CII BCG Growth Index August 2016 - CII Naoroji Godrej ... · Monthly Report August 2016...
16
Monthly Report August 2016 [email protected] it d @ ii i [email protected] dh t di@ ii i Monthly Report – August 2016 sangita.das@cii.in sandhya.satwadi@cii.in
Transcript of CII BCG Growth Index August 2016 - CII Naoroji Godrej ... · Monthly Report August 2016...
Monthly Report August [email protected]
it d @ ii [email protected]
dh t di@ ii iMonthly Report – August 2016 [email protected] [email protected]
Draft – For discussion only
Summary growth trends: August 2016Summary growth trends: August 2016
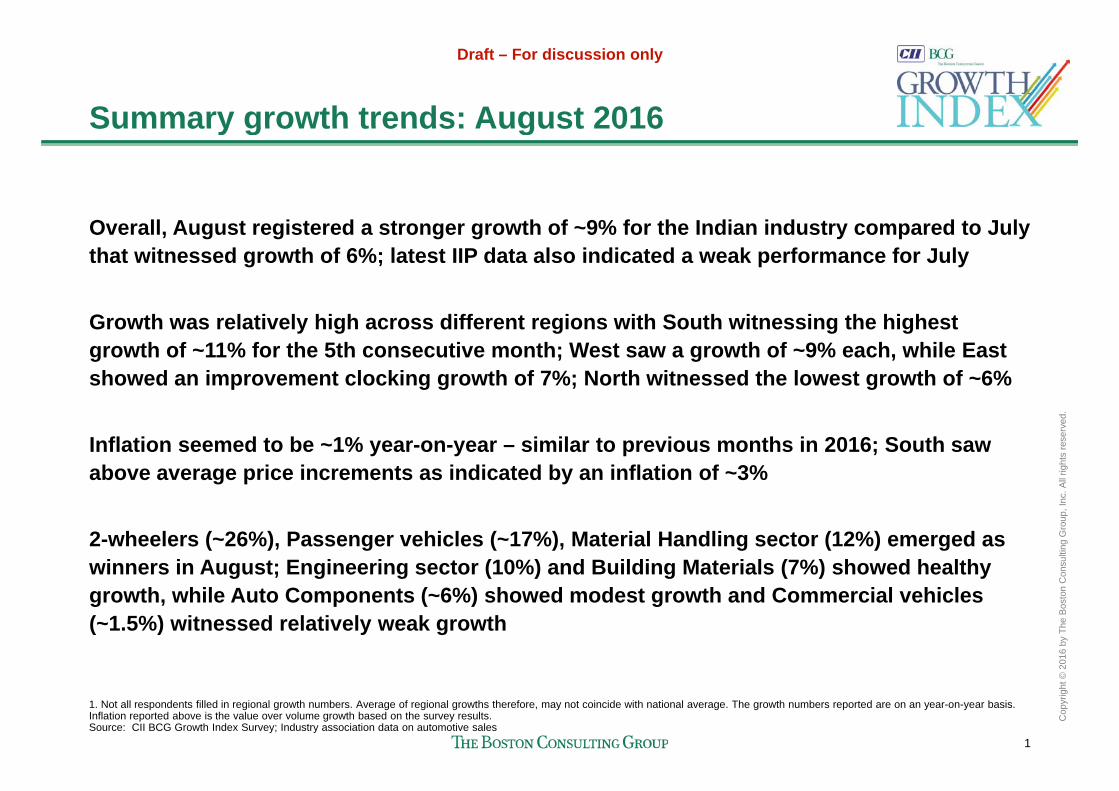
Overall, August registered a stronger growth of ~9% for the Indian industry compared to July that witnessed growth of 6%; latest IIP data also indicated a weak performance for July
Growth was relatively high across different regions with South witnessing the highest growth of ~11% for the 5th consecutive month; West saw a growth of ~9% each, while East showed an improvement clocking growth of 7%; North witnessed the lowest growth of ~6%
All
right
s re
serv
ed.
Inflation seemed to be ~1% year-on-year – similar to previous months in 2016; South saw above average price increments as indicated by an inflation of ~3%
onsu
lting
Gro
up, I
nc. A
2-wheelers (~26%), Passenger vehicles (~17%), Material Handling sector (12%) emerged as winners in August; Engineering sector (10%) and Building Materials (7%) showed healthy
2016
by
The
Bos
ton
Cog ; g g ( ) g ( ) y
growth, while Auto Components (~6%) showed modest growth and Commercial vehicles (~1.5%) witnessed relatively weak growth
1
Cop
yrig
ht ©
2
1. Not all respondents filled in regional growth numbers. Average of regional growths therefore, may not coincide with national average. The growth numbers reported are on an year-on-year basis. Inflation reported above is the value over volume growth based on the survey results.Source: CII BCG Growth Index Survey; Industry association data on automotive sales

Draft – For discussion only
Survey results: August 2016 performanceSurvey results: August 2016 performance
Y Y th %
Summary – all respondents Regional growth – All respondents1
4
8
12
YoY growth %
9% 8%
4%6%6%
9% 8%7%5%
3%
VolumeValue
0
Jul’16 Aug ’16Jun’16May’16Apr’16
Industry growthPeer growth
North:6% (6%)
East
All
right
s re
serv
ed.
Industry growth comparison
Peer growth comparison
6080
Volume growth (%)
2530 2 wheelers
PV
West:9% (8%)
East:7% (7%)
Volume growth (%)
onsu
lting
Gro
up, I
nc. A60
-20-40
200
-60
40
-80 505
101520
Build. materCV
MHEOthers
PVAuto comp
Engg prod.& serv.
South:11%(8%)
Region
xx:xx% (yy%)
2016
by
The
Bos
ton
Co
Value growth (%)
-80-60 -20-80 20-40 40 80600
Value growth (%)
-5-5 0 5 10 15 20 25 30
All industry average All industry average
Valuegrowth yoy
Volume growth yoy
2
Cop
yrig
ht ©
21. Not all respondents filled in regional growth numbers. Average of regional growths therefore, may not coincide with national average. The growth numbers reported are on an year-on-year basisNote: Building materials (BM) industry refers to cement, cementitious products, paints, tiles, roofing, scaffolding. Industry average is displayed only when there are 3+ responses per industry. Other industries where responses were received include: consumer durables, Steel, chemicals, plastics, logistics, packaging, Consulting services, Financial services. Regional averages may not fully align with national average because of different regional exposures of respondent industries. All averages are 'simple averages' (i.e. not weighted by size of company). CV – Commercial vehicles, PV –Passenger vehicles, Auto Comp – Auto Components, Engg prod & services – Engineering products and services, Build. mater. – Building Materials, MHE – Material Handling EquipmentSource: CII BCG Growth Index Survey; Industry association data on automotive sales
Draft – For discussion only
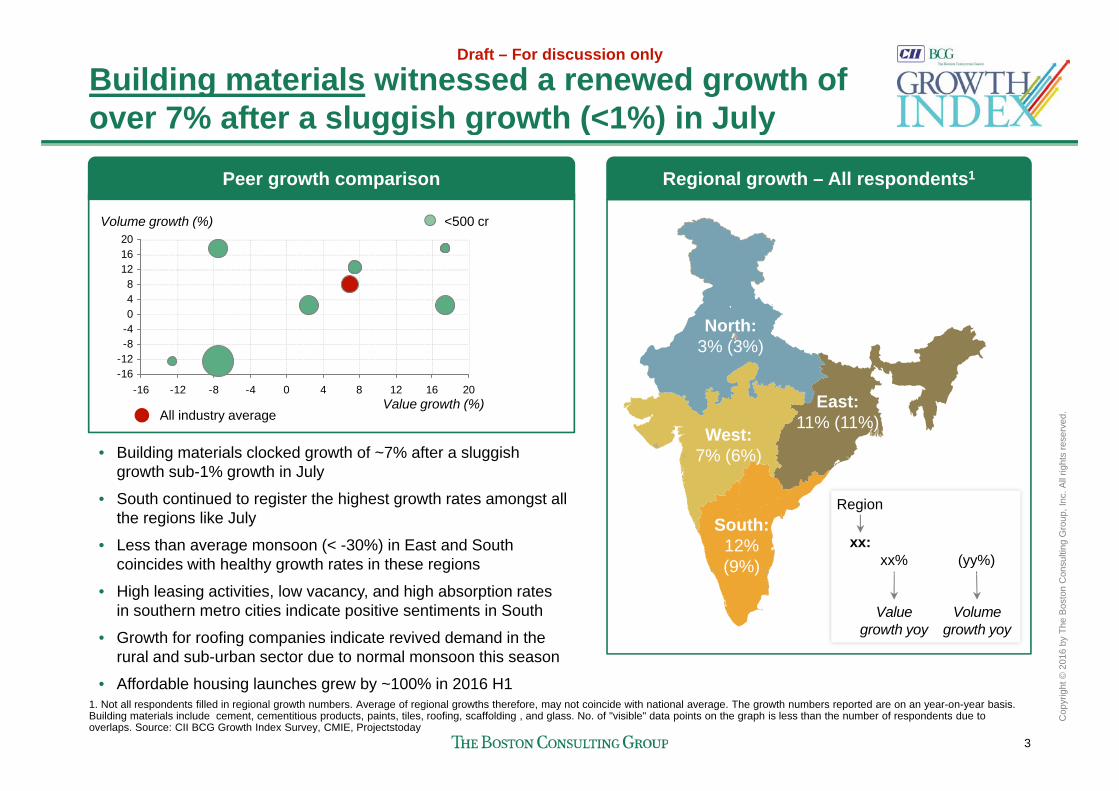
Building materials witnessed a renewed growth of over 7% after a sluggish growth (<1%) in Julyover 7% after a sluggish growth ( 1%) in July
Peer growth comparison Regional growth – All respondents1
48
121620
Volume growth (%) <500 cr
-16-12-8-40
-16 -12 -8 -4 0 4 8 12 16 20
North:3% (3%)
E t
All
right
s re
serv
ed.Value growth (%)
All industry average
• Building materials clocked growth of ~7% after a sluggish growth sub-1% growth in July
West:7% (6%)
East:11% (11%)
onsu
lting
Gro
up, I
nc. A• South continued to register the highest growth rates amongst all
the regions like July
• Less than average monsoon (< -30%) in East and South coincides with healthy growth rates in these regions
South:12%(9%)
Region
xx:xx% (yy%)
2016
by
The
Bos
ton
Co
• High leasing activities, low vacancy, and high absorption rates in southern metro cities indicate positive sentiments in South
• Growth for roofing companies indicate revived demand in the rural and sub-urban sector due to normal monsoon this season
( )
Valuegrowth yoy
Volume growth yoy
3
Cop
yrig
ht ©
2
• Affordable housing launches grew by ~100% in 2016 H11. Not all respondents filled in regional growth numbers. Average of regional growths therefore, may not coincide with national average. The growth numbers reported are on an year-on-year basis. Building materials include cement, cementitious products, paints, tiles, roofing, scaffolding , and glass. No. of "visible" data points on the graph is less than the number of respondents due to overlaps. Source: CII BCG Growth Index Survey, CMIE, Projectstoday
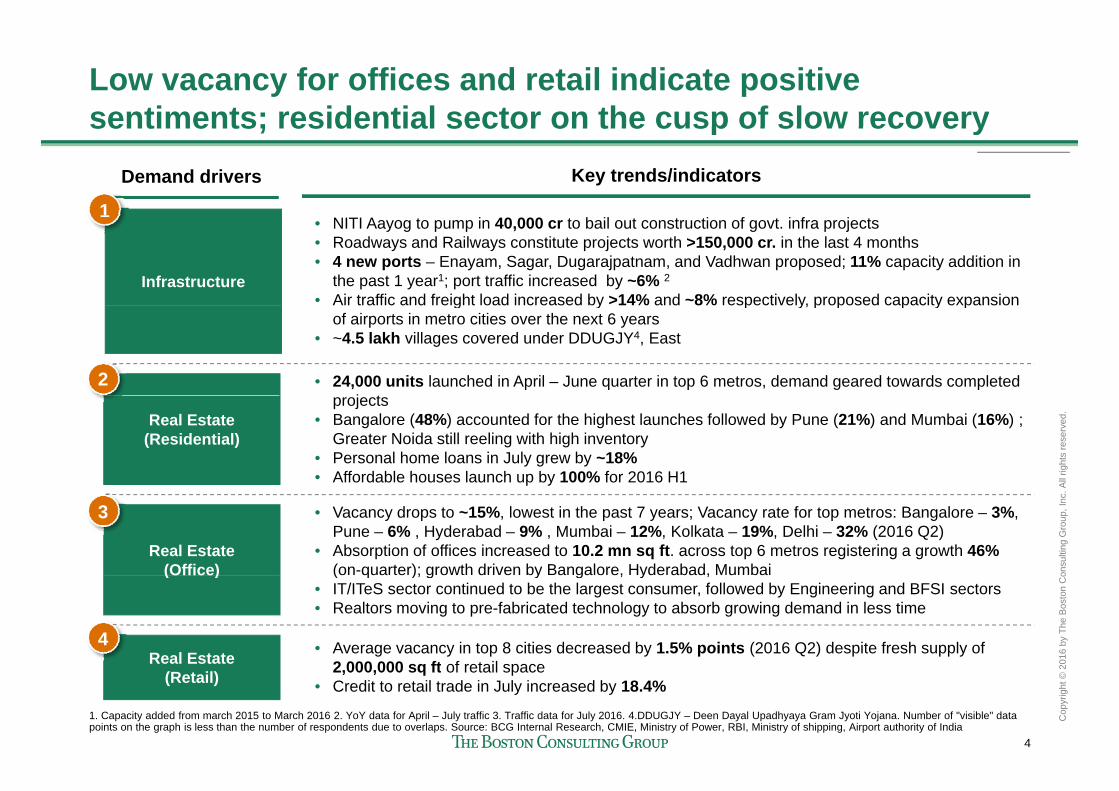
Low vacancy for offices and retail indicate positive sentiments; residential sector on the cusp of slow recoverysentiments; residential sector on the cusp of slow recovery
Demand drivers Key trends/indicators
1
Infrastructure
• NITI Aayog to pump in 40,000 cr to bail out construction of govt. infra projects• Roadways and Railways constitute projects worth >150,000 cr. in the last 4 months• 4 new ports – Enayam, Sagar, Dugarajpatnam, and Vadhwan proposed; 11% capacity addition in
the past 1 year1; port traffic increased by ~6% 2
• Air traffic and freight load increased by >14% and ~8% respectively, proposed capacity expansion
1
g y p y, p p p y pof airports in metro cities over the next 6 years
• ~4.5 lakh villages covered under DDUGJY4, East
• 24,000 units launched in April – June quarter in top 6 metros, demand geared towards completed j t
2
All
right
s re
serv
ed.
Real Estate (Residential)
projects • Bangalore (48%) accounted for the highest launches followed by Pune (21%) and Mumbai (16%) ;
Greater Noida still reeling with high inventory• Personal home loans in July grew by ~18% • Affordable houses launch up by 100% for 2016 H1
onsu
lting
Gro
up, I
nc. A
Real Estate (Office)
p y
• Vacancy drops to ~15%, lowest in the past 7 years; Vacancy rate for top metros: Bangalore – 3%, Pune – 6% , Hyderabad – 9% , Mumbai – 12%, Kolkata – 19%, Delhi – 32% (2016 Q2)
• Absorption of offices increased to 10.2 mn sq ft. across top 6 metros registering a growth 46% (on-quarter); growth driven by Bangalore, Hyderabad, Mumbai
3
2016
by
The
Bos
ton
Co(Office) (o qua e ); g o d e by a ga o e, yde abad, u ba
• IT/ITeS sector continued to be the largest consumer, followed by Engineering and BFSI sectors• Realtors moving to pre-fabricated technology to absorb growing demand in less time
Real Estate • Average vacancy in top 8 cities decreased by 1.5% points (2016 Q2) despite fresh supply of 2 000 000 sq ft of retail space
4
4
Cop
yrig
ht ©
2
1. Capacity added from march 2015 to March 2016 2. YoY data for April – July traffic 3. Traffic data for July 2016. 4.DDUGJY – Deen Dayal Upadhyaya Gram Jyoti Yojana. Number of "visible" data points on the graph is less than the number of respondents due to overlaps. Source: BCG Internal Research, CMIE, Ministry of Power, RBI, Ministry of shipping, Airport authority of India
(Retail) 2,000,000 sq ft of retail space • Credit to retail trade in July increased by 18.4%
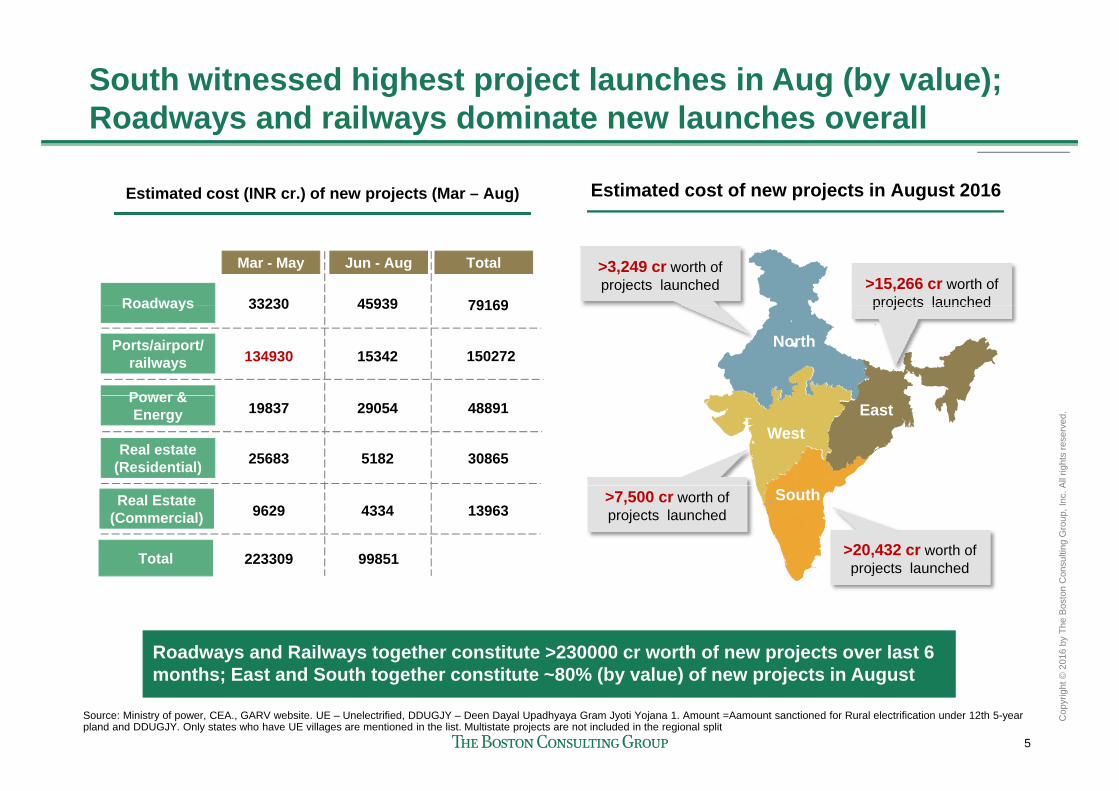
South witnessed highest project launches in Aug (by value); Roadways and railways dominate new launches overallRoadways and railways dominate new launches overall
Estimated cost of new projects in August 2016Estimated cost (INR cr.) of new projects (Mar – Aug)
>3,249 cr worth of projects launched >15,266 cr worth of
projects launchedRoadways
Mar - May
33230 45939 79169
Jun - Aug Total
North
projects launchedRoadways
Ports/airport/ railways
Power &
33230 45939
134930 15342
79169
150272
All
right
s re
serv
ed.
WestEast
Power & Energy
Real estate (Residential)
19837 29054
25683 5182
48891
30865
onsu
lting
Gro
up, I
nc. ASouth>7,500 cr worth of
projects launched
>20,432 cr worth of projects launched
Real Estate(Commercial) 9629 4334 13963
Total 223309 99851
2016
by
The
Bos
ton
Co
Roadways and Railways together constitute >230000 cr worth of new projects over last 6
p j
5
Cop
yrig
ht ©
2months; East and South together constitute ~80% (by value) of new projects in August
Source: Ministry of power, CEA., GARV website. UE – Unelectrified, DDUGJY – Deen Dayal Upadhyaya Gram Jyoti Yojana 1. Amount =Aamount sanctioned for Rural electrification under 12th 5-year pland and DDUGJY. Only states who have UE villages are mentioned in the list. Multistate projects are not included in the regional split

Engineering products registered healthy growth across all the regions, strongest in Southacross all the regions, strongest in South
Regional growth – All respondents1Peer growth comparison
V l h (%)
8
12
16
20Volume growth (%) < 500 cr
North:8% (7%)
-8
-4
0
4
-4 0 4 8 12 16 20
All
right
s re
serv
ed.
West:12% (7%)
East:6% (4%)
Value growth (%)All industry average
• Engineering prod. and serv. showed high growth (~10%) improving on last month's performance of ~7%
onsu
lting
Gro
up, I
nc. A
( )
South:
• Heavy engineering and electrical segment get boost from capacity expansion in power sector; ~1,650 MW capacity and 447 ckms2 of distribution line added
• Falling imports (~36%), rising demand (1.5%) and export Region
2016
by
The
Bos
ton
Co
15%(11%)
g p ( ) g ( ) p(23%)3 resulted in a healthy growth for Steel in August
• High growth in automotive sector (~23%) fuelled growth in the engineering sector
• Investments > 5,000 cr. lined up for capacity expansion Valuegro th o
Volume gro th o
xx:xx% (yy%)
6
Cop
yrig
ht ©
2
es e s 5,000 c ed up o capac y e pa s oand technology upgrade in Automotive comp sector
1. Not all respondents filled in regional growth numbers. Average of regional growths therefore, may not coincide with national average. 2. Capacity addition and distribution lines data is for Jul 2016. 3. Export rise is on YoY for Apr –Aug period. No. of "visible" data points on the graph is less than the number of respondents due to overlaps. The growth numbers reported are on an year-on-year basis. MHE – Material handling equipments. Source: CII BCG Growth Index Survey
growth yoy growth yoy
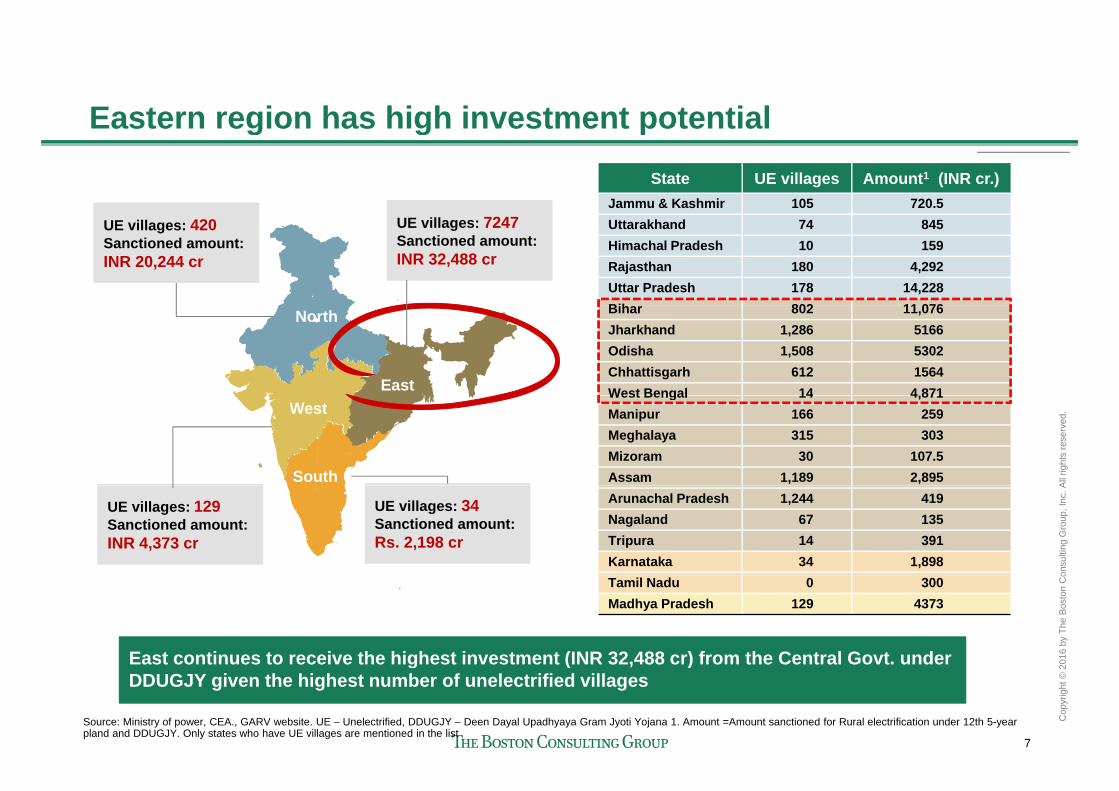
Eastern region has high investment potentialEastern region has high investment potentialState UE villages Amount1 (INR cr.)
Jammu & Kashmir 105 720.5Uttarakhand 74 845Himachal Pradesh 10 159Rajasthan 180 4,292Uttar Pradesh 178 14,228Bih 802 11 076
UE villages: 420Sanctioned amount:INR 20,244 cr
UE villages: 7247Sanctioned amount:INR 32,488 cr
Bihar 802 11,076Jharkhand 1,286 5166Odisha 1,508 5302Chhattisgarh 612 1564West Bengal 14 4 871
North
East
All
right
s re
serv
ed.
West Bengal 14 4,871Manipur 166 259Meghalaya 315 303Mizoram 30 107.5Assam 1,189 2,895
West
South
onsu
lting
Gro
up, I
nc. A
Arunachal Pradesh 1,244 419Nagaland 67 135Tripura 14 391Karnataka 34 1,898
UE villages: 129Sanctioned amount:INR 4,373 cr
UE villages: 34Sanctioned amount:Rs. 2,198 cr
2016
by
The
Bos
ton
Co
Tamil Nadu 0 300Madhya Pradesh 129 4373
East continues to receive the highest investment (INR 32,488 cr) from the Central Govt. under
7
Cop
yrig
ht ©
2
g ( , )DDUGJY given the highest number of unelectrified villages
Source: Ministry of power, CEA., GARV website. UE – Unelectrified, DDUGJY – Deen Dayal Upadhyaya Gram Jyoti Yojana 1. Amount =Amount sanctioned for Rural electrification under 12th 5-year pland and DDUGJY. Only states who have UE villages are mentioned in the list
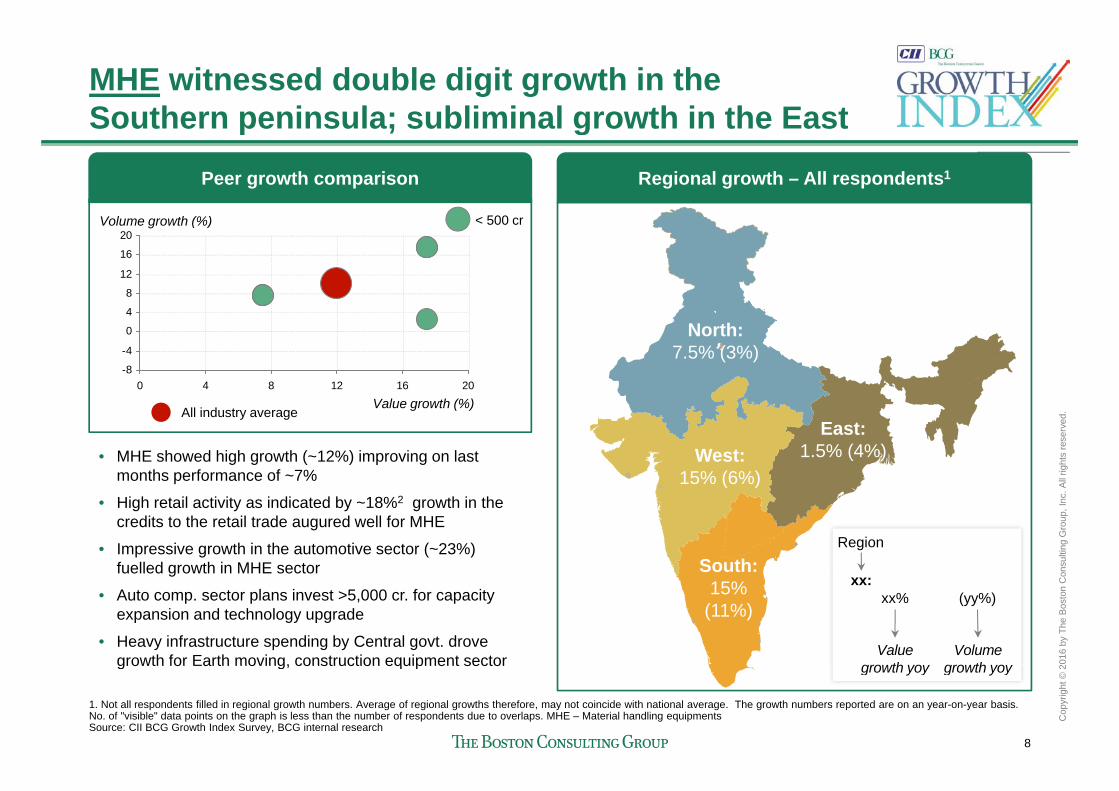
MHE witnessed double digit growth in the Southern peninsula; subliminal growth in the EastSouthern peninsula; subliminal growth in the East
Regional growth – All respondents1Peer growth comparison
V l h (%) 500
8
12
16
20Volume growth (%) < 500 cr
North:7.5% (3%)
-8
-4
0
4
0 4 8 12 16 20
All
right
s re
serv
ed.
West:15% (6%)
East:1.5% (4%)
Value growth (%)All industry average
• MHE showed high growth (~12%) improving on last months performance of ~7%
onsu
lting
Gro
up, I
nc. A
( )
South:
• High retail activity as indicated by ~18%2 growth in the credits to the retail trade augured well for MHE
• Impressive growth in the automotive sector (~23%) fuelled growth in MHE sector
Region
2016
by
The
Bos
ton
Co
15%(11%)
g
• Auto comp. sector plans invest >5,000 cr. for capacity expansion and technology upgrade
• Heavy infrastructure spending by Central govt. drove growth for Earth moving, construction equipment sector
Valuegro th o
Volume gro th o
xx:xx% (yy%)
8
Cop
yrig
ht ©
2
growth for Earth moving, construction equipment sector
1. Not all respondents filled in regional growth numbers. Average of regional growths therefore, may not coincide with national average. The growth numbers reported are on an year-on-year basis. No. of "visible" data points on the graph is less than the number of respondents due to overlaps. MHE – Material handling equipmentsSource: CII BCG Growth Index Survey, BCG internal research
growth yoy growth yoy
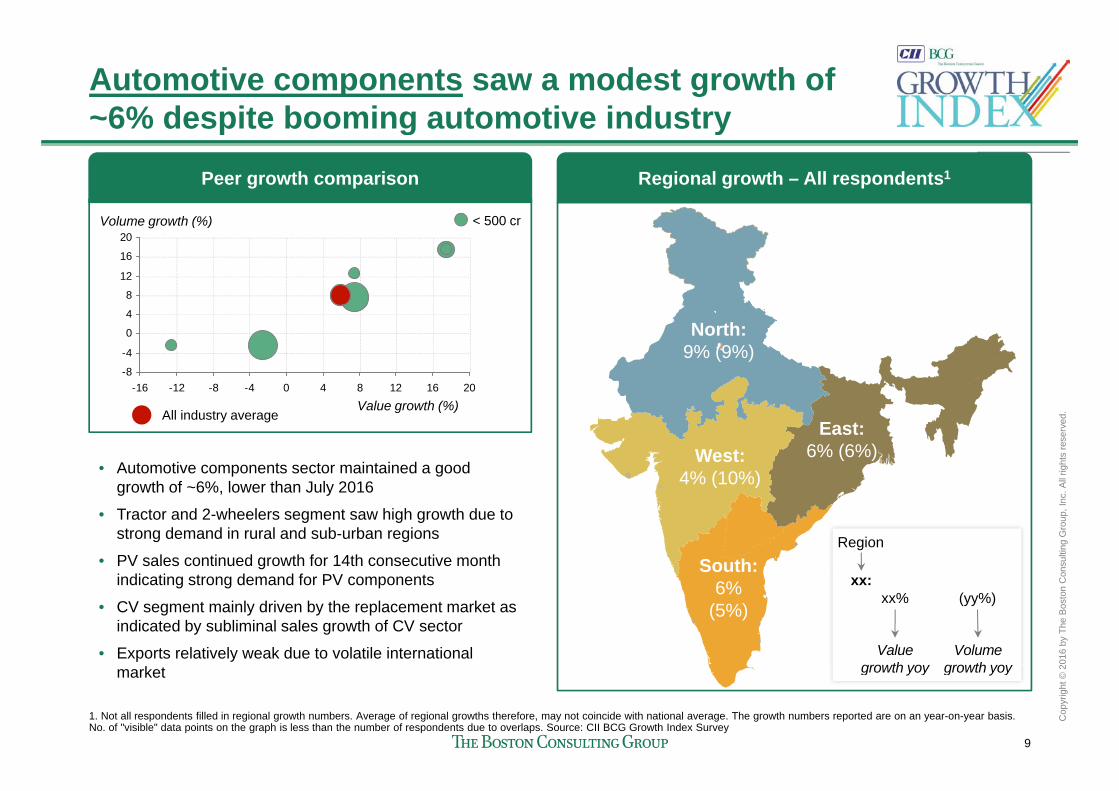
Automotive components saw a modest growth of ~6% despite booming automotive industry6% despite booming automotive industry
Regional growth – All respondents1
V l h (%) 500
Peer growth comparison
8
12
16
20Volume growth (%) < 500 cr
North:9% (9%)
-8
-4
0
4
-16 -12 -8 -4 0 4 8 12 16 20
All
right
s re
serv
ed.
West:4% (10%)
East:6% (6%)
Value growth (%)All industry average
• Automotive components sector maintained a good growth of 6% lower than July 2016
onsu
lting
Gro
up, I
nc. A
( )
South:
growth of ~6%, lower than July 2016
• Tractor and 2-wheelers segment saw high growth due to strong demand in rural and sub-urban regions
• PV sales continued growth for 14th consecutive month i di ti t d d f PV t
Region
2016
by
The
Bos
ton
Co
6%(5%)
indicating strong demand for PV components
• CV segment mainly driven by the replacement market as indicated by subliminal sales growth of CV sector
• Exports relatively weak due to volatile international Valuegro th o
Volume gro th o
xx:xx% (yy%)
9
Cop
yrig
ht ©
2market
1. Not all respondents filled in regional growth numbers. Average of regional growths therefore, may not coincide with national average. The growth numbers reported are on an year-on-year basis. No. of "visible" data points on the graph is less than the number of respondents due to overlaps. Source: CII BCG Growth Index Survey
growth yoy growth yoy
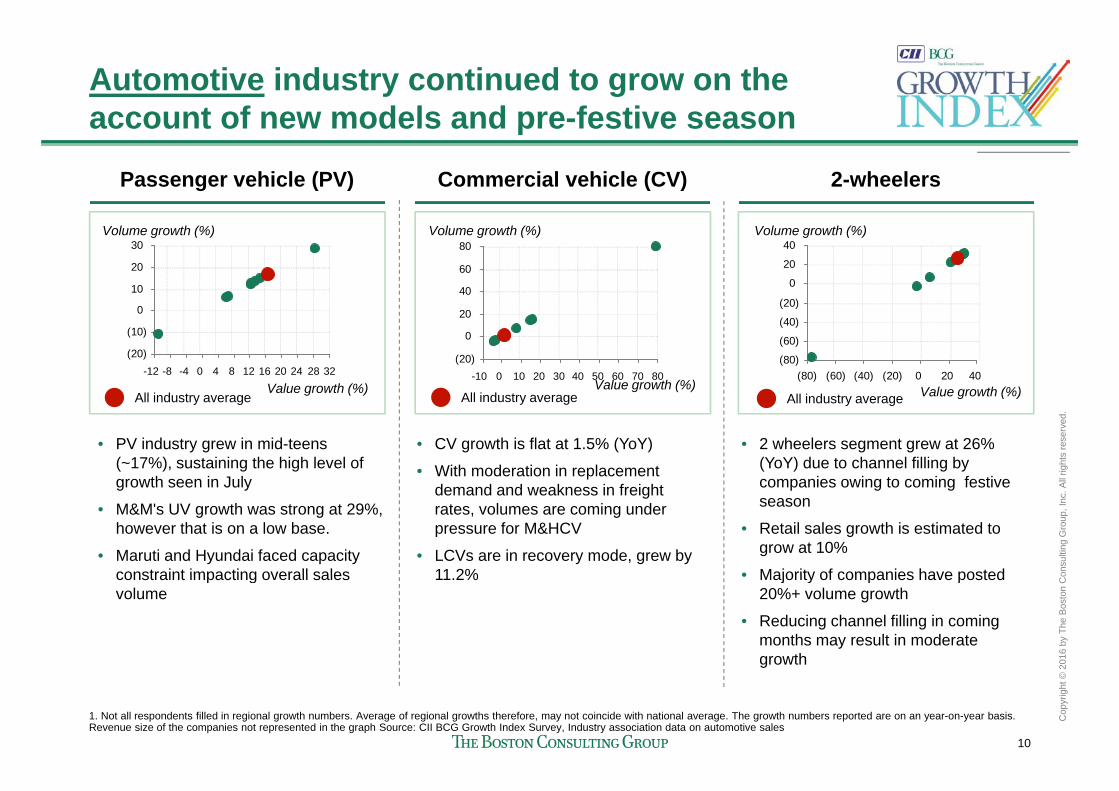
Automotive industry continued to grow on the account of new models and pre-festive seasonaccount of new models and pre festive season
Passenger vehicle (PV) Commercial vehicle (CV) 2-wheelers
0
10
20
30Volume growth (%)
40
60
80Volume growth (%)
(20)
0
20
40Volume growth (%)
Value growth (%)All industry average
(20)
(10)
0
20 24 28 3216124-12 -8 -4 80Value growth (%)
All industry average
(20)
0
20
70 806050402010 300-10Value growth (%)All i d t
(80)
(60)
(40)
(20)
(80) (60) (40) (20) 0 20 40
All
right
s re
serv
ed.
• PV industry grew in mid-teens (~17%), sustaining the high level of growth seen in July
• CV growth is flat at 1.5% (YoY)
• With moderation in replacement d d d k i f i ht
g ( )All industry average All industry average Value growth (%)All industry average
• 2 wheelers segment grew at 26% (YoY) due to channel filling by companies owing to coming festive
onsu
lting
Gro
up, I
nc. Agrowth seen in July
• M&M's UV growth was strong at 29%, however that is on a low base.
• Maruti and Hyundai faced capacity constraint impacting overall sales
demand and weakness in freight rates, volumes are coming under pressure for M&HCV
• LCVs are in recovery mode, grew by 11 2%
companies owing to coming festive season
• Retail sales growth is estimated to grow at 10%
• Majority of companies have posted
2016
by
The
Bos
ton
Coconstraint impacting overall sales
volume11.2% • Majority of companies have posted
20%+ volume growth
• Reducing channel filling in coming months may result in moderate growth
10
Cop
yrig
ht ©
2
g
1. Not all respondents filled in regional growth numbers. Average of regional growths therefore, may not coincide with national average. The growth numbers reported are on an year-on-year basis. Revenue size of the companies not represented in the graph Source: CII BCG Growth Index Survey, Industry association data on automotive sales
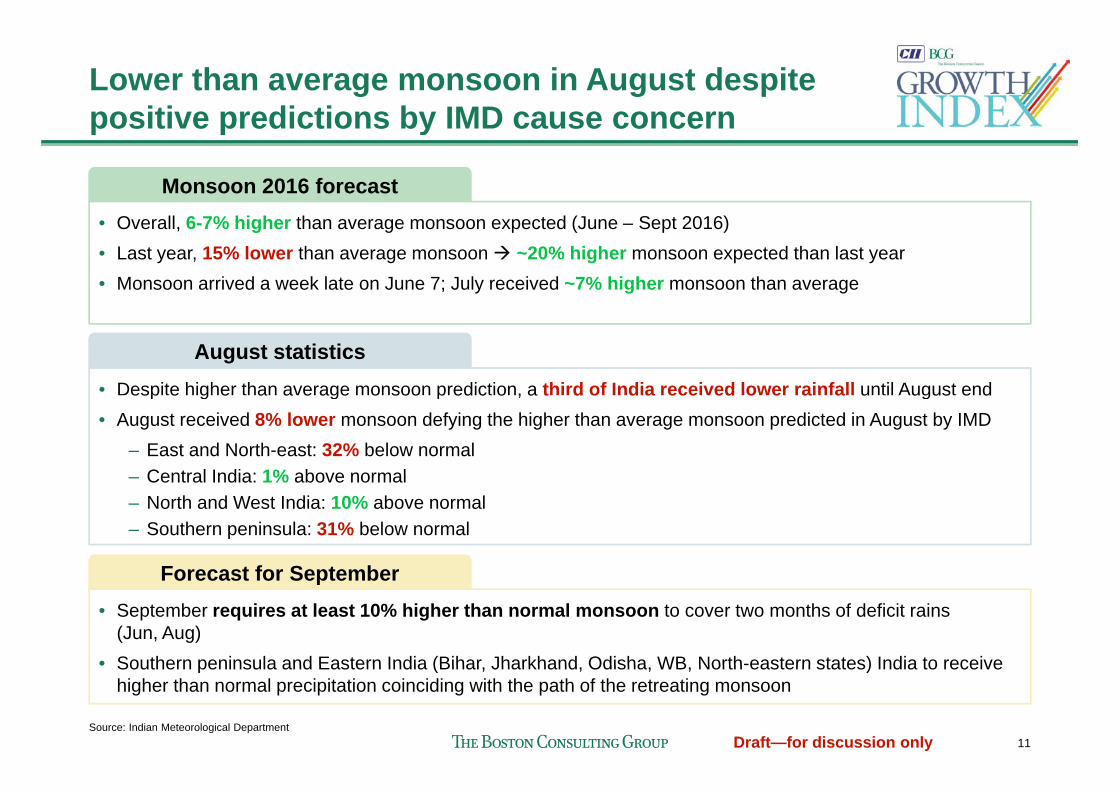
Lower than average monsoon in August despite positive predictions by IMD cause concernpositive predictions by IMD cause concern
Monsoon 2016 forecastO ll 6 7% hi h th t d (J S t 2016)• Overall, 6-7% higher than average monsoon expected (June – Sept 2016)
• Last year, 15% lower than average monsoon ~20% higher monsoon expected than last year• Monsoon arrived a week late on June 7; July received ~7% higher monsoon than average
August statistics• Despite higher than average monsoon prediction, a third of India received lower rainfall until August endesp e g e a a e age o soo p ed c o , a t d o d a ece ed o e a a u ugus e d• August received 8% lower monsoon defying the higher than average monsoon predicted in August by IMD
– East and North-east: 32% below normal– Central India: 1% above normal– North and West India: 10% above normal– Southern peninsula: 31% below normal
Forecast for SeptemberForecast for September• September requires at least 10% higher than normal monsoon to cover two months of deficit rains
(Jun, Aug) • Southern peninsula and Eastern India (Bihar Jharkhand Odisha WB North-eastern states) India to receive
11Draft—for discussion only
• Southern peninsula and Eastern India (Bihar, Jharkhand, Odisha, WB, North-eastern states) India to receive higher than normal precipitation coinciding with the path of the retreating monsoon
Source: Indian Meteorological Department

IIP index drops to -2.4% registering the sharpest fall of the year; Manufacturing sector de-grows at -3.4%of the year; Manufacturing sector de grows at 3.4%
YoY growth (%) in July 2016 Growth trends of various sectors
15
Growth (YoY)%• IIP general index plummeted to an year-low of -
2.4%• Manufacturing sectors registered a sharp decline
10
g g pde-growing at -3.4%
• Growth rates declined for both Mining and Electricity sectors at 0.8% and 1.6%,respectively
0
5
respectively• 12 out of the 22 industry groups in the
manufacturing sector saw negative growth• Losers: Electrical machinery & apparatus (-
-5
01616’1
616161616’16151515151515
Losers: Electrical machinery & apparatus (59.2%), Apparel (-16.2%), leather products (-10.1%), Wooden products (-7.9%)
• Winners: Tobacco products (22.3%), coke and refined petroleum products (12 3%) Chemicals
Aug
’
Jul’
Jun’
May
’
Apr
’
Mar
’
Feb’
Jan’
Dec
’
Nov
’
Oct
’
Sep
’
Aug
’
Jul’
GeneralElect.
Manf.Mining
refined petroleum products (12.3%), Chemicals (5.4%), Machinery equipments (8.8%)
• Consumer goods saw a marginal growth of 1.3%on the account of good performance of consumer Aug data not yet
released by the Govt
12Draft—for discussion only
durables (5.9%)
Source: CSO, Analyst Report. Note: list of "winners" and "losers" is not exhaustive
released by the Govt.
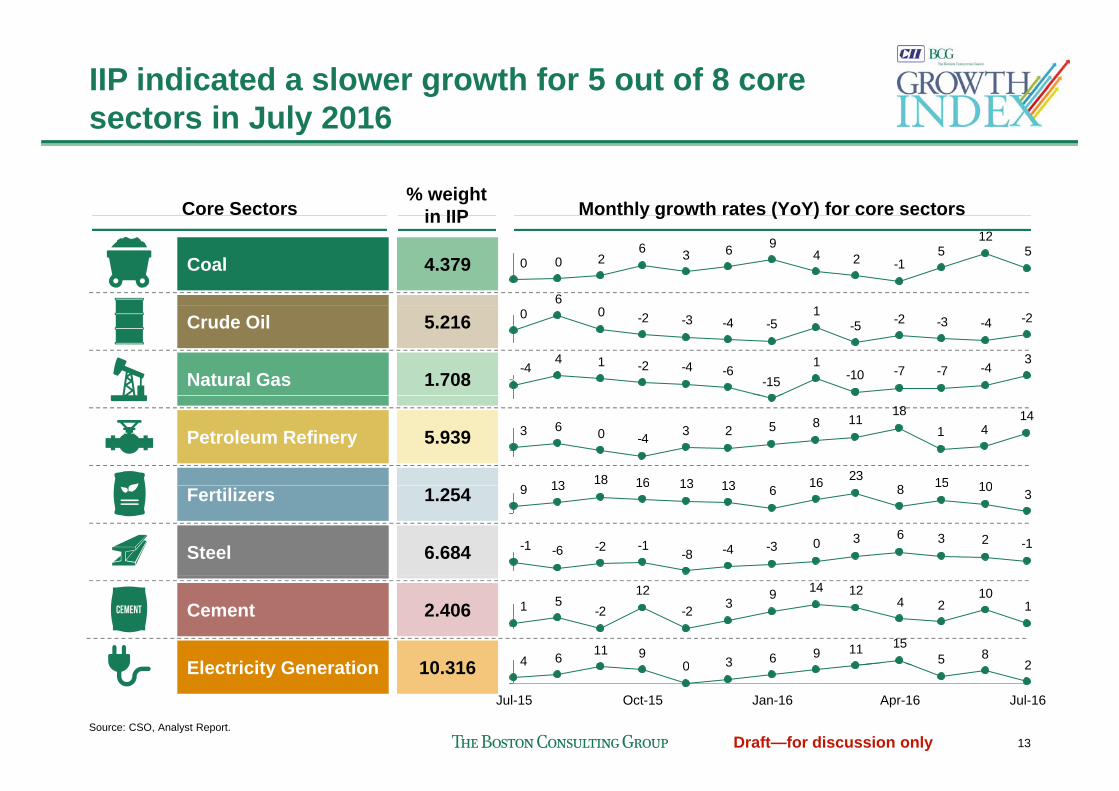
IIP indicated a slower growth for 5 out of 8 core sectors in July 2016sectors in July 2016
% weight in IIPCore Sectors Monthly growth rates (YoY) for core sectors
Coal 4.379
in IIP
512
5-124
9636200
6
y g ( )
Crude Oil
Natural Gas
5.216
1.708
-2-4-3-2-51
-5-4-3-200
3-4-7-7-10
1-15
-6-4-214-4
Petroleum Refinery 5.93914
4118
118523-4063
10158231613131618139Fertilizers
Steel
1.254
6.684
310158166131316139
-123630-3-4-8-1-2-6-1
Cement 2.406
Electricity Generation 10 316
110
2412149
3-212
-251
285
1511963091164
13Draft—for discussion only
Electricity Generation 10.316 2304
Jul-15 Oct-15 Jan-16 Apr-16 Jul-16
Source: CSO, Analyst Report.
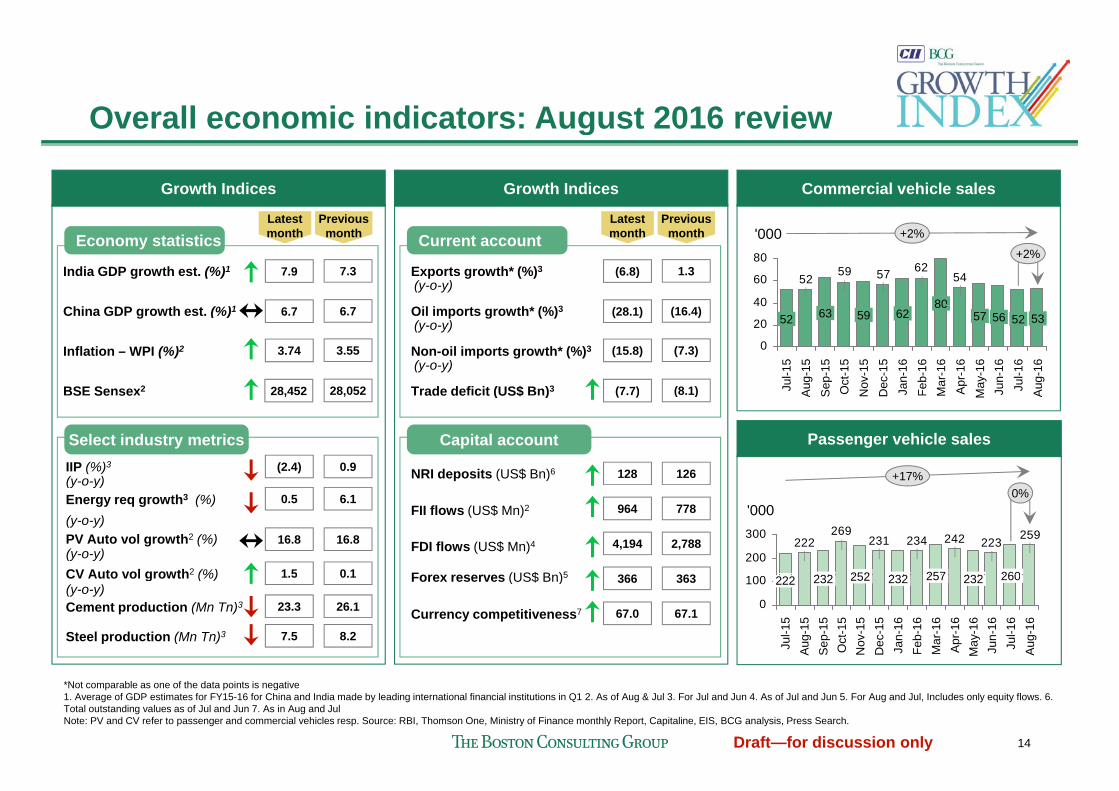
Overall economic indicators: August 2016 review
Commercial vehicle sales
Overall economic indicators: August 2016 review
L t t P i
Growth Indices Growth Indices
L t t P iLatest month
Previous month
India GDP growth est. (%)1
1
7.9 7.3
Latest month
Previous month
Exports growth* (%)3
3
(6.8) 1.3
Economy statistics Current account
(y-o-y) 54625759
52
40
60
80 +2%
+2%'000
80China GDP growth est. (%)1
Inflation – WPI (%)2
BSE Sensex2
3.74
6.7
3.55
28,052
6.7 Oil imports growth* (%)3
Non-oil imports growth* (%)3
Trade deficit (US$ Bn)3
(15.8)
(7.7)
(28.1)
(7.3)
(8.1)
(16.4)(y-o-y)
(y-o-y)0
20
40
May
-16
52
Jun-
16
53
Jul-1
6A
ug-1
6
62
Dec
-15
Nov
-15
Jan-
16
80
Feb-
16M
ar-1
6
57
Apr
-16
56
Jul-1
5
52
Aug
-15
Sep
-15
63
Oct
-15
59
28,452S Se se ,
(y-o-y)IIP (%)3 (2.4) 0.9
ade de c t (US$ ) ( ) ( )
NRI deposits (US$ Bn)6 128 126
Select industry metrics Capital account Passenger vehicle sales
M ADN MA S
+17%
,
(y-o-y)
(y o y)
(y-o-y)
CV Auto vol growth2 (%)
Energy req growth3 (%)
PV Auto vol growth2 (%)
0.5
1 5
16.8
6.1
0 1
16.8
Forex reserves (US$ Bn)5
FII flows (US$ Mn)2
FDI flows (US$ Mn)4
964
366
4,194
778
363
2,788259
223242234231269
222200
300
232
'000
260232257232252
0%
Steel production (Mn Tn)3
CV Auto vol growth (%)
Cement production (Mn Tn)3(y-o-y)
23.3
1.5
7.5
26.1
0.1
8.2
Forex reserves (US$ Bn)5
Currency competitiveness7 67.0
366
67.1
363
0
100
Oct
-15
232
Nov
-15
Dec
-15
Aug-
15
Aug-
16Ju
l-16
260
Jun-
16M
ay-1
6
232
Apr
-16
257
Mar
-16
Feb-
16
Jul-1
5
222
Jan-
16
Sep-
15
232252
14Draft—for discussion only
*Not comparable as one of the data points is negative1. Average of GDP estimates for FY15-16 for China and India made by leading international financial institutions in Q1 2. As of Aug & Jul 3. For Jul and Jun 4. As of Jul and Jun 5. For Aug and Jul, Includes only equity flows. 6. Total outstanding values as of Jul and Jun 7. As in Aug and JulNote: PV and CV refer to passenger and commercial vehicles resp. Source: RBI, Thomson One, Ministry of Finance monthly Report, Capitaline, EIS, BCG analysis, Press Search.
Thank you
bcg.com | bcgperspectives.com