CIECH - Financial results for 1Q2016
26
Financial results for 1Q16 Warsaw, 21 May 2016
-
Upload
ciech-group-ir -
Category
Investor Relations
-
view
445 -
download
0
Transcript of CIECH - Financial results for 1Q2016
Financial results for 1Q16
Warsaw, 21 May 2016
2
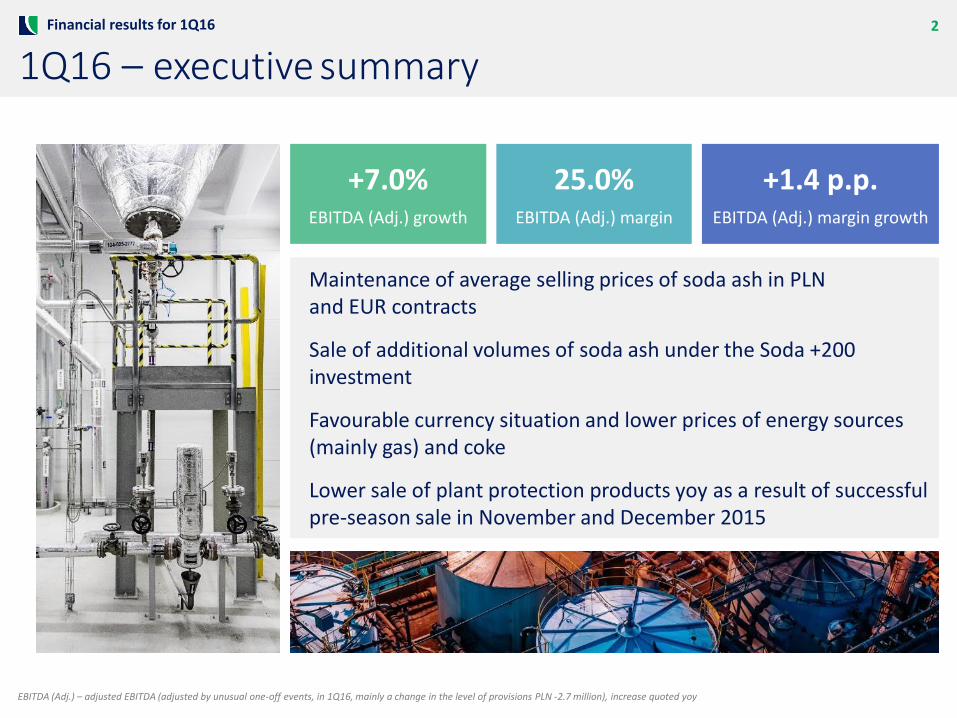
1Q16 – executive summaryFinancial results for 1Q16
+7.0%EBITDA (Adj.) growth
Maintenance of average selling prices of soda ash in PLN and EUR contracts
Sale of additional volumes of soda ash under the Soda +200 investment
Favourable currency situation and lower prices of energy sources (mainly gas) and coke
Lower sale of plant protection products yoy as a result of successful pre-season sale in November and December 2015
25.0%EBITDA (Adj.) margin
+1.4 p.p.EBITDA (Adj.) margin growth
EBITDA (Adj.) – adjusted EBITDA (adjusted by unusual one-off events, in 1Q16, mainly a change in the level of provisions PLN -2.7 million), increase quoted yoy

1. Market situation and major events
2. Financial results for 1Q16
3. Outlook for next quarters
4
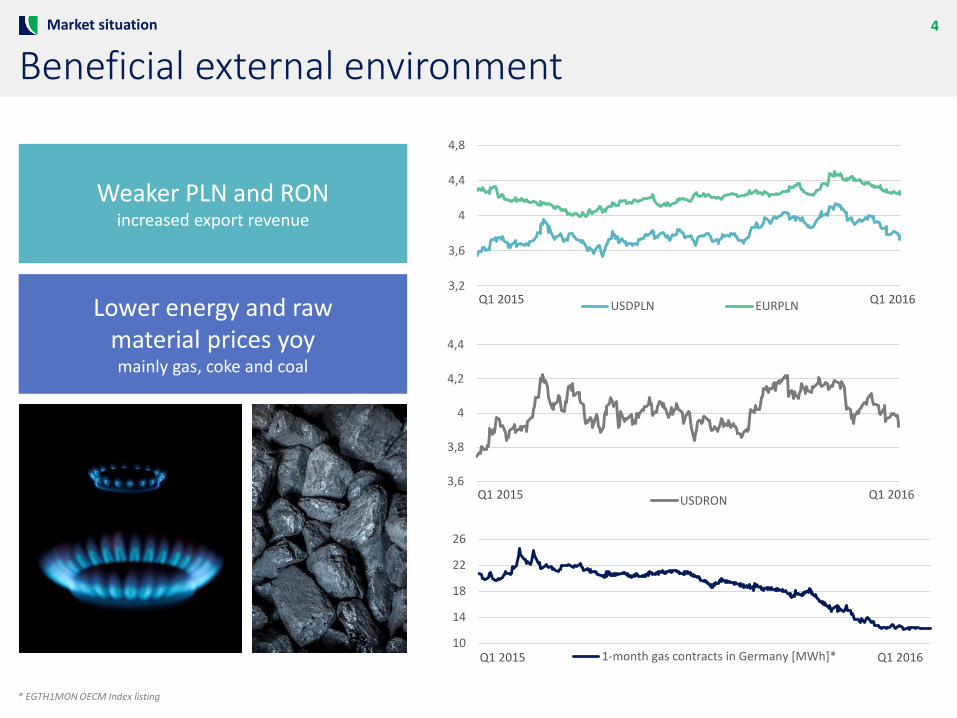
Beneficial external environmentMarket situation
Weaker PLN and RON increased export revenue
Lower energy and rawmaterial prices yoymainly gas, coke and coal
10
14
18
22
26
1-month gas contracts in Germany [MWh]*Q1 2015 Q1 2016
3,2
3,6
4
4,4
4,8
USDPLN EURPLNQ1 2015 Q1 2016
3,6
3,8
4
4,2
4,4
USDRONQ1 2015 Q1 2016
* EGTH1MON OECM Index listing
5
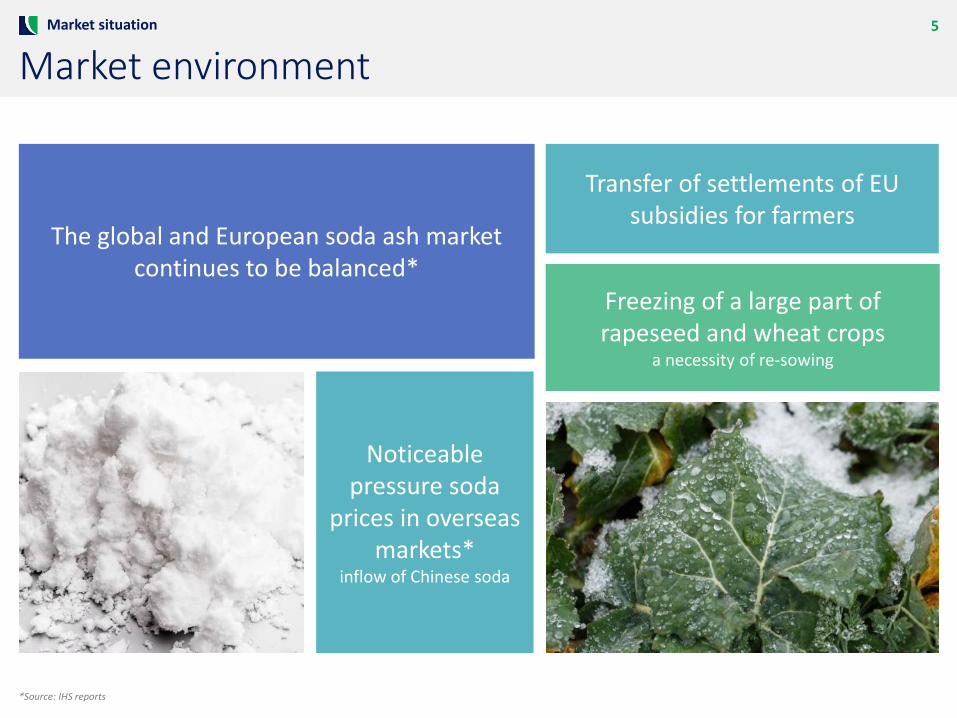
Market environmentMarket situation
The global and European soda ash market continues to be balanced*
*Source: IHS reports
Noticeable pressure soda
prices in overseas markets*
inflow of Chinese soda
Transfer of settlements of EU subsidies for farmers
Freezing of a large part of rapeseed and wheat crops
a necessity of re-sowing
6
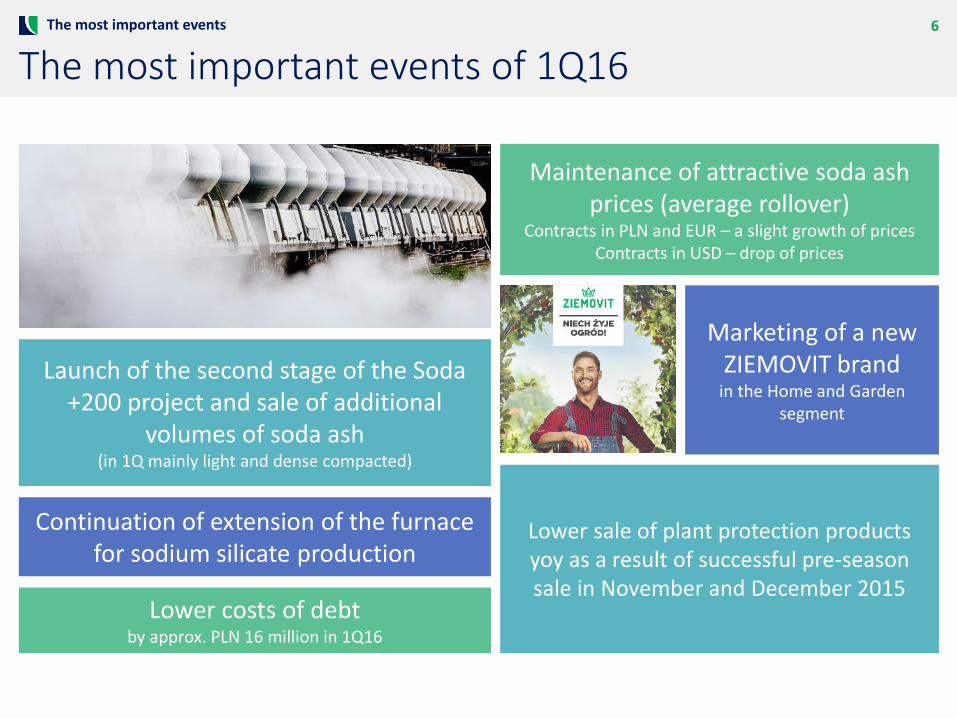
The most important events of 1Q16The most important events
Launch of the second stage of the Soda +200 project and sale of additional
volumes of soda ash(in 1Q mainly light and dense compacted)
Maintenance of attractive soda ash prices (average rollover)
Contracts in PLN and EUR – a slight growth of pricesContracts in USD – drop of prices
Marketing of a new ZIEMOVIT brand
in the Home and Garden segment
Continuation of extension of the furnace for sodium silicate production
Lower costs of debt by approx. PLN 16 million in 1Q16
Lower sale of plant protection products yoy as a result of successful pre-season sale in November and December 2015
1. Market situation and major events
2. Financial results for 1Q16
3. Outlook for next quarters
8
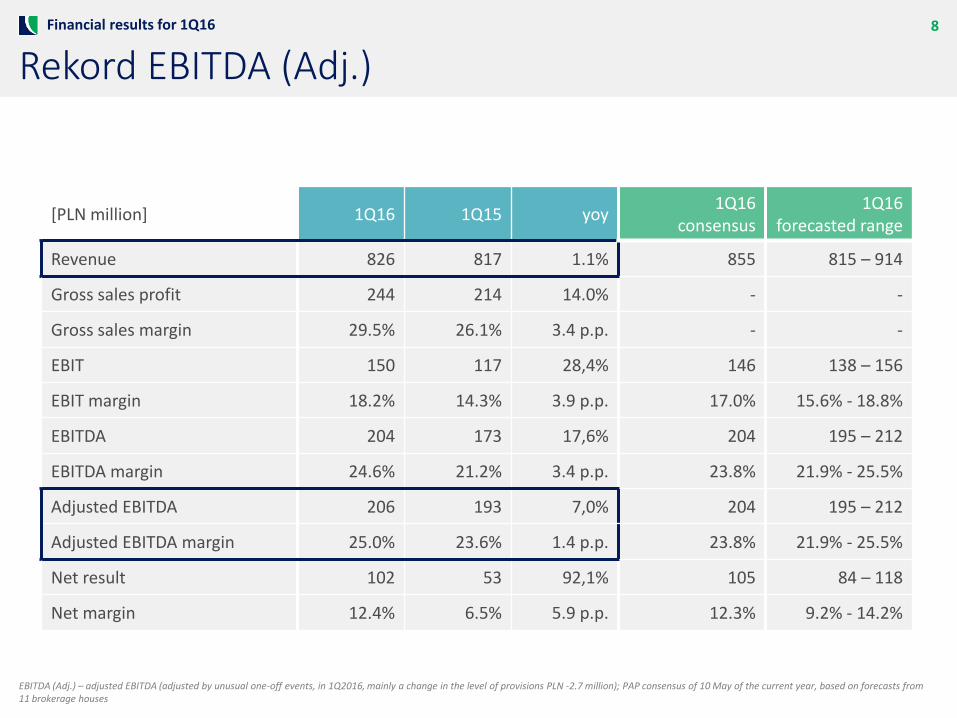
Rekord EBITDA (Adj.)
[PLN million] 1Q16 1Q15 yoy1Q16
consensus1Q16
forecasted range
Revenue 826 817 1.1% 855 815 – 914
Gross sales profit 244 214 14.0% - -
Gross sales margin 29.5% 26.1% 3.4 p.p. - -
EBIT 150 117 28,4% 146 138 – 156
EBIT margin 18.2% 14.3% 3.9 p.p. 17.0% 15.6% - 18.8%
EBITDA 204 173 17,6% 204 195 – 212
EBITDA margin 24.6% 21.2% 3.4 p.p. 23.8% 21.9% - 25.5%
Adjusted EBITDA 206 193 7,0% 204 195 – 212
Adjusted EBITDA margin 25.0% 23.6% 1.4 p.p. 23.8% 21.9% - 25.5%
Net result 102 53 92,1% 105 84 – 118
Net margin 12.4% 6.5% 5.9 p.p. 12.3% 9.2% - 14.2%
Financial results for 1Q16
EBITDA (Adj.) – adjusted EBITDA (adjusted by unusual one-off events, in 1Q2016, mainly a change in the level of provisions PLN -2.7 million); PAP consensus of 10 May of the current year, based on forecasts from 11 brokerage houses
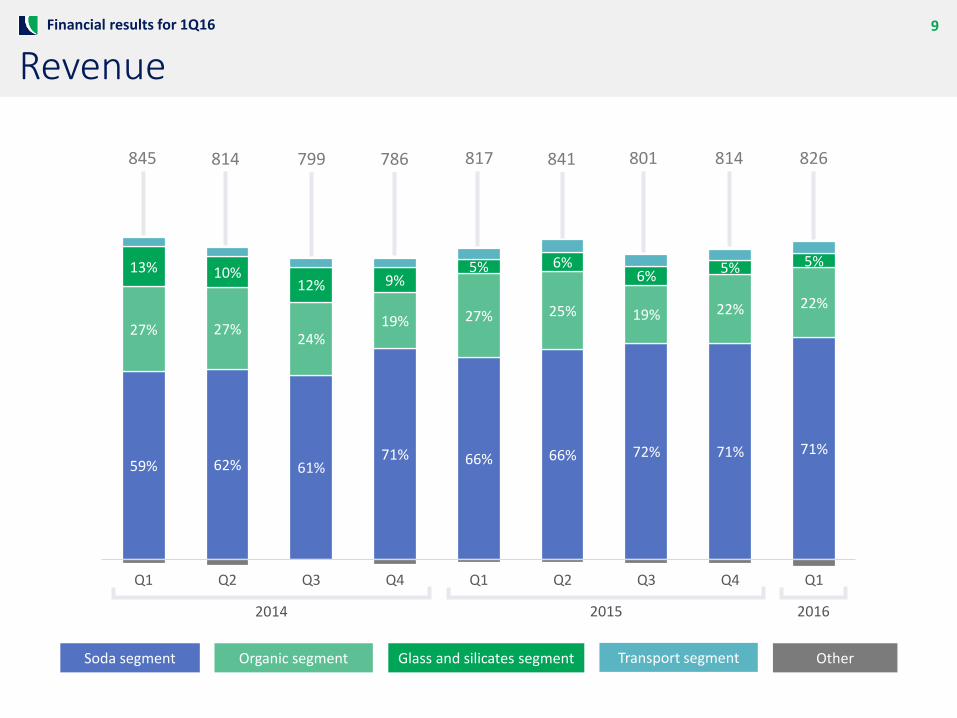
59% 62% 61%71% 66% 66% 72% 71% 71%
27% 27%24%
19% 27% 25% 19% 22% 22%
13% 10%12% 9%
5% 6%6%
5% 5%
Q1 Q2 Q3 Q4 Q1 Q2 Q3 Q4 Q1
9
Revenue
2014
845 814 799 786 817 841 801 814 826
2015 2016
Financial results for 1Q16
Organic segment Glass and silicates segment Transport segment OtherSoda segment
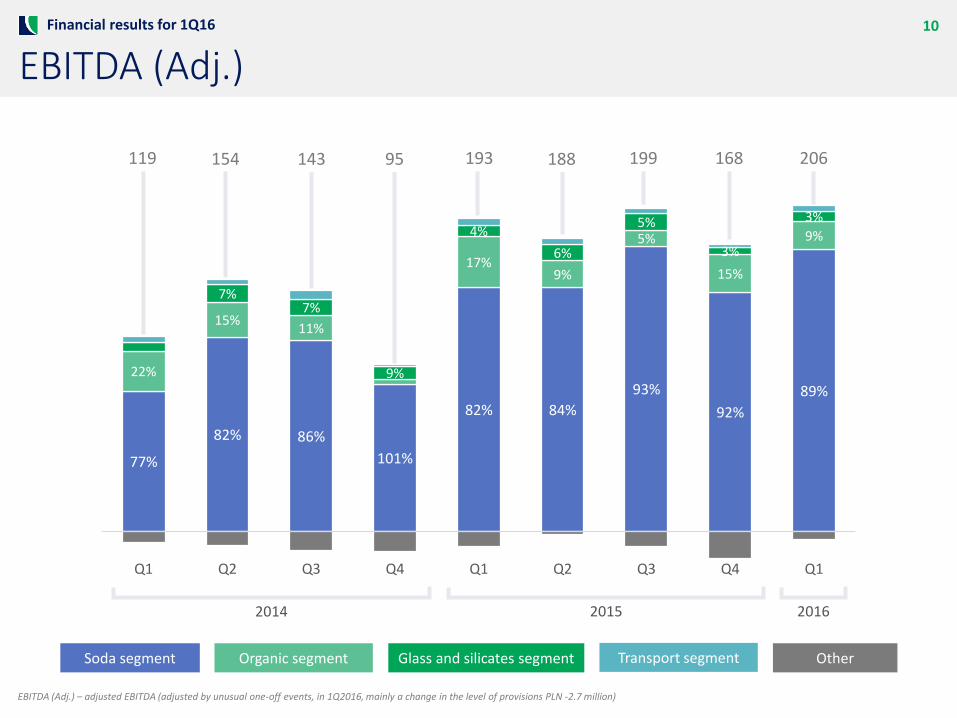
10
EBITDA (Adj.)
77%
82% 86%
101%
82% 84%
93%
92%
89%
22%
15%11%
17%9%
5%
15%
9%
7%7%
9%
4%
6%
5%
3%
3%
Q1 Q2 Q3 Q4 Q1 Q2 Q3 Q4 Q1
EBITDA (Adj.) – adjusted EBITDA (adjusted by unusual one-off events, in 1Q2016, mainly a change in the level of provisions PLN -2.7 million)
2014 2015 2016
119 154 143 95 193 188 199 168 206
Financial results for 1Q16
Organic segment Glass and silicates segment Transport segment OtherSoda segment

11
Soda segmentFinancial results for 1Q16
Q1 Q2 Q3 Q4
536 590
557
574
574
2 241
2015 2016
158 183
158
185
155
656
2015 2016
In plus:
Higher production volumes
Favourable market situation – balancing of the European soda ash market with a trend for growth in demand
An insignificant selling prices growth of soda of Polish and German origin (in connection with the market situation and effective sales negotiations)
Lower prices of furnace fuel (coke) and power sources (coal, gas)
Favourable currency situation – weakening of PLN and RON
Growth of the volume of sale of dry salt and maintenance of prices
Continued increase of effectiveness of soda production process
In minus:
Drop in soda sale prices in Romania with regard to overseas export, as a result of pressure on the part of Chinese producers
Sale of additional volumes of light and compacted soda at lower prices (in connection with the launch of dense soda production –the Soda +200 project)
Partial use of more expensive coal from other suppliers (fulfilment of earlier obligations)
+10.1% +15.4%
Revenue [PLN million] EBITDA (Adj.) [PLN million]
Share in total revenue (main products)
Dense soda ash 42%
Light soda ash 12%
Salt 5%
Sodium bicarbonate 5%
EBITDA (Adj.) – adjusted EBITDA (adjusted by unusual one-off events, in 1Q2016, mainly a change in the level of provisions PLN -2.7 million), yoy comparison
12
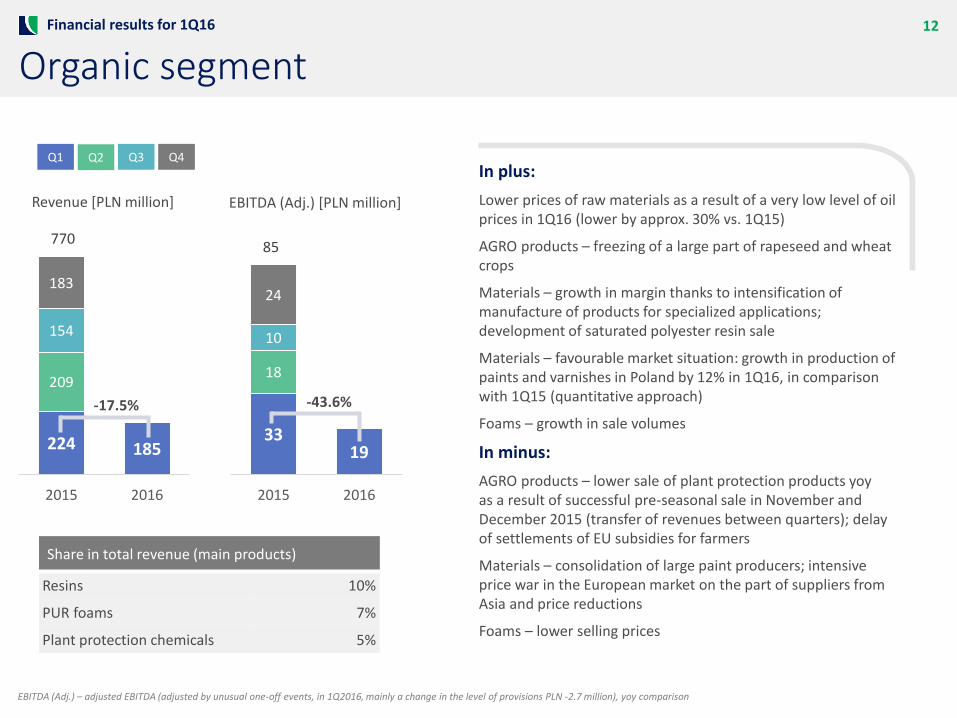
Organic segment
224 185
209
154
183
770
2015 2016
3319
18
10
24
85
2015 2016
In plus:
Lower prices of raw materials as a result of a very low level of oil prices in 1Q16 (lower by approx. 30% vs. 1Q15)
AGRO products – freezing of a large part of rapeseed and wheat crops
Materials – growth in margin thanks to intensification of manufacture of products for specialized applications; development of saturated polyester resin sale
Materials – favourable market situation: growth in production of paints and varnishes in Poland by 12% in 1Q16, in comparison with 1Q15 (quantitative approach)
Foams – growth in sale volumes
In minus:
AGRO products – lower sale of plant protection products yoy as a result of successful pre-seasonal sale in November and December 2015 (transfer of revenues between quarters); delayof settlements of EU subsidies for farmers
Materials – consolidation of large paint producers; intensive price war in the European market on the part of suppliers from Asia and price reductions
Foams – lower selling prices
Financial results for 1Q16
-17.5% -43.6%
Q1 Q2 Q3 Q4
EBITDA (Adj.) – adjusted EBITDA (adjusted by unusual one-off events, in 1Q2016, mainly a change in the level of provisions PLN -2.7 million), yoy comparison
Revenue [PLN million] EBITDA (Adj.) [PLN million]
Share in total revenue (main products)
Resins 10%
PUR foams 7%
Plant protection chemicals 5%
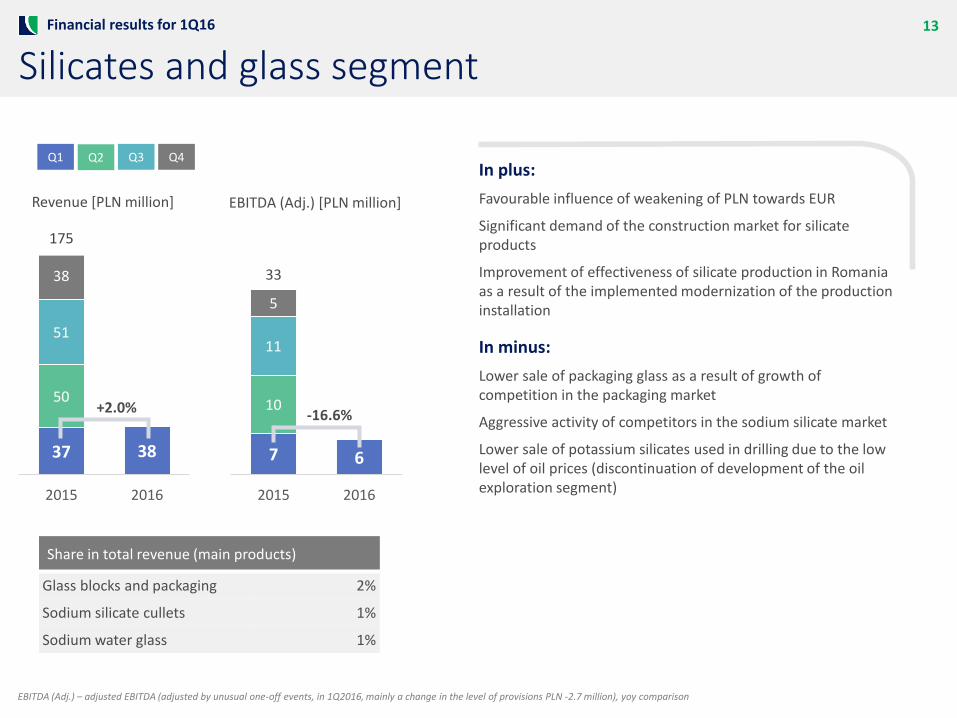
13
Silicates and glass segment
37 38
50
51
38
175
2015 2016
7 6
10
11
5
33
2015 2016
In plus:
Favourable influence of weakening of PLN towards EUR
Significant demand of the construction market for silicate products
Improvement of effectiveness of silicate production in Romania as a result of the implemented modernization of the production installation
In minus:
Lower sale of packaging glass as a result of growth of competition in the packaging market
Aggressive activity of competitors in the sodium silicate market
Lower sale of potassium silicates used in drilling due to the low level of oil prices (discontinuation of development of the oil exploration segment)
Financial results for 1Q16
+2.0% -16.6%
Q1 Q2 Q3 Q4
Revenue [PLN million] EBITDA (Adj.) [PLN million]
Share in total revenue (main products)
Glass blocks and packaging 2%
Sodium silicate cullets 1%
Sodium water glass 1%
EBITDA (Adj.) – adjusted EBITDA (adjusted by unusual one-off events, in 1Q2016, mainly a change in the level of provisions PLN -2.7 million), yoy comparison
14
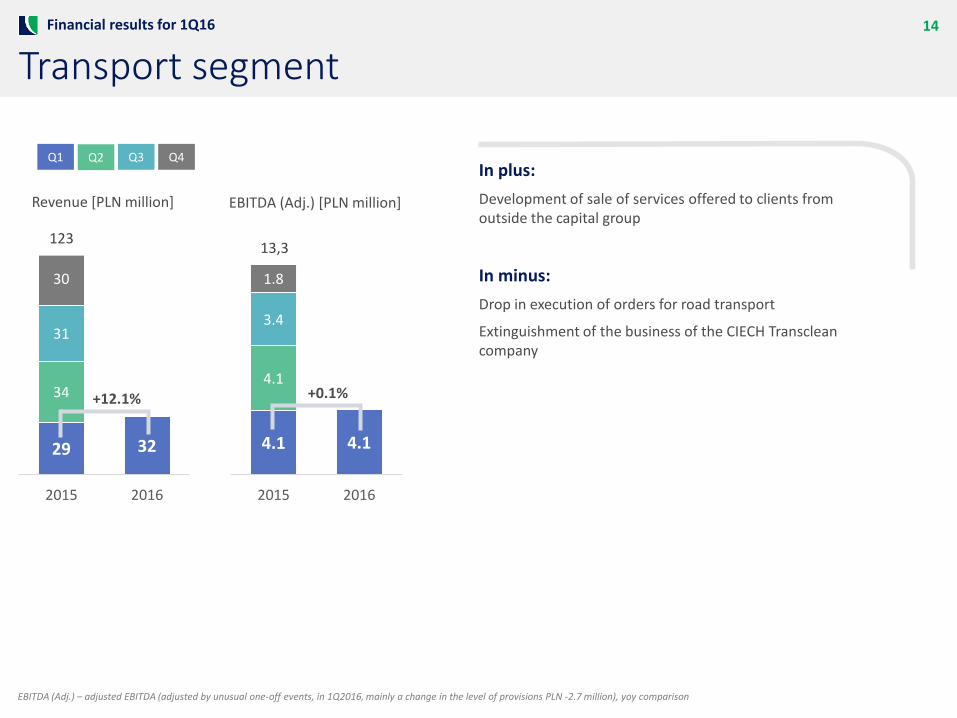
Transport segment
29 32
34
31
30
123
2015 2016
4.1 4.1
4.1
3.4
1.8
13,3
2015 2016
In plus:
Development of sale of services offered to clients from outside the capital group
In minus:
Drop in execution of orders for road transport
Extinguishment of the business of the CIECH Transclean company
Financial results for 1Q16
+12.1% +0.1%
Q1 Q2 Q3 Q4
Revenue [PLN million] EBITDA (Adj.) [PLN million]
EBITDA (Adj.) – adjusted EBITDA (adjusted by unusual one-off events, in 1Q2016, mainly a change in the level of provisions PLN -2.7 million), yoy comparison
15
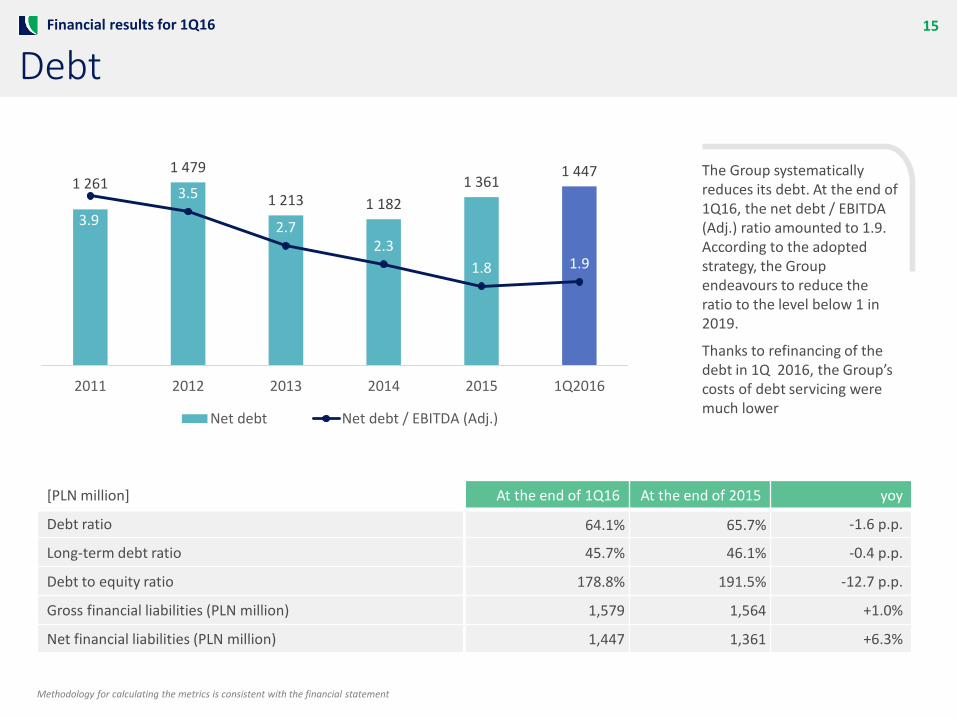
Debt
1 2611 479
1 213 1 182
1 3611 447
3.9
3.5
2.72.3
1.8 1.9
2011 2012 2013 2014 2015 1Q2016
Net debt Net debt / EBITDA (Adj.)
[PLN million] At the end of 1Q16 At the end of 2015 yoy
Debt ratio 64.1% 65.7% -1.6 p.p.
Long-term debt ratio 45.7% 46.1% -0.4 p.p.
Debt to equity ratio 178.8% 191.5% -12.7 p.p.
Gross financial liabilities (PLN million) 1,579 1,564 +1.0%
Net financial liabilities (PLN million) 1,447 1,361 +6.3%
The Group systematically reduces its debt. At the end of 1Q16, the net debt / EBITDA (Adj.) ratio amounted to 1.9. According to the adopted strategy, the Group endeavours to reduce the ratio to the level below 1 in 2019.
Thanks to refinancing of the debt in 1Q 2016, the Group’s costs of debt servicing were much lower
Financial results for 1Q16
Methodology for calculating the metrics is consistent with the financial statement
16
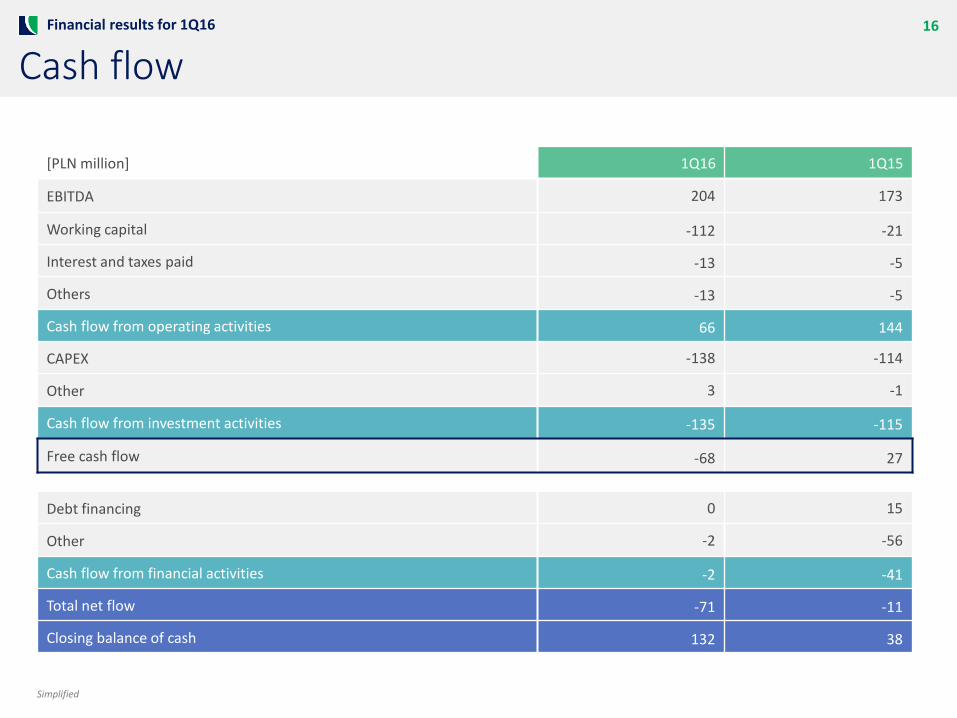
Cash flow
[PLN million] 1Q16 1Q15
EBITDA 204 173
Working capital -112 -21
Interest and taxes paid -13 -5
Others -13 -5
Cash flow from operating activities 66 144
CAPEX -138 -114
Other 3 -1
Cash flow from investment activities -135 -115
Free cash flow -68 27
Debt financing 0 15
Other -2 -56
Cash flow from financial activities -2 -41
Total net flow -71 -11
Closing balance of cash 132 38
Financial results for 1Q16
Simplified
1. Market situation and major events
2. Financial results for 1Q16
3. Outlook for next quarters
18
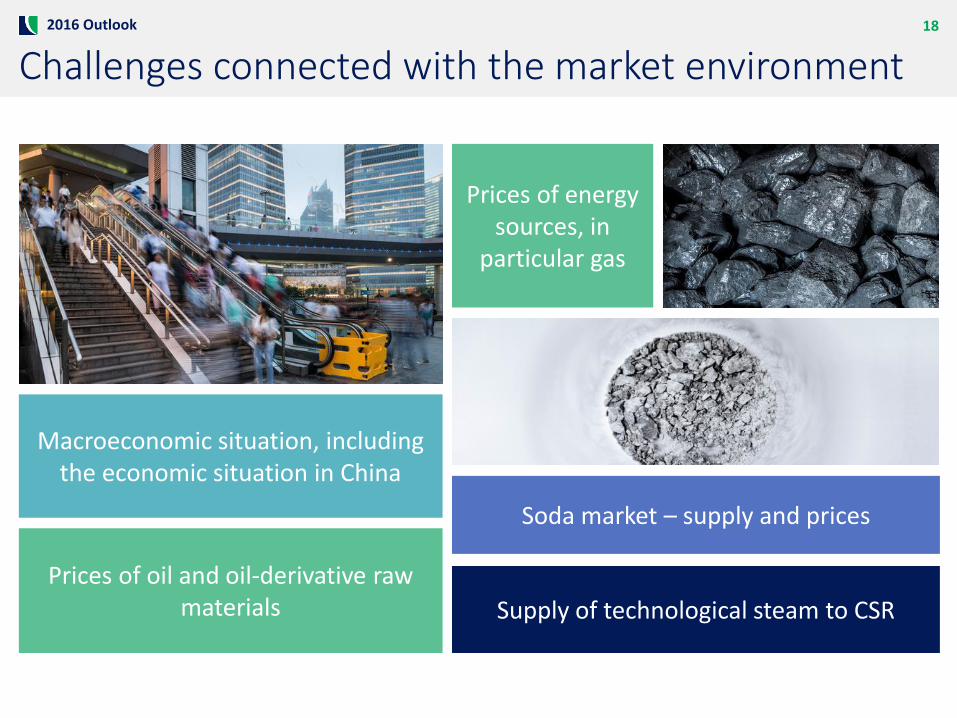
Challenges connected with the market environment2016 Outlook
Soda market – supply and prices
Macroeconomic situation, including the economic situation in China
Prices of energy sources, in
particular gas
Prices of oil and oil-derivative raw materials Supply of technological steam to CSR
19
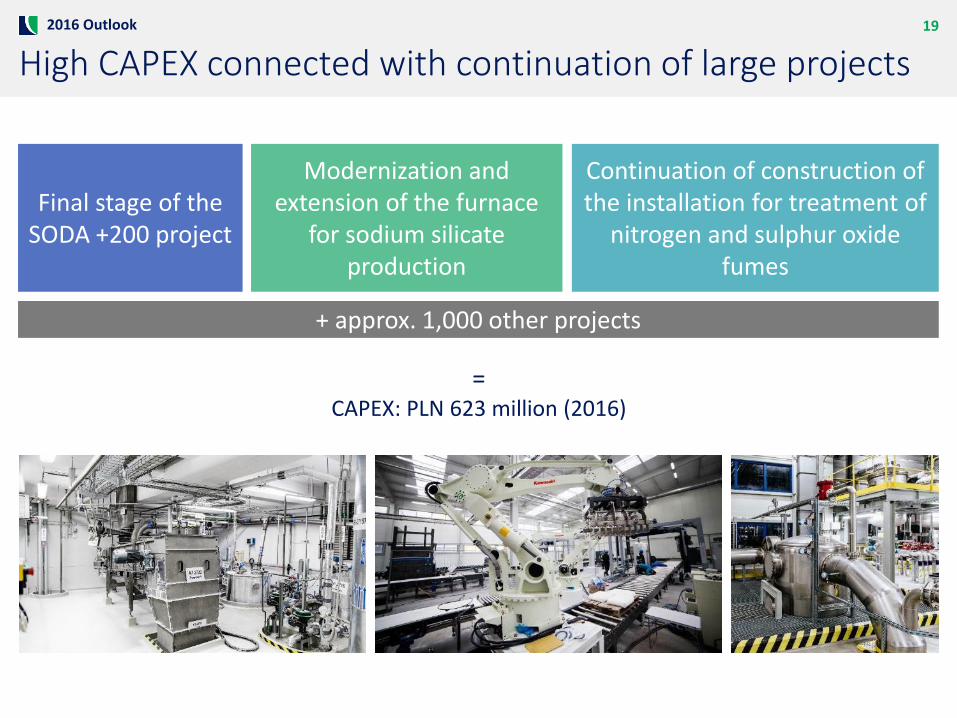
High CAPEX connected with continuation of large projects2016 Outlook
Modernization and extension of the furnace
for sodium silicate production
Continuation of construction of the installation for treatment of
nitrogen and sulphur oxide fumes
Final stage of the SODA +200 project
+ approx. 1,000 other projects
=CAPEX: PLN 623 million (2016)
20
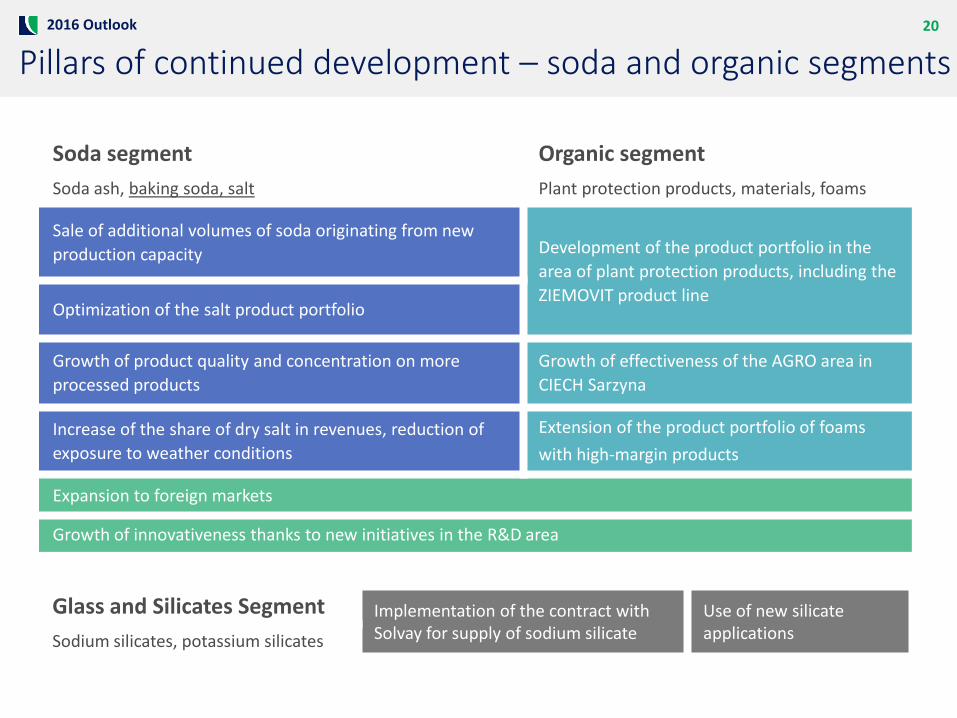
Pillars of continued development – soda and organic segments2016 Outlook
Soda segment Organic segment
Soda ash, baking soda, salt Plant protection products, materials, foams
Sale of additional volumes of soda originating from new
production capacity Development of the product portfolio in the
area of plant protection products, including the
ZIEMOVIT product lineOptimization of the salt product portfolio
Growth of product quality and concentration on more
processed products
Growth of effectiveness of the AGRO area in
CIECH Sarzyna
Increase of the share of dry salt in revenues, reduction of
exposure to weather conditions
Extension of the product portfolio of foams
with high-margin products
Expansion to foreign markets
Growth of innovativeness thanks to new initiatives in the R&D area
Glass and Silicates Segment Implementation of the contract with Solvay for supply of sodium silicate
Use of new silicate applicationsSodium silicates, potassium silicates
Appendices
22
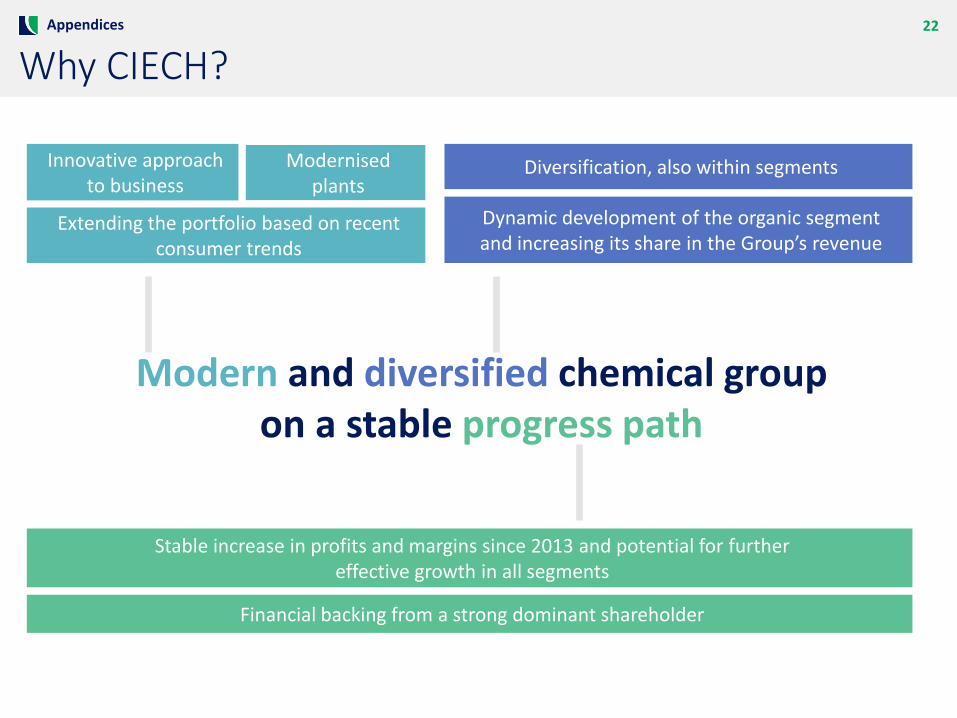
Why CIECH?
Modern and diversified chemical groupon a stable progress path
Innovative approach to business
Diversification, also within segments
Stable increase in profits and margins since 2013 and potential for furthereffective growth in all segments
Financial backing from a strong dominant shareholder
Dynamic development of the organic segmentand increasing its share in the Group’s revenue
Extending the portfolio based on recent consumer trends
Modernised plants
Appendices
23
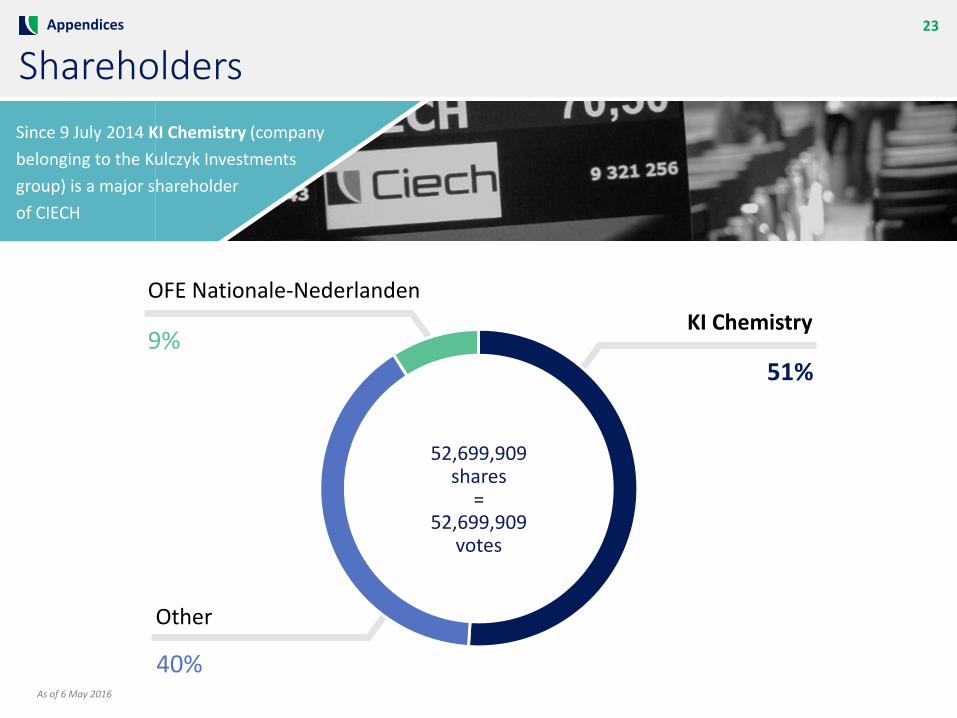
ShareholdersAppendices
KI Chemistry
OFE Nationale-Nederlanden
Other
52,699,909shares
=52,699,909
votes
Since 9 July 2014 KI Chemistry (company
belonging to the Kulczyk Investments
group) is a major shareholder
of CIECH
9%51%
40%As of 6 May 2016
24
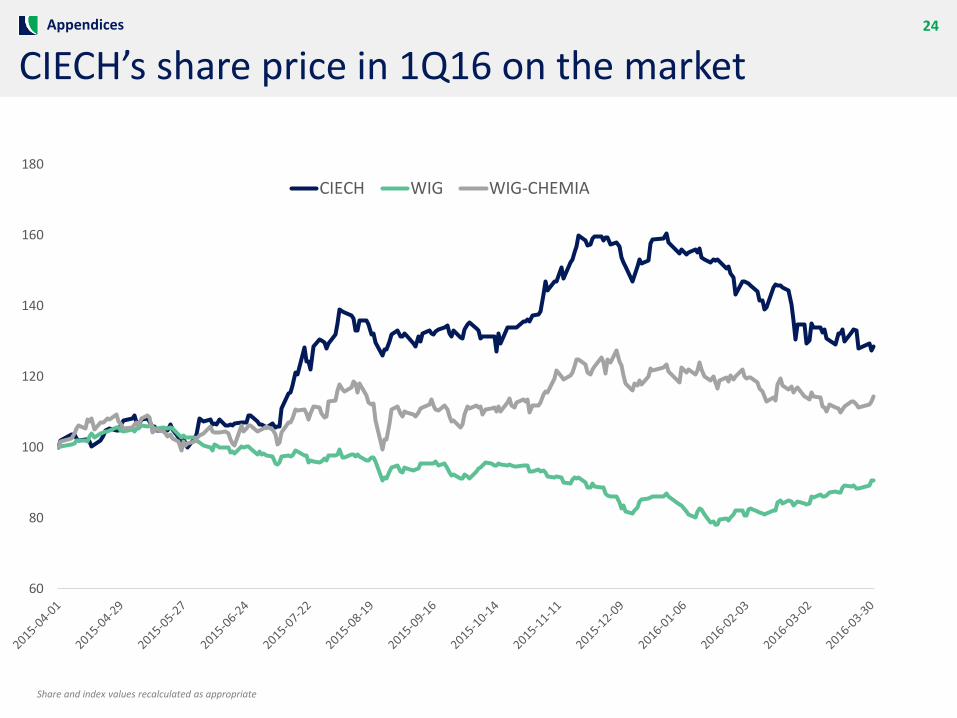
CIECH’s share price in 1Q16 on the market
60
80
100
120
140
160
180
CIECH WIG WIG-CHEMIA
Appendices
Share and index values recalculated as appropriate
Segment
25
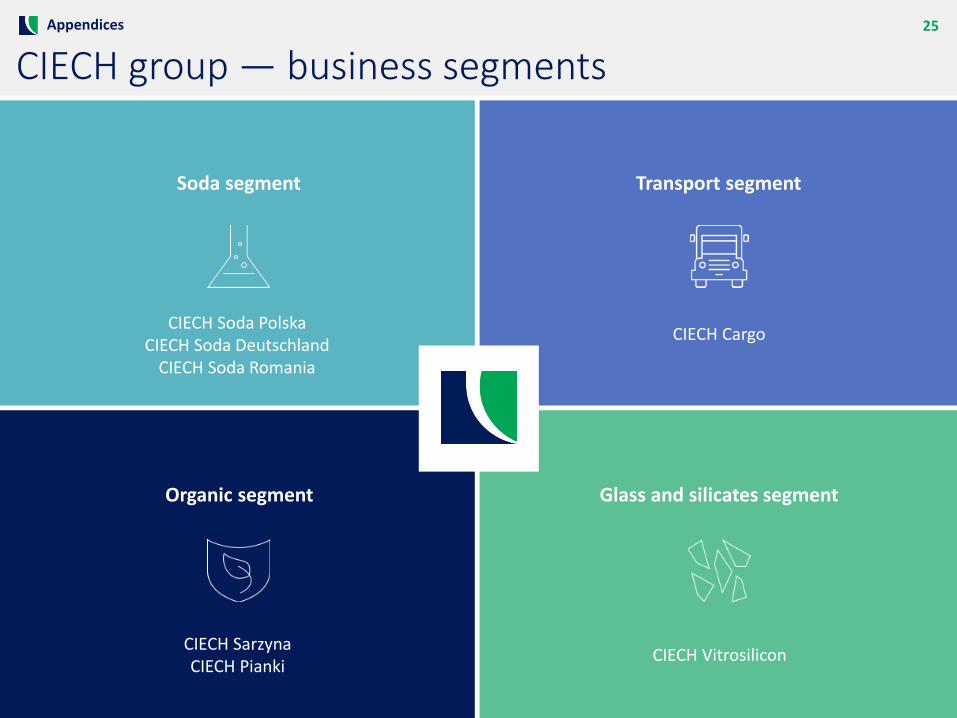
CIECH group — business segments
Soda segment
Salt
Organic segment
Transport segment
Glass and silicates segment
CIECH Soda PolskaCIECH Soda Deutschland
CIECH Soda Romania
CIECH Cargo
CIECH SarzynaCIECH Pianki
CIECH Vitrosilicon
Appendices

This document has been prepared solely for informational purposes. It includes only summary information, is not exhaustive, and may not be used as a sole basis for any assessment or analysis. CIECH S.A. makes no guarantees (explicit or implicit) regarding information presented herein and such information, including forecasts, estimates and opinions, should not be unduly relied upon. CIECH S.A. does not accept any responsibility for possible mistakes, omissions or irregularities found herein. The document is based on sources of information which CIECH S.A. deems to be reliable and accurate, however, it does not guarantee them to be exhaustive nor to fully reflect the actual situation. This document does not constitute an advertisement or a public offer of securities. It may include forward-looking statements that involve investment risks or uncertainties and may significantly differ from actual results. CIECH S.A does not accept any responsibility for consequences of decisions made based on this document. The responsibility lies exclusively with the party using the document. This document is protected by the Copyright and Related Rights Act. Copying, publishing or distributing it requires prior written consent of CIECH S.A.
CONTACT FOR INVESTORS:Joanna Siedlaczek - Investor Relations Expert+48 669 600 567, [email protected]
Modern and diversified chemical groupon a stable progress path