CIBINONG STATION REPORTigets.u-strasbg.fr/2018workshop/1.2_01_CI.pdfCibinong , 18 Mei 2016...
17
1st Workshop on the International Geodynamics and Earth Tide Service (IGETS) 18-20 June 2018, Potsdam (Germany) CIBINONG STATION REPORT
Transcript of CIBINONG STATION REPORTigets.u-strasbg.fr/2018workshop/1.2_01_CI.pdfCibinong , 18 Mei 2016...

1st Workshop on the International Geodynamics and Earth Tide Service (IGETS) 18-20 June 2018, Potsdam (Germany)
CIBINONG STATION REPORT
BRIEF HISTORY OF SG OBSERVATION IN INDONESIA
NEW CIBINONG STATION SG DATA SG APPLICATION CONCLUSION
OUTLINE

SG OBSERVATION IN INDONESIA
Groundwater
SG:TT70-#008
(FUKUDA, 2010)
SG observation in Bandung-From 1997 to 2004-Only one SG station near the equator-Various phenomena -Geodynamics, Tectonics, Hydrology, ENSO …

SG DAMAGED BY FLOODING IN MARCH,2004
Precipitation
(FUKUDA, 2010)

(FUKUDA, 2010)
RESTARTING SG OBS IN INDONESIA
has been desired, because it is– indispensable for the studies of latitude dependent phenomena,
and other interesting phenomena;– important for Global Geodynamics Project.BAKOSURTANAL (now BIG) - (National Coordinating Agency for Surveys and Mapping of Indonesia)– has offered a new observation hut in Cibinong.
CT#022 – can be returned to serve after overhaul.
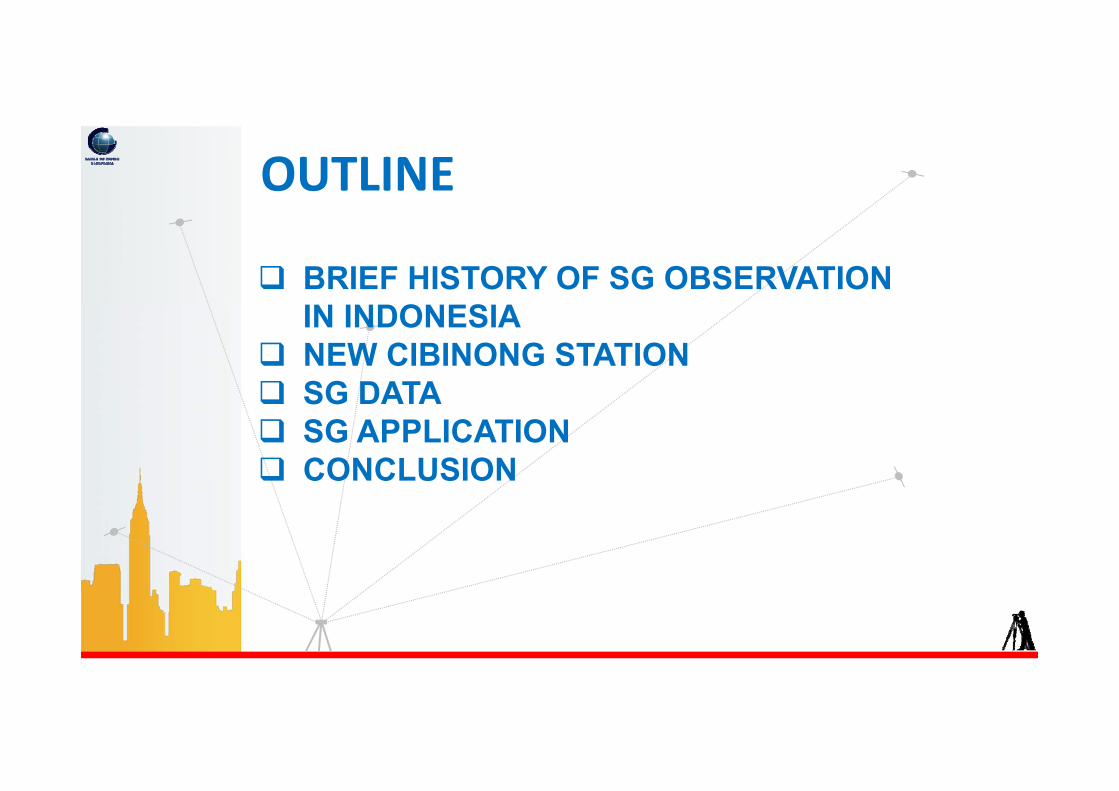
NEW SG SITES IN CIBINONG
(FUKUDA, 2010)

Leveling BMIGS point
DORIS
AG point
BAKOSURTANAL (NOW BIG)
Groundwater
(FUKUDA, 2010)

CT-022: events• 1995-2003: Aso Volcanological Laboratory, Japan
• Jun-Dec 2007: overhaul at GWR• Jan -Aug 2008: test measurements at Tsukuba Univ.• July-Oct 2008: construction of the SG hut
• Sep. 2008: transport from Tsukuba to Cibinong• Sep-Nov 2008: test in BAKOSURTANAL• Nov. 2008: installation in the new SG hut,
start observation• Mar. 2009: GPS clock, groundwater level meter• July 2009: update PC soft, rain gauge
• Sep. 2009: stop observation • Aug. 2010: restart observation
(FUKUDA, 2010)

CIBINONG STATION POSITION : IT WAS AN UNIQUE SG STATION AMONG ALL OF GGP SG STATIONSTHE ONE AND ONLY SG STATION NEAR THE EQUATOR
NEW CIBINONG SG STATION
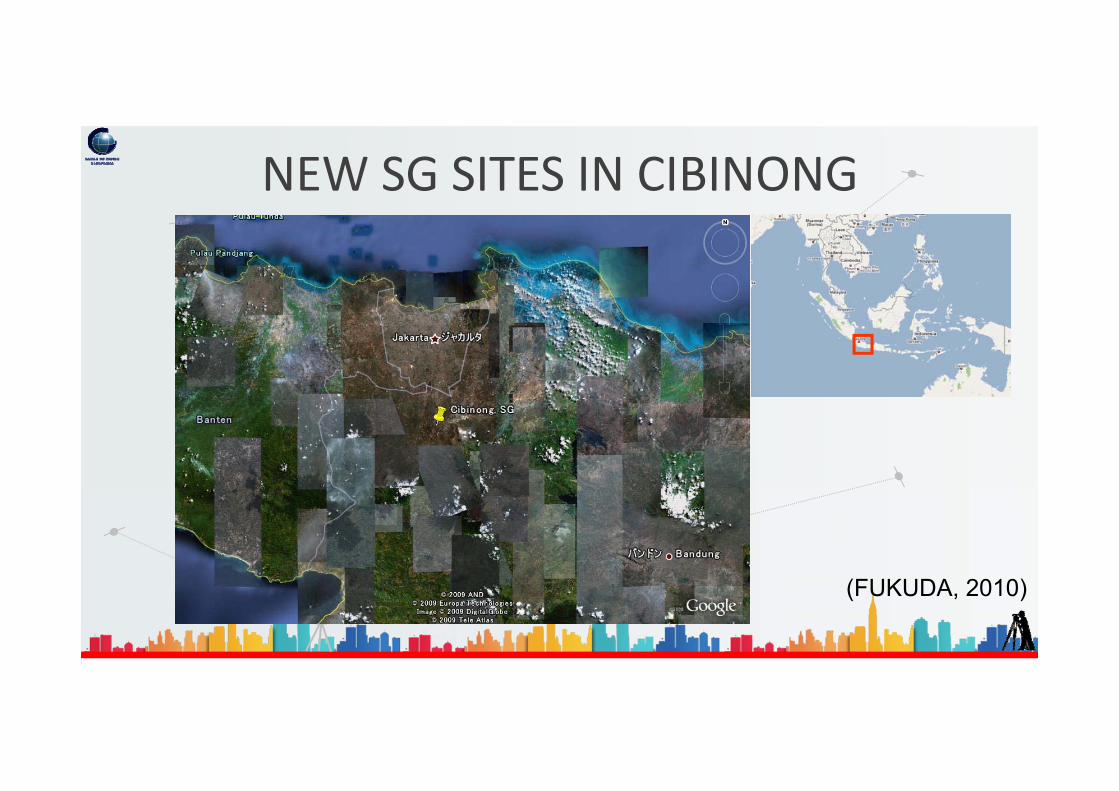
Cibinong Station has recorded almost 3 years SG data in seconds interval.
The data during 2011-2012 period were considered as the best data with minimumgaps.
SG DATA
01-May-2011 16-May-2011 01-Jun-2011-200
-100
0
100
200
mic
roG
al
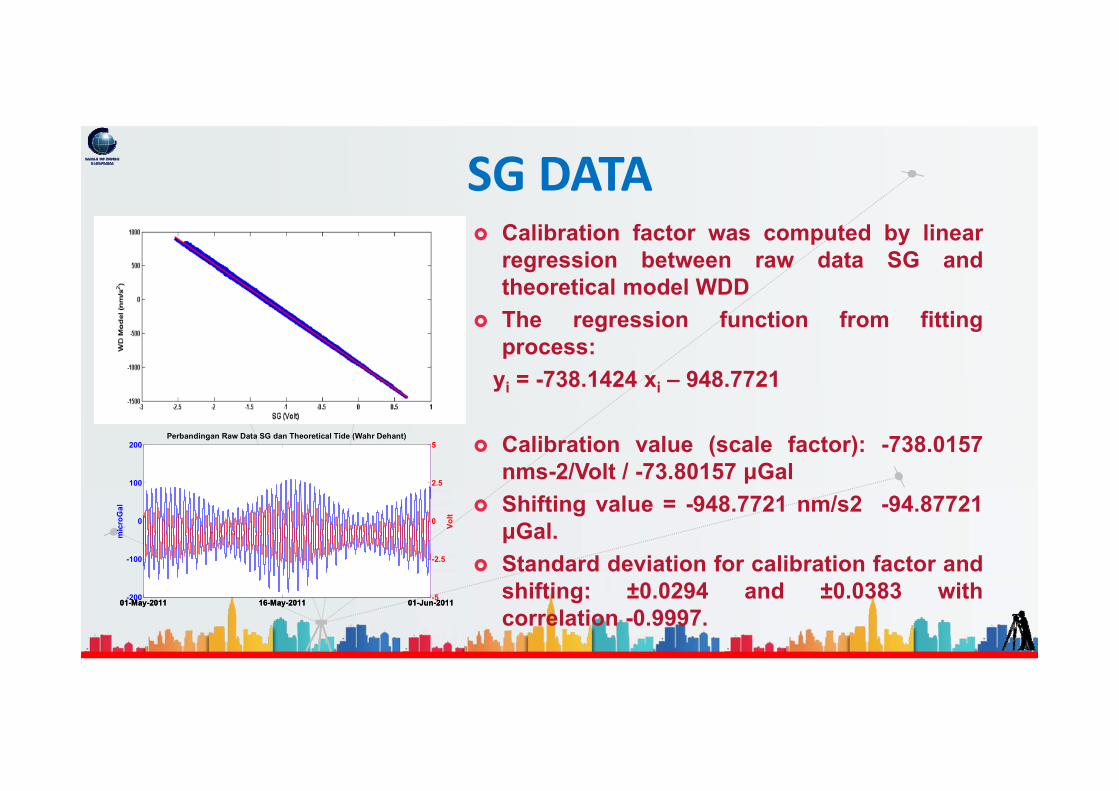
Perbandingan Raw Data SG dan Theoretical Tide (Wahr Dehant)
01-May-2011 16-May-2011 01-Jun-2011-5
-2.5
0
2.5
5Vo
lt
Calibration factor was computed by linearregression between raw data SG andtheoretical model WDD
The regression function from fittingprocess:
yi = -738.1424 xi – 948.7721
Calibration value (scale factor): -738.0157nms-2/Volt / -73.80157 μGal
Shifting value = -948.7721 nm/s2 -94.87721μGal.
Standard deviation for calibration factor andshifting: ±0.0294 and ±0.0383 withcorrelation -0.9997.
SG DATA
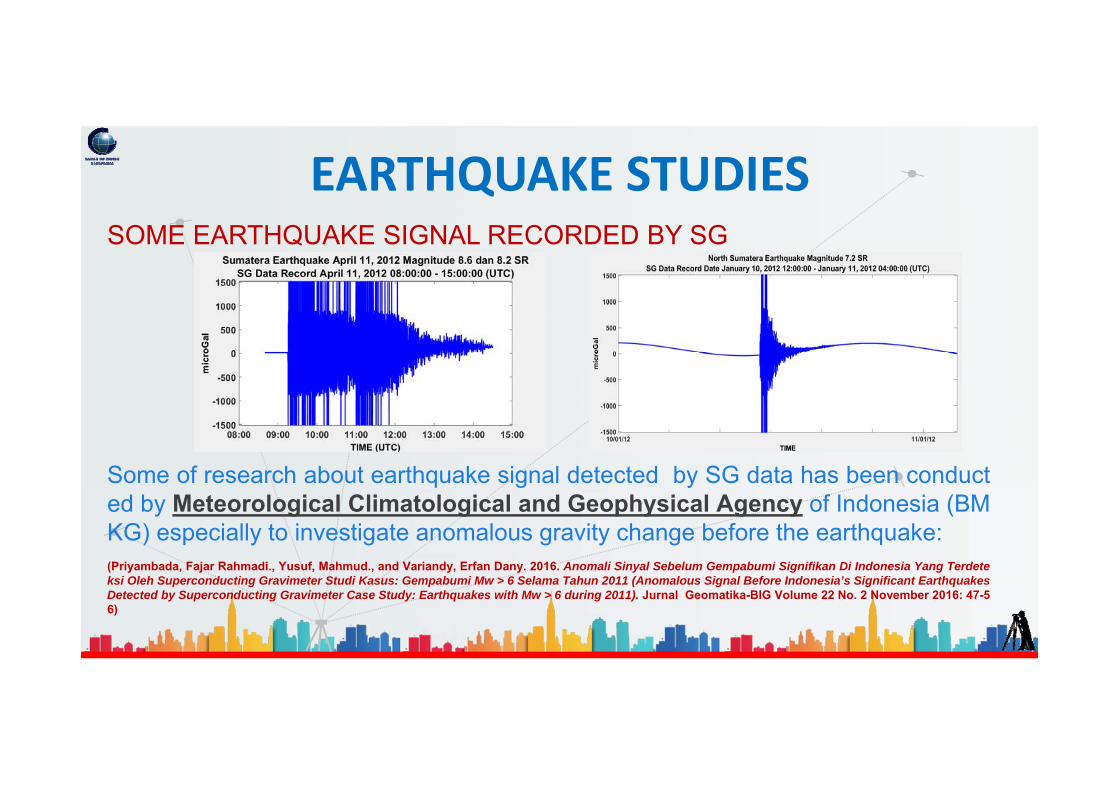
SOME EARTHQUAKE SIGNAL RECORDED BY SG
Some of research about earthquake signal detected by SG data has been conducted by Meteorological Climatological and Geophysical Agency of Indonesia (BMKG) especially to investigate anomalous gravity change before the earthquake:(Priyambada, Fajar Rahmadi., Yusuf, Mahmud., and Variandy, Erfan Dany. 2016. Anomali Sinyal Sebelum Gempabumi Signifikan Di Indonesia Yang Terdeteksi Oleh Superconducting Gravimeter Studi Kasus: Gempabumi Mw > 6 Selama Tahun 2011 (Anomalous Signal Before Indonesia’s Significant EarthquakesDetected by Superconducting Gravimeter Case Study: Earthquakes with Mw > 6 during 2011). Jurnal Geomatika-BIG Volume 22 No. 2 November 2016: 47-56)
EARTHQUAKE STUDIES

The ground water level data obtained from borehole with 15 m depth located 200 m from Cibinong SG station (shallow aquifers)Regression beetwen ground water level and SG data that done by Bramanto (2014) showed admittance value 1,7061 nms-2/m or 0,17061 μGal/m.The hydrological effect on gravity computed with admittance value range from -3 – 5 µGal
SG DATA APPLICATION IN HIDROLOGY

Tidal analysis was computed using BAYTAP-G (Tamura. 1991)
NO GROUP SYMBOL FACTOR(μGal)
RMSE(μGal)
PHASE(deg°)
RMSE(deg°)
AMPL(μGal)
RMSE(μGal)
DIURNAL (1 DAY)1 1-143 Q1 1.00427 0.00722 11.404 0.411 1.339 0.012 144-201 O1 1.08484 0.00129 9.794 0.068 7.557 0.0093 202-249 M1 1.17232 0.00843 2.929 0.412 0.642 0.0054 250-256 PI1 1.07439 0.03366 4.745 1.796 0.204 0.0065 257-266 P1 1.11824 0.00243 9.643 0.125 3.624 0.0086 267-270 S1 0.93677 0.05312 16.938 3.275 0.072 0.0047 271-288 K1 1.11356 0.0008 10.624 0.041 10.909 0.0088 289-292 PSI1 1.11177 0.05179 9.263 2.669 0.085 0.0049 293-305 PHI1 1.14191 0.0404 7.004 2.028 0.159 0.006
10 306-345 J1 1.25852 0.0138 9.669 0.629 0.689 0.00811 346-450 OO1 1.2858 0.01886 9.475 0.84 0.385 0.006
SEMI DIURNAL (12 HOURS)12 451-549 2N2 1.17601 0.00079 0.352 0.038 2.206 0.00113 550-599 N2 1.17448 0.00016 -0.116 0.008 16.65 0.00214 600-612 ALPHA2 1.19295 0.0072 1.812 0.346 0.304 0.00215 613-631 M2 1.16364 0.00003 -0.796 0.002 86.162 0.00216 632-655 BETA2 1.17311 0.01033 -3.078 0.505 0.263 0.00217 656-663 LAMBDA2 1.16344 0.00415 -0.526 0.204 0.635 0.00218 664-681 L2 1.1547 0.00124 -0.79 0.062 2.417 0.00319 682-701 T2 1.12935 0.00113 -1.543 0.057 2.274 0.00220 702-710 S2 1.13175 0.00008 -1.739 0.007 38.989 0.00321 711-827 K2 1.1354 0.00025 -1.514 0.013 10.633 0.002
TERDIURNAL (8 HOURS)22 828-909 M3 1.04525 0.00094 -0.288 0.052 1.509 0.001
NO GROUP SYMBOL FACTOR(μGal)
RMSE(μGal)
PHASE(deg°)
RMSE(deg°)
AMPL(μGal)
RMSE(μGal)
DIURNAL (1 DAY)1 1-143 Q1 1.09536 0.00926 1.302 0.484 1.461 0.0122 144-201 O1 1.11861 0.00166 -0.007 0.085 7.792 0.0123 202-249 M1 1.1518 0.01075 -1.969 0.535 0.631 0.0064 250-256 PI1 1.08409 0.03738 1.124 1.977 0.205 0.0075 257-266 P1 1.11188 0.00311 -0.182 0.16 3.604 0.016 267-270 S1 0.99771 0.05009 3.194 2.887 0.076 0.0047 271-288 K1 1.09899 0.00102 0.306 0.053 10.766 0.018 289-292 PSI1 1.10695 0.05178 2.824 2.68 0.085 0.0049 293-305 PHI1 1.12127 0.04452 2.977 2.277 0.156 0.00610 306-345 J1 1.15641 0.01738 1.3 0.862 0.634 0.0111 346-450 OO1 1.29145 0.02363 0.968 1.048 0.387 0.007
SEMI DIURNAL (12 HOURS)12 451-549 2N2 1.13452 0.00097 -0.362 0.049 2.128 0.00213 550-599 N2 1.13459 0.0002 -0.074 0.01 16.085 0.00314 600-612 ALPHA2 1.19177 0.00875 1.794 0.42 0.303 0.00215 613-631 M2 1.13221 0.00004 -0.096 0.002 83.835 0.00316 632-655 BETA2 1.16996 0.01247 -2.871 0.611 0.262 0.00317 656-663 LAMBDA2 1.16435 0.00504 -0.537 0.248 0.636 0.00318 664-681 L2 1.13217 0.00152 0.245 0.077 2.37 0.00319 682-701 T2 1.12563 0.00138 -0.551 0.07 2.267 0.00320 702-710 S2 1.12909 0.0001 -0.76 0.008 38.897 0.00321 711-827 K2 1.13275 0.0003 -0.538 0.015 10.608 0.003
TERDIURNAL (8 HOURS)22 828-909 M3 1.04525 0.00103 -0.286 0.057 1.509 0.001
RAW DATA CORRECTED WITH GLOBAL OCEAN MODEL NAO99B
TIDAL ANALYSIS OF SG DATA

DEVIATION FROM WDD SOLID EARTH TIDE MODEL
Corrected by
Observation NAO 99b WDD 99 % perbedaan O1 δ-Factor 1.08484 ± 0.00129 1.11861 1.1541 3.08
Phase(°) 9.794 ± 0.068 -0.007
K1 δ-Factor 1.11356 ± 0.0008 1.09899 1.13591 3.25Phase(°) 10.624 ± 0.041 0.0306
M2 δ-Factor 1.16364 ± 0.00003 1.13221 1.16164 2.53Phase(°) -0.796 ± 0.002 -0.096
S2 δ-Factor 1.13175 ± 0.00008 1.12909 1.16164 2.80Phase(°) -1.739 ± 0.007 -0.76
K2 δ-Factor 1.1354 ± 0.00025 1.13275 1.16164 2.49Phase(°) -1.514 ± 0.013 -0.538
TIDAL ANALYSIS OF SG DATA

Cibinong , 18 Mei 2016
Some reason that SG measurement in Cibinong should be continued: Cibinong station is the one and only SG measurement near the equator, so could des
cribe gravity variations in this zone. The equator zone like Indonesia has strong geodynamic activity like earthquake, volc
ano, land subsidence, etc, therefore SG measurement could help researcher around the world to investigate these geophysical phenomena.
Cibinong Station could help us to support the development of disaster mitigation system
SG measurement will promote many research in microgravity, hydrology and geophysics.
”We are very wellcome for any potential partner who want to install SG (especially iGrav that doesn’t need
liquid helium filling) in Indonesia.”
CONCLUSION