CIBC Second Quarter Investor Presentation · 3 2nd Quarter, 2004 Investor Presentation 5 F ‘03 F...
42
1 2nd Quarter, 2004 Investor Presentation CIBC Second Quarter Investor Presentation May 26, 2004 CIBC Overview John S. Hunkin President and Chief Executive Officer
Transcript of CIBC Second Quarter Investor Presentation · 3 2nd Quarter, 2004 Investor Presentation 5 F ‘03 F...

1
2nd Quarter, 2004 Investor Presentation
CIBC Second QuarterInvestor Presentation
May 26, 2004
CIBC Overview
John S. HunkinPresident and Chief Executive Officer

2
2nd Quarter, 2004 Investor Presentation
Second Quarter, 2004Financial Review
Tom WoodsSEVP & CFO
May 26, 2004
4
EPS(1): ROE:
$1.33 18.4%
• Gross Impaired Loans down for 5th consecutive quarter
– currently at $1.2B from $2.1B in Q2/03
• Retail / Wholesale Business mix increased to 67% / 33%
• Strong capital ratios
– Tier 1: 11.0% – Total Capital: 12.8%
• Share repurchases of 6.2MM in Q2
Results helped by:
• Canadian New Issues and Retail Brokerage – record quarters
• Merchant Banking and higher loan sales
• good wholesale loan loss performance
Results hurt by:
• lower revenue and higher loan losses in Retail
• higher project spending, particularly on governance-related initiatives
• Retail interest reimbursement ($16MM pre-tax)
Q2 Summary
_______________________(1) Reported basis; diluted, accrual EPS.
Cash basis EPS are 1¢ higher, cash basis EPS are calculated by including the after-tax impact of goodwill and other intangibles in net income. See Note to Users page.
3
2nd Quarter, 2004 Investor Presentation
5
F ‘03 F ‘04
Q2 Q3 Q4 Q1 Q2
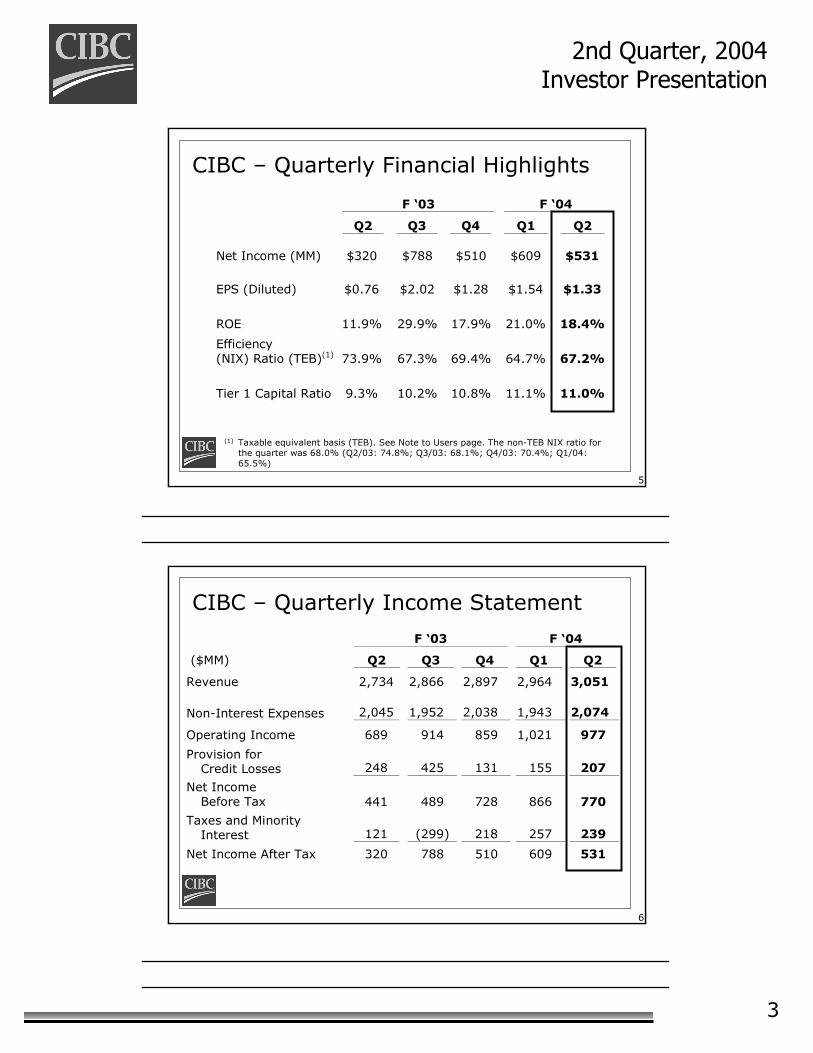
Net Income (MM) $320 $788 $510 $609 $531
EPS (Diluted) $0.76 $2.02 $1.28 $1.54 $1.33
ROE 11.9% 29.9% 17.9% 21.0% 18.4%
Efficiency (NIX) Ratio (TEB)(1) 73.9% 67.3% 69.4% 64.7% 67.2%
Tier 1 Capital Ratio 9.3% 10.2% 10.8% 11.1% 11.0%
CIBC – Quarterly Financial Highlights
(1) Taxable equivalent basis (TEB). See Note to Users page. The non-TEB NIX ratio for the quarter was 68.0% (Q2/03: 74.8%; Q3/03: 68.1%; Q4/03: 70.4%; Q1/04: 65.5%)
6
CIBC – Quarterly Income Statement F ‘03 F ‘04
($MM) Q2 Q3 Q4 Q1 Q2
Revenue 2,734 2,866 2,897 2,964 3,051
Non-Interest Expenses 2,045 1,952 2,038 1,943 2,074
Operating Income 689 914 859 1,021 977
Provision for Credit Losses 248 425 131 155 207
Net Income Before Tax 441 489 728 866 770
Taxes and Minority Interest 121 (299) 218 257 239
Net Income After Tax 320 788 510 609 531
4
2nd Quarter, 2004 Investor Presentation
7
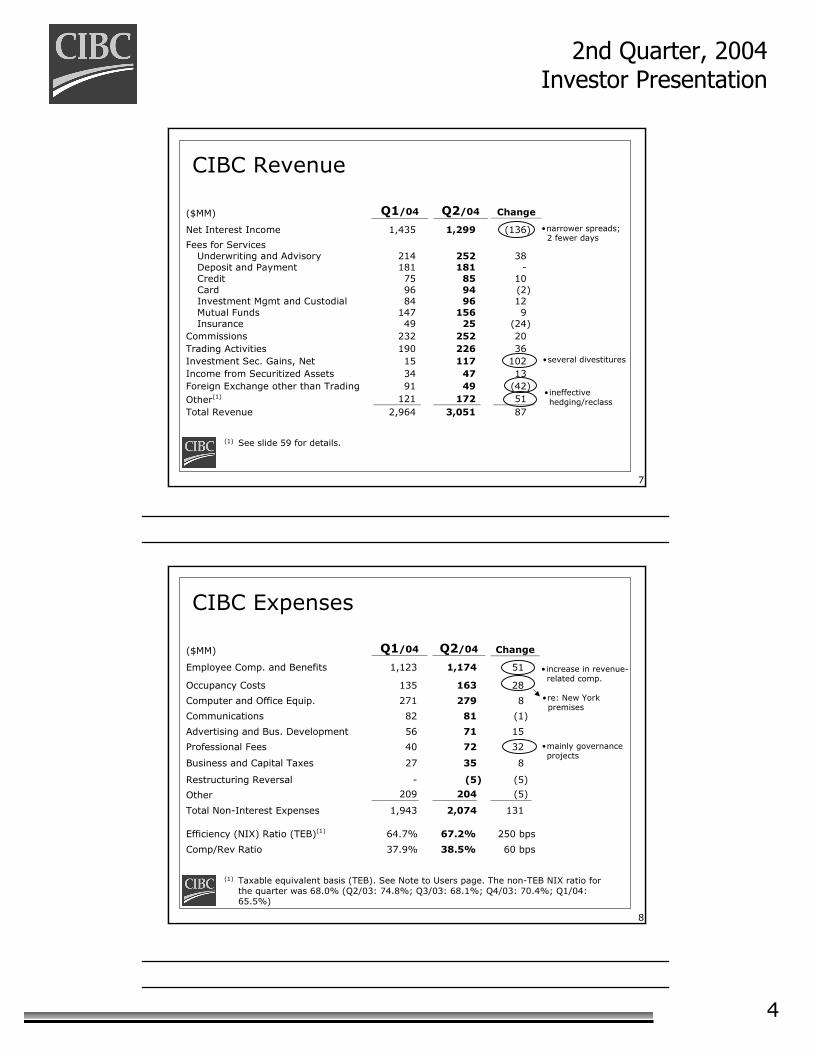
CIBC Revenue
($MM) Q1/04 Q2/04 Change
Net Interest Income 1,435 1,299 (136)
Fees for Services Underwriting and Advisory 214 252 38 Deposit and Payment 181 181 - Credit 75 85 10 Card 96 94 (2) Investment Mgmt and Custodial 84 96 12 Mutual Funds 147 156 9 Insurance 49 25 (24)
Commissions 232 252 20
Trading Activities 190 226 36
Investment Sec. Gains, Net 15 117 102
Income from Securitized Assets 34 47 13
Foreign Exchange other than Trading 91 49 (42)
Other(1) 121 172 51
Total Revenue 2,964 3,051 87
(1) See slide 59 for details.
•narrower spreads; 2 fewer days
•several divestitures
•ineffective hedging/reclass
8
CIBC Expenses
($MM) Q1/04 Q2/04 Change
Employee Comp. and Benefits 1,123 1,174 51
Occupancy Costs 135 163 28
Computer and Office Equip. 271 279 8
Communications 82 81 (1)
Advertising and Bus. Development 56 71 15
Professional Fees 40 72 32
Business and Capital Taxes 27 35 8
Restructuring Reversal - (5) (5)
Other 209 204 (5)
Total Non-Interest Expenses 1,943 2,074 131 Efficiency (NIX) Ratio (TEB)(1) 64.7% 67.2% 250 bps
Comp/Rev Ratio 37.9% 38.5% 60 bps
•increase in revenue-related comp.
•mainly governance projects
•re: New Yorkpremises
(1) Taxable equivalent basis (TEB). See Note to Users page. The non-TEB NIX ratio for the quarter was 68.0% (Q2/03: 74.8%; Q3/03: 68.1%; Q4/03: 70.4%; Q1/04: 65.5%)

5
2nd Quarter, 2004 Investor Presentation
9
CIBC – Reported EPS(1)
1.331.54
2.02
0.76
1.111.28
Q1 Q2 Q3 Q4 Q1 Q2
F ‘03 F ‘04
(1) Diluted, accrual basis.
($)
10
3.08 3.38 3.65 3.66
1.04 0.88
(0.83)
1.832.54 1.00
0.42 0.61
EPS(1)(3) by type of Business
(1) Excludes notable items and Amicus.(2) Wealth Management and Commercial Banking included in “Retail”.(3) EPS shown here excludes earnings/losses not directly attributable to Wholesale/Retail
businesses: F ‘00: $(0.16); F ‘01: $(0.02); F ‘02: $(0.26); F ‘03: $(0.44); Q1F ‘04: $(0.06); Q2F ‘04: $(0.16).
“Wholesale”
“Retail”(2)
F ‘01 F ‘02 F ‘03Annual
F ‘00F`04
Q1 Q2
($)

6
2nd Quarter, 2004 Investor Presentation
11
CIBC - NIAT Components
F ‘03 F ‘04 ($MM) Q2 Q3 Q4 Q1 Q2
CIBC Retail Markets 159(1) 247 204 282 205
CIBC Wealth Management 69 87 89 92 99
CIBC World Markets 115 3(2) 126(3) 194 259
Corporate and Other (23) 451(4) 91(5) 41 (32)
Total 320 788 510 609 531
Notable items (after-tax) include: (1) $81MM write-down on Air Canada contract.(2) $88MM loss on loans held for sale.(3) $64MM loss on loans held for sale.(4) $689MM recovery of income tax and ($232MM) future tax asset valuation adjustment.(5) $95MM reversal of general provision.
12
CIBC Retail Markets - Revenue
($MM)
1,2041,330
1,203 1,257 1,303 1,246
Q1 Q2 Q3 Q4 Q1 Q2
F ‘03 F ‘04
7
2nd Quarter, 2004 Investor Presentation
13
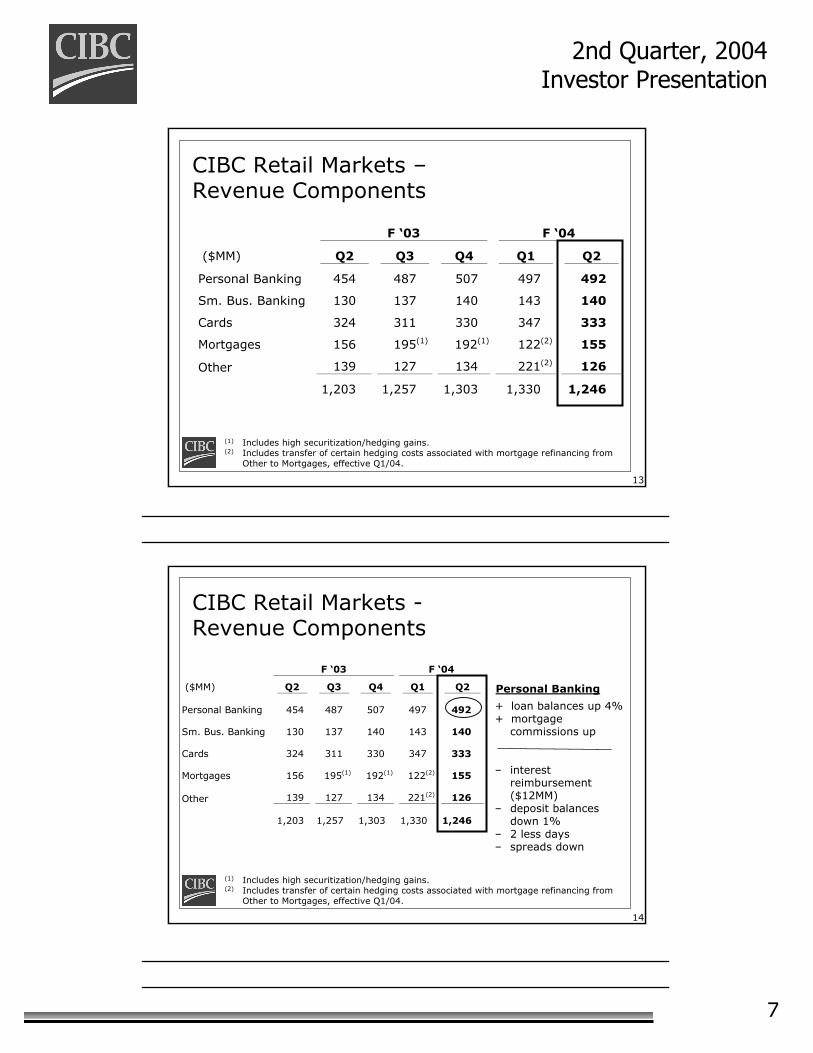
CIBC Retail Markets –Revenue Components
(1) Includes high securitization/hedging gains.(2) Includes transfer of certain hedging costs associated with mortgage refinancing from
Other to Mortgages, effective Q1/04.
F ‘03 F ‘04
($MM) Q2 Q3 Q4 Q1 Q2
Personal Banking 454 487 507 497 492
Sm. Bus. Banking 130 137 140 143 140
Cards 324 311 330 347 333
Mortgages 156 195(1) 192(1) 122(2) 155
Other 139 127 134 221(2) 126
1,203 1,257 1,303 1,330 1,246
14
+ loan balances up 4%+ mortgage
commissions up
– interest reimbursement ($12MM)
– deposit balances down 1%
– 2 less days– spreads down
CIBC Retail Markets -Revenue Components
(1) Includes high securitization/hedging gains.(2) Includes transfer of certain hedging costs associated with mortgage refinancing from
Other to Mortgages, effective Q1/04.
Personal Banking
F ‘03 F ‘04
($MM) Q2 Q3 Q4 Q1 Q2
Personal Banking 454 487 507 497 492
Sm. Bus. Banking 130 137 140 143 140
Cards 324 311 330 347 333
Mortgages 156 195(1) 192(1) 122(2) 155
Other 139 127 134 221(2) 126
1,203 1,257 1,303 1,330 1,246

8
2nd Quarter, 2004 Investor Presentation
15
F ‘03 F ‘04
($MM) Q2 Q3 Q4 Q1 Q2
Personal Banking 454 487 507 497 492
Sm. Bus. Banking 130 137 140 143 140
Cards 324 311 330 347 333
Mortgages 156 195(1) 192(1) 122(2) 155
Other 139 127 134 221(2) 126
1,203 1,257 1,303 1,330 1,246
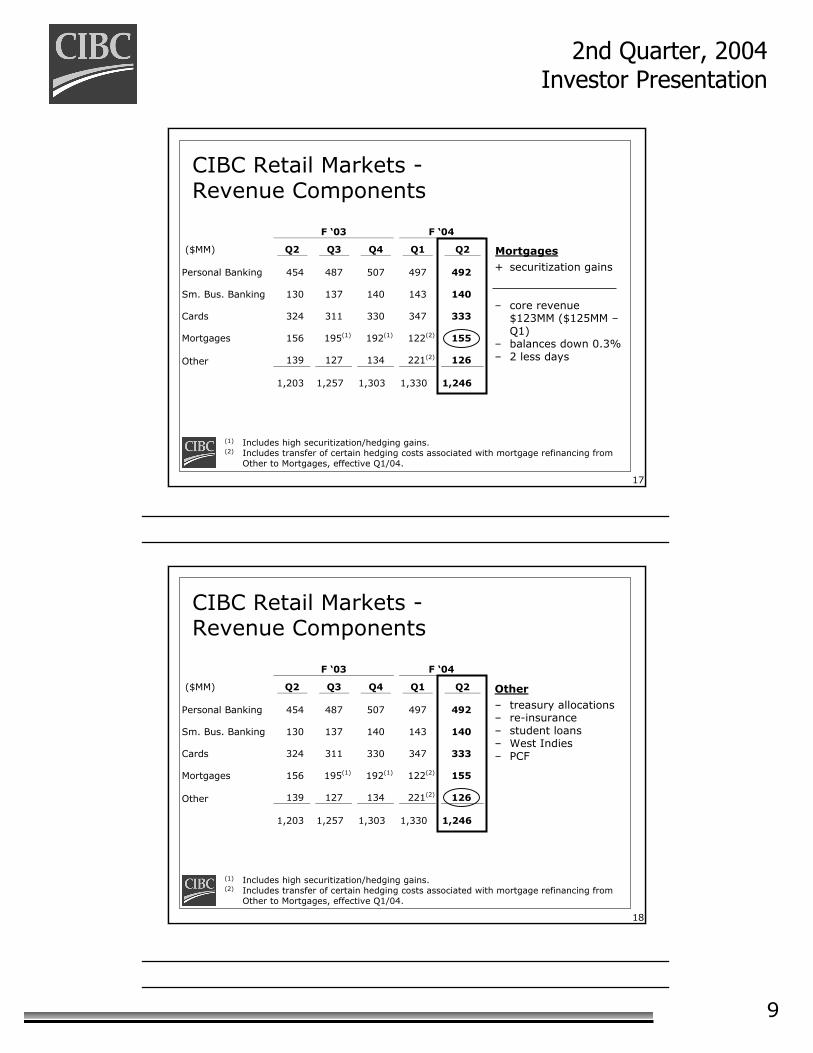
CIBC Retail Markets -Revenue Components
Small Business+ loan balances up
3% + mortgage
commissions up
– deposit balances down 1%
– spreads down– 2 less days
(1) Includes high securitization/hedging gains.(2) Includes transfer of certain hedging costs associated with mortgage refinancing from
Other to Mortgages, effective Q1/04.
16
F ‘03 F ‘04
($MM) Q2 Q3 Q4 Q1 Q2
Personal Banking 454 487 507 497 492
Sm. Bus. Banking 130 137 140 143 140
Cards 324 311 330 347 333
Mortgages 156 195(1) 192(1) 122(2) 155
Other 139 127 134 221(2) 126
1,203 1,257 1,303 1,330 1,246
CIBC Retail Markets -Revenue Components
Cards+ revolve rate up+ FX up
– balances down 3%– purchase volumes
down– 2 less days– securitization
revenue down
(1) Includes high securitization/hedging gains.(2) Includes transfer of certain hedging costs associated with mortgage refinancing from
Other to Mortgages, effective Q1/04.
9
2nd Quarter, 2004 Investor Presentation
17
F ‘03 F ‘04
($MM) Q2 Q3 Q4 Q1 Q2
Personal Banking 454 487 507 497 492
Sm. Bus. Banking 130 137 140 143 140
Cards 324 311 330 347 333
Mortgages 156 195(1) 192(1) 122(2) 155
Other 139 127 134 221(2) 126
1,203 1,257 1,303 1,330 1,246
CIBC Retail Markets -Revenue Components
Mortgages
+ securitization gains
– core revenue $123MM ($125MM –Q1)
– balances down 0.3%– 2 less days
(1) Includes high securitization/hedging gains.(2) Includes transfer of certain hedging costs associated with mortgage refinancing from
Other to Mortgages, effective Q1/04.
18
F ‘03 F ‘04
($MM) Q2 Q3 Q4 Q1 Q2
Personal Banking 454 487 507 497 492
Sm. Bus. Banking 130 137 140 143 140
Cards 324 311 330 347 333
Mortgages 156 195(1) 192(1) 122(2) 155
Other 139 127 134 221(2) 126
1,203 1,257 1,303 1,330 1,246
CIBC Retail Markets -Revenue Components
Other
– treasury allocations– re-insurance– student loans– West Indies– PCF
(1) Includes high securitization/hedging gains.(2) Includes transfer of certain hedging costs associated with mortgage refinancing from
Other to Mortgages, effective Q1/04.
10
2nd Quarter, 2004 Investor Presentation
19
205
282
204247
159(1)
253
Q1 Q2 Q3 Q4 Q1 Q2
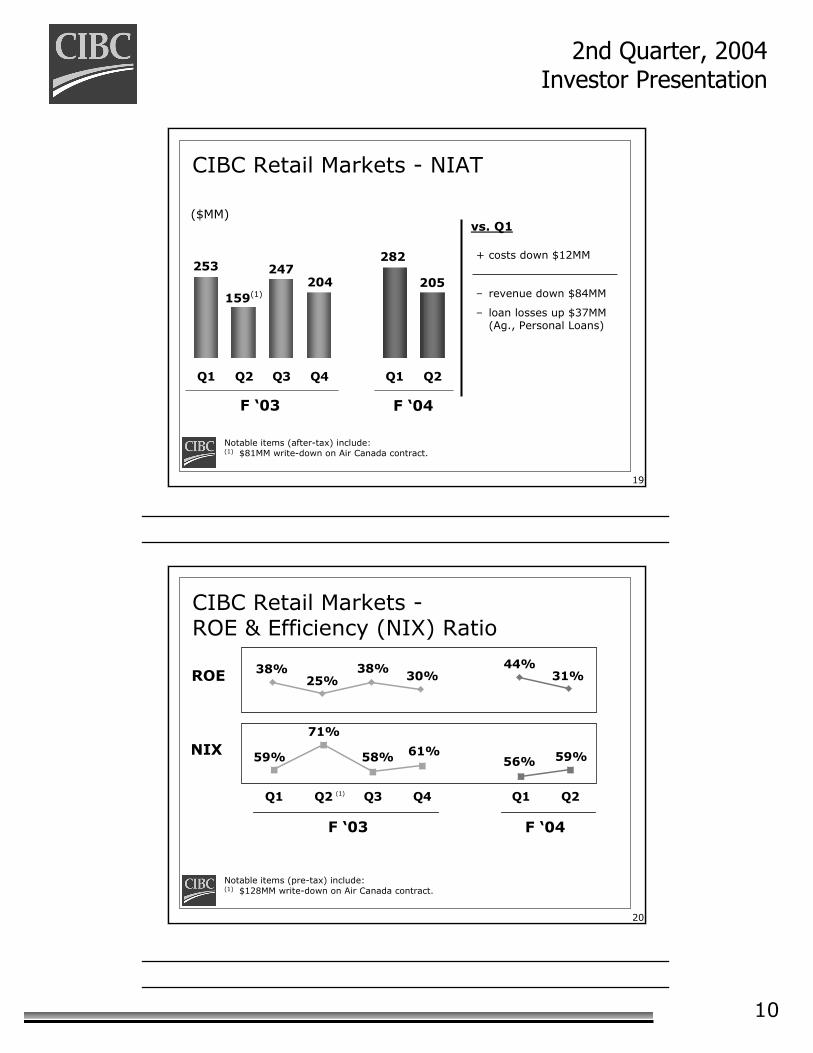
CIBC Retail Markets - NIAT
($MM)
F ‘03
vs. Q1
Notable items (after-tax) include:(1) $81MM write-down on Air Canada contract.
+ costs down $12MM
– revenue down $84MM
– loan losses up $37MM (Ag., Personal Loans)
F ‘04
20
71%
59% 58% 61%56% 59%
Q1 Q2 Q3 Q4 Q1 Q2
ROE
NIX
30% 31%38%25%
38% 44%
Notable items (pre-tax) include: (1) $128MM write-down on Air Canada contract.
CIBC Retail Markets -ROE & Efficiency (NIX) Ratio
F ‘03
(1)
F ‘04

11
2nd Quarter, 2004 Investor Presentation
21
Note: Includes assets under administration booked under Retail Markets only. See page 6 of the Supplementary Financial Information.
CIBC Retail Markets -Cards & Mortgages
($B; spot)
ResidentialMortgages
Card Loans9.99.99.99.79.59.9
Q1 Q2 Q3 Q4 Q1 Q2
79.677.976.774.672.371.0
F ‘03 F ‘04
22
CIBC Retail Markets -Loan Balances(1)
($B; spot)
(1) Includes loans booked under Retail Markets only.(2) Personal loans excluding student and dealer plan loans.(3) Small Business loans excluding dealer plan loans.
16.2 17.0 17.8 18.3 18.8 19.9
Q1 Q2 Q3 Q4 Q1 Q2
PersonalLoans(2)
Small Bus.Loans(3)
F ‘04F ‘03
11.0 11.3 11.4 11.4 11.7 11.7

12
2nd Quarter, 2004 Investor Presentation
23
Residential Mortgages
14.7%14.8%14.4% 14.6% 14.7% 14.8%
CIBC Retail Markets - Market Share
F ‘03 F ‘04
Source: OSFI (consumer deposits); Bank of Canada (all other).One or two month time lag depending on availability of disclosure.
ConsumerDeposits
19.1%19.1%19.3%19.5% 19.2% 19.3%
Consumer Loans
(excl. cards)
15.0%15.0%14.9% 15.0% 15.0% 14.9%
Q1 Q2 Q3 Q4 Q1 Q2
24
Cards, outstanding
Cards, purchase volumes
F ‘03 F ‘04
Source: CBA; excludes AMEX and proprietary cards. Two month time lag.
CIBC Retail Markets - Market Share (cont'd)
19.8%20.0%21.4% 20.9% 20.3%
19.2%
30.9%31.6%
32.3%32.0% 31.8% 31.8%
Q1 Q2 Q3 Q4 Q1 Q2

13
2nd Quarter, 2004 Investor Presentation
25
CIBC Wealth Management -Revenue
($MM)
Notable items (pre-tax) include:(1) $52MM gain on sale of Oppenheimer Private Client and Asset Management businesses.
Q1/03 includes 2 months of Oppenheimer revenues (before sale) of $77MM.
653625604615574
738(1)
Q1 Q2 Q3 Q4 Q1 Q2
F ‘03 F ‘04
26
F ‘03 F ‘04
($MM) Q2 Q3 Q4 Q1 Q2
Imperial Service 173 180 189 188 187
Retail Brokerage 245 250 246 258 294
Private Wealth Management 35 39 30 35 37
Wealth Products 124 128 123 119 120
Other (3) 18 16 25 15
574 615 604 625 653
CIBC Wealth Management -Revenue Components

14
2nd Quarter, 2004 Investor Presentation
27
CIBC Wealth Management -Revenue Components
Imperial Service
F ‘03 F ‘04
($MM) Q2 Q3 Q4 Q1 Q2
Imperial Service 173 180 189 188 187
Retail Brokerage 245 250 246 258 294
Private Wealth Management 35 39 30 35 37
Wealth Products 124 128 123 119 120
Other (3) 18 16 25 15
574 615 604 625 653
+ funds managed up 2% (vs. Q1) and up 8% (vs. Q2/03)
+ product commissions
– spreads down– interest
reimbursement ($3MM)
– 2 fewer days
28
+ CIBC Wood Gundy –record quarter
– 1st mo. of Q3 well down
CIBC Wealth Management -Revenue Components
Retail Brokerage
F ‘03 F ‘04
($MM) Q2 Q3 Q4 Q1 Q2
Imperial Service 173 180 189 188 187
Retail Brokerage 245 250 246 258 294
Private Wealth Management 35 39 30 35 37
Wealth Products 124 128 123 119 120
Other (3) 18 16 25 15
574 615 604 625 653

15
2nd Quarter, 2004 Investor Presentation
29
+ Mutual Funds up
– GIC’s down
CIBC Wealth Management -Revenue Components
Wealth Products
F ‘03 F ‘04
($MM) Q2 Q3 Q4 Q1 Q2
Imperial Service 173 180 189 188 187
Retail Brokerage 245 250 246 258 294
Private Wealth Management 35 39 30 35 37
Wealth Products 124 128 123 119 120
Other (3) 18 16 25 15
574 615 604 625 653
30
CIBC Wealth Management - NIAT
Notable items (after-tax) include:(1) $28MM gain on sale of Oppenheimer Private Client and Asset Management
businesses.
121(1)
6987 89 92 99
Q1 Q2 Q3 Q4 Q1 Q2
($MM)vs. Q1
F ‘03 F ‘04
+ revenue up $28MM
+ lower tax rate
– costs up $32MM
16
2nd Quarter, 2004 Investor Presentation
31
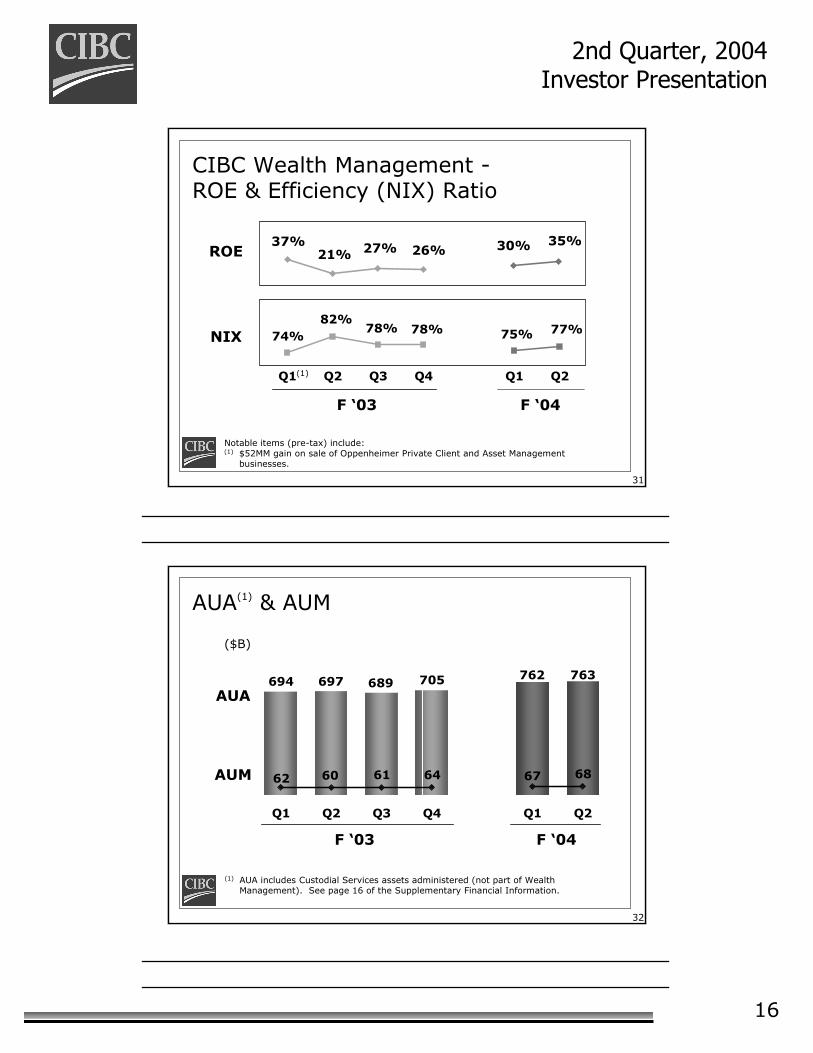
37%21% 27% 26% 30% 35%
Notable items (pre-tax) include:(1) $52MM gain on sale of Oppenheimer Private Client and Asset Management
businesses.
CIBC Wealth Management -ROE & Efficiency (NIX) Ratio
ROE
77%75%78%78%82%
74%
Q1 Q2 Q3 Q4 Q1 Q2(1)
F ‘03 F ‘04
NIX
32
694 697 689763762705
686764616062
Q1 Q2 Q3 Q4 Q1 Q2
(1) AUA includes Custodial Services assets administered (not part of Wealth Management). See page 16 of the Supplementary Financial Information.
AUA(1) & AUM
AUA
AUM
($B)
F ‘04F ‘03
17
2nd Quarter, 2004 Investor Presentation
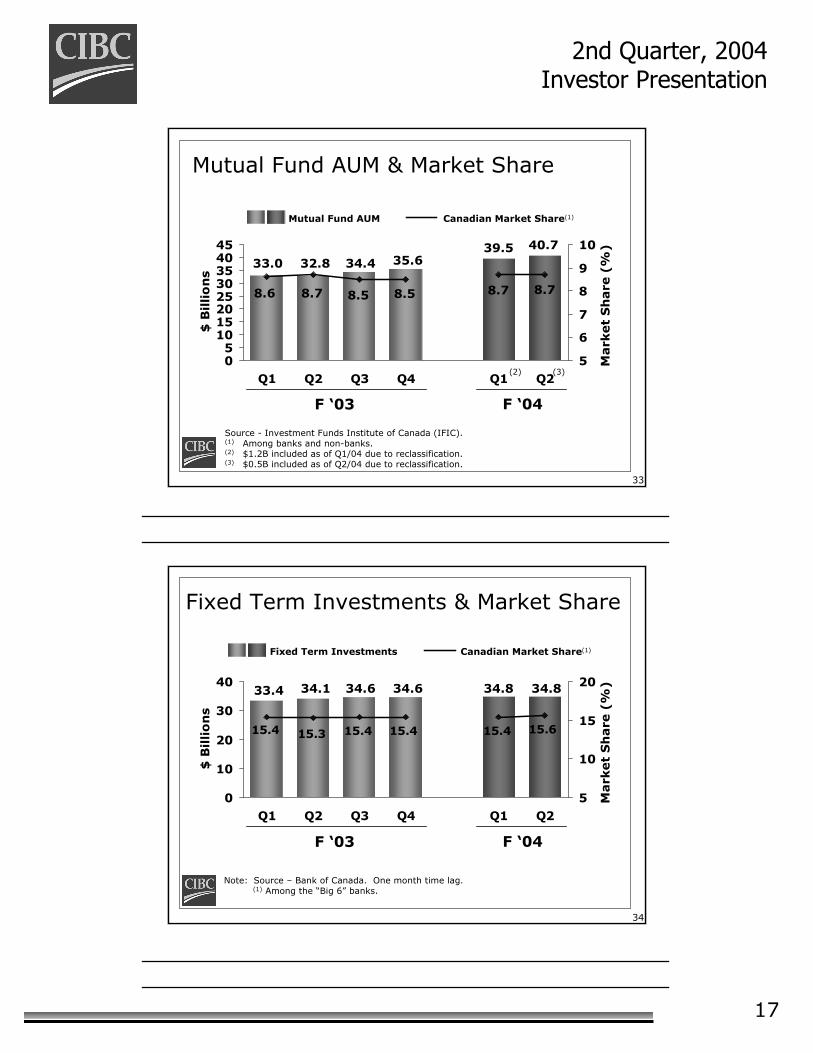
33
39.533.0 32.8 34.4 35.6
40.7
8.78.78.58.58.78.6
05
1015202530354045
Q1 Q2 Q3 Q4 Q1 Q2
$ B
illio
ns
5
6
7
8
9
10
Mark
et
Sh
are
(%
)
Mutual Fund AUM & Market Share
Source - Investment Funds Institute of Canada (IFIC).(1) Among banks and non-banks.(2) $1.2B included as of Q1/04 due to reclassification.(3) $0.5B included as of Q2/04 due to reclassification.
Mutual Fund AUM Canadian Market Share(1)
F ‘03 F ‘04
(2) (3)
34
34.834.634.634.133.4 34.8
15.4 15.3 15.4 15.4 15.4 15.6
0
10
20
30
40
Q1 Q2 Q3 Q4 Q1 Q2
$ B
illio
ns
5
10
15
20
Mark
et
Sh
are
(%
)Fixed Term Investments & Market Share
Note: Source – Bank of Canada. One month time lag.(1) Among the “Big 6” banks.
Fixed Term Investments Canadian Market Share(1)
F ‘03 F ‘04

18
2nd Quarter, 2004 Investor Presentation
35
# Financial Advisers Funds Managed Per FA ($MM)
Productivity
46.8
56.3 58.7 60.7 61.5
2001 2002 2003 Q1F Q2F
Imperial Service
319
8871,029 1,027 1,059
F '01 F '02 F '03 Q1F Q2F
Registered Reps in bank branches Funds Managed Per FA
F ‘01 F ‘02 F ‘03 Q1 Q2 F ‘01 F ‘02 F ‘03 Q1 Q2
Annual Annual F ‘04F ‘04
36
Discount Brokerage
395378380375368354
9.48.6
6.96.25.75.9
0
100
200
300
400
Q1 Q2 Q3 Q4 Q1 Q20
5
10
15
20
Active Accounts (000's) (left axis)
Trades/Day (000's)
Note: Average over the quarter.
F ‘03 F ‘04

19
2nd Quarter, 2004 Investor Presentation
37
CIBC Wood Gundy(1)
98.297.391.689.084.084.4
70.0
56.2 57.261.9 64.3 68.9
0
20
40
60
80
100
Q1 Q2 Q3 Q4 Q1 Q20
20
40
60
80
100
AUA ($B)
AUA per Investment Adviser ($MM)
F ‘03 F ‘04AUA includes client cash and short positions.(1) Canadian Full Service Brokerage.
38
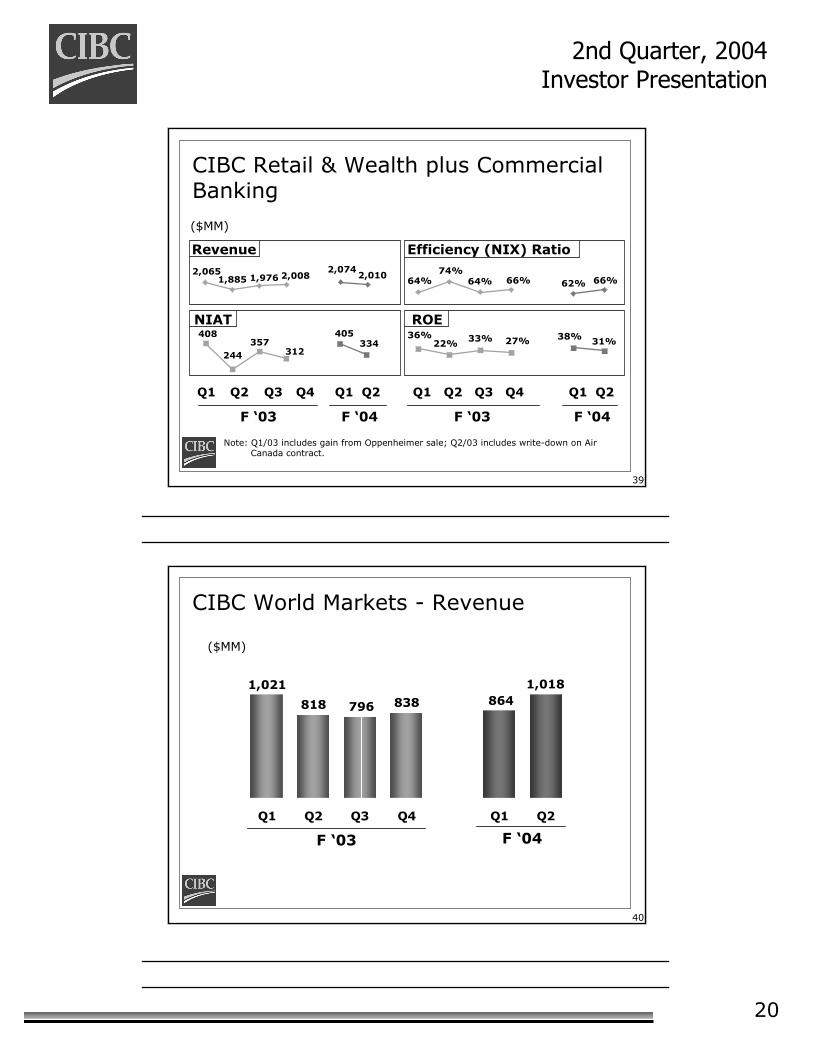
CIBC Retail & Wealth plus Commercial Banking
($MM) Revenue NIAT
F ‘03 F ‘04 F ‘03 F ‘04 Q2 Q1 Q2 Q2 Q1 Q2
CIBC Retail Markets 1,203 1,330 1,246 159 282 205
CIBC Wealth Management 574 625 653 69 92 99
CIBC Retail & Wealth 1,777 1,955 1,899 228 374 304
Plus: Commercial Banking 108 119 111 16 31 30
1,885 2,074 2,010 244 405 334
20
2nd Quarter, 2004 Investor Presentation
39
334405
312357
244
408
2,0102,074
2,0081,9761,8852,065
($MM)
Note: Q1/03 includes gain from Oppenheimer sale; Q2/03 includes write-down on Air Canada contract.
CIBC Retail & Wealth plus Commercial Banking
Revenue
NIAT
Q1 Q2 Q3 Q4 Q1 Q2
64%74%
64% 66% 62% 66%
31%38%27%33%22%36%
Efficiency (NIX) Ratio
ROE
F ‘04
Q1 Q2 Q3 Q4 Q1 Q2
F ‘03 F ‘04F ‘03
40
1,021 1,018
838796818 864
Q1 Q2 Q3 Q4 Q1 Q2
CIBC World Markets - Revenue
($MM)
F ‘04F ‘03

21
2nd Quarter, 2004 Investor Presentation
41
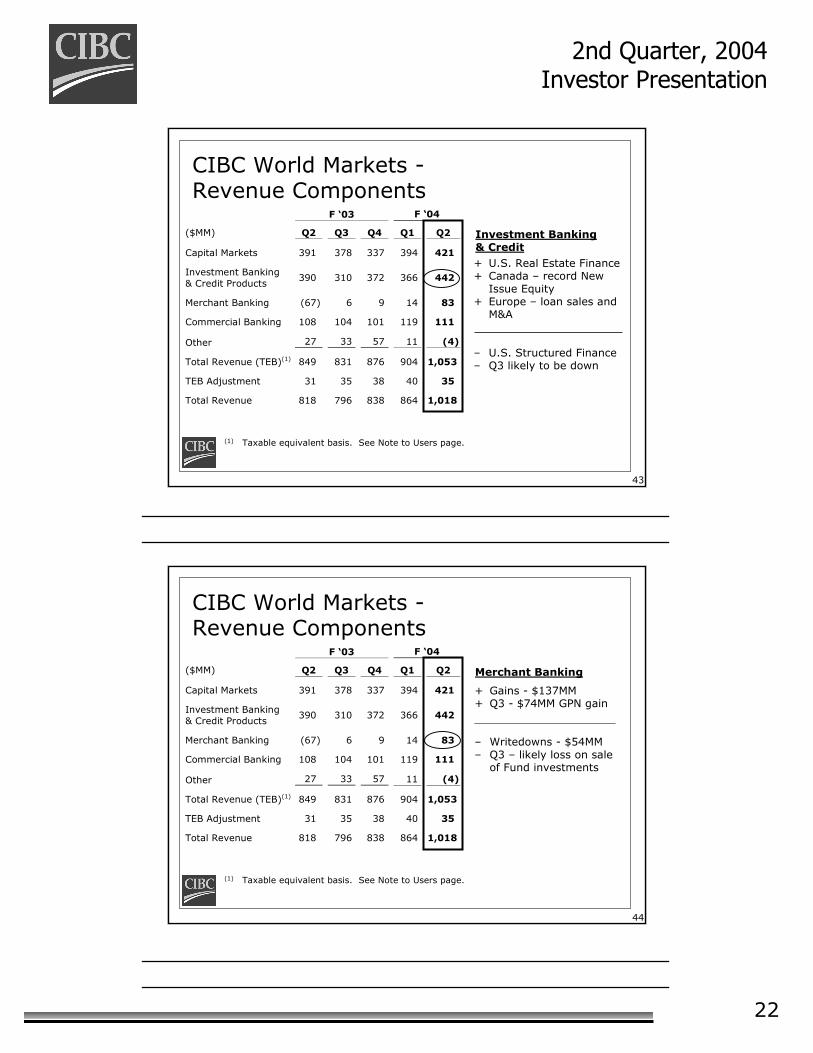
CIBC World Markets –Revenue Components
F ‘03 F ‘04
($MM) Q2 Q3 Q4 Q1 Q2
Capital Markets 391 378 337 394 421
Investment Banking & Credit Products 390 310 372 366 442 Merchant Banking (67) 6 9 14 83
Commercial Banking 108 104 101 119 111 Other 27 33 57 11 (4)
Total Revenue (TEB)(1) 849 831 876 904 1,053
TEB Adjustment 31 35 38 40 35
Total Revenue 818 796 838 864 1,018 1,049
(1) Taxable equivalent basis. See Note to Users page.
42
+ Structured products+ Canadian new equity
issues
– Foreign exchange
F ‘03 F ‘04
($MM) Q2 Q3 Q4 Q1 Q2
Capital Markets 391 378 337 394 421
Investment Banking & Credit Products
390 310 372 366 442
Merchant Banking (67) 6 9 14 83
Commercial Banking 108 104 101 119 111
Other 27 33 57 11 (4)
Total Revenue (TEB)(1) 849 831 876 904 1,053
TEB Adjustment 31 35 38 40 35
Total Revenue 818 796 838 864 1,018
CIBC World Markets -Revenue Components
Capital Markets
(1) Taxable equivalent basis. See Note to Users page.
22
2nd Quarter, 2004 Investor Presentation
43
F ‘03 F ‘04
($MM) Q2 Q3 Q4 Q1 Q2
Capital Markets 391 378 337 394 421
Investment Banking & Credit Products
390 310 372 366 442
Merchant Banking (67) 6 9 14 83
Commercial Banking 108 104 101 119 111
Other 27 33 57 11 (4)
Total Revenue (TEB)(1) 849 831 876 904 1,053
TEB Adjustment 31 35 38 40 35
Total Revenue 818 796 838 864 1,018
CIBC World Markets -Revenue Components
Investment Banking & Credit+ U.S. Real Estate Finance + Canada – record New
Issue Equity+ Europe – loan sales and
M&A
– U.S. Structured Finance– Q3 likely to be down
(1) Taxable equivalent basis. See Note to Users page.
44
+ Gains - $137MM+ Q3 - $74MM GPN gain
– Writedowns - $54MM– Q3 – likely loss on sale
of Fund investments
CIBC World Markets -Revenue Components
Merchant Banking
F ‘03 F ‘04
($MM) Q2 Q3 Q4 Q1 Q2
Capital Markets 391 378 337 394 421
Investment Banking & Credit Products
390 310 372 366 442
Merchant Banking (67) 6 9 14 83
Commercial Banking 108 104 101 119 111
Other 27 33 57 11 (4)
Total Revenue (TEB)(1) 849 831 876 904 1,053
TEB Adjustment 31 35 38 40 35
Total Revenue 818 796 838 864 1,018
(1) Taxable equivalent basis. See Note to Users page.
23
2nd Quarter, 2004 Investor Presentation
45
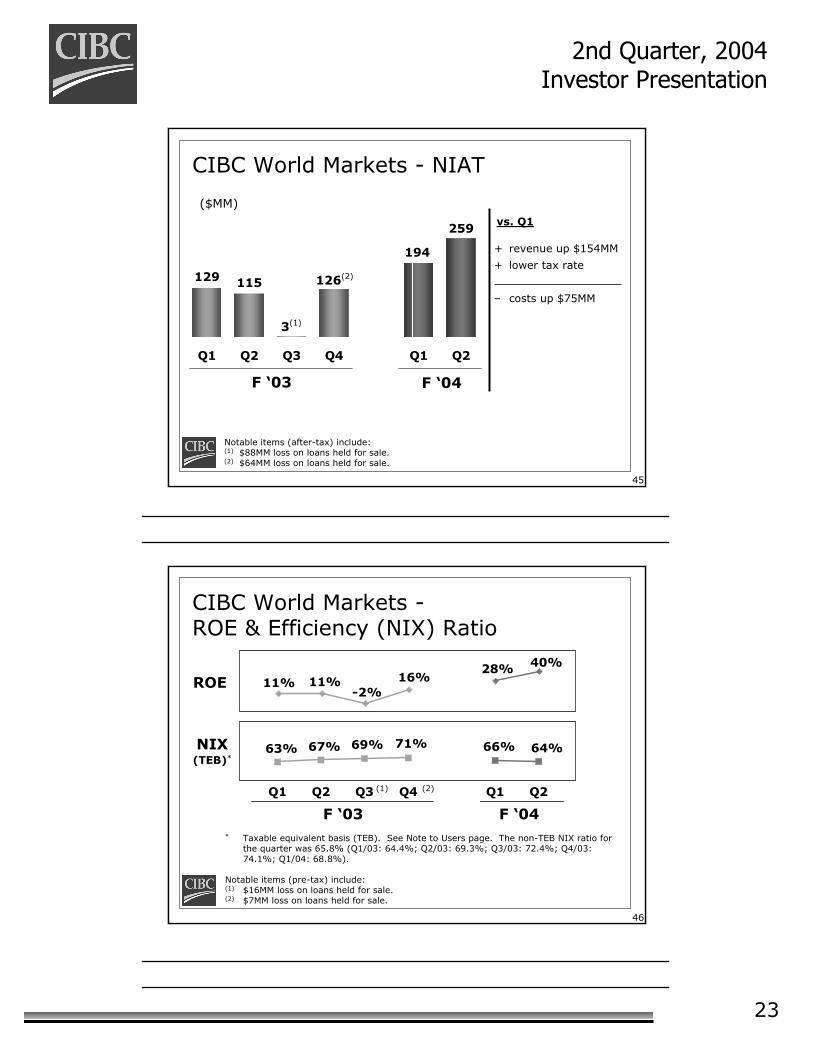
CIBC World Markets - NIAT
129 115
3(1)
126(2)
194
259
Q1 Q2 Q3 Q4 Q1 Q2
($MM)
F ‘03 F ‘04
vs. Q1
+ revenue up $154MM
+ lower tax rate
– costs up $75MM
Notable items (after-tax) include: (1) $88MM loss on loans held for sale.(2) $64MM loss on loans held for sale.
46
* Taxable equivalent basis (TEB). See Note to Users page. The non-TEB NIX ratio for the quarter was 65.8% (Q1/03: 64.4%; Q2/03: 69.3%; Q3/03: 72.4%; Q4/03: 74.1%; Q1/04: 68.8%).
Notable items (pre-tax) include:(1) $16MM loss on loans held for sale.(2) $7MM loss on loans held for sale.
ROE
NIX(TEB)*
CIBC World Markets -ROE & Efficiency (NIX) Ratio
64%66%71%69%67%63%
Q1 Q2 Q3 Q4 Q1 Q2
11% 11%-2%
16%28% 40%
F ‘03 F ‘04
(1) (2)
24
2nd Quarter, 2004 Investor Presentation
47
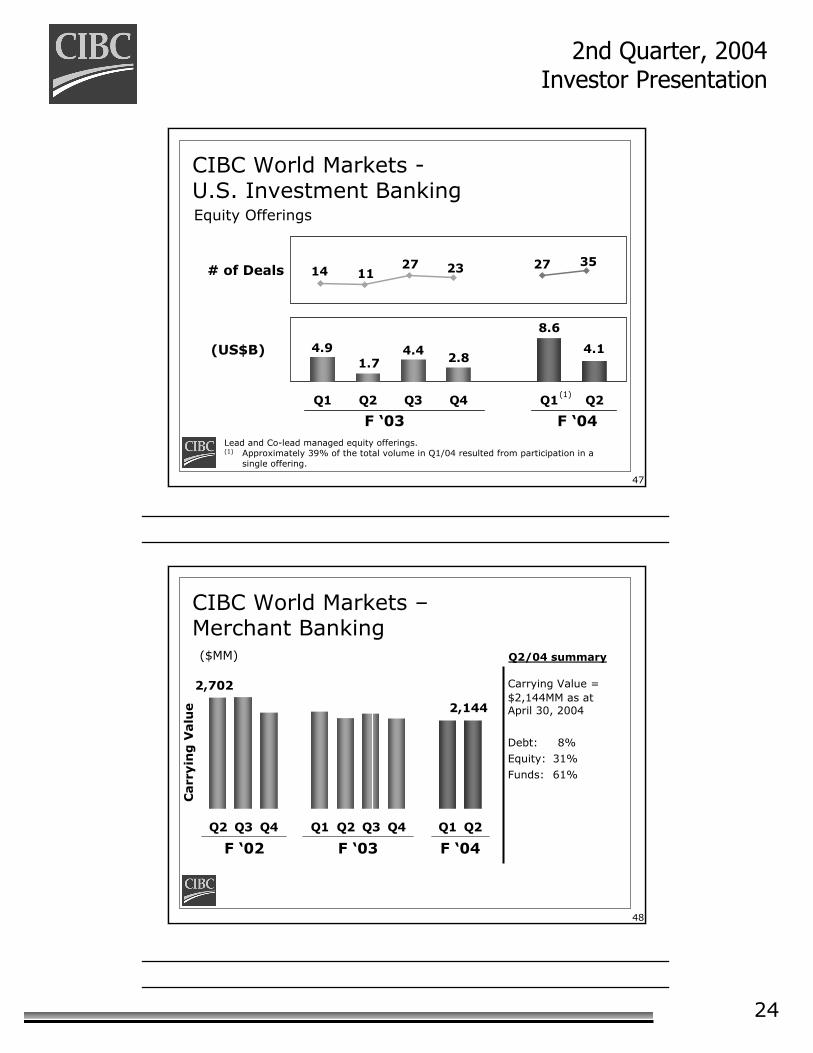
Lead and Co-lead managed equity offerings.(1) Approximately 39% of the total volume in Q1/04 resulted from participation in a
single offering.
# of Deals
(US$B)
CIBC World Markets -U.S. Investment BankingEquity Offerings
4.91.7
4.42.8
8.6
4.1
Q1 Q2 Q3 Q4 Q1 Q2
14 1127 23 27 35
F ‘03 F ‘04
(1)
48
CIBC World Markets –Merchant Banking
2,144
2,702
Q2 Q3 Q4 Q1 Q2 Q3 Q4 Q1 Q2
Carr
yin
g V
alu
e
($MM)
F ‘02 F ‘04
Q2/04 summary
Carrying Value =$2,144MM as atApril 30, 2004
Debt: 8%
Equity: 31%
Funds: 61%
F ‘03

25
2nd Quarter, 2004 Investor Presentation
49
CIBC World Markets -Merchant Banking
Total PortfolioIndustry Diversification
(Carrying Value = $2,144MM as at April 30, 2004)
Consumer Services 16.3% Entertainment 3.3 Financial Services 7.3 Hardware & Software 8.8 Healthcare 4.6 Industrial Growth & Services 18.8 Media & Publishing 8.1 Real Estate 3.6 Resource-based industries 2.4 Retail 6.2 Telecommunications and Cable 10.1 Utilities 4.2 Other 6.3
100.0%
50
Source: TSX (Canada); AUTEX (US). US volume represents listed exchange information.
CIBC World Markets – Market ShareEquity Trading
F ‘03 F ‘04
8.0%10.5%
8.2%
11.7%9.4%
10.8%Canada % of shares traded
US % of shares traded 1.2%1.3%0.7%1.2%1.2%1.2%
Q1 Q2 Q3 Q4 Q1 Q2

26
2nd Quarter, 2004 Investor Presentation
51
18.6%17.3%
18.7%18.7%16.6% 17.5%
0%
5%
10%
15%
20%
Q1 Q2 Q3 Q4 Q1 Q2
Ma
rke
t S
ha
re (
%)
F ‘03(2)
CIBC World Markets – Market ShareCanadian Equity New Issues(1)
Note: Source - CIBC Equity Syndication.(1) Based on total amount underwritten. Includes equity deals greater than $30MM.(2) F `03 market share = 17.8%. F `04 year-to-date market share = 18.0%.
F ‘04(2)
52
CIBC - Competitive Balance Sheet Measures
(1) General Allowance as a percent of Risk-Weighted Assets.(2) Net Impaired Loans = Gross Impaired Loans less Specific Allowance.(3) Bank Peer Group consists of Q1/04 actual information for RBC, BMO, TD and BNS.
($MM) Tier 1 Ratio
Unrealized Gains
General Allowance
GA as % of RWA(1)
Net Impaired Loans(2)
CIBC 11.0% 648 1,100 0.94% 340
Bank Peer Group(3) 10.2% 582 1,234 0.88% 1,104
27
2nd Quarter, 2004 Investor Presentation
53
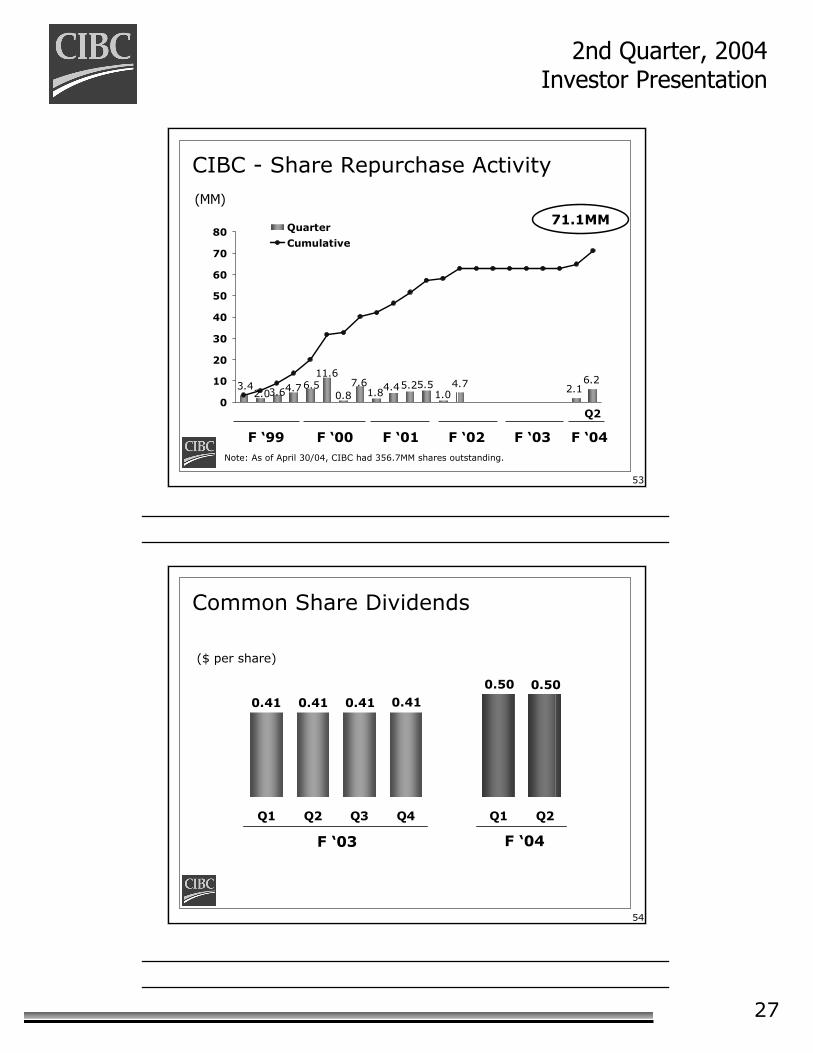
4.7 6.22.13.4 7.6
0.8
11.66.54.73.62.0 1.84.45.25.5
1.00
10
20
30
40
50
60
70
80 Quarter
Cumulative
Note: As of April 30/04, CIBC had 356.7MM shares outstanding.
CIBC - Share Repurchase Activity(MM)
F ‘99 F ‘00 F ‘01 F ‘02 F ‘03 F ‘04
71.1MM
Q2
54
0.500.500.410.410.410.41
Q1 Q2 Q3 Q4 Q1 Q2
Common Share Dividends
($ per share)
F ‘03 F ‘04
28
2nd Quarter, 2004 Investor Presentation
55
324395
278
544
63
167
Q1 Q2 Q3 Q4 Q1 Q2
($MM)
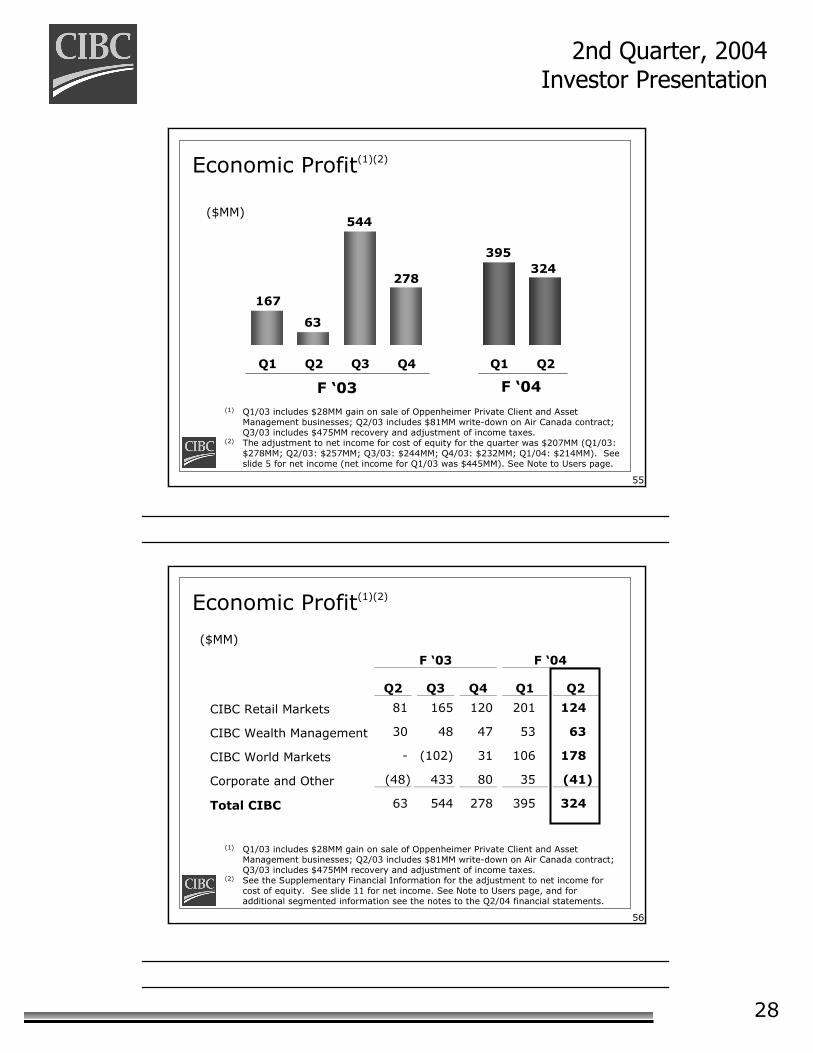
Economic Profit(1)(2)
F ‘03 F ‘04(1) Q1/03 includes $28MM gain on sale of Oppenheimer Private Client and Asset
Management businesses; Q2/03 includes $81MM write-down on Air Canada contract; Q3/03 includes $475MM recovery and adjustment of income taxes.
(2) The adjustment to net income for cost of equity for the quarter was $207MM (Q1/03: $278MM; Q2/03: $257MM; Q3/03: $244MM; Q4/03: $232MM; Q1/04: $214MM). See slide 5 for net income (net income for Q1/03 was $445MM). See Note to Users page.
56
Economic Profit(1)(2)
F ‘03 F ‘04
Q2 Q3 Q4 Q1 Q2
CIBC Retail Markets 81 165 120 201 124
CIBC Wealth Management 30 48 47 53 63
CIBC World Markets - (102) 31 106 178
Corporate and Other (48) 433 80 35 (41)
Total CIBC 63 544 278 395 324
($MM)
(1) Q1/03 includes $28MM gain on sale of Oppenheimer Private Client and Asset Management businesses; Q2/03 includes $81MM write-down on Air Canada contract; Q3/03 includes $475MM recovery and adjustment of income taxes.
(2) See the Supplementary Financial Information for the adjustment to net income for cost of equity. See slide 11 for net income. See Note to Users page, and for additional segmented information see the notes to the Q2/04 financial statements.
29
2nd Quarter, 2004 Investor Presentation
57
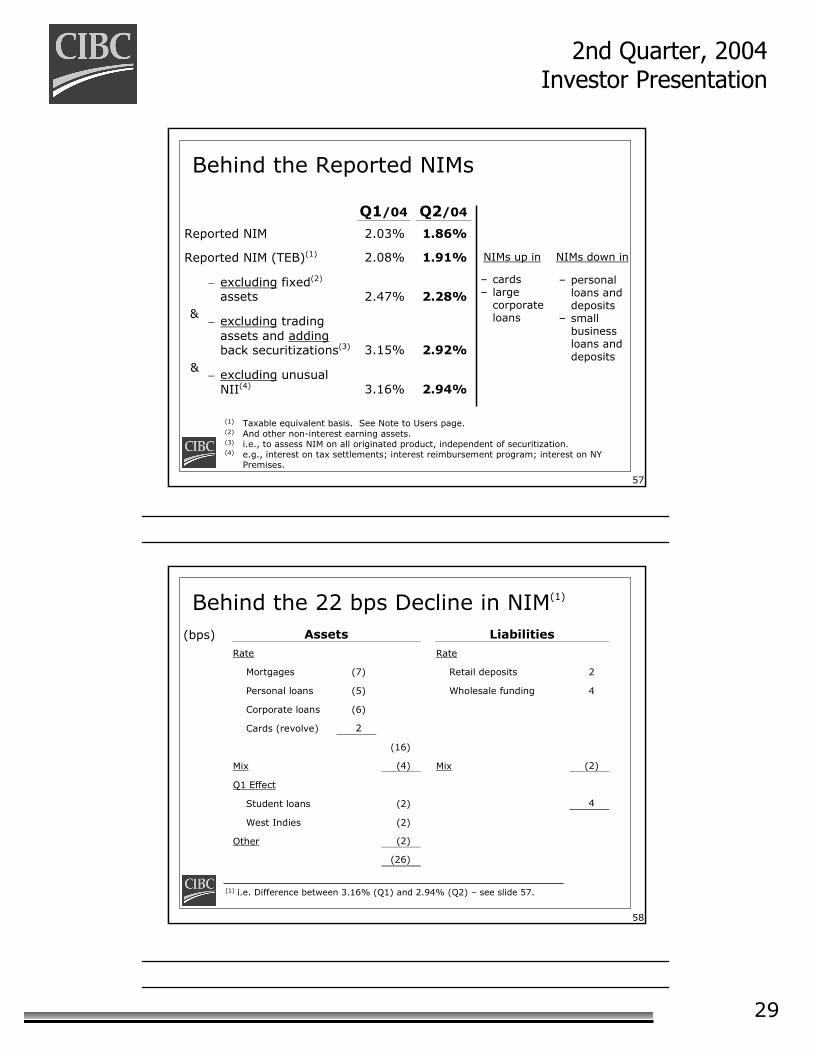
Behind the Reported NIMs
(1) Taxable equivalent basis. See Note to Users page.(2) And other non-interest earning assets.(3) i.e., to assess NIM on all originated product, independent of securitization.(4) e.g., interest on tax settlements; interest reimbursement program; interest on NY
Premises.
Q1/04 Q2/04
Reported NIM 2.03% 1.86%
Reported NIM (TEB)(1) 2.08% 1.91% NIMs up in NIMs down in
− excluding fixed(2) assets 2.47% 2.28%
− excluding trading assets and adding back securitizations(3) 3.15% 2.92%
− excluding unusual NII(4) 3.16% 2.94%
&
&
– cards– large
corporate loans
– personal loans and deposits
– small business loans and deposits
58
Behind the 22 bps Decline in NIM(1)
(1) i.e. Difference between 3.16% (Q1) and 2.94% (Q2) – see slide 57.
(bps) Assets Liabilities Rate Rate
Mortgages (7) Retail deposits 2
Personal loans (5) Wholesale funding 4
Corporate loans (6)
Cards (revolve) 2
(16)
Mix (4) Mix (2)
Q1 Effect
Student loans (2) 4
West Indies (2)
Other (2)
(26)
30
2nd Quarter, 2004 Investor Presentation
59
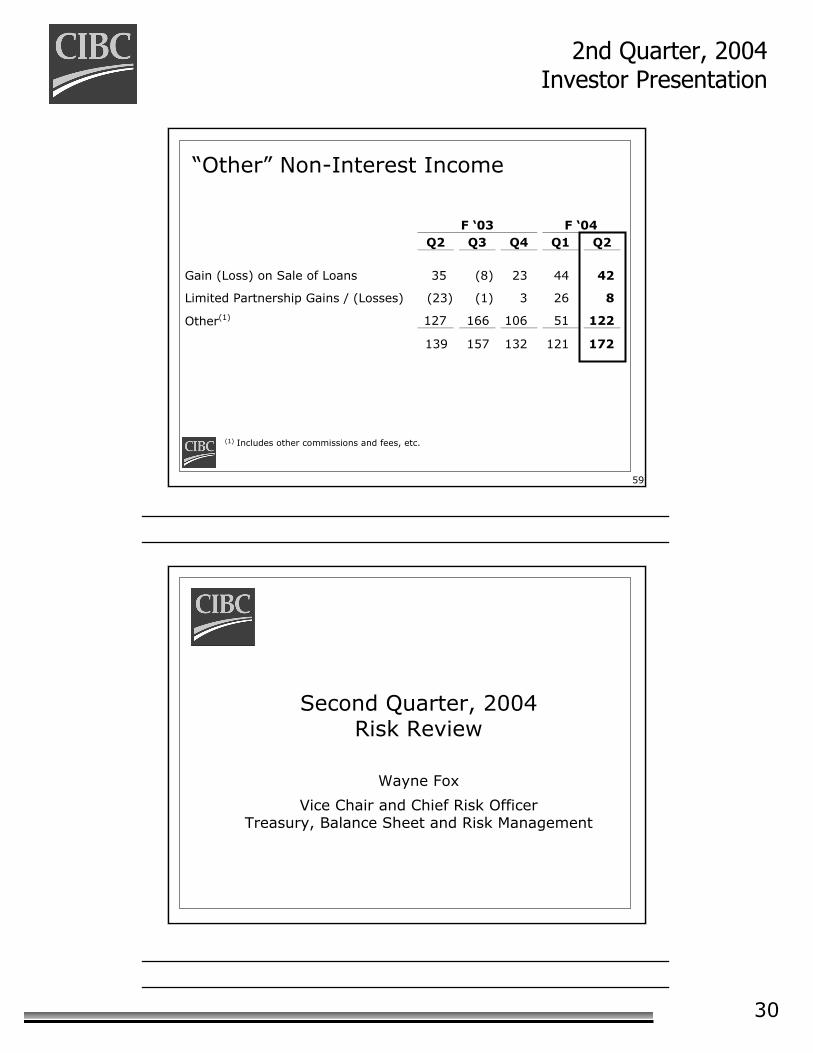
“Other” Non-Interest Income
(1) Includes other commissions and fees, etc.
F ‘03 F ‘04 Q2 Q3 Q4 Q1 Q2
Gain (Loss) on Sale of Loans 35 (8) 23 44 42
Limited Partnership Gains / (Losses) (23) (1) 3 26 8
Other(1) 127 166 106 51 122
139 157 132 121 172
Second Quarter, 2004Risk Review
Wayne Fox
Vice Chair and Chief Risk OfficerTreasury, Balance Sheet and Risk Management

31
2nd Quarter, 2004 Investor Presentation
61
Key Messages
Credit quality continues to improve• Business & Government loans reduced 16% year-over-year• Gross Impaired Loans reduced 41% year-over-year
Specific provision down year-over-year• Business & Government provision of $33MM result of improvement in
credit quality• Consumer provision of $174MM
Continued capital strength• Tier 1 Ratio: 11.0%
Guidance Unchanged• Specific Provisions: $800 - 850MM • General Allowance: 90 – 95 bps of RWAs
62
73 87184
274204
113164
32
77
156
91
101
135
135126
156
33
157174
-50
0
50
100
150
200
250
300
350
400
19
99
20
00
20
01
20
02
Q1
/0
3
Q2
/0
3
Q3
/0
3
Q4
/0
3
Q1
/0
4
Q2
/0
4
Business & Government Consumer
Specific Provision for Credit Losses($MM)
* Full Year /4.** Excludes loan loss on transfer to Held for Sale: $135MM in Q3/03 and
$93MM in Q4/03.
**** **
** (2)
32
2nd Quarter, 2004 Investor Presentation
63
-0.50%
0.00%
0.50%
1.00%
1.50%
2.00%
19
99
20
00
20
01
20
02
Q1
/0
3
Q2
/0
3
Q3
/0
3
Q4
/0
3
Q1
/0
4
Q2
/0
4
An
nu
ali
zed %
of
Ne
t Lo
an
s a
nd A
cce
pta
nce
s
Total Bank
Consumer
Business & Government (incl. Reverse Repos)
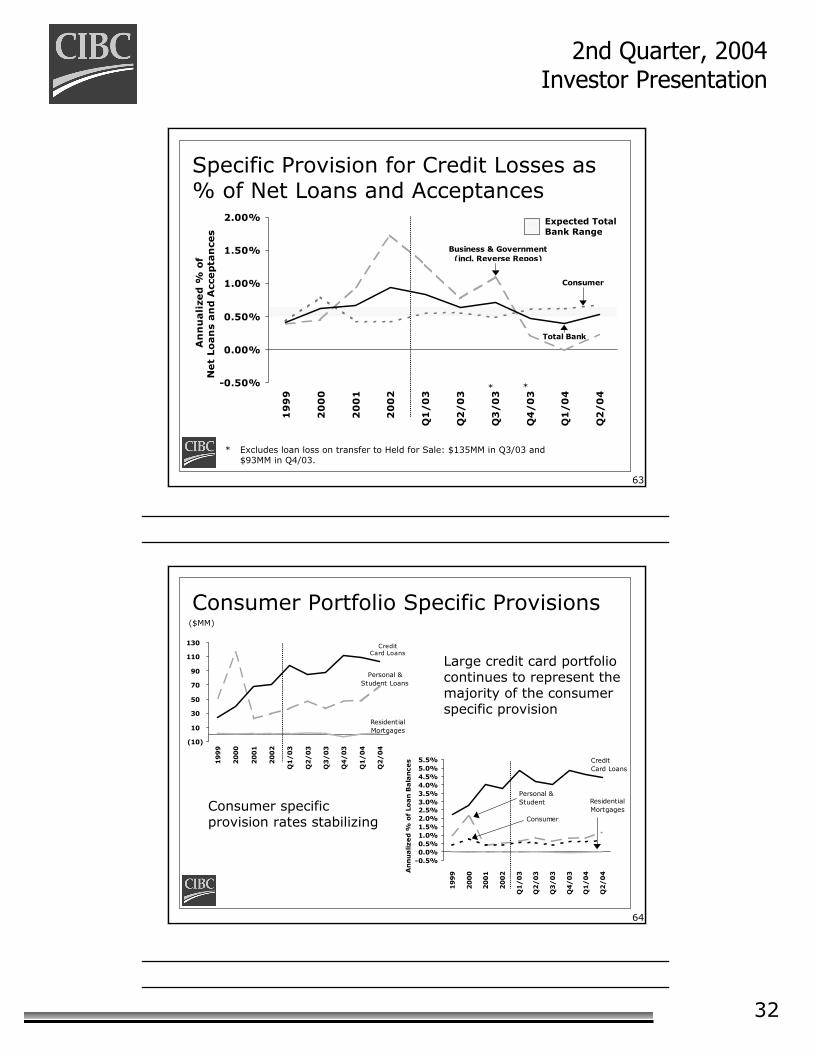
Specific Provision for Credit Losses as % of Net Loans and Acceptances
* Excludes loan loss on transfer to Held for Sale: $135MM in Q3/03 and $93MM in Q4/03.
Expected Total Bank Range
* *
64
-0.5%0.0%0.5%1.0%1.5%2.0%2.5%3.0%3.5%4.0%4.5%5.0%5.5%
19
99
20
00
20
01
20
02
Q1
/0
3
Q2
/0
3
Q3
/0
3
Q4
/0
3
Q1
/0
4
Q2
/0
4An
nu
alize
d %
of
Lo
an
Ba
lan
ce
s Credit Card Loans
Personal &Student Residential
MortgagesConsumer
Consumer Portfolio Specific Provisions
(10)
10
30
50
70
90
110
130
19
99
20
00
20
01
20
02
Q1
/0
3
Q2
/0
3
Q3
/0
3
Q4
/0
3
Q1
/0
4
Q2
/0
4
Credit Card Loans
Personal & Student Loans
Residential Mortgages
Large credit card portfolio continues to represent the majority of the consumer specific provision
Consumer specific provision rates stabilizing
($MM)

33
2nd Quarter, 2004 Investor Presentation
65
Fiscal 2004 Guidance Unchanged
• Specific Provisions: $800 - 850MM
• General Allowance: 90 - 95 bps of RWAs
66
+ 14.4%Business & Gov't Loans
26%
Credit Cards7%
Personal Loans16%
Residential Mortgages
49%
Student Loans2%
Loan Portfolio MixShift to Consumer Credit Continues (Net Loans and Acceptances - $140.2B*)
(* After General Allowance and excluding Reverse Repos)
as at April 30, 2004
+ 12.4%
$2.3
$2.8
Q2/03 Q2/04
- 19.1%
+ 2.0%
Q2/03 Q2/04
$68.5 $69.9
$8.2
$9.4
Q2/03 Q2/04
Q2/03 Q2/04
$19.9
$22.3
Q2/03 Q2/04
$43.1$36.2
- 16.0%

34
2nd Quarter, 2004 Investor Presentation
67
Business/Consumer Loan Portfolio Mix
44%42%
39%33% 31%
27% 26% 26%
56%59%
62%67% 69%
73% 74% 74%
29%30%
70% 71%
0%
10%
20%
30%
40%
50%
60%
70%
80%
19
99
20
00
20
01
20
02
Q1
/0
3
Q2
/0
3
Q3
/0
3
Q4
/0
3
Q1
/0
4
Q2
/0
4
% o
f Loan
Port
folio
Business & Government Consumer
68
20
25
30
35
40
45
50
55
60
19
99
20
00
20
01
20
02
Q1
/0
3
Q2
/0
3
Q3
/0
3
Q4
/0
3
Q1
/0
4
Q2
/0
4$B
- N
et
Loan
s a
nd
Accep
tan
ces
(excl.
Revers
e R
ep
os)
Business & Government Loans and BAs
(Before General Allowance)
Unprotected Credit Protected
- 16.0% Decline Y/Y

35
2nd Quarter, 2004 Investor Presentation
69
Held for Sale Portfolio Update
($MM) Q3/03
Transfer Q4/03
Transfer Total
Transfer Total On and Off Balance Sheet Credits 1,440 1,432 2,872 Off Balance Sheet Credits 551 241 792 On Balance Sheet Credits (Net of Unamortized Fees) 885 1,174 2,059 Credit Loss on Transfer (135) (93) (228) Non-Credit Loss on Transfer (16) (7) (23)
Held-for-Sale Portfolio $734 $1,074 $1,808 Remaining Outstandings Q2/04 19%
70
Credit Protection Industry Diversification($MM)
as at April 30, 2004 On Balance
Sheet Total
Bought
Oil & Gas $539 $1,504 Business Services 344 449 Manufacturing (Capital Goods) 293 665 Telecommunications and Cable 212 606 Forest Products 130 315 Retail 129 346 Publishing, Printing and Broadcasting 126 179 Manufacturing (Consumer Goods) 56 149 Utilities 44 281 Education, Health and Social Services 42 78 Financial Institutions 39 1,114 Other Industries 142 609
Total (Net) $2,096 $6,295
As at Jan 31/04 $1,849 $4,123
36
2nd Quarter, 2004 Investor Presentation
71
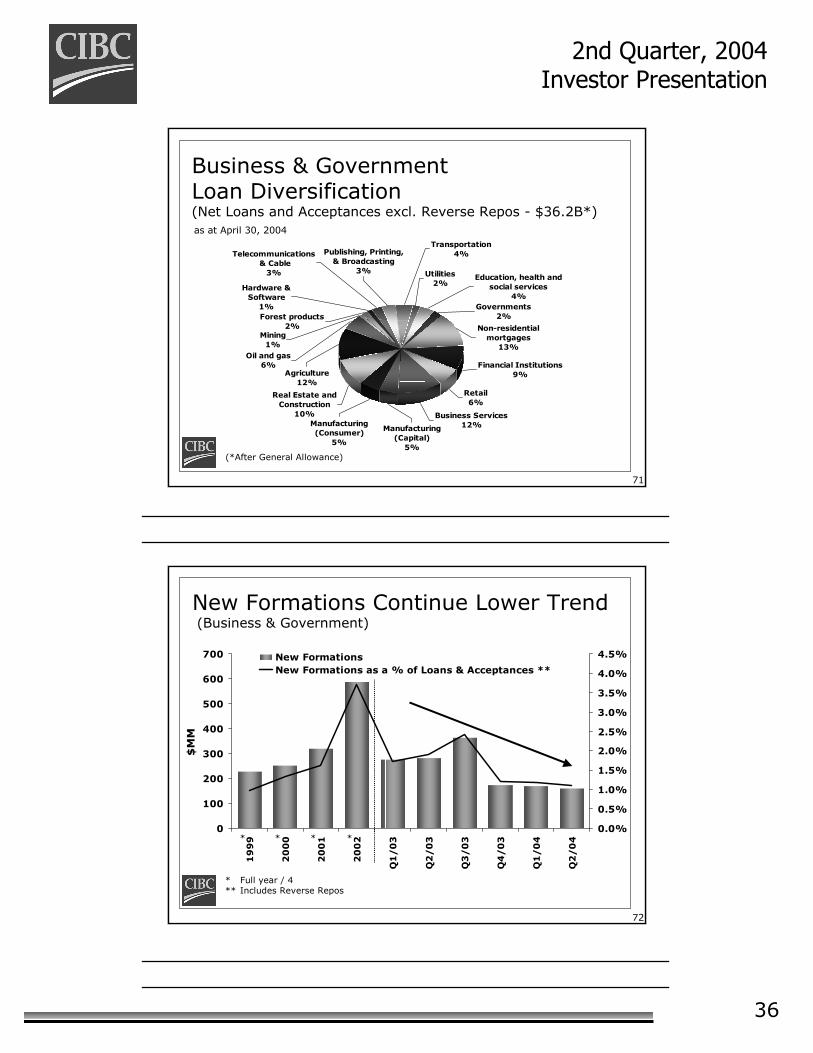
Business & GovernmentLoan Diversification(Net Loans and Acceptances excl. Reverse Repos - $36.2B*)
(*After General Allowance)
as at April 30, 2004
Real Estate and Construction
10%
Agriculture12%
Oil and gas6%
Utilities2%
Manufacturing (Capital)
5%
Governments2%
Mining1%
Forest products2%
Hardware &Software
1%
Telecommunications & Cable
3%
Transportation4%Publishing, Printing,
& Broadcasting3%
Education, health and social services
4%
Manufacturing (Consumer)
5%
Business Services12%
Retail6%
Non-residential mortgages
13%
Financial Institutions9%
72
New Formations Continue Lower Trend(Business & Government)
0
100
200
300
400
500
600
700
19
99
20
00
20
01
20
02
Q1
/0
3
Q2
/0
3
Q3
/0
3
Q4
/0
3
Q1
/0
4
Q2
/0
4
$M
M
0.0%
0.5%
1.0%
1.5%
2.0%
2.5%
3.0%
3.5%
4.0%
4.5%New FormationsNew Formations as a % of Loans & Acceptances **
* * * *
* Full year / 4** Includes Reverse Repos
37
2nd Quarter, 2004 Investor Presentation
73
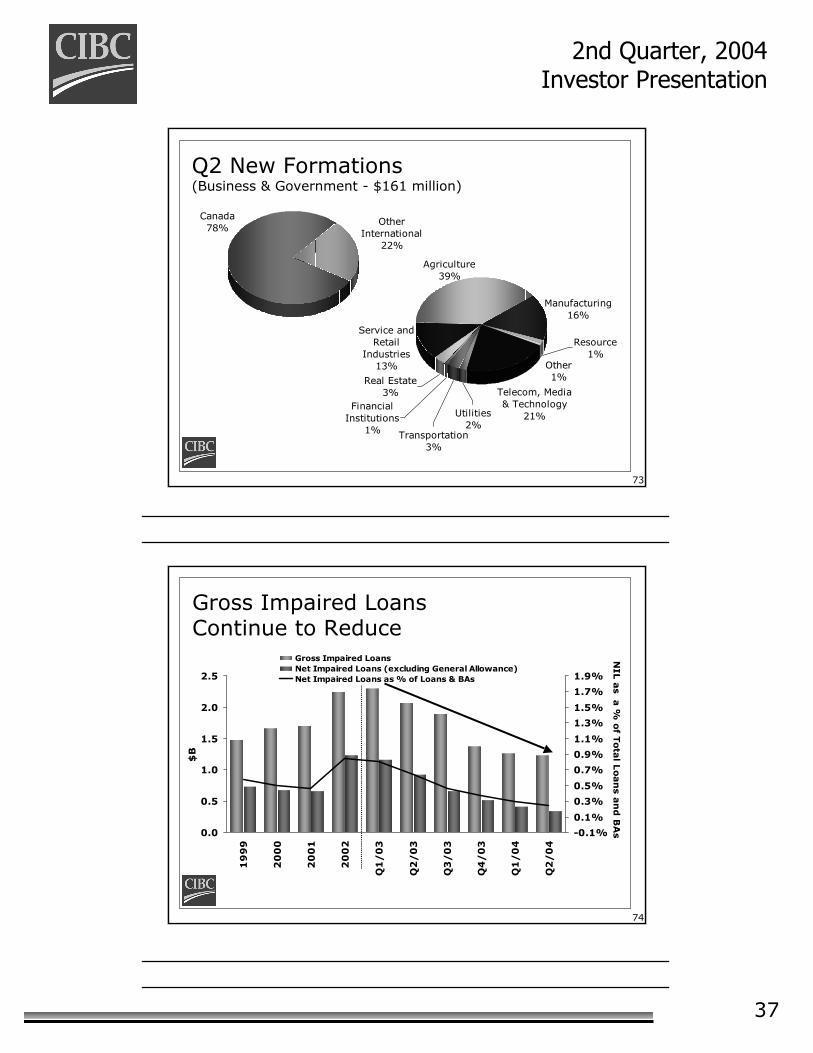
Q2 New Formations(Business & Government - $161 million)
Canada78%
Other International
22%
Agriculture39%
Utilities2%
Transportation3%
Financial Institutions
1%
Real Estate3%
Service and Retail
Industries13% Other
1%
Resource1%
Telecom, Media & Technology
21%
Manufacturing16%
74
Gross Impaired Loans Continue to Reduce
0.0
0.5
1.0
1.5
2.0
2.5
19
99
20
00
20
01
20
02
Q1
/0
3
Q2
/0
3
Q3
/0
3
Q4
/0
3
Q1
/0
4
Q2
/0
4
$B
-0.1%
0.1%
0.3%
0.5%
0.7%
0.9%
1.1%
1.3%
1.5%
1.7%
1.9%
NIL
as a
% o
f Tota
l Loan
s a
nd
BA
s
Gross Impaired LoansNet Impaired Loans (excluding General Allowance)Net Impaired Loans as % of Loans & BAs
38
2nd Quarter, 2004 Investor Presentation
75
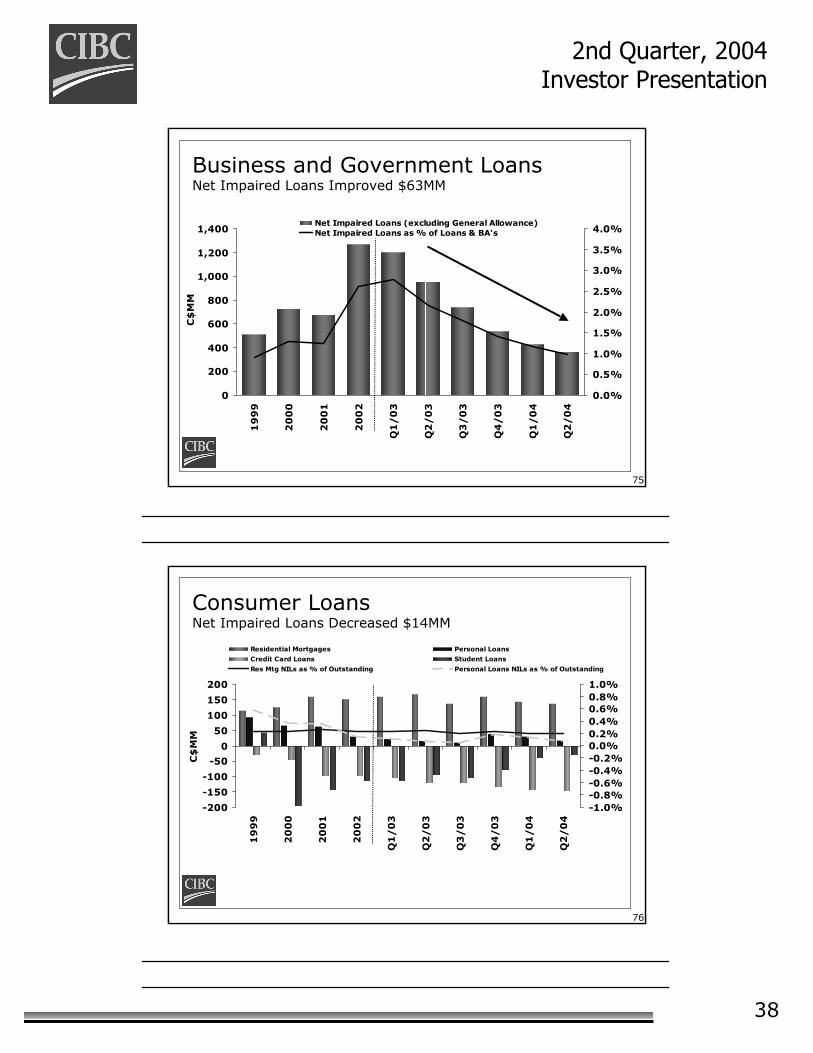
Business and Government LoansNet Impaired Loans Improved $63MM
0
200
400
600
800
1,000
1,200
1,400
19
99
20
00
20
01
20
02
Q1
/0
3
Q2
/0
3
Q3
/0
3
Q4
/0
3
Q1
/0
4
Q2
/0
4
C$
MM
0.0%
0.5%
1.0%
1.5%
2.0%
2.5%
3.0%
3.5%
4.0%Net Impaired Loans (excluding General Allowance)Net Impaired Loans as % of Loans & BA's
76
Consumer LoansNet Impaired Loans Decreased $14MM
-200
-150
-100
-50
0
50
100
150
200
19
99
20
00
20
01
20
02
Q1
/0
3
Q2
/0
3
Q3
/0
3
Q4
/0
3
Q1
/0
4
Q2
/0
4
C$
MM
-1.0%-0.8%-0.6%-0.4%-0.2%0.0%0.2%0.4%0.6%0.8%1.0%
Residential Mortgages Personal Loans
Credit Card Loans Student Loans
Res Mtg NILs as % of Outstanding Personal Loans NILs as % of Outstanding
39
2nd Quarter, 2004 Investor Presentation
77
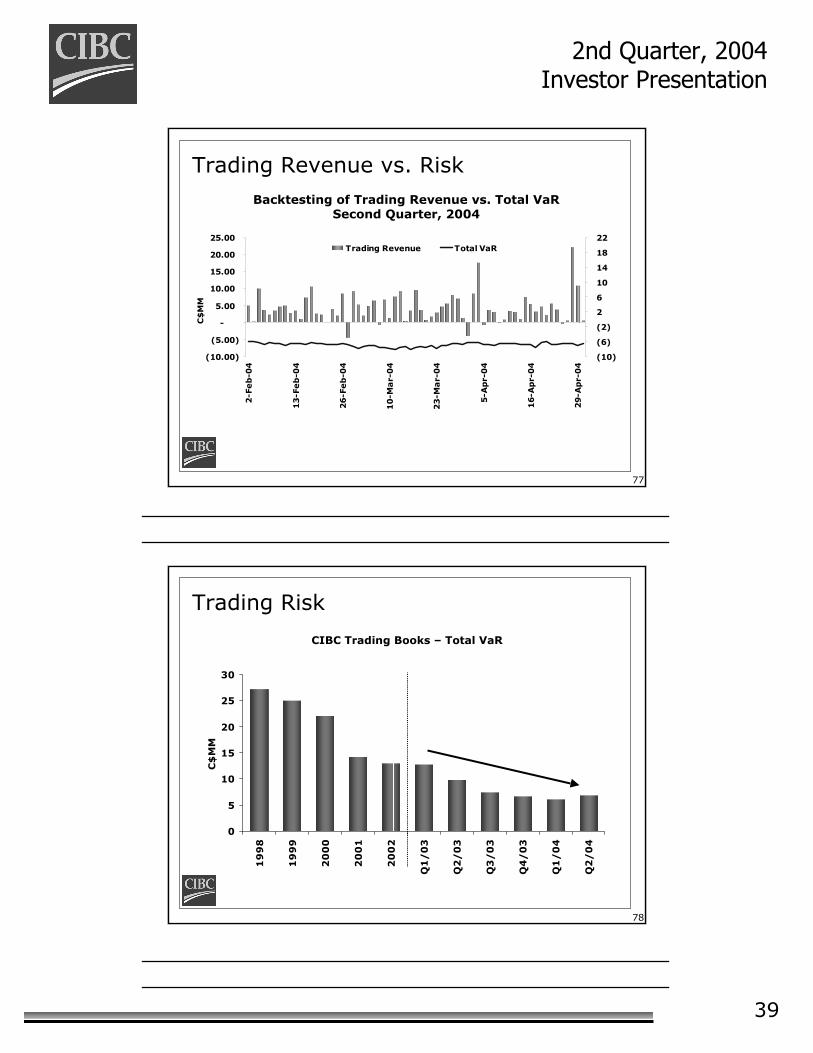
Trading Revenue vs. Risk
(10.00)
(5.00)
-
5.00
10.00
15.00
20.00
25.002
-Feb
-04
5-F
eb
-04
10
-Feb
-04
13
-Feb
-04
18
-Feb
-04
23
-Feb
-04
26
-Feb
-04
2-M
ar-
04
5-M
ar-
04
10
-Ma
r-0
4
15
-Ma
r-0
4
18
-Ma
r-0
4
23
-Ma
r-0
4
26
-Ma
r-0
4
31
-Ma
r-0
4
5-A
pr-
04
8-A
pr-
04
13-A
pr-
04
16-A
pr-
04
21-A
pr-
04
26-A
pr-
04
29-A
pr-
04
C$
MM
(10)
(6)
(2)
2
6
10
14
18
22Trading Revenue Total VaR
Backtesting of Trading Revenue vs. Total VaRSecond Quarter, 2004
78
0
5
10
15
20
25
30
19
98
19
99
20
00
20
01
20
02
Q1
/0
3
Q2
/0
3
Q3
/0
3
Q4
/0
3
Q1
/0
4
Q2
/0
4
C$
MM
Trading Risk
CIBC Trading Books – Total VaR
40
2nd Quarter, 2004 Investor Presentation
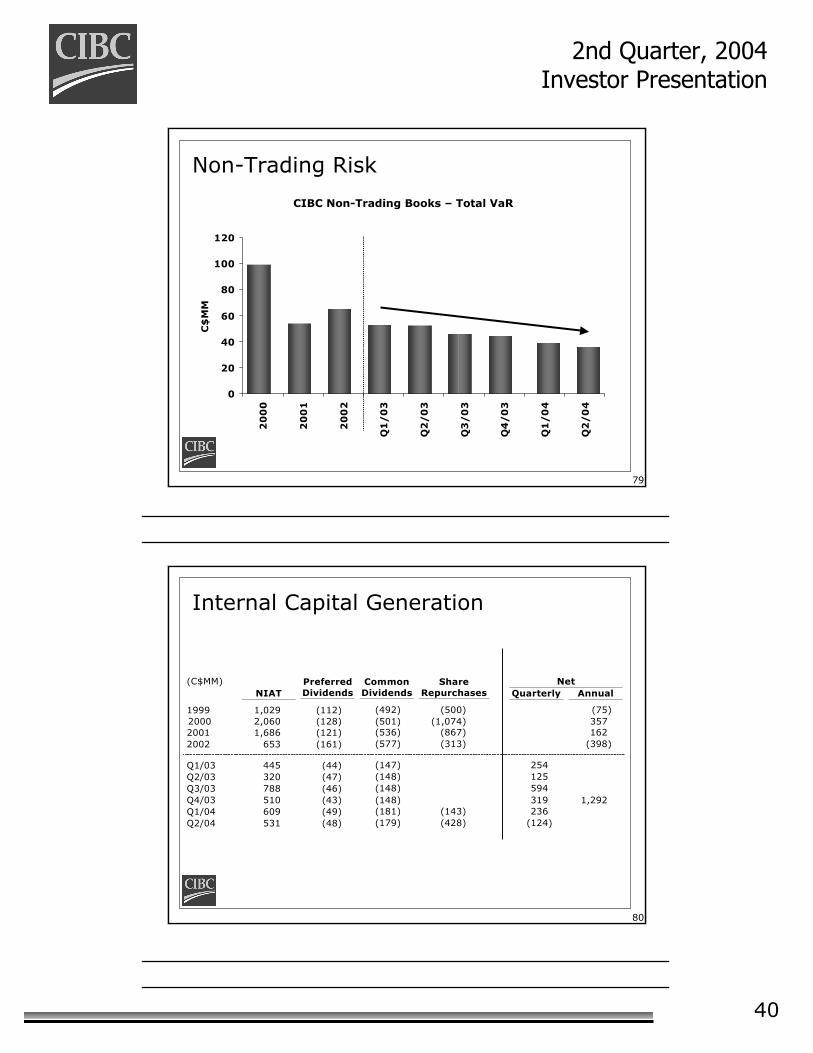
79
Non-Trading Risk
CIBC Non-Trading Books – Total VaR
0
20
40
60
80
100
120
20
00
20
01
20
02
Q1
/0
3
Q2
/0
3
Q3
/0
3
Q4
/0
3
Q1
/0
4
Q2
/0
4
C$
MM
80
Internal Capital Generation
Net (C$MM) NIAT
Preferred Dividends
Common Dividends
Share Repurchases
Quarterly Annual
1999 1,029 (112) (492) (500) (75) 2000 2,060 (128) (501) (1,074) 357 2001 1,686 (121) (536) (867) 162 2002 653 (161) (577) (313) (398)
Q1/03 445 (44) (147) 254 Q2/03 320 (47) (148) 125 Q3/03 788 (46) (148) 594 Q4/03 510 (43) (148) 319 1,292 Q1/04 609 (49) (181) (143) 236 Q2/04 531 (48) (179) (428) (124)
41
2nd Quarter, 2004 Investor Presentation
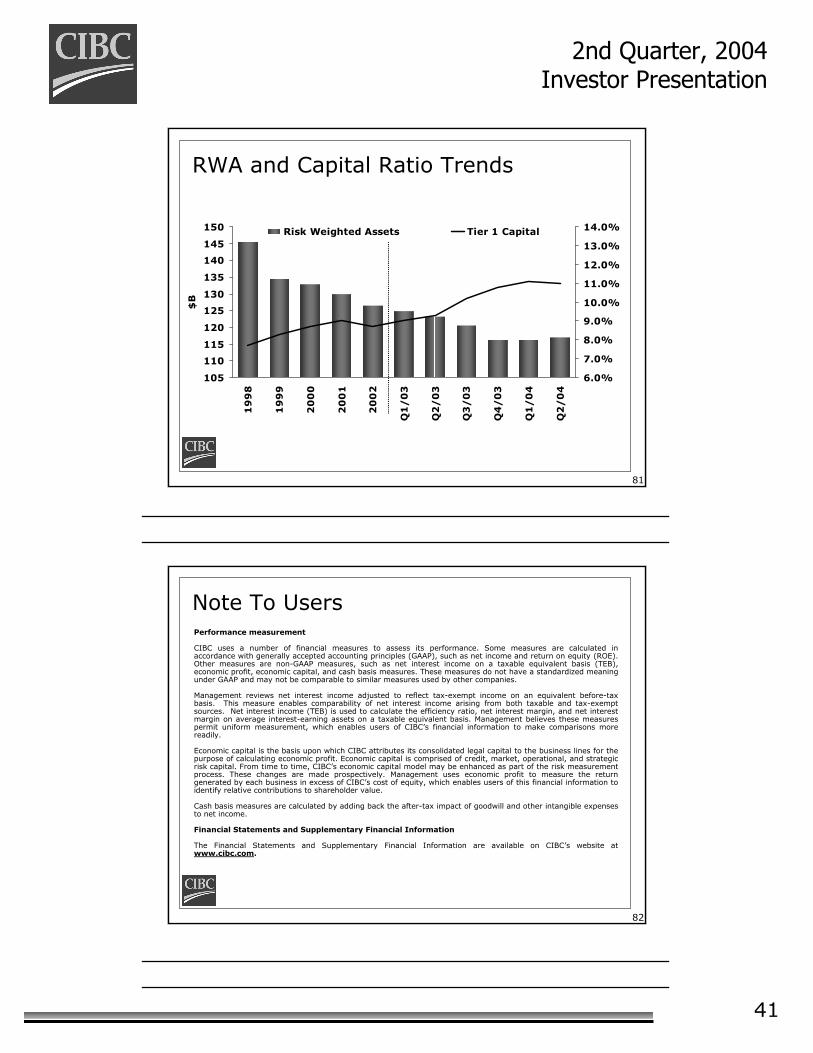
81
RWA and Capital Ratio Trends
105
110
115
120
125
130
135
140
145
150
19
98
19
99
20
00
20
01
20
02
Q1
/0
3
Q2
/0
3
Q3
/0
3
Q4
/0
3
Q1
/0
4
Q2
/0
4
$B
6.0%
7.0%
8.0%
9.0%
10.0%
11.0%
12.0%
13.0%
14.0%Risk Weighted Assets Tier 1 Capital
82
Note To UsersPerformance measurement
CIBC uses a number of financial measures to assess its performance. Some measures are calculated in accordance with generally accepted accounting principles (GAAP), such as net income and return on equity (ROE). Other measures are non-GAAP measures, such as net interest income on a taxable equivalent basis (TEB), economic profit, economic capital, and cash basis measures. These measures do not have a standardized meaning under GAAP and may not be comparable to similar measures used by other companies.
Management reviews net interest income adjusted to reflect tax-exempt income on an equivalent before-tax basis. This measure enables comparability of net interest income arising from both taxable and tax-exempt sources. Net interest income (TEB) is used to calculate the efficiency ratio, net interest margin, and net interest margin on average interest-earning assets on a taxable equivalent basis. Management believes these measures permit uniform measurement, which enables users of CIBC’s financial information to make comparisons more readily.
Economic capital is the basis upon which CIBC attributes its consolidated legal capital to the business lines for the purpose of calculating economic profit. Economic capital is comprised of credit, market, operational, and strategic risk capital. From time to time, CIBC’s economic capital model may be enhanced as part of the risk measurement process. These changes are made prospectively. Management uses economic profit to measure the return generated by each business in excess of CIBC’s cost of equity, which enables users of this financial information to identify relative contributions to shareholder value.
Cash basis measures are calculated by adding back the after-tax impact of goodwill and other intangible expenses to net income.
Financial Statements and Supplementary Financial Information
The Financial Statements and Supplementary Financial Information are available on CIBC’s website at www.cibc.com.

42
2nd Quarter, 2004 Investor Presentation
83
Forward Looking StatementsThis presentation contains forward-looking statements which are made pursuant to the ‘safe harbor’ provisions of the United States Private Securities Litigation Reform Act of 1995. These forward-looking statements include, but are not limited to, statements about the operations, business lines, financial condition, risk management, priorities, targets, ongoing objectives, strategies and outlook of CIBC for 2004 and subsequent periods. Forward-looking statements are typically identified by the words "believe", "expect", "anticipate", "intend", "estimate" and other similar expressions or future or conditional verbs such as "will", "should", "would" and "could". A forward-looking statement is subject to inherent risks and uncertainties that may be general or specific. A variety of factors, many of which are beyond CIBC's control, affect the operations, performance and results of CIBC and its business lines, and could cause actual results to differ materially from the expectations expressed in any of CIBC's forward-looking statements. These factors include: current, pending and proposed legislative or regulatory developments in the jurisdictions where CIBC operates including pending developments in Canadian laws regulating financial institutions and US regulatory changes affecting foreign companies listed on a US exchange; as well as amendments to, and interpretations of, risk-based capital guidelines and reporting instructions; the resolution of legal proceedings and related matters; the effect of applying future accounting changes; changes in tax laws; political conditions and developments; intensifying competition from established competitors and new entrants in the financial services industry; technological change; global capital market activity; interest rate fluctuation; currency value fluctuation; general economic conditions worldwide, as well as in Canada, the United States and other countries where CIBC has operations; changes in market rates and prices which may adversely affect the value of financial products; CIBC's success in developing and introducing new products and services, expanding existing distribution channels, developing new distribution channels and realizing increased revenue from these channels, including electronic commerce-based efforts. This list is not exhaustive of the factors that may affect any of CIBC's forward-looking statements. These and other factors should be considered carefully and you should not place undue reliance on CIBC's forward-looking statements. CIBC does not undertake to update any forward-looking statement in this presentation.
Investor Relations contacts:Kathy Humber, Senior Vice-President (416) 980-3341John Ferren, Director (416) 980-2088Katherine Young, Senior Financial Analyst (416) 980-8691Investor Relations Fax Number (416) 980-5028
Q & A