1 Upcoming developments in Alma Analytics Yoel Kortick Senior Librarian, Ex Libris.

Christian and Muslim Demographics: Facts and Maps PDF 2 June 2007 ©Yoel Natan
Author of the book Moon-o-theism I. Demographic Links and Resources on the Web II. Demographic Map-making Tips and Resources III. Christian and Muslim Demographic Tables and Maps
A. Percent of All Muslims/Christians Demographics Table By Continent/Region for 2006 B. Religion and Children per Woman (CPW) Demographic Table for the Globe as of 2006 C. Regions Promising Noticeable Muslim and Christian Natural Growth D. Children Per Woman (CPW) Demographic Table for the Globe as of 2006 (Ordered by
Weighted CPW/Population) E. Religion and Children per Woman (CPW) Demographic Table for the EU as of 2007 F. Children Per Woman (CPW) Per Country, and Weighted Average by Country/Region
(Data is Compiled From the CIA Factbook, July 2006 Estimates). G. Demographics Data Table, Listing By Country for 2006 H. Five World Demographic Maps
1. Maps Legend 2. Total Fertility Rate (CPW) Global Map
► Related Websites 3. Total Fertility Rate (CPW) Global Map by Region 4. Percent Christian Global Map
► Related Websites 5. Percent Muslim Global Map
► Related Websites 6. Number of Muslims Global Map Related Websites
Note: For related information, see Yoel Natan’s “Demographic Jihad by the Numbers: Getting a Handle on the True Scope,” May 2007, write-up.
I. Demographic Links and Resources on the Web
Wikipedia has entries on Islam by country and region on this same page, which information is based mainly on the CIA Factbook, Adherents.com, and the US State Department’s International Religious Freedom Report. Other organizations make it their business to count Christians and non-Christians are:
► www.adherents.com/ publishes data on religious populations. ► Center for the Study of Global Christianity: Their two main reference works are: World
Christian Encyclopedia, 2nd edition and World Christian Trends. They incorporate their data at the World Christian Database. Here are some of their tables on the number of Christians and Muslims in various countries.
► The Association of Religious Data (ARDA) lists surveys, graphs and maps for the US, including religiosity, number of adherents and congregations
► Valparaiso U. maps out religious adherents in America, including Muslims. Wikipedia has a write-up on the demographics of world religions, a demographic data table tied to
a map of where Sunnis and Shias predominate globally, a map of dominant religions in Europe and part of the Mideast, and map of which religion dominates where in the world, and a map just how seriously religious folk take their religion around the globe.
Wikipedia has a map that shows global Muslim distribution where Muslims are the majority. Unlike other maps that shade or color on a country-by-country basis, it pinpoints the Muslim populations almost to the grid square.
Wikipedia has a data table with the percentage that are Christian in each country tied to a map, and a map where Catholics, Protestants and Orthodox dominate. Spiegel also has an article on the distribution of Catholics, Protestants, Anglicans, and a map on the percentage of Christians globally.
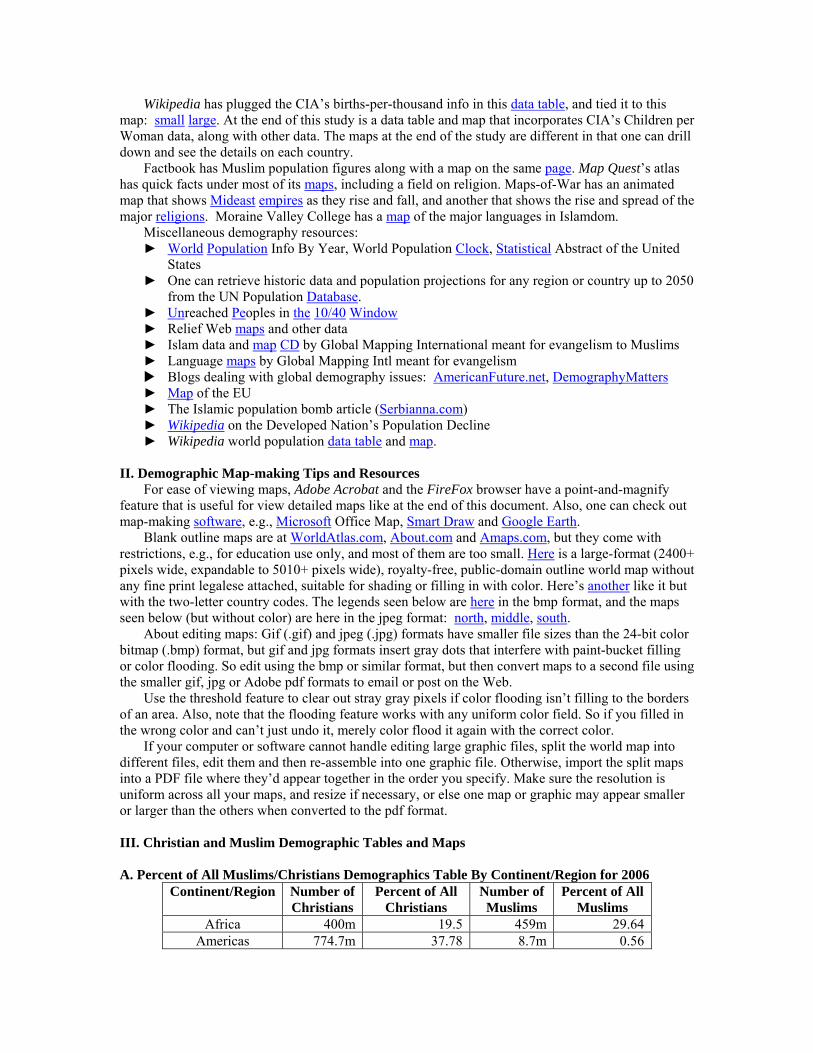
Wikipedia has plugged the CIA’s births-per-thousand info in this data table, and tied it to this map: small large. At the end of this study is a data table and map that incorporates CIA’s Children per Woman data, along with other data. The maps at the end of the study are different in that one can drill down and see the details on each country.
Factbook has Muslim population figures along with a map on the same page. Map Quest’s atlas has quick facts under most of its maps, including a field on religion. Maps-of-War has an animated map that shows Mideast empires as they rise and fall, and another that shows the rise and spread of the major religions. Moraine Valley College has a map of the major languages in Islamdom.
Miscellaneous demography resources: ► World Population Info By Year, World Population Clock, Statistical Abstract of the United
States ► One can retrieve historic data and population projections for any region or country up to 2050
from the UN Population Database. ► Unreached Peoples in the 10/40 Window ► Relief Web maps and other data ► Islam data and map CD by Global Mapping International meant for evangelism to Muslims ► Language maps by Global Mapping Intl meant for evangelism Blogs dealing with global demography issues: AmericanFuture.net, DemographyMatters
► Map of the EU ► The Islamic population bomb article (Serbianna.com) ► Wikipedia on the Developed Nation’s Population Decline ► Wikipedia world population data table and map.
II. Demographic Map-making Tips and Resources
For ease of viewing maps, Adobe Acrobat and the FireFox browser have a point-and-magnify feature that is useful for view detailed maps like at the end of this document. Also, one can check out map-making software, e.g., Microsoft Office Map, Smart Draw and Google Earth.
Blank outline maps are at WorldAtlas.com, About.com and Amaps.com, but they come with restrictions, e.g., for education use only, and most of them are too small. Here is a large-format (2400+ pixels wide, expandable to 5010+ pixels wide), royalty-free, public-domain outline world map without any fine print legalese attached, suitable for shading or filling in with color. Here’s another like it but with the two-letter country codes. The legends seen below are here in the bmp format, and the maps seen below (but without color) are here in the jpeg format: north, middle, south.
About editing maps: Gif (.gif) and jpeg (.jpg) formats have smaller file sizes than the 24-bit color bitmap (.bmp) format, but gif and jpg formats insert gray dots that interfere with paint-bucket filling or color flooding. So edit using the bmp or similar format, but then convert maps to a second file using the smaller gif, jpg or Adobe pdf formats to email or post on the Web.
Use the threshold feature to clear out stray gray pixels if color flooding isn’t filling to the borders of an area. Also, note that the flooding feature works with any uniform color field. So if you filled in the wrong color and can’t just undo it, merely color flood it again with the correct color.
If your computer or software cannot handle editing large graphic files, split the world map into different files, edit them and then re-assemble into one graphic file. Otherwise, import the split maps into a PDF file where they’d appear together in the order you specify. Make sure the resolution is uniform across all your maps, and resize if necessary, or else one map or graphic may appear smaller or larger than the others when converted to the pdf format. III. Christian and Muslim Demographic Tables and Maps A. Percent of All Muslims/Christians Demographics Table By Continent/Region for 2006
Continent/Region Number of Christians
Percent of All Christians
Number of Muslims
Percent of All Muslims
Africa 400m 19.5 459m 29.64 Americas 774.7m 37.78 8.7m 0.56

Asia 256.7m 12.5 1.03b 66.68 Europe 600m 29.2 48m 3.1 Oceania 19.8m 0.97 390k 0.03 World 2.05b 100% 1.55b 100%
Source: Compiled from table below
B. Religion and Children per Woman (CPW) Demographic Table for the Globe as of 2006 Continent/Region CPW
Weighted Avg*
Total Pop.
No. of Christians
No. of Muslims
Percent Christian
Percent Muslim
Percent Neither
Central Africa 6.32 83.1m 59.1m 12.6m 71.22 15.14 13.65East Africa 5.40 195m 115.3m 74m 59.14 37.99 2.87North Africa 3.04 203.5m 21m 182.7m 10.32 89.77 -0.09Southern Africa 4.09 137m 93.8m 9.5m 68.45 6.91 24.64West Africa 5.41 276.6m 97.7m 134.8m 36.20 49.93 13.87Africa Subtotals 4.76 888.7m 387.1m 413.6m 43.56 46.54 9.90Caribbean 3.64 23.9m 22.6m 16k 94.43 0.07 5.51Central America 3.21 42.2m 38.3m 125.7k 90.75 0.30 8.95North America 2.12 446m 366.8m 6.9m 82.23 1.55 16.22South America 2.17 371m 347m 1.7m 93.51 0.45 6.03Americas Subtotals 2.23 883.3m 774.7m 8.7m 87.71 0.99 11.30Caucasus** 1.93 15.6m 7.6m 7.9m 48.85 50.95 0.20Central Asia 2.78 92m 12.9m 45.5m 14.05 49.50 36.45East Asia 1.69 1.53b 91.9m 31m 6.01 2.04 91.94Middle East 2.93 259.9m 7.2m 253.2m 2.81 97.68 -0.48South Asia 3.01 1.49b 31.2m 499.2m 2.09 33.49 64.42Southeast Asia 2.39 571.8m 118.7m 241.4m 20.76 42.22 37.02Asia Subtotals 2.4 3.96b 269.7m 1.1m 6.81 27.25 65.93Balkans 1.49 65.1m 54.5m 8.6m 83.43 13.21 3.36Central Europe 1.27 74.5m 58.4m 549k 78.44 0.74 20.82Eastern Europe 1.27 212.8m 177.4m 23.5m 83.37 11.03 5.60Western Europe 1.53 378.8m 309.3m 15.3m 81.67 4.05 14.28Europe Subtotals 1.42 731.4m 599.7m 48m 81.99 6.56 11.45Oceania 2.21 30.5m 19.8m 390k 64.87 1.28 33.85World 2.59 6.5b 2.05b 1.55b*** 31.59% 23.87% 44.54%
Sources: Wikipedia
CIA Factbook *The CPW is weighted by the population of each country represented in that region. The CPW data is compiled from the CPW table found below, which was extracted from the Rank-Order CPW CIA Factbook 2006 page. The 2.59 CPW for the World is also found on the World page of the CIA Factbook 2006. **The Caucasus here is limited to Armenia, Azerbaijan and Georgia. *** Others estimate that there are only 1.2b Muslims. All data besides the CPW data are compiled from Wikipedia statistics with a few corrections. Notice that the population figures are not the same as that in the CPW table below that uses CIA Factbook data current as of Jul 2006.

C. Regions Promising Noticeable Muslim and Christian Natural Growth Often when Christianity or Islam’s growth is discussed, various hotspots are brought up as supposedly being indicative of a region’s growth. For instance, some have said that Yemen, with its 6.58 CPW birthrate would surpass the population of Russia in a few decades. It is also implied that most of Islamdom’s population is growing as the same rate as Yemen. One can suppose that Yemen’s growth rate is caused by oil wealth increasing the overall health of the populace, and traditional attitudes about family size are still the norm for now. The explanation for high population growth in other places is one can assume that people are too poor to obtain birth control. In the long-term, Yemen’s current population growth will be seen as unsustainable, since Yemen is a desert and maybe will run out of oil within a few decades. Not only is Yemen’s growth rate unsustainable in the long term, but since Yemen only has 21.5m people, so its higher CPW (6.58) barely impacts the region’s population growth. The 259.9m people in the Mideast have a Weighted CPW of 2.93, as can be seen on the global map that shows CPW by region. In the following two tables, I extracted data from the table in the previous section. The selection criteria were that the regions had: 1) a CPW that is significantly elevated over the replacement rate of 2.1, and had 2) more than 50m Christians or Muslims. This gives a more realistic picture of Christianity and Islam’s global growth potential. Religions grow or shrink based not only on the birthrate, but also through evangelism. Notice that judging from birthrate alone, Islam’s Natural Growth Potential (NGP) is twice that of Christianity in those regions that promise significant growth (961 vs. 1975). Thus, evangelism, especially in high population growth areas, is important if Christianity wants maintain or increase its share of the world’s population relative to Islam’s share.
Regions Promising Significant Christian Growth Region Weighted CPW Christian Total Population % Christian Central Africa 6.32 59.18m 83.1m 71.22 East Africa 5.40 115.32m 195.00m 59.14 Southern Africa 4.09 93.78m 137m 68.45 West Africa 5.41 100.13m 276.6m 36.20 Average CPW 5.31 Total Total Weighted % Weighted CPW 5.22 368.41m 691.70m 53.26% NGP: Weighted CPW (5.22) x Half of Total Christians (184.2m) = 961
Regions Promising Significant Muslim Growth
Region Weighted CPW Muslims Total Population % Muslim East Africa 5.4 74.08m 195m 37.99 Middle East 2.93 253.87m 259.9m 97.68 North Africa 3.04 182.68m 203.5m 89.77 West Africa 5.41 138.11m 276.6m 49.93 South Asia 3.01 499.2m 1.49b 27.25 Average CPW 3.96 Total Total Total Weighted CPW 3.44 1.148b 2.43b 47.24% NGP: Weighted CPW (3.44) x Half of Total Muslims (574m) = 1974.56
D. Children per Woman (CPW) Demographic Table for the Globe as of 2006 (Ordered by Weighted CPW/Population)
Ordered by Weighted CPW
CPW Weighted
Avg* Total Pop.
Ordered by Population
CPW Weighted
Avg* Total Pop.
Central Europe 1.27 74.5m
Caucasus 1.93 15.6m

Eastern Europe 1.27 212.8m Caribbean 3.64 23.9m Balkans 1.49 65.1m Oceania 2.21 30.5m Western Europe 1.53 378.8m Central America 3.21 42.2m East Asia 1.69 1.53b Balkans 1.49 65.1m Caucasus 1.93 15.6m Central Europe 1.27 74.5m North America 2.12 446m Central Africa 6.32 83.1m South America 2.17 371m Central Asia 2.78 92m Oceania 2.21 30.5m Southern Africa 4.09 137m Southeast Asia 2.39 571.8m East Africa 5.4 195m Central Asia 2.78 92m North Africa 3.04 203.5m Middle East 2.93 259.9m Eastern Europe 1.27 212.8m South Asia 3.01 1.49b Middle East 2.93 259.9m North Africa 3.04 203.5m West Africa 5.41 276.6m Central America 3.21 42.2m South America 2.17 371m Caribbean 3.64 23.9m Western Europe 1.53 378.8m Southern Africa 4.09 137m North America 2.12 446m East Africa 5.4 195m Southeast Asia 2.39 571.8m West Africa 5.41 276.6m South Asia 3.01 1.49b Central Africa 6.32 83.1m East Asia 1.69 1.53b
E. Religion and Children per Woman (CPW) Demographic Table for the EU as of 2007
27 EU Members as of
2007
Total Pop.
No. of Christians
No. of Muslims
Percent Christian
Percent Muslim
Percent Neither
CPW
Austria 8.2m 7m 385k 85.2 4.7 10.1 1.36 Belgium 10.4m 9.3m 400k 89.3 3.9 6.8 1.64 Bulgaria 7.5m 6.2m 967k 83.8 13.0 3.2 1.38 Cyprus 786k 181k 181k 23 23.2 53.8 2.83 Czech Republic 10.2m 2.9m 20k 28.9 0.2 70.9 1.21 Denmark 5.4m 4.6m 269k 84.8 5.0 10.2 1.74 Estonia 1.3m 397k 10k 30 0.8 69.2 1.4 Finland 5.2m 4.5m 10k 86.4 0.2 13.4 1.73 France 64m 55.3m 6.2m 87 9.8 3.2 1.84 Germany 82.4m 57.7m 3.2m 70 3.9 26.1 1.39 Greece 10.7m 10m 300k 97.2 2.8 0 1.34 Hungary 10m 7.4m 60k 74.4 0.6 25.0 1.32 Ireland 4m 3.7m 19.6k 93 0.5 6.5 1.86 Italy 58m 55.8m 825k 96 1.4 2.6 1.28 Latvia 23m 1.3m 458 58.8 0.0 41.2 1.27 Lithuania 3.6m 3m 3k 85 0.1 14.9 1.2 Luxembourg 468k 422k 9.4k 90 2.0 8.0 1.78 Malta 400k 392k 3k 98 0.7 1.3 1.5 Netherlands 16.4m 8.4m 984k 51 6.0 43.0 1.66 Poland 38.6m 35.3m 30k 91.4 0.1 8.5 1.25 Portugal 10.6m 10.2m 37k 97 0.3 2.7 1.47 Romania 22.3m 22.1m 45k 99 0.2 0.8 1.37 Slovakia 5.4m 4.6m 2.7k 83.8 0.0 16.2 1.33 Slovenia 2m 1.2m 50k 61 2.5 36.5 1.25 Spain 40.3m 38.7m 1m 95 2.5 2.5 1.28 Sweden 9m 7m 301k 78 3.3 18.7 1.66 UK 60.6m 43.3m 1.6m 71.6 2.7 25.7 1.66

Total 489.7m 401m 17m* 89.1% 3.5%* 14.6% 1.52**Source:
Wikipedia *This table is compiled from Wikipedia statistics with some corrections. The table shows that 3.5% of the EU is Muslim, but the CIA Factbook says the European Union (EU) is 3.12% Muslim, with only 14.3m Muslims. **The weighted average CPW, based on the population of each country in the EU, is 1.5, very close to the straight average of 1.52. The EU is slightly more prolific than Europe as a whole that has a 1.42 CPW (see the table above). F. Children Per Woman (CPW) Per Country, and Weight Average by Country/Region (Data is Compiled From the CIA Factbook, July 2006 Estimates).
Region Country Population CPW Weighted
CPW Africa, Central Burundi 8,090,068 6.55
“ Central African Republic 4,303,356 4.41 “ Chad 9,944,201 6.25 “ Congo, Republic of the 3,702,314 6.07 “ Congo, Democratic Republic of the 62,660,551 6.45
Subtotals Africa, Central (Region) 88,700,490 5.95 6.32Africa, East Comoros (islands to the N of Madagascar) 690,948 5.03
“ Djibouti 486,530 5.31 “ Eritrea 4,786,994 5.08 “ Ethiopia 74,777,981 5.22 “ Kenya 34,707,817 4.91 “ Rwanda 8,648,248 5.43 “ Seychelles 81,541 1.74 “ Somalia 8,863,338 6.76 “ Tanzania 37,445,392 4.97 “ Uganda 28,195,754 6.71
Subtotals Africa, East (Region) 198,684,543 5.12 5.40Africa, North Algeria 32,930,091 1.89
“ Egypt 78,887,007 2.83 “ Libya 5,900,754 3.28 “ Mauritania 3,177,388 5.86 “ Morocco 33,241,259 2.68 “ Sudan 41,236,378 4.72 “ Tunisia 10,175,014 1.74 “ Western Sahara 273,008 6.25
Subtotals Africa, North (Region) 205,820,899 3.66 3.04Africa, Southern Angola 12,127,071 6.35
“ Botswana 1,639,833 2.79 “ Lesotho 2,022,331 3.28 “ Madagascar 18,595,469 5.62

“ Malawi 13,013,926 5.92 “ Mauritius (islands to the W of Madagascar) 1,240,827 1.95 “ Mozambique 19,686,505 4.62 “ Namibia 2,044,147 3.06 “ South Africa 44,187,637 2.2 “ Swaziland 1,136,334 3.53 “ Zambia 11,502,010 5.39 “ Zimbabwe 12,236,805 3.13
Subtotals Africa, Southern (Region) 139,432,895 3.99 4.09Africa, West Benin 7,862,944 5.2
“ Burkina Faso 13,902,972 6.47 “ Cameroon 17,340,702 4.39 “ Cote d'Ivoire (Ivory Coast) 17,654,843 4.5 Equatorial Guinea 540,109 4.55 “ Gabon 1,424,906 4.74 “ Gambia, The 1,641,564 5.3 “ Ghana 22,409,572 3.99 “ Guinea 9,690,222 5.79 “ Guinea-Bissau 1,442,029 4.86 “ Liberia 3,042,004 6.02 “ Mali 11,716,829 7.42 “ Niger 12,525,094 7.46 “ Nigeria 131,859,731 5.49 “ Senegal 11,987,121 4.38 “ Sierra Leone 6,005,250 6.08 “ Togo 5,548,702 4.96
Subtotals Africa, West (Region) 276,594,594 5.39 5.41Americas, Caribbean Dominican Republic 9,183,984 2.83
“ Haiti 8,308,504 4.94 “ Jamaica 2,758,124 2.41 “ Puerto Rico 3,927,188 1.75
Subtotals Americas, Caribbean (Region) 24,177,800 2.98 3.33Americas, Central Belize 287,730 3.6
“ Costa Rica 4,075,261 2.24 “ El Salvador 6,822,378 3.12 “ Guatemala 12,293,545 3.82 “ Honduras 7,326,496 3.59 “ Nicaragua 5,570,129 2.75 “ Panama 3,191,319 2.68 “ Trinidad and Tobago 1,065,842 1.74
Subtotals Americas, Central (Region) 40,632,700 2.94 3.21Americas, North Canada 33,098,932 1.61
“ Cuba 11,382,820 1.66

Greenland 56k 2.4 “ Mexico 107,449,525 2.42 “ United States 298,444,215 2.09
Subtotals Americas, North (Region) 450,431,492 2.04 2.12Americas, South Argentina 39,921,833 2.16
“ Bolivia 8,989,046 2.85 “ Brazil 188,078,227 1.91 “ Chile 16,134,219 2 “ Colombia 43,593,035 2.54 “ Ecuador 13,547,510 2.68 “ French Guiana 199,509 2.98 Guyana 767,245 2.04 “ Paraguay 6,506,464 3.89 “ Peru 28,302,603 2.51 “ Suriname 439,117 2.32 “ Uruguay 3,431,932 1.89 “ Venezuela 25,730,435 2.23
Subtotals Americas, South (Region) 375,641,175 2.46 2.17Asia, Caucasus Armenia 2,976,372 1.33
“ Azerbaijan 7,961,619 2.46 “ Georgia 4,661,473 1.42
Subtotals Asia, Caucasus (Region) 15,599,464 1.74 1.93Asia, Central Kazakhstan 15,233,244 1.89
“ Kyrgyzstan 5,213,898 2.69 “ Mongolia 2,832,224 2.25 “ Tajikistan 7,320,815 4 “ Turkmenistan 5,042,920 3.37 “ Uzbekistan 27,307,134 2.91
Subtotals Asia, Central (Region) 62,950,235 2.85 2.78Asia, East China 1,313,973,713 1.73
“ Japan 127,463,611 1.4 “ Korea, North 23,113,019 2.1 “ Korea, South 48,846,823 1.27 “ Taiwan 23,036,087 1.57
Subtotals Asia, East (Region) 1,536,433,253 1.61 1.69Asia, Mideast Bahrain 698,585 2.6
“ Cyprus 784,301 1.82 “ Iran 68,688,433 1.8 “ Iraq 26,783,383 4.18 “ Israel 6,352,117 2.41 “ Jordan 5,906,760 2.63 “ Kuwait 2,418,393 2.91 “ Lebanon 3,874,050 1.9
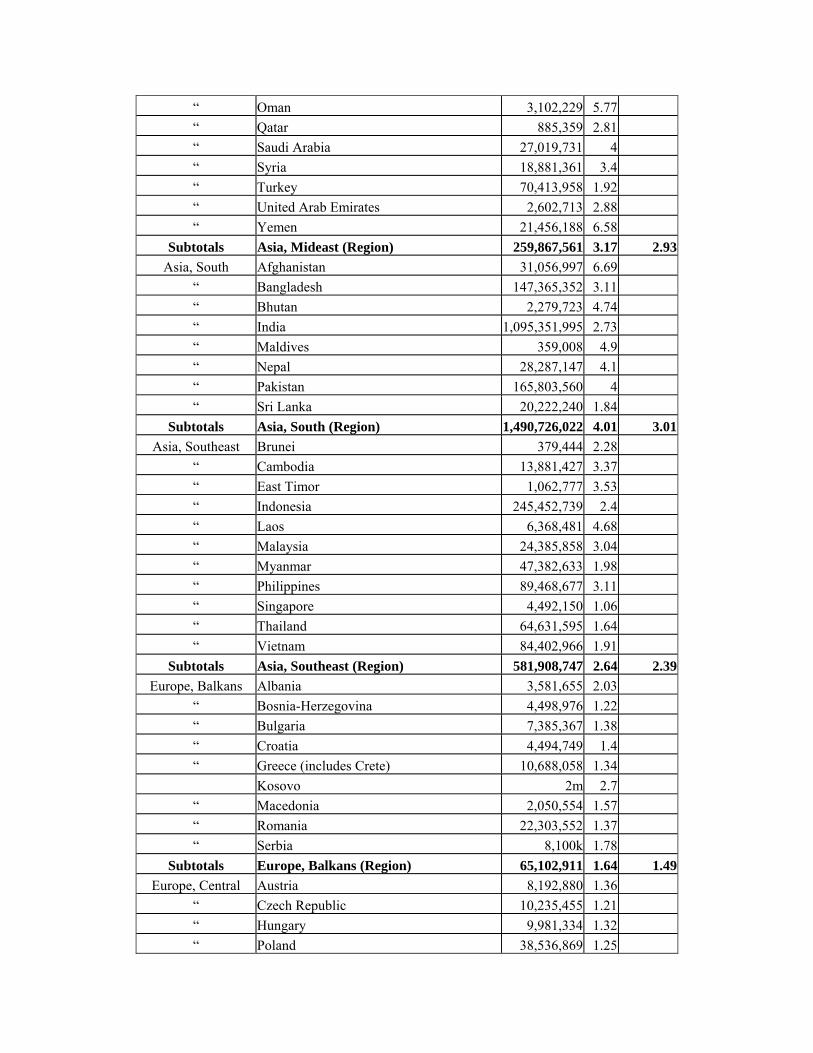
“ Oman 3,102,229 5.77 “ Qatar 885,359 2.81 “ Saudi Arabia 27,019,731 4 “ Syria 18,881,361 3.4 “ Turkey 70,413,958 1.92 “ United Arab Emirates 2,602,713 2.88 “ Yemen 21,456,188 6.58
Subtotals Asia, Mideast (Region) 259,867,561 3.17 2.93Asia, South Afghanistan 31,056,997 6.69
“ Bangladesh 147,365,352 3.11 “ Bhutan 2,279,723 4.74 “ India 1,095,351,995 2.73 “ Maldives 359,008 4.9 “ Nepal 28,287,147 4.1 “ Pakistan 165,803,560 4 “ Sri Lanka 20,222,240 1.84
Subtotals Asia, South (Region) 1,490,726,022 4.01 3.01Asia, Southeast Brunei 379,444 2.28
“ Cambodia 13,881,427 3.37 “ East Timor 1,062,777 3.53 “ Indonesia 245,452,739 2.4 “ Laos 6,368,481 4.68 “ Malaysia 24,385,858 3.04 “ Myanmar 47,382,633 1.98 “ Philippines 89,468,677 3.11 “ Singapore 4,492,150 1.06 “ Thailand 64,631,595 1.64 “ Vietnam 84,402,966 1.91
Subtotals Asia, Southeast (Region) 581,908,747 2.64 2.39Europe, Balkans Albania 3,581,655 2.03
“ Bosnia-Herzegovina 4,498,976 1.22 “ Bulgaria 7,385,367 1.38 “ Croatia 4,494,749 1.4 “ Greece (includes Crete) 10,688,058 1.34 Kosovo 2m 2.7 “ Macedonia 2,050,554 1.57 “ Romania 22,303,552 1.37 “ Serbia 8,100k 1.78
Subtotals Europe, Balkans (Region) 65,102,911 1.64 1.49Europe, Central Austria 8,192,880 1.36
“ Czech Republic 10,235,455 1.21 “ Hungary 9,981,334 1.32 “ Poland 38,536,869 1.25

“ Slovakia 5,439,448 1.33 “ Slovenia 2,010,347 1.25
Subtotals Europe, Central (Region) 74,396,333 1.29 1.27Europe, Eastern Belarus 10,293,011 1.43
“ Estonia 1,324,333 1.4 “ Latvia 2,274,735 1.27 “ Lithuania 3,585,906 1.2 “ Moldova 4,466,706 1.85 “ Russia 142,893,540 1.28 “ Ukraine 46,710,816 1.17
Subtotals Europe, Eastern (Region) 211,549,047 1.37 1.27Europe, Western Belgium 10,379,067 1.64
“ Denmark 5,450,661 1.74 “ Finland 5,231,372 1.73 “ France (includes Corsica) 62,752,136 1.84 “ Germany 82,422,299 1.39 “ Iceland 299,388 1.92 “ Ireland 4,062,235 1.86 “ Italy (includes Sardinia, Sicily) 58,133,509 1.28 “ Luxembourg 474,413 1.78 “ Netherlands 16,491,461 1.66 “ Norway 4,610,820 1.78 “ Portugal 10,605,870 1.47 “ Spain 40,397,842 1.28 “ Sweden 9,016,596 1.66 “ Switzerland 7,523,934 1.43 “ United Kingdom (Britain) 60,609,153 1.66
Subtotals Europe, Western (Region) 378,460,756 1.63 1.53Oceania Australia 20,264,082 1.76
“ Fiji 905,949 2.73 “ New Zealand 4,076,140 1.79 “ Papua New Guinea 5,670,544 3.88 “ Solomon Islands 552,438 3.91 “ Vanuatu 208,869 2.7
Subtotals Oceania (Region) 31,678,022 2.80 2.21Totals World 6,504,861,751 3.12 2.59
Note: These 173 countries represent all the countries with both appreciable land mass and population, i.e., ones that stood a chance of showing up in this study’s colored global maps. G. Demographics Data Table, Listing By Country for 2006 Abbreviations: ID = Insufficient Data, i.e., Islam not listed in the religions present, but could be part of the “other” unspecified religions.

CPW = children per woman C = Christian M = Muslim ND = No Data Data Format: Country Name, 2-letter country code, region of world CPW, Muslim Percentage, The Number of Muslims (if any), Christian Percentage Note 1: The Child Per Woman (CPW) figure is for the entire country. The M: before the percentage and number stands for Muslim, and the C: stands for the Christian percentage, for example: CPW 6.69 CPW M:100% 31m C:0%. The CPW and percentage of Muslims and Christians come from the CIA Factbook (2006) unless a hyperlink points to Wikipedia’s table on Christians or US State Department’s Religious Freedom Report. Note 2: Due to different estimates, the numbers may not add up to 100%, and may be inconsistent with figures found elsewhere—even in this study. For instance: 1) Albania is listed below as having 2.5m Muslims, but a BBC article above puts it at 2.2m; 2) In Qatar the number of Muslims is said to be 95%, and the number of Christians at 8.1%, which adds up to 103.1%, perhaps because the 8.1% figure includes foreign workers; 3) Likewise in Bahrain, Muslims are supposed to be 98%, and Christians 9%, which adds up to 108%. Afghanistan (AF) (S Asia) CPW:6.69 M:100% 31m C:0.1% Aland Islands (AX) No Data Albania (AL) (Balkans) CPW:2.03 M:70% 2.5m (or 2.1m) C:30% Algeria (DZ) (N Africa) CPW:1.89 M:99% 32.2m C:0.4% American Samoa (AS) (Polynesia) CPW:3.16 M:0% “A few adherents of Islam” C:100% Andorra (AD) (on border of France & Spain) CPW:1.3, M:2.8% 2k (or 400) C:97.2% Angola (AO) (S Africa) (includes Cabinda, a disputed province) CPW:6.35 M:1% 112k C:53% Anguilla (AI) (UK territory in the Caribbean) CPW:1.73 ID, C:90.5% Antarctica (AQ) No Data Antigua & Barbuda (AG) (Caribbean) CPW:2.24, M:0.6% 400 C:99.4% Argentina (AR) (S America) CPW:2.16 M:1.5% 593k C:94%
Georgia (GE) (Mideast) CPW:1.42 M:11% 515k C:88.6% Germany (DE) (W Europe) CPW:1.39 M:3.9% 3.2m C:68% Ghana (GH) (W Africa) CPW:3.99 M:15.6% 3.3m C:63% Gibraltar (GI) CPW:1.65, ID C:88.3% Great Britain (GB is little used; see United Kingdom (UK)) Greece (GR) (Balkans) (includes Crete) CPW:1.34 M:2.8% 300k C:97.2% Greenland (GL) CPW:2.4, 0% C:100% Grenada (GD) (Caribbean) CPW:2.34 M:0.3% 268 C:100% Guadeloupe (GP) CPW:1.9 C:96% Guam (GU) CPW:2.58 C:85% Guatemala (GT) (C America) CPW:3.82 M:0.008% 1.2k C:99.002% Guernsey (GG) CPW:1.39 C:100% Guinea (GN) (W Africa) CPW:5.79 M:85% 8m C:8% Guinea-Bissau (GW) (W
Norway (NO) (W Europe) CPW:1.78 M:2% 78k C:90.1% Oman (OM) (Mideast) CPW:5.77 M:99% 3m C:0.01 Pakistan (PK) (S Asia) CPW:4 M:97% 161m C:<1% Palau (PW) CPW:2.46 C:80.5% Palestine (PS) (also see W Bank & Gaza for info listed separately) CPW:5.16 M:98.7% 3.72m C:1.3% Panama (PA) (C America) CPW:2.68 M:0.3% 9k C:100% Papua New Guinea (PG) (Melanesia) CPW:3.88 M:0.04% 2k C:66% Paraguay (PY) (S America) CPW:3.89 M:0.008% 507 C:100% Peru (PE) (S America) CPW:2.51 M:0.003% 837 C:83.1% Philippines (PH) (SE Asia) CPW:3.11 M:5% 4.3m C:92.5% Pitcairn Islands (PN) ID C:100% Poland (PL) (C Europe) CPW:1.25 M:0.08% 30k C:91.1% Portugal (PT) (W Europe)

Armenia (AM) (Mideast) CPW:1.33 M:1-2% 30-60k C:96.7-97.7% Aruba (AW) (Caribbean) CPW:1.79 ID C:90% Ascension Island (AC) No Data Australia (AU) (Australia) CPW:1.76 M:1.5% 304k C:67.4% Austria (AT) (C Europe) CPW:1.36 M:4.7% 385k, C:78.3% Azerbaijan (AZ) (includes Naxcivan) (Mideast) CPW:2.46 M:93.4% 7.4m C:4.8% Bahamas, The (BS) (Caribbean) CPW:2.18 ID “Growing Muslim community” C:96.3% Bahrain (BH) (Mideast) CPW:2.6 M:98% 667k C:9% Bangladesh (BD) (S Asia) CPW:3.11 M:88.3% 130m C:<1% Barbados (BB) CPW:1.65 M:1% 2,700 C:71% Belarus (BY) (E Europe) CPW:1.43 M:0.5% 52k C:99.5% Belgium (BE) (W Europe) CPW:1.64 M:4% 400k C:96% Belize (BZ) (C America) CPW:3.6 M:1% 3k C:76.6% Benin (BJ) (W Africa) CPW:5.2 M:24.4% 1.9m C:42.8% Bermuda (BM) CPW:1.89 ID C:67% Bhutan (BT) (S Asia) CPW:4.74 M:1% 22k C:0.3% Bolivia (BO) (S America) CPW:2.85 M:0.01% 1k C:99.9% Bosnia-Herzegovina (BA) (Balkans) CPW:1.22 M:40% 1.7m (or 2m) C:46% Botswana (S Africa) (BW) CPW:2.79 M:1% 17k C:71.6% Bouvet Island (BV) No Data Brazil (BR) (S America) CPW:1.91 M:0.38% 700k C:89%
Africa) CPW:4.86 M:45% 637k C:5% Guyana (GY) (S America) (Not to be confused with nearby French Guiana) CPW:2.04 M:9% 69k C:50% Haiti (HT) (Caribbean) CPW:4.94 M:0.04% 3.2k C:96% Heard & McDonald Islands (HM) ND Honduras (HN) (C America) CPW:3.59 M:0.04% 3k C:100% Hong Kong (HK) CPW:0.95 C:10% Hungary (HU) (C Europe) CPW:1.32 M:0.6% 60k C:74.4% Iceland (IS) (W Europe) CPW:1.92 M:0.1% 321 C:93.8% India (IN) (S Asia) CPW:2.73 M:13.4% 146.8m C:2.3% Indonesia (ID) (SE Asia) CPW:2.4 M:88.2% 214m C:8% Iran, Islamic Republic of (IR) (Mideast) CPW:1.8 M:98% 67m C:<1% Iraq (IQ) (Mideast) CPW:4.18 M:97% 25m C:1.8% Ireland (IE) (W Europe) CPW:1.86 M:0.49% 20k C:93% Isle of Man (IM) CPW:1.65 C:100% Israel (IL) (Mideast) CPW:2.41 M:16.5% 1.2m C:2.1% (includes E Jerusalem and Golan Heights) Italy (IT) (W Europe) (includes Sardinia & Sicily Islands) CPW:1.28 M:1.4% 825k C:98.6% Jamaica (JM) (Caribbean) CPW:2.41 M:0.2% 5.4k C:65.3% Japan (JP) (E Asia) CPW:1.4 M:0.05% 70k C:0.7% Jersey (JE) CPW:1.58 C:100% Jordan (JO) (Mideast) CPW:2.63 M:95% 5.5m C:6% Kazakhstan (KZ) (C Asia)
CPW:1.47 M:0.35% 37k C:99.65% Puerto Rico (PR) (Caribbean) CPW:1.75 M:0.13% 5k C:93% Qatar (QA) (Mideast) CPW:2.81 M:95% 820k C:8.1% Reunion Island (RE) CPW:2.45 C:86% Romania (RO) (Balkans) CPW:1.37 M:0.2% 447k C:99% Russian Federation (RU) (Eastern Europe) CPW:1.28 M:6% 9m C:80 Rwanda (RW) (E Africa) CPW:5.43 M:4.6% 338k C:93.6% Saint Helena (SH) CPW:1.55 C:100% Saint Kitts & Nevis (KN) CPW:2.31 C:100% Saint Lucia (LC) CPW:2.18 C:90.8% Saint Pierre & Miquelon (PM) CPW:2.01 C:99% Saint Vincent & the Grenadines (VC) CPW:1.83 C:88% Samoa (WS) CPW:2.94 C:98.2% San Marino (SM) CPW:1.34 C:100% Sao Tome & Principe (ST) CPW:5.62 C:77.5% Saudi Arabia (SA) (Mideast) CPW:4 M:96.3% 26.4m C:3.7% Senegal (SN) (W Africa) CPW:4.38 M:95% 10.6m C:5% Serbia (RS) (Balkans) CPW:1.78 M:5% 405k C:83% Seychelles (SC) (E Africa) CPW:1.74 M:1.1% 894 C:93.2% Sierra Leone (SL) (W Africa) CPW:6.08 M:60% 3.6m C:10% Singapore (SG) (SE Asia) CPW:1.06 M:16% 708k C:14.6% Slovakia/Slovak Republic (SK) (C Europe) CPW:1.33 M:0.05% 3k C:93.8% Slovenia (SI) (C Europe) CPW:1.25 M: 2.5% 50k C:61%

Britain (see United Kingdom) British Indian Ocean Territory (IO) No Data British Virgin Islands (Caribbean) CPW:1.72 ID C:96% Brunei Darussalam (BN) (SE Asia) CPW:2.28 M:67% 250k C:10% Bulgaria (BG) (Balkans) CPW:1.38 M:12.2% 967k (or 1.1m) C:83.8% Burkina Faso (BF) (W Africa) CPW:6.47 M:55% 7.7m C:10% Burma (see Myanmar) Burundi (BI) (C Africa) CPW:6.55 M:10% 637k C:67% Cambodia (KH) (SE Asia) CPW:3.37 M:3.5% 476k C:2% Cameroon (CM) (W Africa) CPW:4.39 M:20% 3.3m C:40% Canada (CA) (N America) CPW:1.61 M:1.9% 629k C:70.3% Cape Verde (CV) CPW:3.38 M:0% “small Muslim” community C:100% Cayman Islands (KY) CPW:1.9 ID C:100% Central African Republic (CF) (C Africa) CPW:4.41 M:15% 570k C:85% Chad (TD) (C Africa) CPW:6.25 M:54% 5.3m C:35% Chile (CL) (S America) CPW:2 M:0.02% 3k C:99.8% China (CN) (E Asia) CPW:1.73 M:1.5% 19.6m C:3-4% Christmas Island (CX) ID, M:25% 374 C:18% Cocos (Keeling) Islands (CC) ID, M:80% 460 ID Colombia (CO) (S America) CPW:2.54 M:0.2% 86k C:90% Comoros (E Africa) (KM) CPW:5.03 M:98% 658k C:2% Congo, Democratic Republic of the (CD) (C Africa) CPW:6.45 M:>5% 3m C:85% Congo, Republic of the (CG) (Brazzaville) (C Africa) CPW:6.07 M:2% 61k C:50%
CPW:1.89 M:47% 7m C:46% Kenya (KE) (E Africa) CPW:4.91 M:12% 4.1m C:76% Kiribati (KI) CPW:4.16 C:92% Korea, North (KP) (E Asia) CPW:2.1 ID, C:0.05% Korea, South (KR) (E Asia) CPW:1.27 M:0.04% 20k C:26% Kosovo (Balkans) (YU is a temporary 2-letter country code) CPW:2.7 M 90%, 1.8m C:10% Kuwait (KW) (Mideast) CPW:2.91 M:85% 2m C:0.006% Kyrgyzstan (KG) (C Asia) CPW:2.69 M:80% 4.1m C:20% Laos (LA) (SE Asia) CPW:4.68 M:1% 62k C:1.5% Latvia (LV) (E Europe) CPW:1.27 M:0.02% 458 (or 380) C:100% Lebanon (LB) (Mideast) CPW:1.9 M:70% 2.3m C:39% Lesotho (LS) (S Africa) CPW:3.28 M:2% 37k C:80% Liberia (LR) (W Africa) CPW:6.02 M:20% 696k C:40% Libya (LY) (N Africa) CPW:3.28 M:97% 5.6m C:3% Liechtenstein (LI) (C Europe) CPW:1.51 ID C:83.2% Lithuania (LT) (E Europe) CPW:1.2 M:0.08% 3k C:83.1% Luxembourg (LU) (W Europe) CPW:1.78 M:2% 9k C:98% Macau (MO) (region of China) CPW:1.02 C:15% Macedonia (aka Skopje) (MK) (Balkans) CPW:1.57 M:30% 614k C:65% Madagascar (MG) (S Africa) CPW:5.62 M:7% 1.3m C:41% Malawi (MW) (S Africa) CPW:5.92 M:20% 2.4m C:79.9% Malaysia (MY) (SE Asia) CPW:3.04 M:60.4% 14.5m C:9% Maldives (MV) (S Asia) CPW:4.9 M:99.9% 349k C:0.1% Mali (ML) (W Africa)
Solomon Islands (SB) (Melanesia) CPW:3.91 M:0.04% >200 C:97.1% Somalia (SO) (E Africa) (S Africa) CPW:6.76 M:100% 8.6m South Africa (ZA) CPW:2.2 M:1.5% 665k C:79.7% South Georgia & the South Sandwich Islands (GS) ND Soviet Union (SU is little used; see Russian Federation (RU)) Spain (ES) (W Europe) CPW:1.28 M:2.3% 1m C:94% Sri Lanka (LK) (S Asia) CPW:1.84 M:7% 1.4m C:6.2% Sudan (SD) (N Africa) CPW:4.72 M:65% 26.2m C:5% Suriname (SR) (S America) CPW:2.32 M: 22% 97k C:48% Svalbard & Jan Mayen Islands (SJ) ND Swaziland (SZ) (S Africa) CPW:3.53 M:9% 106k C:86% Sweden (SE) (W Europe) CPW:1.66 M:3% 301k C:78% Switzerland (CH) (W Europe) CPW:1.43 M:4.3% 330k C:79.3% Syrian Arab Republic (SY) (Mideast) CPW:3.4 M:88% 16.3m C:10% Taiwan (TW) (E Asia) CPW:1.57 M:0.7% 160k C:4.5% Tajikistan (TJ) (C Asia) CPW:4 M:85% 6m C:5% Tanzania (TZ) (E Africa) CPW:4.97 M:45% 16.5m C:30% Thailand (TH) (SE Asia) CPW:1.64 M:5% 3.3m C:0.7% Timor-Leste (TL) No Data Togo (TG) (W Africa) CPW:4.96 M:13.7% 778k C:29% Tokelau (TK) ID C:98% Tonga (TO) CPW:3 C:100% Trinidad & Tobago (TT) (C

Cook Islands (CK) CPW:3.1 C:9.8% Costa Rica (CR) (C America) CPW:2.24 M:0.1% 4k C:92% Cote d'Ivoire (Ivory Coast) (CI) (W Africa) CPW:4.5 M:35% 6.7m C:35-40% Croatia/Hrvatska (HR) (Balkans) CPW:1.4 M:1.3% 58k C:92.6% Cuba (CU) (Caribbean) CPW:1.66 M:0.008% 1k C:85% Cyprus (CY) (Mideast) CPW:1.82 M:23% 181k C:77% Czech Republic (CZ) (C Europe) CPW:1.21 M:0.2% 21k C:28.9% Denmark (DK) (W Europe) CPW:1.74 M:5% 269k C:98% Djibouti (DJ) (E Africa) CPW:5.31 M:94% 448k C:6% Dominica (DM) CPW:1.94 C:92% Dominican Republic (DO) (Caribbean) CPW:2.83 M:0.02% 2k C:95% East Timor (TP) (SE Asia) CPW:3.53 M:4% 42k C:93% Ecuador (EC) (S America) CPW:2.68 M:0.003% 400 C:95% Egypt (EG) (N Africa) CPW:2.83 M:94% 72.8m C:6% El Salvador (SV) (C America) CPW:3.12 M:<0.6% 40k C:98% Equatorial Guinea (GQ) CPW:4.55, M:<1%, <5k C:99% Eritrea (ER) (E Africa) CPW:5.08 M:48% 2.2m C:52% Estonia (EE) (E Europe) CPW:1.4 M:0.75% 10k C:27.8% Ethiopia (ET) (E Africa) CPW:5.22 M:48% 36m C:%35-40 European Union (EU) (Europe) CPW:1.47 M:3.12% 14.3m C:ID Falkland Islands (Islas Malvinas) (FK)
CPW:7.42 M:90% 11.1m C:1% Malta (MT) CPW:1.5 M:0.75% 3k C:98% Marshall Islands (MH) CPW:3.85 C:97.5% Martinique (MQ) CPW:1.79 C:10.5% Mauritania (MR) (N Africa) CPW:5.86 M:99.9% 3.1m C:0.1% Mauritius (MU) (S Africa) CPW:1.95 M:16.6% 204k C:32.2% Mayotte (YT) CPW:5.79 M:97 C:3% Mexico (MX) (N America) CPW:2.42 M:0.3% 319k C:95% Micronesia, Federated States of (FM) CPW:3.16 C:97% Moldova (MD) (E Europe) CPW:1.85 M:0.07% 3k C:98.5% Monaco (MC) CPW:1.76 C:90% Mongolia (MN) (C Asia) CPW:2.25 M:6% 168k C:<1% Montenegro (ME) CPW:1.55 M:17.74% 110k C:82.26% (The CPW here is estimated based on the 12.6 births per 1000 rate.) Montserrat (MS) CPW:1.77 C:100% Morocco (MA) (N Africa) CPW:2.68 M:98.7% 32.3m C:1.1% Mozambique (MZ) (S Africa) CPW:4.62 M:20% 3.9m C:41.3% Myanmar (MM) (formerly Burma) (SE Asia) CPW:1.98 M:4% 1.7m C:4% Namibia (NA) (S Africa) CPW:3.06 M:<1% <20k C:>90% Nauru (NR) CPW:3.11 C:100% Nepal (NP) (S Asia) CPW:4.1 M:4.2% 1.2m C: 1.4% Netherlands (NL) (W Europe) CPW:1.66 M:6% 1m C:51%
America) CPW:1.74 M:6% 65k C:57.6% Tunisia (TN) (N Africa) CPW:1.74 M:99% 10m C:1% Turkey (TR) (Mideast) CPW:1.92 M:99% 69m C:0.2% Turkmenistan (TM) (C Asia) CPW:3.37 M:89% 4.4m C:9% Turks & Caicos Islands (TC) CPW:3.05 C:86% Tuvalu (TV) CPW:2.98 C:98.4% Uganda (UG) (E Africa) CPW:6.71 M:16% 4m C:66% Ukraine (UA) (E Europe) CPW:1.17 M:4% 1.9m C:61.37% United Arab Emirates (AE) (Mideast) CPW:2.88 M:96% 2.5m United Kingdom (UK) (W Europe) CPW:1.66 M:2.8% 1.6m C:71.6% United States (US) (N America) CPW:2.09 M:0.66% 2m C:78% United States Minor Outlying Islands (UM) No Data Uruguay (UY) (S America) CPW:1.89 M:0.01% 341 C:66% Uzbekistan (UZ) (C Asia) CPW:2.91 M:88% 23.7m C:9% Vanuatu (VU) (Melanesia) CPW:2.7 M:0.1% 200 C:82.5% Vatican City State (Holy See) (VA) W Europe No Data C:100% Venezuela (VE) (S America) CPW:2.23 M:0.5% 127k C:98% Vietnam (VN) (SE Asia) CPW:1.91 M:0.85% 710k C:7.2% Virgin Islands (VG-British/VI-United States) CPW:2.17 C:93% Wallis & Futuna (WF) ID C:99% West Bank (Mideast) CPW:4.28 M:98.5% 2.3m (does not include any Jewish settlers, who are 187k in W Bank and 177k in E Jerusalem) C:1.5%; see Palestine

ID, 0%, 100% Faroe Islands (FO) CPW:2.17 C:100% Fiji (Melanesia) (FJ) CPW:2.73 M:7% 63k C:52% Finland (FI) (W Europe) CPW:1.73 M:0.2% 11k C:86.4% France (FR) (W Europe) (includes Corsica Island) CPW:1.84 M:10% 6.2m C:85% French Guiana (GF) (S America) (not to be confused with nearby Guyana) CPW:2.98 M:0% C:100% French Polynesia (PF) CPW:2.01 C:84% French Southern Territories (TF) Gabon (GA) (W Africa) CPW:4.74 M:1% 14k C:73% Gambia, The (GM) (W Africa) CPW:5.3 M:95% 1.5m C:1% Gaza Strip (see Palestine) CPW:5.78 M:99.1% 1.42m C:0.9%
Netherlands Antilles (AN) CPW:1.99 C:92.3% New Caledonia (NC) CPW:2.28 C:90% New Zealand (NZ) (Polynesia) CPW:1.79 M:0.17% 7k C:46.5% Nicaragua (NI) (C America) CPW:2.75 M:0.009% <500 C:89.6% Niger (NE) (W Africa) CPW:7.46 M:95% 11.1m C:0.375% Nigeria (NG) (W Africa) CPW:5.49 M:50% 64m C:40% Niue (NU) ID C:81% Norfolk Island (NF) ID C:63.9% Northern Mariana Islands (MP) CPW:1.24 C:100%
Western Sahara (EH) (N Africa) CPW: 6.25 M:99.8% 273k C:0.2% (CPW estimated based on 45.07 births-per-thousand) Yemen (YE) (Mideast) CPW:6.58 M:99% 20.5m C:0.5% Yugoslavia (YU—little used; see other Balkan states) Zambia (ZM) (S Africa) CPW:5.39 M:>1% 115k C:87% Zimbabwe (ZW) (S Africa) CPW:3.13 M:1% 128k C:75%

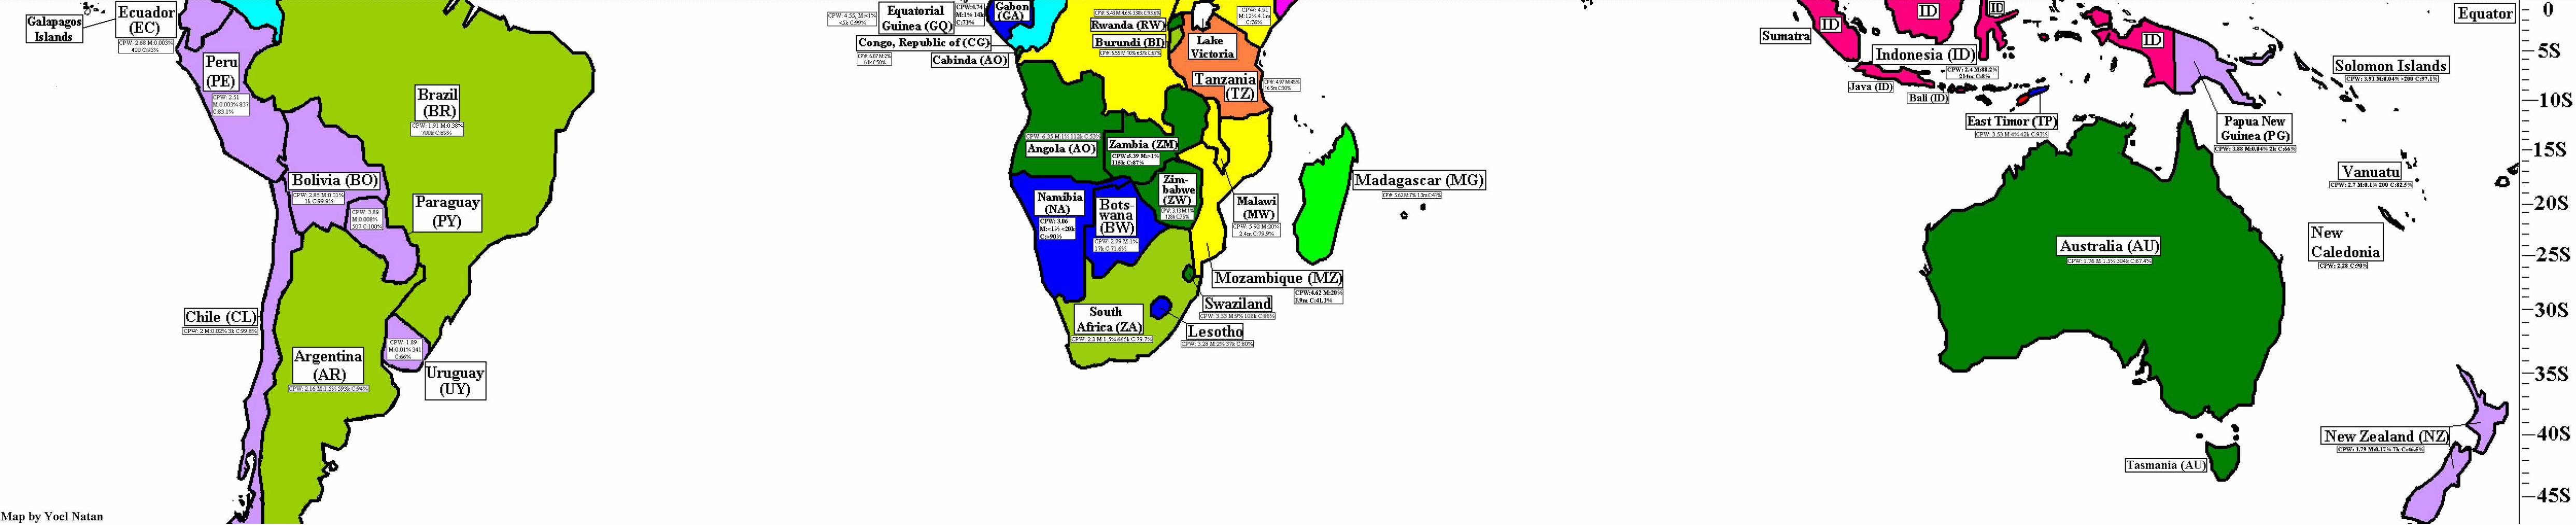
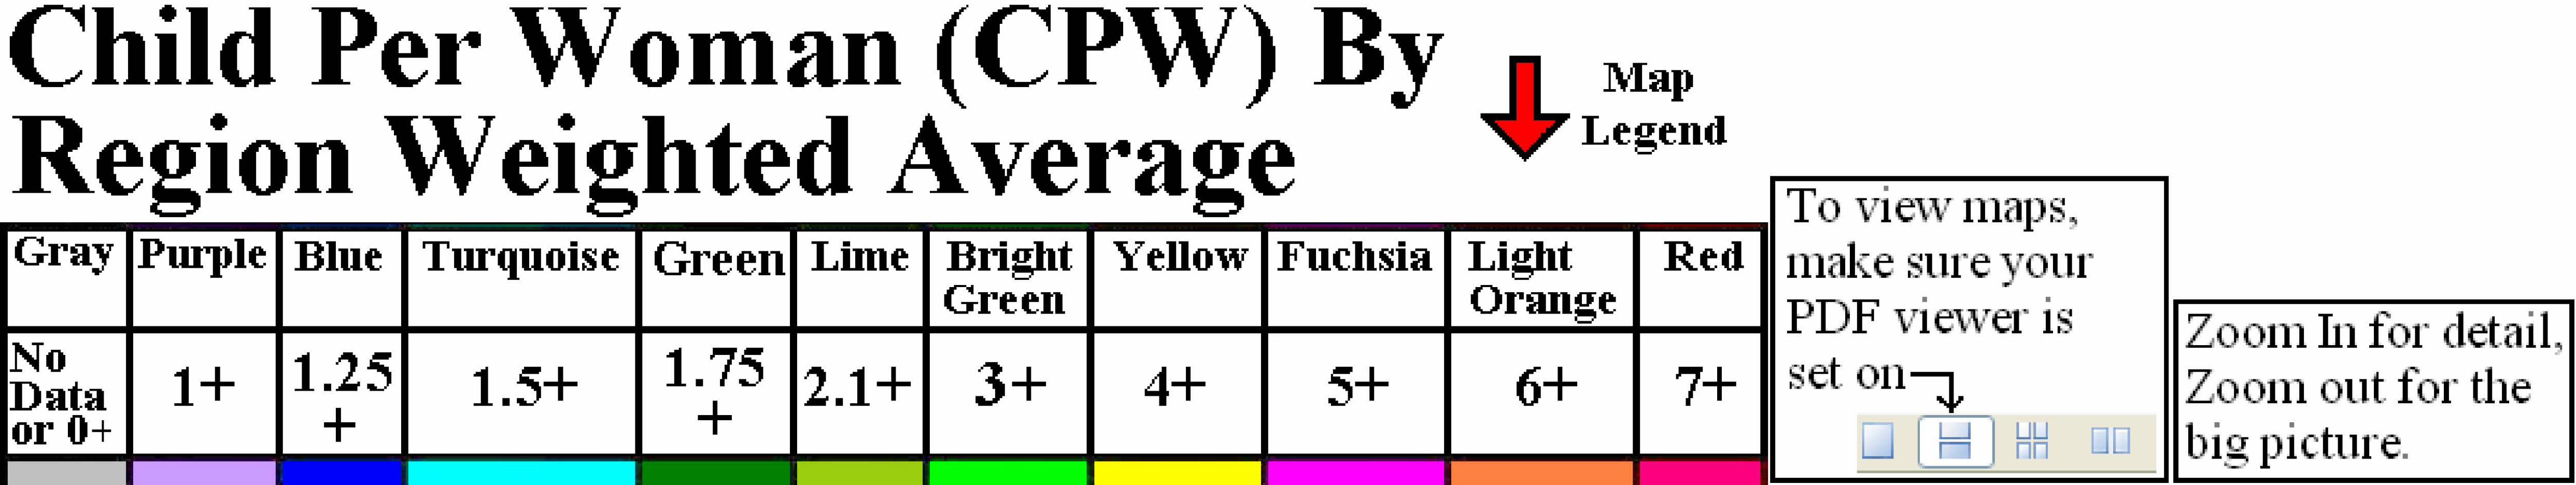
H. Five World Demographic Maps 1. Maps Legend
Map Legend
Gray Purple Blue Turquoise Green Lime Bright Green
Yellow Fuchsia Light Orange
Red
No. of Muslims
No Data
0+ 10k+ 50k+ 100k+ 500k+ 1m+ 2m+ 5m+ 10m+ 50m+
CPW No Data or 0+
1+ 1.25+ 1.5+ 1.75+ 2.1+ 3+ 4+ 5+ 6+ 7+
Percent No Data
0%+ 1%+ 5%+ 10%+ 25%+ 45%+ 50%+ 55%+ 75%+ 90%+
Note: Color names in the legends are only approximate.

2. Total Fertility Rate (CPW) Global Map
• Related Websites: Birthrate data table tied to small and large maps, population decline, world population data table and map


3. Total Fertility Rate (CPW) Global Map by Region


4. Percent Christian Global Map
• Related Websites: Global religions tables and map, religions by people database and list, European religions map, denominations article and map, global religiosity map, Christianity by country table and map, animated map of spread of the historic spread of world religions, American religions by location, Unreached Peoples in the 10/40 Window, Relief Web maps


5. Percent Muslim Global Map
• Related Websites: Muslims in Europe, Islamic world, global Muslim population distribution maps by country and by grid square, American Muslims by location and religiosity, and by number of adherents and congregations (i.e. mosques)


6. Number of Muslims Global Map
• Related Websites: Islam by country table and map, Muslim population tables. Map of the major languages in Islamdom.