Choosing the right strategy: cryogrinding vs. ball milling ...
12
Green Chemistry PAPER Cite this: Green Chem., 2021, 23, 9646 Received 27th August 2021, Accepted 7th October 2021 DOI: 10.1039/d1gc03128g rsc.li/greenchem Choosing the right strategy: cryogrinding vs. ball milling – comparing apples to apples† Julia L. Shamshina, * a Robin S. Stein b and Noureddine Abidi a Despite many reports on ball milling (BM) of chitin, the effect of cryomilling of chitin has not yet been reported, even though it is a solventless and environmentally-friendly method for the processing of chitin polymer. In this work, commercially available chitin has been cryoground for up to 96 min and the result- ing morphological and chemical changes after cryomilling were monitored and compared with those induced by BM. FE-SEM analysis (1000×) revealed that cryogrinding resulted in size reduction of chitin particles and the size reduction was proportional to cryogrinding time. FTIR followed by PCA analysis revealed the breaking of intra- and intermolecular hydrogen bonds, partial amorphization, and insignifi- cant breaking of glycosidic bonds after up to 48 min of cryogrinding, whereas an increase of cryogrinding time to 96 min resulted in a slightly higher number of broken bonds and highly amorphous material. The crystalline structure analysis demonstrated a decrease of crystallinity from 68 to 58% after 48 min of cryo- grinding, and to 51% after 96 min of cryogrinding. No change in the crystallite size was found in the (110) plane, while a ∼15% decrease in crystallite size was determined in plane (020). No changes in the mole- cular weight were detected, although deacetylation to some extent was determined, contrarily to BM. The thermal stability of the polymer was higher than that of the starting material. Overall, the study high- lighted similarities and differences between BM at room temperature and cryomilling, and set a foun- dation for co-processing of chitin with temperature-labile compounds. Introduction Extensive research has been focused on biopolymers as poten- tial renewable sources for the preparation of high-value materials as alternatives to synthetic plastics. Among those, chitin (Fig. 1) is the second most abundant natural polymer, and is made of β-(1–4)-linked 2-deoxy-2-acetamido-D-glucose units. It is obtained from crustacean shells, skeletons of insects, fungi, etc., 1 and is applicable in various fields includ- ing biomedicine. 2–4 Successful replacements of synthetic plastics must preserve the low cost, versatility, and ease of processing in order to compete as biopolymeric alternatives. From the perspective of the field of Green Chemistry, the expansion of which has resulted in the development and implementation of new technologies, low chemical intensity solid-state processing methods are suitable complements to conventional solvent- assisted chemical methods. 5 These include mechanochemis- try, reaction milling, liquid- and electric discharge-assisted milling, etc. 6–8 Mechanochemistry of insoluble (in traditional organic solvents) chitin polymer 9 is an efficient route to its particle size reduction and amorphization; however, the terms “milling” and “grinding” thus far have been applied for relatively high-energy ball-milling (BM). The high number of large mechanical perturbations generated during BM often results in significant changes in morphology, crystallite Fig. 1 Structure of chitin. † Electronic supplementary information (ESI) available: FE-SEM images, ATR FTIR spectra, crystallinity indices (CrI), pXRD diffractograms (include peak fitting and related parameters, crystallite size (110) and (020), the first derivative of the digitally filtered FTIRs, solid-state cross-polarization magic angle spinning carbon-13 nuclear magnetic resonance (CP MAS NMR), flow curves for 1 wt% chitin solutions in ionic liquid 1-ethyl-3-methylimidazolium acetate [C 2 mim][OAc], TGA curves, DTG curves and related peak fitting. See DOI: 10.1039/d1gc03128g a Fiber and Biopolymer Research Institute, Department of Plant and Soil Science, Texas Tech University, Lubbock, Texas, 79409, USA. E-mail: [email protected] b McGill University, Department of Chemistry, Montreal, QC H3A0B8, Canada 9646 | Green Chem. , 2021, 23, 9646–9657 This journal is © The Royal Society of Chemistry 2021 Open Access Article. Published on 11 November 2021. Downloaded on 3/12/2022 9:08:42 PM. This article is licensed under a Creative Commons Attribution-NonCommercial 3.0 Unported Licence. View Article Online View Journal | View Issue
Transcript of Choosing the right strategy: cryogrinding vs. ball milling ...
Green Chemistry
PAPER
Cite this: Green Chem., 2021, 23,9646
Received 27th August 2021,Accepted 7th October 2021
DOI: 10.1039/d1gc03128g
rsc.li/greenchem
Choosing the right strategy: cryogrinding vs. ballmilling – comparing apples to apples†
Julia L. Shamshina, *a Robin S. Stein b and Noureddine Abidi a
Despite many reports on ball milling (BM) of chitin, the effect of cryomilling of chitin has not yet been
reported, even though it is a solventless and environmentally-friendly method for the processing of chitin
polymer. In this work, commercially available chitin has been cryoground for up to 96 min and the result-
ing morphological and chemical changes after cryomilling were monitored and compared with those
induced by BM. FE-SEM analysis (1000×) revealed that cryogrinding resulted in size reduction of chitin
particles and the size reduction was proportional to cryogrinding time. FTIR followed by PCA analysis
revealed the breaking of intra- and intermolecular hydrogen bonds, partial amorphization, and insignifi-
cant breaking of glycosidic bonds after up to 48 min of cryogrinding, whereas an increase of cryogrinding
time to 96 min resulted in a slightly higher number of broken bonds and highly amorphous material. The
crystalline structure analysis demonstrated a decrease of crystallinity from 68 to 58% after 48 min of cryo-
grinding, and to 51% after 96 min of cryogrinding. No change in the crystallite size was found in the (110)
plane, while a ∼15% decrease in crystallite size was determined in plane (020). No changes in the mole-
cular weight were detected, although deacetylation to some extent was determined, contrarily to BM.
The thermal stability of the polymer was higher than that of the starting material. Overall, the study high-
lighted similarities and differences between BM at room temperature and cryomilling, and set a foun-
dation for co-processing of chitin with temperature-labile compounds.
Introduction
Extensive research has been focused on biopolymers as poten-tial renewable sources for the preparation of high-valuematerials as alternatives to synthetic plastics. Among those,chitin (Fig. 1) is the second most abundant natural polymer,and is made of β-(1–4)-linked 2-deoxy-2-acetamido-D-glucoseunits. It is obtained from crustacean shells, skeletons ofinsects, fungi, etc.,1 and is applicable in various fields includ-ing biomedicine.2–4
Successful replacements of synthetic plastics must preservethe low cost, versatility, and ease of processing in order tocompete as biopolymeric alternatives. From the perspective ofthe field of Green Chemistry, the expansion of which has
resulted in the development and implementation of newtechnologies, low chemical intensity solid-state processingmethods are suitable complements to conventional solvent-assisted chemical methods.5 These include mechanochemis-try, reaction milling, liquid- and electric discharge-assistedmilling, etc.6–8 Mechanochemistry of insoluble (in traditionalorganic solvents) chitin polymer9 is an efficient route to itsparticle size reduction and amorphization; however, theterms “milling” and “grinding” thus far have been applied forrelatively high-energy ball-milling (BM). The high numberof large mechanical perturbations generated during BMoften results in significant changes in morphology, crystallite
Fig. 1 Structure of chitin.
†Electronic supplementary information (ESI) available: FE-SEM images, ATRFTIR spectra, crystallinity indices (CrI), pXRD diffractograms (include peakfitting and related parameters, crystallite size (110) and (020), the first derivativeof the digitally filtered FTIRs, solid-state cross-polarization magic angle spinningcarbon-13 nuclear magnetic resonance (CP MAS NMR), flow curves for 1 wt%chitin solutions in ionic liquid 1-ethyl-3-methylimidazolium acetate[C2mim][OAc], TGA curves, DTG curves and related peak fitting. See DOI:10.1039/d1gc03128g
aFiber and Biopolymer Research Institute, Department of Plant and Soil Science,
Texas Tech University, Lubbock, Texas, 79409, USA. E-mail: [email protected] University, Department of Chemistry, Montreal, QC H3A0B8, Canada
9646 | Green Chem., 2021, 23, 9646–9657 This journal is © The Royal Society of Chemistry 2021
Ope
n A
cces
s A
rtic
le. P
ublis
hed
on 1
1 N
ovem
ber
2021
. Dow
nloa
ded
on 3
/12/
2022
9:0
8:42
PM
. T
his
artic
le is
lice
nsed
und
er a
Cre
ativ
e C
omm
ons
Attr
ibut
ion-
Non
Com
mer
cial
3.0
Unp
orte
d L
icen
ce.
View Article OnlineView Journal | View Issue
size, shape, and crystallinity decrease, causing the desiredpartial or complete amorphization and also inducing struc-tural changes.
BM of chitin breaks the intermolecular hydrogen bonds,often cleaving C–O–C glycosidic bonds, and, in the presence ofa base, breaking amide C–NH bonds, causing deacetylation.10–15
Thus, recently, a solid-state single step mechanochemicalmethod was developed for the synthesis of low molecularweight chitosan (LMWC) from shrimp shell powder or purifiedchitin in the presence of a sodium hydroxide.10 Similarly, amethod based on the combination of mechanochemistry andaging was developed to yield high molecular weight chitosan(HMWC).11,12
At the same time, reducing the particle size of chitin withor without minimal structural changes would be desirable,since chitin itself is a valuable polymer for materialpreparation.16–21 In recent years, efforts have been put into thedevelopment of cryogrinding (cryogenic grinding, cryogenicmilling, or cryomilling), that, as the name implies, is theprocess of grinding a material at low temperature (<123 K),achieved by cooling with, for instance, liquid nitrogen (LN2). Itis an environmentally-friendly process that minimizes theenergy expenditure while making the amorphization processrelatively fast and effective. Depending on the conditions, thecryogrinding can be “wet” (milling materials mixed with cryo-genic liquid) or “dry” (milling chamber is cooled externally).
The main advantage of cryogrinding over ball milling (BM)is the suppression of side processes at low temperature. Anumber of recent studies report that the processing of poly-meric materials via cryogrinding facilitates particle sizereduction,22 the preparation of powder coatings,23 microfibril-lated substances24 and/or blending of polymers.25 Forinstance, cryogrinding was employed to generate blends ofchitosan (CS) with poly(lactic acid) (PLA) and tricalcium phos-phate (TCP), that were later electrospun into fibrous mem-branes for bone tissue engineering applications.26 The cryo-grinding process is often applied towards the grinding oftemperature-sensitive active pharmaceutical ingredients(APIs),27–30 producing amorphous systems without theirthermal degradation and/or oxidation at cryogenic tempera-ture. Cryogrinding of cellulose with a poorly water-solubledrug piroxicam resulted in the formation of a stabilized soliddispersion.31
However, despite the fact that cryogrinding of biopolymerscould provide green, scalable access to biopolymersfunctionalization and composites, it has been overlooked infavor of BM. Applied to biopolymers, the cryogrinding of cell-ulose to induce changes in morphology, size, shape, and crys-tallinity was studied vastly more often than that of other bio-polymers. Different types of celluloses (pure cellulose,32
natural sisal fibers,33 Norway spruce,34 orange tree,35 soy,35
sugarcane35) underwent cryogrinding following the study ofmorphological changes on the fiber surface, crystallinity, andstability.36 Cryogrinding studies of chitin, at the same time,are conspicuously lacking,37 and its mechanochemistry isrestricted to BM, with or without10,11,15 the addition of base.
We were able to find a single study of chitin cryogrindingwhere the discussion was dedicated to the design and con-struction of a cryogenic grinding system.38 Below we present astudy of chitin cryogrinding with an emphasis on investigatingchemical aspects, such as the evolution of structure, crystalsize, thermal properties or molecular weight, and comparingthe results with known BM studies.
ExperimentalMaterials
Chitin (powder, practical grade) was obtained from FischerScientific (Alfa Aesar™, chitin from shrimp shells, catalognumber AAJ6120622) and dried overnight in a 50 °C-oven priorto processing. Ionic liquid 1-ethyl-3-methylimidazoliumacetate ([C2mim][OAc], Lot 25PI281_4.3, 0.21 wt% water), wasobtained from ProIonic, Gmbh (Grambach, Austria) and usedwithout additional drying. N,N-Dimethylacetamide (DMAc),HPLC grade, manufactured by Alfa Aesar™, was obtained fromVWR, transferred into an amber-glass bottle under nitrogen,and stored over 3 Å molecular sieves that were activated at300 °C. Anhydrous lithium chloride (99%, for analysis) manu-factured by Acros Organics was obtained from FischerScientific and used without additional purification.
General procedures
Cryogrinding process. To minimize the effect of moisture onthe cryogrinding of chitin, the polymer was dried in 50 °C-oven overnight prior to processing. The grinding was per-formed in a dry state using a cryogenic grinder 6970EFMFreezer/Mill® (6970 EFM, SPEX SamplePrep, Metuchen, NJ,USA) which consisted of two stainless steel vessels, with eachbeing able to hold four standard grinding vials. The mill wasequipped with a totally enclosed liquid nitrogen (LN2) auto-fillsystem, with no LN2 exposure to sample. Polycarbonate centercylinders with steel end plugs (mid-size for up to 25 mLsamples) of diameter (∅) 20 mm, and height (h) 100 mm werefilled with 1 g of chitin each, equipped with magnetically-driven impactors made from 440 C steel (see ESI, Table S1†),and tightly closed. Samples were chilled in liquid nitrogenprior to processing, and cryogenic temperature was main-tained during grinding. The mill was operated with the settingof cryogrinding time and speed. The cryogrinding time wascounted by cycles (3, 6, 12 and 24) where one cycle included15 min of precool time, 4 min grinding, and 1 min of rest. Thespeed was maintained at a rate of 7 counts per second (cps).After cryomilling was finished, the vials were transferred to thebench and stored closed until they equilibrated to room temp-erature. Samples are denoted C0 (unprocessed chitin powder),and C3, C6, C12 and C24 (chitin cryoground for 3, 6, 12, and24 cycles or 12, 24, 48 and 96 min, respectively).
Chitin dissolution in DMAc/LiCl. To prepare a DMAc/LiClsolvent system (8.0% w/v LiCl in DMAc), 4.020 g of LiCl wasplaced into a 10 mL two-neck round bottom flask, and theflask was equipped with a stirring bar, closed with a septum,
Green Chemistry Paper
This journal is © The Royal Society of Chemistry 2021 Green Chem., 2021, 23, 9646–9657 | 9647
Ope
n A
cces
s A
rtic
le. P
ublis
hed
on 1
1 N
ovem
ber
2021
. Dow
nloa
ded
on 3
/12/
2022
9:0
8:42
PM
. T
his
artic
le is
lice
nsed
und
er a
Cre
ativ
e C
omm
ons
Attr
ibut
ion-
Non
Com
mer
cial
3.0
Unp
orte
d L
icen
ce.
View Article Online
and flushed with dry nitrogen gas. DMAc (46.908 g,49.987 mL) was added to the flask under flow of nitrogen, andthe DMAc/LiCl mixture was stirred for 2 h under nitrogen flow,to produce a clear solution. For the dissolution, 0.010 g of pre-dried chitin was weighed, added to the DMAc/LiCl solution,and the mixture was stirred vigorously at 40 °C for 2 h. Thenthe temperature was increased to 90 °C. The heating continuedfor 2 weeks; however, complete dissolution was never achieved.
Chitin dissolution in [C2mim][OAc] ionic liquid. Cryogroundchitin was dried in Fischer Scientific Isotemp 637D Incubator(Fischer Scientific, Hampton, NH, USA) at 50 °C for 24 h priorto dissolution in the IL. For each experiment, dry chitinpowder was placed into several 20 mL scintillation vials con-taining [C2mim][OAc] IL. The vials were equipped with stirringbars, tightly capped, and wrapped with parafilm. Chitinloading in [C2mim][OAc] (wt%) was calculated as a ratiobetween amount of dry chitin to the total amount of solution(i.e., sum of chitin mass and the IL mass), according to
formula: concentration ðwt%Þ ¼ mchitin
mchitin þmIL� 100%, see ESI,
Table S2.† The vials were then placed into an oil bath (100 °C,760 rpm) and heated overnight to ensure complete dissolution.After the dissolution, the vials were taken out of the heatingbath, and the solutions were cooled to RT and subjected torheological measurements.
Methods
Field emission scanning electron microscopy (FE-SEM).Chitin samples were analyzed using a Hitachi S-4700 FieldEmission Scanning Electron Microscope (FE-SEM, Hitachi,Ltd., Tokyo, Japan), with magnification = 500–3000, at 2.0 kVaccelerating voltage and 12 mm working distance.
Crystallinity determination. Method 1. Prior conditioning ofthe samples was performed in an environment of 65 ± 2% rela-tive humidity and 21 ± 1 °C for at least 48 h before the test.The crystalline structures were identified using powder X-raydiffraction (pXRD) on the SmartLab system (HD 2711N,Rigaku Corp., Tokyo, Japan) using CuKα radiation (λ = 1.54 Å)generated at a voltage of 40 kV, and a current of 44 mA at ascan rate of 1° min−1, from 5° 2θ to 50° 2θ. A diffractogram ofthe empty glass slide was first recorded. Samples were placedon a glass slide holder and the diffractograms were taken. Thediffractogram of the empty glass slide was subtracted from thediffractogram of the sample. The crystallinity index (CrI) wascalculated using the following eqn (1):39
CrI110 ¼ ðI110 � IamÞ � 100%=I110 ð1Þwhere I110 = the maximum intensity at 2θ ≅19°, and Iam = theintensity of amorphous diffraction at 2θ ≅ 12.6 or baselineheight at 16°.
Method 2. After obtaining the diffraction intensity profilesof the samples in the same manner as described in Method 1,followed by smoothing and baseline correction, individualcrystalline peaks were extracted by a curve-fitting process usinga peak fitting feature in Origin (https://www.originlab.com/),assuming Gaussian functions for each peak. CrI was calculated
using eqn (2) 59,60 from the ratio of the sum of the areas underthe crystalline diffraction peaks and the total area under thediffraction pattern, respectively, according to the eqn (2):
CrI %ð Þ ¼P
area of crystalline peaksP
area of crystalline and amorphous peaks� 100
ð2Þ
Crystallite size determination. The crystallite size was calcu-lated using the Scherrer eqn (3):40,41
β ¼ ðk � λÞ=ðL� cosðθÞÞ ð3Þ
where β = the crystallite size perpendicular to the lattice planerepresented by (020) and (110) peaks, k is the Scherrer constantfor a given crystal shape (k = 0.91), λ represents the wavelengthof the incident X-rays (1.54 Å), L represents the width of thepeak at half of its maximum in radians (FWHM), and θ is theposition of the peak (half of the plotted 2θ value).
Thermal properties determination. Prior conditioning of thesamples was performed in an environment of 65 ± 2% relativehumidity and 21 ± 1 °C for at least 48 h before the test.Thermal properties were examined using ThermogravimetricAnalyzer (TGA, Pyris1, PerkinElmer Inc., Shelton, CT, USA)under a nitrogen flow of 20 mL min−1 and heating rate of10 °C min−1, in a range from 40 to 600 °C. The thermogramswere analyzed using Pyris software (Version 11, PerkinElmerInc., Shelton, CT, USA, http://www.perkinelmer.com/product/s-w-kit-pyris-standard-single-user-n5340092) by calculating thefirst derivatives of the thermograms (DTG), weight loss percen-tage, and decomposition temperatures.
Fourier-transform infrared spectroscopy (FTIR) and princi-pal component analysis (PCA). Prior conditioning of thesamples was performed in an environment of 65 ± 2% relativehumidity and 21 ± 1 °C for at least 48 h before the test. A FTIRSpectrum-400 (PerkinElmer, Waltham, MA, USA) equippedwith a universal attenuated total reflectance (ATR) accessorywas employed to acquire the spectra of the samples over thespectral range of 650 to 4000 cm−1. The spectral resolution was4 cm−1 and 64 co-add scans were used to generate a spectrum.Optimum contact between the samples placed on the Zn–Se–Diamond crystal stage and the incident infrared beam wasmaintained by using a “pressure arm” to hold the sample.OPUS Bruker software (Version 7.8, Bruker, Bellerica, MA,USA, https://www.bruker.com/en/products-and-solutions/infra-red-and-raman/opus-spectroscopy-software/base-package.html)was used for baseline correction and normalization of thespectra.
The FTIR spectra recorded at a spectra resolution of 4 cm−1
with 64 co-added scans over the range from 650 to 4000 cm−1
were also subjected to Principal Component Analysis (PCA)with leverage correction and mean-center cross validationboxes checked using Unscrambler V. 9.6 Camo Software AS(CAMO Software AS, Norway, http://www.camo.com/unscram-bler/).
Degree of acetylation (%DA). Method 1: FTIR. The degree ofacetylation of the processed chitin was calculated using a
Paper Green Chemistry
9648 | Green Chem., 2021, 23, 9646–9657 This journal is © The Royal Society of Chemistry 2021
Ope
n A
cces
s A
rtic
le. P
ublis
hed
on 1
1 N
ovem
ber
2021
. Dow
nloa
ded
on 3
/12/
2022
9:0
8:42
PM
. T
his
artic
le is
lice
nsed
und
er a
Cre
ativ
e C
omm
ons
Attr
ibut
ion-
Non
Com
mer
cial
3.0
Unp
orte
d L
icen
ce.
View Article Online
method adopted from the literature.42 FTIR spectra (64 scans)were recorded using an FTIR instrument Spectrum-400equipped with a universal attenuated total reflectance (ATR)accessory (PerkinElmer, Waltham, MA, USA). No baseline cor-rection or normalization was applied. On a raw spectrum, a17-point Savitzky–Golay digital filter was applied to a set ofdigital data points for the purpose of smoothing the data andincreasing the precision without distorting the signal inten-sity using OPUS Bruker software (Version 7.8, Bruker,Billerica, MA 01821, USA, https://www.bruker.com/en/pro-ducts-and-solutions/infrared-and-raman/opus-spectroscopy-software/base-package.html). The first derivative of the resul-tant filtered FTIR was plotted using the same software. Theintensity of the peaks MB1 (1383 cm−1), MB2 (1327 cm−1),and RB (1163 cm−1) were determined. The %DA was calcu-lated using eqn (4):
%DA ¼MB1þMB2ð Þ
RB� 0:487%
0:0157ð4Þ
Method 2: solid-state cross-polarization magic angle spin-ning carbon-13 nuclear magnetic resonance (CP/MAS-NMR)spectroscopy
Solid-state 13C NMR spectra were acquired on a 400 MHzVarian VNMRS spectrometer using a 4 mm double-resonanceVarian Chemagnetics T3 probe (now Agilent, Santa Clara, CA,USA). Approximately 35 mg of sample was center-packed intorotors and spun at a spinning rate of 8 kHz (C0, C3) and 8.3kHz (C6, C12 and C24), to minimize spinning sidebands onthe carbonyl carbon atom. Basic CP parameters were based onthose suggested by Duarte et al.,43 with a recycle delay of 5 sand a contact time of 2000 μs using a spin-lock field ofapproximately 60 kHz (CP standard). 2048 scans were acquiredfor each sample, for a total of nearly 3 h per sample.
The spectra were processed using MestReNova software(MestReNova, Version 12.0.0-20080, Mestrelab Research, S.L.,http://www.mestrelab.com). The spectra processing included abackwards linear prediction of the beginning of the FID, phasecorrection, and integration of the CH3 signal region and thepolysaccharidic backbone region (C1–C5). The %DA was deter-mined by measuring relative integrals of methyl group (CH3)compared to the backbone carbons.
Rheological properties of the chitin solution. The rheologi-cal properties of chitin solutions were measured using a flowtest. The measurements were conducted using a rheometerwith a 40 mm circular plate geometry and a Peltier tempera-ture control system (AR 2000EX, TA Instruments, New Castle,DE, USA). A small volume (∼2 mL) of the solution was used forthe measurement. The flow test was performed at a constanttemperature of 25 °C and a frequency of 0.01 s−1.
Results and discussion
Mechanical processing of chitin is a known process, but it hasbeen limited to BM. In order to effectively utilize chitin cryo-
grinding, information on the effect of cryogrinding conditionson the final properties of the polymer is essential. The criticalproperties include structural transformation, crystallinity,crystal size, thermal properties, and polymer quality, which ismeasured by its molecular weight (Mw) and degree of acetyl-ation (%DA).44 In this context, a comparison of BM and cryo-grinding is also of interest.
Effect of cryogrinding conditions on particle morphology andmicrostructure of chitin
Commercial practical grade chitin powder, pre-dried in 50 °C-oven overnight, was cryoground using a cryogenic freezer mill(see Experimental). For this, polycarbonate vessels equippedwith magnetically-driven 440C high carbon martensitic steelimpactors were filled with chitin, chilled in liquid nitrogen,and then ground (in dry state) at cryogenic temperature for 3,6, 12 and 24 cycles (12, 24, 48 and 96 min grinding time,respectively). These samples were abbreviated as C0 (startingmaterial), C3, C6, C12 and C24.
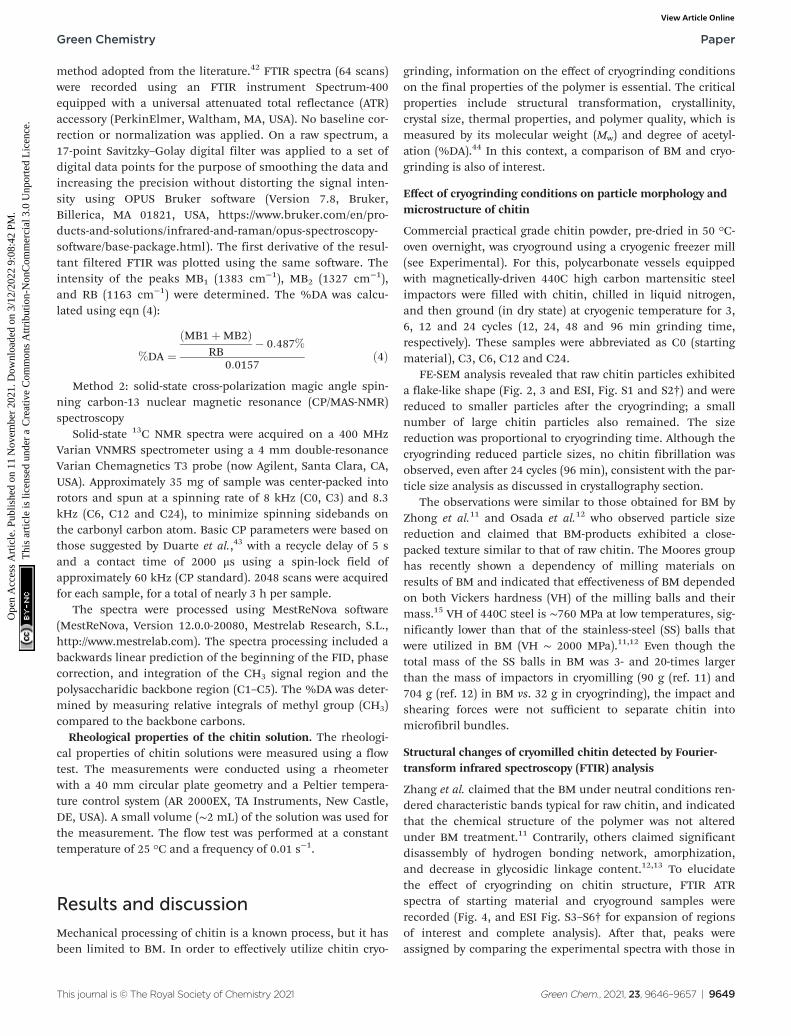
FE-SEM analysis revealed that raw chitin particles exhibiteda flake-like shape (Fig. 2, 3 and ESI, Fig. S1 and S2†) and werereduced to smaller particles after the cryogrinding; a smallnumber of large chitin particles also remained. The sizereduction was proportional to cryogrinding time. Although thecryogrinding reduced particle sizes, no chitin fibrillation wasobserved, even after 24 cycles (96 min), consistent with the par-ticle size analysis as discussed in crystallography section.
The observations were similar to those obtained for BM byZhong et al.11 and Osada et al.12 who observed particle sizereduction and claimed that BM-products exhibited a close-packed texture similar to that of raw chitin. The Moores grouphas recently shown a dependency of milling materials onresults of BM and indicated that effectiveness of BM dependedon both Vickers hardness (VH) of the milling balls and theirmass.15 VH of 440C steel is ∼760 MPa at low temperatures, sig-nificantly lower than that of the stainless-steel (SS) balls thatwere utilized in BM (VH ∼ 2000 MPa).11,12 Even though thetotal mass of the SS balls in BM was 3- and 20-times largerthan the mass of impactors in cryomilling (90 g (ref. 11) and704 g (ref. 12) in BM vs. 32 g in cryogrinding), the impact andshearing forces were not sufficient to separate chitin intomicrofibril bundles.
Structural changes of cryomilled chitin detected by Fourier-transform infrared spectroscopy (FTIR) analysis
Zhang et al. claimed that the BM under neutral conditions ren-dered characteristic bands typical for raw chitin, and indicatedthat the chemical structure of the polymer was not alteredunder BM treatment.11 Contrarily, others claimed significantdisassembly of hydrogen bonding network, amorphization,and decrease in glycosidic linkage content.12,13 To elucidatethe effect of cryogrinding on chitin structure, FTIR ATRspectra of starting material and cryoground samples wererecorded (Fig. 4, and ESI Fig. S3–S6† for expansion of regionsof interest and complete analysis). After that, peaks wereassigned by comparing the experimental spectra with those in
Green Chemistry Paper
This journal is © The Royal Society of Chemistry 2021 Green Chem., 2021, 23, 9646–9657 | 9649
Ope
n A
cces
s A
rtic
le. P
ublis
hed
on 1
1 N
ovem
ber
2021
. Dow
nloa
ded
on 3
/12/
2022
9:0
8:42
PM
. T
his
artic
le is
lice
nsed
und
er a
Cre
ativ
e C
omm
ons
Attr
ibut
ion-
Non
Com
mer
cial
3.0
Unp
orte
d L
icen
ce.
View Article Online
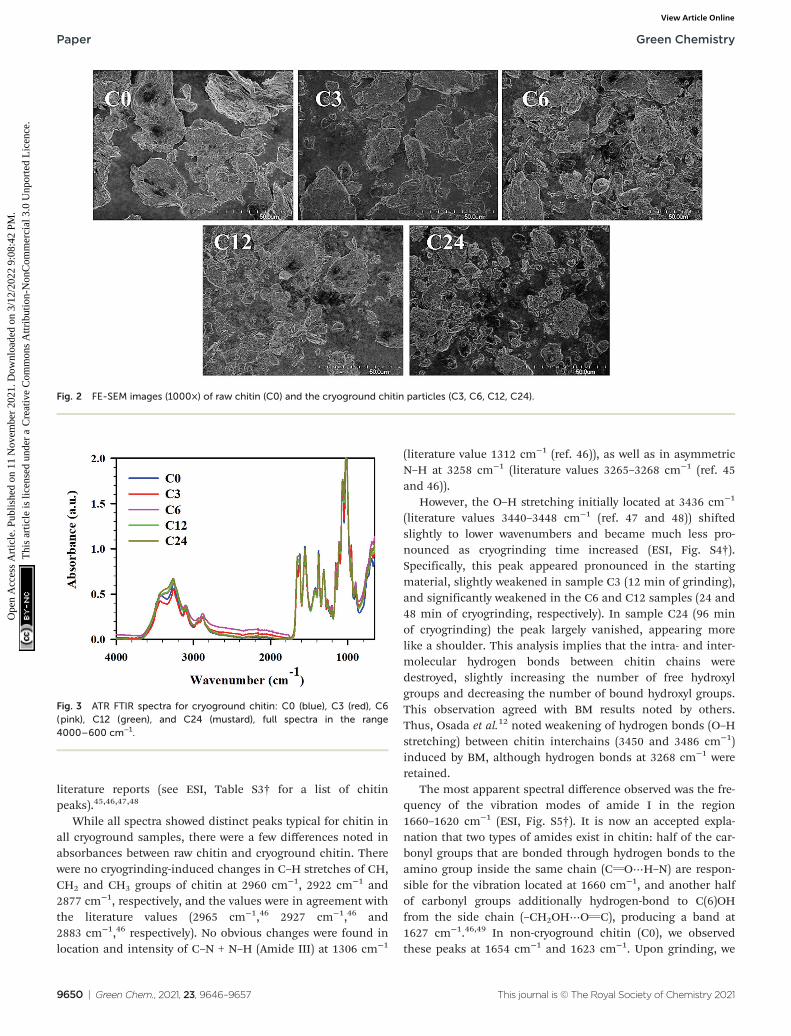
literature reports (see ESI, Table S3† for a list of chitinpeaks).45,46,47,48
While all spectra showed distinct peaks typical for chitin inall cryoground samples, there were a few differences noted inabsorbances between raw chitin and cryoground chitin. Therewere no cryogrinding-induced changes in C–H stretches of CH,CH2 and CH3 groups of chitin at 2960 cm−1, 2922 cm−1 and2877 cm−1, respectively, and the values were in agreement withthe literature values (2965 cm−1,46 2927 cm−1,46 and2883 cm−1,46 respectively). No obvious changes were found inlocation and intensity of C–N + N–H (Amide III) at 1306 cm−1
(literature value 1312 cm−1 (ref. 46)), as well as in asymmetricN–H at 3258 cm−1 (literature values 3265–3268 cm−1 (ref. 45and 46)).
However, the O–H stretching initially located at 3436 cm−1
(literature values 3440–3448 cm−1 (ref. 47 and 48)) shiftedslightly to lower wavenumbers and became much less pro-nounced as cryogrinding time increased (ESI, Fig. S4†).Specifically, this peak appeared pronounced in the startingmaterial, slightly weakened in sample C3 (12 min of grinding),and significantly weakened in the C6 and C12 samples (24 and48 min of cryogrinding, respectively). In sample C24 (96 minof cryogrinding) the peak largely vanished, appearing morelike a shoulder. This analysis implies that the intra- and inter-molecular hydrogen bonds between chitin chains weredestroyed, slightly increasing the number of free hydroxylgroups and decreasing the number of bound hydroxyl groups.This observation agreed with BM results noted by others.Thus, Osada et al.12 noted weakening of hydrogen bonds (O–Hstretching) between chitin interchains (3450 and 3486 cm−1)induced by BM, although hydrogen bonds at 3268 cm−1 wereretained.
The most apparent spectral difference observed was the fre-quency of the vibration modes of amide I in the region1660–1620 cm−1 (ESI, Fig. S5†). It is now an accepted expla-nation that two types of amides exist in chitin: half of the car-bonyl groups that are bonded through hydrogen bonds to theamino group inside the same chain (CvO⋯H–N) are respon-sible for the vibration located at 1660 cm−1, and another halfof carbonyl groups additionally hydrogen-bond to C(6)OHfrom the side chain (–CH2OH⋯OvC), producing a band at1627 cm−1.46,49 In non-cryoground chitin (C0), we observedthese peaks at 1654 cm−1 and 1623 cm−1. Upon grinding, we
Fig. 3 ATR FTIR spectra for cryoground chitin: C0 (blue), C3 (red), C6(pink), C12 (green), and C24 (mustard), full spectra in the range4000–600 cm−1.
Fig. 2 FE-SEM images (1000×) of raw chitin (C0) and the cryoground chitin particles (C3, C6, C12, C24).
Paper Green Chemistry
9650 | Green Chem., 2021, 23, 9646–9657 This journal is © The Royal Society of Chemistry 2021
Ope
n A
cces
s A
rtic
le. P
ublis
hed
on 1
1 N
ovem
ber
2021
. Dow
nloa
ded
on 3
/12/
2022
9:0
8:42
PM
. T
his
artic
le is
lice
nsed
und
er a
Cre
ativ
e C
omm
ons
Attr
ibut
ion-
Non
Com
mer
cial
3.0
Unp
orte
d L
icen
ce.
View Article Online
detected a decrease in the amide I band at 1623 cm−1, indicat-ing the disruption of hydrogen-bonding between carbonylgroups and –C(6)OH from the side chain. Thus, samples C0and C3 demonstrated two separate, clearly distinguishablepeaks at 1654 cm−1 and 1623 cm−1, implying a higher degreeof crystallinity, while samples C6 and C12 revealed a slightconverging of these peaks and respective change in intensity,implying partial amorphization.50 Sample C24 exhibited asingle band at 1656 cm−1. This observation is similar to BM.Thus, Margoutidis et al.13 reported the change in the ratiobetween the absorbance intensity at 1623 and 1654 cm−1 forBM-chitin and noted that the ratio and intensity of thesepeaks depended on milling time. A significant drop in thisratio was observed after 75 min of BM, and was indicative ofhydrogen-bonding network weakening. Osada et al.12 alsoreported partial amorphization under BM.
Multiple peaks were seen within the region1020–1160 cm−1 and were associated with vibration modes of
C–OH, C–O–C and C–C bonds (ESI, Fig. S6†).50 Thus, C–O–Cring asymmetric bridge stretching was located at 1154 cm−1
(literature value 1156–1157 cm−1 (ref. 46 and 50)). The inten-sity of this band decreased insignificantly upon cryomilling(C0 > C3 > C6 > C12 ∼ C24), indicating that cryomilling causedthe breaking of glycosidic bonds in chitin chains to someextent. Importantly, the intensity of this peak was similar inC12 and C24. Interestingly, C–H deformation of theβ-glycosidic bond at 895 cm−1 (literature 895–896 cm−1 (ref. 46and 47)) demonstrated no identifiable trend.
The peaks at 1113 cm−1, 1025 cm−1 and 1068 cm−1 belongto various C–OH stretching of hydroxyl groups.51,52 Theabsorption band at 1025 cm−1 (C5–OH stretching) intensifiedand became more pronounced with an increase of grindingtime while a peak at 1068 cm−1 (C3–OH stretching) slightlyshifted to a lower wavenumber with an increase of grindingtime. The same scenario was observed for a band located at1113 cm−1 (asymmetric in phase ring stretching53) where C6,C12 and C24 demonstrated a more prominent peak than C0and C3 did. Contrarily, the peak at 1010 cm−1 known to beC–O asymmetric stretch in phase ring,53 decreased in intensitywith increase of time of cryogrinding; the same was true forCH3 wagging at 952 cm−1.47 All of this was attributed toenvironmental changes around these bonds due to glycosidicbond breaking. Overall, the results were consistent with thosereported for BM: hydrogen bonding network breakage, partialamorphization, and glycosidic linkage breakage.12,13
To conclude, the most evident spectral features used toanalyze the extent of amorphization in chitin is the change inthe ratio and the intensity of amide I CvO vibration modes at∼1660 and ∼1623 cm−1, respectively while the decrease ofC–O–C ring asymmetric bridge stretching (1154 cm−1) is typicallyindicative of the glycosidic bonds breaking in chitin chains.Zhong et al.11 showed no difference in the ratio or intensity of∼1660/∼1623 cm−1 peaks between raw chitin and BM chitin,nor it demonstrated a decrease of the intensity of the peak at1154 cm−1. However, no expansion of these specific regions,absence of spectra normalization, and somewhat differenttechnique (spectra recorded using pellets made of potassiumbromide (KBr) and chitin) made it difficult to either agree withor argue against the conclusion made by the authors.Contrarily, the spectra published by Osada et al. clearly indi-cated that BM resulted in amorphization while the study didnot look at the glycosidic bond breaking. Data obtained byMargoutidis et al.13 demonstrated both amorphization andbreaking of glycosidic bonds.
Principal component analysis
Principal component analysis (PCA) is frequently used for datareduction and analysis of high-dimensional data sets. Duringthis analysis, a smaller set of principal components (PC) isobtained. It explains the variability on the data through cre-ation of a new sub-space defined by PCs, and is easier to inter-pret than original data. In this study, PCA was applied to theFTIR spectra of the set of cryoground chitin samples, and PCAwas applied to reveal differences between the samples and
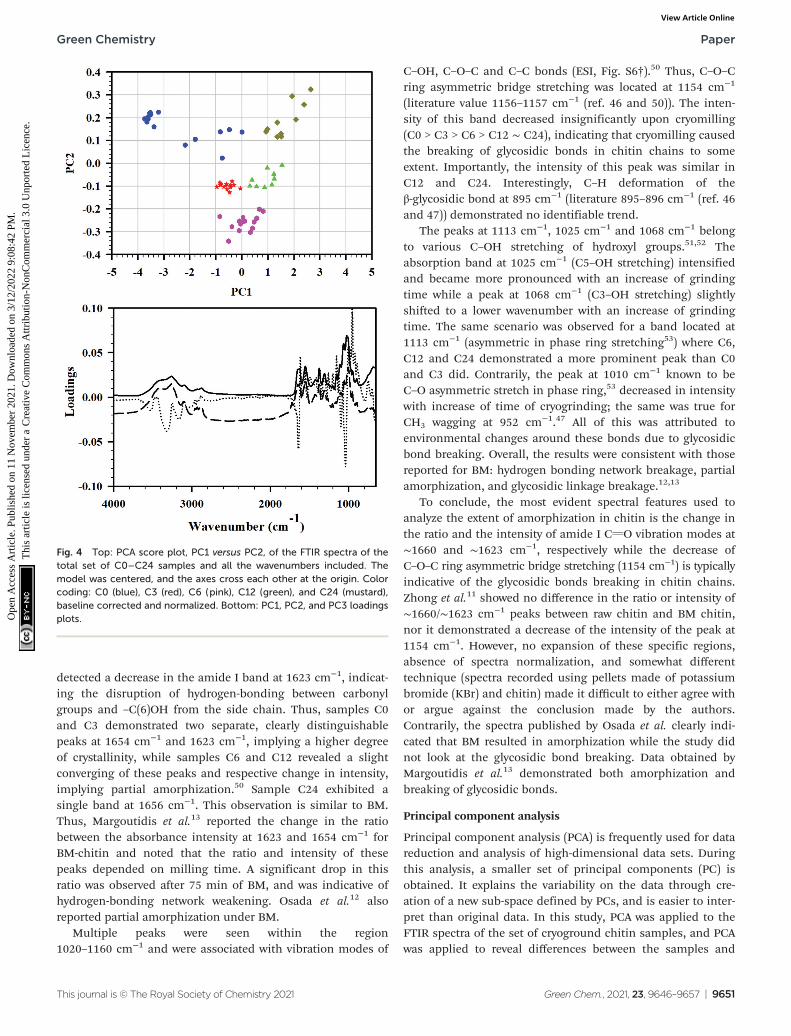
Fig. 4 Top: PCA score plot, PC1 versus PC2, of the FTIR spectra of thetotal set of C0–C24 samples and all the wavenumbers included. Themodel was centered, and the axes cross each other at the origin. Colorcoding: C0 (blue), C3 (red), C6 (pink), C12 (green), and C24 (mustard),baseline corrected and normalized. Bottom: PC1, PC2, and PC3 loadingsplots.
Green Chemistry Paper
This journal is © The Royal Society of Chemistry 2021 Green Chem., 2021, 23, 9646–9657 | 9651
Ope
n A
cces
s A
rtic
le. P
ublis
hed
on 1
1 N
ovem
ber
2021
. Dow
nloa
ded
on 3
/12/
2022
9:0
8:42
PM
. T
his
artic
le is
lice
nsed
und
er a
Cre
ativ
e C
omm
ons
Attr
ibut
ion-
Non
Com
mer
cial
3.0
Unp
orte
d L
icen
ce.
View Article Online
identify the main sources of variation in the spectra. Threeprincipal components were enough to explain 98% differencesamong the samples.
In the PCA score plot, the complete data matrix wasmodeled and included all the samples (10–15 FTIRs of C0–C24each) and all the wavenumbers. The score plot of PC1 versusPC2 (Fig. 4, top) showed a distinct clustering of the samplesthat was related to cryogrinding time. Group A which consistedexclusively of starting material C0 before cryogrinding (n = 15)was located toward the negative side of PC1 and the positiveside of PC2 and clearly had spectra deviating considerablyfrom all other groups. Cluster B, which contained solely C3-points, was situated near the origin of the model, slightlytoward the negative side of both PC1 and PC2 (group B, n =14). Similarly, cluster C (n = 15) was comprised entirely of C6and was located toward the more negative side of PC2. ClusterD (n = 10) that entailed C12 points exclusively was found nearorigin toward the positive side of PC1 and the negative side ofPC2. Finally, cluster E, consisted exclusively of C24, was dis-tinctively positioned on the positive sides of PC1 and PC2 (n =10), away from the other samples. Clusters B, C, and D wererelatively close to each other, while clusters A and D were dis-tinctively set apart. Such difference was attributed to strongintramolecular O–H bonding, its weakening in C3, C6, andC12, and the full breaking of this bonding in C24. It was alsodependent on the extent of amorphization and the extent ofbreaking of glycosidic bonds in chitin chains.
This is in line with the observation that the PC1, PC2, andPC3 loadings plots showed particularly high loadings forseveral wavenumbers in the regions from 3500 to 3200 cm−1
(O–H stretching), 1650 to 1600 cm−1 (CvO stretching of amideI), and 1200 to 900 cm−1 (C–O–C and C–O stretching) as illus-trated in Fig. 4, bottom, confirming the interpretation of FTIRresults.
Changes in crystalline structure of cryomilled chitin
To obtain the crystallinity index (CrI) of the samples, powderX-ray diffractograms were recorded and are presented in Fig. 5.All diffractograms showed six peaks prominent for α-chitin, at2θ 9.24, 12.69, 19.23, 20.58, 23.18, and 26.27°.39,54,55 Thesepeaks corresponded to the crystalline planes of (020), (021),(110), (120), (130), and (013), suggesting a typical α-chitin crys-talline structure.11,56,57 Less pronounced peaks were located at2θ 27.86 and 39.20°.
As seen in the pXRD patterns of cryomilled chitin, therewere noticeable changes in crystallinity (crystallinity index,CrI) after chitin processing; these changes depended on pro-cessing time. First, we conducted an evaluation of CrI by thepeak height method, comparing the relative intensities of crys-talline (2θ 19.2°) vs. amorphous peak of the same unit (2θ12.6°), as reported by Cardenas et al.,47 or with a baselineheight (2θ 16.0°) as reported by Kaya et al.39 However, sinceintensities of the amorphous peak (or baseline height) weresimilar for all samples but C24, crystallinity indices calculatedby this method were nearly identical for C0–C12 (see ESI,Table S6†).
Yet, as it could be seen from Fig. 5, the total area under thediffractograms noticeably increased with cryogrinding timeclearly indicating the reduction in crystallinity and followingthe order C0 ∼ C3 < C6 ∼ C12 < C24. This discrepancy couldbe a result of the fact that the single highest peak (110) at19.2° was used in the calculation of CrI, while contributionsfrom the other five crystalline peaks were excluded. Besides,peaks in the diffractogram were relatively broad and variedconsiderably in their width, resulting in comparison of intensi-ties to be an inaccurate measure of the polymer’scrystallinity.58
Hence, we turned our attention to the second method, peakdeconvolution,59,60 for a crystallinity evaluation. After peakfitting (ESI, Fig. S7–S11†), CrI was calculated as the ratio ofsum of the areas under the crystalline diffraction peaks andthe total area under the diffraction pattern, respectively (seeESI, Table S6† for peak areas). Thus, samples C0 and C3 hadsimilar crystallinity values (CrI 68 ± 0.2%), samples C6 andC12 were slightly less crystalline (CrI 58 ± 2%), and the sampleC24 had the lowest crystallinity (CrI 51 ± 1%). The diffracto-gram of C24 was distinctive from the rest in that the peak at12.6° had a significantly larger area than the same peak in allother samples. The method resulted in significantly lower CrIvalues (∼20–30%) than peak height method, as was alreadyshown for cellulose.58
Such peak broadening and significant decrease of crystalli-nity during cryogrinding was previously noted by Liang et al.;23
however, diffractograms reported in this study were recordedin the narrow range of 2θ 20–50° and excluded three of themost prominent crystalline peaks in (020), (021), and (110)planes from consideration. Comparing the crystallinity ofchitin after cryogrinding with that after BM, we noticed a highdependency on size and mass of the grinding balls.11,15 Thus,Margoutidis et al. reported the CrI decrease from 91% to 51%by BM with 2 × ∅ 12.7 mm (17 g) balls and to 37% by BM with
Fig. 5 pXRD difractogramms for cryoground chitin: C0 (blue), C3 (red),C6 (pink), C12 (green), and C24 (mustard), baseline corrected andnormalized.
Paper Green Chemistry
9652 | Green Chem., 2021, 23, 9646–9657 This journal is © The Royal Society of Chemistry 2021
Ope
n A
cces
s A
rtic
le. P
ublis
hed
on 1
1 N
ovem
ber
2021
. Dow
nloa
ded
on 3
/12/
2022
9:0
8:42
PM
. T
his
artic
le is
lice
nsed
und
er a
Cre
ativ
e C
omm
ons
Attr
ibut
ion-
Non
Com
mer
cial
3.0
Unp
orte
d L
icen
ce.
View Article Online
16 × ∅ 6.35 mm (16 g) balls, during a 90-min time period.13
Osada et al. reported a gradual decrease of the crystallinitywith increasing BM-time: from 91 to 68% after BM with 1400 ×∅ 5 mm (704 g) chromium steel balls for 10 min, and to 40%after BM with the same number and type of balls for 30 min.DiNardo et al. demonstrated a crystallinity decrease from 67 to27–34%, after BM with 1 × ∅ 5.53–12.64 mm (0.7–8.4 g) SSballs.15 Zhong et al. who used BM with 14 × ∅ 10 mm and 38 ×∅ 6.25 mm (total mass 90 g) SS balls reported complete amor-phization of chitin.11
The crystallite size values were calculated using Scherrer’sequation.56 Cryogrinding had no impact on the destruction ofthe plane (110) and slightly impacted plane (020). Thus, nodecrease in the average sizes of the crystalline regions(∼84 nm) was detected in (110) direction, while there was a∼15% decrease in crystallite size in the (020) direction, from73 to 63 nm (Table S7†). Osada et al.12 reported a ∼20%decrease in crystallite size (110), from ∼11 to 9 nm, after10 min of BM time, and to ∼3 nm after 30 min of BM time.
Degree of acetylation (%DA) and molecular weight
The most important properties of chitin are the Mw and %DA.Chitin is made of repeated β-(1→4)-linked N-acetyl-D-glucos-amine units. When more than 50% of N-acetyl residues in apolymer are cleaved with the formation of β-(1→4)-linkedD-glucosamine, the polymer is called chitosan.61
Quantitatively, the %DA represents the proportion of chitosanunits with respect to the total number of units. Extent of dea-cetylation brought about by polymer processing conditions
depends on variations in chitin sources, its Mw, crystallinity,types of crystal morphologies, etc.
For the determination of %DA FTIR has been used by manythrough the application of empirical equations,62 frequentlycombined with titration.63 According to Alvarenga, all FTIRmethods are only useful in the 45–100 %DA range.61 We haveused the method of Beil et al. for %DA determination basedon first derivative ATR FTIR spectroscopy (ESI, Fig. S12–S16and Table S9†).42 The %DA was determined to be ∼82 ± 3% forboth the starting material and all the cryoground samples,suggesting that no deacetylation took place during processing.This agrees with the results of BM reported by Margoutidiset al.13 who did not observe any deacetylation.
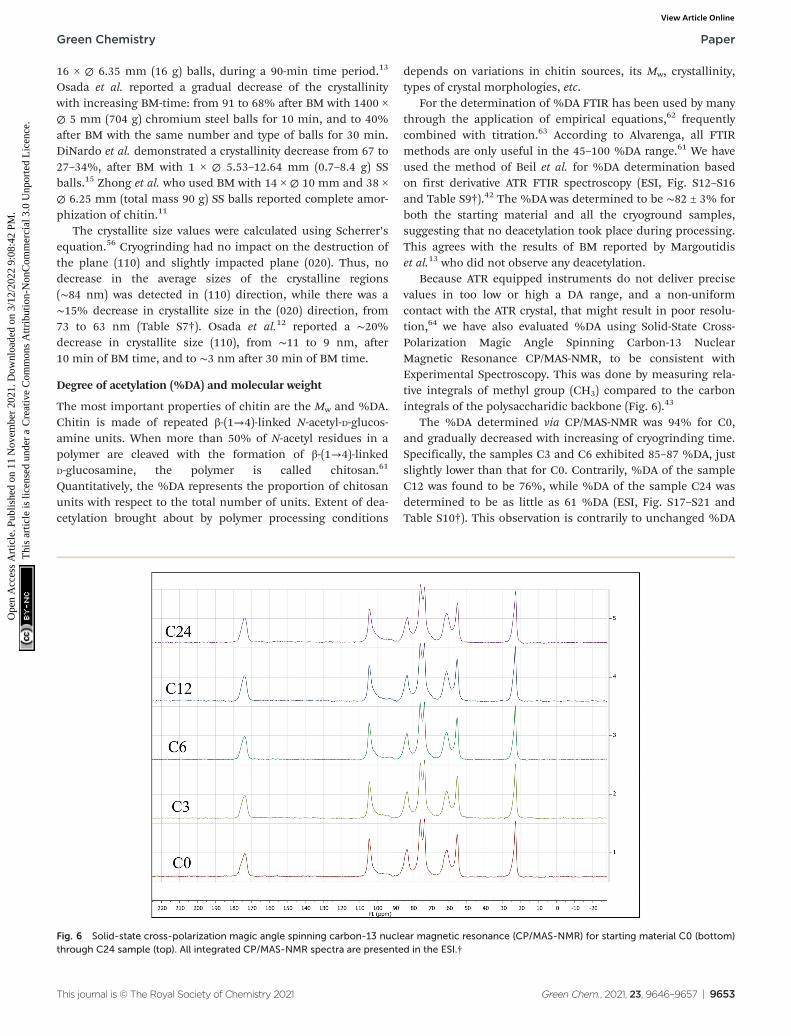
Because ATR equipped instruments do not deliver precisevalues in too low or high a DA range, and a non-uniformcontact with the ATR crystal, that might result in poor resolu-tion,64 we have also evaluated %DA using Solid-State Cross-Polarization Magic Angle Spinning Carbon-13 NuclearMagnetic Resonance CP/MAS-NMR, to be consistent withExperimental Spectroscopy. This was done by measuring rela-tive integrals of methyl group (CH3) compared to the carbonintegrals of the polysaccharidic backbone (Fig. 6).43
The %DA determined via CP/MAS-NMR was 94% for C0,and gradually decreased with increasing of cryogrinding time.Specifically, the samples C3 and C6 exhibited 85–87 %DA, justslightly lower than that for C0. Contrarily, %DA of the sampleC12 was found to be 76%, while %DA of the sample C24 wasdetermined to be as little as 61 %DA (ESI, Fig. S17–S21 andTable S10†). This observation is contrarily to unchanged %DA
Fig. 6 Solid-state cross-polarization magic angle spinning carbon-13 nuclear magnetic resonance (CP/MAS-NMR) for starting material C0 (bottom)through C24 sample (top). All integrated CP/MAS-NMR spectra are presented in the ESI.†
Green Chemistry Paper
This journal is © The Royal Society of Chemistry 2021 Green Chem., 2021, 23, 9646–9657 | 9653
Ope
n A
cces
s A
rtic
le. P
ublis
hed
on 1
1 N
ovem
ber
2021
. Dow
nloa
ded
on 3
/12/
2022
9:0
8:42
PM
. T
his
artic
le is
lice
nsed
und
er a
Cre
ativ
e C
omm
ons
Attr
ibut
ion-
Non
Com
mer
cial
3.0
Unp
orte
d L
icen
ce.
View Article Online
in BM reports,13,14 that claimed that mechanical force alonewas not able to induce deacetylation. It appears that extendedcryogrinding results in breaking of NH–C(O) bond.
High energy milling methods, such as the use of a BMprocess, were previously reported to significantly (2–3 times)decrease molecular weight (Mw) of chitin.
12,15 Thus, we set toevaluate whether cryogrinding decreased the Mw and to whatextent. While synthetic polymers are soluble in volatile organicsolvents (VOCs), chitin is not, and various solvent systems areemployed for its dissolution. A typical solvent system for chitinis N,N-dimethylacetamide/lithium chloride (DMAc/LiCl),65–67
which is a classic solvent system used in the literature for Mw
determination. However, despite numerous attempts, DMAc/LiCl (8% w/v) did not allow complete dissolution of chitinsamples, an issue that was previously reported.12,16 While formaterial preparation incomplete dissolution of the polymerdoes not present an issue, for Mw determination it is criticalthat all chitin is dissolved; otherwise any measurement wouldresult in an erroneous value.
Considering that the value of Mw was not a purpose in thiswork, we set to compare relative viscosities of the samples, toelucidate any differences in Mw. For that, we measured therheological properties of 1 wt% chitin solutions in ionic liquid1-ethyl-3-methylimidazolium acetate [C2mim][OAc]. The flowcurves were plotted (3–5 replicates for each sample, ESI,Fig. S22†), and statistical analysis showed no significant differ-ences between them, indicating no decrease in Mw value.
Thermal properties
Thermal properties were studied using Thermal GravimetricAnalysis (TGA). TGA curves and differential thermogravimetry(DTG) thermograms for chitin are shown in ESI, Fig. S23 andS24.† It could be seen that there were three weight loss inter-vals in TGA curves of C0–C24 samples. The first characteristicweight loss, at 49–51 °C, corresponded to the evaporation ofphysically adsorbed and strongly hydrogen-bonded water tochitin.68 The samples contained 9–11% water (Table 1) andthe ability of cryoground samples to absorb water of thesamples increased with amount of grinding time.
The onset temperature (Tonset) for C0 decomposition wasobserved at 292.5 °C (Table 1). All other samples exhibitedTonset at temperature slightly higher than that for C0. Thus,Tonset for C3, C12, C24, and C6 was observed at 298.1, 302.5,298.0, and 303.1 °C, respectively. The decomposition of thechitin polymer was a two-step decomposition in all cases. Thefirst step was attributed to the depolymerization/decompo-sition of polymer chains through deacetylation and cleavage ofglycosidic linkage, and the second step was attributed to thethermal destruction of the pyranose ring.69 Because thesepeaks were close to each other in the DTG plots, individualpeaks were extracted by a curve-fitting process from the ther-mogram profiles using a peak fitting feature in Origin (https://www.originlab.com/), assuming Gaussian functions for eachpeak (ESI, Fig. S25–S29†).
Thus, T1 50% was significantly higher for cryogroundsamples C3–C24 (∼349–352 °C) than for the starting material
C0 (∼326 °C). Specifically, the value of T1 50% was approximatelythe same for all cryoground samples 348.9 (C3), 353.4 (C6),346.4 (C12), and 351.6 °C (C24). The second step decomposition(T2 50%) took place at 370.8 °C for the starting material andincreased to ∼390 °C for the cryoground samples. Namely, T250% was found to be 391.6, 393.2, 390.2, and 388.6 for C12–C24,respectively. The amount of ash was very similar between allsamples and varied from 13% in C0 to 16.5% in C3.
In the case of α-chitin, the decomposition temperature at10 °C min−1 decomposition rate was reported to be 396.6 °C,70
with the sample degrading in two steps, but it was lower in thecase of our starting material. It has also been reported byZhong et al.11 that chitin ball-milled with SS balls (14 × ∅10 mm + 38 × ∅ 6.25 mm, 90 g) displayed two stages of weightloss, at ∼270 °C and 390.6 °C. Other studies did not report thethermal decomposition data.
Conclusions
The work reported here suggests that the cryogrinding methodis suitable for chitin polymer processing. With this study, wedemonstrated the morphological, crystalline, and structuralchanges in chitin after cryomilling, and compared it with BM-grinding (Table 2). It was found that similarly to BM, a sizereduction takes place during cryogrinding. FTIR analysisshowed a significant breaking of intra- and intermolecularhydrogen bonds and partial amorphization, with the extent ofamorphization proportional to cryogrinding time. The crystalli-nity, determined from the ratio of the sum of the areas underthe crystalline diffraction peaks and the total area under thediffraction pattern, was found to be 51%, somewhat higherthan that typically obtained through BM (27–51%), whichmight be explained by the relatively low mass of the 440C steelimpactor. The crystallite size in plane (110) was determined tobe 84.5 nm and was not affected by cryogrinding while thecrystal size in plane (020) decreased ∼15%, from 73 to 63 nm.
The study also demonstrated that the method of chitingrinding dramatically affected two main characteristics ofchitin, which are its Mw and DA. From this viewpoint, Kimet al.71 and Mao et al.72 have extensively reviewed existinginformation on the influence of chitin and/or chitosan pro-perties, specifically, Mw and DA, on the performance of thedelivery systems. Our study showed that while DA was notaffected by BM, it continuously reduced during cryogrinding.Likewise, chitin of high Mw could not be obtained from BM,but only from cryogrinding, greatly expanding chitin’s poten-tial applications.
In relation to Green Chemistry process, relatively recentarticle73 evaluated technological aspects of cryomilling such asits environmental impact, scale-up potential, and potentialapplications. It has been shown that from the point of GreenChemistry principles, the cryomilling is an eco-friendlyprocess, and that the large-scale cryogrinding can be utilizedin different applications, especially those that involve tempera-ture-sensitive materials (i.e., drug delivery vehicles, matrices
Paper Green Chemistry
9654 | Green Chem., 2021, 23, 9646–9657 This journal is © The Royal Society of Chemistry 2021
Ope
n A
cces
s A
rtic
le. P
ublis
hed
on 1
1 N
ovem
ber
2021
. Dow
nloa
ded
on 3
/12/
2022
9:0
8:42
PM
. T
his
artic
le is
lice
nsed
und
er a
Cre
ativ
e C
omm
ons
Attr
ibut
ion-
Non
Com
mer
cial
3.0
Unp
orte
d L
icen
ce.
View Article Online
loaded with pesticides, etc.). The process utilizes liquid nitro-gen, economical and efficient coolant, which is eco-friendly asit turns into non-toxic and abundant N2 gas. The major inputraw materials in cryomilling are coolant, and millingmaterials. The processing cost of this technique consists of theelectricity cost and the cost of liquid coolant. As research into
this area continues to progress, cryogenic grinding is gainingrecognition as an efficient alternative for biopolymer proces-sing that meets the demands of today’s industry.
When we know how chitin is behaving under this process,and what changes in its properties we can expect – we nowhave enough information and are at starting point for the
Table 2 Comparison of cryogrinding results with those obtained by BM
Analysis Cryogrinding
Ball milling
Ref.Conditions Results
Morphology No chitin morphological changes other thansize reduction
14 × ∅ 10 mm + 38 ×∅ 6.25 mm (90 g)
Close-packed texture similar to that ofraw chitin
11
1400 × ∅ 5 mm (704 g) Size reduction observed after10 minutes
12
FTIR-ATRspectroscopy
1. Breaking intra- and intermolecular hydrogenbonds
14 × ∅ 10 mm + 38 ×∅ 6.25 mm (90 g)
Chemical structure of the polymerwas not altered
11
2. Extent of amorphization proportional tocryogrinding time
16 × ∅ 6.35 mm (16 g),90 min
1. Weakening of the hydrogenbonding
13
3. Insignificant breaking of glycosidic bondsafter 48 minutes of cryogrinding
2. Partial amorphization
3. Glycosidic linkage breaking1400 × ∅ 5 mm (704 g) 1. Weakening of hydrogen bonds
between chitin interchains12
2. Partial amorphizationCrystallinestructure
Decreased from 68 to 51% 14 × ∅ 10 mm + 38 ×∅ 6.25 mm (90 g)
Complete amorphization 11
1400 × ∅ 5 mm (704 g),10 min
Decreased from 91 to 68% 12
1400 × ∅ 5 mm (704 g),30 min
Decreased from 91 to 40% 12
2 × ∅ 12.7 mm (17 g),90 min
Decreased from 91 to 51% 13
16 × ∅ 6.35 mm (16 g),90 min
Decreased from 91 to 37% 13
1 × ∅ 5.53–12.64 mm(0.7–8.4 g)
Decreased from 66 to 34% 15
Crystallite size(110)
Size of 84.5 nm did not change 1400 × ∅ 5 mm (704 g),30 min
Size decrease from 10.7 to 8.8 nm 12
Crystallite size(020)
A slight decrease in crystallite size in (020)direction, from 73 to 63 nm
— —
Deacetyl. degree Gradual decrease in %DA, from 91% (C0) to61% (C24)
16 × ∅ 6.35 mm (16 g),90 min
No change in %DA 13
MW No change in MW 1 × ∅ 5.53–12.64 mm(0.7–8.4 g)
Significant decrease of Mw 15
1400 × ∅ 5 mm (704 g),30 min
Significant decrease of Mw 12
Thermalproperties
T1 50% ∼ 350, T2 50% ∼ 390 °C 14 × ∅ 10 mm + 38 ×∅ 6.25 mm (90 g)
T1 50% ∼ 270, T2 50% ∼ 390 °C 11
Table 1 Thermal properties of cryoground samples C0–C24 and comparison with reported data for BM
% water Tonset, °C T1 50%, °C Ttransition, °C T2 50%, °C Ref.
C0 7.6 292.5 326.2a 342.9 370.8 This workC3 8.5 298.1 348.9a 366.2 391.6 This workC6 9.0 302.5 353.4a 366.2 393.2 This workC12 9.4 297.9 346.4 366.2 390.2 This workC24 11.0 303.1 351.6 371.4 388.6 This workα-Chitin —b —b —b —b 396.6 70α-Chitin —b —b ∼340.0c ∼350.0c ∼380.0c 69BM α-chitin —b —b 270.0 390.6 11
a Individual peaks were extracted by a curve-fitting process from the thermogram profiles using a peak fitting feature in Origin (https://www.origi-nlab.com/), assuming Gaussian functions for each peak. bNot reported. c Elucidated from reported thermogram.
Green Chemistry Paper
This journal is © The Royal Society of Chemistry 2021 Green Chem., 2021, 23, 9646–9657 | 9655
Ope
n A
cces
s A
rtic
le. P
ublis
hed
on 1
1 N
ovem
ber
2021
. Dow
nloa
ded
on 3
/12/
2022
9:0
8:42
PM
. T
his
artic
le is
lice
nsed
und
er a
Cre
ativ
e C
omm
ons
Attr
ibut
ion-
Non
Com
mer
cial
3.0
Unp
orte
d L
icen
ce.
View Article Online
preparation of respective composites with temperature-labilematerials (volatiles, pharmaceutical actives, DNA and siRNA,etc.). We believe that these findings will be useful in designingfurther cryogrinding strategies in the production of chitincomposites and blends. In this context, the application of cryo-grinding can be advantageous in establishing strategies forchitin processing aligned with the Green Chemistry principles.
Conflicts of interest
The authors declare the following interest(s):Dr J. L. Shamshina is a former employee of 525 Solutions, Inc.,and a former employee of Mari Signum, Ltd.
References
1 S.-K. Kim, Chitin, chitosan, oligosaccharides and their deriva-tives: biological activities and applications, CRC Press, 2010.
2 B. K. Park and M. M. Kim, Int. J. Mol. Sci., 2010, 11, 5152–5164.
3 R. Jayakumar, D. Menon, K. Manzoor, S. V. Nair andH. Tamura, Carbohydr. Polym., 2010, 82, 227–232.
4 J. L. Shamshina, P. Berton and R. D. Rogers, ACSSustainable Chem. Eng., 2019, 7, 6444–6457.
5 K. J. Ardila-Fierro and J. G. Hernández, ChemSusChem,2021, 14, 2145–2162.
6 T. Friščić, C. Mottillo and H. M. Titi, Angew. Chem., 2020,59, 1018–1029.
7 A. Calka and D. Wexler, Nature, 2002, 419, 147–151.8 J. L. Howard, Q. Cao and D. L. Browne, Chem. Sci., 2018, 9,
3080–3094.9 J. C. Roy, F. Salaün, S. Giraud and A. Ferri, Solubility of
Chitin: Solvents, Solution Behaviors and Their RelatedMechanisms, InTechOpen, 2017, pp. 109–127.
10 X. Chen, H. Yang, Z. Zhong and N. Yan, Green Chem., 2017,19, 2783–2792.
11 T. Zhong, M. P. Wolcott, H. Liu, N. Glandon and J. Wang,Cellulose, 2020, 27, 6205–6216.
12 M. Osada, C. Miura, Y. S. Nakagawa, M. Kaihara, M. Nikaidoand K. Totani, Carbohydr. Polym., 2013, 92, 1573–1578.
13 G. Margoutidis, V. H. Parsons, C. S. Bottaro, N. Yan andF. M. Kerton, ACS Sustainable Chem. Eng., 2018, 6, 1662–1669.
14 T. Di Nardo, C. Hadad, V. N. A. Nguyen and A. Moores,Green Chem., 2019, 21, 3276–3285.
15 T. Di Nardo and A. Moores, Beilstein J. Org. Chem., 2019, 15,1217–1225.
16 H. Wineinger, J. L. Shamshina, A. Kelly, C. King andR. D. Rogers, Green Chem., 2020, 22, 3734–3741.
17 J. L. Shamshina and P. Berton, Front. Bioeng. Biotechnol.,2020, 8, 1–14.
18 P. Berton, X. Shen, R. Rogers and J. L. Shamshina, Ind. Eng.Chem. Res., 2019, 58, 19862–19876.
19 X. Shen, Y. Xie, Q. Wang, X. Yi, J. L. Shamshina andR. D. Rogers, Cellulose, 2019, 26, 4005–4019.
20 J. L. Shamshina, P. Berton and R. D. Rogers, ACSSustainable Chem. Eng., 2019, 7, 6444–6457.
21 J. L. Shamshina, O. Zavgorodnya, H. Choudhary, B. Frye,N. Newbury and R. D. Rogers, ACS Sustainable Chem. Eng.,2018, 14713–14722.
22 J. Schmidt, M. Plata, S. Tröger and W. Peukert, PowderTechnol., 2012, 228, 84–90.
23 S. B. Liang, D. P. Hu, C. Zhu and A. B. Yu, Chem. Eng.Technol., 2002, 25, 401–405.
24 A. Chakraborty, M. Sain and M. Kortschot, Holzforschung,2005, 59, 102–107.
25 A. M. Poulose, S. Piccarolo, D. Carbone and S. M. Al-Zahrani, J. Appl. Polym. Sci., 2016, 133, APP.43083.
26 S. Ramesh, L. Lungaro, D. Tsikritsis, E. Weflen, I. V. Riveroand A. P. D. Elfick, J. Appl. Polym. Sci., 2018, 135, APP.46692.
27 K. Kaminski, K. Adrjanowicz, Z. Wojnarowska,K. Grzybowska, L. Hawelek, M. Paluch, D. Zakowiecki andJ. Mazgalski, J. Pharm. Sci., 2010, 7, 2642–2657.
28 K. Adrjanowicz, K. Grzybowska, K. Kaminski, L. Hawelek,M. Paluch and D. Zakowiecki, Philos. Mag., 2011, 91, 1926–1948.
29 T. P. Shakhtshneider, F. Danede, F. Capet, J. F. Willart,M. Decamps, S. A. Myz, E. V. Boldyreva and V. V. Boldyrev,J. Therm. Anal. Calorim., 2007, 89, 699–707.
30 T. P. Shakhtshneider, F. Danede, F. Capet, J. F. Willart,M. Decamps, L. Paccou, E. V. Surov, E. V. Boldyreva andV. V. Boldyrev, J. Therm. Anal. Calorim., 2007, 89, 709–715.
31 A. Penkina, K. Semjonov, M. Hakola, S. Vuorinen, T. Repo,J. Yliruusi, J. Aruvali, K. Kogermann, P. Veski andJ. Heinamaki, Drug Dev. Ind. Pharm., 2016, 42, 378–388.
32 M. Pouzar, A. Krejcova, T. Cernohorsky and K. Peskova,Talanta, 2008, 76, 254–258.
33 M. Benitez-Guerrero, L. A. Perez-Maqueda, R. Artiaga,P. E. Sanchez-Jimenez and J. Pascual-Cosp, J. Nat. Fibers,2017, 14, 26–39.
34 P. Karinkanta, M. Illikainen and J. Niinimaeki,Holzforschung, 2013, 67, 277–283.
35 M. S. Gomes, D. Santos Jr., L. C. Nunes, G. G. Arantes deCarvalho, F. O. Leme and F. J. Krug, Talanta, 2011, 85,1744–1750.
36 A. Penkina, K. Semjonov, M. Hakola, S. Vuorinen, T. Repo,J. Yliruusi, J. Aruvali, K. Kogermann, P. Veski andJ. Heinamaki, Drug Dev. Ind. Pharm., 2016, 42, 378–388.
37 S. Gui, Faming Zhuanli Shenqing, CN106519075A20170322,2017.
38 S. B. Liang, D. P. Hu, C. Zhu and A. B. Yu, Chem. Eng.Technol., 2002, 25, 401–405.
39 M. Kaya, T. Baran, I. Saman, M. A. Ozusaglam,Y. S. Cakmak and A. Menteşet, J. Crustacean Biol., 2014, 34,283–288.
40 P. Scherrer, Nachr. Ges. Wiss. Goettingen, Math.-Phys. Kl.,1918, 26, 98–100.
41 J. I. Langford and A. J. C. Wilson, J. Appl. Crystallogr., 1978,11, 102–113.
42 S. Beil, A. Schamberger, W. Naumann, S. Mauchill andK. van Pee, Carbohydr. Polym., 2012, 87, 117–122.
Paper Green Chemistry
9656 | Green Chem., 2021, 23, 9646–9657 This journal is © The Royal Society of Chemistry 2021
Ope
n A
cces
s A
rtic
le. P
ublis
hed
on 1
1 N
ovem
ber
2021
. Dow
nloa
ded
on 3
/12/
2022
9:0
8:42
PM
. T
his
artic
le is
lice
nsed
und
er a
Cre
ativ
e C
omm
ons
Attr
ibut
ion-
Non
Com
mer
cial
3.0
Unp
orte
d L
icen
ce.
View Article Online
43 M. L. Duarte, M. C. Ferreira, M. R. Marvão and J. Rocha,Int. J. Biol. Macromol., 2001, 28, 359–363.
44 E. Khor, Chitin and Chitosan: Making the Grade, inFulfilling the biomaterial promise, ed. E. Khor, Elsevier,Oxford, UK, 2014, ch. 7, pp. 101–111.
45 Y. Yamaguchi, T. T. Nge, A. Takemura, N. Hori and H. Ono,Biomacromolecules, 2005, 6, 1941–1947.
46 S. Darmon and K. M. Rudall, Discuss. Faraday Soc., 1950, 9,251–260.
47 J. Kumirska, M. Czerwicka, Z. Kaczyński, A. Bychowska,K. Brzozowski, J. Thöming and P. Stepnowski, Mar. Drugs,2010, 8, 1567–1636.
48 G. Cárdenas, G. Cabrera, E. Taboada and S. P. Miranda,J. Appl. Polym. Sci., 2004, 1876–1885.
49 S. Tanner, H. Chanzy, M. Vincendon, J. Roux and F. Gaill,Macromolecules, 1990, 23, 3576–3583.
50 I. Akpan, O. P. Gbenebor and S. O. Adeosun, Int. J. Biol.Macromol., 2018, 106, 1080–1088.
51 P. Kolhe and R. M. Kannan, Biomacromolecules, 2003, 4,173–180.
52 Z. Zakaria, Z. Izzah, M. Jawaid and A. Hassan, BioResources,2012, 7, 5568–5580.
53 M. Kaya, M. Mujtaba, H. Ehrlich, A. M. Salaberria, T. Baran,C. T. Amemiya, R. Galli, L. Akyuzh, I. Sargin and J. Labidi,Carbohydr. Polym., 2017, 176, 177–186.
54 E. S. Abdou, K. S. A. Nagy and M. Z. Elsabee, Bioresour.Technol., 2008, 99, 1359–1367.
55 F. A. Sagheer, M. A. Al-Sughayer, S. Muslim andM. Z. Elsabee, Carbohydr. Polym., 2009, 77, 410–419.
56 Y. Fan, T. Saito and A. Isogai, Biomacromolecules, 2008, 9,192–198.
57 R. Minke and J. Blackwell, The structure of α-chitin, J. Mol.Biol., 1978, 120, 167–181.
58 S. Park, J. O. Baker, M. E. Himmel, P. A. Parilla andD. K. Johnson, Biotechnol. Biofuels, 2010, 3, 10.
59 A. K. Gupta and R. P. Singhal, J. Polym. Sci., Polym. Phys.Ed., 1983, 21, 2243–2262.
60 G. Nansé, E. Papirer, P. Fioux, F. Moguet and A. Tressaud,Carbon, 1997, 35, 175–194.
61 E. Alvarenga, Characterization and Properties of Chitosan, inBiotechnology of Biopolymers, ed. M. Elnashar, InTechOpen,2011, pp. 91–110.
62 M. Kasaai, Carbohydr. Polym., 2008, 71, 497.63 N. Varan, J. Text. Sci. Eng., 2017, 6, 288.64 J. Brugnerotto, J. Lizardi, F. M. Goycoolea, W. Argüelles-
Monal, J. Desbrières and M. Rinaudo, Polymer, 2001, 42,3569–3580.
65 N. L. B. M. Yusof, L. Y. Lim and E. Khor, J. Biomed. Mater.Res., 2001, 54, 59–68.
66 P. R. Austin, Chitin solution, US4059457A, 1977.67 K. D. Nguyen and T. Kobayashi, J. Chem., 2020, 6645351.68 H. Moussout, H. Ahlafi, M. Aazza and M. Bourakhouadar,
Polym. Degrad. Stab., 2016, 130, 1–9.69 S. S. Kim, S. J. Kim, Y. D. Moon and Y. M. Lee, Polymer,
1994, 35, 3212.70 M. Jang, B. Kong, Y. Jeong, C. H. Lee and J. Nah,
J. Polym. Sci., Part A: Polym. Chem., 2004, 42, 3423–3432.
71 T.-H. Kim, H. L. Jiang, D. Jere, I.-K. Park, M.-H. Cho,J.-W. Nah, Y.-J. Choi, T. Akaike and C.-S. Cho, Prog. Polym.Sci., 2007, 32, 726–753.
72 S. Mao, W. Sun and T. Kissel, Chitosan-based formulationsfor delivery of DNA and siRNA, Adv. Drug Delivery Rev.,2010, 62, 12–27.
73 N. K. Katiyar, K. Biswas and C. S. Tiwary, Int. Mater. Rev.,2021, 66, 493–532.
Green Chemistry Paper
This journal is © The Royal Society of Chemistry 2021 Green Chem., 2021, 23, 9646–9657 | 9657
Ope
n A
cces
s A
rtic
le. P
ublis
hed
on 1
1 N
ovem
ber
2021
. Dow
nloa
ded
on 3
/12/
2022
9:0
8:42
PM
. T
his
artic
le is
lice
nsed
und
er a
Cre
ativ
e C
omm
ons
Attr
ibut
ion-
Non
Com
mer
cial
3.0
Unp
orte
d L
icen
ce.
View Article Online


![This is a Publisher · 2019-03-13 · dry or wet milling techniques, including ball milling, jet milling, media milling, and homogenization [23–25]. In addition to these mechanical](https://static.fdocuments.in/doc/165x107/5e284b280276bd44b2393281/this-is-a-publisher-2019-03-13-dry-or-wet-milling-techniques-including-ball-milling.jpg)