Chipotle Master Thesis 2014 copy - AU...
60
Strategic Analysis and Corporate Valuation of Chipotle Mexican Grill, Inc. MSc in Finance and International Business Michael Christopher Fontenot, Exam Number: 402559 Thesis Adviser: Otto Friedrichsen Submission Deadline: 01/06/2014 Master Thesis
Transcript of Chipotle Master Thesis 2014 copy - AU...

Strategic Analysis and Corporate Valuation of Chipotle Mexican Grill, Inc.
MSc in Finance and International Business Michael Christopher Fontenot, Exam Number: 402559 Thesis Adviser: Otto Friedrichsen Submission Deadline: 01/06/2014
Master Thesis

Table of Contents
ABSTRACT .......................................................................................................................................... 3
INTRODUCTION ................................................................................................................................ 4
PROBLEM STATEMENTS ................................................................................................................ 5
METHODOLOGY ................................................................................................................................ 6
DELIMITATIONS ............................................................................................................................... 6
THESIS OUTLINE ............................................................................................................................... 7
COMPANY PROFILE ......................................................................................................................... 8
STRATEGIC ANALYSIS .................................................................................................................. 10
INTERNAL ANALYSIS .................................................................................................................... 10 MISSION, VISION, VALUES ..................................................................................................................... 10 STRATEGY .................................................................................................................................................. 11 BUSINESS MODEL .................................................................................................................................... 12 EXTERNAL ANALYSIS ............................................................................................................................. 21 INDUSTRY ANALYSIS .............................................................................................................................. 22 ENVIRONMENTAL ANALYSIS ................................................................................................................. 26
HISTORICAL FINANCIAL ANALYSIS ......................................................................................... 33
VALUATION MODEL ..................................................................................................................... 38 ESTIMATING THE COST OF CAPITAL ................................................................................................ 39 MODEL ESTIMATES ................................................................................................................................. 42
FORECAST ASSUMPTIONS .......................................................................................................... 44
Scenario Analysis .......................................................................................................................... 45
SENSITIVITY ANALYSIS ............................................................................................................... 48
IMPLIED MULTIPLES ANALYSIS ............................................................................................... 50
VALUATION OF SHOPHOUSE EXPANSION ............................................................................. 50
VALUE OF INTERNATIONAL EXPANSION .............................................................................. 52
VALUATION OF BREAKFAST MENU ......................................................................................... 53
CONCLUSION ................................................................................................................................... 56
REFERENCES ................................................................................................................................... 58

ABSTRACT
The overall objective of this thesis is to determine the fair market value of Chipotle
Mexican Grill Inc. In this thesis, strategic and financial analyses are conducted to support
forecast estimates used in the valuation. The primary valuation method used is the
enterprise discounted cash flow model.
Chipotle Mexican Grill (pronounced Chi-‐poat-‐lay) is a chain of “fast-‐casual” restaurants
known for serving oversized burritos stuffed with fresh, high-‐quality ingredients. The
company has grown rapidly after its IPO in 2006. In addition to the Chipotle brand chain
of restaurants, the company has developed and opened several Asian inspired
restaurants called ShopHouse Southeast Asian Kitchen. Chipotle is a U.S. based company
with only 1% of its total restaurants being located outside of the United States.
Chipotle is and always has been categorized as a high growth stock. As such, the fair
market value of the company has been a highly debated topic. Adding to this debate is
the question of how much value does the potential to increase the currently small
number of ShopHouse and international locations add to the current value of the
company. These are some of the questions this thesis set out to answer. In the end, a
weighted average scenario analysis led to an estimated fair market value of $621.70.
In addition, an analysis of the companies various growth opportunities resulted in the
conclusion that Chipotle does have the potential to add value over and above what is
currently priced in by the market.

INTRODUCTION
Chipotle Mexican Grill, Inc. owns and operates a chain of Mexican restaurants serving
fast, fresh, high-‐quality food.
The company has been very successful in creating a strong brand image. Chipotle’s
“Food with Integrity” philosophy of using locally sourced meats and produce raised in a
sustainable and environmentally responsible way differentiates the Chipotle brand from
its competitors. The company often receives additional media attention for their
unconventional marketing practices, innovative social media campaigns and extensive
efforts to implement and promote socially responsible business practices.
The first Chipotle restaurant opened in Denver, Colorado in 1993 and with the help of a
large investment from McDonalds grew from 16 restaurants in 1998 to over 500 by
2005. In 2006 Chipotle went public and began trading under the symbol CMG on the
New York Stock Exchange. Now a component of the S&P 500, the stock price has
experienced exceptional growth from a first day closing price of $44.00 in January of
2006 to an all-‐time high of $622.90 in March of 2014. As of December 31st 2013,
Chipotle Mexican Grill has grown to 1572 restaurants in the United States, 7 in Canada, 6
in London, England, 2 in Paris, France and 1 in Frankfurt, Germany.
In 2011, CMG opened the first of 6 Asian inspired restaurants called ShopHouse
Southeast Asian Kitchen. Following the same philosophy and business model,
ShopHouse was created to see if Chipotle could replicate its success by extending its
model to different cuisines.

PROBLEM STATEMENTS
The overall purpose of this thesis is to determine the fair market value of Chipotle
Mexican Grill Inc. (CMG). A fundamental component in determining fair value is an
accurate assessment of future growth potential. Of particular relevance to the future
growth of CMG is the ability to increase unit growth. As such, opportunities for unit
expansion will be a primary focus point in this valuation. In addition to analyzing the
opportunities for continued domestic revenue growth and expansion of the Chipotle
Mexican Grill chain of restaurants, the following sub-‐ questions will be addressed.
1) How much does the potential for international expansion of Chipotle Mexican
Grill add to the value of CMG?
2) How much does the potential domestic expansion of ShopHouse add to the value
of CMG?
3) How much additional value could be created by extending current opening hours
to include a breakfast menu?
4) Is management’s idealistic philosophy of “Food with Integrity” and extensive
efforts to implement and promote socially responsible practices an asset and key
driver to continued growth or is it a liability and threat to future growth and
shareholder value?

METHODOLOGY
In an attempt to find answers to the previously mentioned problem statements, a
combination of strategic and financial analysis will be performed. An internal company
analysis and external industry and environmental analysis will be conducted in order to
gain incite into the factors influencing Chipotles future growth potential. This will be
concluded in the form of a summary SWOT analysis outlining key factors influencing the
company’s profitability and capacity to increase unit growth without destroying
shareholder value. In addition, a historical financial analysis will be performed in order
to evaluate the company’s ability to combine unit growth with growth in revenues and
return on invested capital. Information from both the strategic and historical financial
analysis will be used to estimate and then forecast future unit and revenue growth.
These estimates will provide the basis for answering the proposed problem statements.
The enterprise discounted cash flow model will then be used to value the company
based on multiple scenarios including those related to answering the problem
statements. Finally, a sensitivity analysis and implied multiples analysis will be
performed in order to evaluate the inputs and assumptions used in the valuations.
DELIMITATIONS
Although financial statements for the year ending 2005 and Q1 2014 were available
prior to the completion of this thesis, the historical financial analysis will be based
primarily on information from the financial statements for the years ending 2006-‐2013.
In addition, Chipotle has recently announced their investment in a pizza restaurant
company called Pizzeria Locale. As the percentage and dollar amount have not been
disclosed and the company currently consists of only a single restaurant, no discussion
or consideration of Pizzeria Locale will be included in this thesis. Furthermore, it should
be noted that the excel spreadsheet and model used to value employee stock options is
not of the author’s own design.

THESIS OUTLINE
Chapter 1: This chapter consists of: A brief introduction highlighting areas of interest
behind the motivations for this thesis; A description of the problem statements to be
investigated and answered by this thesis; A brief description of the methodology and
models used to provide answers to the problem statements; A description of certain
delimitations associated with the thesis; A company profile providing relevant
background information considered to be both helpful and necessary for a complete
understanding of the strategic and financial analysis.
Chapter 2:This chapter includes the strategic analysis of Chipotle Mexican Grill. The
analysis is divided into three parts: An internal company analysis, an external industry
and environmental analysis, and a summary SWOT analysis.
Chapter 3:This chapter includes a historical financial analysis of the company
highlighting relevant accounting issues, and the historical developments in revenue
growth and return on invested capital.
Chapter 4:This chapter includes a discussion and description of the valuation methods
used to answer the problem statements and a discussion of the estimation models,
methods, and results used in the final valuation.
Chapter 5:This chapter describes the estimates and assumptions used in forecasting the
financial statements and associated free cash flows used for answering the problem
statements and final valuation.
Chapter 6: This chapter includes the final valuation of Chipotle Mexican Grill using a
weighted average of three possible yet hypothetical scenarios.
Chapter 7:This chapter includes a sensitivity analysis of the estimates used in the
valuation model and an implied multiples analysis as a test of plausibility.
Chapter 8:This chapter includes answers to all four problem statements and final
conclusions.

COMPANY PROFILE
After graduating from the Culinary Institute of America, founder Steve Ells went to work
as a sous chief in an upscale San Francisco restaurant. With a dream of opening his own
fine dining restaurant, Chipotle was originally conceived as a way for Steve to generate
enough cash to realize that dream. The Chipotle Mexican Grill concept was inspired by
the local “taquerias”(traditional street vendors who make and sell fresh, authentic
Mexican tacos and burritos) he frequented while living in California. Combining his
appreciation for fresh ingredients with his training in classic cooking methods, Ells set
out to create a better burrito. In 1993, with a loan from his father, Steve opened the first
Chipotle Mexican Grill in Denver, Colorado. The restaurant proved to be a success.
(chipotle.com)
“A Few Things, Thousands of Ways”
Chipotle restaurants serve only a few things: burritos, burrito bowls, tacos and salads.
Customers can choose from four different types of meat, two types of beans and a
variety of extras such as salsas, guacamole, cheese and lettuce. (CMG AR 2014)
Customers order and choose ingredients via an interactive assembly line format. The
order process consists of choosing one of four main menu items, then personally
selecting the individual ingredients to be included
.

“Food with Integrity”
From the beginning, the importance of using fresh ingredients has been the cornerstone
and hallmark of the Chipotle brand and the quality of food that it served. However,
overtime their belief that “freshness” equals “quality” was challenged. In 1999 Steve Ells
visited one of their pork suppliers. After seeing the conditions and learning more about
how these animals were being raised, Steve decided he wanted to do things differently.
From that point in time, Chipotle has been increasingly active and committed to raising
the standards that define quality ingredients (chipotle.com). Their Food With Integrity
philosophy outlines their focus and commitment to not only using the highest quality
ingredients possible but also doing so with respect for the animals, the people and the
environment that produces them. This includes extensive efforts to remove all
genetically modified organisms (GMO’S) from their menu items, serve meat and dairy
products free of growth hormones and antibiotics, and the use of local and or organic
produce whenever possible. Today Chipotle serves more naturally raised meat and local
produce than any other restaurant company in the United States.(chipotle.com).
‘Changing the way people think about and eat fast food”
Over recent years, the Chipotle story has evolved from “Big Burritos” to “Big
Agriculture”. Their efforts to educate the public and influence industry standards in the
areas of sustainable agriculture and responsible food production have become a large
part of the Chipotle brand image. In 2011, Chipotle produced and released a short
animated film called “Back to the Start” showing the journey of a small pig farmer as he
transforms his small family farm into an industrialized animal factory. The story then
proceeds to show the farmer struggling with the morality of what he has created and
eventually tearing it all down and going back to more natural farming methods: “back to
the start”. Then in September of 2013 Chipotle released another original animated film
called “The Scarecrow” about a scarecrow working for a huge industrialized food
production factory. The story shows a behind the scenes look into the dark side of
industry practices such as animal confinement and antibiotic/hormone injections. In
February 2014, Chipotle released a four part original comedy series called “Farmed and

Dangerous” based on big agriculture and the evil practices used by large corporations in
the factory farming and food processing industries.
STRATEGIC ANALYSIS
The purpose of this strategic analysis is to provide insight and understanding into the
issues affecting the past, current and future business activities of the company. These
insights will then be considered when analyzing past financial performance and in
forecasting future scenarios for the company.
INTERNAL ANALYSIS
The internal analyses will begin by looking at the companies’ goals and objectives as
expressed through its “mission, vision and values” statements and the strategies by
which they hope to obtain them. Then an analysis of the business model will be
performed in order to identify and evaluate the resources, capabilities, structure and
systems used by the company to implement those strategies.
MISSION, VISION, VALUES
Analyzing a companies Mission, Vision, and Value statements is an important first step
in strategic analysis. The mission statement describes their purpose for being in
business today. The vision statement announces their ambitions for the future. The
value statement declares their organizational beliefs and standards of behavior (Grant, R.
M. (2010)). The following statements were taken from Chipotle’s 2012 annual report.
Mission: “Serving high quality food while still charging reasonable prices.”
Vision: " Our vision is to change the way people think about and eat fast food.”
Values: " We believe that purchasing fresh ingredients and preparing them by hand are
not enough, so we spend time on farms and in the field to understand where our food
comes from and how it is raised." "We focus on recruiting and retaining top performing
people to ensure that the restaurant experience we provide is exceptional; on building

restaurants that are operationally efficient and aesthetically pleasing; and on doing all of
this with increasing awareness and respect for the environment, animals and people
who grow or raise the food."
Chipotles statements of mission, vision and value, as stated in their annual reports from
2006 to 2013, have been both clear and consistent over time. Any variations between
years have been to further enhance efforts associated with the previous year statements.
According to Grant, R. M. (2010). clear, consistent long-‐term goals are the first element in
successful strategies.
Corporate statements of mission, vision and value are sometimes viewed by people,
inside and outside of a company, as being “just words”. However, looking at a companies
actual business practices and resource expenditures can help to determine the validity
and authenticity of these statements.
A clear connection between Chipotles vision statement and a commitment of resources
can be seen in its’ cause marketing campaigns “Back to the Start”, The Scarecrow”, and
the new “Farmed and Dangerous series.
STRATEGY
Porter’s generic strategies for competitive advantage will serve as a starting point to
frame the discussion of Chipotles overall competitive strategy. Porter describes two
primary strategies that companies can use to create competitive advantage in an
industry or market. These include cost leadership and differentiation. (Grant, R. M.
(2010)) Using Porters model, Chipotle clearly falls into the category of differentiation.
The fast food industry as represented by large chains like McDonalds has widely been
associated with and characterized by serving less than high quality food. Although it is
quite clear that millions of people enjoy eating at these chains, it is likely that few if any
would describe the food as high quality. The use of microwaves and warming lamps to
prepare and serve highly processed, pre-‐cooked food is in many ways symbolic of the
industry. Unlike most large fast food chains, Chipotle in-‐store employees actually

prepare and cook the food in the restaurant. Employees do not just reheat and assemble
frozen, pre-‐cut, pre-‐cooked food; they chop the fresh raw vegetables with knives, cook
raw fresh meat on grills in open kitchens where customers see the food being cooked.
Chipotles differentiation is based on offering a higher quality of food with a higher
perceived value compared to others in the industry. This quality is based on the use of
high-‐quality ingredients and classic cooking methods. In addition, the use of an open
kitchen floor plan and unique interior design further add to the feeling that this is a
different kind of fast food restaurant.
BUSINESS MODEL
Analysis of CMGs business model will be based on the 9 building blocks of the “Business
Model Canvas” as outlined in the book Business Model Generation. The 9 areas for
analysis include: Customer Segments, Value Propositions, Channels, Customer
Relationships, Revenue Streams, Key Resources, Key Activities, Key Partnerships and
Cost Structure (Osterwalder, A., & Pigneur, Y. (2010)). The individual analysis of these
components and how they work together as a whole, allows for an in depth
understanding of the company's operations and the ability to quantify the degree of
importance of each component area as they relate to the companies key value drivers
and costs. This ability to understand the interaction of the individual parts and how they
affect the whole is extremely helpful when determining the validity, power and
significance of current and future strengths and weaknesses. This is not only key to
understanding the impact of new news and events on the value of the company but in
understanding exactly how and where it affects the company.

Key Activities
The “key activities describe the most important things a company must do to make its
business model work. They are required to create and offer a value proposition, reach
markets, maintain customer relationships and earn revenues.”( Osterwalder, A., & Pigneur, Y. (2010).
Chipotles key activities include: marketing, customer relations, supply chain
management, employee acquisition and training, and new store location and expansion.
These key activities will be the focus of discussion that follows.
Customer Segments
Customer segmentation involves analyzing the "mass market" customer base and then
grouping customers with similar characteristics into individual segments. Identifying
common characteristics and the creation of customer segments allows companies to
maximize the effectiveness of their business activities and the utilization of their
resources.
Chipotles customers are derived from the "mass market' of consumers who choose to
frequent a restaurant for their lunch and/or dinner needs. As such, the overall
demographic of their customers encompasses a wide range of characteristics. Upon
entering a Chipotle restaurant, it is not atypical to observe customers that vary widely in
age, perceived level of education and social class/status, ethnicity and gender. As for
customer segments, Chipotle does not publicly define a "specific" group or demographic.
However, analyzing and reverse engineering their value proposition and associated
business model components clearly points to a well known demographic. A comparison
of Chipotles value proposition and business model with the dominant character traits,
values, and behaviors that define "Millennials" (aka. "Generation Y”) shows a high
degree of correlation. In fact the similarities are so significant that an analysis of
Chipotles strategy and business model would be incomplete without providing some
additional information regarding this demographic. Some of the findings from a recent

study by Fromm (2013) on Millennials that are relevant include:
“Millennials include some of the earliest adopters of new technologies and emerging
social tools?”
“Millennials are interested in participating in brand marketing.”
“Millennials strive for a healthy lifestyle.”
“Millennials seek peer affirmation.”
“Millennials are “hooked” on social media.”
“Millennials believe in cause marketing.”
“Millennials ask the question, is your brand authentic and transparent or just using a
cause to sell them something in a disingenuous way?”
This final statement is particularly important as many consumers are becoming
increasingly aware of the fact that companies often make only superficial adjustments to
products in an effort to keep up with changing consumer trends.
Value Propositions
A company's value proposition constitutes the sum total of all products, services and
experiences that create a real or perceived value for customers. It comprises those
elements that differentiate its products and services from competitors. A company's
value proposition may be quantitative and or qualitative in nature. (Osterwalder, A., & Pigneur, Y. (2010)).
Chipotles primary value propositions come from their customizable menu choices, the
quality of their ingredients, relative price for value, service efficiency, and dining
experience. These are often articulated through company slogans:
" A Few Things, Thousands of Ways"

" Serving high quality food while still charging reasonable prices"
"Food Served Fast … So That Customers Can Enjoy It Slowly"
Channels
Channels describe how and where a company communicates and delivers their value
proposition and products to customers. More specifically, channels are the places and
avenues companies use to create awareness of their brand/product/service, enable
customers to purchase products and services, and ultimately deliver the overall
experience of the value proposition to the customer. (Osterwalder, A., & Pigneur, Y. (2010).)
Restaurants
Chipotles restaurants play a primary role in delivering the companies value propositions
and the customer experience they define. Serving their focused menu in an assembly
line format allows them to efficiently serve customers in a timely manner while the open
kitchen format allows customers to see all ingredients being freshly prepared and
cooked.
The interior design of their restaurants is based on the same philosophy as their food,
using a few simple ingredients to create something special. Their restaurants follow a
functional, modern and simplistic design that is both consistent and unique. The overall
affect creates a place that feels trendy and modern with a distinct sense of style and
personality. The combination of quality food, service, and design provide the overall
experience.
Company Website
The design and format of their online order process is easy and intuitive almost exactly
replicating the in-‐store order process. Chipotles is notorious for having lines so long that
they go out the door during peak lunch times. Online ordering helps to reduce these
lines while increasing the number of sales during peak hours. When customers arrive to

pick up their orders, there are a number of parking spaces reserved specifically for
customers who have ordered online and this further enhance the speed and experience
of the process.
In addition to enabling customers to order food and purchase products, the site offers a
variety fun formats designed to further educate and create awareness on topics that
define and differentiate the Chipotle brand.
Social and Online Media
Chipotle has fully embraced the use of social media as a platform to further create brand
awareness and the “Food With Integrity” philosophy that define it.
Using social and online media platforms such as Facebook, Twitter, YouTube, etc.,
Chipotle focuses on real interaction and getting to know/ having a relationship with
customers. These will be discussed further in the “customer relationships” section of this
analysis.
Marketing
Chipotle is well known for its unconventional and innovative marketing campaigns. In
particular, their “cause marketing” campaigns in recent years have been the subject of
much debate. The defining characteristic of their marketing efforts is that they are all
designed to give people something to both think and talk about. They believe in and
focus on word-‐of-‐mouth marketing and promotion. Creating unique marketing pieces
gives people something to talk about and more importantly something to share with
others. Chipotle has been very successful at creating headline grabbing, buzz worthy
attention not only through purposeful marketing campaigns, but also from “first and or
best in class” business activities and initiatives.
Community Events
Over the years, Chipotle has used various local community contests and events to

further create and expand awareness of their brand and cause. Some of the most
popular events include Chipotles “Cultivate Food, Ideas and Music Festivals” and the
“Boorito” Halloween contests.
Chipotles Cultivate Food, Ideas and Music Festivals: “These events give our customers an
opportunity to experience Chipotle in a new way and to learn something about issues in
food, develop a deeper appreciation for farmers and food artisans who are changing food
culture for the better, and enjoy some great music. (chipotle.com)
Customer Relationships
The customer relationships component of the business model describes the type and
purpose of the relationships a company aims to create with its customers. It describes
how and why they interact with customers. The type of relationships can range from
highly personal to highly automated. Defining the purpose of the relationships is an
important aspect in choosing what type of relationships a company should focus on.
What are they trying to accomplish with the relationship? Is the goal to create new
customers; retain current customers or increase revenues from existing customers?
(Osterwalder, A., & Pigneur, Y. (2010).)
At Chipotle, two primary types of customer relationships stand out. The first can be seen
in their stores. Their assembly line order process involves a real time, one on one dialog
between the customer and the person assembling their food. This interaction and ability
to ask questions, etc. creates a more connected and personal experience.
The second type of relationship can be observed through their active participation in
social media and community events. This type of relationship involves creating a sense
of community. Creating a sense of “we”, a sense of belonging to a group of like-‐minded
individuals based on “shared values”. The combination of “Cause Marketing” and
community events provides opportunities to connect with new customers and
strengthens relationships with current customers.
Key Partnerships

Chipotles key partnerships include: their regional distributers of food, beverage,
materials, network of farmers, real estate brokers, and landlords. These partnerships are
all considered vital to the past and future success of the company. However, the
companies’ network of local farmers is especially important as their value proposition is
directly related to the quality and the integrity of their ingredients. Furthermore, in the
case of Chipotle, these partners are not easily replaced. In fact, finding enough suppliers
who can meet Chipotles “quality” requirements has been a big challenge for the
company. In recent years, the supply of these “quality” ingredients has not been able to
keep up with demand. For example, on a number of occasions, Chipotle has disclosed
that they have been forced to use ingredients that do not meet the standards they have
promised their customers.
Key Resources
Human Resources
Executive Management: Steve Ells: the founder, chairman and co-‐chief executive officer is
a key resource for the company. Steve was recently named the second most powerful
person leading and shaping change in the restaurant industry by Nation's Restaurant
News. (2014 NRN Power List).
His authentic story and commitment to changing the industry based on the "Food With
Integrity" philosophy is an integral component of the past, present and future success of
the company.
Corporate employees: their experience and capabilities have allowed Chipotle to grow
successfully at a rapid pace. Customer relations, marketing, supply chain management,
human resources, etc. Their experience and expertise are a key asset and determining
factor in Chipotles ability to successfully expand operations.
In-‐Store employees: These include managers and crewmembers. This is an area where
Chipotle really stands apart from others in the industry. Executive management has
described this group as the most important in the company. Their “Restarantor”

program is designed to create an incentive program that is not often found in hourly
employment positions. Furthermore, when they hire a person for a dishwasher position,
they do it based on whether or not that person shows the quality and characteristics to
eventually become a top performing restaurant manager.
Financial Resources
Chipotles has maintained a strong balance sheet with sizeable assets and zero bank debt.
Furthermore, as a publicly traded company, Chipotles financial resources include the
ability to issue new equity and or debt if needed. Further discussion of Chipotles
financial resources is provided in the financial analysis.
Physical Resources
Chipotle leases almost all of their store locations. However, the large number of
nationwide restaurant locations and the lease agreements governing them is their most
valuable physical resource.
Intellectual/Intangible Resources
Chipotles intellectual resources consist of various trademarks related to their company
slogans and other “name” rights.
“Chipotle,” “Chipotle Mexican Grill,” “Unburritable,” “Food With Integrity,” “Fresh Is Not
Enough, Anymore,” “The Gourmet Restaurant Where You Eat With Your Hands,”
“Responsibly Raised,” “ShopHouse” and a number of related designs and logos are U.S.
registered trademarks of Chipotle. “We also believe that the design of our restaurants is
our proprietary trade dress” (CMG AR 2012).
Without question, the most valuable intangible resource the company has is its brand
name and the reputation of integrity associated with it.

Revenue Streams
The revenue streams component categorizes the methods by which a company receives
revenues from its customers. (Osterwalder, A., & Pigneur, Y. (2010).) Chipotles does not offer
franchise or license agreements at this time or in the foreseeable future (CMG AR 2012).
Their main revenue stream comes from the sale of their menu items. These revenues are
generated primarily from in-‐store food sales. Chipotle has recently added catering
services to their offerings allowing them to deliver the same in-‐store menu items in a
new way. However, catering is a very small percentage of revenues at this time. In
addition to in-‐store and catering food sales, Chipotle also generates revenues from the
sale of gift cards and a small number of miscellaneous branded merchandise such as
shirts and water bottles.
Cost Structure
The cost structure describes key costs associated with delivering the company’s value
proposition.
For restaurants the most important costs are food costs, labor costs and occupancy
costs. The importance of these costs has much to do with the structure of the industry.
Food and labor costs make up the majority of the costs of goods sold and the nature of
the business requires large capital investments in fixed assets in the form of new stores.
A single restaurant can only serve so many customers. As customer demand increases
companies must open additional stores, hire additional employees to run those stores,
and purchase additional inventories to be sold. In other words, the industry is not set up
to have significant increasing returns to scale. The importance of food, labor, and
occupancy costs will be discussed further and in more detail in both the external
strategic analysis and financial analysis that follow.

EXTERNAL ANALYSIS
As a starting point for industry analysis it is important to discuss the definition of the
industry to be analyzed. The restaurant industry can be segmented into two main
sectors: limited-‐service restaurants and full-‐service restaurants. However, the industry
is more commonly segmented into three basic categories: fast food, casual dinning, and
fine dining.
Fast food restaurants also known as limited-‐service restaurants (LSR) or quick-‐service
restaurants (QSR) are characterized by lower priced menu items, where speed of
services is a priority, and where customers must pay for their food before they sit down
to eat. McDonalds would be the classic example of a fast food restaurant. Compared to
LSR’s, casual dinning restaurants are characterized by moderately higher prices, a
broader menu selection, a more casual atmosphere, a higher perceived quality of food,
and the addition of waiter and waitresses providing table service. Examples would
include the Chilies’ chain of restaurants in the United States and Jensens Bofhus in
Denmark. In comparison to casual-‐dinning restaurants, higher prices, higher food
quality, and overall higher levels of service characterize fine dinning restaurants.
Recently, a newer segment labeled “Fast Casual” or “Quick Casual” restaurants has
received much attention. It is important to understand that this is not technically a
separate segment but the description of a group of restaurants in the traditional LSR-‐fast
food segment. It could be considered a sub-‐segment of the fast food segment. At the
most basic level, they are still limited service restaurants where you pay before you eat.
The name “Fast Casual” is derived from the fact that these restaurants seem to combine
the characteristics associated with fast food and casual dinning restaurants. Most
notably, this segment has embraced certain practices that are atypical of the traditional
fast food industry. These restaurants offer menus consisting of freshly prepared food
and quality ingredients in a comfortable upscale atmosphere. In addition, many of these
restaurants show a noticeable appreciation and tendency towards social and
environmentally responsible business practices.

Over the last few years, this segment has experienced rapid growth in market share. As a
result, the large national fast food and casual dining chains that have dominated the
restaurant industry in years past, have been looking at the success of fast casual
restaurants and adapting their business models, restaurant design, product offerings,
and marketing efforts to compete against this new sub-‐segment. These activities may
potentially create wide spread change in the structure of an industry that has been
relatively consistent for decades.
Although technically a segment of the overall restaurant industry, for the purpose of this
thesis, the industry to be discussed and analyzed will be the “fast food industry”. This is
defined as consisting of traditional fast food and fast casual segments collectively.
INDUSTRY ANALYSIS
The purpose of the competitive industry analysis is to evaluate how the dynamics of
competition and the companies involved effect industry attractiveness and profitability.
For this, Michael Porters Five Forces framework will be used. The theory assumes that
the intensity level of the competitive environment in the industry is dictated by five
competing forces which together act to determine the attractiveness and profitability of
an industry. The five forces include: the degree of rivalry among existing competitors,
the threat of new entrants, the threat of substitutes, the bargaining power of buyers, and
the bargaining power of suppliers. (Grant, R. M. (2010). )
From a purely financial perspective, industry attractiveness in terms of profitability can
be measured by analyzing the weighted average cost of capital (WACC) and return on
invested capital (ROIC) for the industry. Using Bloomberg and taking a market capital
weighted average of individual company ROIC’s and WACC’s, a level of industry
profitability can be calculated and analyzed. The results of this exercise show a market
cap weighted average ROIC and WACC of 20.23% and 7.99% for companies in the fast
food industry. Based on those numbers, this is clearly a profitable industry to be in and
one could make the assumption that this would attract attention and increase the threat
of new entrants in the future. These numbers alone however do not explain where the

source of profitability is coming from or the factors contributing to the industries ability
to achieve this level of return. Therefore, it is necessary to look deeper into the
industries individual competitive parts as suggested by Porter.
Rivalry between Established Competitors:
Over the years, the dominant fast food chains have waged war on each other through
various marketing campaigns and promotional offers in an attempt to win customers. A
review of the television commercials for McDonalds, Burger King and Wendy’s
hamburger chains over the past twenty years provide clear evidence of intense rivalry.
However, an argument could be made that the level of rivalry between the established
national chains has been lower than perceived. This can be seen in the fact that industry
wide menu prices are continuing to increase. Theoretically, the presence of intense
rivalry and competition should result in a decline of overall industry prices. A possible
explanation is that companies have been competing based on non-‐price related factors.
Instead of engaging in price wars, companies have been competing based on
differentiation factors and new product offers. Chipotle is a perfect example of a
company competing based on pure differentiation. Where as other companies focus on
promoting limited time offers on new menu items to lure customers to their stores.
Recent examples of this are Taco Bell’s “Doritos” taco and Wendy’s “pretzel bun burger”.
These non-‐price related competitive strategies have clearly dominated the marketing
and advertising campaigns used by industry leaders in recent years. However, the
dominance of non-‐price related competitive strategies might soon change. With the
success of the fast casual concept and an attractive overall industry spread, the future
may bring many new entrants into the industry. As more restaurants with new, yet
similar, concepts enter the industry, the levels of differentiation may be unrecognized by
consumers resulting in increased price competition over time.
Threat of New Entrants:
The threat of new entrants has been relatively low. Although it may be fairly easy for an
individual to by into a national franchise, the creation of a new national chain is quite a

large endeavor. It requires significant financial resources and industry specific
knowledge to enter the industry at a relevant scale. Again with the success of the fast
casual concept and an attractive overall industry spread, the future may bring new
entrants into the industry. In fact, this is already starting to happen. A number of
national casual restaurant chains and fine dinning restaurants are creating fast casual
spinoffs of their brands to compete in this segment of the industry. This threat of new
entrants from established firms within the “overall” restaurant industry presents a
significant threat. Unlike traditional new entrants, these companies have both access to
the required capital and the knowledge required to expand rapidly on a national level.
Competition from Substitutes:
It is important to clarify what defines true competition from a substitute. The
clarification between substitutions in buyer behavior versus the choice of a substitute
industry product is required. For example, customers can choose to substitute their
behavior of purchasing food for lunch with preparing food at home. This is different
from deciding to substitute buying lunch from a fast food restaurant with buying lunch
from a substitute establishment. Typical substitutes for fast food chains include: pre-‐
packaged sandwiches and meals from the fresh section of grocery and convenience
stores, food trucks and street vendors, local and family owned restaurant and shops, and
larger casual-‐dining restaurants. While a number of casual dinning restaurants are
creating new fast casual spinoffs as previously discussed, other large casual dinning
chains are making adjustments to current menu items, prices and service models in an
attempt to steal fast casual customers.
Bargaining Power of Buyers:
Buyer bargaining power is generally a function of supply and demand variables, their
ability to buy a similar product at a similar price, and any associated switching costs. In
the fast food industry, buyers/customers can in many cases buy a similar product at a
similar price with zero switching costs. For example, customers can purchase a
hamburger from McDonalds or Burger King and get relatively the same product at the

same price. Based on the previous example one could conclude that the bargaining
power of buyers in the industry should be relatively high. On the other hand, the
argument could be made that the bargaining power of buyers is ultimately based on
their collective ability to place pricing pressure on the industry. As previously discussed,
industry menu prices have consistently increased over the years implying that buyers
have not influenced prices in their favor. Buyers in the fast food industry consist of
individual consumers and although their combined size is very large, they do not make
purchases collectively. This is unlikely to change.
Bargaining Power of Suppliers:
The bargaining power of suppliers is relatively high for the industry. Although one may
think that large companies like McDonalds would have substantial bargaining power
over their suppliers, the reality is somewhat more complicated. The issue is that there
are very few suppliers that can handle the demand requirements of large national
chains. In this case, there are many fewer suppliers than buyers leading to more supplier
bargaining power. This is compounded by the fact that even the largest fast food chains
represent a small % of overall sales for these suppliers. For example, 85% of all beef
products in the U.S. are supplied by only four companies (Reding, N. (2014).) Considering
the level of beef products served in the industry, this provides strong leverage for those
suppliers. As large as McDonalds is, their total beef purchases still represent less than
2% of the total beef industry. (mcdonalds.com)
Implications for Chipotle
For chipotle, these developments could become a real problem in the future. As more
and more comparable restaurant and options become available from new entrants, copy
cat business models and established rivals adjusting their offering to be more similar to
Chipotles value propositions. Taking away chipotles pricing power for differentiation
will hurt their operating margins. Increasing industry demand for supply of the same
quality of produce as Chipotle from an increasing number of competitors will increase
their cost of goods sold further reducing operating margins. The result could be reduced

same store sales, reduced ability to charge a price premium for differentiation and
increased costs of goods sold via food supplies. A large part of Chipotles efforts to
promote changes in the food production industry is based on their belief that an
increase in overall demand for “sustainable” higher quality food will ultimately lead to
an increase in supply. Chipotles high standards mean that they have fewer suppliers to
source ingredients from than many of their competitors. This puts Chipotle in a difficult
situation. As Not only does it challenge their ability to grow their business from a supply
restraint standpoint, but also it puts additional pressure on their profitability margins
due to the ever-‐increasing bargaining power of their suppliers.
ENVIRONMENTAL ANALYSIS
Political/Legal
The impact of ever changing political and legal issues on the fast food industry can be
quite high. These issues are wide ranging and can have significant influence over
industry profitability. While laws and regulations are designed to protect the welfare of
consumers and employees, the compliance requirements generally result in an increase
in costs for industry participants.
The industry is subject to a variety of legal and regulatory issues including: local and
federal labor laws affecting employee wages and benefits, environmental protection
laws, consumer protection and food safety laws, and corporate tax laws.
Two areas of interest that are set to impact the industry in the near term include the
Affordable Care Act and the proposed increase in the federal minimum wage.
In the United States, the majority of hourly employees in the fast food industry do not
receive insurance benefits from their employers. The Affordable Care Act requires that
by 2016 employers with 50-‐99 full-‐time workers must provide affordable insurance to
all employees working 30 or more hours per week. (nrn.com) For large employers like
national fast food chains, this may amount to a significant increase in labor costs over
the coming years.

Changes in local and federal minimum wage requirements are another area poised to
increase costs for the industry. The current federal minimum wage is $7.25 per hour.
Last year, a bill backed by President Obama was proposed to increase the federal
minimum wage to $10.10 per hour. If this were to take affect, the impact on labor cost
would be substantial. Increasing by over 39%. In April of 2014 the senate blocked the
proposed bill to increase the Federal minimum wage. (nrn.com)This has been followed
by protests in 150 cities in the U.S. by workers in the fast food industry who are calling
for minimum wages of $15 per hour.(nrn.com)
Economic
The overall economic environment plays a major role concerning the profitability of
companies in the fast food industry. There is a long list of economic metrics and
variables that can be considered important to industry profitability, many of which are
interrelated and codependent. This analysis will break down the most important
economic factors for the industry as they relate to consumer demand, costs of goods
sold.
Consumer Demand: In the fast food industry, sales are primarily the result of
discretionary purchases. For the most part people do not need to buy fast food.
Therefore, factors effecting changes in consumer discretionary income and spending are
very important. Consumer spending on discretionary items is affected by many
macroeconomic factors. The health of the overall economy influences unemployment
rates, which in turn impacts disposable personal income, consumer confidence and
ultimately discretionary spending.
Cost of Goods Sold: For the restaurant industry, there are three primary costs
associated with a company’s cost of goods sold: Food Costs, Labor Costs, and Occupancy
Costs. Food Costs, which are affected by fluctuations in commodity prices, are the least
stable and most difficult to control costs for fast food companies. Many companies use
hedging to try to reduce the uncertainty and volatility but beyond that they are mostly
out of the companies control. Labor Costs: federal and local governments generally

determine labor costs as previously discussed. However, overall unemployment rates
can also have an effect on the cost of labor. Occupancy Costs: Are a function of the cost
and demand for commercial real estate. Typically these two variables are a function of
long-‐term interest rates and the health of the overall economy.
According to the CBO budget and economic outlook 2014-‐-‐-‐2024, disposable income and
consumer spending on goods and services is expected to increase by 3% in 2014 and
grow by nearly 3% per year on average through 2016. In addition, the agency reports
that US real GDP is projected to grow by 3.1% in 2014, 3.4% in 2015 and 2016, 2.7% in
2017, and by an average of 2.2% 2018-‐-‐-‐2024. (cbo.gov).
Social
Social factors including overall societal preferences, beliefs, aspirations, and concerns
affect demand for products and services. Companies must be mindful of these factors
when deciding on marketing and operating strategies. Social factor influences change
over time and companies must continually adjust to these changes as they develop. For
an industry dominated by large national chains, the time and costs of implementing
nationwide changes to adjust for changing consumer preferences can be substantial.
The fast food industry has long been demonized for contributing to the obesity problem
in modern society. Over the last 10-‐15 years, the trend towards a more healthy diet and
lifestyle has been seen as a threat to many in the industry. In recent years, the industry
has made adjustments to address these concerns by adding healthier options to their
menus. Today, the trend in consumer preferences has developed beyond healthier
choices. Consumers have demonstrated an increased preference towards food that is
prepared fresh using quality ingredients. In addition, a trend towards social
consciousness has developed where customers want to feel good about where their food
comes from. (nrn.com) An ever-‐increasing number of consumers are becoming more
aware and concerned about the effects of artificial additives used in food production.
These trends will place high demands on many of the traditional fast food chains known
for serving low quality, highly processed, pre-‐cooked food. For large companies, making
changes to meet changing consumer preference can take a long time to implement and
leaving them at a competitive disadvantage. To highlight the previously mentioned
issues, McDonalds will be used as an example once again. In January 2014 McDonalds
acknowledged that the rise in social consciousness and growing consumer demand for
“responsibly raised” proteins presents a big challenge for the company. They announced
that they are now committed to the goal of offering, “verified sustainable” beef in their
restaurants. However, due to their size and the complexity of their supply chain, they
believe it will take them at least two years before they can begin serving “verified
sustainable” beef to their customers.(mcdonalds.com)
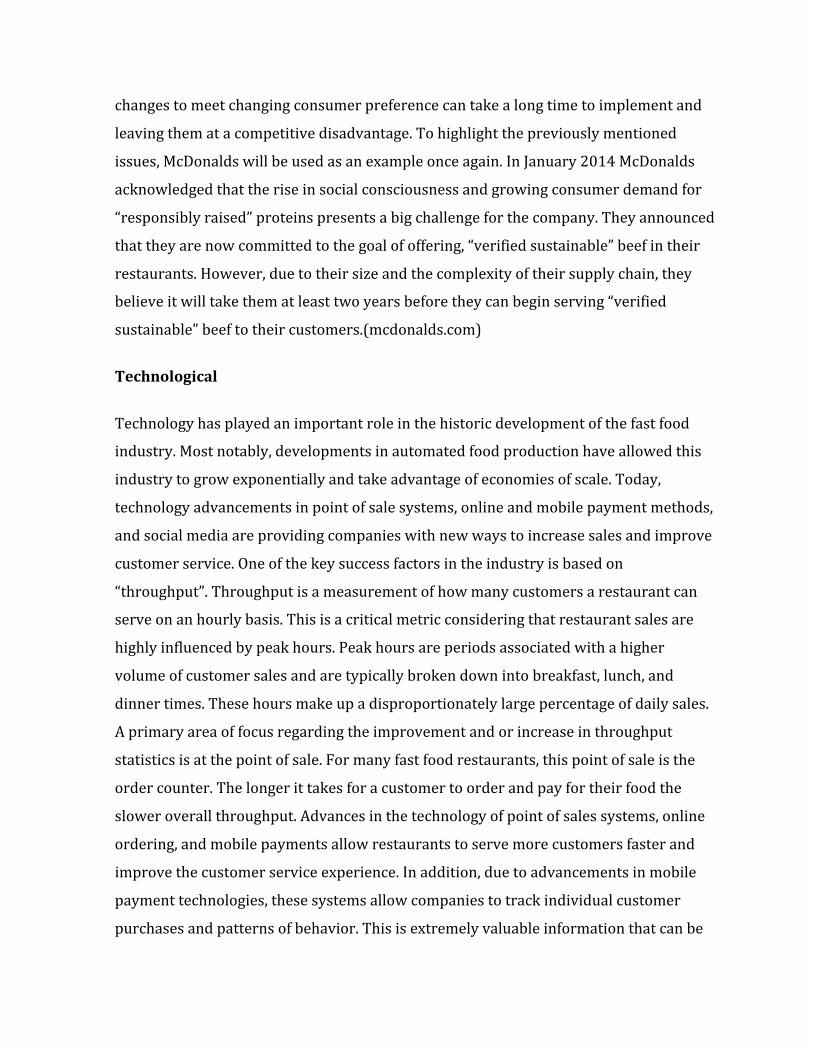
Technological
Technology has played an important role in the historic development of the fast food
industry. Most notably, developments in automated food production have allowed this
industry to grow exponentially and take advantage of economies of scale. Today,
technology advancements in point of sale systems, online and mobile payment methods,
and social media are providing companies with new ways to increase sales and improve
customer service. One of the key success factors in the industry is based on
“throughput”. Throughput is a measurement of how many customers a restaurant can
serve on an hourly basis. This is a critical metric considering that restaurant sales are
highly influenced by peak hours. Peak hours are periods associated with a higher
volume of customer sales and are typically broken down into breakfast, lunch, and
dinner times. These hours make up a disproportionately large percentage of daily sales.
A primary area of focus regarding the improvement and or increase in throughput
statistics is at the point of sale. For many fast food restaurants, this point of sale is the
order counter. The longer it takes for a customer to order and pay for their food the
slower overall throughput. Advances in the technology of point of sales systems, online
ordering, and mobile payments allow restaurants to serve more customers faster and
improve the customer service experience. In addition, due to advancements in mobile
payment technologies, these systems allow companies to track individual customer
purchases and patterns of behavior. This is extremely valuable information that can be

used to identify emerging trends and opportunities. This allows companies to track
customer visits, preferences, and more. With this information companies can target
market to individual customers using text message based special offers on their favorite
products, persuade them to try different products, and inform them of new products.
Another technological development impacting the industry is the rise of social media.
Social media offers new formats and opportunities to reach and communicate with
consumers. More importantly, social media not only allows communication between
companies and customers but between customers themselves. Today’s consumers are
constantly communicating with each other using Facebook, Twitter, Instagram,
Foursquare, Yelp, etc. This communication provides a format that has catapulted the
power and impact of word of mouth recommendations to new levels. This power
however can be a double-‐edged sword for companies. Prior to the wide spread use of
this technology, if a customer had a bad experience at a restaurant they may share it
with a few friends over time. However, today customers can post photos, video, and
comments about the experience in real time to thousands. Bad news and reviews can
travel and go viral fast.
STRENGTHS
Consistency-‐ The level of consistency and congruency throughout all aspects of
chipotles operations may be its greatest strength. The company’s mission, vision, and
values; choice of competitive strategy, value propositions, marketing messages, business
practices, etc. and the values of its customer base are in harmony. This consistency
provides a level of authenticity that sets it apart from others in the industry.
Brand-‐ Chipotle has created well-‐known brand that is based on a standard of
exceptional quality and integrity. In addition to providing the ability to charge a
premium for its products, the brands aspirational qualities provide positive brand
association further increasing its value.

Marketing-‐ Chipotles marketing goes beyond traditional marketing. Their ability to tell
a story and give people something to talk about is unmatched in the industry. They have
found a way to create marketing campaigns tied to business practices that are so buzz
worthy, the coverage from news broadcasters, and journalist increases the company’s
reach exponentially.
Employees-‐ The company is lead by its founder who is on a mission to do something
more than increase short term profits. Chipotles previous association with McDonalds
has afforded corporate level departments with process knowledge and experience from
arguably one of the most dominant brand based growth firms in history. The companies
“people culture” and “ Restarantor Program” create frontline employees who think and
behave more like business owners and entrepreneurs than like average low-‐level hourly
workers.
Menu: The small and relatively consistent menu reduces costs related to R&D for new
products, new product promotions, and employee training. Their core(normal) menu is
also well suited for catering to a large variety of different dietary needs and preferences.
Their core menu items provide vegan options, gluten-‐free options; carbohydrate-‐free
options etc.
Weaknesses
Supply Chain: Chipotles high standards regarding the integrity and quality of their
ingredients reduces the number of suppliers for chipotle compared to others in the
industry. Chipotle is extremely vulnerable to supply shortages. Considering the fact that
their brand is built on the quality of its ingredients this is a problem. Their brand, price
premiums and a large component of their value proposition is built on and contingent
on providing a product requiring inputs that the do not control.

Threats
Increased Competition: An increase in completion from either new competitors or from
value proposition adjustments by established firms is a real threat to Chipotles
profitability. It is conceivable that Chipotles price premium based on a differentiation
strategy could be eroded as more and more competitors bridge the gap. This may hurt
Chipotles ability to increase prices and at the same time reduce same store sale due to
reduced customer visits.
Increased Food Costs: Due to commodity prices, Supply Chain Issues: Any disruptions
to Chipotles limited supply chain could hurt the company’s profitability and expansion
plans. Shortages of food products due to increased industry competition for supplies of
sustainable ingredients.
Increased Labor Costs: Labor costs due to changes in minimum wage and employee
benefits would have a significant impact on profitability.
Bad press PR issues that undermine the vision values and integrity associated with the
brands reputation and integrity.
Opportunities
As discussed in the beginning of this thesis, the domestic expansion of the companies
ShopHouse brand and the continued expansion of international restaurants provide
exciting opportunities for the company. In addition, to opening more restaurants, the
decision to begin offering a breakfast menu is another potentially exciting opportunity.

HISTORICAL FINANCIAL ANALYSIS
The historical economic performance of Chipotle Mexican Grill will be analyzed using
company reported financial statements from the years ending 2006-‐2013. The focus of
this analysis will be based on historic developments in revenue growth and ROIC. The
purpose of the historical performance analysis is to provide incite into factors that have
influenced past performance and provide benchmarks for evaluating forecasted
estimates of future performance.
Chipotle reports under US GAAP. This format makes it difficult to interpret performance
in a meaningful way. The income statement, balance sheet and must be reorganized to
separate their various components into operating items, non-‐operating items and
sources of financing. This conversion will produce measures of NOPLAT, Invested
Capital and Free Cash Flows. A profitability analysis can be done by creating a ROIC tree
to determine the sources of growth in ROIC and its related components. The key drivers
of ROIC to be evaluated include revenue growth, operating profit, and asset utilization.
With the reformulation of the financial statements, Chipotles operating leases were
capitalized and their value added in the calculations of NOPLAT and Invested Capital.
REVENUE GROWTH ANALYSIS
Revenue growth for Chipotle consists of two components. The first being revenue
growth as the result of opening new stores and the second being revenue growth in
same store sales. From the end of the year 2006 to the end of year 2013, Chipotle
increased their number of stores by 175% from 581 to 1594. Over the same period of
time, the company increased total revenues by 291%.

The fact that total revenues are increasing with the addition of new stores is not overly
surprising. More importantly, revenues per store have also increased by 42% over the
same period meaning that growth in total revenues is not only due to growth in new
units but the result of an increase in unit/same-‐store sales.
The average year over year percentage change in total revenue growth for the period
has been roughly 23% per year with 15% coming from an increase in the number of
stores and 8% due to an increase in same-‐store sales.
ROIC ANALYSIS
Having taken a look at the development in historical revenues, the next logical step is to
look at the company’s historical profitability. A breakdown analysis of ROIC can show
where the development in ROIC is coming from. Is the development in ROIC driven by
improvements in the revenue to expenses ratio, the efficient utilization of invested
capital or both? Using the reformulated income statement and balance sheet to calculate
values for NOPLAT and Invested Capital, values for ROIC based on end of year invested
capital are calculated and decomposed into a ROIC tree for further analysis.
$3,214.591
$0,000
$1.000,000
$2.000,000
$3.000,000
$4.000,000
2005 2006 2007 2008 2009 2010 2011 2012 2013
Total Revenue
!"#$%"&'2006 ())* ())+ ()), ()-) ()-- ()-( ()-.
9% 8% 10% 13% 16% 18% 18% 19%PERCENT CHANGE OVER PERIOD 103%

Chipotle’s after tax return on invested capital has increased by 103% from 9% in 2006
to 19% in 2013 and has remained relatively stable over the last four years averaging
approximately 18%. A ROIC of 18% indicates that the company has generated a return
of $0.18 for each dollar invested in operations.
Again looking at the table above, Chipotle’s pre-‐tax ROIC has increased by 177% over
the period form 10.8% to 29.9%. These developments are the result of the two primary
drivers of ROIC known as NOPLAT and Invested Capital and are represented in the ROIC
tree as operating margin and invested capital as a percentage of revenues. After looking
at the development in these two drivers, it appears that improvements in both operating
margin and capital utilization are contributing positively to the development and growth
of Chipotle’s ROIC.
!"#$%&!'()$&"*+!""# !""$ !""% !""& !"'" !"'' !"'! !"'(,-./0 ,1.,0 ,2.30 ,3.40 51.60 54.-0 53.,0 53.30
PERCENT CHANGE OVER PERIOD '$$)
!"#$%&'()*+%$)'(,*%-./*#0'&1$#2/!""# !""$ !""% !""& !"'" !"'' !"'! !"'(34/54 34/56 34/56 34/57 34/58 34/58 34/59 34/59
PERCENT CHANGE OVER PERIOD %%)

The company has improved its operating margin by 88% going from 10% in 2006 to
18% in 2013. At the same time, productivity improved by 32%. To generate $1.00 in
revenue in 2006, Chipotle had to spend $.89 in invested capital and by 2013; they only
had to spend $.60 to generate $1.00 in revenue.
Therefore, the overall change in ROIC from 2006 to 2013 can be explained by the fact
that not only are they making more profit per unit of sales; it is costing them less to
generate those sales.
Continuing with the decomposition of ROIC, operating margin will be dissected into
Gross Profit Margin, SG&A, and D&A. Chipotles Gross Margin has increased by 27%
while SG&A and D&A have decreased by 20% and 28% respectively. All three have made
positive contributions to the improvements in Chipotles Operating Margin and ROIC.
!"#$%&%'()*+,-%#%".%!""# !""$ !""% !""& !"'" !"'' !"'! !"'(/012 /013 /014 /051 /056 /034 /037 /03/
PERCENT CHANGE OVER PERIOD )(!*
!"#$$%&'"!()*%+#!$,"-.-)/-!""# !""$ !""% !""& !"'" !"'' !"'! !"'(01234 01233 01233 01235 01236 01237 01236 01236
PERCENT CHANGE OVER PERIOD !$)$!8',"-.-)/-
!""# !""$ !""% !""& !"'" !"'' !"'! !"'(01219 01216 01216 01216 01217 01216 01216 01217
PERCENT CHANGE OVER PERIOD :31;
<-="-+('>(#),"-.-)/-!""# !""$ !""% !""& !"'" !"'' !"'! !"'(0121? 0121? 0121? 0121? 0121? 0121@ 0121@ 0121@
PERCENT CHANGE OVER PERIOD *!%)

However, as gross margin carries a much higher weight and consists of key variable
expenses, it is also broken down into individual components for further analysis. Over
the period, Food and Beverage Costs increased by 7%, Labor Costs decreased by 18%,
and both Rent Expense and Other Operating Expenses decreased by 13 %. Therefore, the
improvements in gross margin result from the company’s ability to offset increased food
costs with decreases in all other expenses included in the cost of goods sold.
Invested Capital
As previously discussed, it appears that Chipotle has increased the efficiency, utilization
and or productivity of its assets by 32%. The three primary components to be
investigated further are Operating Working Capital, PP&E, and Investments in Operating
Leases. Over the period, OWC decreased by 47%, PP&E decreased by 39%, and
Operating Leases considered additional PP&E have decreased by 20%. Again, while all
three components contributed positively, PP&E and Operating Leases carry the highest
weights.
!"#$%&'(')*'+!""# !""$ !""% !""& !"'" !"'' !"'! !"'(
,-./.0 ,-./.1 ,-./.1 ,-./.2 ,-./.1 ,-./.2 ,-./.1 ,-./.1PERCENT CHANGE OVER PERIOD )*$+
""'%&'(')*'!""# !""$ !""% !""& !"'" !"'' !"'! !"'(-./03 -./04 -./00 -./01 -./25 -./22 -./21 -./2.
PERCENT CHANGE OVER PERIOD )(&+!"'&678)9:;'6+'+%&'(')*'
!""# !""$ !""% !""& !"'" !"'' !"'! !"'(-./04 -./04 -./04 -./0< -./0= -./2> -./25 -./25
PERCENT CHANGE OVER PERIOD -20%

VALUATION MODEL
The valuation of Chipotle Mexican Grill will be completed using the Enterprise
Discounted Cash Flow Model. The Enterprise DCF model follows a four-‐step process:
1) Calculate the value of operations.
2) Calculate Enterprise value
3) Value all debt and non-‐equity claims
4) Value common equity
The value of operations is calculated by forecasting a companies free cash flows and
discounting them by the companies weighted average cost of capital (WACC). The
forecast is divided into two periods. The explicit forecast period and continuing value
period. To calculate enterprise value, the value of operations is added to the value of
non-‐operating assets. Then the value of debt and non-‐equity items is subtracted. The
final step in the Enterprise DCF model is to value the common equity by subtracting all
non-‐equity claims from enterprise value to get the value of equity. The estimated share
price is calculated by dividing the equity value by the current number of shares
outstanding.

ESTIMATING THE COST OF CAPITAL
WEIGHTED AVERAGE COST OF CAPITAL
The weighted average cost of capital includes the estimated cost of equity and debt. The
WACC is calculated based on the following formula:
𝑊𝐴𝐶𝐶 = !!∗ 𝑘𝑑 1 − 𝑇𝑚 + !
!∗ 𝑘𝑒
!"#$%"&%!'()$'*!"#$%&'((%!)*(%+,-'%./%012345%6!78 9:;,<2(*)%628 ,:=,>)'$(*%!"#$%?'(@"A@%6!@8 B:,,<C3#*%37%DEA"*-%6F(8 G:=,<?'(10)H%C3#*%37%I(J*%%6F58 K:L,<
CA''(4*%>)'$(*%/M)'(%?'"N( O;K9/M)'(#%PA*#*)45"4Q K+:,RK+,-./0%1,23/%45%673809%:6; <=>?@A>B=>CI(J*%S)TA(%/0%6C)U:%V()#(8% O,:+LKI(J*%S)TA(%V*%6C)U:%V()#(8 OK:KRBI(J*%S)TA(%6C)U:%PU:%V()#(8 O9W9,B:LR+$40,2%D/E0%:D; <C?C=FBF=F6G0/-H-8I/%1,23/%:1; <=J?KL>B=KC
X("QM*%37%I(J*%6IYS8 ++:G=<X("QM*%37%DEA"*-%6DYS8 RR:9+<>)'Q"4)T%0)H%!)*(%6%0@)'8 K=:9,<Z7*('%0)H%F5% 9:+<M/8NO0/P%'Q/-,N/%!4I0%45%!,H80,2%:M'!!; KBC=R

ESTIMATING THE COST OF EQUITY
To determine the cost of equity, the Capital Asset Pricing Model (CAPM) is used.
Although, there are other asset pricing models, the CAPM is the model used most often.
The model relies on three key variables, the risk free rate (Rf), the Beta of the equity (B),
and the expected return on the market (E(Rm)).
E(Ri) = rf + βi [E(Rm) – rf ]
RISK FREE RATE (Rf):
Ideally, the risk free rate should be based on a bond that matches the currency and cash
flow period as the company being valued.( Koller (2010).) The risk free rate used in the
valuation is based on the 10 year US Treasury bond.
ESTIMATING BETA (B):
The raw beta was estimated using the market model:
Rit = αi + βiRmt + εit
Koller, (2010) recommends regressing the company stock returns against a well-‐
diversified market portfolio and using monthly returns with a minimum of 60 data
points. In addition, they suggest improving the beta estimate by using an industry-‐
adjusted beta. This method was also suggested by Damodaran, A. (2012). adding that a
minimum of 20 comparables be used to improve the estimate. Ultimately, beta was
estimated using five year and three year monthly and weekly return against the
equivalent returns for the S&P 500 Index. This process was completed using 20 industry
peers and then adjusted for differences in leverage. Unfortunately the industry average
unlevered beta combined with Chipotles low debt ratio produced a beta that was much
lower than seemed reasonable compared to the same estimates not including industry
peers. A complete list of the various beta estimates can be found in the appendix. In the
end, the estimate chosen was based on a consensus between all estimates and the
Bloomberg adjusted 3 year and 5 year estimates.

ESTIMATING THE MARKET RISK PREMIUM:
As the formula used in the CAPM clearly shows, the market risk premium is the
difference between the risk free rate of return and the expected return on the market.
Similar to the situation with beta, there are a number of different methods used to
estimate the market risk premium. The survey approach uses a survey of analysts and
investors estimates on what they consider the current market risk premium to be. The
historical approach uses historic returns between the market and risk-‐free rate to
estimate the market risk premium. One of the challenges with this approach is that the
results can vary widely depending on the time periods chosen. Furthermore, even if the
same time periods are chosen, there can still be differences in the final number
depending on the choice between using the arithmetic versus geometric average of the
returns. Others suggest using a third approach that is more forward looking by
calculating implied returns to estimate the market risk premium Bruner (2013) completed
a study of “best practices” in estimating the cost of capital. They found that the range of
the market risk premium used by companies, analysts, and promoted in current trade
and texts books was between 4% and 9 % with the average reported number being
6.5%. . Koller, (2010) recommends using a market risk premium between 4.5% and 5.5%.
Thus, the decision was made to use 6% in this valuation.
ESTIMATING THE AFTER TAX COST OF DEBT (Kd):
The after tax cost of debt is used in the calculation of the weighted average cost of
capital. The after tax cost of debt is equal to the pre-‐tax cost of debt multiplied by 1
minus the companies marginal tax rate. Chipotle does not have any traditional bank
debt. All of their debt is related to capital leases and operating leases for their
restaurants. Furthermore, the company does not disclose its true cost of debt. Therefor,
the cost of debt must be estimated. The estimation of the cost of debt for Chipotle is
included in the upcoming discussion on the valuation of the companies operating leases.

MODEL ESTIMATES
CONTINUING VALUE
The continuing value beginning in year 2024 is estimated using the key value driver
formula : CV = NOPLATt+1 (1− (g/ RONIC))/ (WACC – g)
The inputs used in the formula are as follows:
NOPLATt+1: NOPLATt+1 equals estimated NOPLAT for 2024
g = The expected growth rate in NOPLAT
RONIC = The expected return on new invested capital is based on beginning of the year
ROIC in 2024
WACC= The weighted average cost of capital previously calculated.
ENTERPRISE VALUE
To calculate enterprise value, the value of operations is added to the value of non-‐
operating assets. For Chipotle, non-‐operating assets consist of excess cash. Operating
cash was estimated to be equal to 2% of revenues. The remainder is set as excess cash.
VALUE DEBT AND NONEQUITY CLAIMS
For Chipotle, these include employee stock options and operating leases. Employee
options were valued using the Black-‐Scholes option pricing model and based on the
recommendations of Damodaran, A. (2012). . The risk free rate used was the 5-‐year US
Treasury rate due to the 5.1 years remaining. According to Chipotles valuation in the
2013 10-‐k, they used a risk free rate of .5%. All other inputs for the valuation were based
on Chipotles end of year 2013 valuation as reported in the 2013 10-‐k.
As with many of the other input variables needed for the valuation model, there are a
number of different methods to value operating leases. Three different methods were
calculated and evaluated by the author. Two of the methods required an estimate of the

company’s pre-‐tax cost of debt. The cost of debt was estimated based on the risk free
rate and a default premium. Bloomberg provided a default risk rate for Chipotle of 1%.
This was added to the risk free rate of 2.5% for a total of 3.5%. In addition, the lease
valuation method suggested by Koller recommend using the yield to maturity on AA
rated secured bonds as the cost of debt to be used in the valuation of operating leases.
Interestingly enough, this rate was 3.4%. The most commonly suggested method for
calculating the value of operating leases recommends taking the present value of the
reported minimum payments to arrive at an estimate of current value Koller,
(2010) however, states that this leads to an undervaluation and suggested using the
following formula to determine the value of the leases:
Another method suggested by Koller, (2010) includes multiplying the rental expense by a
capitalization rate of 8. In addition to using the multiplier of 8, an additional calculation
using a rate based on actual private offerings of Chipotle restaurants. Although Chipotle
leases nearly all of their restaurants, they do have a small number of company owned
restaurant buildings. Over the years, they have attempted to sell these buildings by
marketing them as sale-‐leaseback triple net lease investments. The offerings state a true
capitalization rate of 6.00%. This is consistent on different buildings in different states
and in different years. All three lease valuation are included in appendix. After
evaluating the results provided by all three methods, the decision was made to use the
method suggested by Koller) and the cost of debt of 3.4%.
VALUE OF COMMON EQUITY
The final step in the Enterprise DCF model is to value the common equity by subtracting
all non-‐equity claims from enterprise value to get the value of equity. The estimated
share price is calculated by dividing the equity value by the current number of shares
outstanding.
11 of 88
thoroughly was chosen to be from 2004/05 to current financial year 2009/10. The
reason for this specific period is that analysis further back would give limited
information because of the frequent changes in Danisco´s business for the past
decade, such as acquisition of Genencor and divestment of the Sugar and Flavour
division.
In the analysis of Danisco there are several accounting issues that require special
attention. These are:
Operating lease: When a company leases an asset, they don’t have to record it as an
asset or a liability. Instead they add the rental charges to the income statement.
Therefore a company that leases assets instead of buying them will seem to be
“capital light”. In order to make up for that in our reformulation we have to capitalize
the leased asset. The value of the leased assets is estimated using the following
equation:
Equation 3 - Operating Lease Asset Value
!!""#$!!"#$%!!! !!"#$%&!!"#!$%!!!! ! !
!""#$!!"#$
Where !! represents cost of debt. As lease obligations are considered to be less risky
than the company’s unsecured debt, since operating leases are secured by the
underlying asset, a different risk premium was estimated for operating lease than
other debt. Operating leases are estimated to have less risk premium than Danisco´s
other debts. The fair risk premium was found to be 0.65% (AA rated)2, which is
0.45% lower than risk premium on Danisco´s other debt. The leased assets are mainly
buildings and production plants and for that reason an estimated asset life of 20 years
was found to be appropriate.
This action will influence ROIC and leverage ratios, for instance invested capital will
increase and because of that ROIC will decrease. This should however not have
impact on valuation as the drop in ROIC will be accompanied by a drop in the cost of
capital and increase in debt equivalents. (Koller, Goedhart, & Wessels, 2010, p. 577)
2 The debt rating table can be seen in table 10 on page 40.

FORECAST ASSUMPTIONS
This valuation will be completed using a weighted average of three different future
scenarios. The scenarios are focused on future estimates of revenue growth and
profitability margins during the explicit forecast period.
REVENUE FORCASTS
The revenue forecast is split into to parts:
1) Revenue growth due to growth in new units
2) Revenue growth due to growth in same store sales
Unit Growth: Unit growth will be based on Chipotles ability to open additional
restaurants. New unit growth forecasts will be estimated based on a combination of
historic unit growth rates and estimated saturation rates.
Saturation rates are based on the current number of Chipotle restaurants in their home
state of Colorado. The number of units in Colorado has not increased since 2010.
Therefore it is assumed that they have reached the number of stores for the state that
can be supported by customer demand. They have 71 stores and the state population is
5,029,196 giving a saturation rate of 1 store per 70,834 residents.
Therefore, the saturation rate for the total number US locations is estimated based on
total U.S. population numbers. These numbers suggest that Chipotle can open an
additional 2900 units in the in the US for a total restaurant count of 4,472.
Same Store Sales Growth: Year over year changes in Same Store Sales (SSS) growth can
be due to a mix of several variables: increases in menu prices, an increase or decrease in
visits from both new and existing customers, increase or decrease in ticket totals, the
addition of new menu items, increase or decrease in catering and online orders, increase
or decrease in competition, and changes in the health of the overall economy. Forecasts
in SSS revenue growth will be based on a combination of historical analysis, company
guidance, economic outlook, and industry competition.

Profitability Forecasts
The profitability forecast is based on changes in operating margins due to changes in
costs of goods sold. Similar to SSS growth, estimates will be based on a combination of
historical analysis, company guidance, economic outlook, and competitive conditions
and other issues revealed in the strategic analysis.
Scenario Analysis
BASE CASE: The base case forecast follows company guidance and current economic
situations and circumstances. For the base case scenario, Chipotles will continue to focus
on domestic expansion and future domestic unit growth will be similar to average
historical unit growth rates. The forecast for unit growth shows Chipotle reaches full
unit saturation year-‐end 2023. The unit growth of ShopHouse and international units is
forecasted based on a combination of recent company guidance and historical growth
rates. In the base case, Chipotle opens a small number of additional ShopHouse and
international locations each year of the forecast period. SSS growth is based on historical
rates and company guidance. Management has stated that they intend to increase prices
in 2014. As such, an increase in SSS revenue due to the increase is built into the forecast.
Thereafter, total SSS growth is forecast to decline gradually over the forecast period to a
long-‐term growth rate of 3%. Economic conditions are forecast to be neutral and similar
to recent years. For the base case, operating margins are forecasted to be consistent
with historical percentage of revenue ratios. Realistically, cost of goods sold and
expenses could potentially increase at a higher percentage of revenues than historic
ratios. Expected increases in minimum wage and higher food costs could increase food
and labor ratios. However, due to Chipotle already paying above average wages and
their ability to increase prices, overall profitability from operations is forecast to be
similar to historic averages. This results in a forecasted share price of $644.81.

WORST CASE: Compared to the base-‐case scenario, in the worst-‐case scenario, Chipotle
is faced with increased competition, increases in labor costs and food costs. With this is
the assumption that Chipotle is no longer able to successfully increase menu prices
without loosing sales volume. An increase in competition causes same store sales
revenue growth to decline as a result of the company loosing pricing power and
customer traffic. The scenario suggests that the percentage increase in the federal
minimum wage takes place and is higher than expected. Increases in food cost are also
forecasted to be higher than historical ratios. This could result from an increase in
commodity prices or an increase in competitor demand for sustainably raised foods.
This results in a forecasted share price of $498.87.
!"#$%&"#$%'"()"*+,-%-$.%)-+*# !"#$ !"#% !"#& !"#' !"#( !"#) !"#* !"!" !"!# !"!! !"!$!"#$%!&'($)*+$,-*"('&) " #)" #*) !#) !%" !'% !*" $#* $&# $)' %!%!"#$%!&'$(.-/.-%(" " ## ## ## ## ## ## ## ## ## ##*,*"%+-&/$"#$%+-%)-+*# #$+ #!+ #!+ #!+ ##+ ##+ ##+ ##+ ##+ ##+ ##+
###%/$'$-)$%/0&)"$&!)0"1(" !,"+ %,"+ #,&+ #,&+ #,&+ #,&+ #,&+ #,&+ #,&+ #,&+ #,&+'012&)$&!)0"1("3,")0"1(" !,'+ !,"+ #,&+ #,&+ #,&+ #,"+ #,"+ #,"+ #,"+ #,"+ #,"+*&4$-2$-'."0 #,"+ #,"+ ","&+ ","&+ ","&+ ","&+ ","&+ ","&+ ","&+ ","&+ ","&+*,*"(%###%/$'$-)$% &,'+ (,"+ $,#+ $,#+ $,#+ !,'+ !,'+ !,'+ !,'+ !,'+ !,'+
*,*"(%/$'$-)$%0/,.*1 #*+ #*+ #&+ #&+ #%+ #%+ #%+ #$+ #$+ #$+ #$+&,#*%,2%0,,3#%#,(32--,$5$6"7"01+"$)-('( -#."(% -#.!)# -#.%($ -#.')* -#.*$% -!.!"" -!.%*) -!.)$% -$.!#" -$.'$$ -%.#")$$$8$)9:;<=$$>?> !"+ #*+ #&+ #&+ #%+ #%+ #%+ #$+ #$+ #$+ #$+@16-0$5$$6"!&22&'(($)-('( -(%" -))! -#."#& -#.#'% -#.$$$ -#.&#' -#.(!! -#.*&$ -!.!#! -!.&"% -!.)$#$$$8$)9:;<=$$>?> #&+ #*+ #&+ #&+ #%+ #%+ #%+ #$+ #$+ #$+ #$+#1"/$%4/+&$ 566789
!"#$%&'($)&*(+,(%-".&.)!&,.-%$ !"#$ !"#% !"#& !"#' !"#( !"#) !"#* !"!" !"!# !"!! !"!$!"#$%!&'($)*+$,-*"('&) " #)" #*) !#) !%" !'% !*" $#* $&# $)' %!%!"#$%!&'$(.-/.-%(" " ## ## ## ## ## ## ## ## ## ##%"%(&-.'#)($)&-.&,.-%$ #$+ #!+ #!+ #!+ ##+ ##+ ##+ ##+ ##+ ##+ ##+
$$$&#)*).,)&/0&)"$&!)0"1(" !,"+ %,"+ #,&+ #,"+ #,"+ #,"+ #,"+ #,"+ #,"+ #,"+ #,"+'012&)$&!)0"1("3,")0"1(" !,'+ !,"+ #,&+ #,"+ ",&+ ",&+ ",&+ ",&+ ",&+ ",&+ ",&+*&4$-2$-'."0 #,"+ #,"+ ",#+ ",#+ ",#+ ",#+ ",#+ ",#+ ",#+ ",#+ ",#+%"%(+&$$$&#)*).,)& &,'+ (,"+ $,#+ !,#+ #,'+ #,'+ #,'+ #,'+ #,'+ #,'+ #,'+
%"%(+&#)*).,)&/#"!%0 #*+ #*+ #&+ #%+ #$+ #$+ #$+ #!+ #!+ #!+ #!+'"$%&"1&/""2$&$"+22--,$5$6"7"01+"$)-('( -#."(% -#.!)# -#.%($ -#.(&) -#.*)' -!.!%" -!.&!# -!.)$& -$.#)$ -$.&(# -%.""!$$$8$)9:;<=$$>?> !"+ #*+ #&+ #*+ #$+ #$+ #$+ #!+ #!+ #!+ #!+@16-0$5$$6"!&22&'(($)-('( -(%" -))! -#."#& -#.!#! -#.$'* -#.&%$ -#.($) -#.*&$ -!.#*% -!.%'# -!.(&)$$$8$)9:;<=$$>?> #&+ #*+ #&+ #*+ #$+ #$+ #$+ #!+ #!+ #!+ #!+$0(#)&3#-') 456768

BEST CASE: Compared to the base-‐case scenario, in the best-‐case scenario, Chipotle’s
overall same store sales numbers are higher due to an increase in the “mix of other”
category. This could come as a result of increased ticket sizes, an increase in catering
sales, and or possible new menu and add-‐on items. In addition, in the best-‐case scenario,
beginning in 2016 management decides to increase the number of new ShopHouse units
as compared to what is forecasted in the base-‐case. This results in a forecasted share
price of $705.56.
FINAL VALUATION (WEIGHTED AVERAGE)
The final valuation is based on the weighted
average of the three scenarios. All three scenarios
Are considered to be realistic possibilities,
however the base case being more neutral and
representative of past performance is given the highest weight.
!"#$%&'#"%(')*'$+,-%-".%*-+$# !"#$ !"#% !"#& !"#' !"#( !"#) !"#* !"!" !"!# !"!! !"!$!"#$%!&'($)*+$,-*"('&) " #)" #*) !#) !%" !'% !*" $#* $&# $)' %!%!"#$%!&'$(.-/.-%(" " ## ## #$ #' #* !$ !( $$ $* %($,$'%+-&/"'#"%+-%*-+$# #$+ #!+ #!+ #!+ #!+ ##+ ##+ ##+ ##+ ##+ ##+
###%/"("-*"%/0&)"$&!)0"1(" !,"+ %,"+ #,&+ #,&+ #,&+ #,&+ #,&+ #,&+ #,&+ #,&+ #,&+'012&)$&!)0"1("3,")0"1(" !,'+ !,"+ #,&+ #,&+ #,&+ #,"+ #,"+ #,"+ #,"+ #,"+ #,"+*&4$-2$-'."0 #,"+ #,"+ #,"+ #,"+ #,"+ #,"+ #,"+ #,"+ #,"+ #,"+ #,"+$,$')%###%/"("-*"% &,'+ (,"+ %,"+ %,"+ %,"+ $,&+ $,&+ $,&+ $,&+ $,&+ $,&+
$,$')%/"("-*"%0/,.$1 #*+ #*+ #'+ #'+ #'+ #&+ #&+ #&+ #&+ #&+ #&+&,#$%,2%0,,3#%#,)32--,$5$6"7"01+"$)-('( -#."(% -#.!)# -#.%)& -#.(#* -#.*)( -!.!)' -!.'!' -$."#& -$.%&* -$.*'( -%.&%)$$$8$)9:;<=$$>?> !"+ #*+ #'+ #'+ #'+ #&+ #&+ #&+ #&+ #&+ #&+@16-0$5$$6"!&22&'(($)-('( -(%" -))! -#."!$ -#.#)& -#.$(" -#.&(& -#.)#" -!."() -!.$)% -!.($% -$.#$%$$$8$)9:;<=$$>?> #&+ #*+ #'+ #'+ #'+ #&+ #&+ #&+ #&+ #&+ #&+#1'/"%4/+&" 567879
!"# $%%"&'!"( %)&"&#!"' #!*"*$
!"#$%&'

SENSITIVITY ANALYSIS
Over the course of this valuation, a number of assumptions and estimates needed to be
made in order to calculate a final value for the company. These variables are not
observable and there are a number of different ways to come up with various inputs
required by the valuation model. Different choices in input variables can lead to a
significantly different the final valuation. This creates a bit of uncertainty. In an effort to
find a range and size of the uncertainty, a sensitivity analysis is performed.
The idea is to determine how sensitive the final value is to the inputs that were
estimated with uncertainty. Valuation using the DCF model requires future free cash
flows to be discounted by the weighted average cost of capital. The WACC requires a
number of inputs that are estimated with uncertainty. Therefore, a good starting point is
to see how sensitivity the final valuation is to each of these variables. The sensitivity
analysis is conducted using the base case share price.
When choosing the market risk premium, the choice of 6% was made however, (Koller)
recommend using rate between 4.5 and 5.5 percent. As can be seen from the analysis, a
choice of 5% instead of 6%, if all other inputs were held constant, would have increased
the final valuation by over $175 per share.
!"#$%&'$()%&!*+,-.-/-.0&12%3#45$'67899:;< =:;> =:;; =:?= =:?@ =:?A =:?9 =:?> =:?8 <:==
9:=B !"#"$%&$' !"#"()&'% !"#"*'&+' !"#*,%&'+ !"#*+,&*' !"#*'%&*" !"#*%,&() !"#*"(&"" !$+$&''9:>B !"#*")&'% !$,%&(, !$'(&," !$"-&+( !$*(&'- !)$*&,( !),)&(" !)--&"$ !)%*&+$>:=B !))+&", !)'+&() !)%*&+$ !,$,&*- !,)+&,' !,,'&," !,-(&$' !,+(&'' !,"(&)->:>B !,)*&"$ !,'+&%% !,%(&'" !,*%&-$ !-$%&,( !-)(&** !-,(&+% !--'&%- !-%$&(+8:=B !-$+&'% !--'&%- !-''&)" !-%-&(' !-",&'+ !-*)&,, !-**&(* !+$%&*( !+-*&)-8:>B !-%+&+$ !+$,&+% !+)*&** !+-(&(+ !+++&(( !+',&+* !+($&)- !+(%&'" !+*'&%,C:=B !+-,&"% !+'"&-" !+%+&-) !+"*&+' !+*(&%' !'$-&"% !')$&") !')%&($ !'+-&,$C:>B !+",&', !'$'&"% !',$&+( !'-+&-- !'+)&$) !'+%&'- !''-&*$ !'($&)) !'"-&'";:=B !','&)( !'+(&(% !'($&)) !'%,&*$ !'%*&$( !'"'&$% !'*$&*+ !'*(&(% !()"&-$

The choice of beta estimate ranged form .85 to .96. This leads to a difference of over
$103 per share between the high and low estimates. A one point increase or decrease in
the chosen value would have changed the final value by approximately $19 per share.
For the default spread and the cost of debt, a 1% increase or decrease form the rate
chosen would have changed the share price by roughly $20 dollars.
WACC VS. Terminal Value: For these two components, an increase of .25% in the WACC
increased the final value by about 7% whereas the same percentage increase in the
terminal growth rate only changed the final valuation by 4%. Implying that the valuation
is more sensitive to small changes in WACC than small differences in the terminal
growth rate.
PRICE (TERMINAL GROWTH RATE/ WACC)$644.81 6.46% 6.71% 6.96% !"#$% !"&'% !"!$% !"('% )"#$% )"&'%
1.00% $612.19 $578.55 $547.85 $519.73 $493.90 $470.08 $448.07 $427.67 $408.731.25% $628.51 $592.83 $560.39 $530.78 $503.66 $478.73 $455.76 $434.52 $414.831.50% $646.47 $608.47 $574.07 $542.79 $514.24 $488.08 $464.04 $441.87 $421.381.75% $666.34 $625.70 $589.07 $555.90 $525.75 $498.21 $472.99 $449.80 $428.422.00% $688.44 $644.75 $605.58 $570.27 $538.31 $509.23 $482.69 $458.36 $435.992.25% $713.16 $665.93 $623.84 $586.09 $552.07 $521.26 $493.23 $467.64 $444.182.50% $740.99 $689.63 $644.14 $603.59 $567.22 $534.44 $504.74 $477.73 $453.062.75% $772.58 $716.32 $666.86 $623.05 $583.98 $548.95 $517.36 $488.75 $462.713.00% $808.73 $746.61 $692.44 $644.81 $602.62 $565.00 $531.25 $500.82 $473.253.25% $850.50 $781.27 $721.47 $669.33 $623.47 $582.84 $546.61 $514.11 $484.793.50% $899.33 $821.32 $754.69 $697.14 $646.95 $602.81 $563.69 $528.81 $497.503.75% $957.16 $868.13 $793.08 $728.97 $673.59 $625.29 $582.80 $545.15 $511.564.00% $1,026.73 $923.58 $837.95 $765.76 $704.09 $650.80 $604.33 $563.44 $527.20
!"#$%&'$()%&!*+,-.-/-.0&1234$567899:;< !"#$ %"#$ &"#$ &"'($ #"#($ #"'($ )"#($!"(($ *!+('("%' *!+(&,"#& *''%"&, *'-&"%- *'))".& *'&'".- *'%)"%!!")($ *'%("-& *.-'"#- *.#)"&. *.&(")% *.!,".' *.(#"&. *-'%".)%"(($ *-'&"%' *-,("#. *-&&"!. *-%!"%! *-!("%% *-(("(. *,'("-&%")($ *,'#"!! *,,-"%. 7899:;< *,&#"'& *,%)".% *,!-"#! *,('",#&"(($ *,!#".! *)'%"&- *)-&")( *),)"!, *))-"#- *))("&) *)#&"-,&")($ *))("(& *)&("'& *)!#"-' *)(-",# *)(!"(# *#'#"'% *#.'"%##"(($ *#',"!, *#-'",, *#,)",, *#)'"#) *#)&"-( *##."&- *##&"#!
IMPLIED MULTIPLES ANALYSIS
Similar to the purpose behind doing the sensitivity analysis, Koller, (2010) suggests using
multiples implied by the valuation as a check for reasonableness of the estimated value.
Multiples were calculated based on the base case valuation and then compared to the
company’s actual multiples provided by Bloomberg. The results show that the implied
multiples from the valuation are much higher than those provided by Bloomberg. The
differences in value may be due to a number issues. One of the issues is that Bloomberg
calculates enterprise value differently than the method used in this valuation. Another
reason is that the valuation methods and adjustments for operating leases and non-‐
operating items can vary. An attempt was made to adjust for differences in enterprise
value and other items. However, it is not unlikely that mistakes were made in this
process. In an effort to move passed the uncertainty of the implied multiples analysis,
another method was used to evaluate the plausibility of the valuation. Bloomberg
provides annalists estimates and forward consensus figures. The results show that the
valuation is in line with analyst’s projections of future value. The analyst consensus 12
month target price of $620.19 is not far from the price $621.70 estimated in this
valuation.
VALUATION OF SHOPHOUSE EXPANSION
In 2011, CMG opened an Asian inspired restaurant called ShopHouse Southeast Asian
Kitchen. Following the same philosophy and business model, ShopHouse was created to
see if Chipotle could replicate its success by extending its model to different cuisines.
The value propositions and customer base for ShopHouse are identical to those of the
Chipotle Mexican Grill restaurants. As such, expectations for its successful expansion are
quite high. This leads to the question proposed by sub-‐problem statement number 1:
“How much value does the possible expansion of ShopHouse add to the overall value
of Chipotle Mexican Grill?”

At this time, management has said that they will be focusing on building the Chipotle
brand and only slowly testing the expansion of the ShopHouse brand in select markets.
By all accounts, the company’s first restaurants have been well received by customers.
So far they have tested it on the east coast and the west coast where customer tastes are
typically more adventurous than in Middle America. The question is, how much support
is there for an Asian inspired Chipotles throughout the whole of the U.S. While there are
plenty of local Chinese restaurants in every city, there are very few national Asian chains
and even fewer in the fast food category.
Panda Express is the leading Asian inspired fast food concept in the country with over
1500 stores in the United States. The company has stated that it plans to add an
additional 100 units in 2014. (nrn.com) The service format of Panda Express is very
similar to that of Chipotles and ShopHouse. Although they lack the trendy vibe of
ShopHouse, their restaurants use the same open kitchen floor plan and order process.
Customers start at one end of the counter and choose from a selection of menu items as
they proceed down a buffet style counter to the cash register.
In an attempt to find an answer to the question proposed in the above problem
statement, additional new unit adjustments were made to the base-‐case model used to
value Chipotle. Using the assumption that Panda Express store counts are a reasonable
indicator of consumer support for a national chain of Asian inspired fast food
restaurants; ShopHouse unit growth was modeled to grow to a total of 1600 units by
year-‐end 2013. This was done by adding additional new units on top of those already
modeled in the base case. All other variables were held constant to the base-‐case. The
results suggest that if management did decide to fully develop and expand the
ShopHouse brand up to the support level of 1600 total units, it would add an additional
$136.52 to the base case share price.

VALUE OF INTERNATIONAL EXPANSION
As of the year ending 2013, Chipotle Mexican Grill has 7 restaurants in Canada, 6 in
London, England, 2 in Paris, France and 1 in Frankfurt, Germany. As with ShopHouse,
management has stated that they are focused on the domestic expansion of the Chipotle
brand and are slowly testing international markets. However, based on population
statistics, the expansion of the Chipotle brand internationally, looks very exciting. This
leads to the question proposed by sub-‐problem statement number 2:
“How much does the potential for international expansion of Chipotle Mexican Grill
add to the value of the company?”
Again, in an attempt to find an answer to the question proposed in the above problem
statement, additional new unit adjustments were made to the base-‐case model. All other
variables were held constant to the base-‐case. As for international unit growth,
population estimates suggest that Chipotle can open an additional 3,395 restaurants.
However, even though international unit numbers are estimated based on population, it
could be argued that the number be cut by at least half based on the assumption that the
appeal of Mexican food and international demand will be less than that in the U.S.
Therefore, it was decided to value the expansion based on 50% and 25% of the total
!"#$"#%!&'()*%)+,#-.)!&'/)!& !"#$ !"#% !"#& !"#' !"#( !"#) !"#* !"!" !"!# !"!! !"!$+#+)*'.#0'%-,+! #%#" #&*& #)"'+*& !"%% !$## !'#' !*'' $$(% $)&( %%$* &#&!!"#$%!&'($)*+$,-*"('&) #)" #*) !#) !%" !'% !*" $#* $&# $)' %!%!"#$%!&'$(.-/.-%(" ## ## ## ## ## ## ## ## ## ##
)11'-&2'%-,+'!"#$"#%!& #' !$ $% %* (# #"! #%) !#& $#! %#&!"#$%!&'($&!'"0!1'&-!12 & & & & & & & & & &
+#+)*'-&2'%-,+! #)& !##+*& !$( !'( $"% $&" %") %)$ &)! (#% )&&+#+)*'&30'%-,+! #&*& #)"'+*& !"%% !$## !'#' !*'' $$(% $)&( %%$* &#&! '"")4',-/5&)!&',-'+#+)*'%-,+! #$, 674 674 674 674 674 684 684 694 6:4 6;4!!!'5&(&-%&')1<%!+=&-+!/0&)"$&!)0"1(" !, %+"", #+&", #+&", #+&", #+&", #+&", #+&", #+&", #+&", #+&",'013&)$&!)0"1("4,")0"1(" $, !+"", #+&", #+&", #+&", #+"", #+"", #+"", #+"", #+"", #+"",*&5$-3$-'."0 #, #+"", "+"&, "+"&, "+"&, "+"&, "+"&, "+"&, "+"&, "+"&, "+"&,
+#+)*'!!!'5&(&-%&')1<%!+=&-+! 9>:4 ;4 74 74 74 74 74 74 74 74 744'+#+)*'5&(&-%&'?5#2+" 6@4 A34 6:4 6:4 6:4 6:4 6:4 6;4 6B4 6@4 6@4/CDE'CF'?CCGD'!CHG'ID'4'5JKJLMJ !"#$ !"#% !"#& !"#' !"#( !"#) !"#* !"!" !"!# !"!! !"!$3667$187$9:;:<=>:$)6?@? $$, $$, $$, $$, $$, $$, $$, $$, $$, $$, $$,2=A6<$B$"CDE6F::$9:8:GH@? !$, !$, !$, !$, !$, !$, !$, !$, !$, !$, !$,-IIJD=8IF40:8@$"KD:8?: ', ', ', ', ', ', ', ', ', ', ',-@L:<$-D:<=@H8>$"KD:8?:? ##, ##, ##, ##, ##, ##, ##, ##, ##, ##, ##,
!")5&'$5,/& ;B6>77 67:>9A )11+,#-)*'()*%&'/#=$)5&1'+#'+"&'.)!&'/)!&

suggested by population estimates. These numbers suggest that suggest additional
international units of 1,704 and 852 respectively. Possibly a more realistic saturation
rate would be based on the 5 largest cities in Canada, France, England, and Germany
where Chipotle already has restaurants. This estimate suggests that Chipotle could open
a total of 471 restaurants in their current international markets. All three numbers were
tested and the results suggest that if management did decide to fully develop and expand
the brand internationally, it could add an additional $160.82 / $80.21 / $44.23 on top of
the base case share price depending on how many units they open.
VALUATION OF BREAKFAST MENU
Chipotle only serves lunch and dinner and does not currently offer a nation wide
breakfast menu like most of its competitors. However, a breakfast menu is something
they have experimented with at a very limited level in two of their locations. This is due
to the fact that their lease terms for those locations require that they be open and serve
breakfast items during morning hours. The addition of a breakfast menu for Chipotle is a
real opportunity to add value to the company and could substantially increase same
store sales figures. The fact that it provides an opportunity to significantly increase
!"#$%"&#!'"&()*)(&%+$,#)-!#!$,.&,$)-&,$ !"#$ !"#% !"#& !"#' !"#( !"#) !"#* !"!" !"!# !"!! !"!$#'#&().'/)0"!#, #%#" #&*& #(** !"!' !!(( !&&& !)'% $!"( $&*# %"!! %&"'!"#$%!&'($)*+$,-*"('&) #)" #*) !#) !%" !'% !*" $#* $&# $)' %!%!"#$%!&'$(.-/.-%(" ## ## ## ## ## ## ## ## ## ##!"#$%!&'($&!'"0!1'&-!12 & & & & & & & & & &
!""#$%&#'$()*#($)%+$!)(,$!- ) #$ #( !! !* $) %* '% )$ ##%#'#&()"$1)0"!#, #)& !"% !!( !&# !() $"* $%% $)% %$" %)& &&%#'#&()$2/)0"!#, #&*& #(** !"!' !!(( !&&& !)'% $!"( $&*# %"!! %&"' &"'"3)!"-%$&,$)!")#'#&()0"!#, #$+ 453 453 463 463 463 463 463 463 463 463,,,)%$7$"0$)&890,#:$"#,/0&)"$&!)0"1(" !+ %,""+ #,&"+ #,&"+ #,&"+ #,&"+ #,&"+ #,&"+ #,&"+ #,&"+ #,&"+'013&)$&!)0"1("4,")0"1(" $+ !,""+ #,&"+ #,&"+ #,&"+ #,""+ #,""+ #,""+ #,""+ #,""+ #,""+*&5$-3$-'."0 #+ #,""+ ","&+ ","&+ ","&+ ","&+ ","&+ ","&+ ","&+ ","&+ ","&+
#'#&(),,,)%$7$"0$)&890,#:$"#, *;<3 =3 53 53 53 53 53 53 53 53 533)#'#&()%$7$"0$)+%'1#> 4?3 623 4<3 4*3 4*3 4*3 4*3 4*3 4*3 4*3 4*3-@AB)@C)+@@DA),@ED)FA)3)%GHGIJG !"#$ !"#% !"#& !"#' !"#( !"#) !"#* !"!" !"!# !"!! !"!$3667$187$9:;:<=>:$)6?@? $$+ $$+ $$+ $$+ $$+ $$+ $$+ $$+ $$+ $$+ $$+2=A6<$B$"CDE6F::$9:8:GH@? !$+ !$+ !$+ !$+ !$+ !$+ !$+ !$+ !$+ !$+ !$+-IIJD=8IF40:8@$"KD:8?: '+ '+ '+ '+ '+ '+ '+ '+ '+ '+ '+-@L:<$-D:<=@H8>$"KD:8?:? ##+ ##+ ##+ ##+ ##+ ##+ ##+ ##+ ##+ ##+ ##+
,>&%$)K%!-$ <L?;2M MM;65 &88!#!'"&()7&(0$)#').&,$)-&,$

revenues without increasing the number of new stores is very exciting. This leads to the
motivation behind the question proposed by problem statement number 3:
“How much value would the addition of offering a breakfast menu add to the value
of Chipotles?”
Currently their stores are open from 11am to 10pm. Many of their competitors are open
well before 11am. McDonalds opens at 5am in many locations and leads the breakfast
market with 31% market share. Additionally, 20% of all sales for McDonalds come from
their early morning breakfast menu. (nrn.com) Taco Bell has just launched a new
breakfast menu with opening hours starting at 7 am. Using an opening time of 7am for
Chipotle would add 4hrs of additional sales to total revenue. An increase from the
current 11 to 15 hours per day equates to 36.4%. Making the wildly ambitious
assumption that sales during breakfast hours would be equal to average sales during
normal hours would result in an increase of same store sales by the same 36.4%.
Furthermore, not every component of cost of goods sold would increase by the same
amount. This would significantly improve operating margin and capital utilization ratios.
MANAGEMENT PHILOSOPHY CREATING OR DESTROYING VALUE
Management has openly stated that based on their own research, they believe that the
primary reason the majority of their customers eat at Chipotles is because the food
tastes good. Stating further, that they believe only a small percentage of their customers
choose Chipotles because of their “”Food with Integrity” philosophy and socially
responsible business practices. This brings up the question of: If most of the companies
customers are visiting primarily due to the taste, is the large amount of time, energy, and
money the company spends on promoting these issues a poor use of resources and
unwarranted expense? As a shareholder, these practices may be viewed as a
mismanagement and gratuitous dilution of shareholder value. These thoughts lead to
the final problem statement proposed by this thesis.

“Is management’s idealistic philosophy of “Food with Integrity” and extensive
efforts to implement and promote socially responsible practices an asset and key
driver to continued growth or is it a liability and threat to future growth and
shareholder value?”
The strategic analysis concluded that the company’s consistent message and business
practices provide them with a level of authenticity that is key to their credibility with
customers and differentiation that allows them to charge a premium for their products.
For example, there is a difference between companies like McDonalds who are adopting
“sustainable products” due to consumer trends and industry competition, versus a
company like Chipotle where it is an integral part of their overall brand image and
historically consistent with their mission, vision, and value statements, marketing
efforts, and all other business practices. The problem statement asks two questions.
Both of which, have two parts.
First, are these practices an asset and key driver to continued growth? Are they an asset?
The company’s commitment and “extensive” efforts create a level of authenticity that
does truly separate them from copycat initiatives by competitors. Therefore, it is
concluded that yes, their philosophy and efforts constitute a valuable asset. Second, are
they a key driver to continued growth? This thesis has discussed the company’s future
growth opportunities through the strategic analysis and previous problem statements.
These opportunities are considered the sources of continued growth for the company.
Furthermore, it can be argued that without the success of the Chipotle brand, which is
based on these philosophies and practices, these opportunities for continued growth
would be less valuable. Therefore, it is concluded that the answer is yes, they are a key
driver for continued growth?
The second part of the problem statement proposes the question: Is management’s
idealistic philosophy of “Food with Integrity” and extensive efforts to implement and
promote socially responsible practices a liability and or a possible threat to future
growth and shareholder value? As previously discussed in the strategic analysis, the
high standards associated with their “Food with Integrity” philosophy and commitment

to socially responsible practices drastically reduces their number of possible suppliers,
making Chipotle extremely vulnerable to supply shortages. Their brand, price premiums
and a large component of their value proposition are all dependent on offering quality
ingredients that are consistent with their philosophy. Supply shortages due to Chipotles
limited supply chain could ultimately hurt both the company’s profitability and
expansion plans. Therefore, it is concluded that, management’s idealistic philosophy
of “Food with Integrity” and extensive efforts to implement and promote socially
responsible practices are in fact both a liability and threat to future growth and
consequently shareholder value.
CONCLUSION
The original motivation behind this thesis came from the authors desire to better
understand, and gain incite into how accurately annalists, investors, and the overall
market were valuing Chipotle’s various growth opportunities and the company as a
whole. The primary problem statement specified that the purpose of this thesis was to
determine the fair market value of Chipotle Mexican Grill Inc. In addition, as there has
been much debate over the value of the company’s growth prospects, three additional
sub-‐statements relating to future growth opportunities were investigated.
The starting point for this investigation was an internal and external strategic analysis.
The analysis concluded among other things that the company has built a strong brand,
and positive brand image. Chipotle has a strong business model that is both consistent
with their brand and the values of their customers. The company has a unique and
valuable mix of passionate leadership, experienced corporate development teams, and
motivated frontline employees. These qualities help to explain the current and past
success of the company. This success, however, has drawn the attention of others and
threatens their future profitability both by increasing industry competition for customer
visits and increasing the competition for an already limited supply of sustainably raised
ingredients. The historical financial analysis showed that Chipotle has been very
successful in managing their operating margins and their fixed assets. The combined
strategic and financial analyses show that the company is very vulnerable to food costs

and inventory shortages as well as being sensitive to labor costs as these have in the
past helped to offset increasing food costs. These issues were modeled into various
scenarios to estimate their impact on the value of the company. The scenarios showed
that increased competition, food costs, and labor costs could reduce the estimated value
of the company by over $100 per share. On the other hand, the scenario analysis also
demonstrated how the company’s value could be increased significantly with
management’s decision to accelerate the expansion rate of their ShopHouse brand. In
addition, the analysis suggests that Chipotle has the ability to continue growth in same
store sales by adding to their limited menu. The combination of these scenarios
produced an estimated share price of $705.56. In the end, a scenario weighted average
estimated the current fair value of the company to be $621.70. In addition to the
weighted average valuation, three additional value adding growth opportunities were
examined. The results showed that the company could possibly open as many as 1600
ShopHouse restaurants which would add roughly $136 per share in additional value.
The potential for international expansion of the Chipotle brand restaurants was
investigated as well. Based on the results, Chipotle could potential add an additional $80
to $160 per share depending on how many restaurants they ultimately choose to open.
One interesting result that came from this analysis was the realization that opening an
additional 471 units, in their current international locations, only added $44 to the
company’s share price. This may explain why the company has repeatedly stated that
they do not have any near term plans to accelerate international expansion. The
addition of offering a breakfast menu on the other hand appears to be possibly a very
profitable opportunity for the company in the future.

REFERENCES
Grant, R. M. (2010). Contemporary Strategy Analysis: Text Only. John Wiley and Sons.
Osterwalder, A., & Pigneur, Y. (2010). Business model generation: a handbook for
visionaries, game changers, and challengers. John Wiley & Sons.
Koller, T., Goedhart, M., & Wessels, D. (2010). Valuation: measuring and managing the
value of companies (Vol. 499). John Wiley and Sons.
Singh, A. (2013). Is Leasing a Substitute or Complement to Debt? Evidence from the
Restaurant and Retail Industry. Journal of Hospitality & Tourism Research, 37(2), 155-‐
183.
Rauh, J. D., & Sufi, A. (2010). Explaining Corporate Capital Structure: Product Markets,
Leases, and Asset Similarity.
Peter, J. L. (2011). Approximate Firm Valuation with Operating Leases. Journal of
Business Valuation and Economic Loss Analysis, 6(1), 1-‐22.
Bostwick, E. D., Fahnestock, R. T., & O'Keefe, W. T. (2013). Effects of lease capitalization
techniques on key measures of financial performance. Journal of Finance &
Accountancy, 12.
Damodaran, A. (2008). Damodaran on valuation. John Wiley & Sons.
Damodaran, A. (2012). Investment valuation: Tools and techniques for determining the
value of any asset. John Wiley & Sons.
Bruner, R. F., Eades, K. M., Harris, R. S., & Higgins, R. C. (1998). Best practices in
estimating the cost of capital: survey and synthesis. Financial Practice and Education, 8,
13-‐28.
Reding, N. (2014). THE MEAT RACKET The Secret Takeover of America's Food Business.

Damodaran, A. (2012). Investment valuation: Tools and techniques for determining the
value of any asset. John Wiley & Sons.
Bruner, R. F., Eades, K. M., Harris, R. S., & Higgins, R. C. (1998). Best practices in
estimating the cost of capital: survey and synthesis. Financial Practice and Education, 8,
13-‐28.
Fromm, J., & Garton, C. (2013). Marketing to Millennials: Reach the Largest and
Most Influential Generation of Consumers Ever. AMACOM Div American Mgmt Assn.
Chipotle Mexican Grill Inc. (2006). Annual Report 2005. Delaware (US)
Chipotle Mexican Grill Inc. (2007). Annual Report 2006. Delaware (US)
Chipotle Mexican Grill Inc. (2008). Annual Report 2007. Delaware (US)
Chipotle Mexican Grill Inc. (2009). Annual Report 2008. Delaware (US)
Chipotle Mexican Grill Inc. (2010). Annual Report 2009. Delaware (US)
Chipotle Mexican Grill Inc. (2011). Annual Report 2010. Delaware (US)
Chipotle Mexican Grill Inc. (2012). Annual Report 2011. Delaware (US)
Chipotle Mexican Grill Inc. (2013). Annual Report 2012. Delaware (US)
Chipotle Mexican Grill Inc. (20014). Annual Report 2013. Delaware (US)
Chipotle: Chipotle Story. 2014. Chipotle: Chipotle Story. [ONLINE] Available
at: http://www.chipotle.com/en-‐us/chipotle_story/chipotle_story.aspx. [
Chipotle: Food With Integrity. 2014. Chipotle: Food With Integrity. [ONLINE] Available
at: http://www.chipotle.com/en-‐us/fwi/fwi.aspx. [
NRN names the restaurant industry's power players | Nation's Restaurant News. 2014. NRN
names the restaurant industry's power players | Nation's Restaurant News. [ONLINE] Available
at: http://nrn.com/nrn-‐50-‐power-‐list-‐2014.
Beef Sustainability :: AboutMcDonalds.com. 2014. Beef Sustainability :: AboutMcDonalds.com.
[ONLINE] Available

at:http://www.aboutmcdonalds.com/mcd/sustainability/signature_programs/beef-‐
sustainability.html.
How state minimum wage hikes impact restaurants | H.R. & Training content from Nation's
Restaurant News. 2014. How state minimum wage hikes impact restaurants | H.R. & Training
content from Nation's Restaurant News. [ONLINE] Available
at: http://nrn.com/government/how-‐state-‐minimum-‐wage-‐hikes-‐impact-‐restaurants.
Photo Gallery: Top 10 food and drink trends at 2014 NRA Show | Nation's Restaurant News.
[ONLINE] Available at:http://nrn.com/food-‐trends/top-‐10-‐food-‐and-‐drink-‐trends-‐2014-‐nra-‐
show.