Chipotle Mexican Grill Inc. · Chipotle Mexican Grill Inc. ... Chipotle is the market leader in the...
18
Stock Valuation Report July 6 th , 2016 Chipotle Mexican Grill Inc. Turki I. AlSabbar Student Investment Management (SIM)
Transcript of Chipotle Mexican Grill Inc. · Chipotle Mexican Grill Inc. ... Chipotle is the market leader in the...

Stock Valuation Report
July 6th, 2016
Chipotle Mexican Grill Inc.
Turki I. AlSabbar
Student Investment Management (SIM)

Summary
Stock Valuation Report: Chipotle Mexican Grill Inc., July 6th, 2016
Ticker CMG
Sector Consumer Discretionary
Industry Restaurants
Current Price (USD) as of (07/01/2016) $393.91
Price Target (USD) $234.7
Total Projected Return $111,447
Dividend Yield (N/A)
Downside 40.4%
Recommendation: SELL
Market Capitalization (USD) $11.57 Bn.
Shares Outstanding 29.20 Mn.
52-week Price Range $384.77 - $758.61
Beta 0.33
Market Data
Revenue (USD) $4.50
Revenue Growth (Y/Y) 10%
Operating Income (USD) $764 Mn.
Financial Data (FY2015)
Fund SIM, OSU
Instructor Royce West, CFA
Analyst Turki I. AlSabbar
Phone +1 614-397-6973
Email [email protected]
Analyst/Fund Information
0
100
200
300
400
500
600
700
800
CMG 12-Month Stock Price Chart
Source: NASDAQ
Summary: Chipotle has been on the forefront of
quick-casual restaurant segment in the US for the
last two decades. It is among the few companies in
the industry that recorded same-store sales growth
every quarter since inception. The management has
been conservative in maintaining sound capital
structure and carefully driving growth to leverage
market opportunity. Stock performance over the last
two decades have been a testimony to the good
performance and the stock has delivered attractive
returns in the long run. However, hygiene concerns
have recently emerged and that could substantially
dilute brand equity that is built upon healthy food.
Coupled with high penetration rate of the company
in its target segment, increasing competition, and
input cost pressure could have adverse impact on
long term operating margins and same-store sales
growth. In my view, the current valuations don't
provide margin of safety for conservative investors,
and therefore I assign SELL rating on the stock with
a downside target of $234.7 over the next 12-
months. It implies a correction of 40.4% from the
current stock price of $393.91.
Investment Thesis: I assign a sell rating on
Chipotle due to the following reasons. First, recent
regulatory issues about E-Coli and Norovirus
contamination in the food offered by Chipotle have
caused significant dilution in the brand equity that is
built upon offering quality food. Second, increasing
competition in the fast food service restaurant
segment is likely to result in more moderate same-
store sales growth than the historical rates for
Chipotle. Third, increasing food, beverages, and
packaging costs in an environment of higher
competition and fragile real GDP recovery are
likely to limit company's ability to pass input cost
pressure to final consumers and therefore would put
pressure on operating margins. Finally, increasing
costs of labor due to recent regulatory changes
could cause contraction in operating margins
Risks: Risks include resolution of E-Coli and
Norovirus incidents earlier than expected, lower
agriculture and crude oil prices, successful
international expansion earlier than anticipated,
more successful and quicker scalability of
diversification in other food segments, quicker
break-even period for newly opened stores.

Table of Contents
Company Overview 3
Business Segments 3
Market Share, Addressable Market, Growth Drivers 3
Sustained Competitive Advantage 4
Recent Important News and Events 5
Investment Thesis 5
Economic Analysis 5
Demand Drivers 5
Consumer Confidence 5
Consumer Spending 5
Fundamental Drivers of Profitability 6
Food Commodity Costs 6
Labor Costs 7
US Unemployment Rate 7
Financial Analysis and DCF Model 7
Operating Margin 7
Food, Beverage, and Packaging Costs 7
Crude Oil Prices 8
Labor Costs 8
Break-Even Period 8
Revenue Growth 8
Earning Per Share (Diluted EPS) 8
Valuation 8
DCF Model 9
Relative Valuation 9
Final Price Target 11
Risks 11
Resolution of E-Coli and Norovirus 11
Lower Agriculture and Crude Oil Prices 11
International Expansion 12
Scalability of Diversification 12
Break-Even Period For New Stores 12
Conclusion 12
References and Appendix 13

Overview Risks ConclusionInvestment
3Company Overview
Chipotle Mexican Grill, Inc. operates Chipotle
Mexican Grill restaurants. The company was
founded by Steve Ells, a classically trained chef in
1993. Most of these restaurants operate on fast-
casual Mexican food concept and are located in the
US. In order to diversify the risk, the company has
gradually been expanding into international markets
and other food segments, See (Figure 1: Business
Segments).
Figure 1: Business Segments
Chipotle Restaurants
• US (1,971)
• Canada (11)
• England (7)
• France (4)
• Germany (1)
Mexican food: Burritos, tacos, burrito bowls,
salads
ShopHouse Southeast Asian
Kitchen
13
Asian cuisine
Pizzeria Locale restaurants
(Indirectly held through
investment in a separate entity)
3
Fast casual pizza concept
# of Outlets
Sub-segment
# of Outlets
Sub-segment
# of Outlets
Sub-segment
Restaurants Segments
Based on the type of food served, the share of
Mexican cuisine is 5.7%. It is considered as a
niche though rapidly growing segment. Chipotle
is the market leader in the segment and has
recorded substantial market share gains over the
last two decades.
Fast-food segment is further divided into fast-
casual in which Chipotle operates. It refers to a
growing group of restaurant operators that
provide higher quality food than the traditional
fast-food restaurants do but at a lower price-point
of full-service restaurants. Historically, Chipotle
has grown at a higher growth rate than the
industry’s growth in fast-food segment.
Following factors are the growth drivers for
consumers' preference for fast-casual segment:
• Limited service or self-service format
• Average check generally between $8 and $12
• Food prepared to order
• Fresh (or perceived as fresh) ingredients
• Innovative food suited to sophisticated taste
• Upscale or highly developed interior design
• Alcohol may be served
Technomic (a reputed restaurant market research
firm based in the US) expects the market share of
fast casual segment to increase to 10% in the long
run from the current 7.3%. Quality food, fast
service, and reasonable price are expected to be
the main driver for this shift. Market leaders such
as Chipotle are likely to gain from the shift due to
their strong brand equity, robust vendor base, and
vast reach.
Market Share, Addressable Market, Growth Drivers
Restaurants industry is driven by changing
consumer preferences and population shift. The size
of the industry in 2015 was $683.4 billion. Eating
places (operating segment of Chipotle) is the largest
segment accounting for $455.9 billion.
SALES (BIL. $)
Commercial food service, total 624.3
Eating places 455.9
Bars and taverns 20.0
Managed services 47.1
Loding place restaurants 34.8
Retail, vending, recreation, mobile 66.4
other food service 56.6
TOTAL US FOOD SERVICE SALES 683.4
Source: Nation’s Restaurant News
Source: Ir.Chipotle.com, (Form 10k 2015, Annual Report 2015)

Overview Risks ConclusionInvestment
4Sustained Competitive Advantage
Founder, Chairman, and co-CEO Steve Ells is a trained chef. His approach has led to establishing unique
approach to cook and focus on quality. In my opinion, the company has strongly conveyed its desired
message of "Food with Integrity" in its business practices. Based on my primary research by visiting the
outlets of competitors, analyzing advertising campaigns, and by giving attention to small details, I have
identified the following unique attributes in the business practices of Chipotle. Over the last 2 decades,
the company has been able to gain market share, record robust same-store sales growth, and command
pricing power due to these competitive advantages.
Scope of Operations Unique Attributes Competitive Advantage For Chipotle
OwnershipAll restaurants are company owned and no
franchise arrangement
Better control over the quality of food and services
Quality of food
• Year 2000: Starting serving naturally raised
pork
• Year 2002: started serving naturally raised
chicken
• Year 2004: started using zero-trans fat frying
oil
• Year 2007: Made all sour cream and cheese
products rBGH free
• Year 2009: starting using naturally raised beef
• Year 2010: starting using certified organic
black beans
• Stated policy of not using unnatural hormones
or anti-biotic usage for raising meat and
additives
• Better customer loyalty
• Increased pricing power compared to competitors
• Better ability to raise prices due to cost increases. In
the past it has not impacted same-store sales growth
Supply chain
• Stated preference to buy from local farms
(within 300 miles from a restaurant)
• Preference to buy from family farms
• Increased feeling of community ownership within
the location of the restaurants
• Better longevity of the robust supply chain,
acquisition of local knowledge and loyal customers
base from the community
• High consistency in the quality of ingredients
Architecture of the
restaurants
• Most of the restaurants are designed by
sculptor Bruce Gueswel
• Each restaurant aims for hip and urban feel
• Each location has industrial, but little decor,
which consists of halogen lighting, metal
tabletops, wooden benches and seats, concrete
floors, arched metal ceilings, exposed
ductwork with artwork
• Use of open kitchen
• Consistency in customer experience
• Casual yet modern look
• Design supports the ability to deliver fast
• High quality architecture compliments high quality
food to ensure premium positioning
• Creating atmosphere of trust between store
employees and customers
Focus on
sustainability
• Substantial focus on sustainable construction
such as solar panels and wind turbines
• Enhances brand equity due to increased customer
focus on sustainability
Advertising
• During early years, the advertising was
entirely by word-of-mouth
• Now it advertises on billboards and on radio
• Advertising theme: witty, edgy campaigns
poking fun
• Giving out burritos on Halloween
• Cost optimization
• Better match with the desired ambience of
restaurants as casual outlets
• Positioning restaurants as a place to relax while
having food
• Enhancing the image as socially responsible
organization
Human resource
practices
• Despite having 59,330 employees (as on
December 31, 2015), none of the employee is
unionized or covered by a collective
bargaining agreement
• Reflects trust of employees in management's ability
to devise employee friendly policies
Source: www.sec.gov
Overview Risks ConclusionInvestment
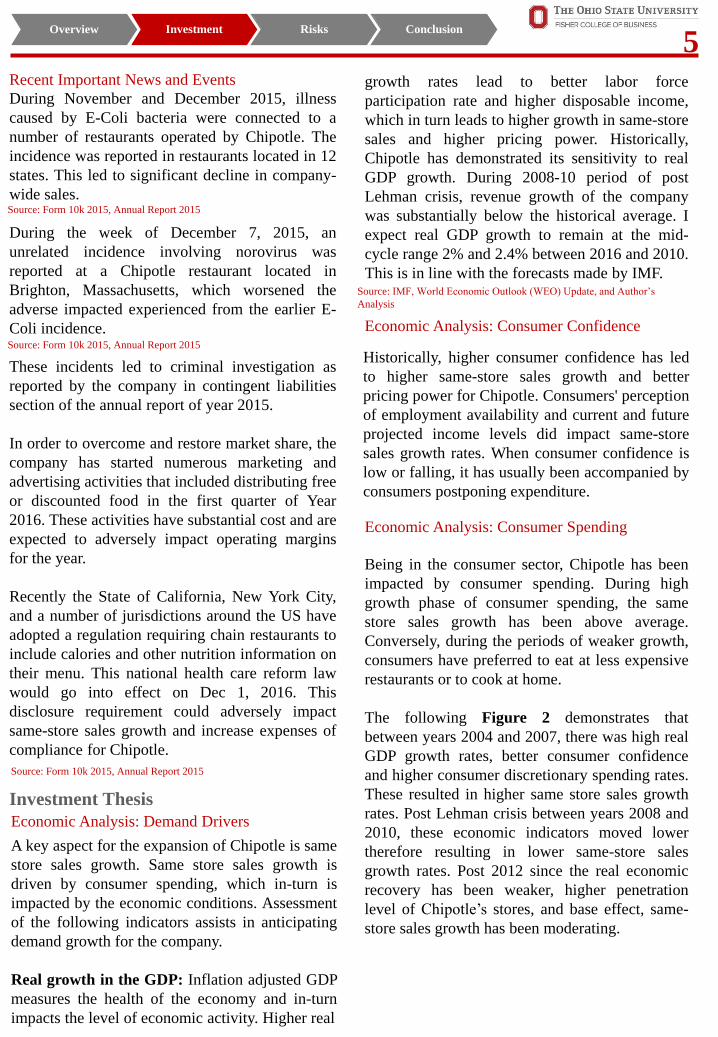
5Recent Important News and Events
During November and December 2015, illness
caused by E-Coli bacteria were connected to a
number of restaurants operated by Chipotle. The
incidence was reported in restaurants located in 12
states. This led to significant decline in company-
wide sales.
During the week of December 7, 2015, an
unrelated incidence involving norovirus was
reported at a Chipotle restaurant located in
Brighton, Massachusetts, which worsened the
adverse impacted experienced from the earlier E-
Coli incidence.
These incidents led to criminal investigation as
reported by the company in contingent liabilities
section of the annual report of year 2015.
In order to overcome and restore market share, the
company has started numerous marketing and
advertising activities that included distributing free
or discounted food in the first quarter of Year
2016. These activities have substantial cost and are
expected to adversely impact operating margins
for the year.
Recently the State of California, New York City,
and a number of jurisdictions around the US have
adopted a regulation requiring chain restaurants to
include calories and other nutrition information on
their menu. This national health care reform law
would go into effect on Dec 1, 2016. This
disclosure requirement could adversely impact
same-store sales growth and increase expenses of
compliance for Chipotle.
Investment Thesis
Economic Analysis: Demand Drivers
A key aspect for the expansion of Chipotle is same
store sales growth. Same store sales growth is
driven by consumer spending, which in-turn is
impacted by the economic conditions. Assessment
of the following indicators assists in anticipating
demand growth for the company.
Real growth in the GDP: Inflation adjusted GDP
measures the health of the economy and in-turn
impacts the level of economic activity. Higher real
growth rates lead to better labor force
participation rate and higher disposable income,
which in turn leads to higher growth in same-store
sales and higher pricing power. Historically,
Chipotle has demonstrated its sensitivity to real
GDP growth. During 2008-10 period of post
Lehman crisis, revenue growth of the company
was substantially below the historical average. I
expect real GDP growth to remain at the mid-
cycle range 2% and 2.4% between 2016 and 2010.
This is in line with the forecasts made by IMF.
Economic Analysis: Consumer Confidence
Historically, higher consumer confidence has led
to higher same-store sales growth and better
pricing power for Chipotle. Consumers' perception
of employment availability and current and future
projected income levels did impact same-store
sales growth rates. When consumer confidence is
low or falling, it has usually been accompanied by
consumers postponing expenditure.
Economic Analysis: Consumer Spending
Being in the consumer sector, Chipotle has been
impacted by consumer spending. During high
growth phase of consumer spending, the same
store sales growth has been above average.
Conversely, during the periods of weaker growth,
consumers have preferred to eat at less expensive
restaurants or to cook at home.
The following Figure 2 demonstrates that
between years 2004 and 2007, there was high real
GDP growth rates, better consumer confidence
and higher consumer discretionary spending rates.
These resulted in higher same store sales growth
rates. Post Lehman crisis between years 2008 and
2010, these economic indicators moved lower
therefore resulting in lower same-store sales
growth rates. Post 2012 since the real economic
recovery has been weaker, higher penetration
level of Chipotle’s stores, and base effect, same-
store sales growth has been moderating.
Source: Form 10k 2015, Annual Report 2015
Source: Form 10k 2015, Annual Report 2015
Source: Form 10k 2015, Annual Report 2015
Source: IMF, World Economic Outlook (WEO) Update, and Author’s
Analysis

Overview Risks ConclusionInvestment
6Figure 2
US: Consumer Sentiment IndexUS: Discretionary Consumer Spending
2004-07:
Robust
economic
conditions
leading to
higher
same-store
sales
growth
rates
2008-10:
Economic
uncertainty
post Lehman
crisis resulted
in sharp drop
in same-store
sales growth
2012-
Present:
Weak
economic
recovery
led to
subdued
growth in
same store
sales
Fundamental Drivers of Profitability: Food
Commodity Prices
Food and packaging costs are the largest
component of the cost structure for Chipotle. Over
the last 10-years, these have ranged between
30.6% and 34.6%. Corn, meat, vegetables, edible
oils are major ingredients of food items. Most of
the packaging material is petroleum based,
therefore fluctuation in crude oil prices impact the
cost of packaging material. As exhibited in the
figure below, between 2009 and 2010, the CRB
Index touched the low of 190 and that resulted in
food, packaging and beverage cost to decline to
30.6%. Since all stores are owned by Chipotle, the
sensitivity to commodity prices are higher for the
company compared to franchise operated business
models by other competitors. This is because for
franchise owned stores, food costs are incurred by
the franchisee and not the franchisor. For
Chipotle, all food and packaging costs are
incurred by the company. During the current cycle
of low commodity prices, these costs have not
come down because customers have been trading
down (buying low priced items) reflecting weaker
real economic recovery post Lehman crisis.
Consumers' tendency to trade-down coupled with
moderate same-store sales growth have limited
Chipotle’s pricing power, and a large proportion
of the commodity cost increases have been
absorbed by the company in the recent years.
Chipotle: Same store sales growth rates since
inception: Q1 Q2 Q3 Q4 FY
2014 2.0% 2.0% 2.0% 2.0% 2.0%
2013 1.0% 5.5% 5.8% 6.6% 4.7%
2012 12.7% 8.0% 4.8% 3.8% 7.3%
2011 12.4% 10.0% 11.3% 11.1% 11.2%
2010 4.3% 8.7% 11.4% 12.6% 9.4%
2009 2.2% 1.7% 2.7% 2.0% 2.2%
2008 10.2% 7.1% 3.1% 3.5% 5.8%
2007 8.3% 11.6% 12.4% 10.6% 10.8%
2006 19.7% 14.5% 11.6% 10.1% 13.7%
2005 4.1% 9.6% 11.5% 14.3% 10.2%
2004 23.2% 13.2% 8.9% 10.4% 13.3%
2003 25.3% 24.6% 24.7% 23.4% 24.4%
2002 16.8% 18.8% 15.5% 17.0% 17.0%
2001 22.5%
2000 16.4%
1999 27.1%
1998 14.9%

Overview Risks ConclusionInvestment
7In order to sustain profitability, the company has
undertaken various cost cutting initiatives. These
include reducing wastage and optimizing logistics
costs for sourcing raw material. Due to these
initiatives, I expect food, beverage, and packaging
cost to decline to 33% and 27% respectively in
FY2017 and FY2018.
Chipotle:
Food,
packaging, and
beverage cost
as a percentage
of sales
2015 33.4%
2014 34.6
2013 33.4%
2012 32.6%
2011 32.5%
2010 30.6%
2009 30.7%
2008 32.4%
2007 31.9%
2006 31.4%
2005 32.2%
2004 32.7%
2003 33.3%
2002 33.1%
2001 34.4%
2000 35.3%
Total Return: Core Commodity CRB
Index:
Fundamental Drivers of Profitability: Labor
Costs
Labor costs are the second major component of the
cost structure of Chipotle. Over the last decade,
these costs have been range bound between 22% and
24%. However unemployment rates have been
falling even though the quality of employment has
been lower than the pre-Lehman crisis levels.
Chipotle relies heavily on the availability of a
dependable work force at the low end of the national
pay scale. In such an environment coupled with
robust national employment outlook, the company
has to raise pay levels to attract and retain workers.
Minimum wage legislation, regional labor shortages,
and higher healthcare costs could increase the labor
costs. I have projected labor costs to be in the range
of 25% to 26% in my financial model.
Fundamental Drivers of Profitability:
Unemployment Rate
Financial Analysis and DCF Model
As shown in the appendix, my estimates for both
revenue growth and operating margins are more
conservative than consensus estimates. The
difference is on the following account:
Operating Margin
2015
(Actual)
2016
(Estimated)
2017
(Estimated)
2018
(Estimated)
My
Projection17.0 5.1% 13.1% 19.1%
Analysts'
Consensus- 6.2% 14.4% 19.6%
My projections are more conservative than
analysts' consensus. It can be attributed to the
following discrepancies:
Food, Beverage, and Packaging Costs: As per
consensus opinion, food costs would continue
to remain moderate over the next two years. In
my view, due to severe drought in major
agriculture producing countries such as Brazil
(recorded among the worst drought in the last
80 years) during 2014 and 2015, the agriculture
production has decreased. The impact of El-
nino has also affected agricultural crops in the
other parts of the world. Consequently, the
prices of products such as milk, coffee, corn
and spices would remain at an elevated levels.
Adverse agriculture crops lead to higher prices
for meat products such as beef, pork, and
poultry. All these are key ingredients of the
menu of Chipotle. These trends have already
reflected in the higher levels in CRB index in
which agricultural commodities and meat
products account for a major part.
Source: US Bureau of Labor Statistics, from Tradingeconomics.com
Source: Author’s Analysis

Overview Risks ConclusionInvestment
8Since Chipotle's brand positioning is based on high
quality food ingredients, it is unlikely to
compromise on the quality of inputs, and therefore
these costs would remain high.
While analysts expect same-sales growth rates to
return to the historical trend resulting in increased
ability of Chipotle to pass the cost pressure to
consumers by raising prices, I believe that such cost
inflation would largely be absorbed by the company
due to fragile real economic recovery and increased
competition in the sector.
Crude Oil Prices: Most of the packaging
material is based on crude oil derivatives.
Analysts expect crude prices to remain benign
below $50 per barrel. In my opinion, due to
persistence of supply side constraints, crude
prices (WTI) could move to higher levels. This
would cause packaging costs to move higher.
Labor Costs: Analysts project labor cost to
remain at a long term average of 22-23.5% of
sales. In my opinion, robust employment
outlook, minimum wage regulation, and higher
healthcare costs would result in labor costs
moving above the long term average to 25%
over the next 3-years.
Break-Even Period: Chipotle expects to
continue expansion at 220-235 restaurants per
year. Historically, the break-even period of
these restaurants has been 12-months. Break-
even period is defined as the duration in which
the restaurant stops incurring operating losses
and expects to become profit neutral. Analysts
expect the break-even period to remain at the
historical level. In my opinion, increased
competition, down trading by customers for
lower value products, and fragile real
economic recovery could cause break-even
period to increase from 12 months to 15-18
months. It would result in delayed contribution
of new restaurants in operating profits.
Revenue Growth
My estimates for revenue growth are more
conservative than analysts' consensus. Analysts
are more bullish on the prospects of international
expansion of the company. They also expect that
Chipotle would continue to find attractive niche
within the food segment (such as Asian Cuisine
and pizza) to record robust growth.
Revenue Growth 2016-2018 (CAGR %)
My projection 1.0
Analysts' consensus 10.0
In my view, international expansion is a long-term
strategy for Chipotle. Based on historical
evidence, the management is conservative in
expansion strategies. It patiently tests its business
model in new location. Acquiring local knowledge
and build local vendor base to ensure food quality
are of immense importance for the company.
However this requires time. I believe that the
company plans to expand into newer niche but
without diluting its corporate image, therefore it
would be more conservative on such aspect as
well. There has been increasing competition in the
US markets and newer players are as nimble and
technology savvy as has been Chipotle. In view of
these, I have projected 1% revenue CAGR for the
company between 2016 and 2018.
Earning Per Share (Diluted EPS)
My EPS estimates are more conservative than the
consensus. This is due to:
• Muted revenue growth projections than the
consensus
• Relatively lower operating margins than the
consensus
Due to relatively conservative estimates, my view
on the projected stock price is more moderate
than the consensus.
Valuation
Since restaurant industry has steady and stable
cash flows, and Chipotle is a major player with
the focus on profitable growth, DCF is an
appropriate model to assess the stock value. I
have assigned 60% weight to the DCF based
valuation.
Increasing competition and disruption in the
traditional business models of restaurants has
made the industry more dynamic. In such as
Source: Author’s Analysis

Overview Risks ConclusionInvestment
9Scenario, multiples based valuation gains
importance as competitive landscape in the
marketplace could have impact on the performance
of Chipotle. I have done valuation based multiples
at 3 levels:
• 1: Chipotle vs S&P 500
• 2: Chipotle vs Consumer Discretionary Sector
• 3: Chipotle vs Peers
DCF Model
The appendix contains Discounted Cash Flow
(DCF) Model. I have taken discount rate of 10%,
and terminal growth rate of 4%. The model implies
a final target price of $226 per share.
The S&P 500 is currently trading at a forward P/E
of 16.6. Based on the P/E of consumer discretionary
sector, the implied growth rate is 5.8%. However
over the long run, I expect P/E of Chipotle to be at a
discount with consumer discretionary sector and
have used 4% terminal growth rate in my DCF
model. This is on account of relatively high
penetration level of the stores in the US, increasing
competition, and Mexican cuisine accounting for a
larger proportion in the revenue stream compared to
bigger competitors who are well diversified across
different food categories. Even though the company
has provided indication of adding 220-235 stores
per year for the next few years, in my view focus on
profitable growth and increasing competition might
lead the company to reconsider its expansion plans.
While other analysts are optimistic about
international expansion plans, I believe that due to
conservative nature, the management might build
international base more gradually than the
expectations of the analysts, Source: Author’s Analysis and
Annual Report 2015.
I have used the discount rate of 10% on account of
increasing food safety regulations resulting in
higher potential risk for companies operating in
food segment. Recent cases of E-Coli incident
indicate the potential dilution in brand equity and
potential adverse impact on long term revenue
growth.
Figure 3 below illustrates the target stock prices
given adjustments to both discount rate and
terminal growth rates.
10.75% 11.00% 11.25% 11.50% 11.75%
2.00% $196.89 $191.42 $186.25 $181.35 $176.70
2.25% $203.18 $197.37 $191.89 $186.70 $181.79
2.50% $209.85 $203.67 $197.85 $192.36 $187.16
2.75% $216.93 $210.36 $204.17 $198.34 $192.83
3.00% $224.47 $217.46 $210.87 $204.67 $198.82
3.25% $232.52 $225.02 $218.0 $211.38 $205.16
3.50% $241.12 $233.08 $225.56 $218.51 $211.89
3.75% $250.33 $241.70 $233.65 $226.11 $219.04
4.00% $260.23 $250.94 $242.28 $234.21 $226.65
4.25% $270.89 $260.86 $251.54 $242.87 $234.77
Figure 3: Sensitivity analysis of target price to
growth rate (row) and discount rate (column)
The DCF model also accounts for the value of
Chipotle's cash acquisition. In December 2015,
the company reported cash and liquid investments
of $0.67 million. Since the company is debt free, I
have provided $0.22 million for expansion
initiatives to achieve projected revenues and to
maintain liquidity for operating purposes. Then, I
added $0.43 million (or $7.6 per outstanding
share) to the valuation model to arrive at a DCF
implied price of $226.0 per share. The DCF
implied price implies a discount of 42.6% from
the current stock price of $393.91.
I expect Chipotle to maintain the large cash
balance due to its conservative management,
requirement of growth plans, and policy to
maintain relatively conservative capital structure.
Relative Valuation
As a sector, consumer discretionary sector is
considered a stable cash flow business with
moderate growth rates due to relatively saturated
market opportunity, steady population growth, and
low working capital intensive business model.
Although the sector has been trading at a
moderate premium to S&P 500 valuation, the
valuations of the sector have been range bound
over the 10-years. This is contrary to the period
before 2003-04 when the sector used to command
higher valuation multiples compared to S&P 500
valuations. In my opinion, this is due to increasing
competitive intensity leading to more moderate
growth opportunities and lower operating margins
than before.
Source: Author’s Analysis

Overview Risks ConclusionInvestment
10Table: Sector's Historical Multiples' Range (10Y
CMG Absolute Valuation)
High Low Median Current
P/E 64.79 21.66 36.86 25.92
P/S 5.17 1.52 3.43 2.75
P/B 10.75 3.20 7.42 5.73
P/CH 32.70 10.23 22.32 18.13
P/EBITDA 30.42 10.57 18.23 13.86
Sector's Stock Price Performance Chart Compared
to S&P 500
0
500
1000
1500
2000
2500
3000
3500
7/7/2011 7/7/2012 7/7/2013 7/7/2014 7/7/2015
CMG S&P 500
Table: Stock Relative Valuations Compared to S&P
500. (10Y CMG Relative to S&P 500)
High Low Median Current
P/E4.12 1.54 2.74 1.95
P/S4.32 1.19 2.51 1.52
P/B5.78 1.23 3.15 2.67
P/CH4.82 0.92 2.48 2.19
P/EBITDA5.05 1.33 2.70 1.71
While the company is currently trading at a
premium to the valuations of consumer
discretionary sector, in my view the earnings are
lower than the long term average. This is partly
due to expenses on rebuilding the brand post E-
Coli incident in Year 2015. The incident has also
brought down the revenue growth rate due to
aversion of some consumers to visit company's
outlets until the inquiry is complete and the issue
to satisfactory resolved. Lower than historical
operating margins and revenue growth have
caused valuation multiples including P/E, P/B,
P/CH, P/EBITDA to be on the higher side as
earnings are lower than the normalized scenario.
Figure 4: Sector's Historical Multiples' Range vs
Peers (9Y)
P/E P/S P/B P/CHP/EBI
TDA
Average 23.53 1.48 3.06 11.55 9.92
CHIPOTLE 41.92 2.22 3.91 17.63 18.23
LUBY'S INC 13.71 0.78 1.64 9.92 7.52
MCDONALD'S CORP 18.71 2.53 3.45 12.60 9.38
BOB EVANS FARMS 23.49 0.81 1.85 8.85 7.76
PANERA BREAD 29.66 2.10 4.43 16.56 12.87
Source: Author’s Analysis
Source: Bloomberg
Source: Author’s Analysis Source: Author’s Analysis
Figure 4 below shows Chipotle's price and
enterprise value based multiples relative to its
peers. As indicated by the wide range of these
results within each multiple, the companies are at
a different growth phases, management strategies,
and market presence. Due to dominant proportion
of Mexican cuisine in the capital structure,
Chipotle's performance is largely driven by
dynamics in this niche than more diversified
competitors. Within these limitations, I believe
that Chipotle is strongly positioned within the
consumer discretionary sector and management
has done commendable job in ensuring consistent
growth, debt free balance sheet, and strong brand
equity.

Overview Risks ConclusionInvestment
11However, the company suffers from long term
structural limitations:
• Relatively concentrated presence in Mexican
Cuisine segment therefore increasing the sub-
segment concentration risk
• Limited international presence
• Recent lawsuits diluting the brand equity of the
company since the brand is built on high food
quality
Compared to Chipotle, other similar sized
competitors like McDonalds and Panera Bread
score higher therefore have less risky and more
mature business model.
Final Price Target
For the final price target, I undertook a weighted
average of the target prices from the implied
prices from DCF valuation and valuation
multiples. I assigned 60% weight to the DCF
implied valuation as the sector is characterized by
low working capital requirement and steady cash
flows. In my opinion, the certainty of the cash
flow for Chipotle is high considering the strong
brand equity and conservative management
approach, the conditions suitable to apply DCF
model.
Given the disparities among different players, I
have assigned 40% weight on valuation of
multiples. Since Chipotle is impacted by market
and competitive dynamics, the weight is
appropriate in my view. In order to further
normalize the impact of Chipotle's lower than
normalized earnings due to the recent E-Coli
incident, I have assigned equal weight to different
multiples based on earnings, sales, book value,
cash flow, and EBITDA
Table: Final Price Target For Chipotle's Stock
Based on Valuation of Multiples
P/E P/S P/B P/CH
P/EB
ITD
A
Implied value (Chipotle) 397.3 234.6 176.9 204.2 226.5
Equal Weight valuation
multiple based price$247.9
Source: Author’s Analysis
Table: Final Target Price as The Weighted
Average of DCF and Multiple Based Approaches
Weight
Implied value
by using the
model
DCF 60% 226.0
Valuation multiples based 40% 247.9
Final target price 234.7
Discount to the current market
price (%)40.4
Source: Author’s Analysis
The table above implies a price target of $234.7,
which is at 40.4% discount to the current stock
price of $393.91. The target price represents
40.4% downside from the current stock price over
the next 12-months.
Since the sensitivity analysis indicates high
sensitivity of Chipotle on potentially adverse
scenarios, in my opinion the current stock price
does not provide adequate margin of safety for
conservative investors. Due to these reasons, I
assign sell rating on the stock with a price-target
of $234.7 over the next 12-months.
Risks Resolution of E-Coli and Norovirus incidents
earlier than expected:
I have assumed historical revenue growth to
resume 12-18 months from now after satisfactory
resolution of these incidents. Earlier resolution
would be a key upside risk to the target price.
Lower agriculture and crude oil prices:
A key component of cost structure are Food,
beverage, and packaging costs. These have
accounted for between 30.6% and 34.6% over the
last 5-years. In my view, increasing competition
and fragile real economic recovery would limit
Chipotle's ability to pass the input cost pressure to
consumers. I expect large part of such input cost
increases to be absorbed by Chipotle and therefore
operating margins would be adversely impacted.
However, in the event of food, beverage, and
packaging costs moving to lower levels would
negate this assumption and lead to upturn in the
stock price.

Overview Risks ConclusionInvestment
12
Successful international expansion earlier than
anticipated:
Due to conservative management and focus on
profitability, I expect Chipotle to adopt gradual
approach to expand in international markets. Intense
competition in these markets, and lack of familiarity
with the newer markets could cause further
challenges. However, in the event of such
international expansion becoming more successful
than my expectation, there would be upside risk to
my target price.
More successful and quicker scalability of
diversification in other food segments:
In order to diversify from Mexican food segment,
Chipotle is gradually expanding to Asian cuisine
and Pizza segments. As of now the contribution of
these segments in the total revenue is negligible.
Due to lack of experience of Chipotle's management
and intense competition in these segments, I expect
gradual scalability of these businesses. However in
case these businesses become more scalable earlier
than my expectation, then that would cause stock
price to move higher.
Quicker break-even period for newly opened stores:
Chipotle expects to continue expansion at 220-235
restaurants per year. Historically the break-even
period of these restaurants has been 12-months. In
my opinion, increased competition, down trading by
customers for lower value products, and fragile real
economic recovery could cause break-even period to
increase from 12 months to 15-18 months. It would
result in delayed contribution of new restaurants in
operating profits. In case the break-even period
remains at the historical level, then they would start
contributing in profit pool earlier than my
expectation and lead to upside in the stock price.
uncertainty about the sustainability of such
premium. Chipotle's sensitivity to these issues are
higher than peers causing significant downside
risk to the current stock price. After incorporating
these factors in the DCF and valuation based
multiples approaches, I arrived at a target price of
$234.7 over the next 12-months. The target price
represents 40.4% potential downside to the
current stock price and accordingly I assign SELL
rating to the stock.
Conclusion
Over the last two decades, Chipotle has emerged as
a key player in Mexican food segment in the US. It
is among the few companies that have recorded
same-store sales growth in each quarter since
inception. This has resulted in the stock price
commanding premium relative to the sector.
However, recent regulatory issues, increasing
competition, and input cost pressures have caused

13References & Appendix
• All prices are taken from Bloomberg and most updated as on date
• Stock price: Closing price as on July 1, 2016
• Main sources of prices:
Yahoo Finance: http://finance.yahoo.com/q?s=CMG&ql=1
Bloomberg Terminal
12-month stock chart, NASDAQ, from: http://www.nasdaq.com/symbol/cmg/stock-chart
Business segment: Ir.Chipotle.com and Form 10k 2015, Annual Report 2015
Technomic, from: https://www.technomic.com/Pressroom/Releases/dynRelease_Detail.php?rUID=402
Sustained competitive advantage: All data has been taken from Form 10k for years from year 2005 to
2015, Annual Reports: From 2005-2015; Before 2005, the data has been taken from SEC filings, US
Securities and Exchange commission, www.sec.gov
Recent restaurant news/events: http://ir.chipotle.com/phoenix.zhtml?c=194775&p=irol-sec and Form
10k 2015, Annual Report 2015
Investment thesis: IMF: http://www.imf.org/external/pubs/ft/weo/2016/update/01/, World Economic
Outlook (WEO) Update, Subdued Demand, Diminished Prospects
Brazil Drought: http://www.bbc.com/news/world-latin-america-30962813
US Consumer sentiment index: http://www.tradingeconomics.com/united-states/consumer-confidence
Chipotle: Same store sales growth: All data has been taken from Form 10k for years from year 2005 to
2015, Annual Reports: From 2005-2015; Before 2005, the data has been taken from SEC filings, US
Securities and Exchange commission, www.sec.gov
Food, beverages, and packaging costs: All data has been taken from Form 10k for years from year
2005 to 2015, Annual Reports: From 2005-2015; Before 2005, the data has been taken from SEC
filings, US Securities and Exchange commission, www.sec.gov
Unemployment rate: www.tradingeconomics.com
Other: Author's analysis, Annual report; 2015

14References & Appendix CMG
FY FY FY FY FY FY FY FY
(000$) 2018E 2017E 2016E 2015 2014 2013 2012 2011
Consensus 5,940,000 4,980,000 4,200,000
Net Sales 4,625,097 4,447,208 4,276,162 $ 4,501,223 $ 4,108,269 $ 3,214,591 $ 2,731,224 $ 2,269,548
1.32 1.03
Restaurant operating costs: 1.33 1.03
Food, beverage and packaging 1,248,776 1,467,579 1,710,465 1,503,835 1,420,994 1,073,514 891,003 738,720
Labor 1,156,274 1,111,802 1,111,802 1,045,726 904,407 739,800 641,836 543,119
Occupancy 323,757 311,305 299,331 262,412 230,868 199,107 171,435 147,274
Other operating costs 508,761 489,193 470,378 514,963 434,244 347,401 286,610 251,208
General and administrative expenses 323,757 311,305 299,331 250,214 273,897 203,733 183,409 149,426
Depreciation and amortization 138,753 133,416 128,285 130,368 110,474 96,054 84,130 74,938
Pre-opening costs 23,125 22,236 21,381 16,922 15,609 15,511 11,909 8,495
Loss on disposal of assets 18,500 17,789 17,105 13,194 6,976 6,751 5,027 5,806
Total operating expenses 3,741,703 3,864,624 4,058,078 3,737,634 3,397,469 2,681,871 2,275,359 1,918,986
Income from operations 883,393 582,584 218,084 763,589 710,800 532,720 455,865 350,562
Interest and other income (expense), net 4,625 4,447 4,276 6,278 3,503 1,751 1,820 (857)
Income before income taxes 878,768 578,137 213,808 769,867 714,303 534,471 457,685 349,705
Provision for income taxes (338,326) (222,582.8) (82,316.1) (294,265) (268,929) (207,033) (179,685) (134,760)
Net Income 540,443 355,554 131,492 $ 475,602 $ 445,374 $ 327,438 $ 278,000 $ 214,945
Other comprehensive income (loss), net of income taxes:
Foreign currency translation adjustments (1,471) (1,471) (1,471) (6,322) (2,049) 596 827 (409)
Unrealized loss on investments - - - (1,522) - - - -
Other comprehensive income (loss) (1,471) (1,471) (1,471) (7,844) (2,049) 596 827 (409)
Comprehensive income 538,971 354,083 130,021 $ 467,758 $ 443,325 $ 328,034 $ 278,827 $ 214,536
EPS:
Basic 17.43 11.47 4.53 $ 15.30 $ 14.35 $ 10.58 $ 8.82 $ 6.89
Diluted 16.89 11.11 4.50 $ 15.10 $ 14.13 $ 10.47 $ 8.75 $ 6.76
Consensus - GAAP 17.66 11.80 4.72
Guidance 15.10-4.72
Weighted Average Common Shares Outstanding:
Basic 31,000 31,000 29,000 31,092 31,038 30,957 31,513 31,217
Diluted 32,000 32,000 29,200 31,494 31,512 31,281 31,783 31,775
Tax Rate 38.5% 38.5% 38.5% 38.2% 37.6% 38.7% 39.3% 38.5%
D&A 138,753 133,416 128,285 130,368 110,474 96,054 84,130 74,938
% of Sales 3.0% 3.0% 3.0% 2.9% 2.7% 3.0% 3.1% 3.3%
CapEx 265,199 262,574 259,974 257,400 252,600 199,900 197,000 151,100
% of Sales 5.7% 5.9% 6.1% 5.7% 6.1% 6.2% 7.2% 6.7%
Receivables 39,326 38,975 38,628 38,283 34,839 24,016 16,800 8,389
% of Sales 0.9% 0.9% 0.9% 0.9% 0.8% 0.7% 0.6% 0.4%
Inventory 15,194 15,148 15,088 15,043 15,332 13,044 11,096 8,913
% of Sales 0.3% 0.3% 0.4% 0.3% 0.4% 0.4% 0.4% 0.4%
Payables 90,866 89,084 87,337 85,709 69,613 59,022 58,700 46,382
% of Sales 2.0% 2.0% 2.0% 1.9% 1.7% 1.8% 2.1% 2.0%
Change in WC 1,385 1,339 1,239 12,941 (2,520) (8,842) 1,724 8,131
Sales 4.00% 4.00% -5.00% 9.56% 27.80% 17.70% 20.34% 23.62%
Expenses as % of Sales:
Restaurant operating costs:
Food, beverage and packaging 27.0% 33.0% 40.0% 33.4% 34.6% 33.4% 32.6% 32.5%
Labor 25.0% 25.0% 26.0% 23.2% 22.0% 23.0% 23.5% 23.9%
Occupancy 7.0% 7.0% 7.0% 5.8% 5.6% 6.2% 6.3% 6.5%
Other operating costs 11.0% 11.0% 11.0% 11.4% 10.6% 10.8% 10.5% 11.1%
General and administrative expenses 7.0% 7.0% 7.0% 5.6% 6.7% 6.3% 6.7% 6.6%
Depreciation and amortization 3.0% 3.0% 3.0% 2.9% 2.7% 3.0% 3.1% 3.3%
Pre-opening costs 0.5% 0.5% 0.5% 0.4% 0.4% 0.5% 0.4% 0.4%
Loss on disposal of assets 0.4% 0.4% 0.4% 0.3% 0.2% 0.2% 0.2% 0.3%
Interest and other income (expense), net 0.1% 0.1% 0.1% 0.14% 0.09% 0.05% 0.07% -0.04%
Operating Margin 19.1% 13.1% 5.1% 17.0% 17.3% 16.6% 16.7% 15.4%
2008 2009 2010
Food, beverage and packaging 431947 466027 549211
Sales 1331968 1518417 1798084
% of Sales 0.324292325 0.306916348 0.305442349
Sales per share 158.3937211

15References & Appendix
Chipotle Mexican Grill, Inc.
(CMG)
Analyst: Turki AlSabbar
Terminal
Discount
Rate = 10.00%
6/7/2016
Terminal FCF
Growth = 4.0%
(000s)
Year 2016E 2017E 2018E 2019E 2020E 2021E 2022E 2023E 2024E 2025E 2026E
Revenue 4,276,162 4,447,208 4,625,097 4,810,101 5,002,505 5,202,605 5,410,709 5,681,244 5,965,307 6,263,572 6,576,751
% Growth 4.0% 4.0% 4.0% 4.0% 4.0% 4.0% 5.0% 5.0% 5.0% 5.0%
Operating Income 218,084 582,584 883,393 769,616 800,401 832,417 865,713 908,999 954,449 1,002,172 1,052,280
Operating Margin 5.1% 13.1% 19.1% 16.0% 16.0% 16.0% 16.0% 16.0% 16.0% 16.0% 16.0%
Interest Income 4,276 4,447 4,625 4,810 5,003 5,203 5,411 5,681 5,965 6,264 6,577
Interest % of Sales 0.1% 0.1% 0.1% 0.1% 0.1% 0.1% 0.1% 0.1% 0.1% 0.1% 0.1%
Taxes 82,316.12 222,582.78
338,325.8
2 294,450.3 306,228.3 318,477.4 331,216.5 347,777.4 365,166.2 383,424.6 402,595.8
Tax Rate 38.5% 38.5% 38.5% 38.5% 38.5% 38.5% 38.5% 38.5% 38.5% 38.5% 38.5%
Net Income 131,492 355,554 540,443 470,356 489,170 508,737 529,086 555,540 583,318 612,483 643,108
% Growth 170.4% 52.0% -13.0% 4.0% 4.0% 4.0% 5.0% 5.0% 5.0% 5.0%
Add Depreciation/Amort 128,285 133,416 138,753 144,303 150,075 156,078 162,321 170,437 178,959 187,907 197,303
% of Sales 3.0% 3.0% 3.0% 3.0% 3.0% 3.0% 3.0% 3.0% 3.0% 3.0% 3.0%
Plus/(minus) Changes WC 1,239 1,339 1,385 1,441 1,499 1,558 1,621 1,702 1,787 1,876 1,970
% of Sales 0.0% 0.0% 0.0% 0.0% 0.0% 0.0% 0.0% 0.0% 0.0% 0.0% 0.0%
Subtract Cap Ex 259,974 262,574 265,199 275,807 286,840 298,313 216,428 227,250 238,612 250,543 263,070
Capex % of sales 6.1% 5.9% 5.7% 5.7% 5.7% 5.7% 4.0% 4.0% 4.0% 4.0% 4.0%
Free Cash Flow 1,041.63 227,735.56
415,381.4
3 340,292.12 353,903.80 368,059.96 476,599.88 500,429.87 525,451.36 551,723.93
579,310.1
3
% Growth 21763.4% 82.4% -18.1% 4.0% 4.0% 29.5% 5.0% 5.0% 5.0% 5.0%
NPV of Cash Flows 2,504,535 39%
NPV of terminal value 3,871,385 61% Terminal Value
10,041,37
6
Projected Equity Value 6,375,920 100%
Free Cash Flow Yield 0.01%
Free Cash
Yield 5.77%
Current P/E 87.5 32.3 21.3 Terminal P/E 15.6
Projected P/E 48.5 17.9 11.8
Current EV/EBITDA 31.3 15.1 10.6
Terminal
EV/EBITDA 7.5
Projected EV/EBITDA 16.5 8.0 5.6
Shares Outstanding 29,200
Current Price
$
393.91
Implied equity value/share
$
218.35
Upside/(Downside) to DCF -44.6%
Debt -
Cash 667,470
Cash/share 22.86
As on Dec 31, 2015
Cash 248005
Investments 415199
Total 663204
Cash for regular operations and
liquidity 7.619520548
Implied value from DCF 226.0Discount
Upside/(Downside) to DCF (after
adding cash) 0.573666462 0.426333538

16References & Appendix
FY 2018 (Projected) EPS (FY 2018): Chipotle
EPS 16.89
Sales per share 158.4
Book value per share 57.8592
Cash flow per share 17.6841
EBITDA per share 22.832775
(10Y) CMG Relative to S&P500 High Low Median Current P/E 4.12 1.54 2.74 1.95P/S 4.32 1.19 2.51 1.52P/B 5.78 1.23 3.15 2.67P/CH 4.82 0.92 2.48 2.19P/EBITDA 5.05 1.33 2.70 1.71
(10Y) CMG Relative to Con. Disc. Sector
High Low Median Current
P/E 4.04 0.06 2.18 1.90P/S 6.17 1.95 3.34 1.95P/B 3.99 1.10 2.29 1.54P/CH 3.73 0.55 2.14 1.90P/EBITDA 5.37 1.49 2.65 1.94
(10Y) CMG Absolute Valuation High Low Median Current P/E 64.79 21.66 36.86 25.92P/S 5.17 1.52 3.43 2.75P/B 10.75 3.20 7.42 5.73P/CH 32.70 10.23 22.32 18.13P/EBITDA 30.42 10.57 18.23 13.86
Company: (9Y) P Multiples P/E P/S P/B P/CH P/EBITDAAverage 23.53 1.48 3.06 11.55 9.92CHIPOTLE MEXICAN GRILL INC 41.92 2.22 3.91 17.63 18.23LUBY'S INC 13.71 0.78 1.64 9.92 7.52MCDONALD'S CORP 18.71 2.53 3.45 12.60 9.38BOB EVANS FARMS 23.49 0.81 1.85 8.85 7.76PANERA BREAD COMPANY-CLASS A 29.66 2.10 4.43 16.56 12.87DENNY'S CORP 13.66 0.44 -- 3.71 3.74
Implied value (Chipotle) 397.3 234.6 176.9 204.2 226.5
Equal weight: 20%79.4682497
946.9153820
1 35.3765243540.8336266
145.2967199
9
Implied value (Chipotle: Weighted average)
247.8905027

17References & Appendix
Final target price Weight
Implied value by using the
model Weighted average value
DCF 0.6 226.0 135.6
Valuation multiples based 0.4 247.9 99.2
Final target price 234.7
Discount to the current market price 40.41%
0
200
400
600
800
1000
1200
1400
1600
7/7/2011 7/7/2012 7/7/2013 7/7/2014 7/7/2015
CMG Stock VS Sector (S5COND)
CMG Consumer Discretionary Sector
0
200
400
600
800
1000
1200
7/1/2011 7/1/2012 7/1/2013 7/1/2014 7/1/2015 7/1/2016
CMG Stock VS Peers
CHIPOTLE PANERA BREAD BOB EVANS FARMS
LUBY'S DENNY'S MCDONALD'S