CHIP-EDITS (6-26-13)
141
Florida Department of Health in Orange County has one document for their Community Health Assessment and their Community Health Improvement Plan. Please see below for the page number for each. Community health assessment ........................................................................................... 1‐22 and 33‐131 Community Health Improvement Plan ............................................................................................... 23‐32
Transcript of CHIP-EDITS (6-26-13)
Florida Department of Health in Orange County has one document for their Community Health
Assessment and their Community Health Improvement Plan. Please see below for the page number for
each.
Community health assessment ........................................................................................... 1‐22 and 33‐131
Community Health Improvement Plan ............................................................................................... 23‐32
1
2012-2015
Orange County
Community Health
Improvement Plan
(CHIP)
Sponsored by the
Orange County Health Department
Facilitated by the
Health Council of East Central Florida, Inc.
2
Special Thanks to the MAPP Workgroup
Lesli P. Ahonkhai, MA
Lisa Barkley, MD, FAAFP
Gabriele Bloodworth
Margaret Brennan
Ellen S. Geiger, MSN, RN
Steven Hale, MD
Randy Hunt
Sue Idtensohn
Ray Larsen
Yolanda Martinez, EdPhD, Ph.D.
Tara McHugh, MSN, RN, APHN
Janelle Middents
Verbelee Nielsen-Swanson
James Pate
Rexanne Paugh
Ken Peach, MBA, FACHE
Stephanie K. Prewitt, JD
George Ralls, MD
Arlene Rhodenbeck
Rebecca Sayago
Kevin Sherin, MD, M.P.H., M.B.A.
Robbi Sukanek
Linda Sutherland
Kim Weaver
Justin Yelken, MHSA
Orange County Health Department
University of Central Florida, College of Medicine
Orange County Health Department
Orange County Government
Orange County Healthy Start Coalition
Orange County Health Department
Senior Resource Alliance, Inc.
Planned Parenthood Orlando
Heart of Florida United Way
Orange County Health Department
Orange County Health Department
American Lung Association
Florida Hospital
Orange County Health Department
YMCA
Health Council of East Central Florida, Inc.
Orlando Health
Orange County Government
Healing the Children
Shepherd’s Hope
Orange County Health Department
Lakeside Behavioral Healthcare
Orange County Healthy Start Coalition
Health Central Hospital
American Lung Association
3
Introduction 4
The MAPP Process 5
Overview of Orange County, Florida 7
Organize for Success/Visioning 8
MAPP Assessment Summaries
Community Themes and Strengths 11
Local Public Health System Performance Measures 13
Community Health Status 15
Forces of Change Assessment 22
Strategic Planning Retreat 23
Strategic Goals and Objectives Matrix 27
Strategic Goals and Objectives 28
Action Cycle 32
Appendix B: Local Public Health Assessment 56
Appendix C: Community Health Status 80
Appendix D: Forces of Change 120
Appendix E: Action Cycle Template 129
Appendix F: Measurable Health Outcomes 131
Appendix A: Community Themes and Strengths Assessment 33
Table of Contents
4
INTRODUCTION
The Orange County Health Department (OCHD), sponsored a comprehensive health assessment process through a grant from the Florida Department of Health. Using the Mobilizing for Action through Planning and Partnership (MAPP) strategic planning model, community partners came together to develop the 2012 Orange County Community Health Improvement Plan (CHIP). Under contract with the OCHD, the Health Council of East Central Florida, Inc. facilitated the MAPP Visioning, MAPP Assessments (Local Public Health System, Forces of Change, Community Themes and Strengths, and Community Health Assessment), Strategy and Goal development, and the Action Cycle. This CHIP is the culmination of data gleaned from the MAPP Assessments and efforts of participating community partners.
A comprehensive health assessment serves as the foundation for improving and promoting healthier communities. The assessment is a process of collecting and analyzing data to educate and mobilize communities in developing priorities, gathering resources and planning actions that impact the public’s health. Based on assessment results, the identification of strategies and goals are supported by the development of SMART (Specific, Measurable, Achievable, Relevant and Timed) objectives used to measure progress and success. The Action Cycle is a continuous process of planning, implementing and evaluating that provides a sustainable method for the community to build upon accomplishments and attain even greater achievements.
5
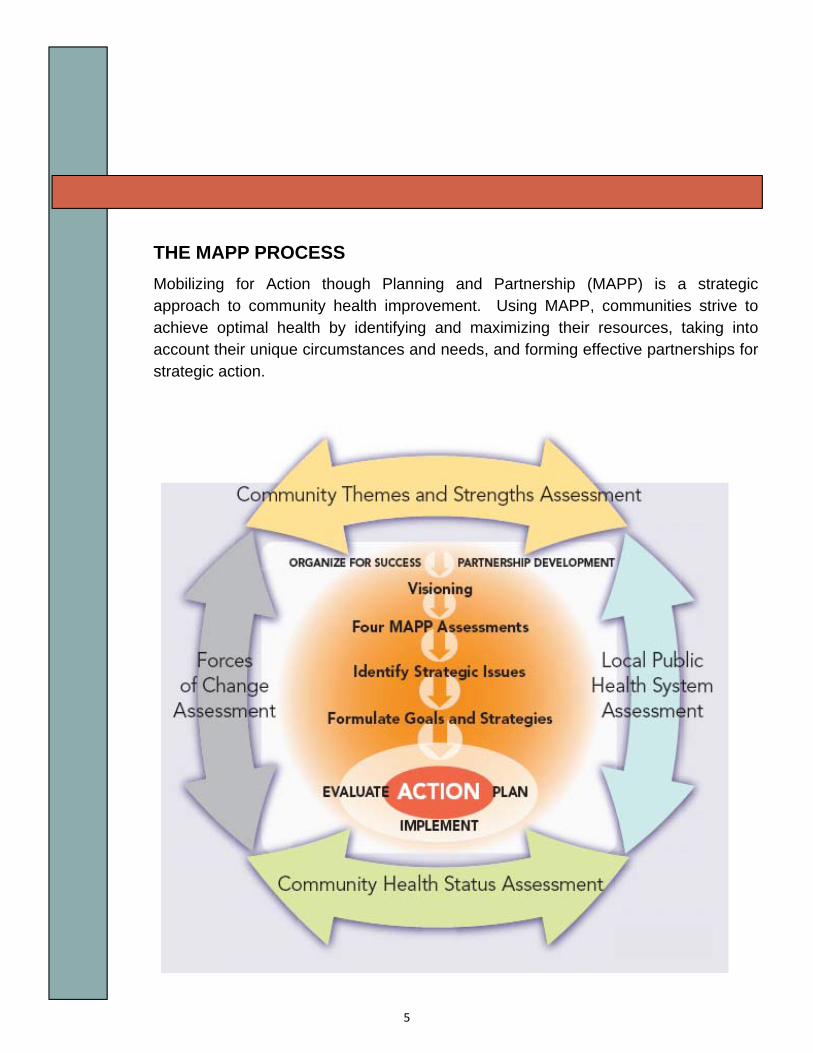
THE MAPP PROCESS
Mobilizing for Action though Planning and Partnership (MAPP) is a strategic approach to community health improvement. Using MAPP, communities strive to achieve optimal health by identifying and maximizing their resources, taking into account their unique circumstances and needs, and forming effective partnerships for strategic action.
6
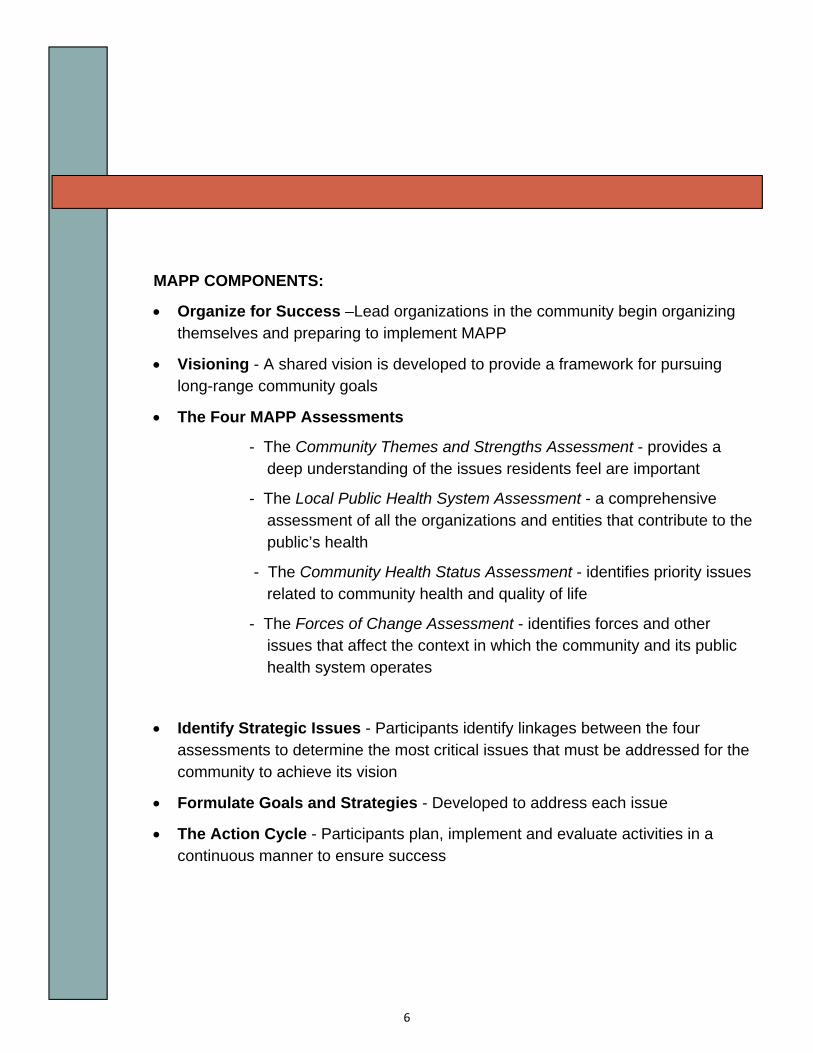
MAPP COMPONENTS:
Organize for Success –Lead organizations in the community begin organizing themselves and preparing to implement MAPP
Visioning - A shared vision is developed to provide a framework for pursuing long-range community goals
The Four MAPP Assessments
- The Community Themes and Strengths Assessment - provides a deep understanding of the issues residents feel are important
- The Local Public Health System Assessment - a comprehensive assessment of all the organizations and entities that contribute to the public’s health
- The Community Health Status Assessment - identifies priority issues related to community health and quality of life
- The Forces of Change Assessment - identifies forces and other issues that affect the context in which the community and its public health system operates
Identify Strategic Issues - Participants identify linkages between the four assessments to determine the most critical issues that must be addressed for the community to achieve its vision
Formulate Goals and Strategies - Developed to address each issue
The Action Cycle - Participants plan, implement and evaluate activities in a continuous manner to ensure success
7
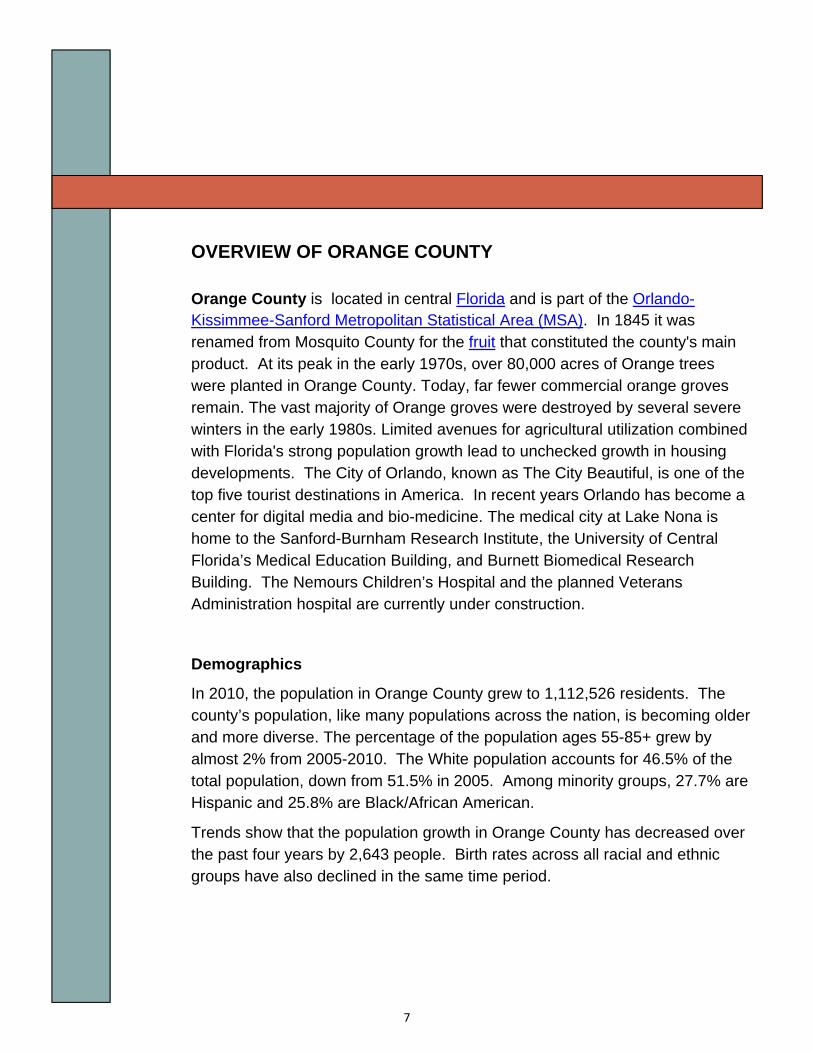
OVERVIEW OF ORANGE COUNTY
Orange County is located in central Florida and is part of the Orlando-Kissimmee-Sanford Metropolitan Statistical Area (MSA). In 1845 it was renamed from Mosquito County for the fruit that constituted the county's main product. At its peak in the early 1970s, over 80,000 acres of Orange trees were planted in Orange County. Today, far fewer commercial orange groves remain. The vast majority of Orange groves were destroyed by several severe winters in the early 1980s. Limited avenues for agricultural utilization combined with Florida's strong population growth lead to unchecked growth in housing developments. The City of Orlando, known as The City Beautiful, is one of the top five tourist destinations in America. In recent years Orlando has become a center for digital media and bio-medicine. The medical city at Lake Nona is home to the Sanford-Burnham Research Institute, the University of Central Florida’s Medical Education Building, and Burnett Biomedical Research Building. The Nemours Children’s Hospital and the planned Veterans Administration hospital are currently under construction.
Demographics
In 2010, the population in Orange County grew to 1,112,526 residents. The county’s population, like many populations across the nation, is becoming older and more diverse. The percentage of the population ages 55-85+ grew by almost 2% from 2005-2010. The White population accounts for 46.5% of the total population, down from 51.5% in 2005. Among minority groups, 27.7% are Hispanic and 25.8% are Black/African American.
Trends show that the population growth in Orange County has decreased over the past four years by 2,643 people. Birth rates across all racial and ethnic groups have also declined in the same time period.
8
ORGANIZE FOR SUCCESS
Staff from the Health Council of East Central Florida, Inc. and the Orange County Health Department began as the Core Support Team to prepare for the MAPP process and recruit participants. The team updated the list of community stakeholders from the previous MAPP initiative and prepared an announcement for the impending MAPP 2012 process. Over 70 partners, representing more than 30 organizations were invited to attend the MAPP Visioning session that outlined the activities, responsibilities and timeline for the process.
VISIONING
A vision is a compelling and inspiring image of a desired and possible future that a community seeks to achieve. Health visions state the ideal, establish a ‘stretch’, link to strategies, inspire commitment, and draw out community values. A vision expresses goals that are worth striving for and appeals to ideals and values that are shared throughout the local public health system. Through the visioning process, the community develops a shared vision and common values.
The Orange County Visioning retreat was held on August 22, 2011 with community partners representing a broad cross-section of organizations. Facilitated visioning exercises were conducted to identify value statements that provided the focus, purpose and direction for the MAPP process. The shared community vision helped to establish an overarching goal for Orange County’s local public health system that guided the community-driven planning process.
9
VISIONING Results
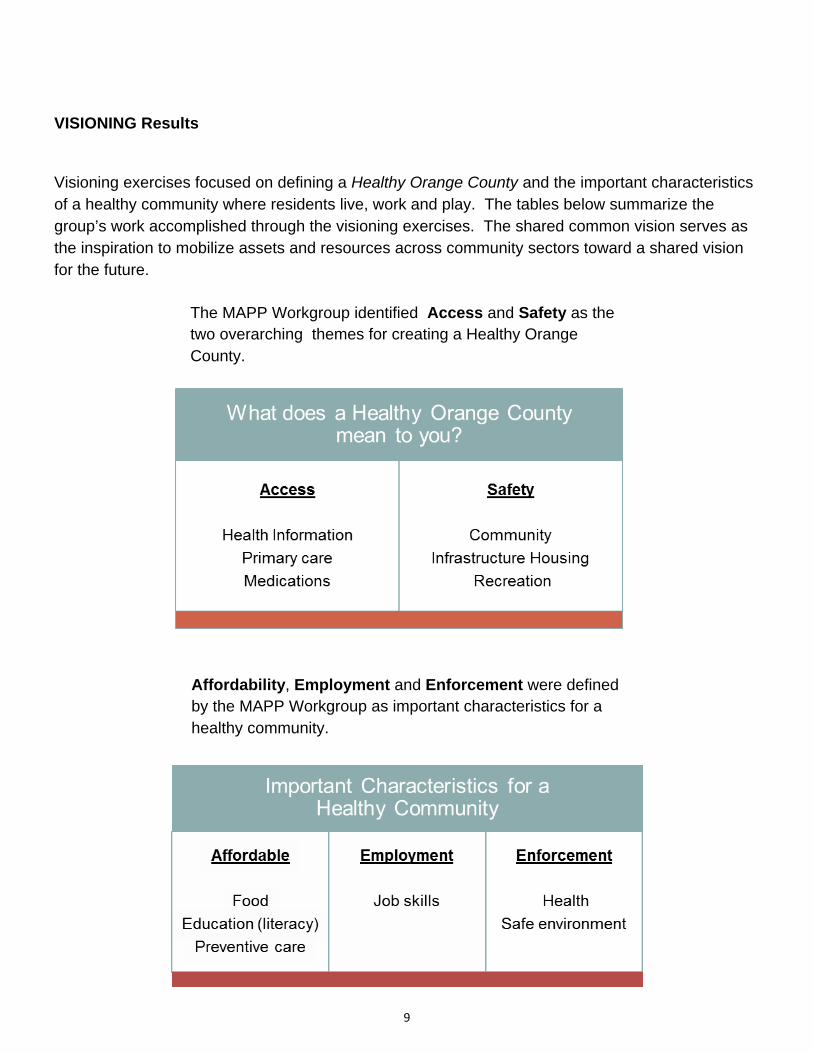
Visioning exercises focused on defining a Healthy Orange County and the important characteristics of a healthy community where residents live, work and play. The tables below summarize the group’s work accomplished through the visioning exercises. The shared common vision serves as the inspiration to mobilize assets and resources across community sectors toward a shared vision for the future.
The MAPP Workgroup identified Access and Safety as the two overarching themes for creating a Healthy Orange County.
Affordability, Employment and Enforcement were defined by the MAPP Workgroup as important characteristics for a healthy community.
10
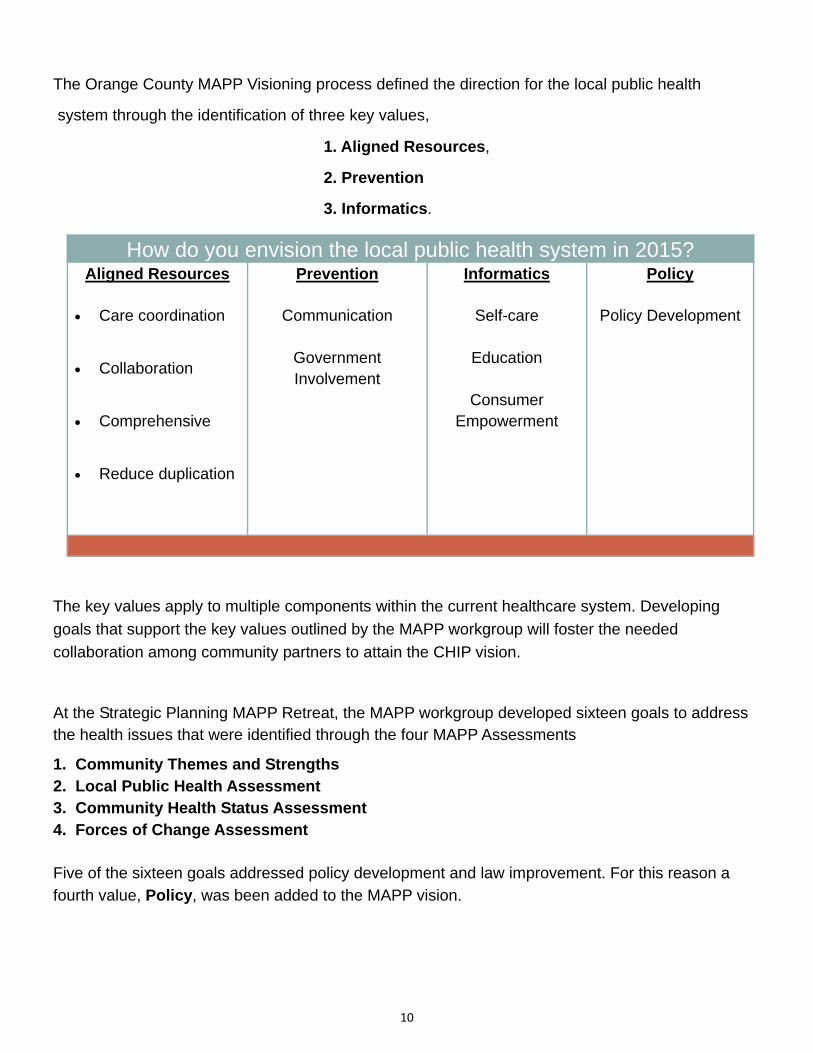
The Orange County MAPP Visioning process defined the direction for the local public health
system through the identification of three key values,
1. Aligned Resources,
2. Prevention
3. Informatics.
The key values apply to multiple components within the current healthcare system. Developing
goals that support the key values outlined by the MAPP workgroup will foster the needed
collaboration among community partners to attain the CHIP vision.
At the Strategic Planning MAPP Retreat, the MAPP workgroup developed sixteen goals to address the health issues that were identified through the four MAPP Assessments
1. Community Themes and Strengths 2. Local Public Health Assessment 3. Community Health Status Assessment 4. Forces of Change Assessment Five of the sixteen goals addressed policy development and law improvement. For this reason a
fourth value, Policy, was been added to the MAPP vision.
How do you envision the local public health system in 2015? Aligned Resources
Care coordination
Collaboration
Comprehensive
Reduce duplication
Prevention
Communication
Government Involvement
Informatics
Self-care
Education
Consumer Empowerment
Policy Policy Development
11
MAPP ASSESSMENTS
The results of the four MAPP assessments were presented to a broad community group at the strategic planning retreat. The assessment highlights have been summarized to provide an overview for the reader.
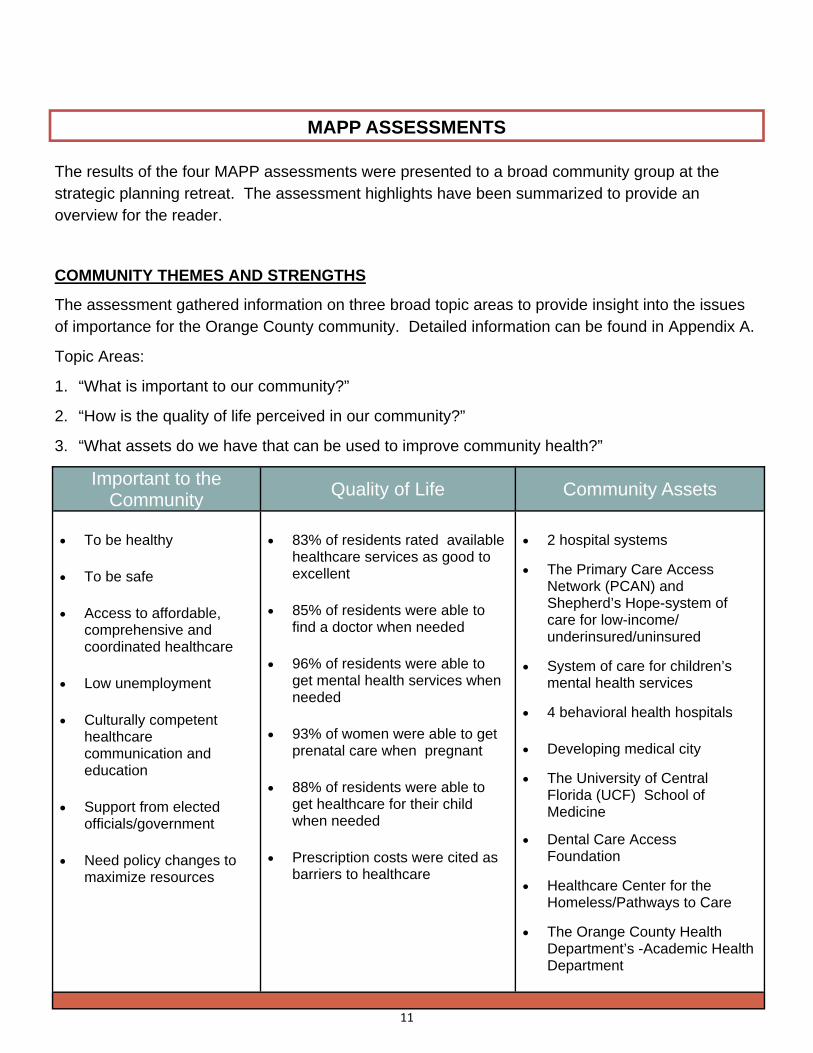
COMMUNITY THEMES AND STRENGTHS
The assessment gathered information on three broad topic areas to provide insight into the issues of importance for the Orange County community. Detailed information can be found in Appendix A.
Topic Areas:
1. “What is important to our community?”
2. “How is the quality of life perceived in our community?”
3. “What assets do we have that can be used to improve community health?”
Important to the Community
Quality of Life Community Assets
To be healthy To be safe Access to affordable,
comprehensive and coordinated healthcare
Low unemployment Culturally competent
healthcare communication and education
Support from elected
officials/government Need policy changes to
maximize resources
83% of residents rated available
healthcare services as good to excellent
85% of residents were able to
find a doctor when needed 96% of residents were able to
get mental health services when needed
93% of women were able to get
prenatal care when pregnant 88% of residents were able to
get healthcare for their child when needed
Prescription costs were cited as
barriers to healthcare
2 hospital systems
The Primary Care Access Network (PCAN) and Shepherd’s Hope-system of care for low-income/underinsured/uninsured
System of care for children’s mental health services
4 behavioral health hospitals Developing medical city
The University of Central Florida (UCF) School of Medicine
Dental Care Access Foundation
Healthcare Center for the Homeless/Pathways to Care
The Orange County Health Department’s -Academic Health Department
12
Opportunities and threats were identified for each force of change in preparation for the strategic planning retreat. The list below contains the opportunities and threats that the MAPP Workgroup identified as those most likely to effect the health care system within the next three years. As the DOH reorganization was not defined at the time the MAPP process was conducted, potential opportunities and threats were identified.
Overarching Opportunities:
Greater integration of healthcare delivery systems
Maximize resources
DOH reorganization - develop new partnerships to maximize resources, expanded community outreach, redefined focus on community health
Medicaid Expansion
Policy changes to expand role of nurse practitioners - (added after Strategic Planning Retreat)
Sharing patient data to cut cost and increase efficiency
Focus on the built environment to support population health
Focus on chronic disease prevention
Organizations need to maintain cultures of integrity
Overarching Threats:
Smaller workforce to support retirees
Poor economy impacts individual health and success for future generations
Maximize resources
DOH reorganization - reduced revenue, reduce community health department services to core public health issues, loss of personnel
Expansion of safety net programs are unsustainable
Provider shortages
Trust issues for electronic health records
High rates of chronic disease
Cut in government spending will limit scientific research
Greater accountability to gain consumer trust
MAPP ASSESSMENTS
13
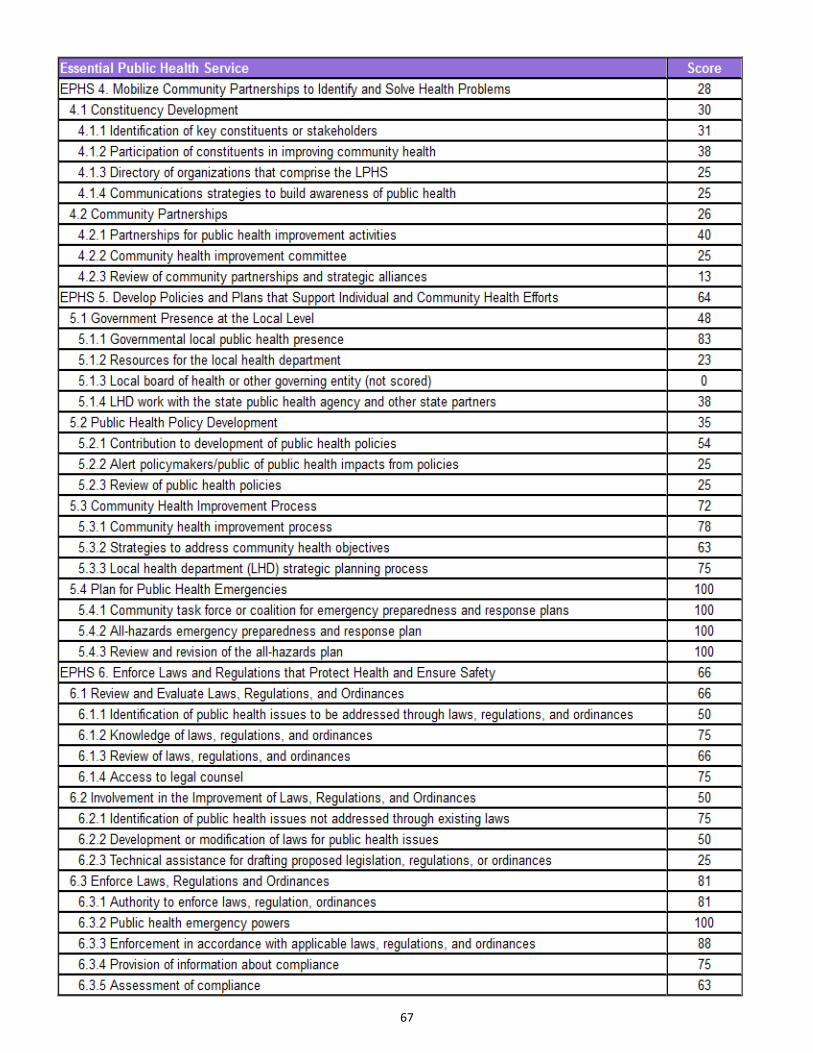
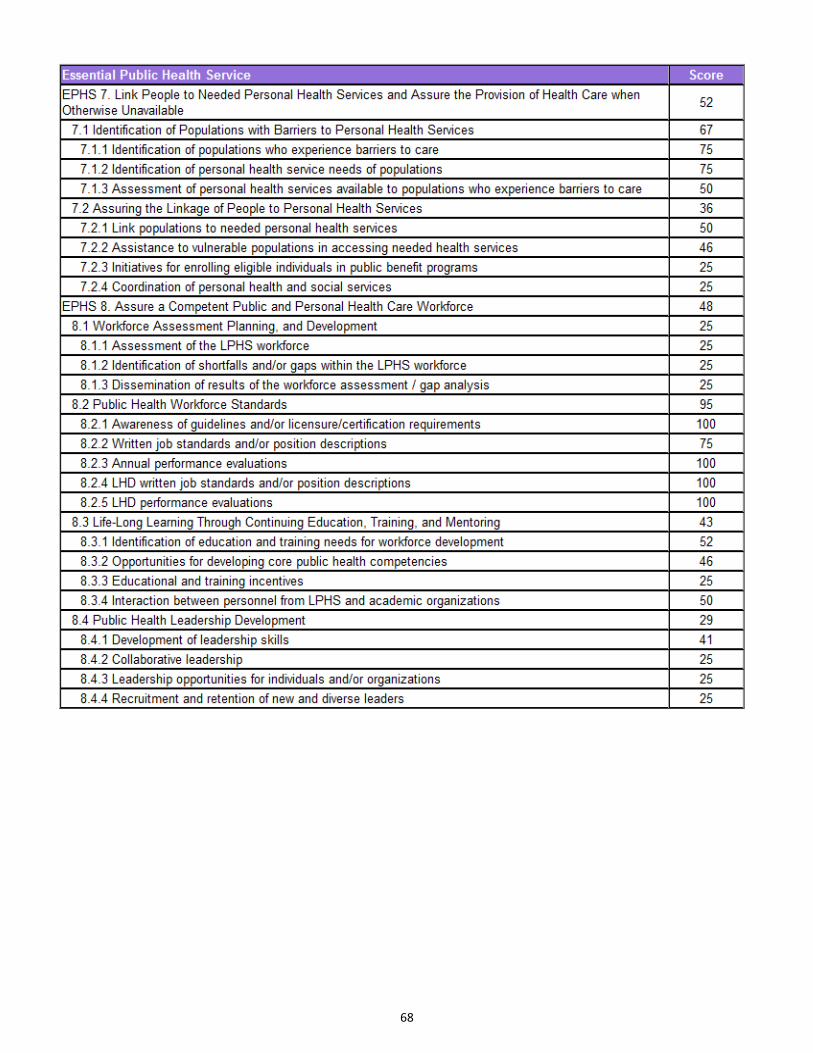
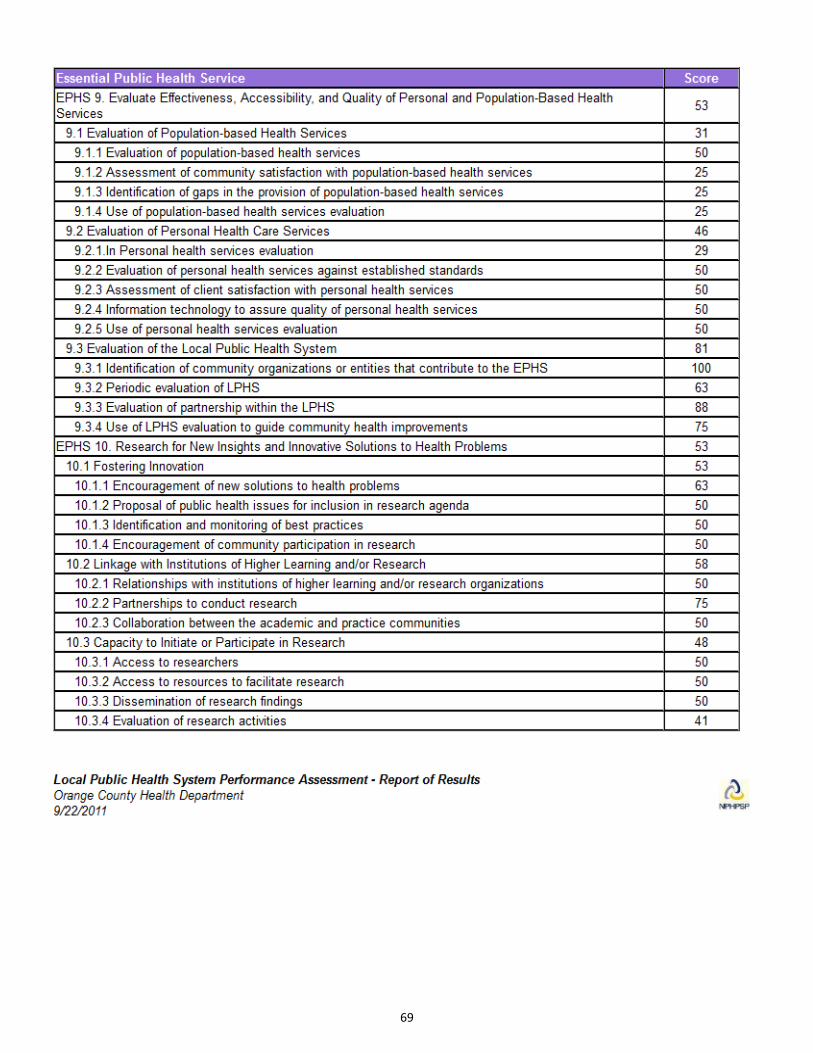
Local Public Health System Assessment
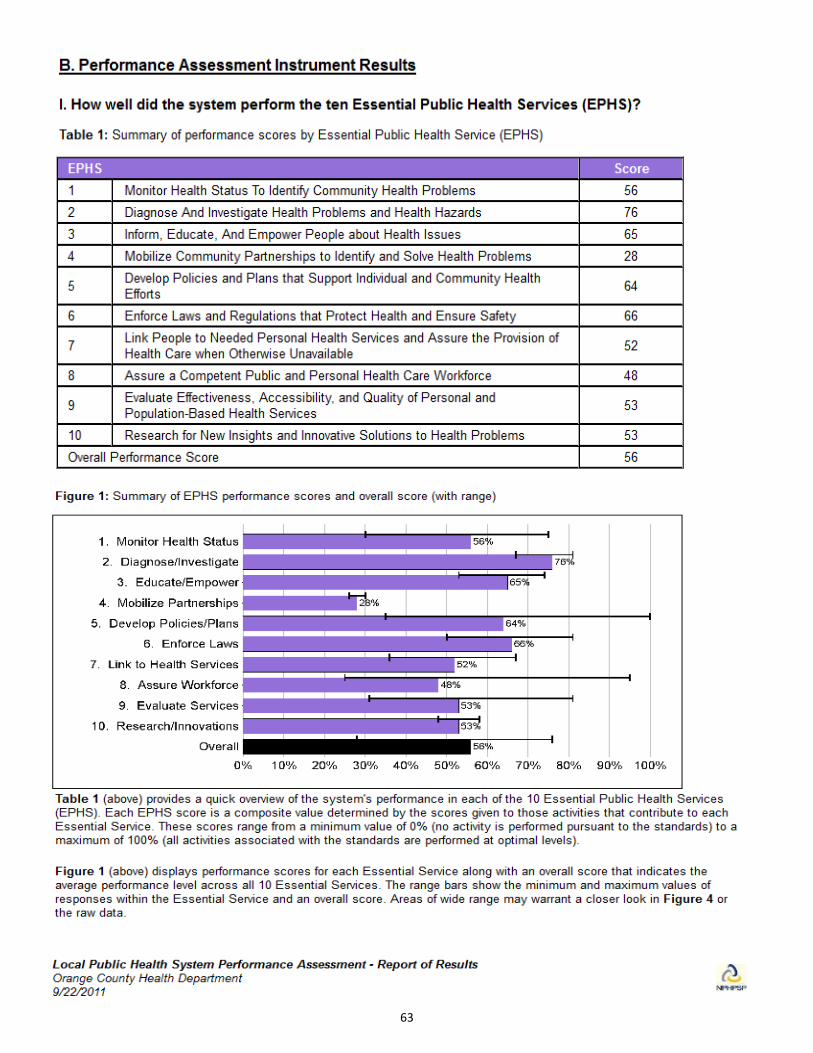
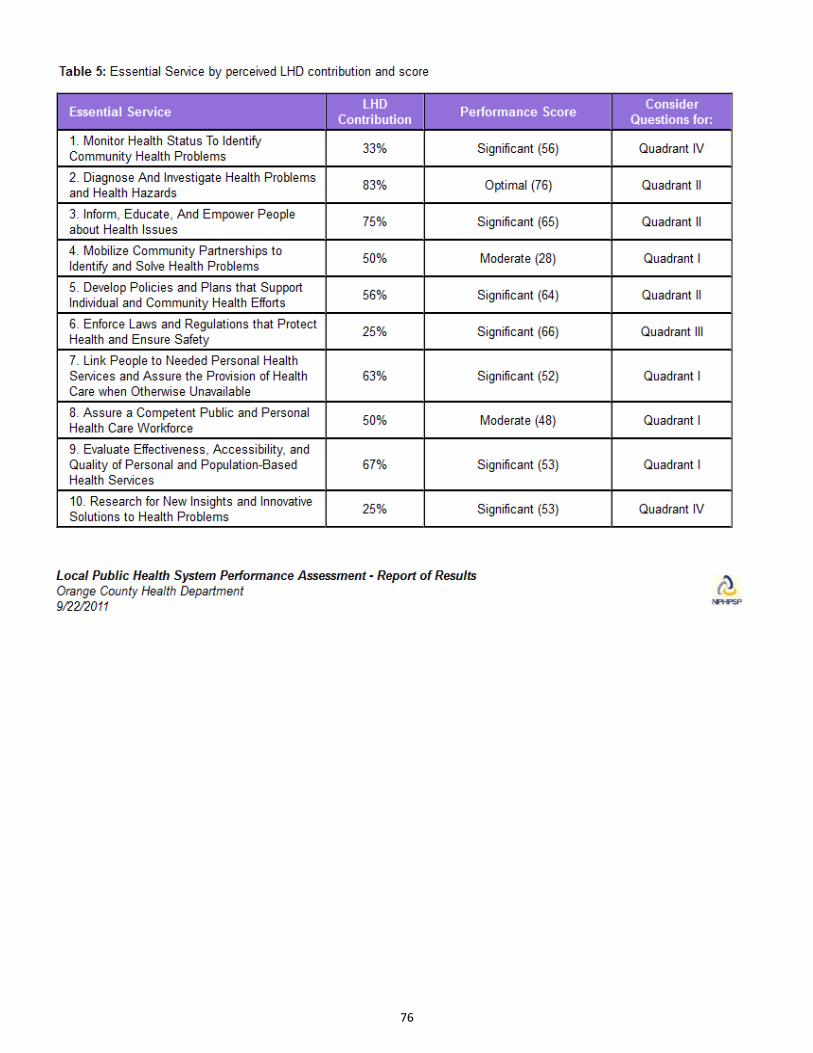
The local public health system assessment focuses on all the organizations and entities within the community that contribute to the public’s health. The assessment provided information on the components, activities, competencies and capacities of the public health system in Orange County, Florida, as well as how the Ten Essential Public Health Services are being provided in the community. These services developed by the Core Public Health Functions Steering Committee in 1994 established a framework that to describe the activities that should be undertaken in all communities. The Ten Essential Public Health Services are as follows:
1 - Monitor health status to identify community health problems
2 - Diagnose and investigate health problems and health hazards in the community
3 - Inform, educate and empower people about health issues
4 - Mobilize community partnerships to identify and solve health problems
5 - Develop policies and plans that support individual and community health efforts
6 - Enforce laws and regulations that protect health and ensure safety
7 - Link people to needed personal health services and assure the provision of
health care when otherwise unavailable
8 - Assure a competent public health and personal health care workforce
9 - Evaluate the effectiveness, accessibility, and quality of personal and population-based
health services 10 - Research for new insights and innovative solutions to health problems
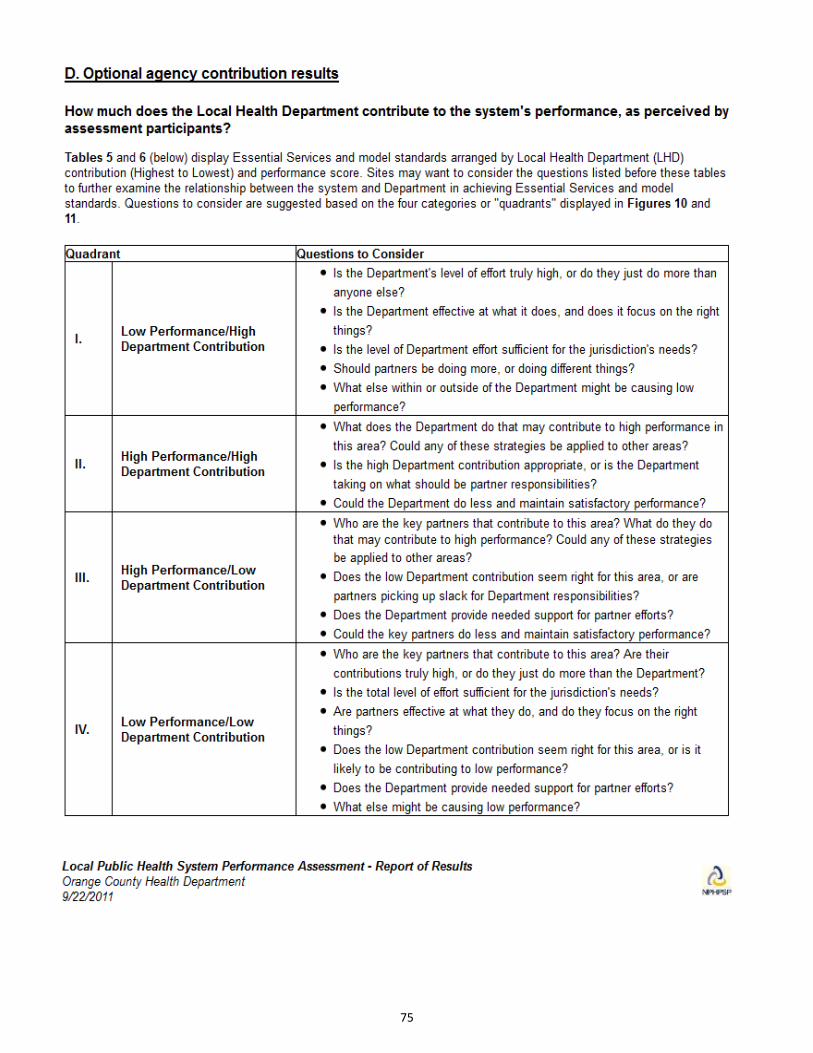
The assessment was conducted using the Local Public Health System Performance Assessment Instrument developed by the National Public Health Performance Standards Program (NPHPSP). The results of the assessment are used to strengthen and improve the public health system by addressing weaknesses while maintaining areas in which the public health system is strong. The final report can be found in Appendix B.
MAPP ASSESSMENTS
14
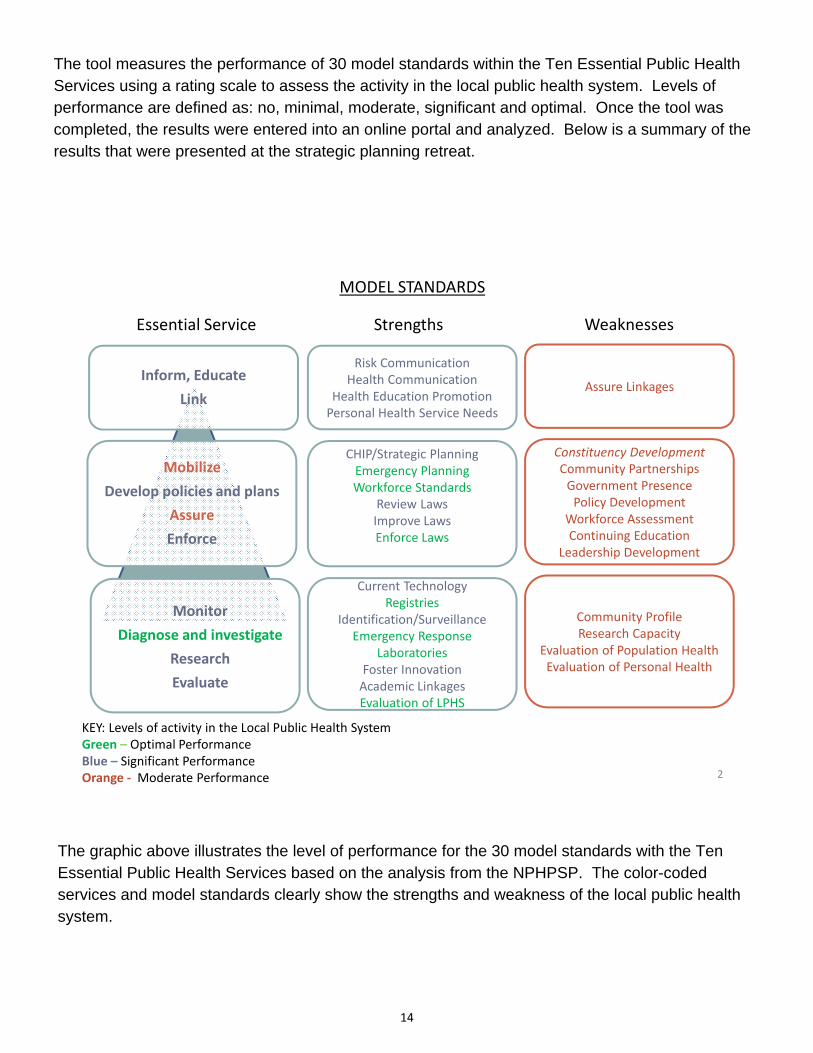
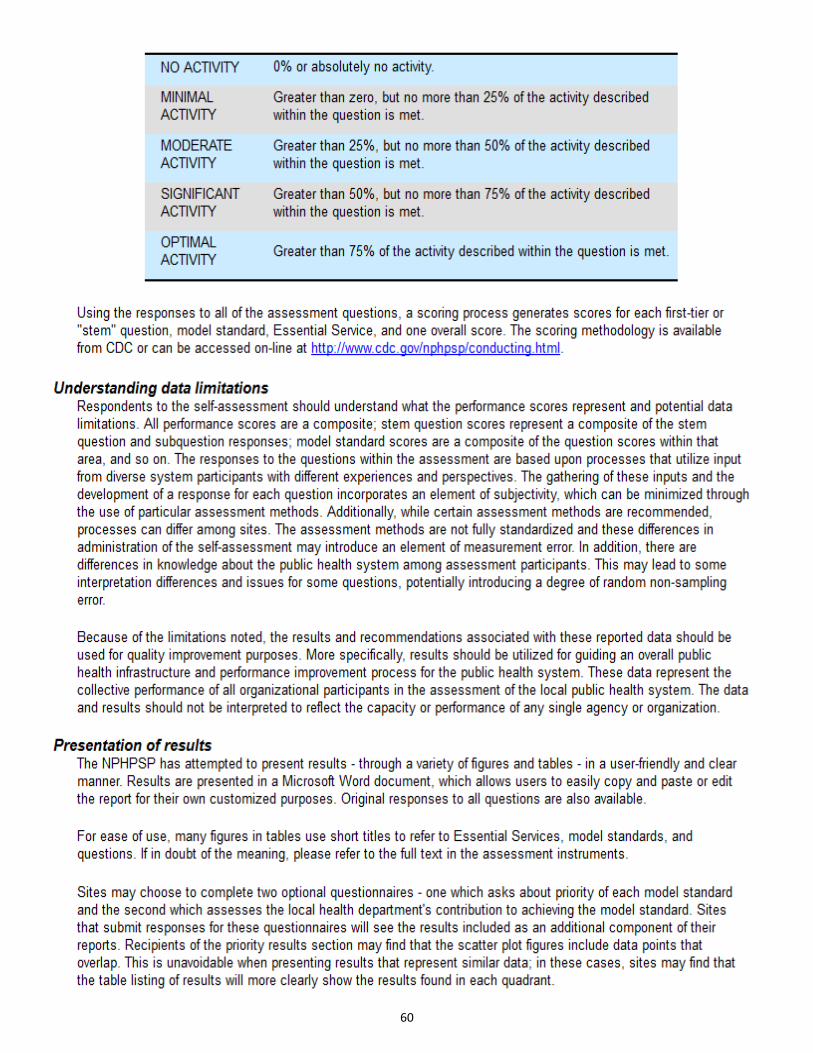
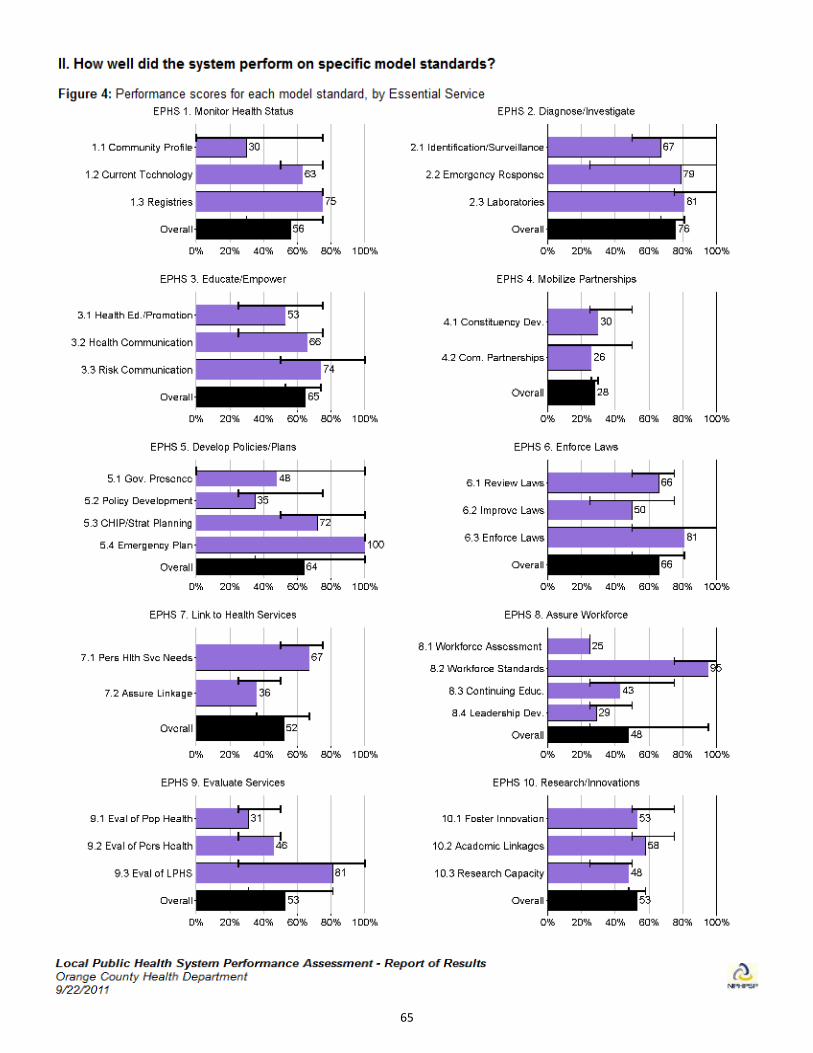
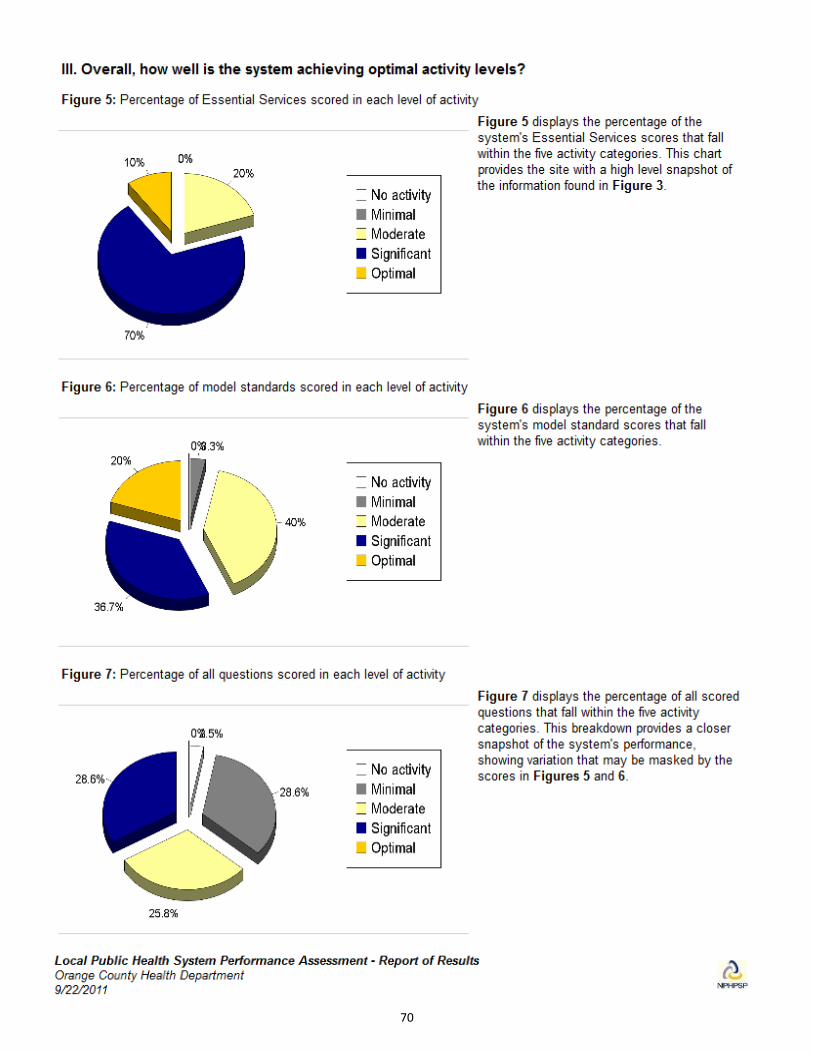
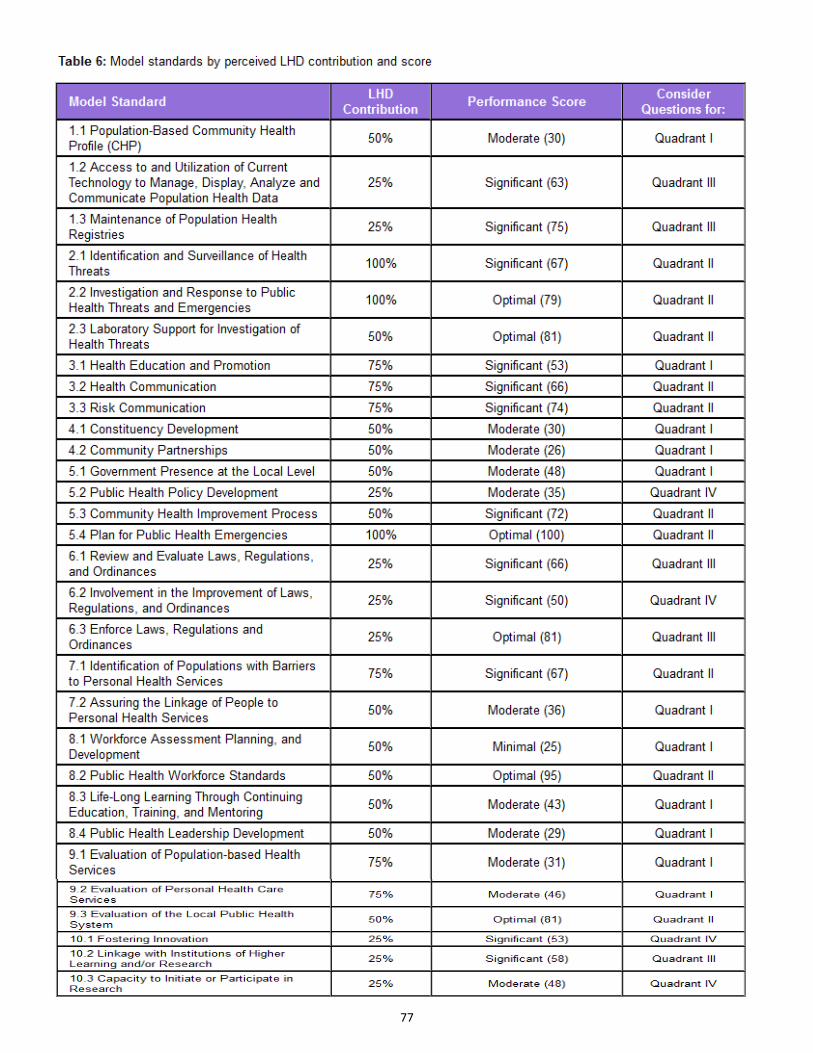
The graphic above illustrates the level of performance for the 30 model standards with the Ten Essential Public Health Services based on the analysis from the NPHPSP. The color-coded services and model standards clearly show the strengths and weakness of the local public health system.
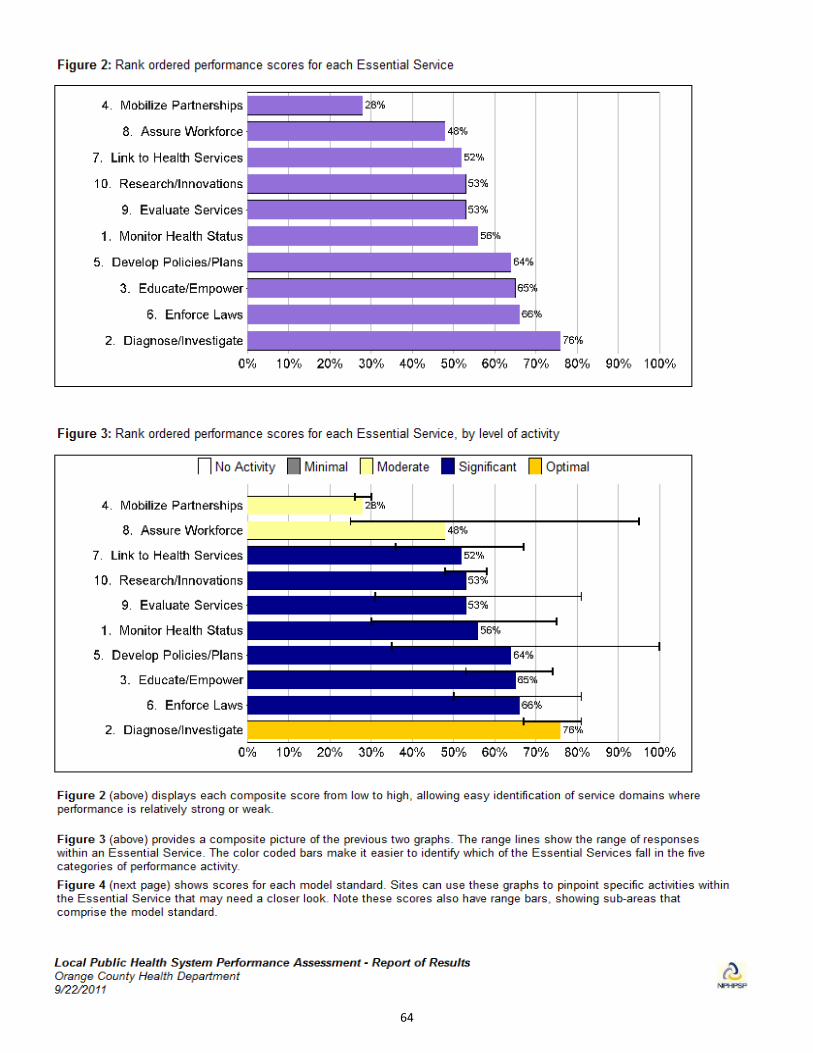
The tool measures the performance of 30 model standards within the Ten Essential Public Health Services using a rating scale to assess the activity in the local public health system. Levels of performance are defined as: no, minimal, moderate, significant and optimal. Once the tool was completed, the results were entered into an online portal and analyzed. Below is a summary of the results that were presented at the strategic planning retreat.
Strengths Weaknesses
Assure Linkages
Risk CommunicationHealth Communication
Health Education PromotionPersonal Health Service Needs
CHIP/Strategic PlanningEmergency PlanningWorkforce Standards
Review LawsImprove LawsEnforce Laws
Current TechnologyRegistries
Identification/SurveillanceEmergency Response
LaboratoriesFoster InnovationAcademic LinkagesEvaluation of LPHS
Constituency DevelopmentCommunity PartnershipsGovernment PresencePolicy Development
Workforce AssessmentContinuing Education
Leadership Development
Community ProfileResearch Capacity
Evaluation of Population HealthEvaluation of Personal Health
Inform, Educate
Link
Mobilize
Develop policies and plans
Assure
Enforce
Monitor
Diagnose and investigate
Research
Evaluate
Essential Service
MODEL STANDARDS
KEY: Levels of activity in the Local Public Health SystemGreen – Optimal PerformanceBlue – Significant PerformanceOrange ‐ Moderate Performance 2
15
MAPP ASSESSMENTS
Community Health Status Assessment
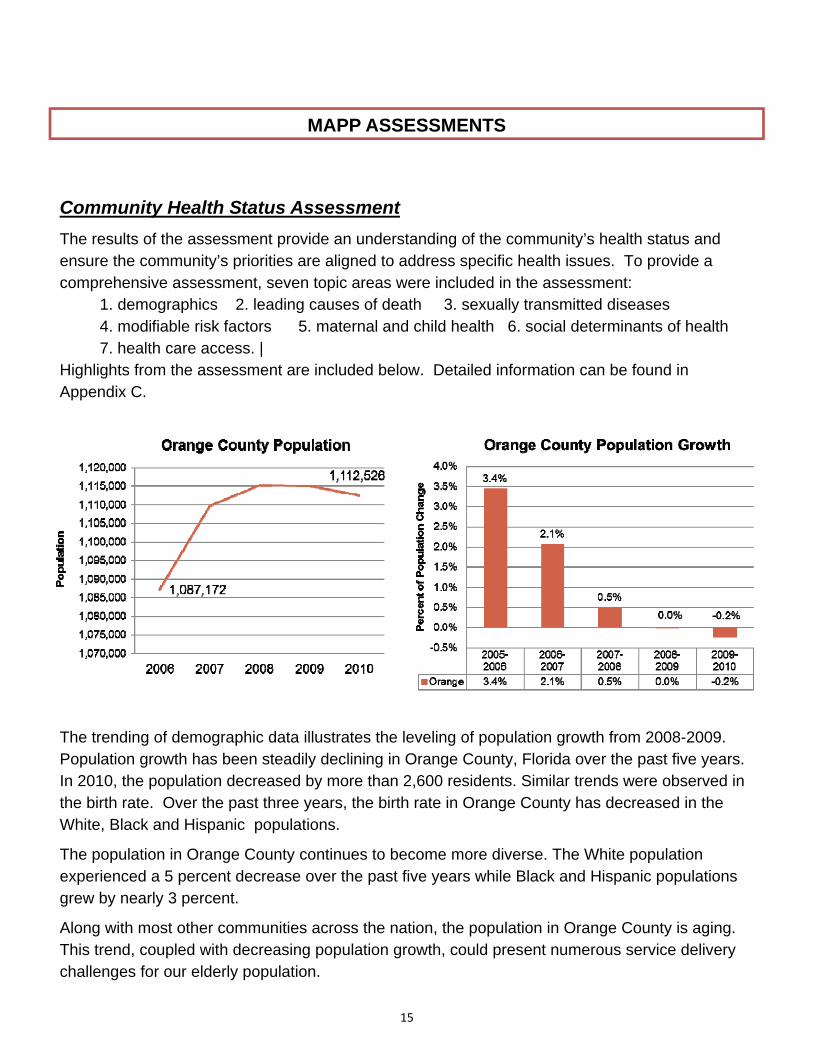
The results of the assessment provide an understanding of the community’s health status and ensure the community’s priorities are aligned to address specific health issues. To provide a comprehensive assessment, seven topic areas were included in the assessment: 1. demographics 2. leading causes of death 3. sexually transmitted diseases 4. modifiable risk factors 5. maternal and child health 6. social determinants of health 7. health care access. | Highlights from the assessment are included below. Detailed information can be found in Appendix C.
The trending of demographic data illustrates the leveling of population growth from 2008-2009. Population growth has been steadily declining in Orange County, Florida over the past five years. In 2010, the population decreased by more than 2,600 residents. Similar trends were observed in the birth rate. Over the past three years, the birth rate in Orange County has decreased in the White, Black and Hispanic populations.
The population in Orange County continues to become more diverse. The White population experienced a 5 percent decrease over the past five years while Black and Hispanic populations grew by nearly 3 percent.
Along with most other communities across the nation, the population in Orange County is aging. This trend, coupled with decreasing population growth, could present numerous service delivery challenges for our elderly population.
16
MAPP ASSESSMENTS
Leading Causes of Death
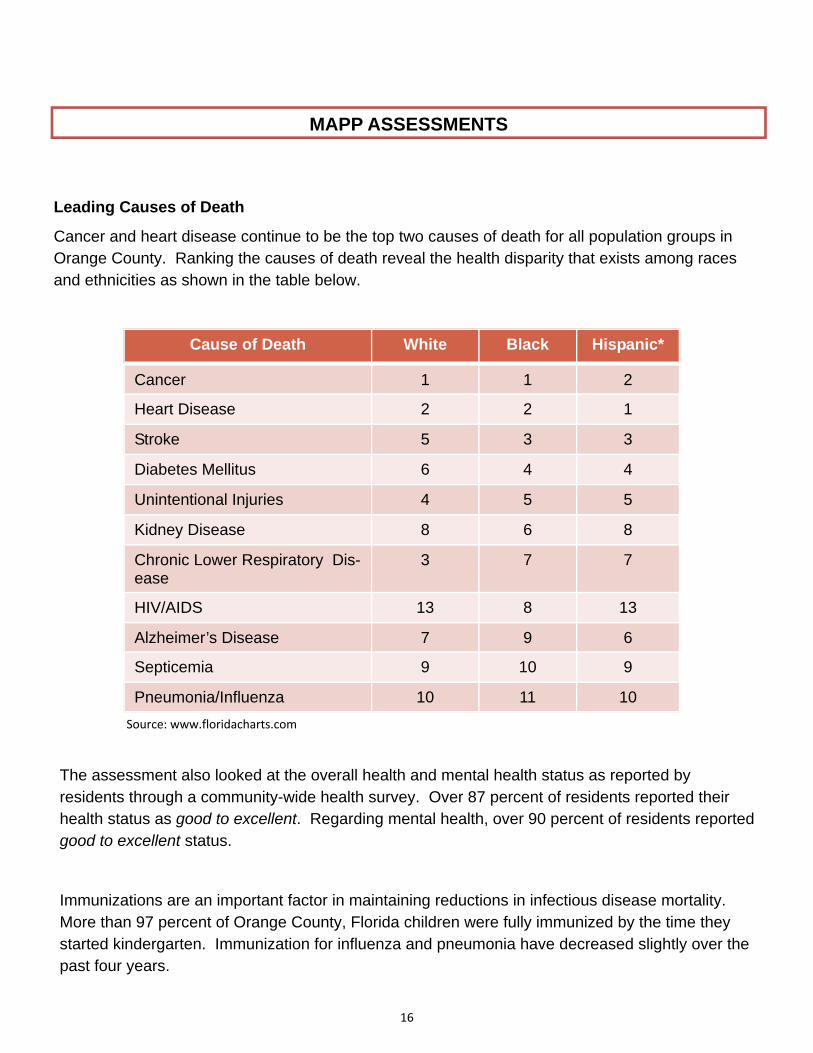
Cancer and heart disease continue to be the top two causes of death for all population groups in Orange County. Ranking the causes of death reveal the health disparity that exists among races and ethnicities as shown in the table below.
Cause of Death White Black Hispanic*
Cancer 1 1 2
Heart Disease 2 2 1
Stroke 5 3 3
Diabetes Mellitus 6 4 4
Unintentional Injuries 4 5 5
Kidney Disease 8 6 8
Chronic Lower Respiratory Dis-ease
3 7 7
HIV/AIDS 13 8 13
Alzheimer’s Disease 7 9 6
Septicemia 9 10 9
Pneumonia/Influenza 10 11 10
The assessment also looked at the overall health and mental health status as reported by residents through a community-wide health survey. Over 87 percent of residents reported their health status as good to excellent. Regarding mental health, over 90 percent of residents reported good to excellent status.
Immunizations are an important factor in maintaining reductions in infectious disease mortality. More than 97 percent of Orange County, Florida children were fully immunized by the time they started kindergarten. Immunization for influenza and pneumonia have decreased slightly over the past four years.
Source: www.floridacharts.com
17
MAPP ASSESSMENTS
Sexually Transmitted Disease
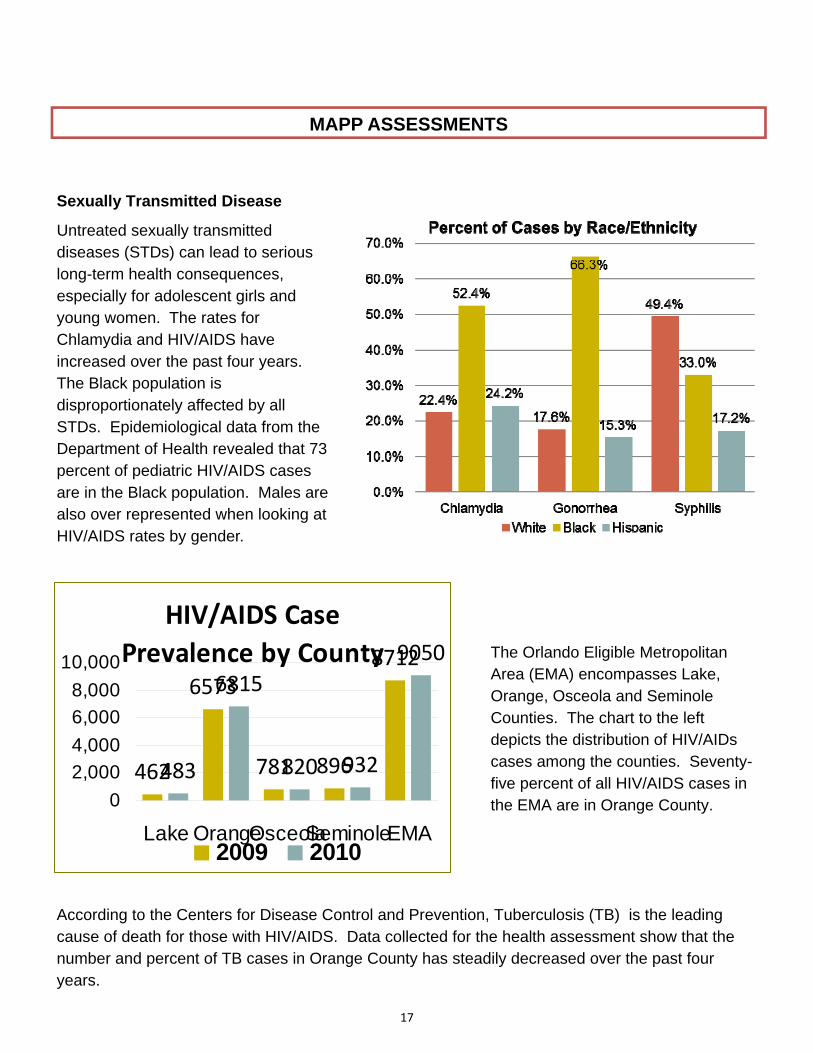
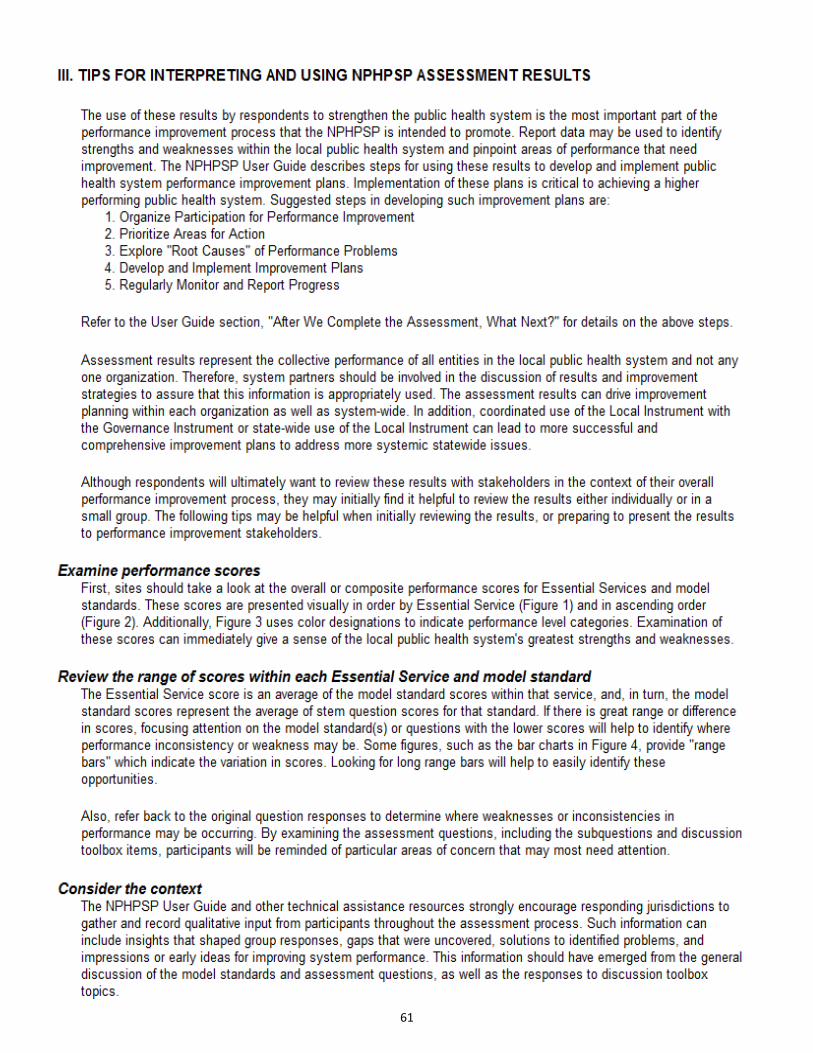
Untreated sexually transmitted diseases (STDs) can lead to serious long-term health consequences, especially for adolescent girls and young women. The rates for Chlamydia and HIV/AIDS have increased over the past four years. The Black population is disproportionately affected by all STDs. Epidemiological data from the Department of Health revealed that 73 percent of pediatric HIV/AIDS cases are in the Black population. Males are also over represented when looking at HIV/AIDS rates by gender.
HIV/AIDS Case
Prevalence by County
462
6573
781 896
8712
483
6815
820 932
9050
0
2,000
4,000
6,000
8,000
10,000
Lake OrangeOsceolaSeminoleEMA2009 2010
The Orlando Eligible Metropolitan Area (EMA) encompasses Lake, Orange, Osceola and Seminole Counties. The chart to the left depicts the distribution of HIV/AIDs cases among the counties. Seventy-five percent of all HIV/AIDS cases in the EMA are in Orange County.
According to the Centers for Disease Control and Prevention, Tuberculosis (TB) is the leading cause of death for those with HIV/AIDS. Data collected for the health assessment show that the number and percent of TB cases in Orange County has steadily decreased over the past four years.
18
MAPP ASSESSMENTS
Modifiable Risk Factors
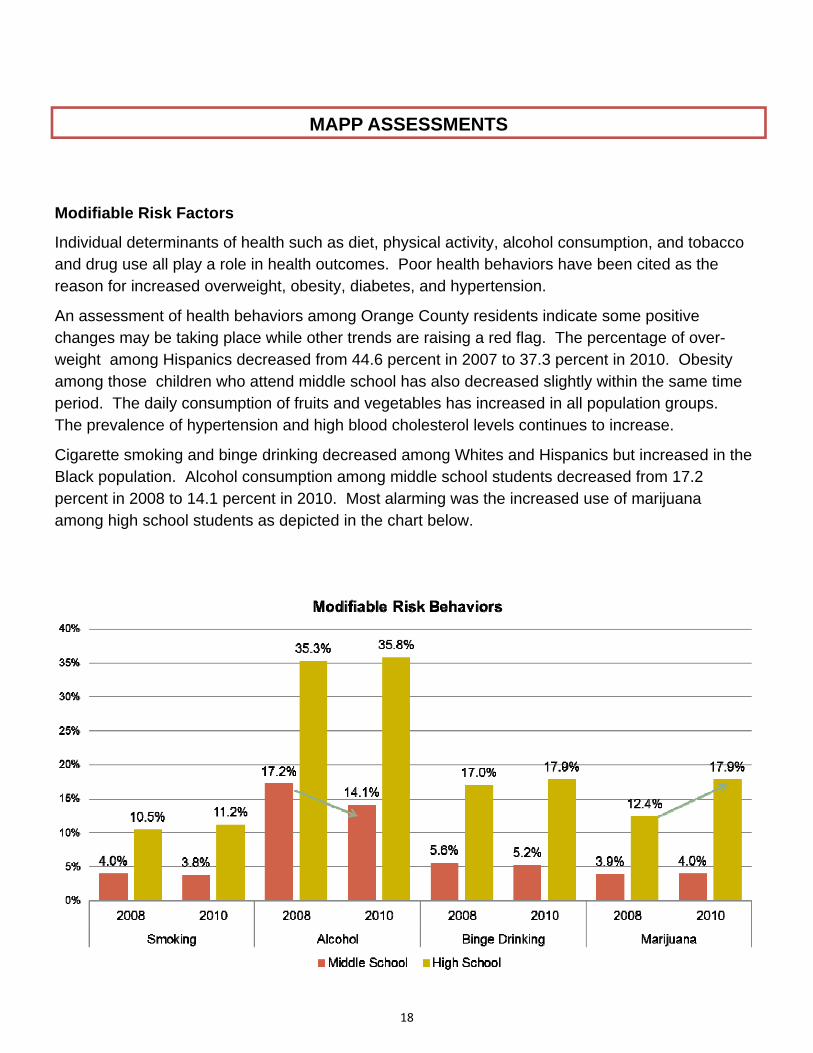
Individual determinants of health such as diet, physical activity, alcohol consumption, and tobacco and drug use all play a role in health outcomes. Poor health behaviors have been cited as the reason for increased overweight, obesity, diabetes, and hypertension.
An assessment of health behaviors among Orange County residents indicate some positive changes may be taking place while other trends are raising a red flag. The percentage of over-weight among Hispanics decreased from 44.6 percent in 2007 to 37.3 percent in 2010. Obesity among those children who attend middle school has also decreased slightly within the same time period. The daily consumption of fruits and vegetables has increased in all population groups. The prevalence of hypertension and high blood cholesterol levels continues to increase.
Cigarette smoking and binge drinking decreased among Whites and Hispanics but increased in the Black population. Alcohol consumption among middle school students decreased from 17.2 percent in 2008 to 14.1 percent in 2010. Most alarming was the increased use of marijuana among high school students as depicted in the chart below.
19
MAPP ASSESSMENTS
Maternal and Child Health
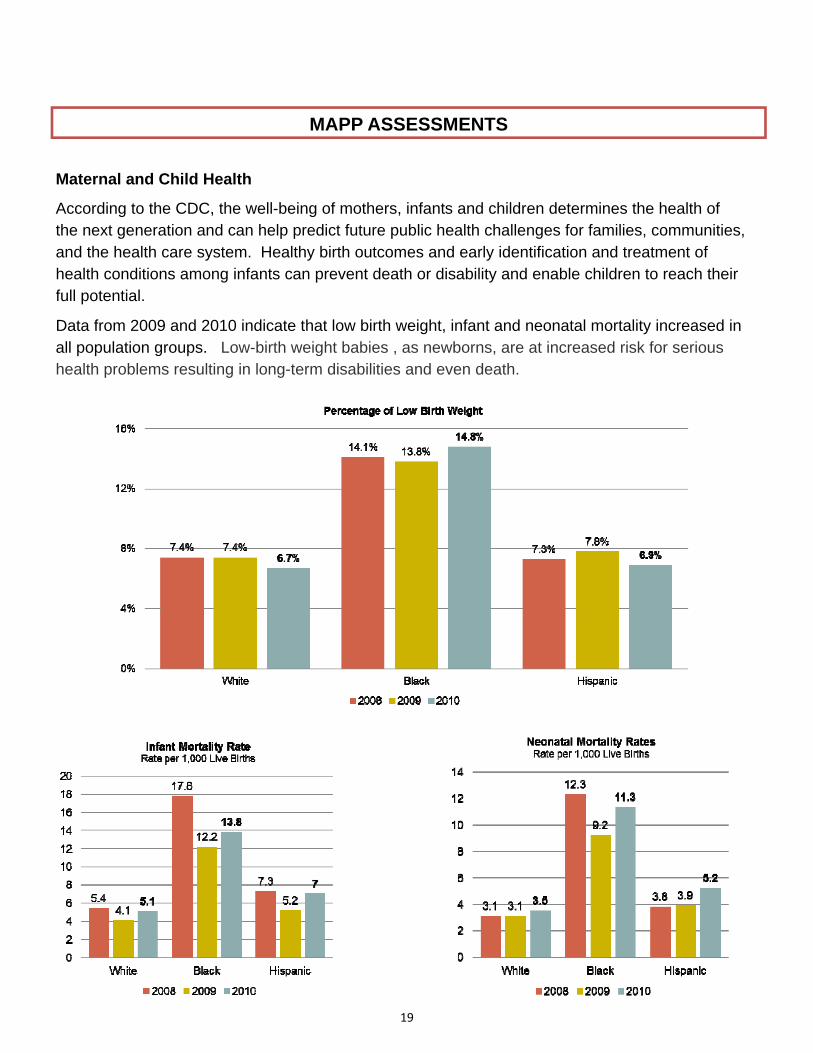
According to the CDC, the well-being of mothers, infants and children determines the health of the next generation and can help predict future public health challenges for families, communities, and the health care system. Healthy birth outcomes and early identification and treatment of health conditions among infants can prevent death or disability and enable children to reach their full potential.
Data from 2009 and 2010 indicate that low birth weight, infant and neonatal mortality increased in all population groups. Low-birth weight babies , as newborns, are at increased risk for serious health problems resulting in long-term disabilities and even death.
20
MAPP ASSESSMENTS
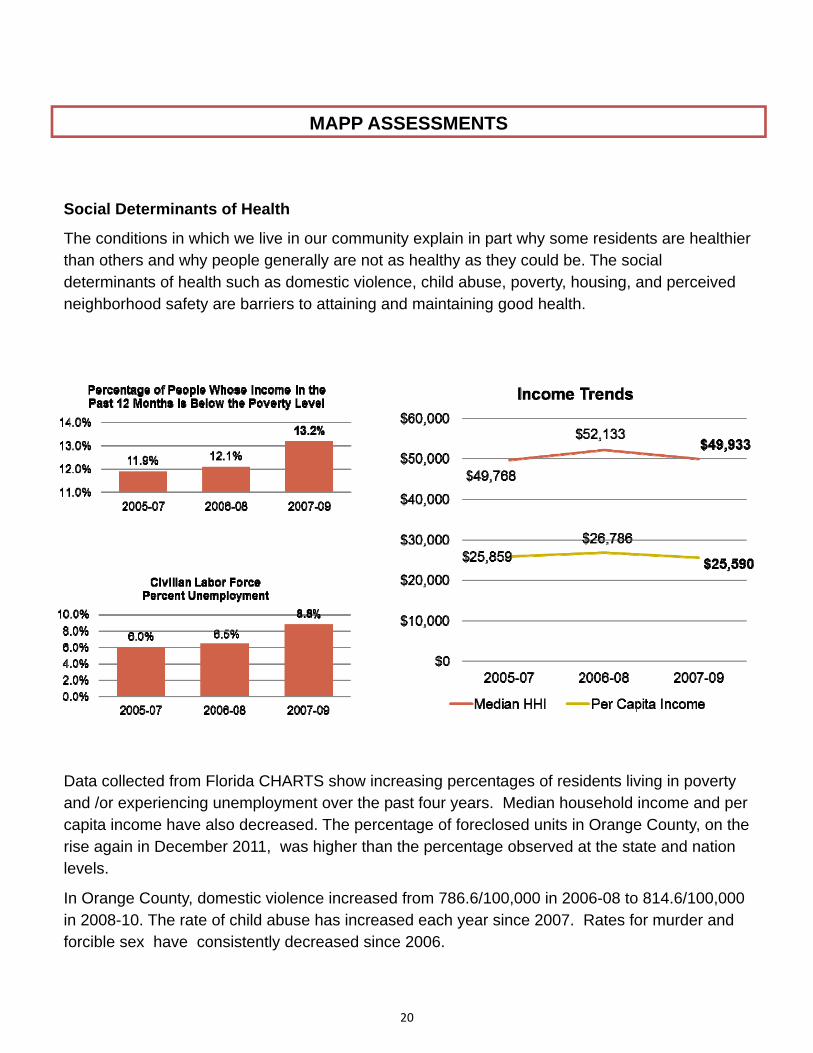
Social Determinants of Health
The conditions in which we live in our community explain in part why some residents are healthier than others and why people generally are not as healthy as they could be. The social determinants of health such as domestic violence, child abuse, poverty, housing, and perceived neighborhood safety are barriers to attaining and maintaining good health.
Data collected from Florida CHARTS show increasing percentages of residents living in poverty and /or experiencing unemployment over the past four years. Median household income and per capita income have also decreased. The percentage of foreclosed units in Orange County, on the rise again in December 2011, was higher than the percentage observed at the state and nation levels.
In Orange County, domestic violence increased from 786.6/100,000 in 2006-08 to 814.6/100,000 in 2008-10. The rate of child abuse has increased each year since 2007. Rates for murder and forcible sex have consistently decreased since 2006.
21
MAPP ASSESSMENTS
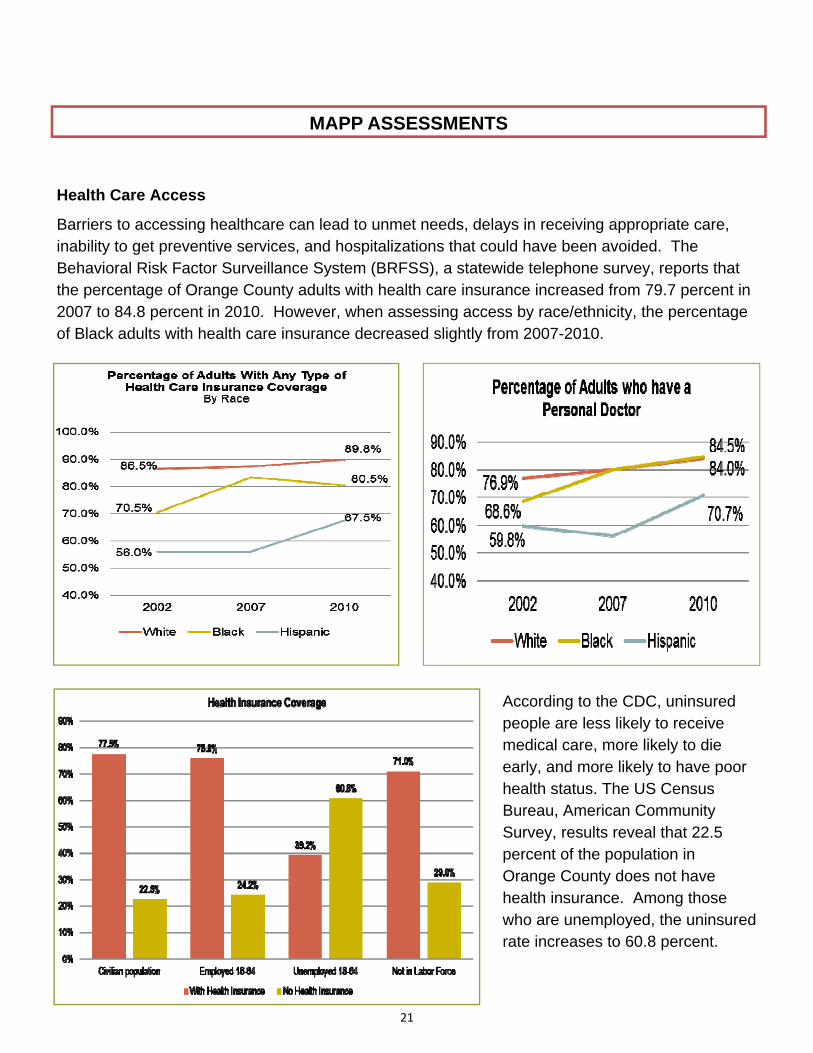
Health Care Access
Barriers to accessing healthcare can lead to unmet needs, delays in receiving appropriate care, inability to get preventive services, and hospitalizations that could have been avoided. The Behavioral Risk Factor Surveillance System (BRFSS), a statewide telephone survey, reports that the percentage of Orange County adults with health care insurance increased from 79.7 percent in 2007 to 84.8 percent in 2010. However, when assessing access by race/ethnicity, the percentage of Black adults with health care insurance decreased slightly from 2007-2010.
According to the CDC, uninsured people are less likely to receive medical care, more likely to die early, and more likely to have poor health status. The US Census Bureau, American Community Survey, results reveal that 22.5 percent of the population in Orange County does not have health insurance. Among those who are unemployed, the uninsured rate increases to 60.8 percent.
22
MAPP ASSESSMENTS
Forces of Change Assessment
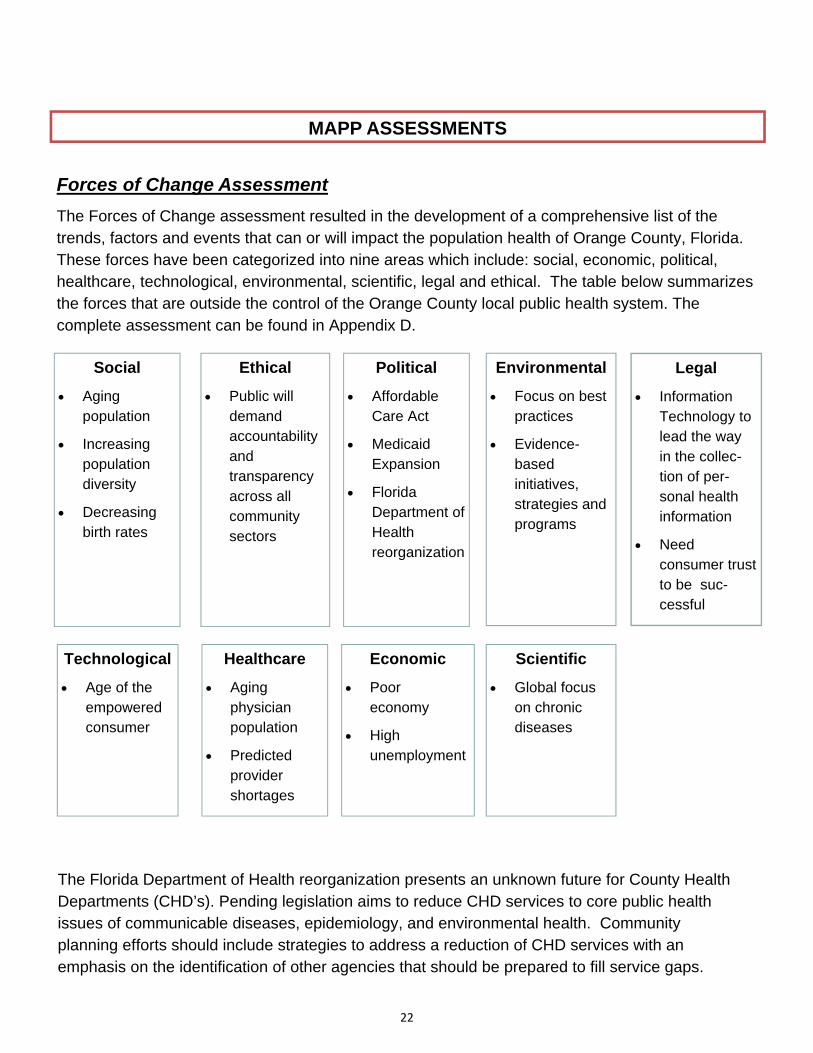
The Forces of Change assessment resulted in the development of a comprehensive list of the trends, factors and events that can or will impact the population health of Orange County, Florida. These forces have been categorized into nine areas which include: social, economic, political, healthcare, technological, environmental, scientific, legal and ethical. The table below summarizes the forces that are outside the control of the Orange County local public health system. The complete assessment can be found in Appendix D.
Social
Aging population
Increasing population diversity
Decreasing birth rates
Economic
Poor economy
High unemployment
Political
Affordable Care Act
Medicaid Expansion
Florida Department of Health reorganization
Healthcare
Aging physician population
Predicted provider shortages
Technological
Age of the empowered consumer
Environmental
Focus on best practices
Evidence-based initiatives, strategies and programs
Scientific
Global focus on chronic diseases
Legal
Information Technology to lead the way in the collec-tion of per-sonal health information
Need consumer trust to be suc-cessful
Ethical
Public will demand accountability and transparency across all community sectors
The Florida Department of Health reorganization presents an unknown future for County Health Departments (CHD’s). Pending legislation aims to reduce CHD services to core public health issues of communicable diseases, epidemiology, and environmental health. Community planning efforts should include strategies to address a reduction of CHD services with an emphasis on the identification of other agencies that should be prepared to fill service gaps.
23
STRATEGIC PLANNING RETREAT
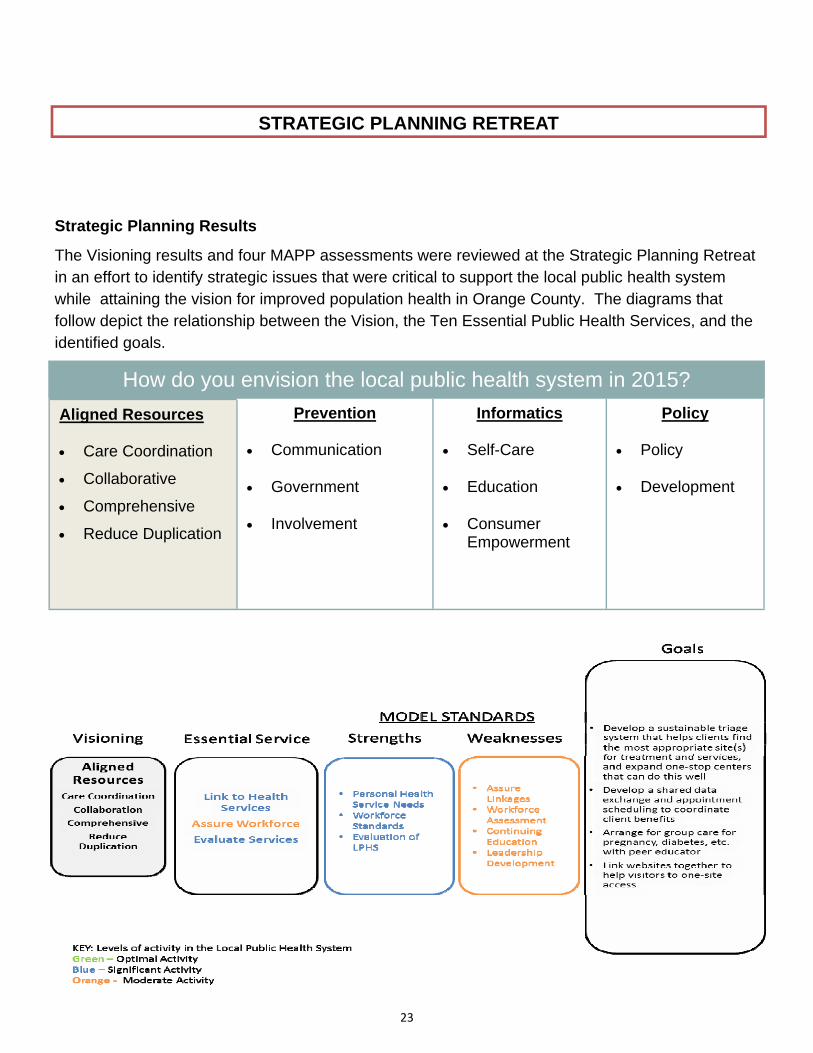
Strategic Planning Results
The Visioning results and four MAPP assessments were reviewed at the Strategic Planning Retreat in an effort to identify strategic issues that were critical to support the local public health system while attaining the vision for improved population health in Orange County. The diagrams that follow depict the relationship between the Vision, the Ten Essential Public Health Services, and the identified goals.
How do you envision the local public health system in 2015?
Aligned Resources Care Coordination
Collaborative
Comprehensive
Reduce Duplication
Prevention
Communication
Government
Involvement
Informatics
Self-Care
Education
Consumer Empowerment
Policy
Policy
Development
24
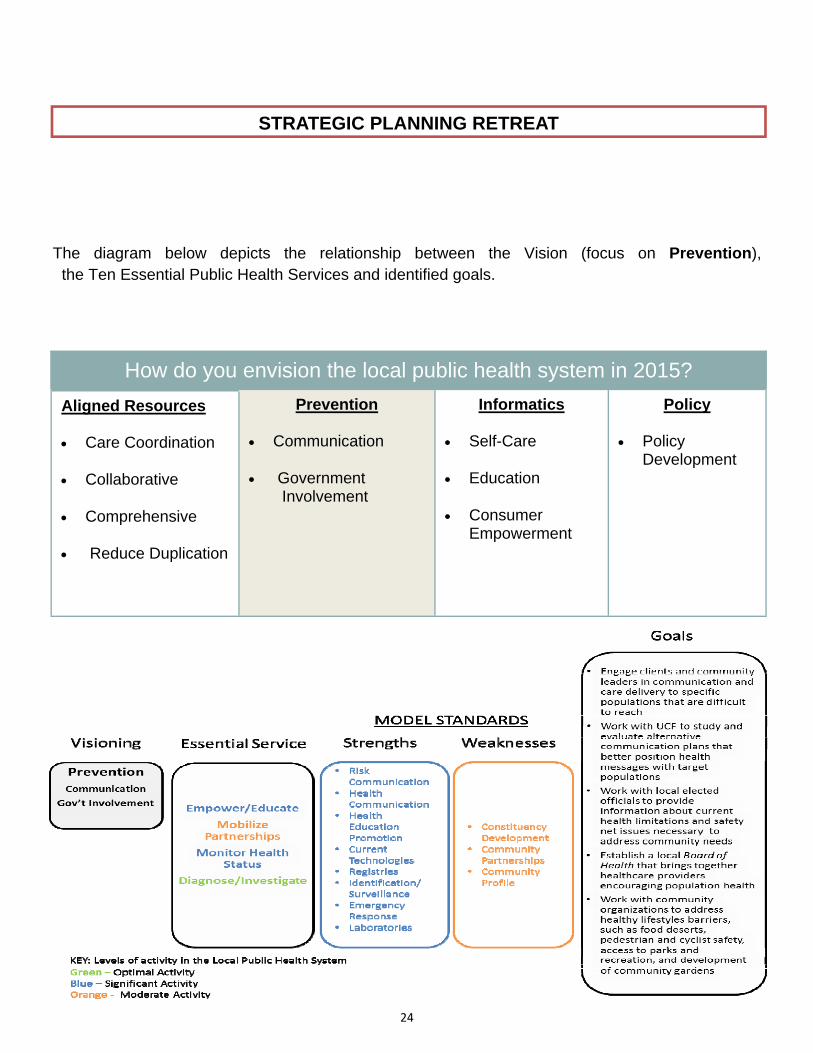
STRATEGIC PLANNING RETREAT
How do you envision the local public health system in 2015?
Aligned Resources Care Coordination
Collaborative
Comprehensive
Reduce Duplication
Prevention
Communication
Government Involvement
Informatics
Self-Care
Education
Consumer Empowerment
Policy
Policy Development
The diagram below depicts the relationship between the Vision (focus on Prevention), the Ten Essential Public Health Services and identified goals.
25
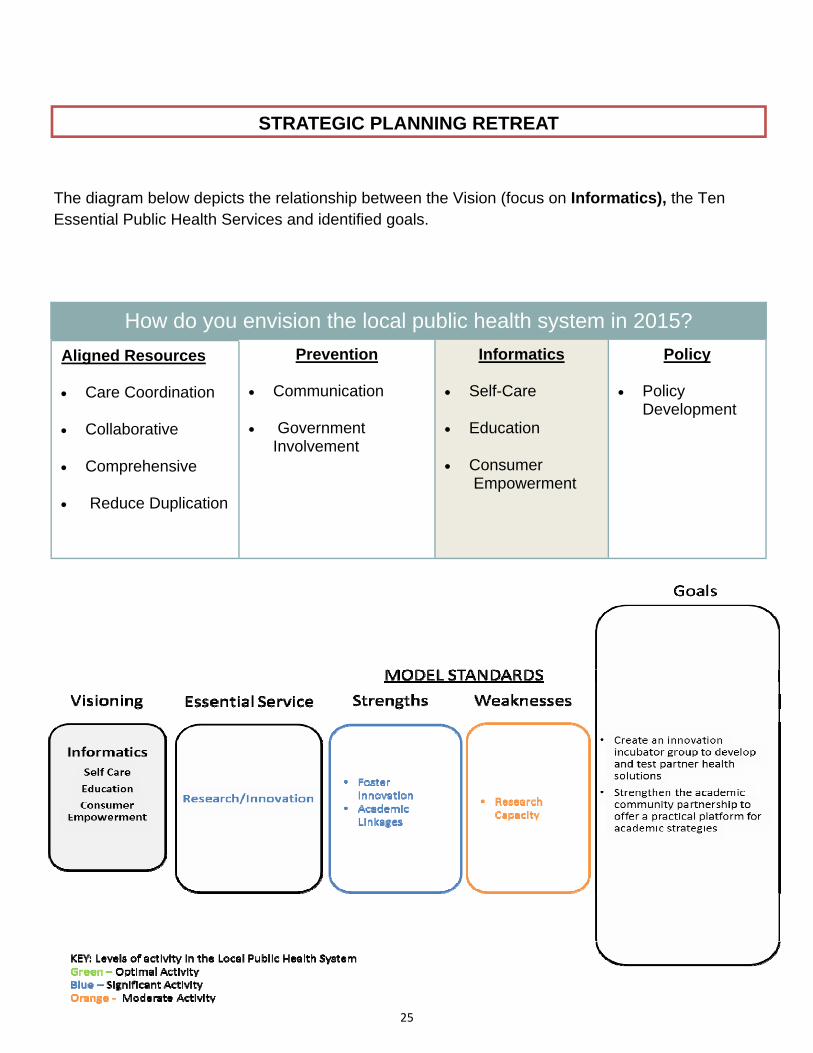
STRATEGIC PLANNING RETREAT
The diagram below depicts the relationship between the Vision (focus on Informatics), the Ten Essential Public Health Services and identified goals.
How do you envision the local public health system in 2015?
Aligned Resources Care Coordination
Collaborative
Comprehensive
Reduce Duplication
Prevention
Communication
Government Involvement
Informatics
Self-Care
Education
Consumer Empowerment
Policy
Policy Development
26
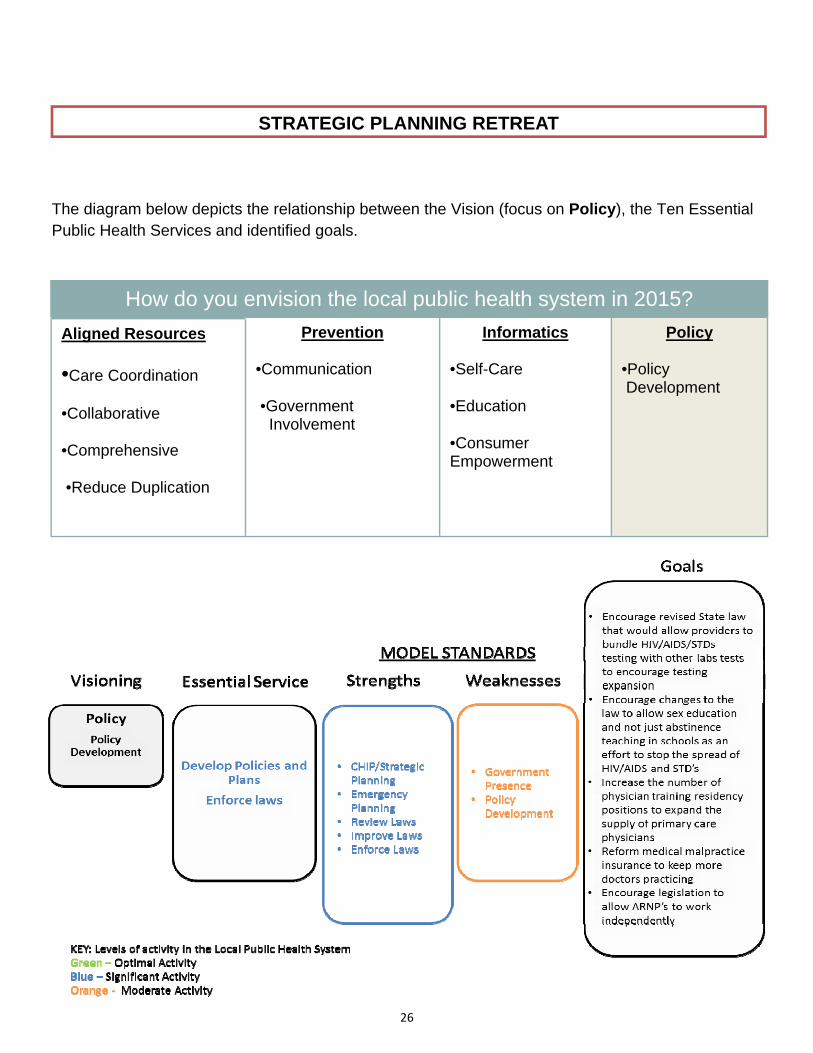
STRATEGIC PLANNING RETREAT
How do you envision the local public health system in 2015?
Aligned Resources
•Care Coordination
•Collaborative
•Comprehensive
•Reduce Duplication
Prevention
•Communication
•Government Involvement
Informatics
•Self-Care
•Education
•Consumer Empowerment
Policy
•Policy Development
The diagram below depicts the relationship between the Vision (focus on Policy), the Ten Essential Public Health Services and identified goals.
27
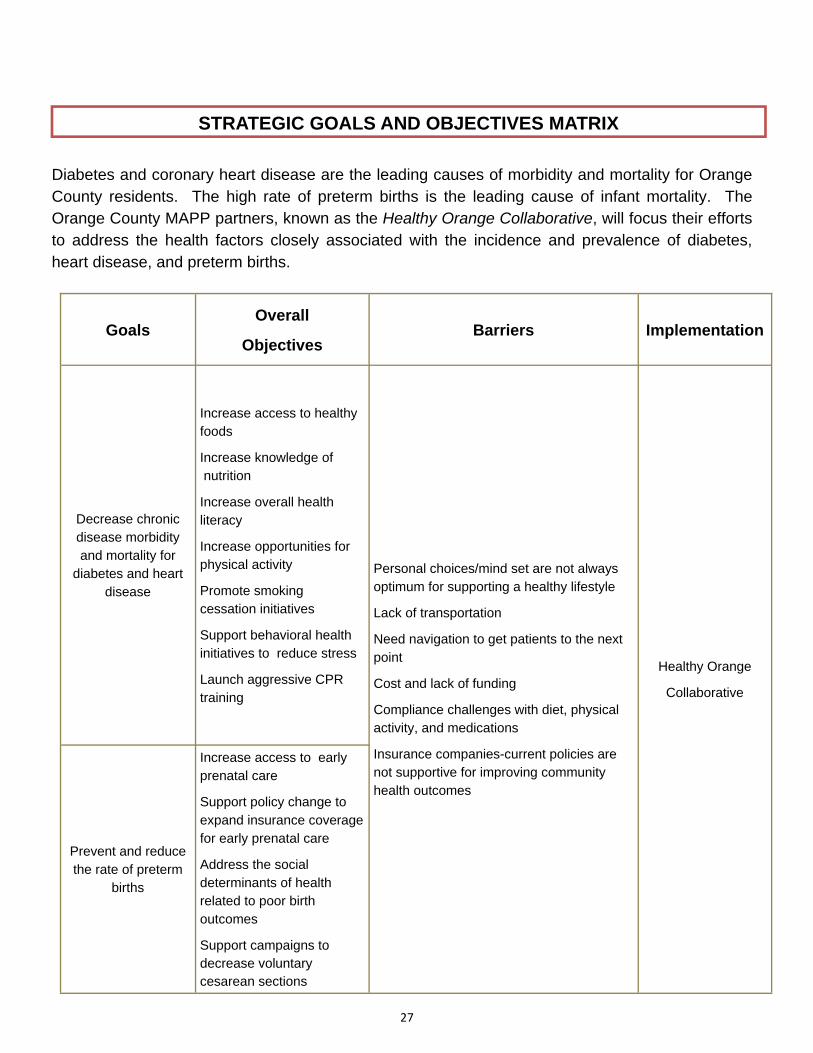
STRATEGIC GOALS AND OBJECTIVES MATRIX
Diabetes and coronary heart disease are the leading causes of morbidity and mortality for Orange County residents. The high rate of preterm births is the leading cause of infant mortality. The Orange County MAPP partners, known as the Healthy Orange Collaborative, will focus their efforts to address the health factors closely associated with the incidence and prevalence of diabetes, heart disease, and preterm births.
Goals Overall
Objectives Barriers Implementation
Decrease chronic disease morbidity and mortality for
diabetes and heart disease
Increase access to healthy foods
Increase knowledge of nutrition
Increase overall health literacy
Increase opportunities for physical activity
Promote smoking cessation initiatives
Support behavioral health initiatives to reduce stress
Launch aggressive CPR training
Personal choices/mind set are not always optimum for supporting a healthy lifestyle
Lack of transportation
Need navigation to get patients to the next point
Cost and lack of funding
Compliance challenges with diet, physical activity, and medications
Insurance companies-current policies are not supportive for improving community health outcomes
Healthy Orange
Collaborative
Prevent and reduce the rate of preterm
births
Increase access to early prenatal care
Support policy change to expand insurance coverage for early prenatal care
Address the social determinants of health related to poor birth outcomes
Support campaigns to decrease voluntary cesarean sections
28
Objective 1.1: By December 31, 2015, decrease morbidity and mortality related to diabetes and heart disease by 3% through educational outreach on nutrition. (SP, 20, SG, ES) Strategy 1.1.1: Partner with organizations to promote educational outreach on nutrition Objective 1.2: By December 31, 2015, decrease morbidity and mortality related to diabetes and heart disease by 3% through increasing access to healthy food. (SP, 20, SG, ES) Strategy 1.2.1: Work with community partners to expand the development of community gardens at local park facilities
Strategy 1.2.2: Build partnerships with transportation providers to increase access to grocery stores, farmers markets, and community gardens Objective 1.3: By December 31, 2015, decrease morbidity and mortality related to diabetes and heart disease by 3% by promoting the benefits of physical activity. (SP, 20, SG, ES) Strategy 1.3.1: Partner with organizations to promote educational outreach to increase participation in physical activity
Strategy 1.3.2: Support the distribution of physical activity education messages through social media Strategy 1.3.3: Conduct a safety assessment to determine the barriers for participating in physical activities within the community
SP—Florida State Health Improvement Plan 2012-2015
20—Healthy People 2020
ES— Ten Essential Services
SG— Strategic Goal
STRATEGIC GOALS AND OBJECTIVES
The findings from the four MAPP assessments lead to the development of three overarching goals to decrease morbidity and mortality as it relates to diabetes, heart disease and preterm births. Increasing the adoption of healthy lifestyle behaviors within the community will also improve overall health outcomes for other chronic diseases and conditions.
The goals and objectives of the Orange County CHIP have been aligned with measures from the Florida State Healthy Improvement Plan 2012-2015, Healthy People 2020, the Ten Essential Public Health Services as defined by the National Public Health Performance Standards Program, and the strategic goals developed at the MAPP Strategic Planning Retreat.
GOAL 1: Decrease morbidity and mortality related to diabetes and heart disease
29
Objective 1.4: By December 31, 2015 decrease morbidity and mortality related to diabetes and heart disease by 3%, and promoting smoking cessation initiatives. (SP, 20, SG, ES) Strategy 1.4.1: Support smoking cessation efforts throughout the community Strategy 1.4.2: Assure all distributed health materials reflect the principles and practices of cultural and linguistic competence
Strategy 1.4.3: Support education for middle and high school students on the harmful effects of to-bacco use Strategy 1.4.4: Raise awareness on the dangers of Hookah bars Strategy 1.4.5: Develop a centralized source for smoking cessation resources Objective 1.5: By December 31, 2015, decrease by 3% morbidity and mortality of stress related diabetes and heart disease. (SG, ES) Strategy 1.5.1: Partner with behavioral health providers to support culturally and linguistically ap-propriate education to decrease stress
Strategy 1.5.2: Support the promotion of culturally and linguistically appropriate stress reducing ini-tiatives through social media
Strategy 1.5.3: Promote the use of culturally and linguistically appropriate motivational tools to in-crease behavioral compliance to reduce stress Objective 1.6: By December 31, 2015, reduce the severity of cardiac events through aggressive CPR training. (ES) Strategy 1.6.1: Develop a community-wide CPR training campaign
Objective 2.1: By December 31, 2015, prevent and reduce preterm births by 3% through culturally and linguistically sensitive education on the importance of early prenatal care. (SP, 20, SG, ES) Strategy 2.1.1: Support education on the benefits of early prenatal care through social media outlets
Strategy 2.1.2: Educate local employers on the benefits of early prenatal care Strategy 2.1.3: Engage local employers to promote the benefits of early prenatal care for employees
Strategy 2.1.4: Support education on the inappropriate use of pain medications during pregnancy Strategy 2.1.5: Promote the importance of women’s health prior to pregnancy Strategy 2.1.6: Support family planning education Objective 2.2: By December 31, 2015, prevent and reduce preterm births by 3% through increasing access to care for women of childbearing age. (SP, 20, SG, ES) Strategy 2.2.1: Conduct an assessment to determine availability of community providers for early prenatal care
GOAL 2: Reduce the rate of preterm births
30
Objective 2.3: By December 31, 2015, prevent and reduce by 3% preterm births related to the social determinants of health. (SP, SG, ES) Strategy 2.3.1: Work with community organizations to address the impact of poverty, domestic vio-lence, and racial injustice related to preterm births Objective 2.4: By December 31, 2015, prevent and reduce by 3% preterm births through policy change that supports early prenatal care. (20) Strategy 2.4.1: Work with health insurance providers to expand maternity coverage for early prena-tal care Strategy 2.4.2: Educate local employers on the health and financial benefits of early prenatal care
Objective 2.5: By December 31, 2015, prevent and reduce by 3% preterm births by decreasing the number of voluntary Cesarean Sections. (20) Strategy 2.5.1: Support campaigns for hospitals to adopt “hard stops” for voluntary C-sections Strategy 2.5.2: Support the reduction of non-medically necessary inductions and C-sections before 39 weeks gestation
Objective 3.1: By December 31, 2015, increase to 90% the number of two-year-olds who are fully immunized. (SP, 20, SG, ES) Strategy 3.1.1: Partner with local organizations, day-cares, and providers to educate the community on the importance of vaccinations for children under two years of age Strategy 3.1.2: Create community awareness through education using social media, local media, internet, and outreach
Objective 3.2: By December 31, 2015, increase to 75% the number of adults aged 65 and older who have had a flu shot in the previous year. (20, SG) Strategy 3.2.1: Partner with local organizations, senior centers, community centers, and providers to educate the community on the importance of adult vaccinations Strategy 3.2.2: Create community awareness through education using social media, local media, internet, and outreach Objective 3.3: By December 31, 2015, reduce to 2620 per 100,000 the rate of bacterial STD cases among females 15-34 years of age. (SP, 20, SG) Strategy 3.3.1: Promote the Stop the Denial campaign targeting teens to get tested Strategy 3.3.1: Develop a texting campaign to increase awareness of test results and compliance with treatment Objective 3.4: By December 31, 2015, reduce the TB case rate to 3.5 per 100,000. (SP, 20, SG) Strategy 3.4.1: Partner with local providers to increase accurate reporting of positive cases to the state Strategy 3.4.2: Partner with local providers to refer suspected positive cases to DOH Strategy 3.4.3: Develop a texting campaign to increase awareness of test results and compliance with treatment
GOAL 3: Prevent disease, disability and death through public health interventions.
31
Objective 3.5: By December 31, 2015, increase to 93% the number of TB patients completing therapy within 12 months of initiation of treatment. (SP, 20, SG) Strategy 3.5.1: Increase client education on the importance of therapy completion Strategy 3.5.2: Implement Video Directly Observed Therapy to help patients comply and adhere with TB treatment Objective 3.6: By December 31, 2015, reduce the enteric disease case rate to 51.7 per 100,000. (20, SG) Strategy 3.6.1: Provide outbreak assistance and oversee outbreak investigations Strategy 3.6.2: Develop, evaluate, and supply outbreak investigation tools and training materials Strategy 3.4.3: Develop, implement, and evaluate strategies for the prevention and control of disease outbreaks Objective 3.7: By December 31, 2015, reduce the AIDS case rate to 20.5 per 100,000. (SP, 20, SG) Strategy 3.7.1: Provide education on disease transmission and medical adherence Strategy 3.7.2: Partner with local providers to refer suspected positive cases to DOH
Objective 3.8: By December 31, 2015, increase to 95% the number of HIV-infected people in Orange County who know they are infected. (SP, 20, SG, ES) Strategy 3.8.1: Provide education on disease transmission and medical adherence
Note: For measurable outcomes and designated accountable agencies see Appendix F.
32
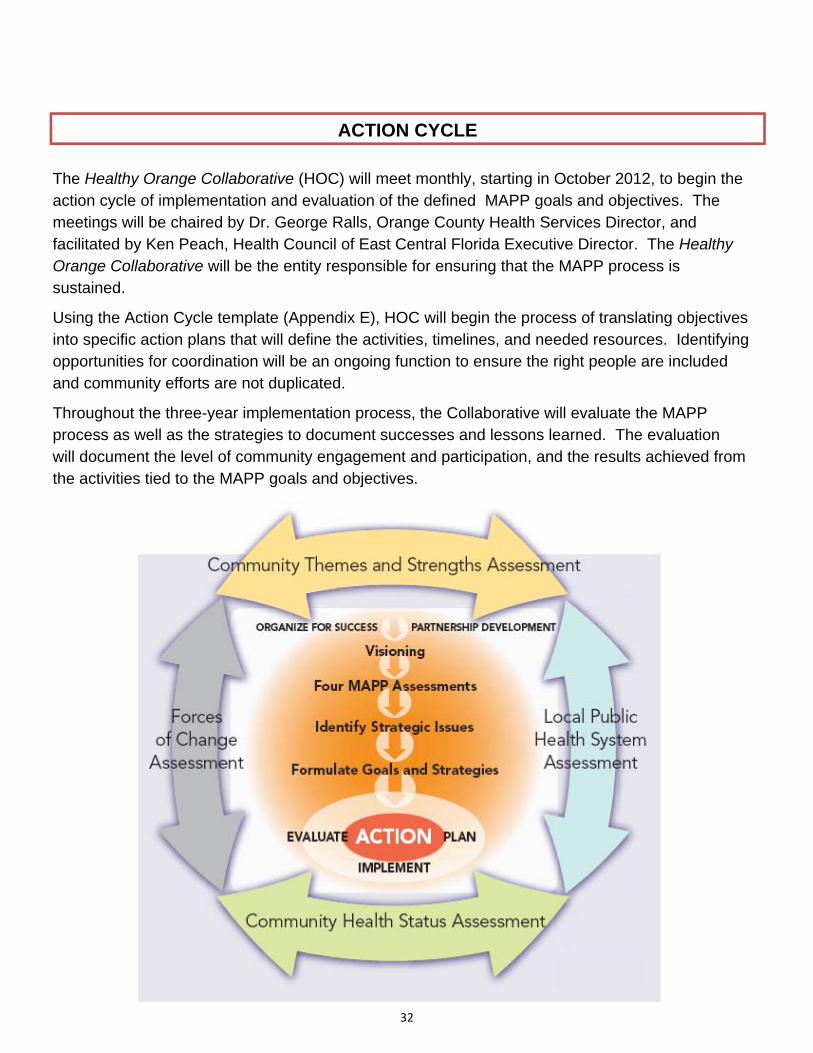
ACTION CYCLE
The Healthy Orange Collaborative (HOC) will meet monthly, starting in October 2012, to begin the action cycle of implementation and evaluation of the defined MAPP goals and objectives. The meetings will be chaired by Dr. George Ralls, Orange County Health Services Director, and facilitated by Ken Peach, Health Council of East Central Florida Executive Director. The Healthy Orange Collaborative will be the entity responsible for ensuring that the MAPP process is sustained.
Using the Action Cycle template (Appendix E), HOC will begin the process of translating objectives into specific action plans that will define the activities, timelines, and needed resources. Identifying opportunities for coordination will be an ongoing function to ensure the right people are included and community efforts are not duplicated.
Throughout the three-year implementation process, the Collaborative will evaluate the MAPP process as well as the strategies to document successes and lessons learned. The evaluation will document the level of community engagement and participation, and the results achieved from the activities tied to the MAPP goals and objectives.

33
APPENDIX A
COMMUNITY THEMES AND STRENGTHS
34
SUMMARY
The Orange County Health Department (OCHD) serves approximately one million residents and several mil-lion visitors annually. The mission is to “To protect, promote & improve the health of all people in Florida through integrated state, county, & community efforts". Our vision is “To Be the Healthiest State in the Na-tion”. Orange County Florida populations suffer from high rates of preventable diseases such as obesity, dia-betes, and cardiovascular diseases. Also, there is a great push to reduce preterm births and prevent and con-trol infectious disease. There are pockets of increased disease burden whereby racial, ethnic and lower socio-economic groups experience higher levels of disease than they should based on the size of their population; a phenomenon known as “health disparity”. In many areas, the physical environment does not support good health with numerous underserved communities identified as “food deserts” with little to no access to fresh fruits and vegetables.
The OCHD community health assessment is a tool used to collect, analyze and use data to educate and mo-bilize communities, develop priorities, garner resources, and plan actions to improve the public's health. In 2012, the Orange County Health Department engaged the Health Council of East Central Florida to facilitate a comprehensive, county-wide assessment for Orange County.
This community health assessment provided the opportunity to:
Assess the population health status
Highlight the areas of unmet needs
Present the community perspective
Provide suggestions for interventions
This report includes secondary data from national, state and county-level databases. It also includes primary data that encompasses the community’s perspective.
We protect and promote the health of all residents and visitors in Orange County by offering the following public health services: Community health education, maternal and family planning, epidemiology, environ-mental health, school health, dental immunization, TB, STD and HIV services.
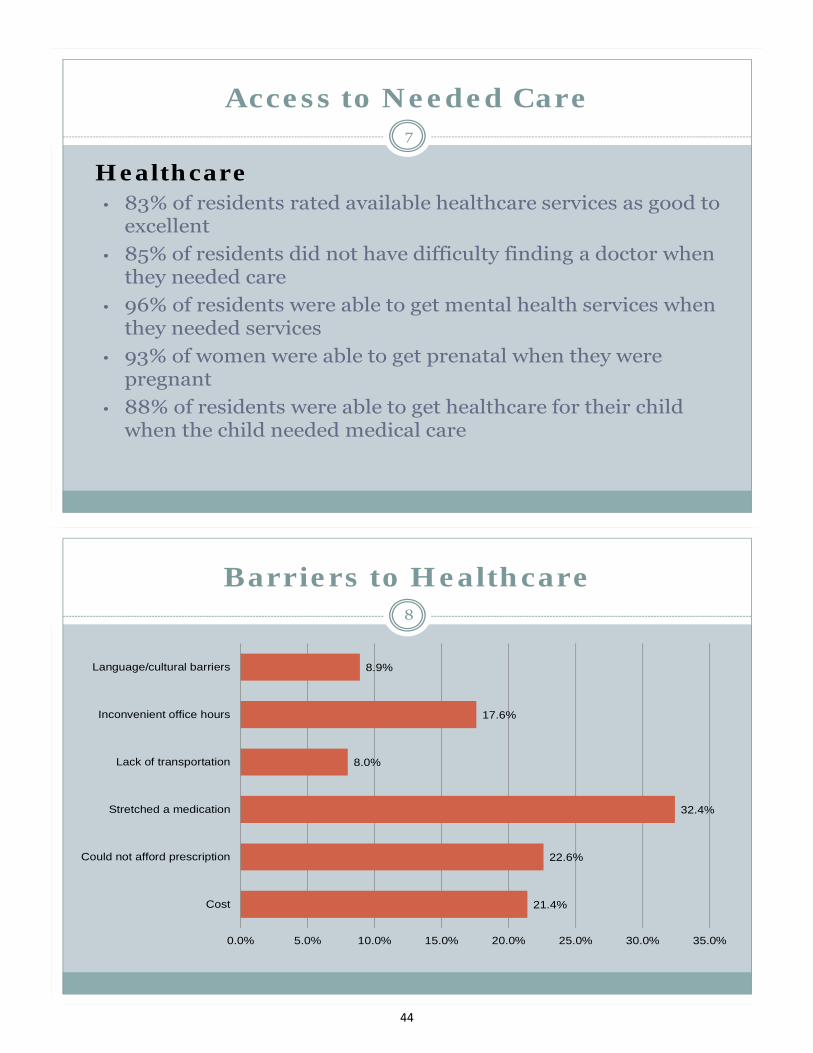
87.2% of the residents of Orange County rate their physical health status somewhere between good and ex-cellent
Mental Health Status
36.5% of residents rate their mental health status as excellent
34.7 % of residents rate their mental health status as very good
19.8 % of the residents rate their mental health status as good
7.2% of the residents rate their mental health status as fair
3.4% of the residents rate their mental health status as poor
Source: 2009 PRC Community Health Assessment

35
Healthcare
83% of the residents rated available healthcare services as good to excellent
85% of the residents did not have difficulty finding a doctor when they needed care
96% of the residents were able to get mental health services when they needed services
93% of women were able to get prenatal care when they were pregnant
88% of residents were able to get their child health care service
Some of the barriers associated with securing health care needs: language barriers, inconvenient office hours, lack of transportation, stretching of medication because the cost of prescription or the cost for services.
Healthcare is accessed via military/VA healthcare, hospital emergency room, traditional doctors office, urgent care/walk-in clinic, hospital based clinic or stand alone clinic.
Education
87% of the Orange County resident are high school graduate or higher with 30% of these residents have a bachelor degree or higher.
The State of Florida graduation rate rose from 56.5 percent in 2002-03 to 74.5 percent in 2011-12.
Source: http://www.fldoe.org/default.asp
Healthy Eating and Physical Activity
Only 26.5% of residents knew that 5 or more fruits and vegetables are recommended daily to prevent un-healthy weight gain.
Almost 80% of residents knew that 30 or more minutes of physical exercise is recommended daily to prevent unhealthy weight gain
Source: Behavioral Risk Factor Surveillance Study
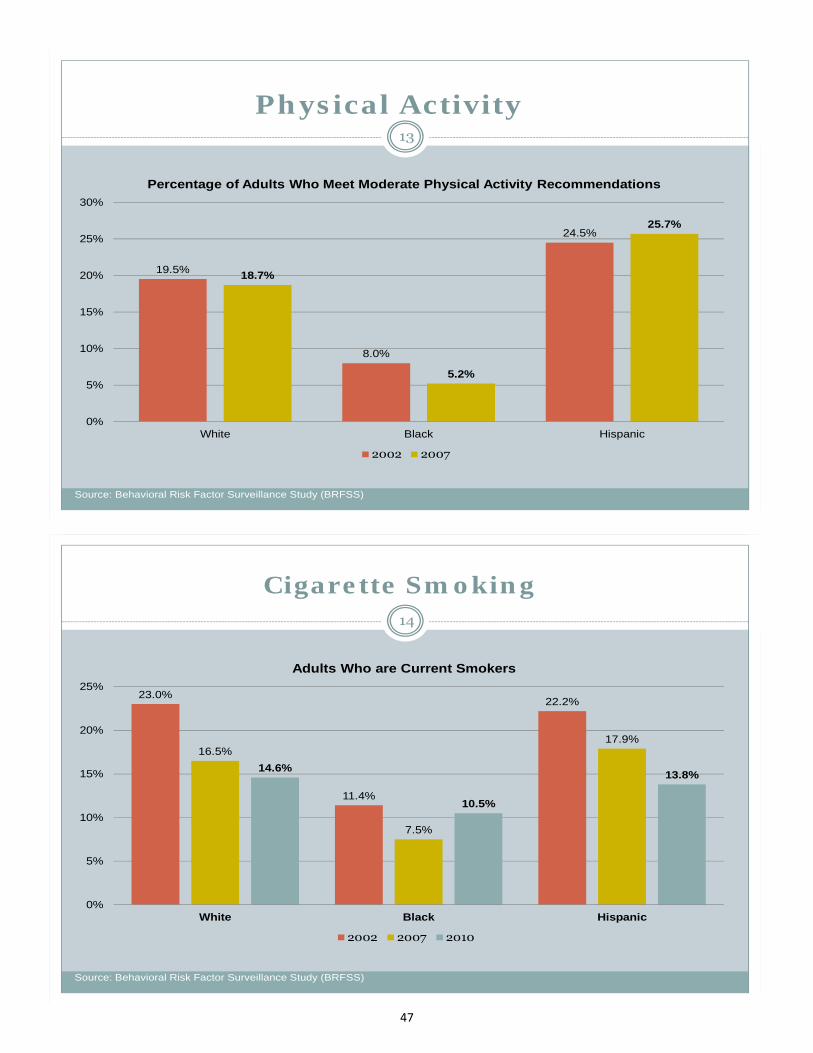
Physical Activity
In 2002 only 51% of the entire Orange population participated in moderate physical activity. By 2007 the physical activity rate dropped to 49.6%
Source: Behavioral Risk Factor Surveillance Study
Cigarette Smoking
In 2002, 56.6% of the population were current cigarette smokers, by 2010 the smokers decreased to 38.9%
Source: Behavioral Risk Factor Surveillance Study
36
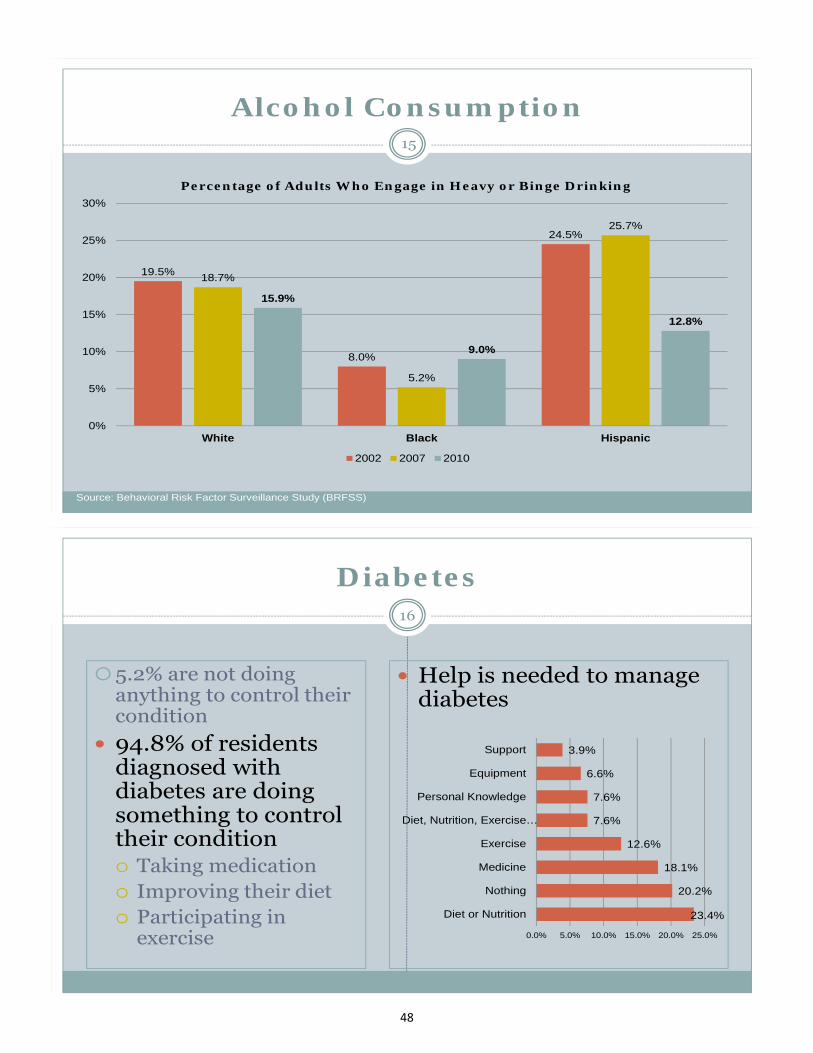
Alcohol Consumption
In 2002, 52.0% of adults engaged in heavy or binge drinking by 2010 the rates decreased to 37.7%
Source: Behavioral Risk Factor Surveillance Study
Diabetes
5.2% of Orange County residents are not doing anything to control their diabetes condition.
94.8% of residents diagnosed with diabetes are doing something to control their condition by:
Take medication
Improving their diet
Participating in exercise
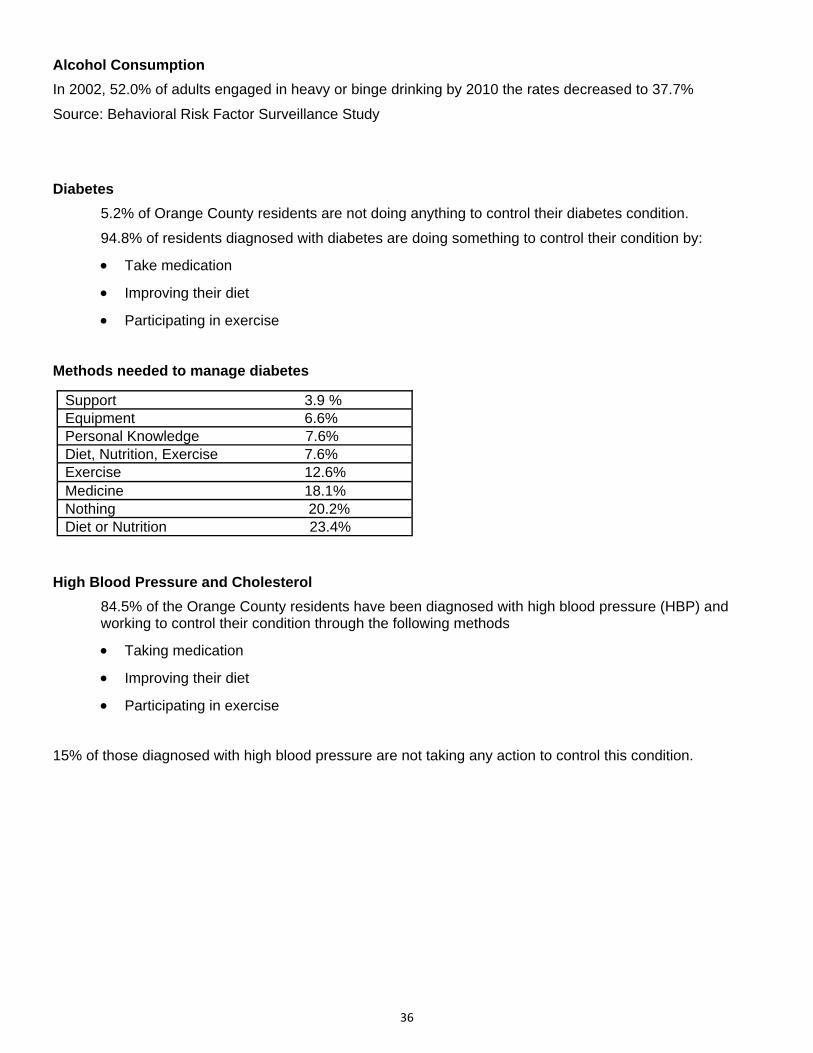
Methods needed to manage diabetes
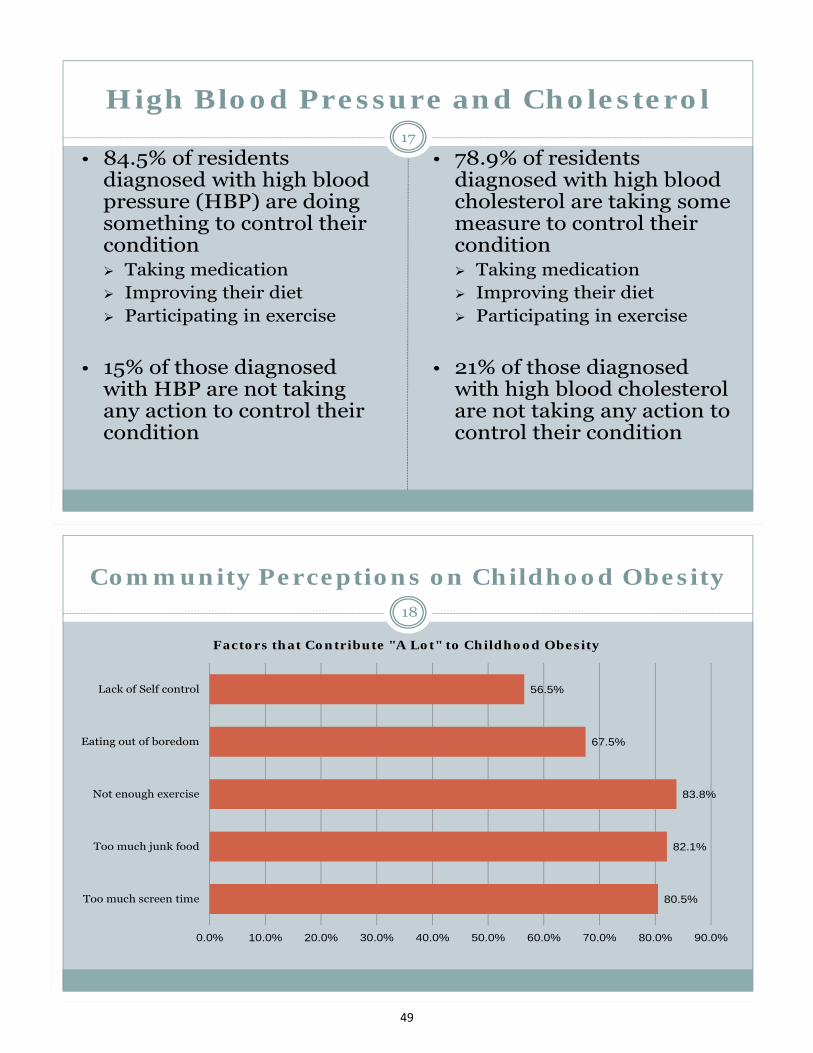
High Blood Pressure and Cholesterol
84.5% of the Orange County residents have been diagnosed with high blood pressure (HBP) and working to control their condition through the following methods
Taking medication
Improving their diet
Participating in exercise
15% of those diagnosed with high blood pressure are not taking any action to control this condition.
Support 3.9 %
Equipment 6.6%
Personal Knowledge 7.6%
Diet, Nutrition, Exercise 7.6%
Exercise 12.6%
Medicine 18.1%
Nothing 20.2%
Diet or Nutrition 23.4%
37
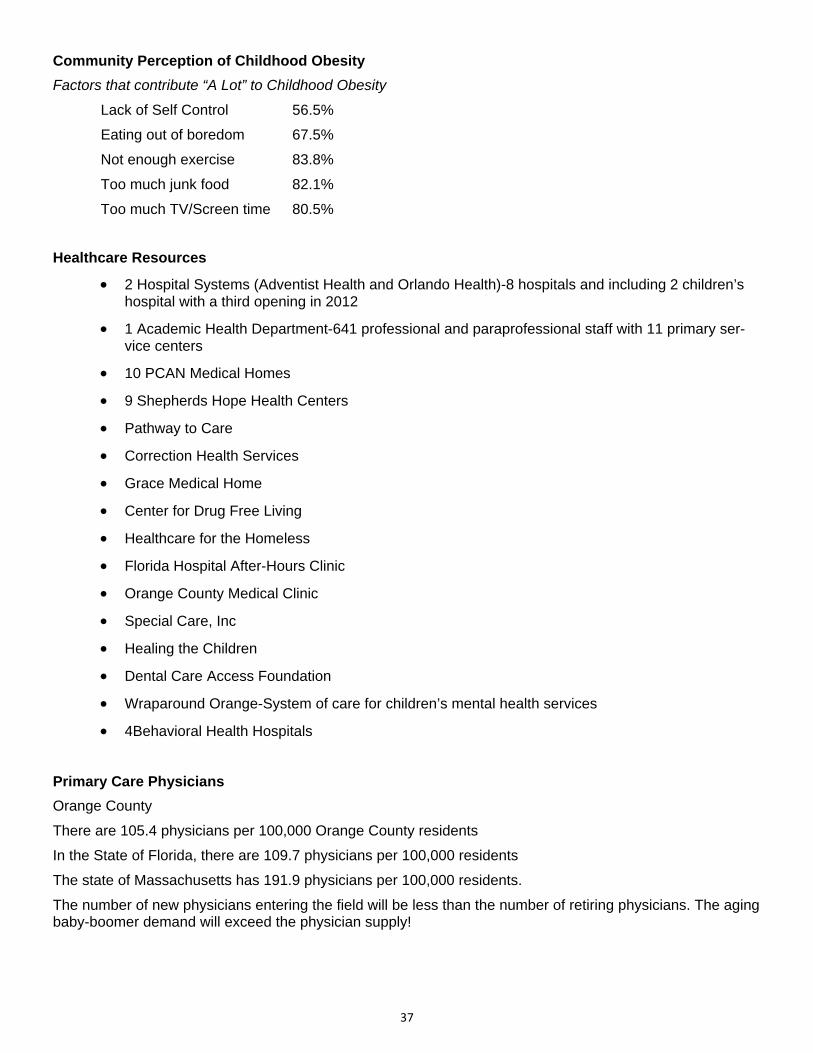
Community Perception of Childhood Obesity
Factors that contribute “A Lot” to Childhood Obesity
Lack of Self Control 56.5%
Eating out of boredom 67.5%
Not enough exercise 83.8%
Too much junk food 82.1%
Too much TV/Screen time 80.5%
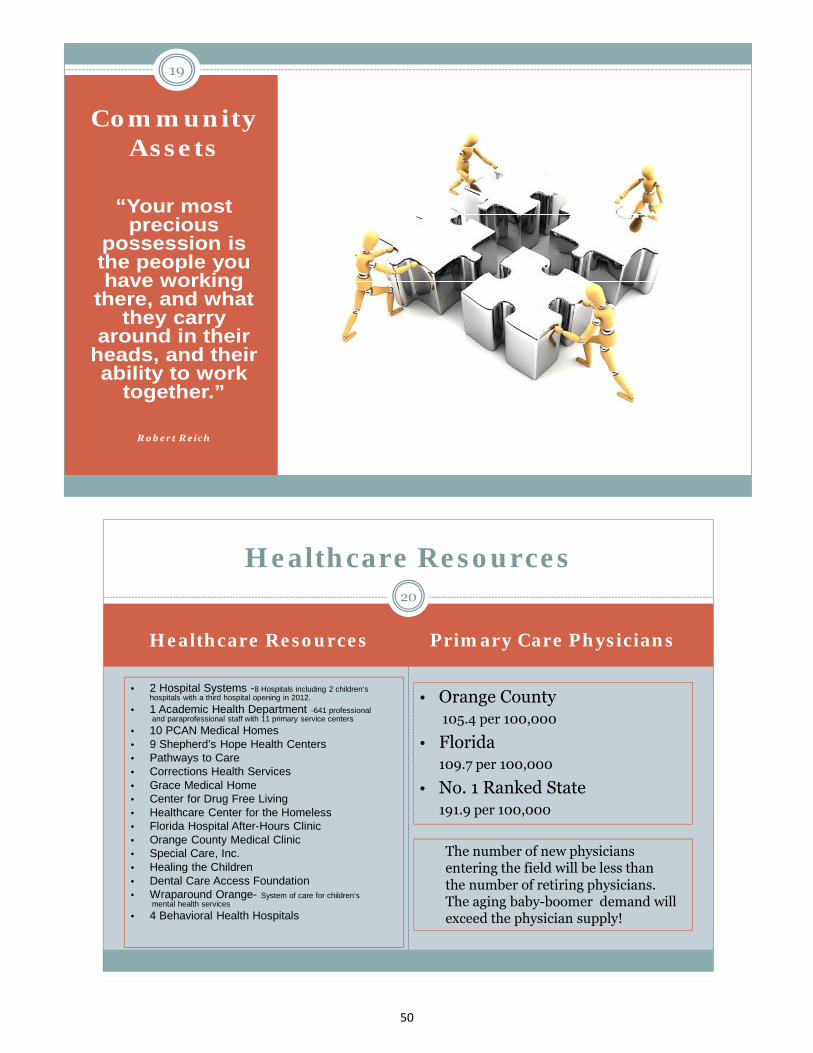
Healthcare Resources
2 Hospital Systems (Adventist Health and Orlando Health)-8 hospitals and including 2 children’s hospital with a third opening in 2012
1 Academic Health Department-641 professional and paraprofessional staff with 11 primary ser-vice centers
10 PCAN Medical Homes
9 Shepherds Hope Health Centers
Pathway to Care
Correction Health Services
Grace Medical Home
Center for Drug Free Living
Healthcare for the Homeless
Florida Hospital After-Hours Clinic
Orange County Medical Clinic
Special Care, Inc
Healing the Children
Dental Care Access Foundation
Wraparound Orange-System of care for children’s mental health services
4Behavioral Health Hospitals
Primary Care Physicians
Orange County
There are 105.4 physicians per 100,000 Orange County residents
In the State of Florida, there are 109.7 physicians per 100,000 residents
The state of Massachusetts has 191.9 physicians per 100,000 residents.
The number of new physicians entering the field will be less than the number of retiring physicians. The aging baby-boomer demand will exceed the physician supply!
38
Information Technology
The University of Central Florida-College of Medicine Regional Extension Center (REC) is assisting providers across Central Florida in the use of electronic health records (EHR’s) to improve patient care.
Central Florida RHIO (Regional Health Information Exchange)
The Lake Nona Medical City consists of the following:
University of Central Florida-College of Medicine Health Science Campus
Sanford Burnham Medical Research Institute
Nemours Pediatric Healthcare Campus
University of Florida Academic Research Center
Veterans Administration Medical Center
MD Anderson Orlando Cancer Research Institute
The biggest businesses and properties in the Central Florida area
Walt Disney World
Universal Studios
Marriott
Hilton
Progress Energy
Rosen Hotels
Sea World
Wyndham Resorts
Westgate Resorts
Lockheed Martin
Vistana
AT&T/Bellsouth
MSR Grande Lakes Resort
FDG Maitland/South Park
Bluegreen Vacation Liberty Property
Bright House Networks
Florida Mall Associates
HIW-KC Orlando LLC
Island One Inc.
Embarq
Darden Corporation
Grand Cypress Resort
Wal-Mart/ Sam’s Club
39
Orange County Public Schools
There are 198 public schools in Orange County. This consists of 124 elementary schools, 39 middle schools, 19 high schools and 21 charter schools.
The school grades are broken down by the following:
55.2% received an “A”
23% received a “B”
18.4% received a “C”
2.9% received a “D”
0.6% received a “F”
*Does not include charter schools
Early Learning Support
There is 151 Day Care Centers in Orange County. Most elementary schools offer extended day enrichment programs. There are before and after school programs offered at middle schools. Parramore Kidz Zone
Parks and Recreation Facilities
There are 96 parks and recreation facilities in Orange County.
Resources for Seniors
Senior Resource Alliance is a local resource for accessing services and programs through state and federal government
Seniors First is a non-profit social service organization
There are:
6 senior centers
5 Adult day care
7 Local senior citizen organizations
More community assets
Faith based organization
Non-profit entities
Local government support
Emergency preparedness
Police and Fire safety
Community building and planning department
Housing and shelter authorities
Food pantries
Health and wellness centers

40
2012 Overarching Community Themes
Maximizing resources
Information technology will play a greater role
Focus on awareness and prevention
Plan for the Affordable Care Act
41
MOBILIZING FOR ACTION THROUGH PLANNING AND PARTNERSHIPS
(MAPP)
S P O NS OR ED B Y :
THE ORANGE COUNTYHEALTH DEPARTMENT
Community Themes and Strengths
1
Community Themes and Strengths
What’s important to our community?
How is the quality of life perceived in our community?
What assets do we have that can be used to improve community health?
2
42
What’s important to our community?
To become the
healthiest and safest community in Central
Florida
3
Orange County Health Department Mission
Protect and promote the health of all residents and visitors in Orange County Community Health education
Maternal and Family Planning
Epidemiology
Environmental health
School health
Dental
Immunizations, TB, STD’s, HIV
4
43
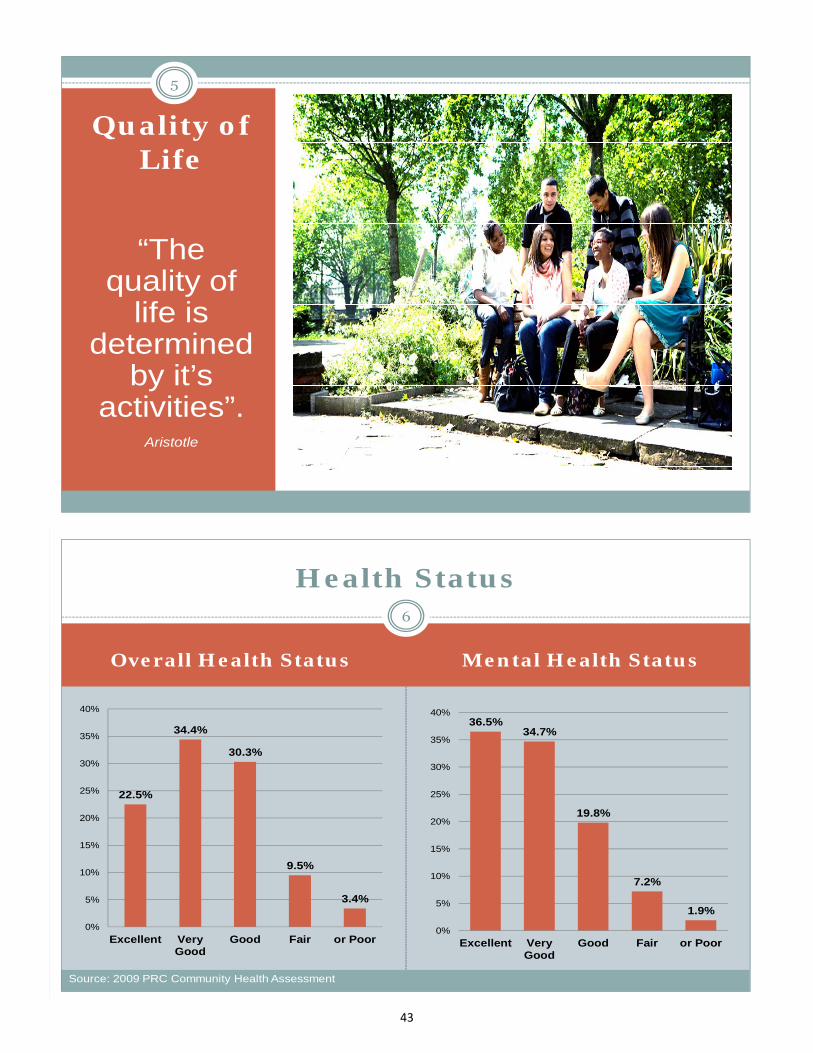
Quality of Life
“The quality of
life is determined
by it’s activities”.
Aristotle
5
Overall Health Status Mental Health Status
22.5%
34.4%
30.3%
9.5%
3.4%
0%
5%
10%
15%
20%
25%
30%
35%
40%
Excellent VeryGood
Good Fair or Poor
36.5%34.7%
19.8%
7.2%
1.9%
0%
5%
10%
15%
20%
25%
30%
35%
40%
Excellent VeryGood
Good Fair or Poor
Health Status
Source: 2009 PRC Community Health Assessment
6
44
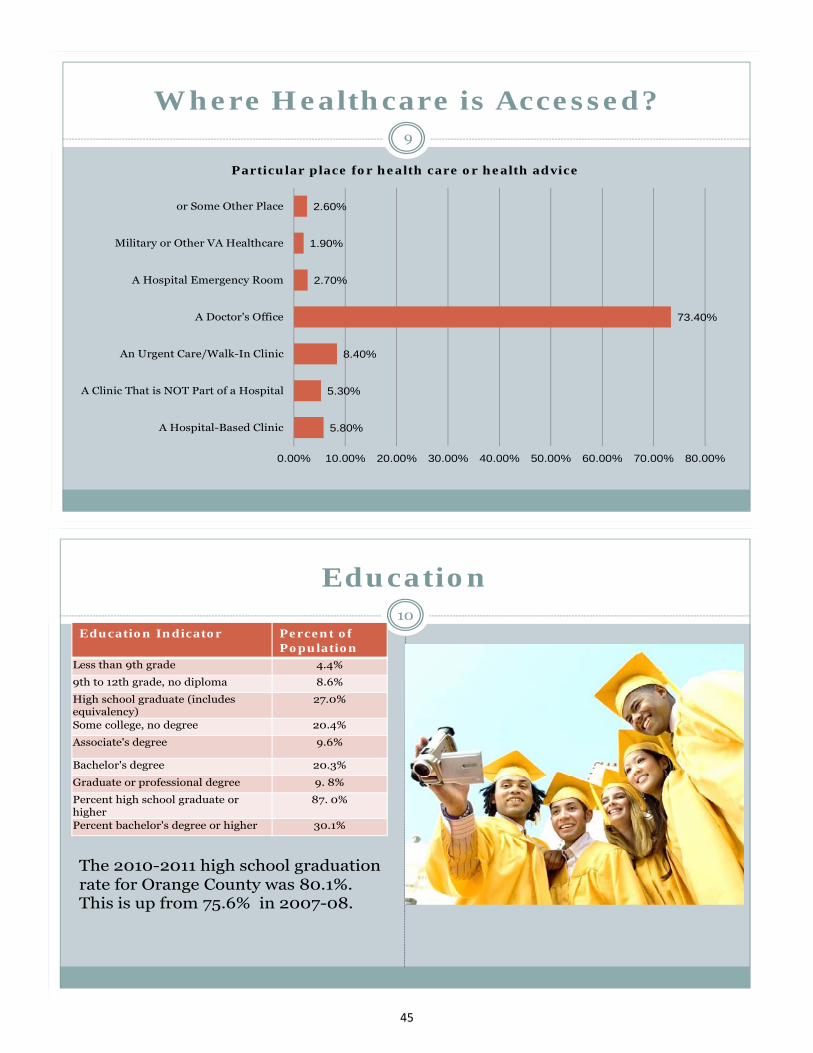
Access to Needed Care
Healthcare• 83% of residents rated available healthcare services as good to
excellent
• 85% of residents did not have difficulty finding a doctor when they needed care
• 96% of residents were able to get mental health services when they needed services
• 93% of women were able to get prenatal when they were pregnant
• 88% of residents were able to get healthcare for their child when the child needed medical care
7
Barriers to Healthcare
21.4%
22.6%
32.4%
8.0%
17.6%
8.9%
0.0% 5.0% 10.0% 15.0% 20.0% 25.0% 30.0% 35.0%
Cost
Could not afford prescription
Stretched a medication
Lack of transportation
Inconvenient office hours
Language/cultural barriers
8
45
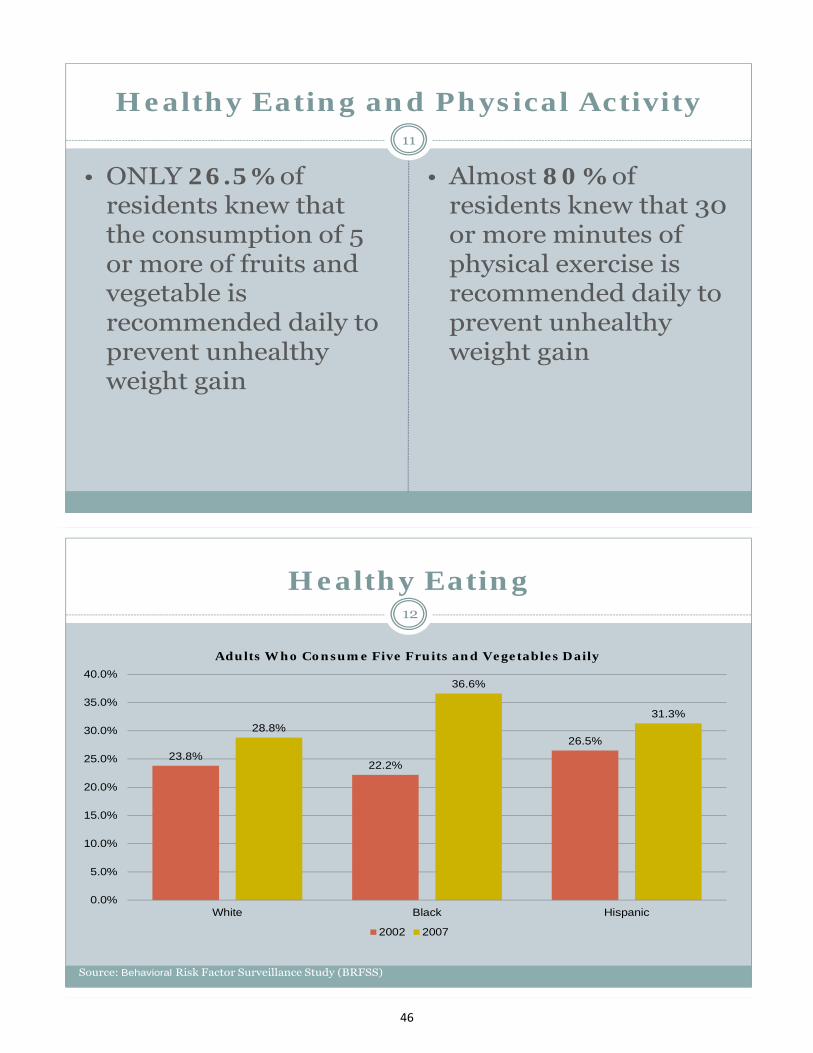
Where Healthcare is Accessed?
5.80%
5.30%
8.40%
73.40%
2.70%
1.90%
2.60%
0.00% 10.00% 20.00% 30.00% 40.00% 50.00% 60.00% 70.00% 80.00%
A Hospital-Based Clinic
A Clinic That is NOT Part of a Hospital
An Urgent Care/Walk-In Clinic
A Doctor's Office
A Hospital Emergency Room
Military or Other VA Healthcare
or Some Other Place
Particular place for health care or health advice
9
Education
Education Indicator Percent of Population
Less than 9th grade 4.4%
9th to 12th grade, no diploma 8.6%
High school graduate (includes equivalency)
27.0%
Some college, no degree 20.4%
Associate's degree 9.6%
Bachelor's degree 20.3%
Graduate or professional degree 9. 8%
Percent high school graduate or higher
87. 0%
Percent bachelor's degree or higher 30.1%
The 2010-2011 high school graduation rate for Orange County was 80.1%. This is up from 75.6% in 2007-08.
10
46
Healthy Eating and Physical Activity
• ONLY 26.5% of residents knew that the consumption of 5 or more of fruits and vegetable is recommended daily to prevent unhealthy weight gain
• Almost 80% of residents knew that 30 or more minutes of physical exercise is recommended daily to prevent unhealthy weight gain
11
Healthy Eating
23.8%22.2%
26.5%28.8%
36.6%
31.3%
0.0%
5.0%
10.0%
15.0%
20.0%
25.0%
30.0%
35.0%
40.0%
White Black Hispanic
Adults Who Consume Five Fruits and Vegetables Daily
2002 2007
Source: Behavioral Risk Factor Surveillance Study (BRFSS)
12
47
Physical Activity
19.5%
8.0%
24.5%
18.7%
5.2%
25.7%
0%
5%
10%
15%
20%
25%
30%
White Black Hispanic
Percentage of Adults Who Meet Moderate Physical Activity Recommendations
2002 2007
Source: Behavioral Risk Factor Surveillance Study (BRFSS)
13
Cigarette Smoking
23.0%
11.4%
22.2%
16.5%
7.5%
17.9%
14.6%
10.5%
13.8%
0%
5%
10%
15%
20%
25%
White Black Hispanic
Adults Who are Current Smokers
2002 2007 2010
Source: Behavioral Risk Factor Surveillance Study (BRFSS)
14
48
Alcohol Consumption
19.5%
8.0%
24.5%
18.7%
5.2%
25.7%
15.9%
9.0%
12.8%
0%
5%
10%
15%
20%
25%
30%
White Black Hispanic
Percentage of Adults Who Engage in Heavy or Binge Drinking
2002 2007 2010
Source: Behavioral Risk Factor Surveillance Study (BRFSS)
15
Diabetes
5.2% are not doing anything to control their condition
94.8% of residents diagnosed with diabetes are doing something to control their condition Taking medication Improving their diet Participating in
exercise
Help is needed to manage diabetes
23.4%
20.2%
18.1%
12.6%
7.6%
7.6%
6.6%
3.9%
0.0% 5.0% 10.0% 15.0% 20.0% 25.0%
Diet or Nutrition
Nothing
Medicine
Exercise
Diet, Nutrition, Exercise…
Personal Knowledge
Equipment
Support
16
49
High Blood Pressure and Cholesterol
• 84.5% of residents diagnosed with high blood pressure (HBP) are doing something to control their condition Taking medication Improving their diet Participating in exercise
• 15% of those diagnosed with HBP are not taking any action to control their condition
• 78.9% of residents diagnosed with high blood cholesterol are taking some measure to control their condition Taking medication Improving their diet Participating in exercise
• 21% of those diagnosed with high blood cholesterol are not taking any action to control their condition
17
Community Perceptions on Childhood Obesity
80.5%
82.1%
83.8%
67.5%
56.5%
0.0% 10.0% 20.0% 30.0% 40.0% 50.0% 60.0% 70.0% 80.0% 90.0%
Too much screen time
Too much junk food
Not enough exercise
Eating out of boredom
Lack of Self control
Factors that Contribute "A Lot" to Childhood Obesity
18
50
Community Assets
“Your most precious
possession is the people you have working
there, and what they carry
around in their heads, and their ability to work
together.”
Robert Reich
19
Healthcare Resources Primary Care Physicians
• 2 Hospital Systems -8 Hospitals including 2 children’s hospitals with a third hospital opening in 2012.
• 1 Academic Health Department -641 professionaland paraprofessional staff with 11 primary service centers
• 10 PCAN Medical Homes• 9 Shepherd’s Hope Health Centers• Pathways to Care• Corrections Health Services• Grace Medical Home• Center for Drug Free Living• Healthcare Center for the Homeless• Florida Hospital After-Hours Clinic• Orange County Medical Clinic• Special Care, Inc.• Healing the Children• Dental Care Access Foundation• Wraparound Orange- System of care for children’s
mental health services
• 4 Behavioral Health Hospitals
• Orange County105.4 per 100,000
• Florida109.7 per 100,000
• No. 1 Ranked State191.9 per 100,000
Healthcare Resources
The number of new physicians entering the field will be less than the number of retiring physicians.The aging baby-boomer demand will exceed the physician supply!
20
51
Information Technology
The UCF College of Medicine Regional Extension Center (REC) is assisting providers across Central Florida in theuse of electronic health records (EHR's)to improve patient care
Central Florida RHIO (Regional Health Information Exchange)
21
Lake Nona Medical City
UCF College of Medicine Health Sciences Campus
Sanford-Burnham Medical Research Institute
Nemours Pediatric Healthcare Campus
University of Florida Academic Research Center
Veterans Administration Medical Center
MD Anderson Orlando Cancer Research Institute
22
52
Biggest Businesses and Properties
Walt Disney
Universal
Marriott
Hilton
Progress Energy
Rosen Hotels
Sea World
Windham Resorts
Westgate Resorts
Lockheed Martin
Vistana
AT&T/BellSouth
MSR Grande Lakes Resort
FDG Maitland/SouthPark
Bluegreen Vacations Liberty Property
Bright House Networks
Florida Mall Associates
HIW-KC Orlando LLC
Island One Inc.
Embarq
Darden Corporation.
Grand Cypress Resort
Wal-Mart/Sam’s Club
23
Orange County Public Schools
198 Schools
124 Elementary Schools
39 Middle Schools
19 High Schools
21 Charter Schools
School Grades*
55.2% received “A”
23% received “B”
18.4% received “C”
2.9% received “D”
0.6% received “F
*Does not include charter schools
24
53
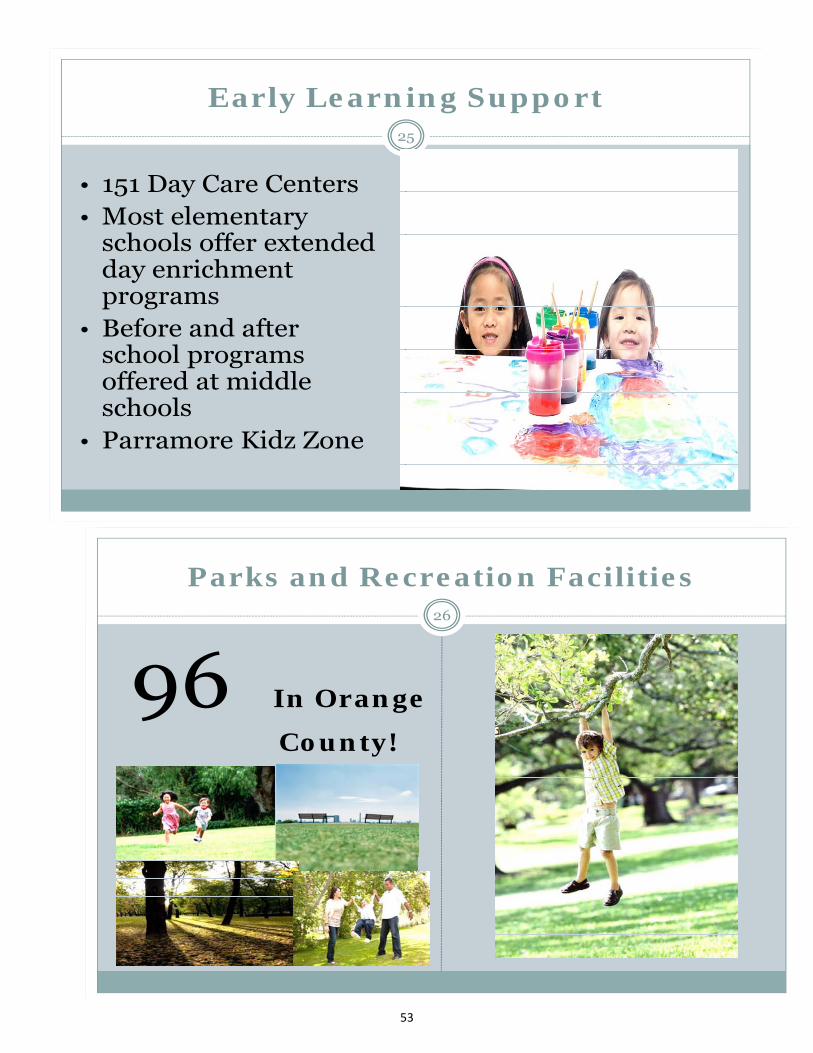
Early Learning Support
• 151 Day Care Centers• Most elementary
schools offer extended day enrichment programs
• Before and after school programs offered at middle schools
• Parramore Kidz Zone
25
Parks and Recreation Facilities
96 In Orange
County!
26
54
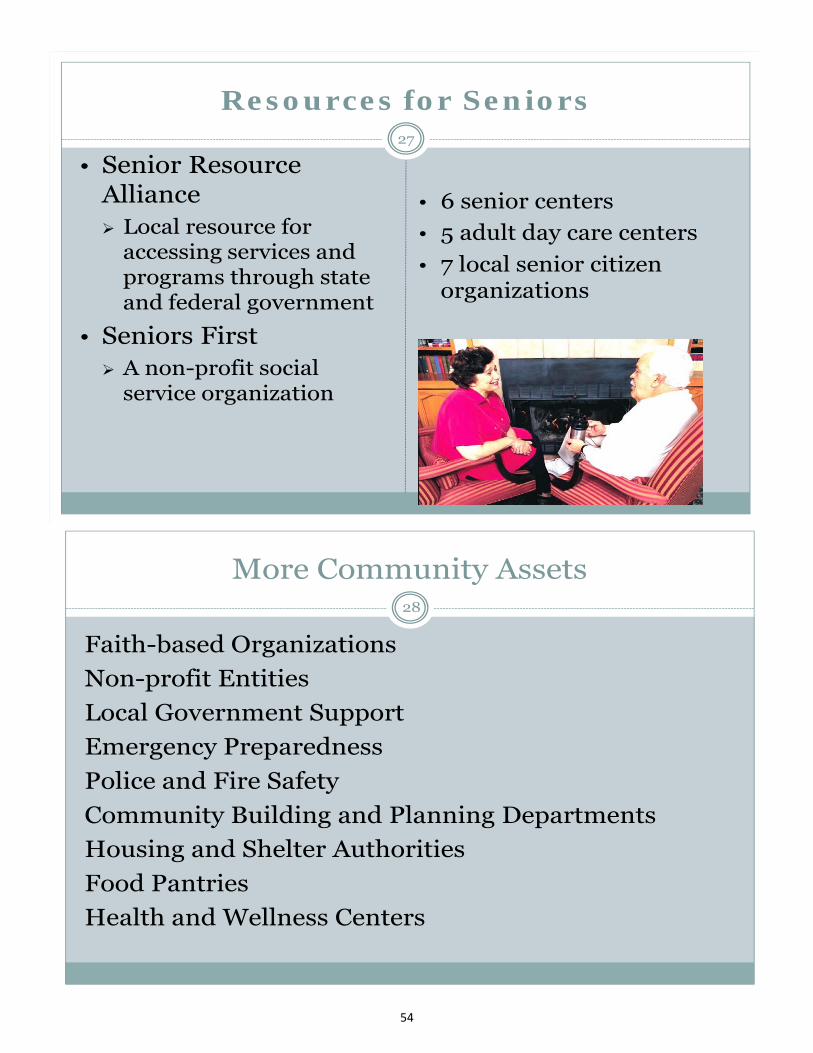
More Community Assets
Faith-based Organizations
Non-profit Entities
Local Government Support
Emergency Preparedness
Police and Fire Safety
Community Building and Planning Departments
Housing and Shelter Authorities
Food Pantries
Health and Wellness Centers
28
Resources for Seniors
• Senior Resource Alliance Local resource for
accessing services and programs through state and federal government
• Seniors First A non-profit social
service organization
• 6 senior centers
• 5 adult day care centers
• 7 local senior citizen organizations
27
55
What really
matters is what you do
with what you
have.”
-Shirley Lord, writer
29
2012 Overarching Community Themes
Maximize resources
Information Technology will play greater role
Focus on awareness and prevention
Plan for the Affordable Care Act
30
56
APPENDIX B
LOCAL PUBLIC HEALTH ASSESSMENT
57
58
59
60
61
62
63
64
65
66
67
68
69
70
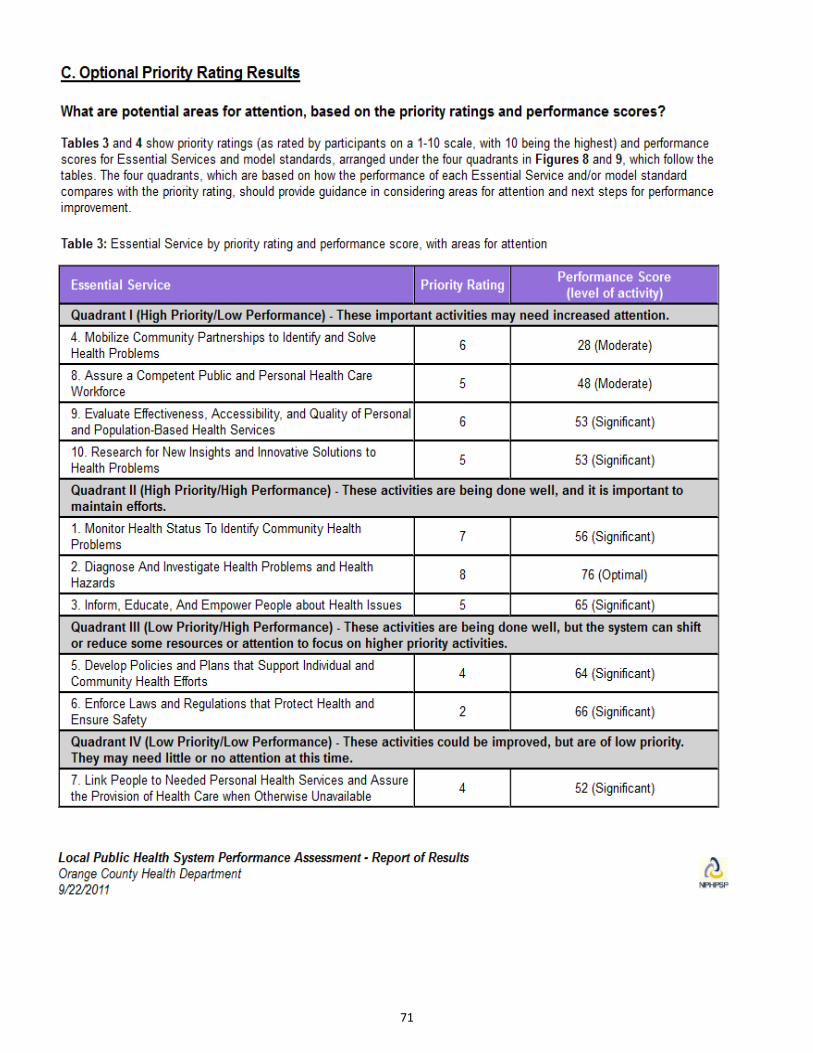
71
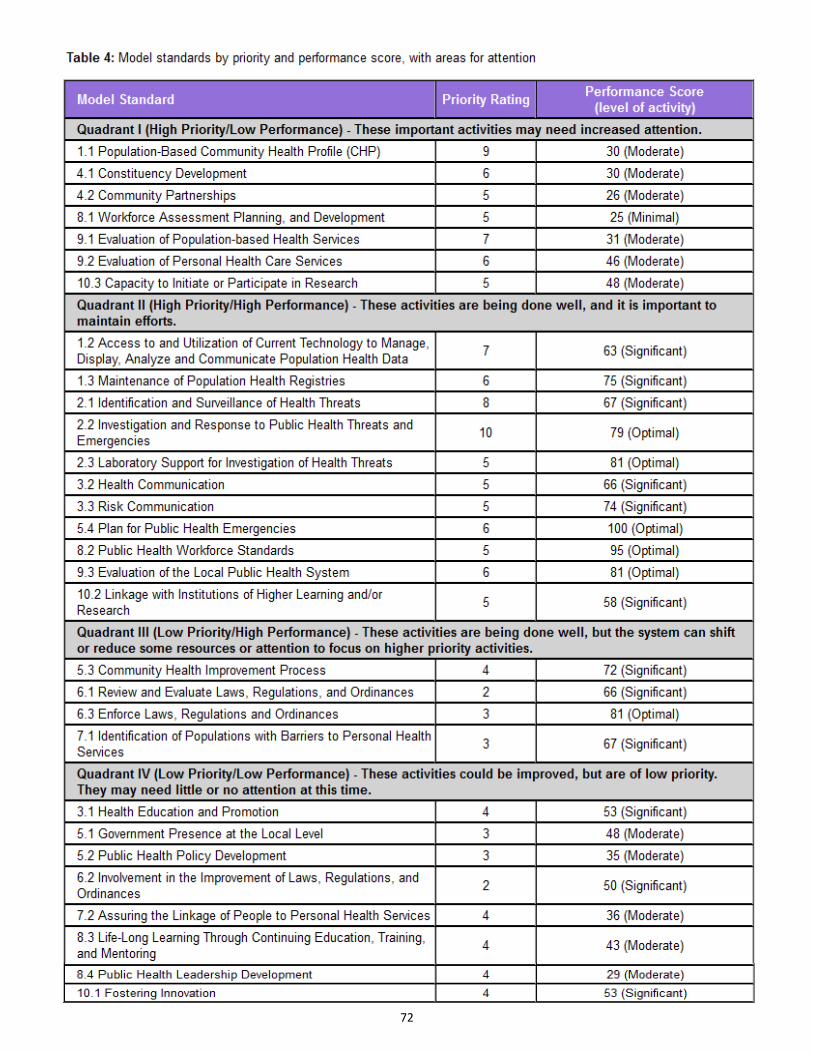
72
73
74
75
76
77
78
79
80
APPENDIX C
COMMUNITY HEALTH STATUS
81
SUMMARY
The Community Health Assessment for MAPP is sponsored by OCHD to provide a complete view of Orange County in regards to demographics, health status, environment, behaviors, and healthcare related accessibility.
Demographics
According to Florida CHARTS, the population in Orange County decreased by 79 residents in 2008‐2009 and decreased again in 2009‐2010 by 2,643 residents. The population has been increasing by smaller amounts yearly until 2008.
The Hispanic population in Orange County was the only race/ ethnicity to steadily increase in the past five years. The White popu‐lation is on a slow, but steady decline, and the Black (and other) population has stayed pretty consistent.
The 35‐34 year old age range has continually been the largest age demographic in Orange County over the past five years with 16.1% of the population fall in that age range. The 35‐44 year old age range is slightly lower at 14.3% and the 55‐64 range follows closely behind that at 13.7%. Each age range under 24 years old and over 55 years old make up less than 10% of the population.
The birth rate for the White, Black, and Hispanic populations has continued to drop slightly in recent years. The Black population in Orange County continually produces the most (15.9), Hispanic population is second (14.9), and the White population follows more than two points behind (12.2).
Source: Florida Charts
Causes of Death
According to Healthy People 2020, measuring the causes of death is one component used to assess the multi‐dimensional concept of health‐related quality of life.
Orange County is slightly higher than the national target rate for cancer deaths and over 60 points higher than the national target rate for heart disease deaths. In all other causes of death, Orange County was at or below the national target rates (where infor‐mation was available). The state target for chronic lower respiratory disease is below (34.8) what Orange County has reported (42).
Cancer and heart disease are the top two leading causes of death in the White, Black, and Hispanic populations in Orange County. Heart disease ranks above cancer only in the Hispanic population. Stroke, Diabetes Mellitus, and unintentional injuries rank 3rd, 4th, and 5th for the Black and Hispanic populations in Orange County, while chronic lower respiratory disease, unintentional inju‐ries, and stroke are the next three (respectively) for the White population. Kidney disease, HIV/ AIDS, Alzheimer ’s disease, septi‐cemia, and pneumonia/ influenza vary in their rankings (from 6‐13) among all three races/ ethnic groups in Orange County.
The Influenza and pneumonia deaths for Orange County’s White and Black population have risen slightly in 2008‐10 after going down in 2007‐09. The Hispanic population saw a slight increase in 2007‐09, but data was not available for 2008‐10.
Source: Florida Charts
82
Health Status
The majority of the overall health status of Orange County is ranked good, very good, or excellent. Only 12.9% of the population is ranked fair or poor. The mental health status of Orange County is also ranked mostly good, very good, or excellent; with only 9.1% of the population ranked fair or poor.
Source: PRC Community Health Assessment, 2009
Immunization
In Orange County, 66.9% of the White population over the age of 65 received the flu shot in the past year, while only 42.2% of the Black population did (Hispanic data unavailable). Over a third of the White and Black populations over the age of 18 received the flu shot in the past year and 16.8% of the Hispanic population did.
Almost ¼ of the White and Black population of adults age 18 and older in Orange County received a pneumonia shot in the past year. 18.2% of the Hispanic population age 18 and over also received this shot. The White population age 65 and over in Orange County had 64.7% of that demographic received the pneumonia shot, while 58.7% of the Black population age 65 and over did (Hispanic data not available).
The percent of fully immunized children (two years of age) dropped in 2009, down to 66.3% from 75.7% in 2008; but then rose again to 76.1% in 2010. Immunization levels of children in kindergarten in Orange County have consistently been just over 93% from 2006‐10.
Source: Florida Charts
Sexually Transmitted Diseases
Sexually transmitted disease (STD) rates in Orange County have continually risen since 2006. Gonorrhea and Syphilis rates are consistently going down, but Chlamydia rates are still rising steadily.
The percent of cases of Chlamydia and Gonorrhea are significantly higher (52.4% and 66.3%) in the Black population in Orange County than any other race/ ethnicity.
Chlamydia cases are between 20‐25% of each the While and Hispanic population, while Gonorrhea cases are between 15‐18% of each of the other populations. The majority of Syphilis cases in Orange County are encountered by the White population (49.4%), followed by the Black population (33.0%), and then the Hispanic population (17.2%).
Males contribute to just over ¼ of the Chlamydia cases in Orange County, while Gonorrhea cases are almost equally split between sexes. Syphilis cases in Orange County are overwhelming male (93.5%).
Source: Florida Charts
83
HIV/ AIDS
Orange County had a significantly higher rate of HIV/ AIDS cases than its surrounding counties in 2009; and this number rose slightly in 2010. HIV/ AIDS cases in the Orlando PMA are mostly male (73%), but for the general population HIV/ AIDS cases are split almost equally between males and females.
Orange County has a higher HIV/ AIDS case prevalence in the Black population than any other race/ ethnicity. The Black popula‐tion in Orange County is also more than double the percentage of the general population HIV/ AIDS cases. The general White population for HIV/ AIDS cases is almost twice as high as the Orange County data shows; while the Hispanic population data is pretty consistent between Orange County and the general population.
PLWHA in Orange County seem to be located closer to the city of Orlando and become less prevalent as you move away from the city center in every direction.
The majority of pediatric HIV/ AIDS cases in Orlando EMA is overwhelming within the Black population (73%). The Hispanic popu‐lation contributes almost a ¼ of the pediatric HIV/ AIDS cases to Orlando EMA, while the White population is only 3% of the cases.
Both the number of TB cases and the disease rate are decreasing in Orange County. According to the CDC, tuberculosis is the lead‐ing cause of death for persons diagnosised with HIV
Source: Florida Department of Health, Bureau of HIV/AIDS, Florida CHARTS
Modifiable Risk Behaviors
According to Healthy People 2020, individual behavior also plays a role in health outcomes. Examples of individual determinants of health include: diet, physical activity, and alcohol, cigarette, and other drug use.
Cigarette smoking in Orange County has been on the decline for the White and Hispanic populations. Although the Black popula‐tion has a lower amount of adult smokers (10.5%) than the White or Hispanic populations, the data shows that the amount of smokers has increased since 2007.
The percentage of White population adults in Orange County that engage in heavy or binge drinking has been declining slightly since 2002. The Hispanic population of heavy or binge drinkers has dropped significantly since rising in 2007 (25.7%) to 12.8% in 2010. The percentage of adults in the Black population that engage in this type of behavior was higher (9%) than it had been in previous years, but it is still the lowest between these three races/ ethnicities.
Modifiable risk behaviors for middle school children in Orange County has dropped in all categories, except marijuana (which only saw a 0.1% increase), since 2008. High school students in Orange County have increased all of the modifiable risk behaviors since 2008, but they have stayed below the state target for high school students smoking (state target – 16%, Orange County – 11.2%).
Approximately ¼ of the Hispanic population in Orange County meets the moderate physical activity recommendations, showing a slight increase between 2002‐07. The Black population in Orange County has dropped from 8% to 5.2% of adults meeting this rec‐ommendation, while the White population has shown just under a 1% drop (19.5% or 18.7%) from 2002‐07.
84
Adults who consume five fruits and vegetables a day is increasing in Orange County among the White, Black, and Hispanic popula‐tions. The Black population has the most people who follow this recommendation (36.6%), followed by the Hispanic population (31.3%), and then the White population (28.8%).
The percentage of the White adult population in Orange County that is overweight has been increasing slowly since 2002 (from 31% to 37.9%). The Black adult population has seen a slight increase in 2010, since a large jump between 2002‐07. Although the Hispanic adult population made a large jump up from 2002‐07, it has seen a decrease in 2010 (37.3%). Obesity among the White and Hispanic adult populations in Orange County is consistently rising, while the Black population had declined in obesity from 2002‐07, but is now rising again. The Black adult population in Orange County has the highest percentage (40.1%) of obese adults among these races/ ethnicities. Obesity among middle and high school age children has gone down slightly, but asthma and insuf‐ficient physical activity are both rising.
Health Screening trends for Adults in Orange County have gone down for Mammography and Pap Tests, but have gone up for Prostate‐Specific Antigen Tests and Colonoscopy. Blood Stool Testing trends are generally the same since 2007 after taking a 10% decrease from 2002.
The Black population in Orange County has consistently had the highest percentage of adults diagnosed with hypertension. The White and Hispanic populations of adults in Orange County who have been diagnosed with hypertension have consistently risen.
This data states that over 34% of the white population and almost 25% of the Hispanic population has been diagnosed.
Almost 40% of the White and Black adult populations in Orange County have been diagnosed with high blood cholesterol. Both of these populations show an increase from recent years; with the Black population having a significant jump (19.4% to 38.6%) since 2007. The adult Hispanic population has seen a slight drop in high blood cholesterol diagnosis in 2010 after an 8% increase in 2007.
Sources: BRFSS, Florida CHARTS, 2009 PRC Child and Adolescent Health Survey.
Maternal and Child Health
Healthy People 2020 states, “Improving the well‐being of mothers, infants, and children is an important public health goal for the United States. Their well‐being determines the health of the next generation and can help predict future public health challenges for families, communities, and the health care system. Pregnancy can provide an opportunity to identify existing health risks in women and to prevent future health problems for women and their children.”
The Black population has the highest percentage of low birth weight babies in Orange County; holding steady around 14% since 2008. Consistently since 2008, the White and Hispanic populations in Orange County have between 6.5‐8% of low birth weight babies.
Infant mortality rates in Orange County are up for the Black, White, and Hispanic populations since 2009. The Black population continues to have the highest rate at 13.8 per 1,000 live births, followed by the Hispanic population at 7 per 1,000 live births, and then the White population at 5.1 per 1,000 live births. Neonatal mortality rates are also up in Orange County since 2009 for all three demographics. The Black population is again the highest, followed by the Hispanic, and then the White population.
The percentage of births to mothers with 1st trimester prenatal care is over 75% for the Black, White, and Hispanic populations. The White population currently is the highest at 86.7%, followed by the Hispanic population at 83.4%.
85
The teen birth rate in Orange County is steadily declining in all demographics. The White population has the least amount of teen births (24.4/ 1,000 live births), followed by the Hispanic population (38/ 1,000 live births), and then the Black population (50.7/ 1,000 live births). Each of these rates is down at least five births from 2009.
The percentage of births to unwed mothers in Orange County is down slightly since 2009. The White population is the lowest at just under 40%, the Hispanic population is at 52.4%, and the Black population is the highest at 68.1%.
The percentage of mothers who initiated breastfeeding in Orange County is on the rise. Since 2006, it has gone up 3% (82% to 85%).
Source: Florida CHARTS
Social Determinants of Health
Healthy People 2020 states “Our health is also determined in part by access to social and economic opportunities. The conditions in which we live explain in part why some Americans are healthier than others and why Americans more generally are not as healthy as they could be.”
Two violent crimes in Orange County are on a steady decline: aggravated assault and robbery, but domestic violence is making a small upward climb. Both violent crimes of rape and murder are on a consistent decline in Orange County since 2006.
The rate of children ages 5‐11 in Orange County who are experiencing child abuse is going up slightly (12/ 1,000 population) after a decline in 2007 (9.3/ 1,000 population).
The percentage of people in Orange County whose income level in the past year is below the poverty level is consistently rising since 2005. Currently, 13.2% of the population of Orange County is earning income below the poverty level. Civilian labor force in Orange County is also increasing. The most recent data shows that 8.8% of the population in Orange County is unemployed. The trends for income show that both the median household income and per capita income have gone down slightly since 2008, but the latest data shows that they are back to numbers similar to 2005.
Over 92% of Orange County has street lights and over 87% have sidewalks. Heavy traffic only accounts for 27% of the built envi‐ronment, while over 46% of the area has walking, biking, or jogging trails.
Almost half (48.7%) of Orange County feels “quite safe” in their neighborhood environment, while over 7% say they are “not safe at all.” A “slightly safe” neighborhood accounts for over 25% of residents and 18.5% say the feel “extremely safe.”
Orange County has a majority of its homeless population considered unsheltered (5,724 sheltered versus 2.609 unsheltered). 149 of the total homeless population in Orange County are unaccompanied youth, 650 are victims of domestic violence, 75 have HIV/ AIDS, and over 3,000 are chronic substance abusers. Veterans make up almost 1,300 of the homeless population and the severely mentally ill make up almost 2,400. 3,783 people in Orange County are considered chronically homeless.
86
The percentage of housing units in foreclosure are higher in Orange County when compared to the state and nation. Housing unit foreclosures decreased substantially from 2,517 in October 2011 to 1,387 in November. Foreclosures were on the rise again in December 2011.
Sources: Realty Trac, Florida CHARTS, 2009 PRC Community Health Survey, Orange County Government Five‐Year Strategic Plan 2010‐2015.
Health Care Access
Disparities in access to health services affect individuals and society. Barriers to accessing health services lead to: Unmet health needs, delays in receiving appropriate care, inability to get preventive services, and hospitalizations that could have been pre‐vented.
In Orange County, the percentage of adults with any type of health care insurance coverage went up over 5% in 2010 since staying pretty consistently around 79% from 2002 on. Since 2002, Orange County has consistently had over 85% of the White adult popu‐lation with some type of health care insurance coverage. This number continues to rise. The Black adult population, over 80% in 2010 have health care insurance coverage, down from 2007, but still above the 70.5% in 2002. The Hispanic adult population in Orange County has experienced over 10% increase in 2010, after staying consistently at 56% since 2002.
The percentage of adults who have a personal doctor is on the rise for the Black, White, and Hispanic populations in Orange County. The percentage of White and Hispanic adults in Orange County who have had a medical check‐up in the past year is up slightly since last reported in 2007, while the Black population has declined almost 10%.
Over 77% of the civilian population in Orange County has health insurance coverage. 75.8% of the employed population ages 18‐64 and 39.2% of the unemployed are insured, while 71% of people who are not in the labor force are as well.
The median monthly Medicaid enrollment is up in 2010 over 2,300 per 100,000 population from 2009 reports. This number is a huge jump as compared to an increase of just under 400 between 2008 and 2009.
Dental visits for adults within the past year are down for the overall population in Orange County between 2002 and 2010; al‐though, the Black population has seen an increase of almost 10% of adults seeing a dentist within the last year. The percentage of all adults in Orange County who have had their teeth cleaned in the past year is also down between 2002 and 2010, but the Black population has seen an increase of teeth cleaning in the past year of 6.7%.
Dental health emergency room visits have stayed pretty consistent from 2008‐2010 at Arnold Palmer Hospital, Florida Hospital Apopka, Health Central, and Winter Park, while Dr. Phillips Hospital has seen a decrease in these visits. Florida Hospital East Or‐lando and Orlando Regional has seen a continuous increase in dental health emergency room visits.
In both 2008 and 2010, self‐pay was the most prominent funding of ER dental charges by payor, with an increase from 2008 to 2010. Medicaid as the payor also increased from 2008 to 2010, while commercial and all other payor options decreased. Self‐Pay dental visits by payor were also the most prominent with an increase between 2008‐2010. Medicaid payors visits also went up, while commercial and all other payors went down in this time period.
The number of ER visits for oral health has stayed pretty consistent within each age group from 2008 to 2010. 15‐19 years has the highest amount of visits, followed by 0‐4 years, then 5‐9 years, and lastly, 10‐14 years.

87
The health rankings for Orange County are all below the rankings for the state of Florida except in the determinants of early pre‐natal care and obesity (which is only by 0.6%). As for the Healthy People 2020 Target, Orange County is already below the target rates in binge drinking, obesity, and child immunization. Orange County is within ten points of reaching the 2020 target in the determinants of Cancer deaths, Cardiovascular deaths, infant mortality, diabetes diagnosis, early prenatal care, and smoking. Lack of health insurance in Orange County is at 15.6%, but the Healthy People 2020 Target is at 0%.
Sources: Florida CHARTS, BRFSS.
88
Demographics
Characteristics about a
population of people
2
SPONSORED BY
THE ORANGE COUNTY HEALTH DEPARTMENT
1
Community Health Assessment for
Mobilizing for Action Through Planning and Partnerships
(MAPP)
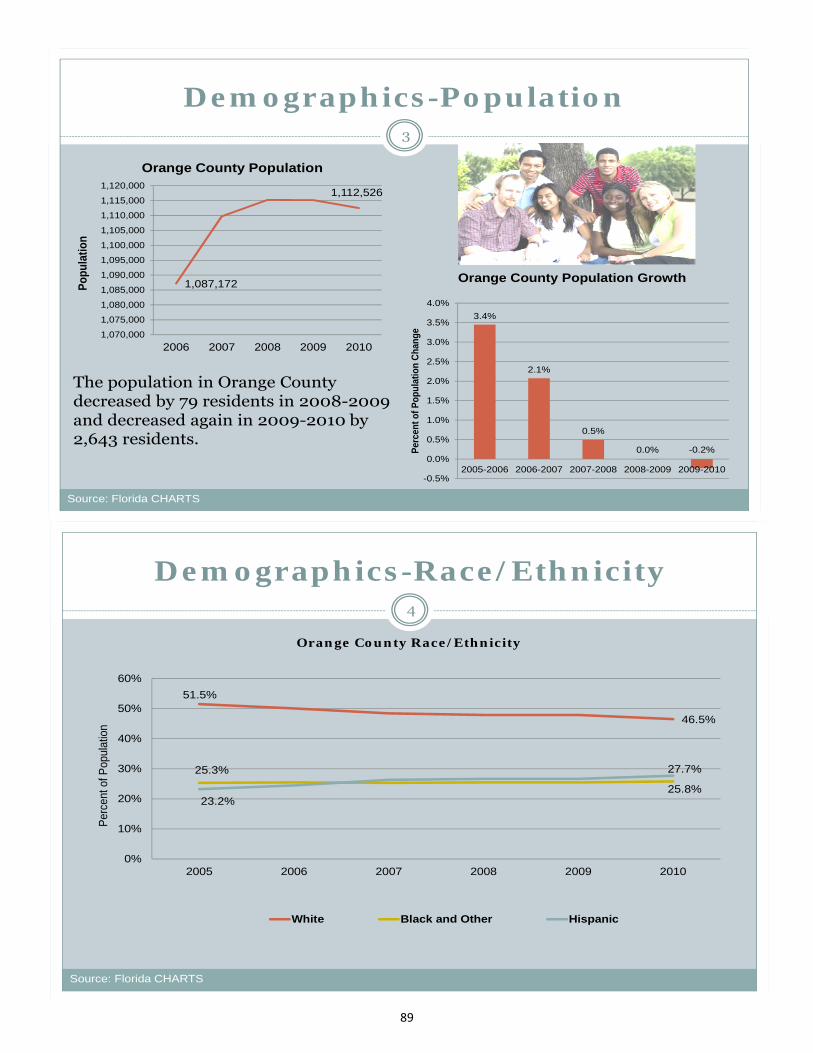
89
Demographics-Population
1,087,172
1,112,526
1,070,000
1,075,000
1,080,000
1,085,000
1,090,000
1,095,000
1,100,000
1,105,000
1,110,000
1,115,000
1,120,000
2006 2007 2008 2009 2010
Pop
ulat
ion
Orange County Population
3.4%
2.1%
0.5%
0.0% -0.2%
-0.5%
0.0%
0.5%
1.0%
1.5%
2.0%
2.5%
3.0%
3.5%
4.0%
2005-2006 2006-2007 2007-2008 2008-2009 2009-2010
Per
cent
of P
opul
atio
n C
hang
e
Orange County Population Growth
3
The population in Orange County decreased by 79 residents in 2008-2009 and decreased again in 2009-2010 by 2,643 residents.
Source: Florida CHARTS
Demographics-Race/Ethnicity
51.5%
46.5%
25.3%
25.8%23.2%
27.7%
0%
10%
20%
30%
40%
50%
60%
2005 2006 2007 2008 2009 2010
Per
cent
of P
opul
atio
n
Orange County Race/Ethnicity
White Black and Other Hispanic
4
Source: Florida CHARTS
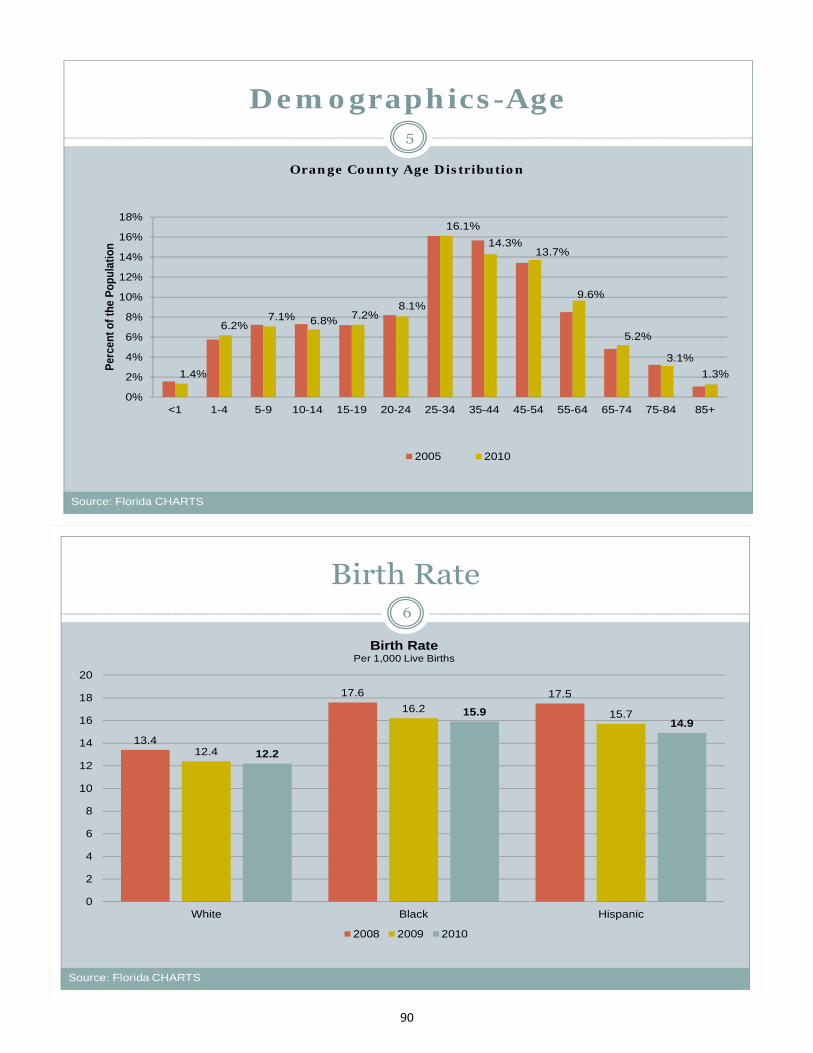
90
Demographics-Age
1.4%
6.2%7.1% 6.8% 7.2%
8.1%
16.1%
14.3%13.7%
9.6%
5.2%
3.1%
1.3%
0%
2%
4%
6%
8%
10%
12%
14%
16%
18%
<1 1-4 5-9 10-14 15-19 20-24 25-34 35-44 45-54 55-64 65-74 75-84 85+
Per
cent
of t
he P
opul
atio
n
Orange County Age Distribution
2005 2010
5
Source: Florida CHARTS
Birth Rate6
13.4
17.6 17.5
12.4
16.2 15.7
12.2
15.914.9
0
2
4
6
8
10
12
14
16
18
20
White Black Hispanic
Birth Rate Per 1,000 Live Births
2008 2009 2010
Source: Florida CHARTS
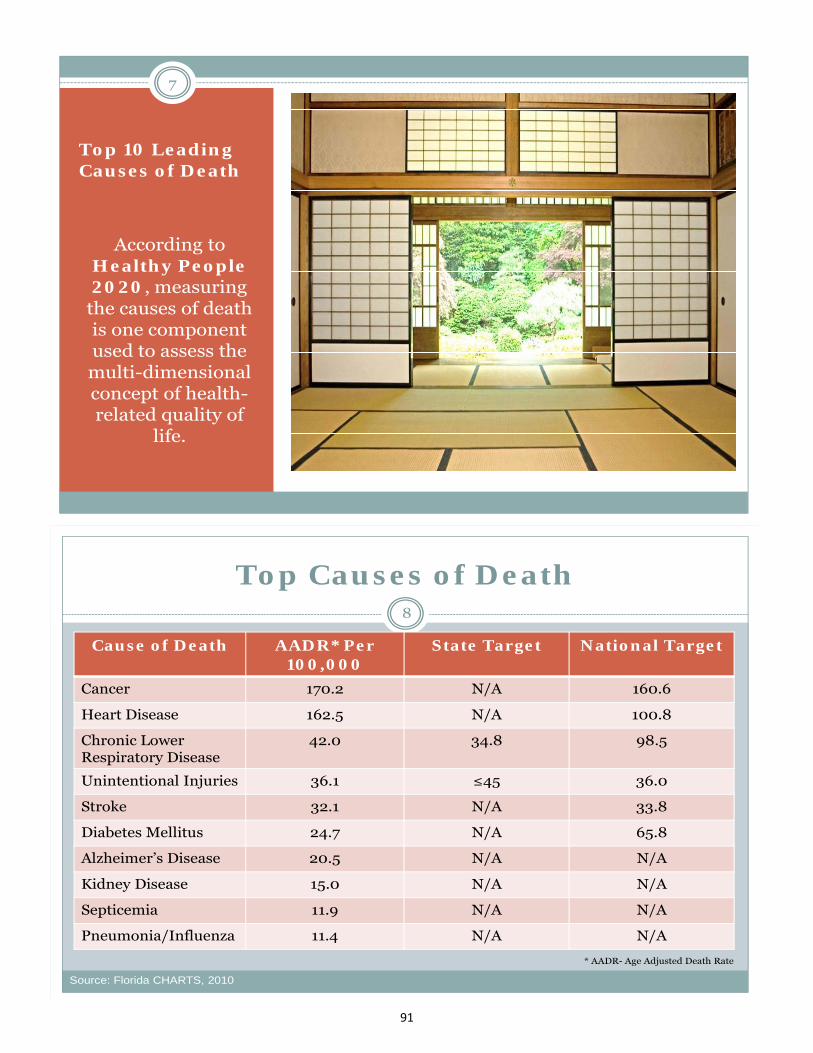
91
Top 10 Leading Causes of Death
According to Healthy People 2020, measuring
the causes of death is one component used to assess the multi-dimensional concept of health-related quality of
life.
7
Top Causes of Death8
* AADR- Age Adjusted Death Rate
Source: Florida CHARTS, 2010
Cause of Death AADR* Per 100,000
State Target National Target
Cancer 170.2 N/A 160.6
Heart Disease 162.5 N/A 100.8
Chronic Lower Respiratory Disease
42.0 34.8 98.5
Unintentional Injuries 36.1 ≤45 36.0
Stroke 32.1 N/A 33.8
Diabetes Mellitus 24.7 N/A 65.8
Alzheimer’s Disease 20.5 N/A N/A
Kidney Disease 15.0 N/A N/A
Septicemia 11.9 N/A N/A
Pneumonia/Influenza 11.4 N/A N/A
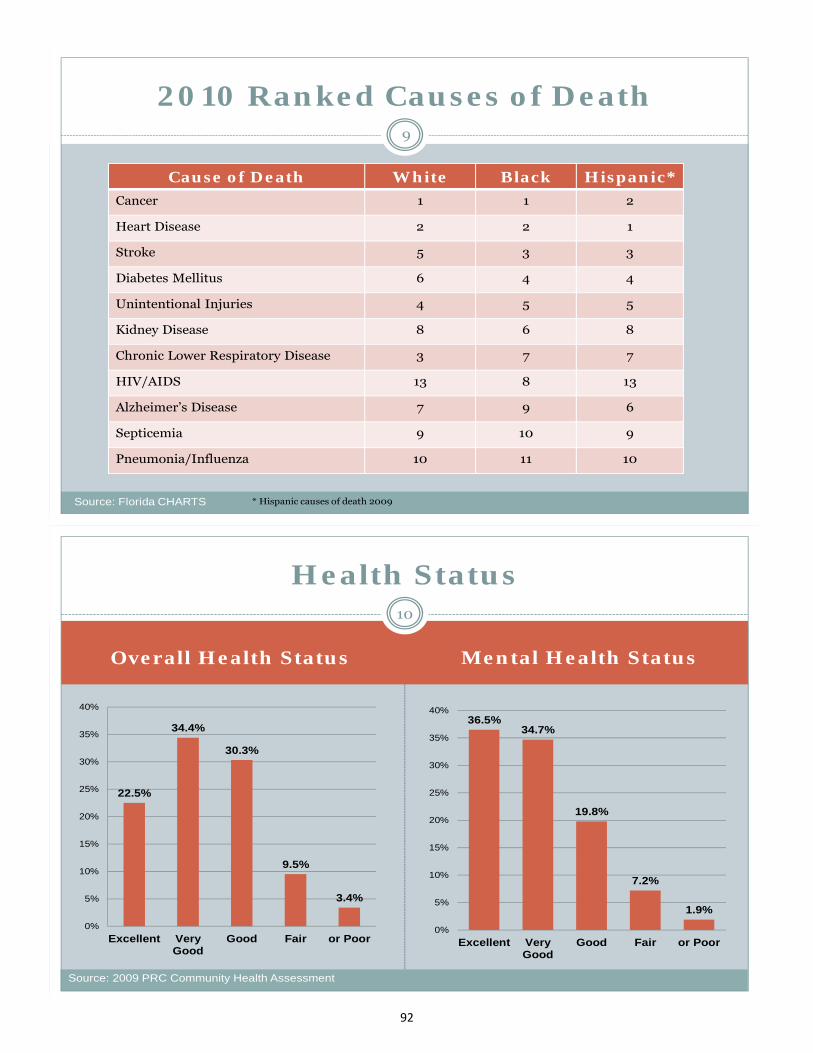
92
2010 Ranked Causes of Death
Cause of Death White Black Hispanic*Cancer 1 1 2
Heart Disease 2 2 1
Stroke 5 3 3
Diabetes Mellitus 6 4 4
Unintentional Injuries 4 5 5
Kidney Disease 8 6 8
Chronic Lower Respiratory Disease 3 7 7
HIV/AIDS 13 8 13
Alzheimer’s Disease 7 9 6
Septicemia 9 10 9
Pneumonia/Influenza 10 11 10
* Hispanic causes of death 2009
9
Source: Florida CHARTS
Overall Health Status Mental Health Status
Health Status
22.5%
34.4%
30.3%
9.5%
3.4%
0%
5%
10%
15%
20%
25%
30%
35%
40%
Excellent VeryGood
Good Fair or Poor
36.5%34.7%
19.8%
7.2%
1.9%
0%
5%
10%
15%
20%
25%
30%
35%
40%
Excellent VeryGood
Good Fair or Poor
10
Source: 2009 PRC Community Health Assessment
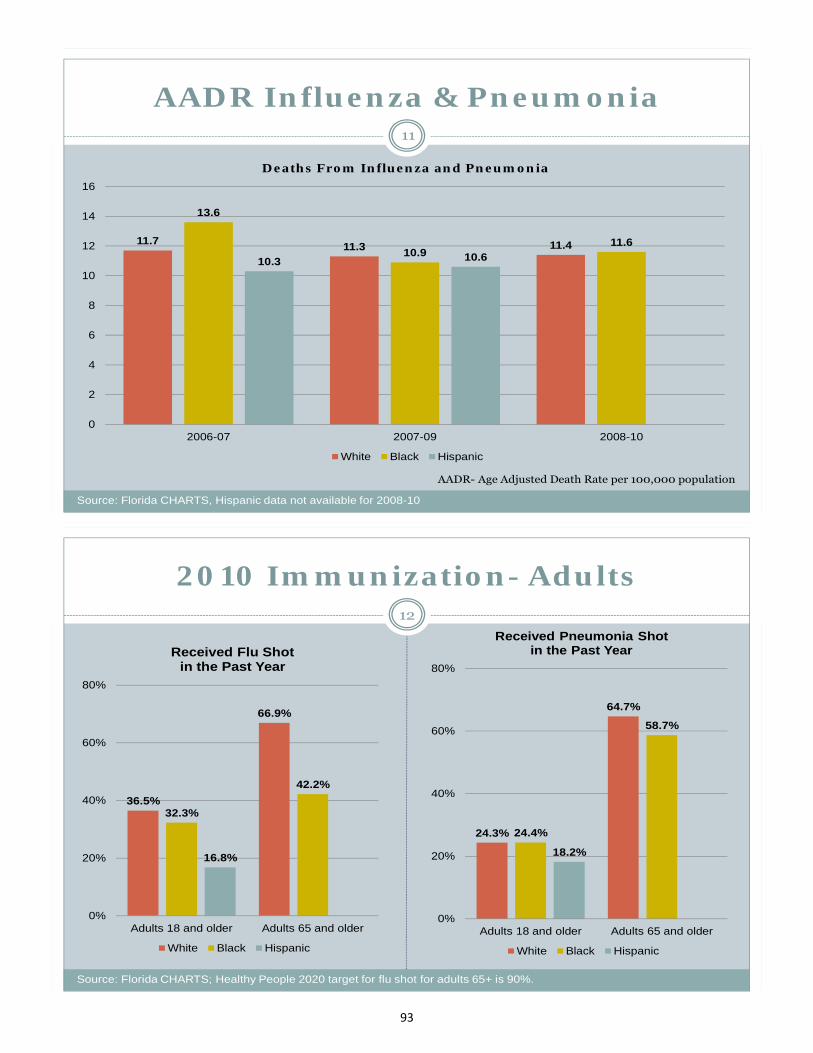
93
AADR Influenza & Pneumonia11
11.711.3 11.4
13.6
10.911.6
10.3 10.6
0
2
4
6
8
10
12
14
16
2006-07 2007-09 2008-10
Deaths From Influenza and Pneumonia
White Black Hispanic
AADR- Age Adjusted Death Rate per 100,000 population
Source: Florida CHARTS, Hispanic data not available for 2008-10
2010 Immunization- Adults12
36.5%
66.9%
32.3%
42.2%
16.8%
0%
20%
40%
60%
80%
Adults 18 and older Adults 65 and older
Received Flu Shot in the Past Year
White Black Hispanic
24.3%
64.7%
24.4%
58.7%
18.2%
0%
20%
40%
60%
80%
Adults 18 and older Adults 65 and older
Received Pneumonia Shot in the Past Year
White Black Hispanic
Source: Florida CHARTS; Healthy People 2020 target for flu shot for adults 65+ is 90%.
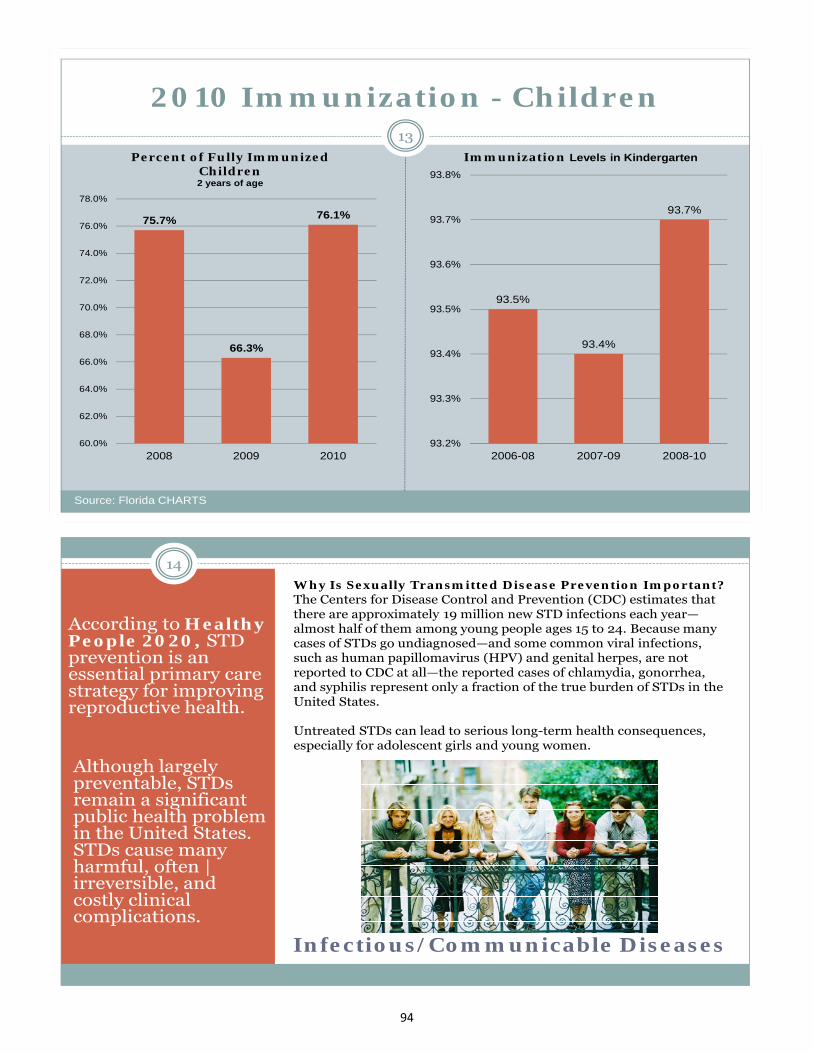
94
2010 Immunization - Children13
75.7%
66.3%
76.1%
60.0%
62.0%
64.0%
66.0%
68.0%
70.0%
72.0%
74.0%
76.0%
78.0%
2008 2009 2010
Percent of Fully Immunized Children 2 years of age
93.5%
93.4%
93.7%
93.2%
93.3%
93.4%
93.5%
93.6%
93.7%
93.8%
2006-08 2007-09 2008-10
Immunization Levels in Kindergarten
Source: Florida CHARTS
14
Infectious/Communicable Diseases
According to Healthy People 2020, STD prevention is an essential primary care strategy for improving reproductive health.
Although largelypreventable, STDs remain a significantpublic health problemin the United States.STDs cause many harmful, often |irreversible, and costly clinical complications.
Why Is Sexually Transmitted Disease Prevention Important?The Centers for Disease Control and Prevention (CDC) estimates that there are approximately 19 million new STD infections each year—almost half of them among young people ages 15 to 24. Because many cases of STDs go undiagnosed—and some common viral infections, such as human papillomavirus (HPV) and genital herpes, are not reported to CDC at all—the reported cases of chlamydia, gonorrhea, and syphilis represent only a fraction of the true burden of STDs in the United States.
Untreated STDs can lead to serious long-term health consequences, especially for adolescent girls and young women.
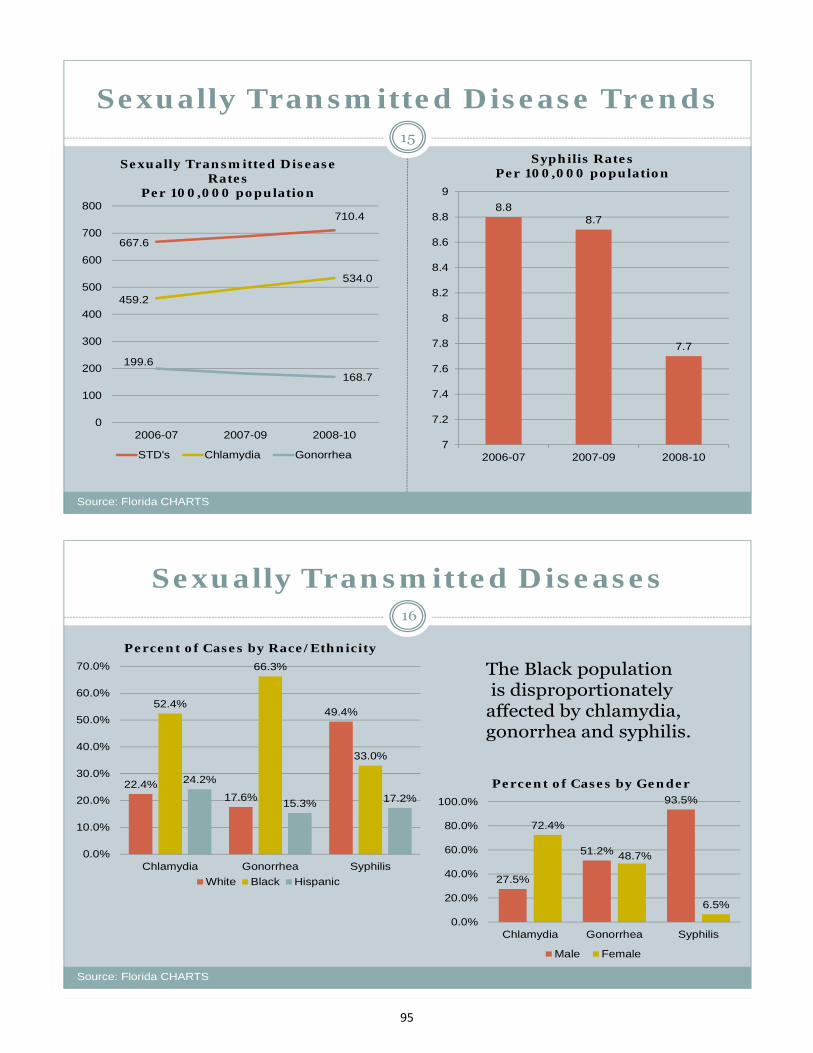
95
Sexually Transmitted Disease Trends15
667.6
710.4
459.2
534.0
199.6
168.7
0
100
200
300
400
500
600
700
800
2006-07 2007-09 2008-10
Sexually Transmitted Disease Rates
Per 100,000 population
STD's Chlamydia Gonorrhea
8.88.7
7.7
7
7.2
7.4
7.6
7.8
8
8.2
8.4
8.6
8.8
9
2006-07 2007-09 2008-10
Syphilis RatesPer 100,000 population
Source: Florida CHARTS
Sexually Transmitted Diseases16
The Black populationis disproportionately
affected by chlamydia, gonorrhea and syphilis.
22.4%17.6%
49.4%52.4%
66.3%
33.0%
24.2%
15.3% 17.2%
0.0%
10.0%
20.0%
30.0%
40.0%
50.0%
60.0%
70.0%
Chlamydia Gonorrhea Syphilis
Percent of Cases by Race/Ethnicity
White Black Hispanic 27.5%
51.2%
93.5%
72.4%
48.7%
6.5%
0.0%
20.0%
40.0%
60.0%
80.0%
100.0%
Chlamydia Gonorrhea Syphilis
Percent of Cases by Gender
Male Female
Source: Florida CHARTS
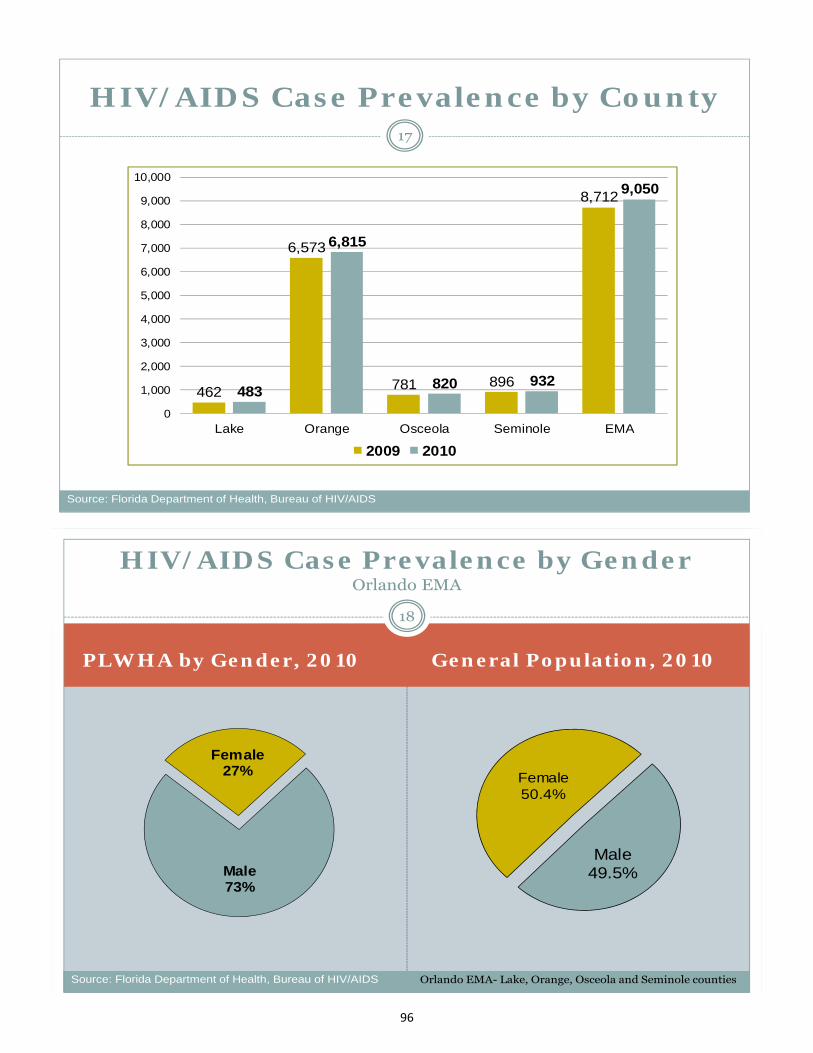
96
HIV/AIDS Case Prevalence by County17
462
6,573
781 896
8,712
483
6,815
820 932
9,050
0
1,000
2,000
3,000
4,000
5,000
6,000
7,000
8,000
9,000
10,000
Lake Orange Osceola Seminole EMA
2009 2010
Source: Florida Department of Health, Bureau of HIV/AIDS
PLWHA by Gender, 2010 General Population, 2010
18
HIV/AIDS Case Prevalence by GenderOrlando EMA
Male73%
Female27%
Male49.5%
Female50.4%
Orlando EMA- Lake, Orange, Osceola and Seminole countiesSource: Florida Department of Health, Bureau of HIV/AIDS
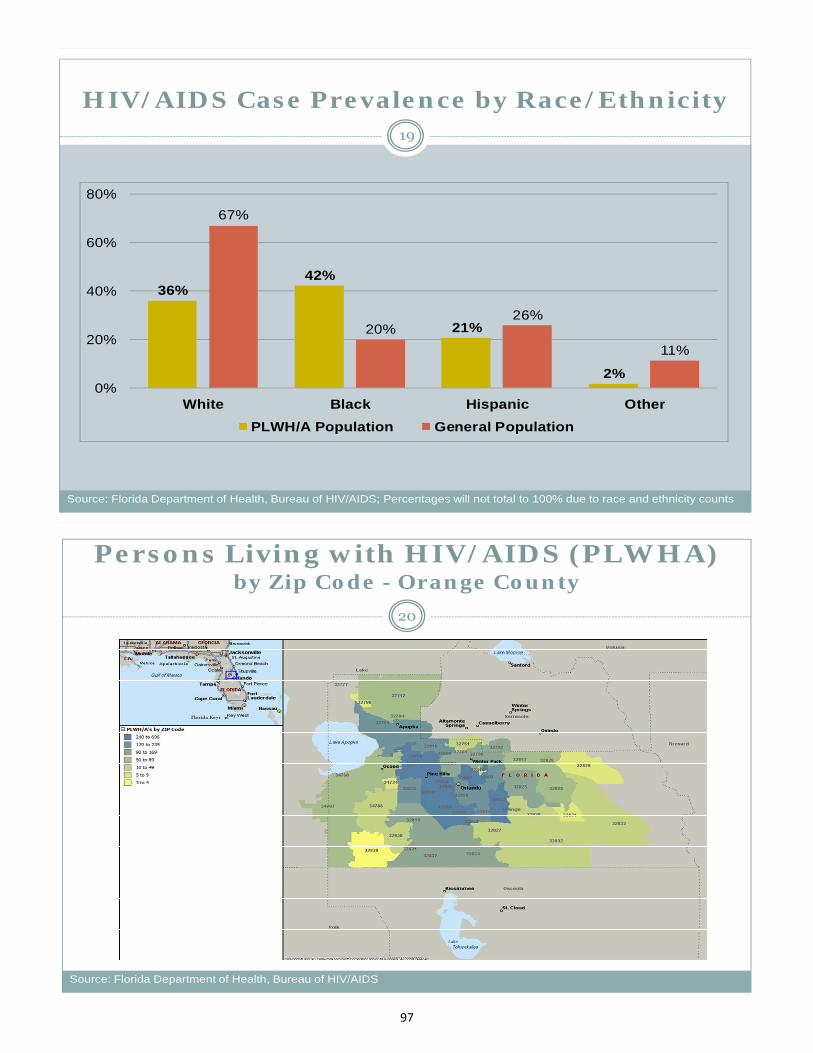
97
HIV/AIDS Case Prevalence by Race/Ethnicity19
36%42%
21%
2%
67%
20%26%
11%
0%
20%
40%
60%
80%
White Black Hispanic Other
PLWH/A Population General Population
Source: Florida Department of Health, Bureau of HIV/AIDS; Percentages will not total to 100% due to race and ethnicity counts
Persons Living with HIV/AIDS (PLWHA) by Zip Code - Orange County
20
Source: Florida Department of Health, Bureau of HIV/AIDS
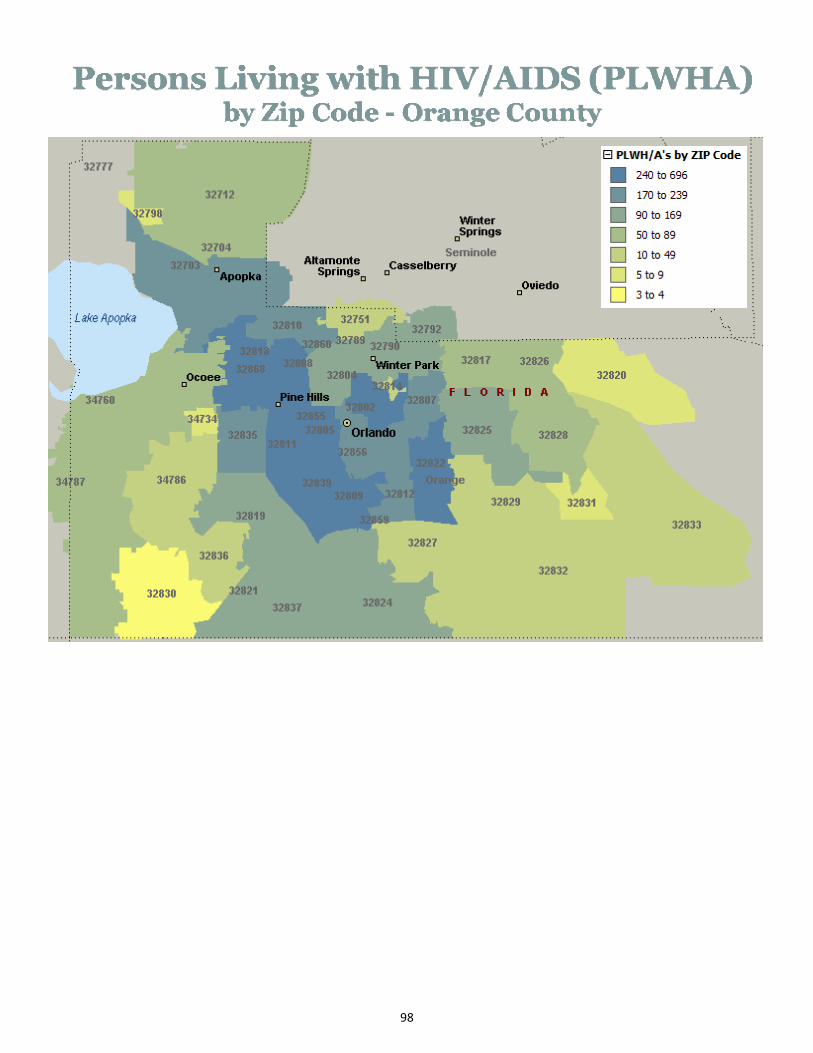
98
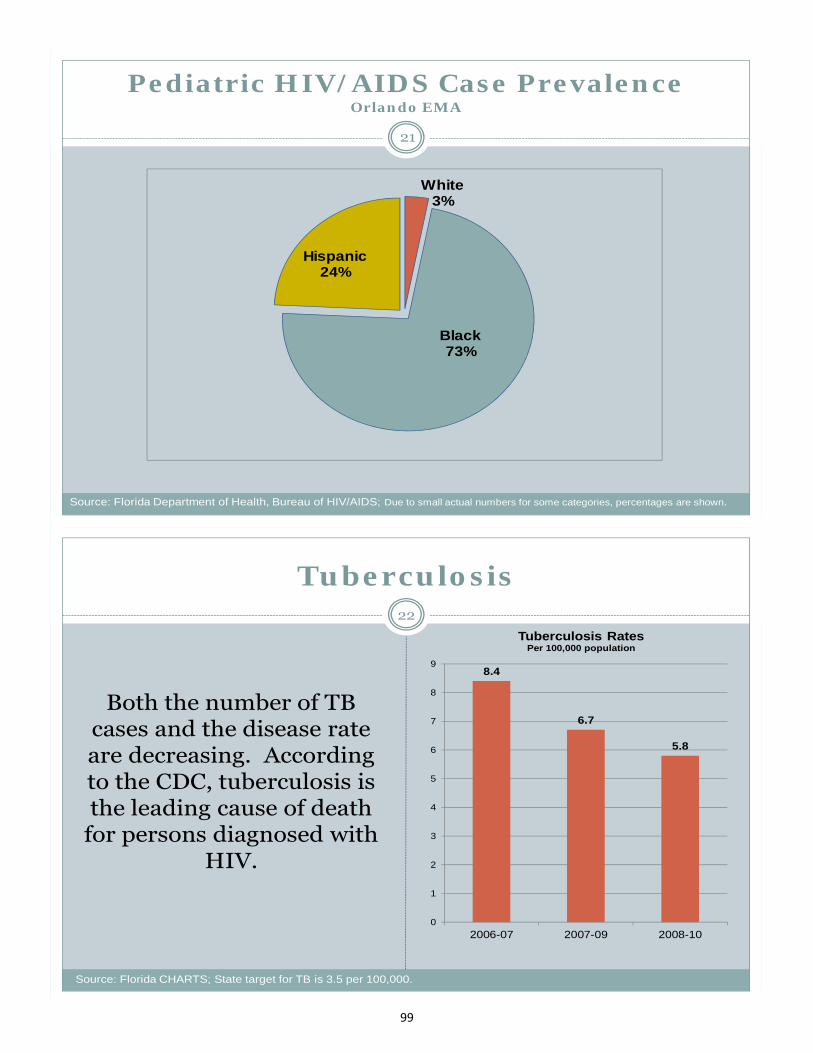
99
Pediatric HIV/AIDS Case PrevalenceOrlando EMA
21
White3%
Black73%
Hispanic24%
Source: Florida Department of Health, Bureau of HIV/AIDS; Due to small actual numbers for some categories, percentages are shown.
Tuberculosis22
Both the number of TB cases and the disease rate are decreasing. According to the CDC, tuberculosis is the leading cause of death
for persons diagnosed with HIV.
8.4
6.7
5.8
0
1
2
3
4
5
6
7
8
9
2006-07 2007-09 2008-10
Tuberculosis RatesPer 100,000 population
Source: Florida CHARTS; State target for TB is 3.5 per 100,000.
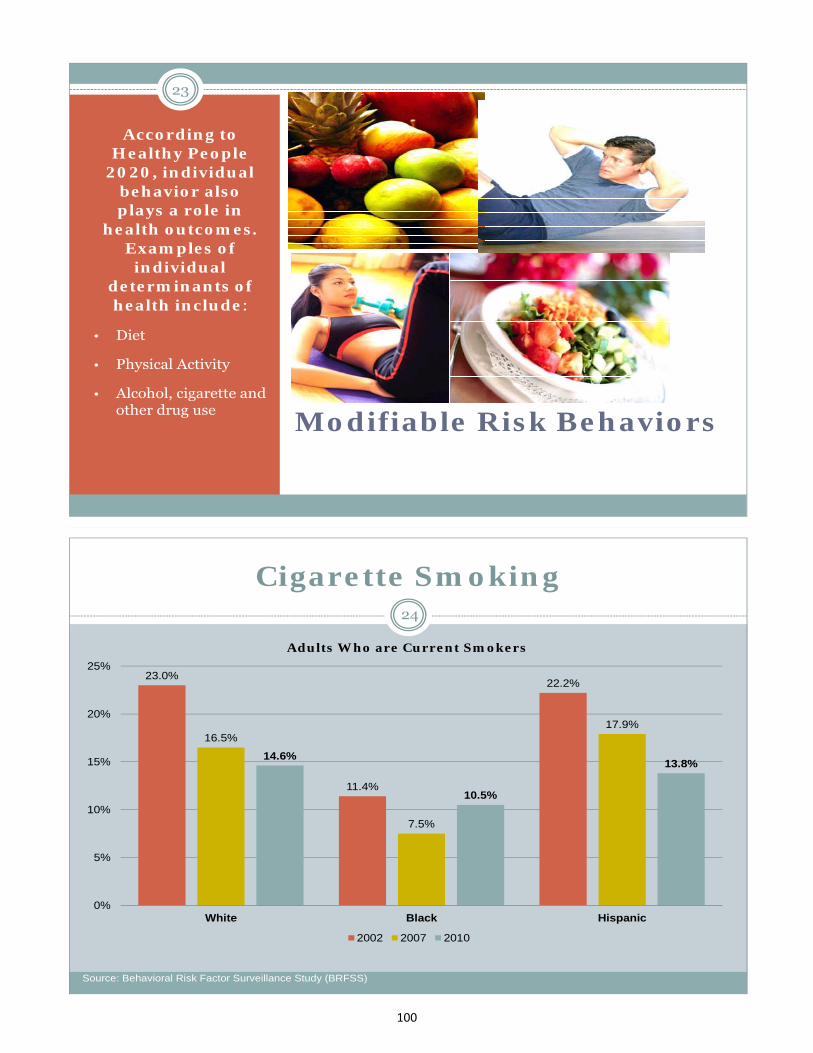
100
23
Modifiable Risk Behaviors
According to Healthy People
2020, individual behavior also plays a role in
health outcomes. Examples of
individual determinants of health include:
• Diet
• Physical Activity
• Alcohol, cigarette and other drug use
Cigarette Smoking24
23.0%
11.4%
22.2%
16.5%
7.5%
17.9%
14.6%
10.5%
13.8%
0%
5%
10%
15%
20%
25%
White Black Hispanic
Adults Who are Current Smokers
2002 2007 2010
Source: Behavioral Risk Factor Surveillance Study (BRFSS)
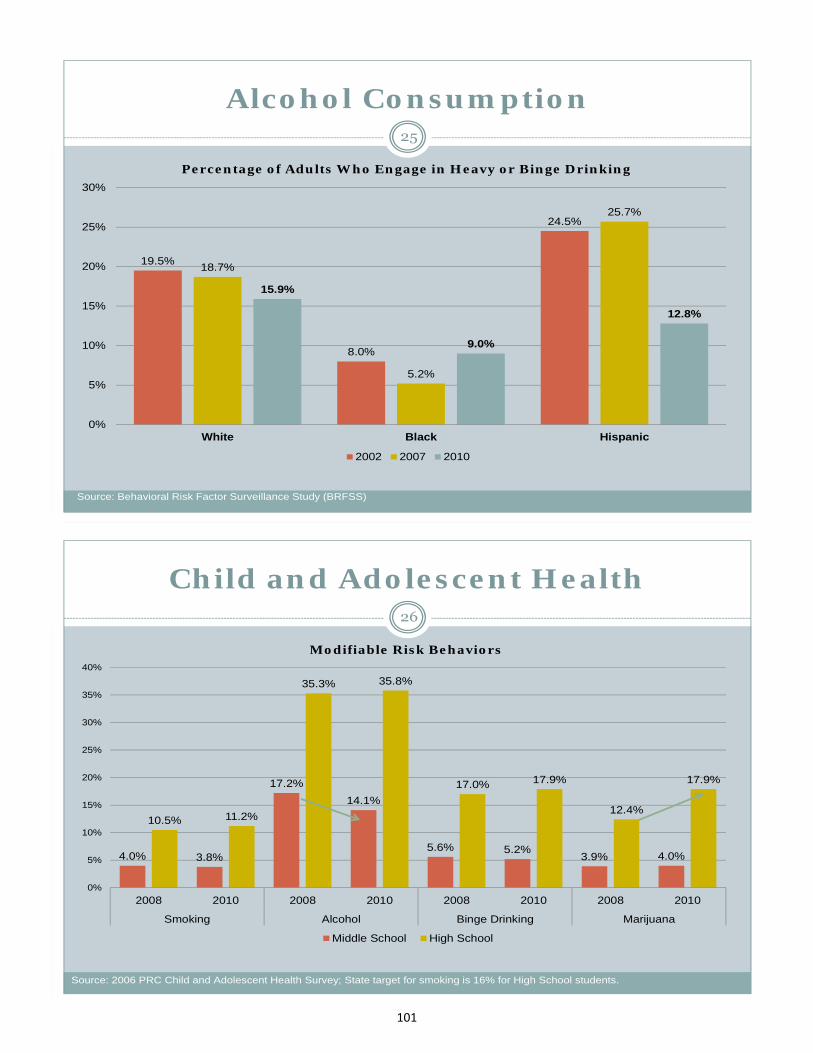
101
Alcohol Consumption25
19.5%
8.0%
24.5%
18.7%
5.2%
25.7%
15.9%
9.0%
12.8%
0%
5%
10%
15%
20%
25%
30%
White Black Hispanic
Percentage of Adults Who Engage in Heavy or Binge Drinking
2002 2007 2010
Source: Behavioral Risk Factor Surveillance Study (BRFSS)
Child and Adolescent Health26
4.0% 3.8%
17.2%
14.1%
5.6% 5.2%3.9% 4.0%
10.5% 11.2%
35.3% 35.8%
17.0% 17.9%
12.4%
17.9%
0%
5%
10%
15%
20%
25%
30%
35%
40%
2008 2010 2008 2010 2008 2010 2008 2010
Smoking Alcohol Binge Drinking Marijuana
Modifiable Risk Behaviors
Middle School High School
Source: 2006 PRC Child and Adolescent Health Survey; State target for smoking is 16% for High School students.
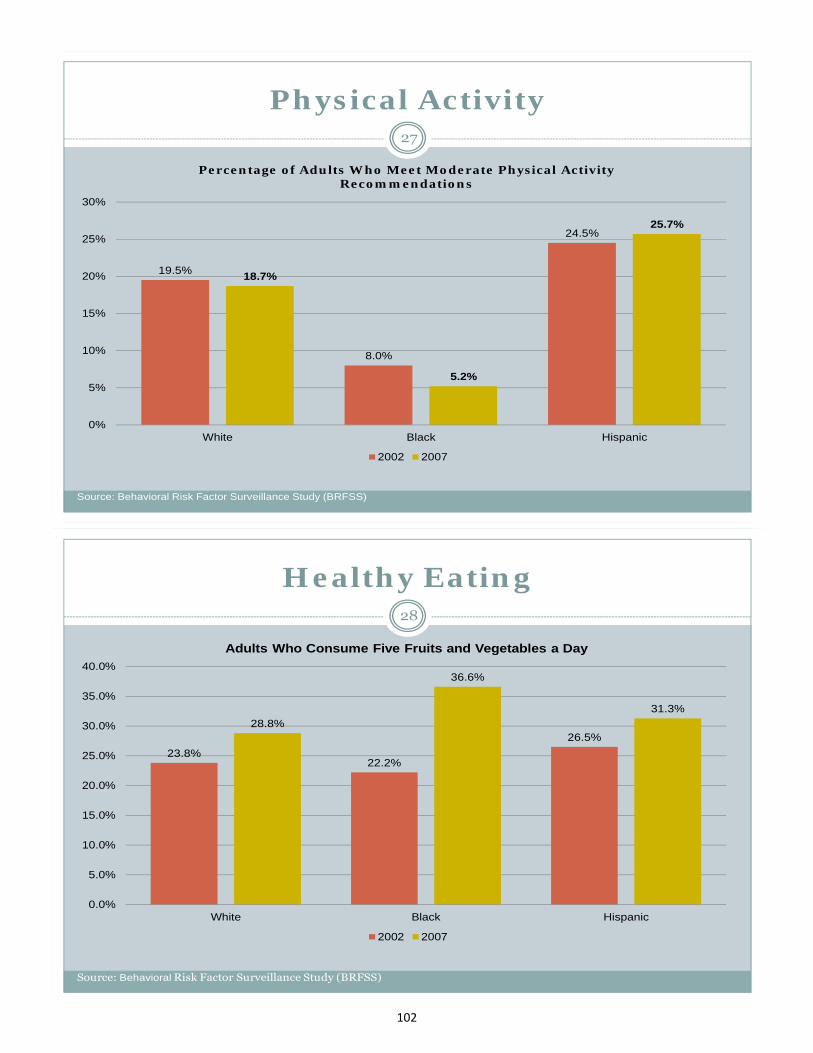
102
Physical Activity27
19.5%
8.0%
24.5%
18.7%
5.2%
25.7%
0%
5%
10%
15%
20%
25%
30%
White Black Hispanic
Percentage of Adults Who Meet Moderate Physical Activity Recommendations
2002 2007
Source: Behavioral Risk Factor Surveillance Study (BRFSS)
Healthy Eating28
Source: Behavioral Risk Factor Surveillance Study (BRFSS)
23.8%22.2%
26.5%28.8%
36.6%
31.3%
0.0%
5.0%
10.0%
15.0%
20.0%
25.0%
30.0%
35.0%
40.0%
White Black Hispanic
Adults Who Consume Five Fruits and Vegetables a Day
2002 2007
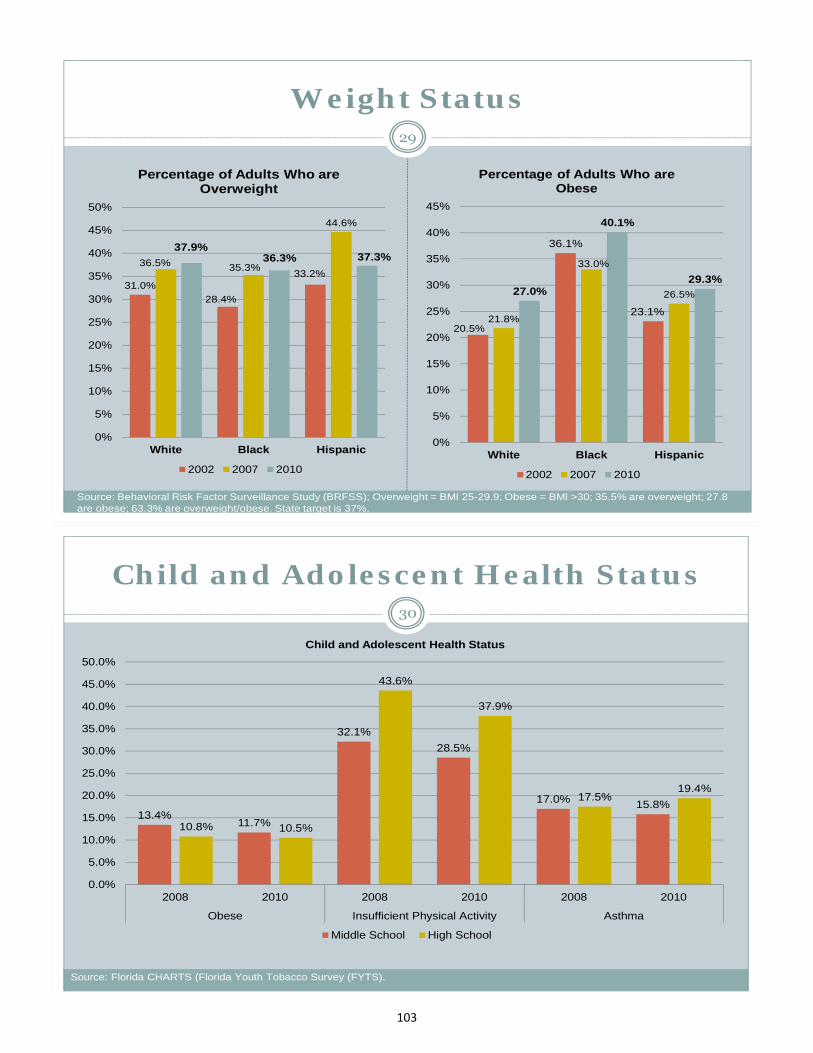
103
Weight Status29
20.5%
36.1%
23.1%21.8%
33.0%
26.5%27.0%
40.1%
29.3%
0%
5%
10%
15%
20%
25%
30%
35%
40%
45%
White Black Hispanic
Percentage of Adults Who are Obese
2002 2007 2010
31.0%
28.4%
33.2%36.5% 35.3%
44.6%
37.9%36.3% 37.3%
0%
5%
10%
15%
20%
25%
30%
35%
40%
45%
50%
White Black Hispanic
Percentage of Adults Who are Overweight
2002 2007 2010
Source: Behavioral Risk Factor Surveillance Study (BRFSS); Overweight = BMI 25-29.9; Obese = BMI >30; 35.5% are overweight; 27.8are obese; 63.3% are overweight/obese. State target is 37%.
Child and Adolescent Health Status30
13.4%11.7%
32.1%
28.5%
17.0% 15.8%
10.8% 10.5%
43.6%
37.9%
17.5%19.4%
0.0%
5.0%
10.0%
15.0%
20.0%
25.0%
30.0%
35.0%
40.0%
45.0%
50.0%
2008 2010 2008 2010 2008 2010
Obese Insufficient Physical Activity Asthma
Child and Adolescent Health Status
Middle School High School
Source: Florida CHARTS (Florida Youth Tobacco Survey (FYTS).
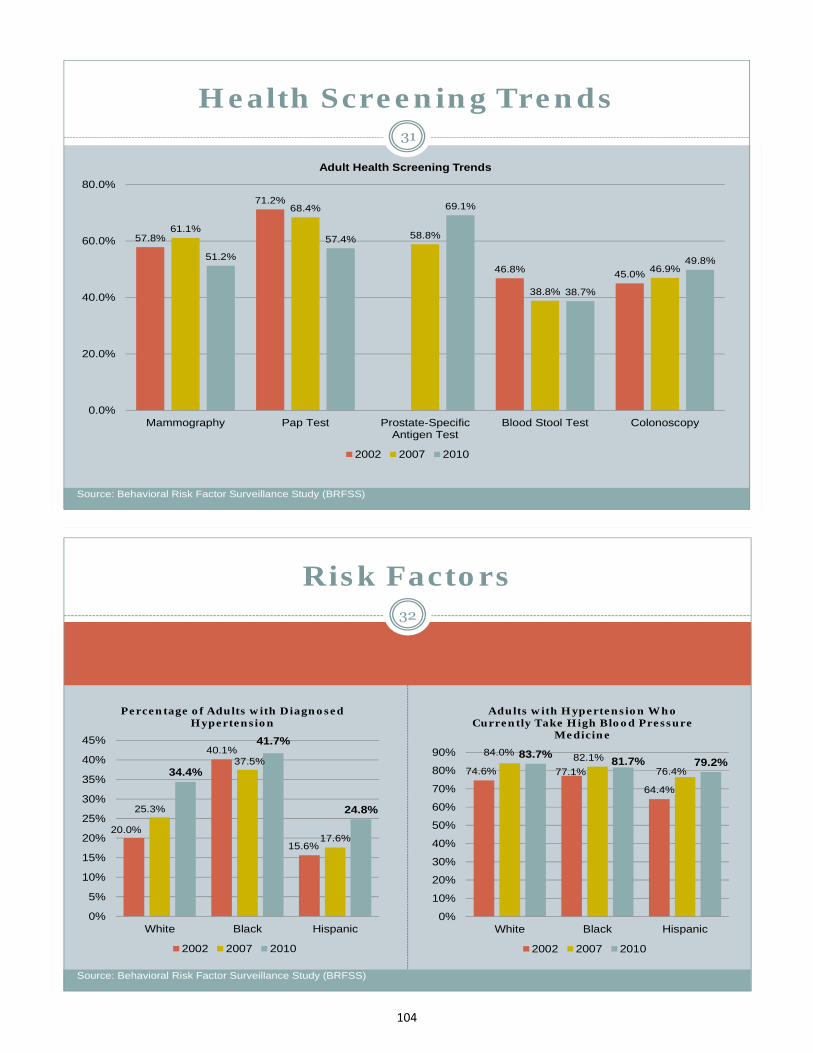
104
Health Screening Trends31
Source: Behavioral Risk Factor Surveillance Study (BRFSS)
57.8%
71.2%
46.8% 45.0%
61.1%
68.4%
58.8%
38.8%
46.9%51.2%
57.4%
69.1%
38.7%
49.8%
0.0%
20.0%
40.0%
60.0%
80.0%
Mammography Pap Test Prostate-SpecificAntigen Test
Blood Stool Test Colonoscopy
Adult Health Screening Trends
2002 2007 2010
32
Risk Factors
20.0%
40.1%
15.6%
25.3%
37.5%
17.6%
34.4%
41.7%
24.8%
0%
5%
10%
15%
20%
25%
30%
35%
40%
45%
White Black Hispanic
Percentage of Adults with Diagnosed Hypertension
2002 2007 2010
74.6% 77.1%
64.4%
84.0% 82.1%
76.4%
83.7%81.7% 79.2%
0%
10%
20%
30%
40%
50%
60%
70%
80%
90%
White Black Hispanic
Adults with Hypertension Who Currently Take High Blood Pressure
Medicine
2002 2007 2010
Source: Behavioral Risk Factor Surveillance Study (BRFSS)
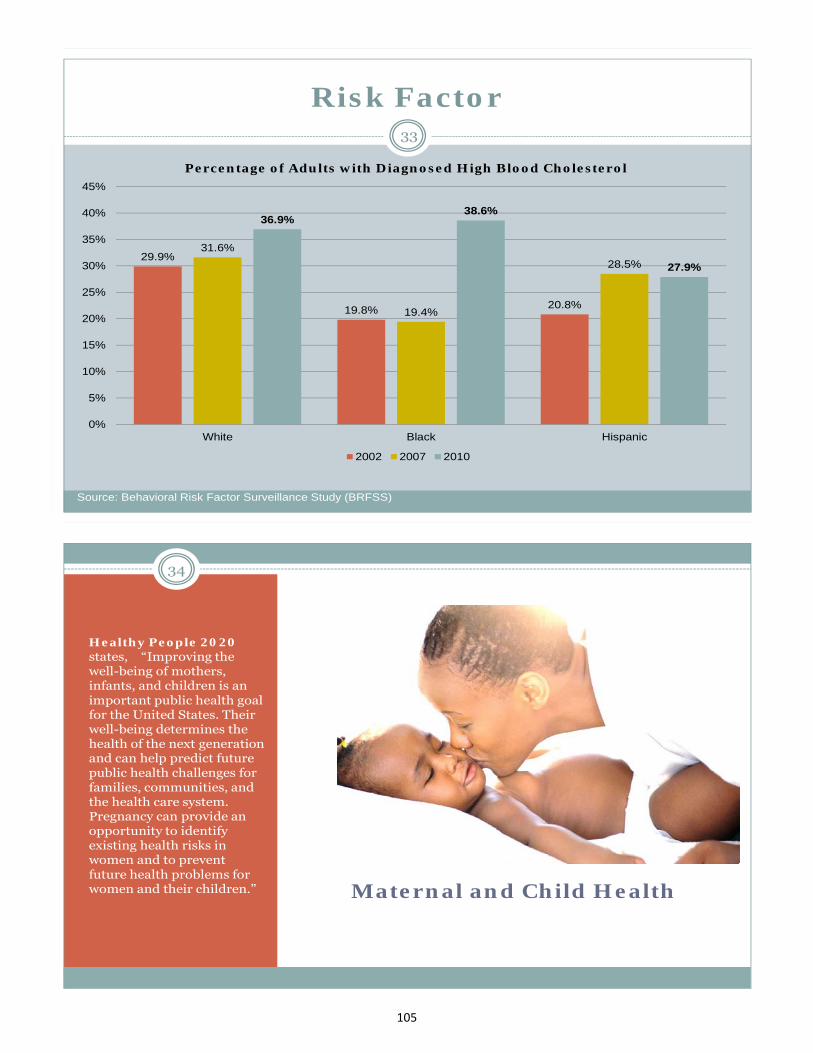
105
Risk Factor33
29.9%
19.8% 20.8%
31.6%
19.4%
28.5%
36.9%38.6%
27.9%
0%
5%
10%
15%
20%
25%
30%
35%
40%
45%
White Black Hispanic
Percentage of Adults with Diagnosed High Blood Cholesterol
2002 2007 2010
Source: Behavioral Risk Factor Surveillance Study (BRFSS)
34
Maternal and Child Health
Healthy People 2020 states, “Improving the well-being of mothers, infants, and children is an important public health goal for the United States. Their well-being determines the health of the next generation and can help predict future public health challenges for families, communities, and the health care system. Pregnancy can provide an opportunity to identify existing health risks in women and to prevent future health problems for women and their children.”
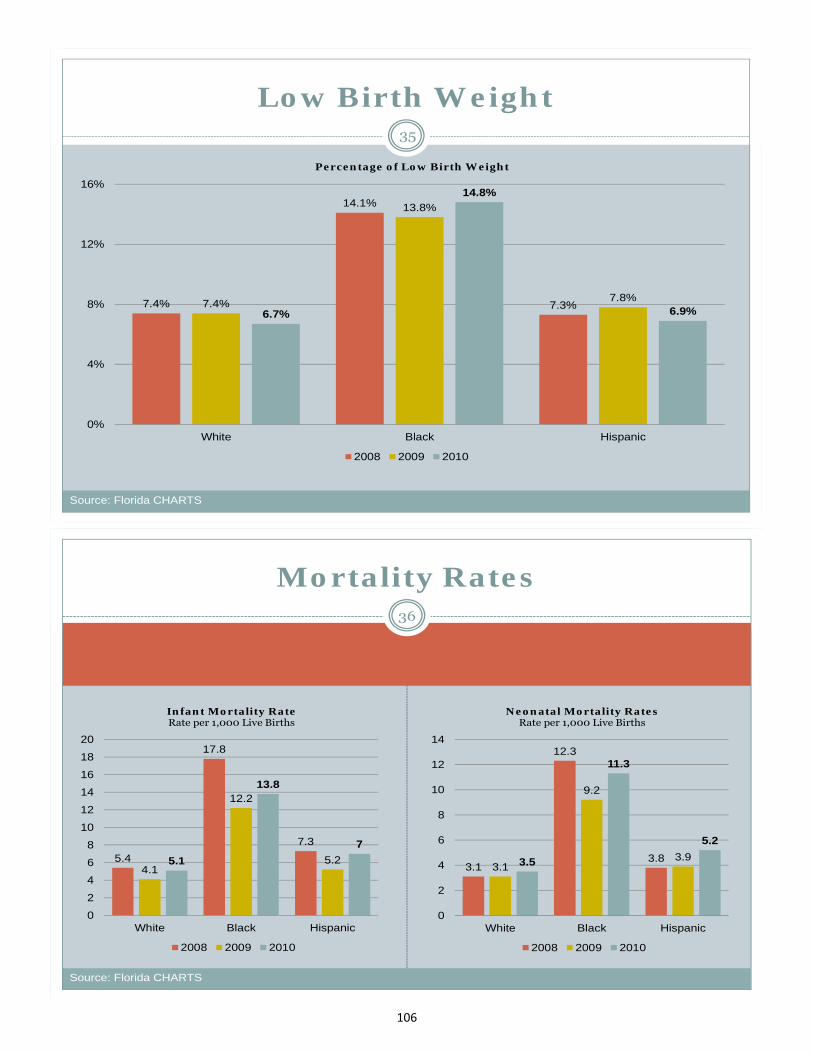
106
Low Birth Weight35
7.4%
14.1%
7.3%7.4%
13.8%
7.8%
6.7%
14.8%
6.9%
0%
4%
8%
12%
16%
White Black Hispanic
Percentage of Low Birth Weight
2008 2009 2010
Source: Florida CHARTS
36
Mortality Rates
5.4
17.8
7.3
4.1
12.2
5.25.1
13.8
7
0
2
4
6
8
10
12
14
16
18
20
White Black Hispanic
Infant Mortality RateRate per 1,000 Live Births
2008 2009 2010
3.1
12.3
3.83.1
9.2
3.93.5
11.3
5.2
0
2
4
6
8
10
12
14
White Black Hispanic
Neonatal Mortality RatesRate per 1,000 Live Births
2008 2009 2010
Source: Florida CHARTS
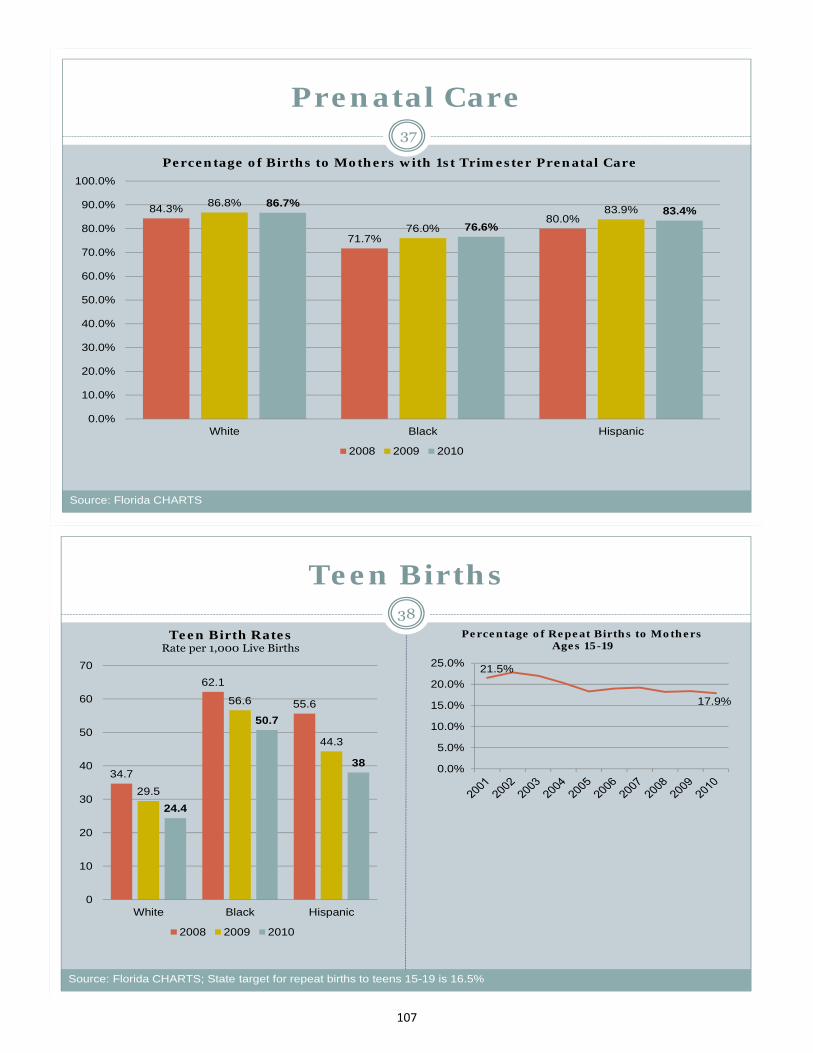
107
Prenatal Care37
84.3%
71.7%
80.0%
86.8%
76.0%
83.9%86.7%
76.6%
83.4%
0.0%
10.0%
20.0%
30.0%
40.0%
50.0%
60.0%
70.0%
80.0%
90.0%
100.0%
White Black Hispanic
Percentage of Births to Mothers with 1st Trimester Prenatal Care
2008 2009 2010
Source: Florida CHARTS
Teen Births38
34.7
62.1
55.6
29.5
56.6
44.3
24.4
50.7
38
0
10
20
30
40
50
60
70
White Black Hispanic
Teen Birth RatesRate per 1,000 Live Births
2008 2009 2010
21.5%
17.9%
0.0%
5.0%
10.0%
15.0%
20.0%
25.0%
Percentage of Repeat Births to MothersAges 15-19
Source: Florida CHARTS; State target for repeat births to teens 15-19 is 16.5%
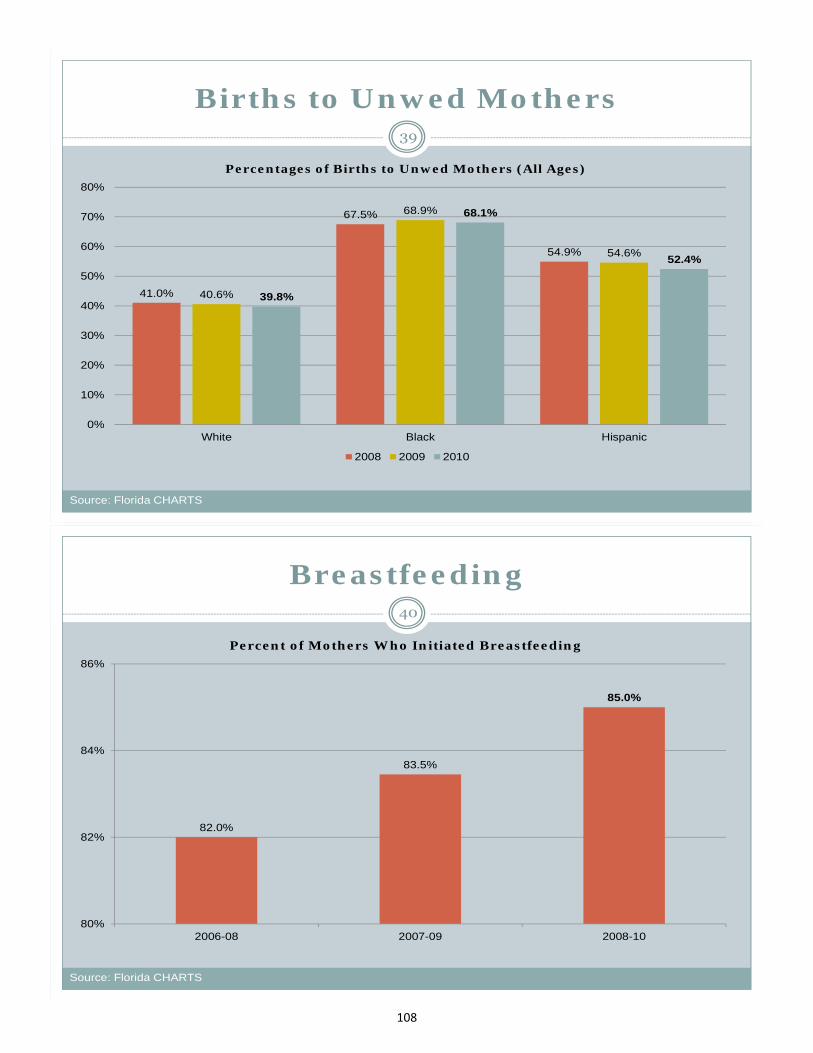
108
Births to Unwed Mothers39
41.0%
67.5%
54.9%
40.6%
68.9%
54.6%
39.8%
68.1%
52.4%
0%
10%
20%
30%
40%
50%
60%
70%
80%
White Black Hispanic
Percentages of Births to Unwed Mothers (All Ages)
2008 2009 2010
Source: Florida CHARTS
Breastfeeding40
82.0%
83.5%
85.0%
80%
82%
84%
86%
2006-08 2007-09 2008-10
Percent of Mothers Who Initiated Breastfeeding
Source: Florida CHARTS
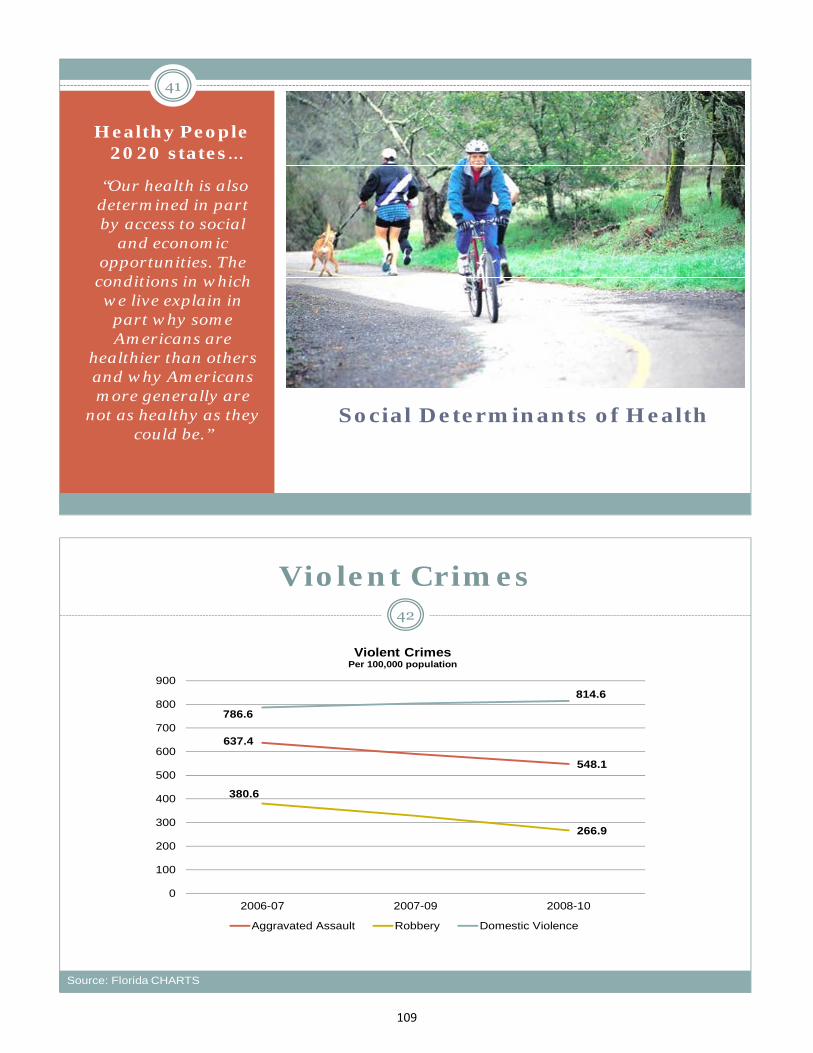
109
41
Social Determinants of Health
Healthy People 2020 states…
“Our health is also determined in part by access to social
and economic opportunities. The
conditions in which we live explain in
part why some Americans are
healthier than others and why Americans more generally are
not as healthy as they could be.”
Violent Crimes42
637.4
548.1
380.6
266.9
786.6
814.6
0
100
200
300
400
500
600
700
800
900
2006-07 2007-09 2008-10
Violent Crimes Per 100,000 population
Aggravated Assault Robbery Domestic Violence
Source: Florida CHARTS
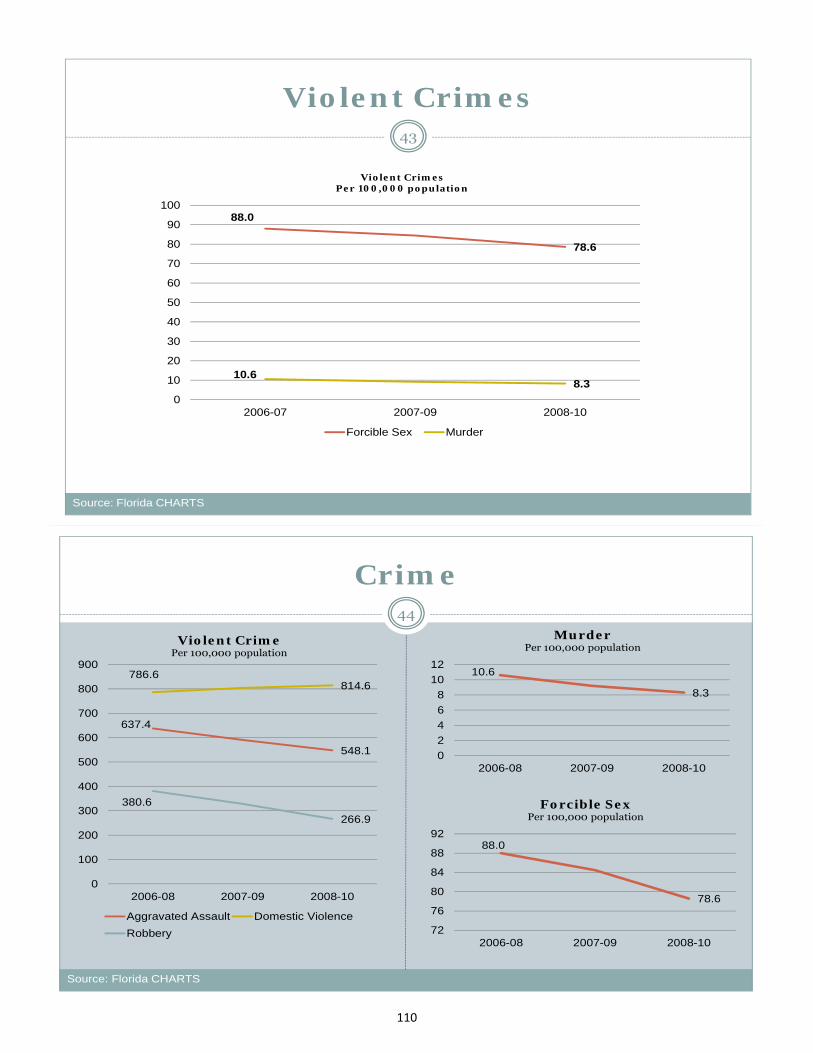
110
Violent Crimes43
88.0
78.6
10.68.3
0
10
20
30
40
50
60
70
80
90
100
2006-07 2007-09 2008-10
Violent Crimes Per 100,000 population
Forcible Sex Murder
Source: Florida CHARTS
Crime44
10.6
8.3
0
2
4
6
8
10
12
2006-08 2007-09 2008-10
Murder Per 100,000 population
88.0
78.6
72
76
80
84
88
92
2006-08 2007-09 2008-10
Forcible Sex Per 100,000 population
Source: Florida CHARTS
637.4
548.1
786.6814.6
380.6
266.9
0
100
200
300
400
500
600
700
800
900
2006-08 2007-09 2008-10
Violent Crime Per 100,000 population
Aggravated Assault Domestic Violence
Robbery
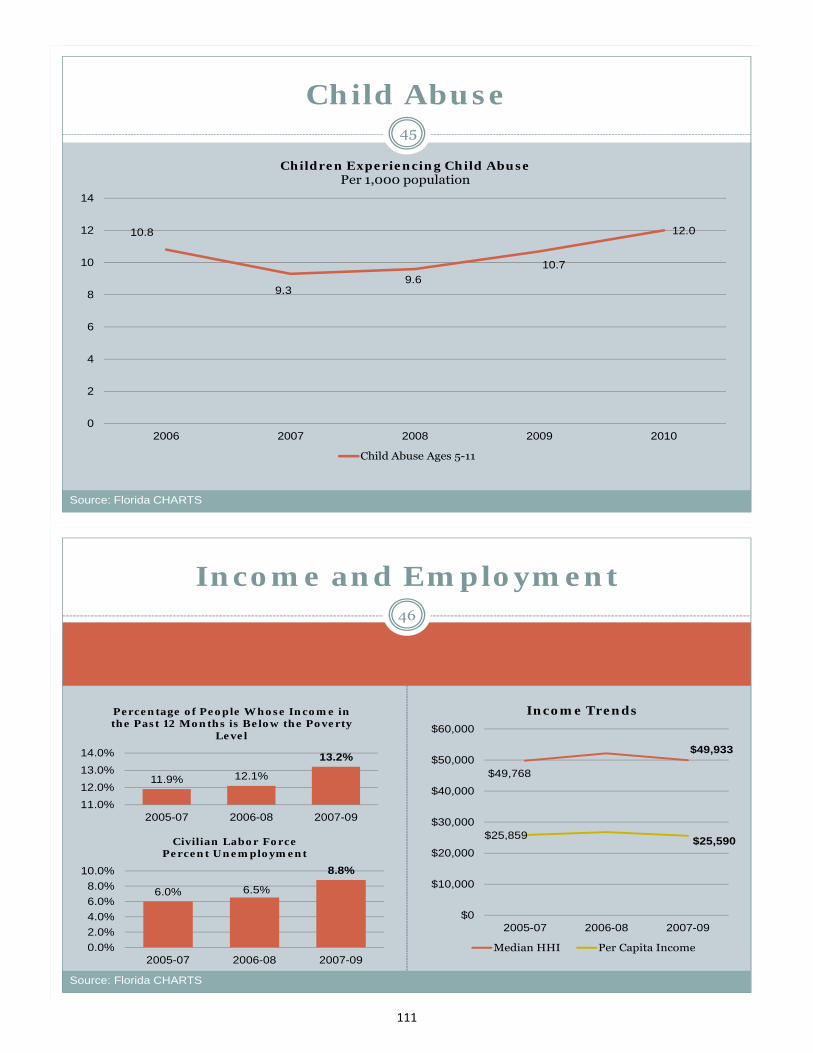
111
Child Abuse45
10.8
9.39.6
10.7
12.0
0
2
4
6
8
10
12
14
2006 2007 2008 2009 2010
Children Experiencing Child Abuse Per 1,000 population
Child Abuse Ages 5-11
Source: Florida CHARTS
46
Income and Employment
11.9% 12.1%
13.2%
11.0%
12.0%
13.0%
14.0%
2005-07 2006-08 2007-09
Percentage of People Whose Income in the Past 12 Months is Below the Poverty
Level
6.0% 6.5%
8.8%
0.0%
2.0%
4.0%
6.0%
8.0%
10.0%
2005-07 2006-08 2007-09
Civilian Labor ForcePercent Unemployment
$49,768
$49,933
$25,859 $25,590
$0
$10,000
$20,000
$30,000
$40,000
$50,000
$60,000
2005-07 2006-08 2007-09
Income Trends
Median HHI Per Capita Income
Source: Florida CHARTS
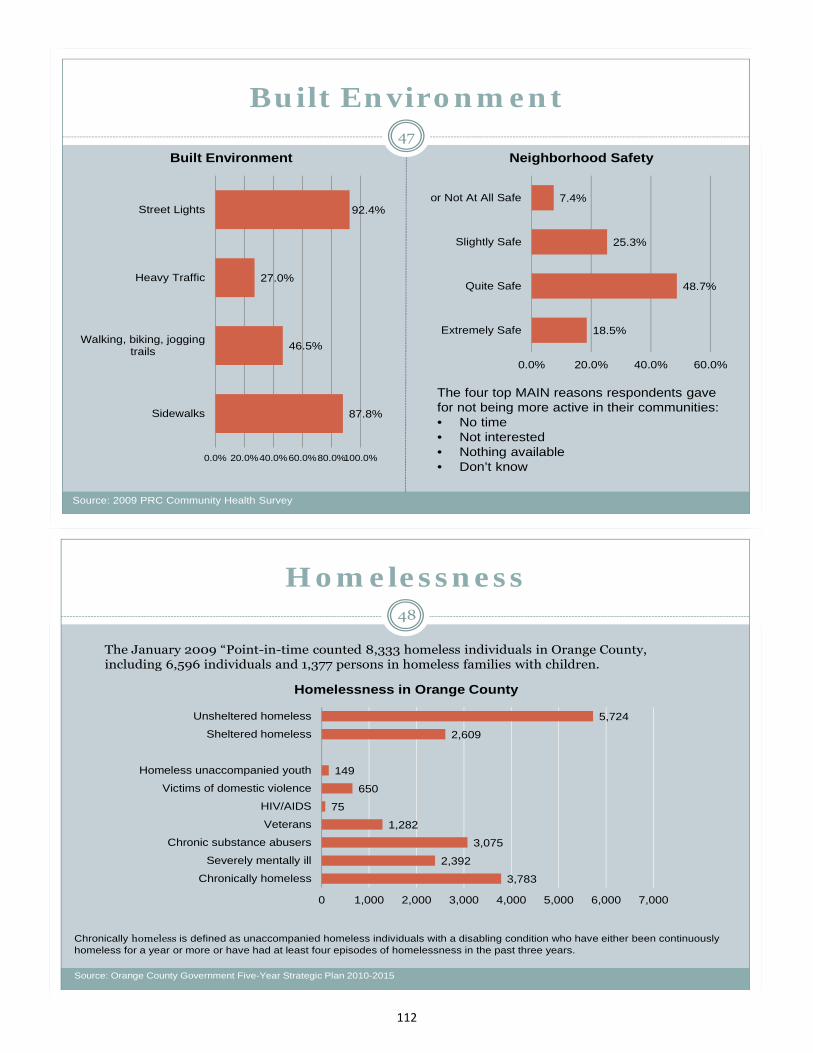
112
Built Environment47
87.8%
46.5%
27.0%
92.4%
0.0% 20.0%40.0%60.0%80.0%100.0%
Sidewalks
Walking, biking, joggingtrails
Heavy Traffic
Street Lights
Built Environment
18.5%
48.7%
25.3%
7.4%
0.0% 20.0% 40.0% 60.0%
Extremely Safe
Quite Safe
Slightly Safe
or Not At All Safe
Neighborhood Safety
The four top MAIN reasons respondents gave for not being more active in their communities:• No time• Not interested• Nothing available• Don’t know
Source: 2009 PRC Community Health Survey
Homelessness48
3,783
2,392
3,075
1,282
75
650
149
2,609
5,724
0 1,000 2,000 3,000 4,000 5,000 6,000 7,000
Chronically homeless
Severely mentally ill
Chronic substance abusers
Veterans
HIV/AIDS
Victims of domestic violence
Homeless unaccompanied youth
Sheltered homeless
Unsheltered homeless
Homelessness in Orange County
The January 2009 “Point-in-time counted 8,333 homeless individuals in Orange County, including 6,596 individuals and 1,377 persons in homeless families with children.
Chronically homeless is defined as unaccompanied homeless individuals with a disabling condition who have either been continuouslyhomeless for a year or more or have had at least four episodes of homelessness in the past three years.
Source: Orange County Government Five-Year Strategic Plan 2010-2015
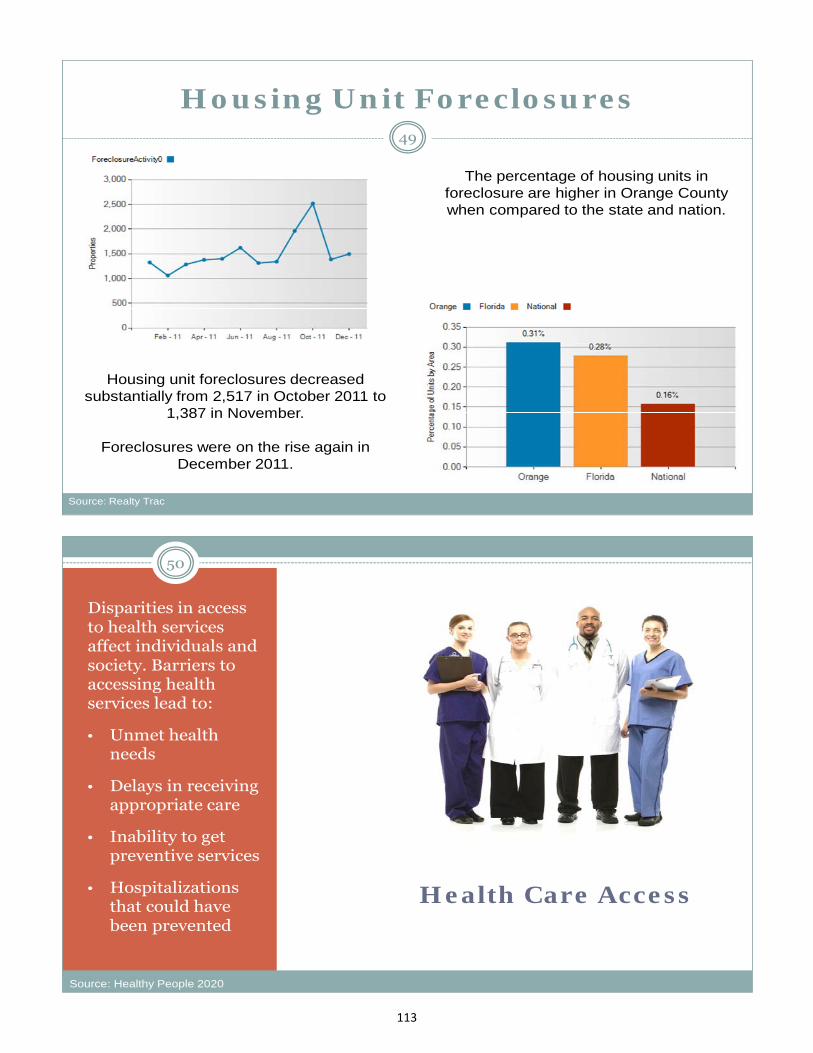
113
Housing Unit Foreclosures49
Housing unit foreclosures decreased substantially from 2,517 in October 2011 to
1,387 in November.
Foreclosures were on the rise again in December 2011.
The percentage of housing units in foreclosure are higher in Orange County when compared to the state and nation.
Source: Realty Trac
50
Health Care Access
Disparities in access to health services affect individuals and society. Barriers to accessing health services lead to:
• Unmet health needs
• Delays in receiving appropriate care
• Inability to get preventive services
• Hospitalizations that could have been prevented
Source: Healthy People 2020
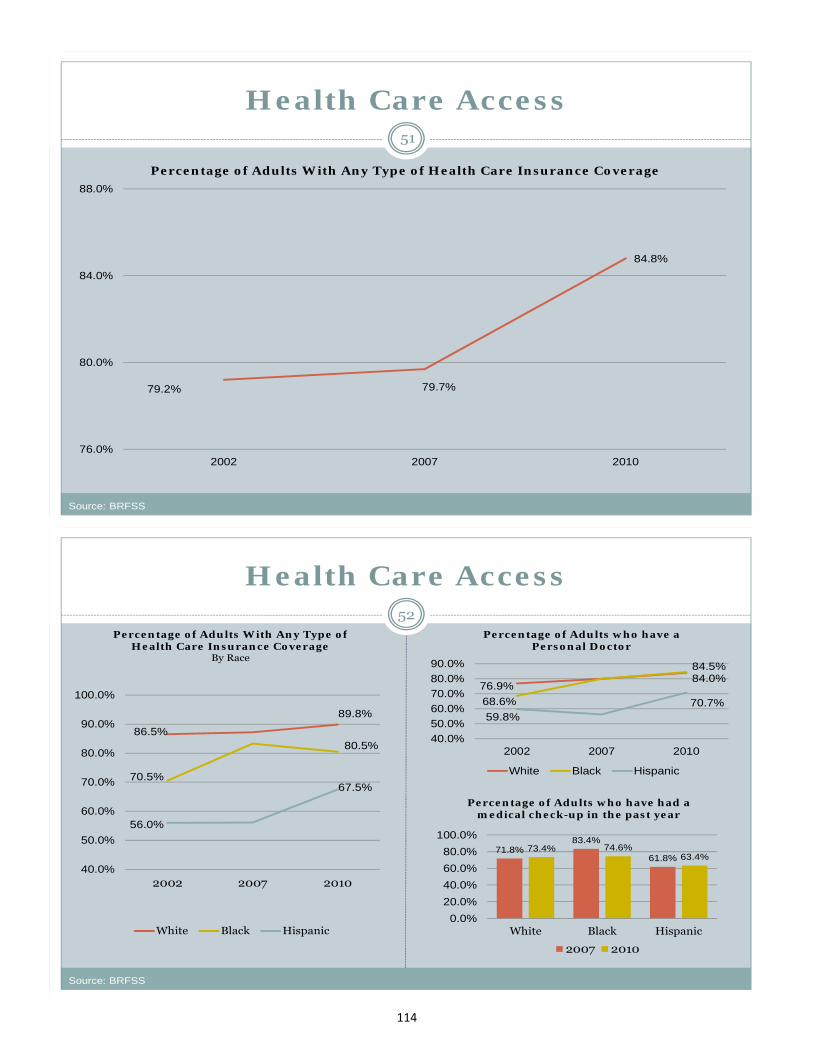
114
Health Care Access51
79.2% 79.7%
84.8%
76.0%
80.0%
84.0%
88.0%
2002 2007 2010
Percentage of Adults With Any Type of Health Care Insurance Coverage
Source: BRFSS
Health Care Access52
86.5%
89.8%
70.5%
80.5%
56.0%
67.5%
40.0%
50.0%
60.0%
70.0%
80.0%
90.0%
100.0%
2002 2007 2010
Percentage of Adults With Any Type of Health Care Insurance Coverage
By Race
White Black Hispanic
76.9%84.0%
68.6%
84.5%
59.8%70.7%
40.0%
50.0%
60.0%
70.0%
80.0%
90.0%
2002 2007 2010
Percentage of Adults who have a Personal Doctor
White Black Hispanic
Source: BRFSS
71.8%83.4%
61.8%73.4% 74.6%
63.4%
0.0%
20.0%
40.0%
60.0%
80.0%
100.0%
White Black Hispanic
Percentage of Adults who have had a medical check-up in the past year
2007 2010
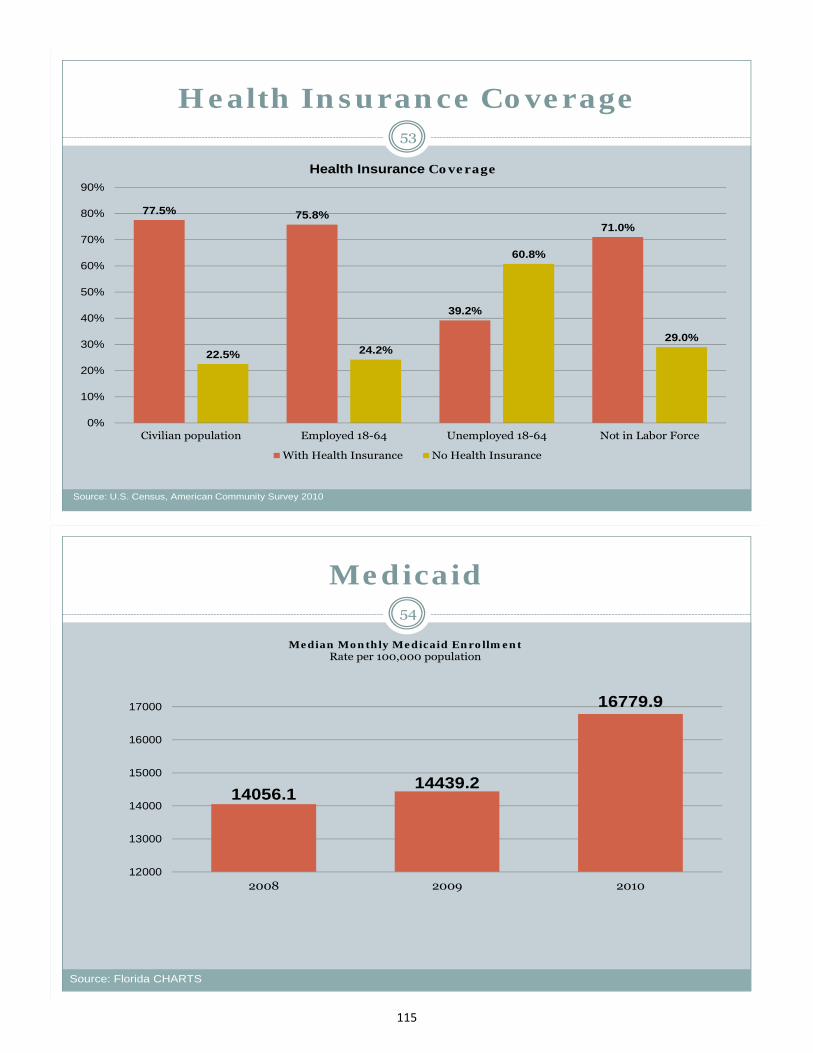
115
Health Insurance Coverage53
77.5% 75.8%
39.2%
71.0%
22.5% 24.2%
60.8%
29.0%
0%
10%
20%
30%
40%
50%
60%
70%
80%
90%
Civilian population Employed 18-64 Unemployed 18-64 Not in Labor Force
Health Insurance Coverage
With Health Insurance No Health Insurance
Source: U.S. Census, American Community Survey 2010
Medicaid54
14056.114439.2
16779.9
12000
13000
14000
15000
16000
17000
2008 2009 2010
Median Monthly Medicaid Enrollment Rate per 100,000 population
Source: Florida CHARTS
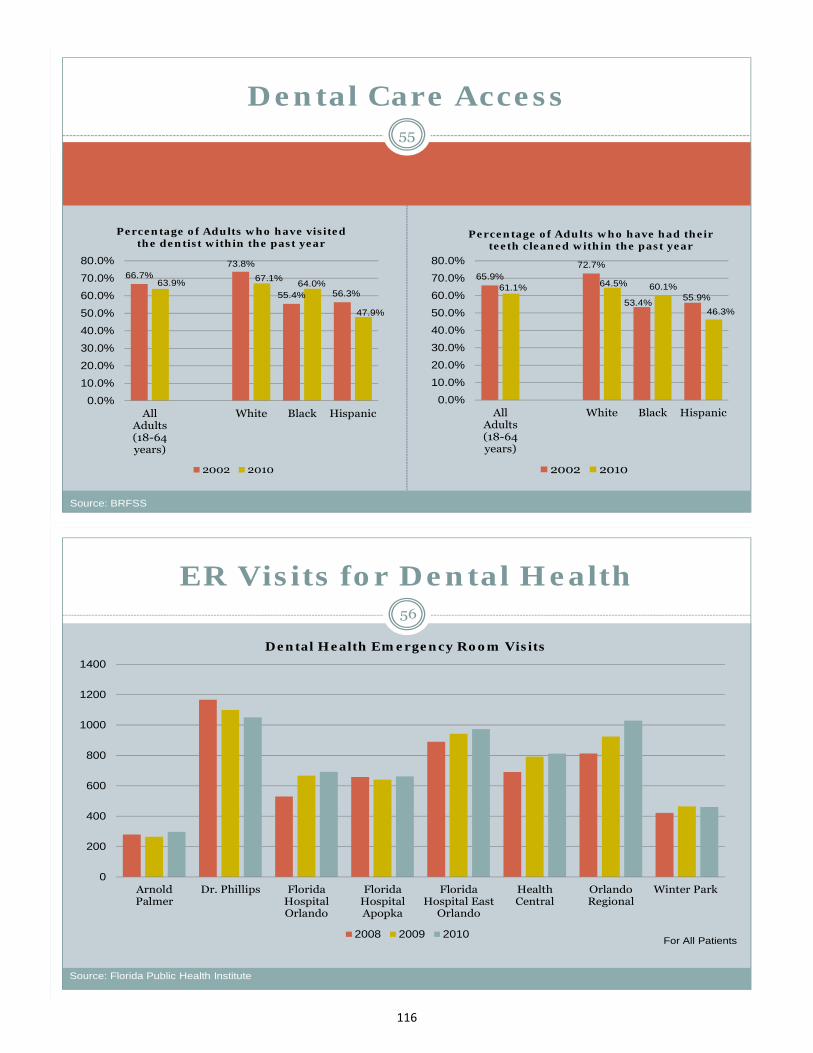
116
55
Dental Care Access
Source: BRFSS
66.7%73.8%
55.4% 56.3%63.9% 67.1%
64.0%
47.9%
0.0%
10.0%
20.0%
30.0%
40.0%
50.0%
60.0%
70.0%
80.0%
AllAdults(18-64years)
White Black Hispanic
Percentage of Adults who have visited the dentist within the past year
2002 2010
65.9%72.7%
53.4%55.9%
61.1% 64.5% 60.1%
46.3%
0.0%
10.0%
20.0%
30.0%
40.0%
50.0%
60.0%
70.0%
80.0%
AllAdults(18-64years)
White Black Hispanic
Percentage of Adults who have had their teeth cleaned within the past year
2002 2010
ER Visits for Dental Health56
0
200
400
600
800
1000
1200
1400
ArnoldPalmer
Dr. Phillips FloridaHospitalOrlando
FloridaHospitalApopka
FloridaHospital East
Orlando
HealthCentral
OrlandoRegional
Winter Park
Dental Health Emergency Room Visits
2008 2009 2010For All Patients
Source: Florida Public Health Institute
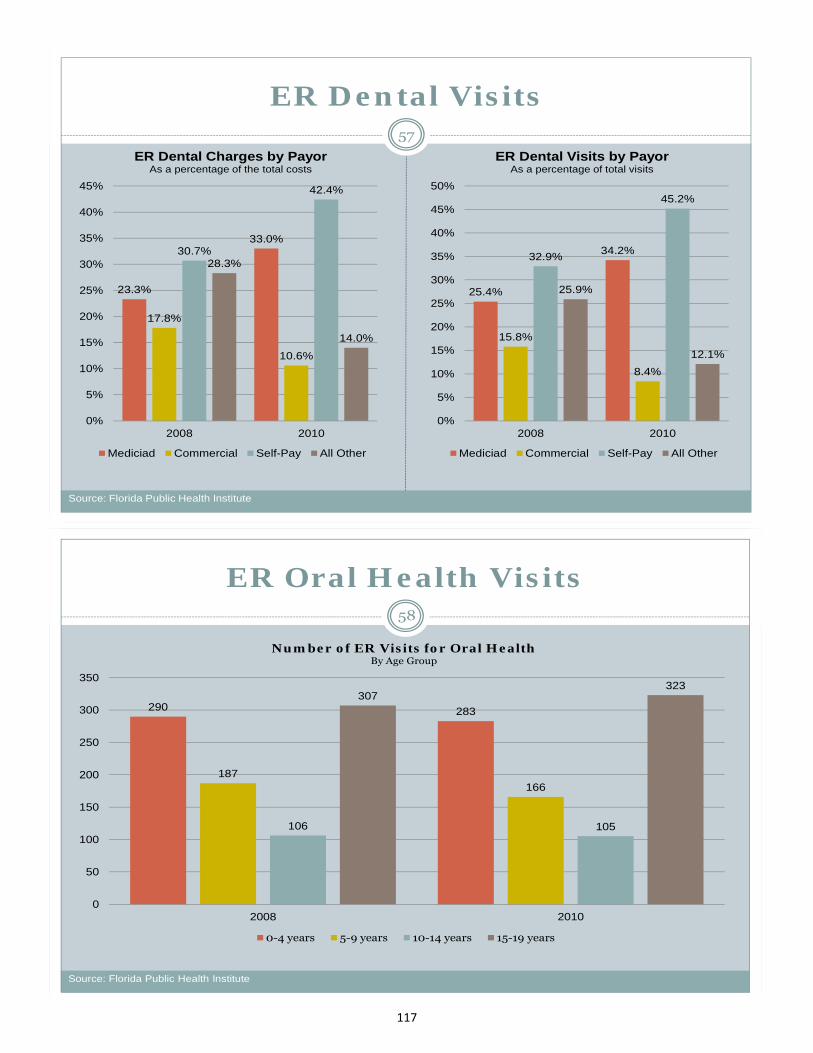
117
ER Dental Visits57
23.3%
33.0%
17.8%
10.6%
30.7%
42.4%
28.3%
14.0%
0%
5%
10%
15%
20%
25%
30%
35%
40%
45%
2008 2010
ER Dental Charges by PayorAs a percentage of the total costs
Mediciad Commercial Self-Pay All Other
25.4%
34.2%
15.8%
8.4%
32.9%
45.2%
25.9%
12.1%
0%
5%
10%
15%
20%
25%
30%
35%
40%
45%
50%
2008 2010
ER Dental Visits by Payor As a percentage of total visits
Mediciad Commercial Self-Pay All Other
Source: Florida Public Health Institute
ER Oral Health Visits58
290 283
187166
106 105
307323
0
50
100
150
200
250
300
350
2008 2010
Number of ER Visits for Oral HealthBy Age Group
0-4 years 5-9 years 10-14 years 15-19 years
Source: Florida Public Health Institute
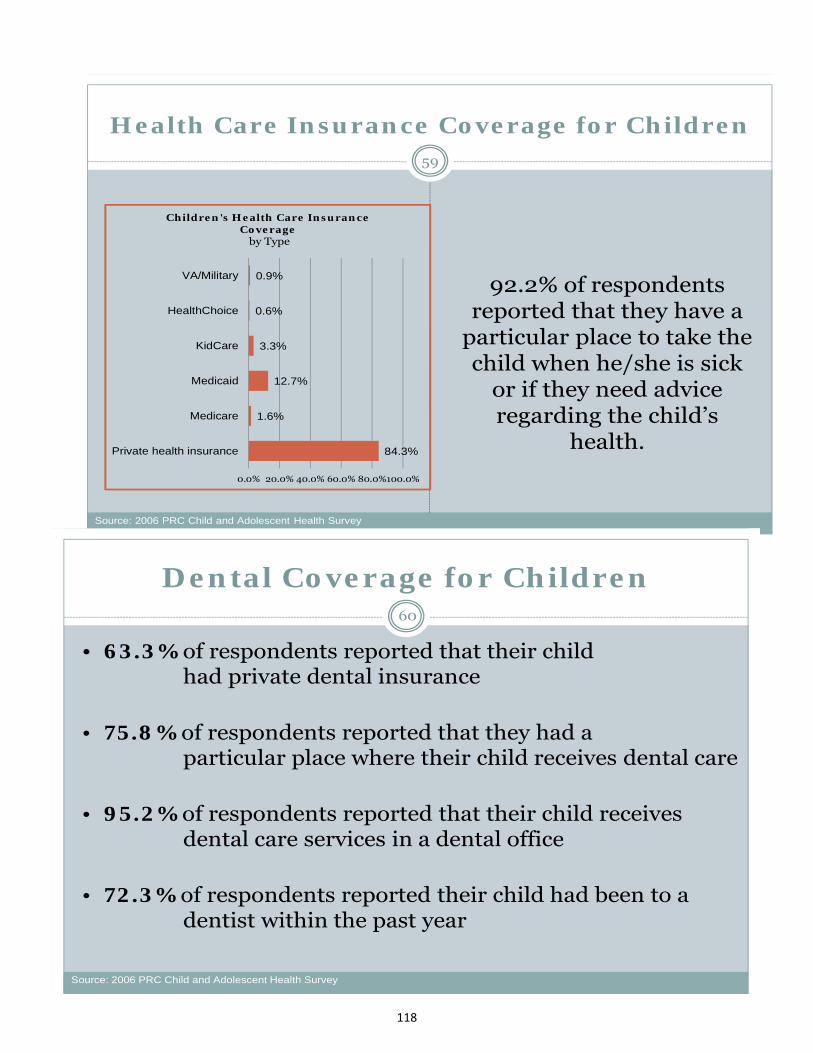
118
Health Care Insurance Coverage for Children59
84.3%
1.6%
12.7%
3.3%
0.6%
0.9%
0.0% 20.0% 40.0% 60.0% 80.0%100.0%
Private health insurance
Medicare
Medicaid
KidCare
HealthChoice
VA/Military
Children's Health Care Insurance Coverage
by Type
92.2% of respondents reported that they have a
particular place to take the child when he/she is sick
or if they need advice regarding the child’s
health.
Source: 2006 PRC Child and Adolescent Health Survey
Dental Coverage for Children60
• 63.3% of respondents reported that their child had private dental insurance
• 75.8% of respondents reported that they had a particular place where their child receives dental care
• 95.2% of respondents reported that their child receives dental care services in a dental office
• 72.3% of respondents reported their child had been to a dentist within the past year
Source: 2006 PRC Child and Adolescent Health Survey
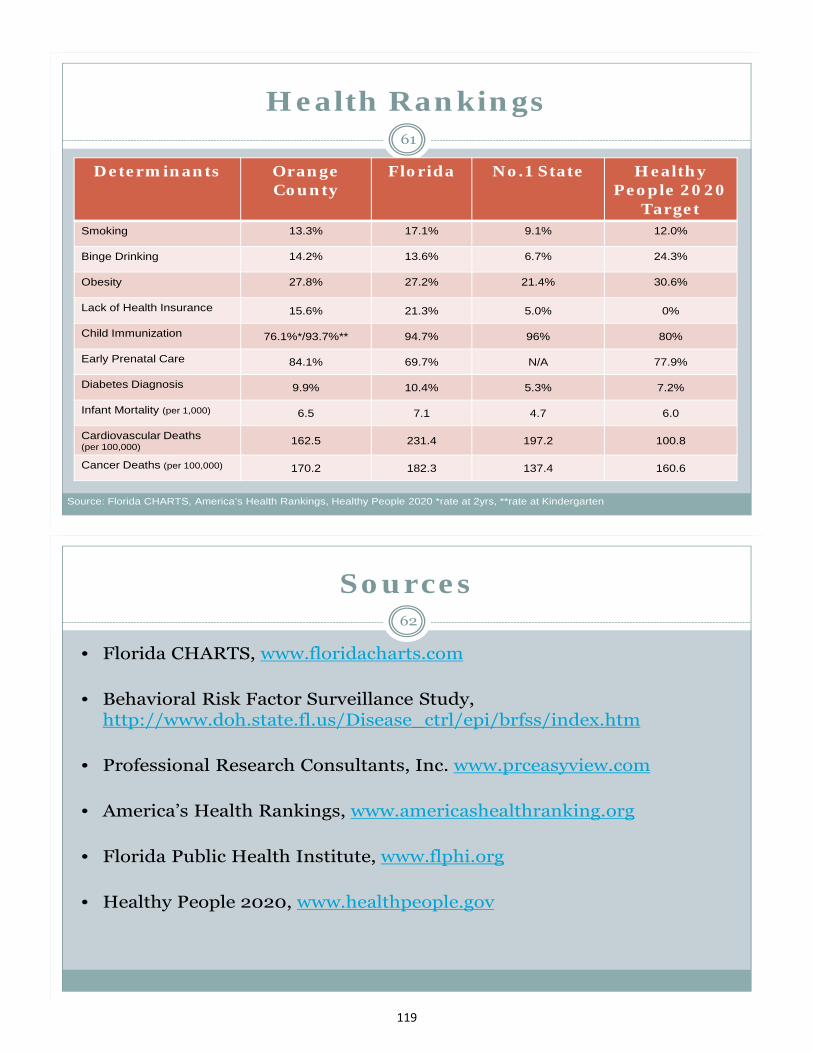
119
Health Rankings61
Determinants Orange County
Florida No.1 State Healthy People 2020
TargetSmoking 13.3% 17.1% 9.1% 12.0%
Binge Drinking 14.2% 13.6% 6.7% 24.3%
Obesity 27.8% 27.2% 21.4% 30.6%
Lack of Health Insurance 15.6% 21.3% 5.0% 0%
Child Immunization 76.1%*/93.7%** 94.7% 96% 80%
Early Prenatal Care 84.1% 69.7% N/A 77.9%
Diabetes Diagnosis 9.9% 10.4% 5.3% 7.2%
Infant Mortality (per 1,000) 6.5 7.1 4.7 6.0
Cardiovascular Deaths (per 100,000)
162.5 231.4 197.2 100.8
Cancer Deaths (per 100,000) 170.2 182.3 137.4 160.6
Source: Florida CHARTS, America’s Health Rankings, Healthy People 2020 *rate at 2yrs, **rate at Kindergarten
Sources62
• Florida CHARTS, www.floridacharts.com
• Behavioral Risk Factor Surveillance Study, http://www.doh.state.fl.us/Disease_ctrl/epi/brfss/index.htm
• Professional Research Consultants, Inc. www.prceasyview.com
• America’s Health Rankings, www.americashealthranking.org
• Florida Public Health Institute, www.flphi.org
• Healthy People 2020, www.healthpeople.gov

120
APPENDIX D
FORCES OF CHANGE
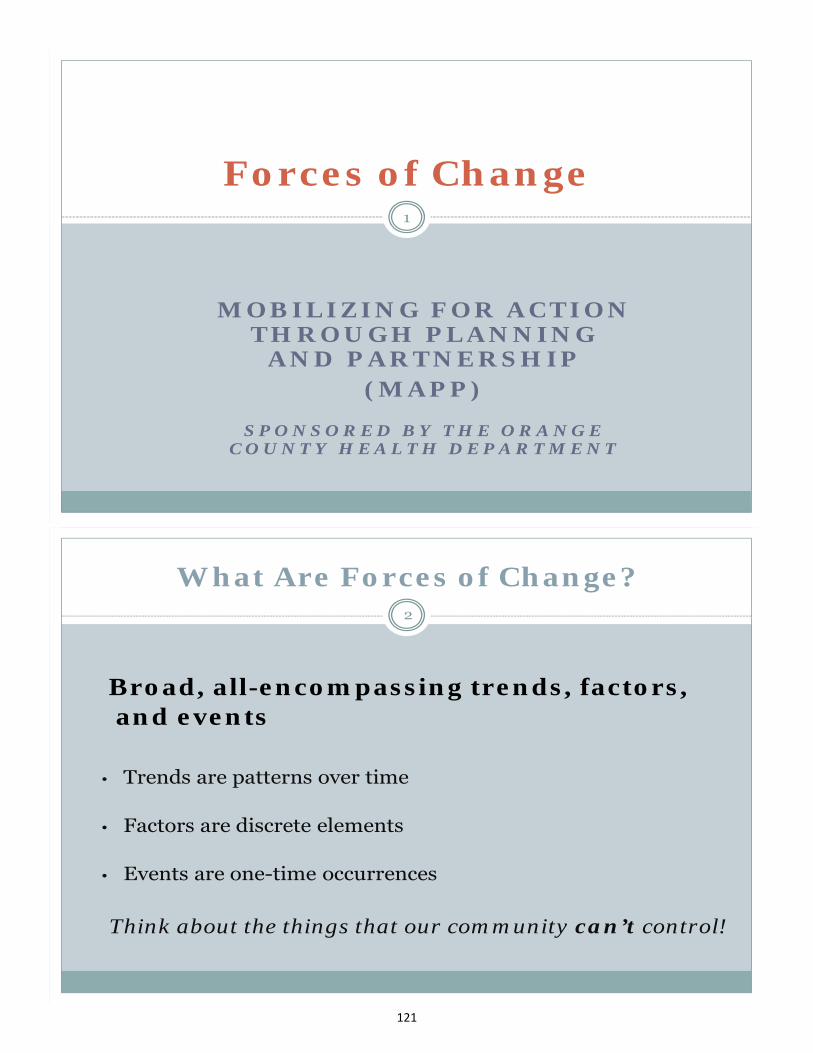
121
MOBILIZING FOR ACTION THROUGH PLANNING
AND PARTNERSHIP(MAPP)
S P O N S O R E D B Y T H E O R A N G E C O U N T Y H E A L T H D E P A R T M E N T
1
Forces of Change
What Are Forces of Change?2
Broad, all-encompassing trends, factors,and events
• Trends are patterns over time
• Factors are discrete elements
• Events are one-time occurrences
Think about the things that our community can’t control!
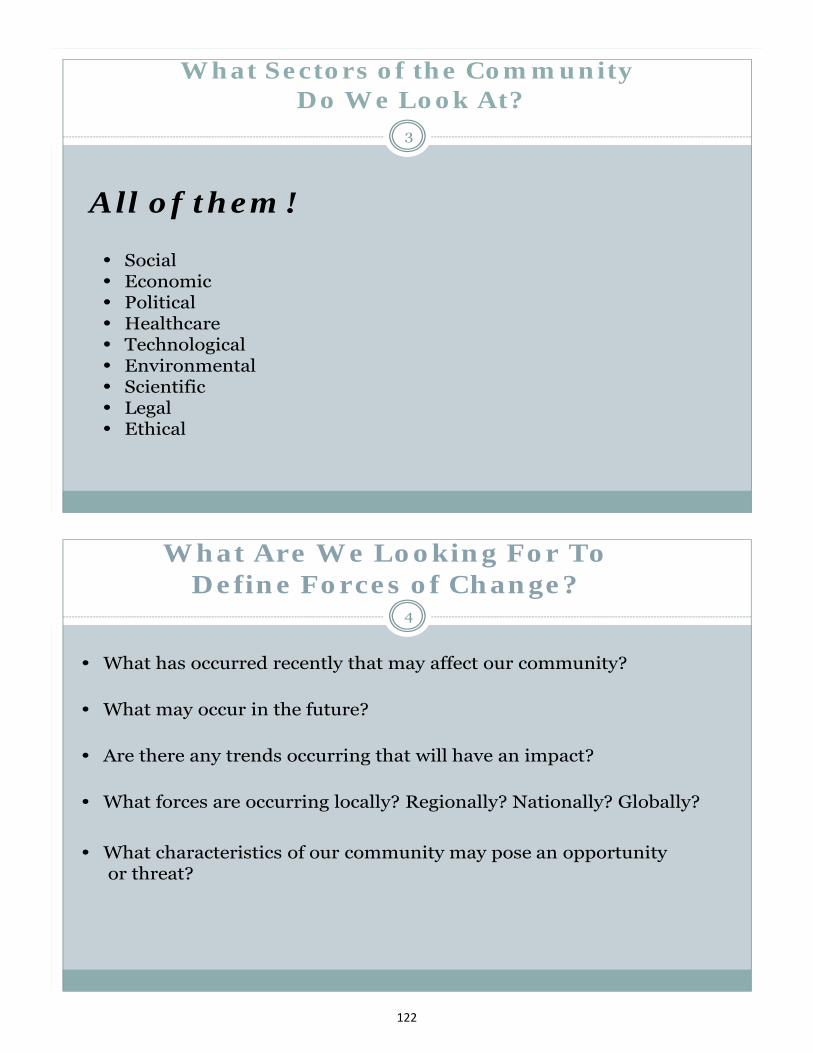
122
What Sectors of the CommunityDo We Look At?
3
All of them!
• Social• Economic• Political• Healthcare• Technological• Environmental• Scientific• Legal• Ethical
What Are We Looking For To Define Forces of Change?
4
• What has occurred recently that may affect our community?
• What may occur in the future?
• Are there any trends occurring that will have an impact?
• What forces are occurring locally? Regionally? Nationally? Globally?
• What characteristics of our community may pose an opportunityor threat?
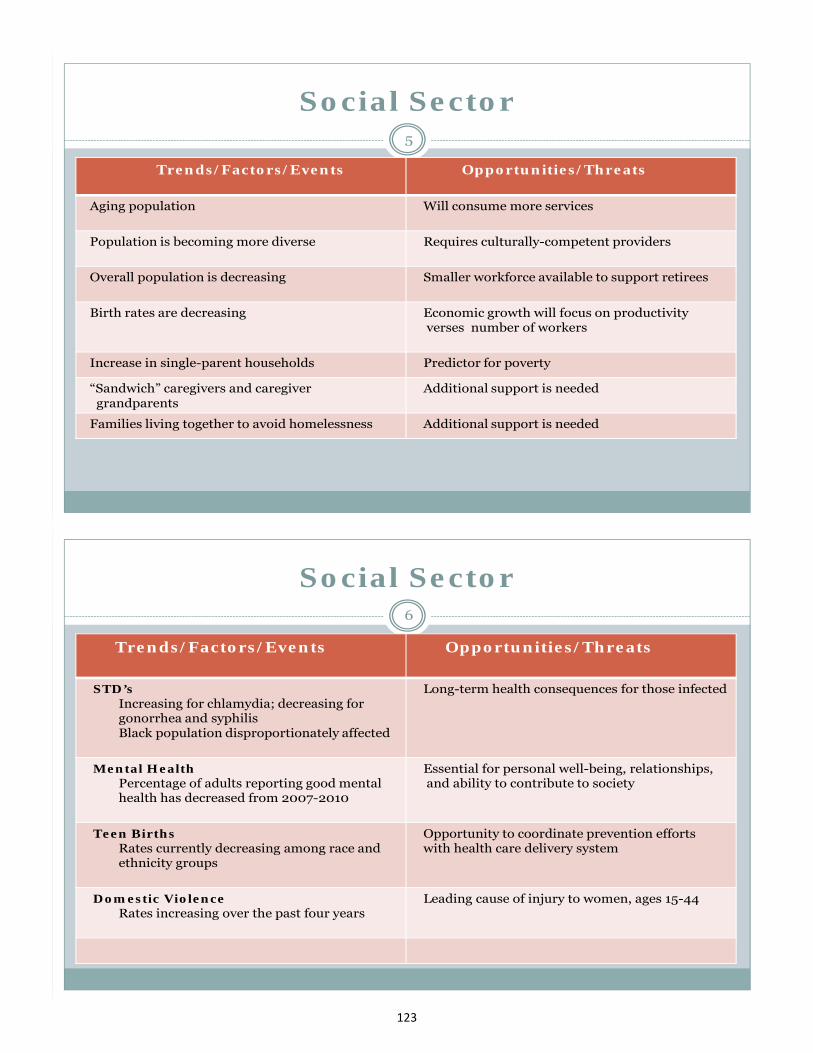
123
Social Sector5
Trends/Factors/Events Opportunities/Threats
Aging population Will consume more services
Population is becoming more diverse Requires culturally-competent providers
Overall population is decreasing Smaller workforce available to support retirees
Birth rates are decreasing Economic growth will focus on productivityverses number of workers
Increase in single-parent households Predictor for poverty
“Sandwich” caregivers and caregiver grandparents
Additional support is needed
Families living together to avoid homelessness Additional support is needed
Social Sector6
Trends/Factors/Events Opportunities/Threats
STD’sIncreasing for chlamydia; decreasing for gonorrhea and syphilisBlack population disproportionately affected
Long-term health consequences for those infected
Mental HealthPercentage of adults reporting good mental health has decreased from 2007-2010
Essential for personal well-being, relationships, and ability to contribute to society
Teen BirthsRates currently decreasing among race and ethnicity groups
Opportunity to coordinate prevention efforts with health care delivery system
Domestic ViolenceRates increasing over the past four years
Leading cause of injury to women, ages 15-44
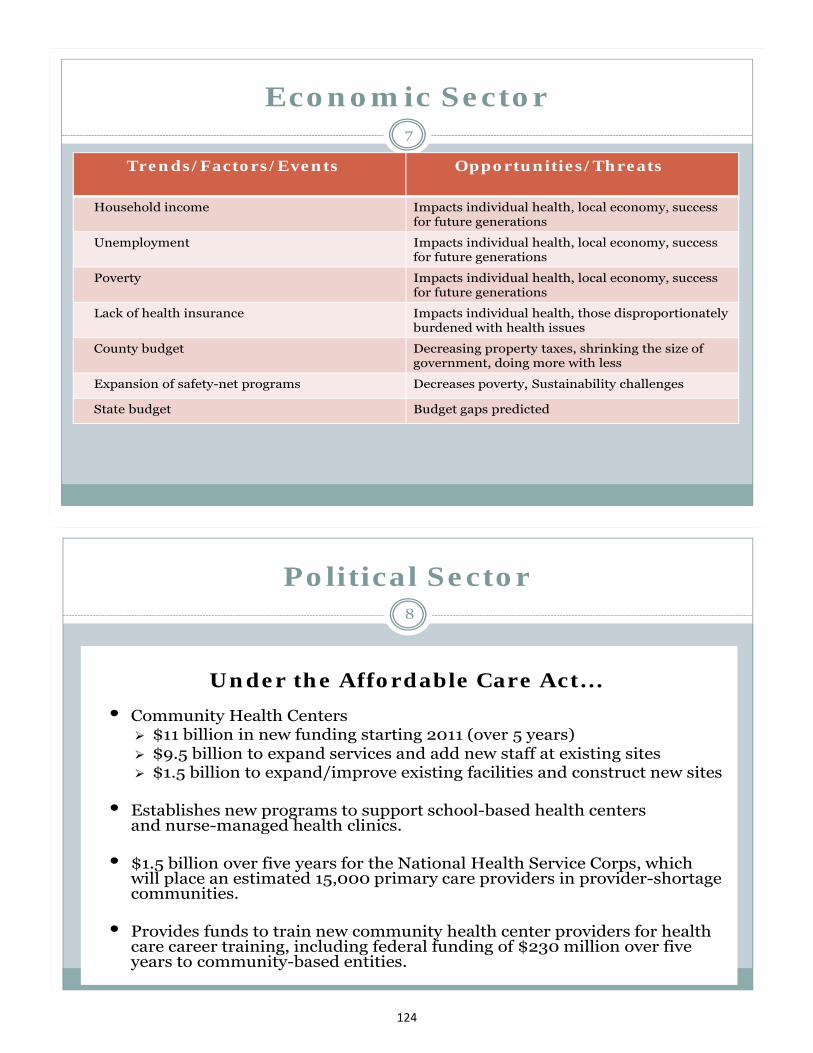
124
Economic Sector7
Trends/Factors/Events Opportunities/Threats
Household income Impacts individual health, local economy, success for future generations
Unemployment Impacts individual health, local economy, success for future generations
Poverty Impacts individual health, local economy, success for future generations
Lack of health insurance Impacts individual health, those disproportionately burdened with health issues
County budget Decreasing property taxes, shrinking the size of government, doing more with less
Expansion of safety-net programs Decreases poverty, Sustainability challenges
State budget Budget gaps predicted
Political Sector8
Under the Affordable Care Act…
• Community Health Centers $11 billion in new funding starting 2011 (over 5 years) $9.5 billion to expand services and add new staff at existing sites $1.5 billion to expand/improve existing facilities and construct new sites
• Establishes new programs to support school-based health centersand nurse-managed health clinics.
• $1.5 billion over five years for the National Health Service Corps, whichwill place an estimated 15,000 primary care providers in provider-shortage communities.
• Provides funds to train new community health center providers for health care career training, including federal funding of $230 million over five years to community-based entities.
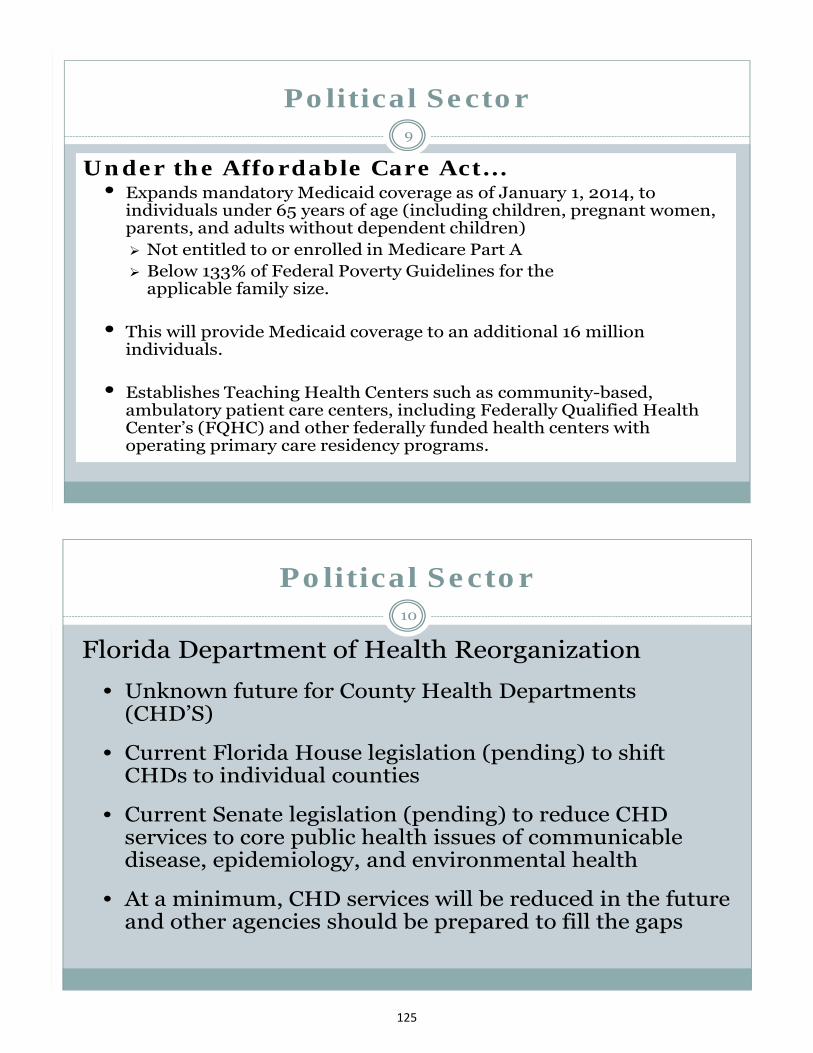
125
Political Sector9
Under the Affordable Care Act…• Expands mandatory Medicaid coverage as of January 1, 2014, to
individuals under 65 years of age (including children, pregnant women, parents, and adults without dependent children) Not entitled to or enrolled in Medicare Part A Below 133% of Federal Poverty Guidelines for the
applicable family size.
• This will provide Medicaid coverage to an additional 16 million individuals.
• Establishes Teaching Health Centers such as community-based, ambulatory patient care centers, including Federally Qualified Health Center’s (FQHC) and other federally funded health centers with operating primary care residency programs.
Political Sector10
Florida Department of Health Reorganization
• Unknown future for County Health Departments (CHD’S)
• Current Florida House legislation (pending) to shift CHDs to individual counties
• Current Senate legislation (pending) to reduce CHD services to core public health issues of communicable disease, epidemiology, and environmental health
• At a minimum, CHD services will be reduced in the future and other agencies should be prepared to fill the gaps
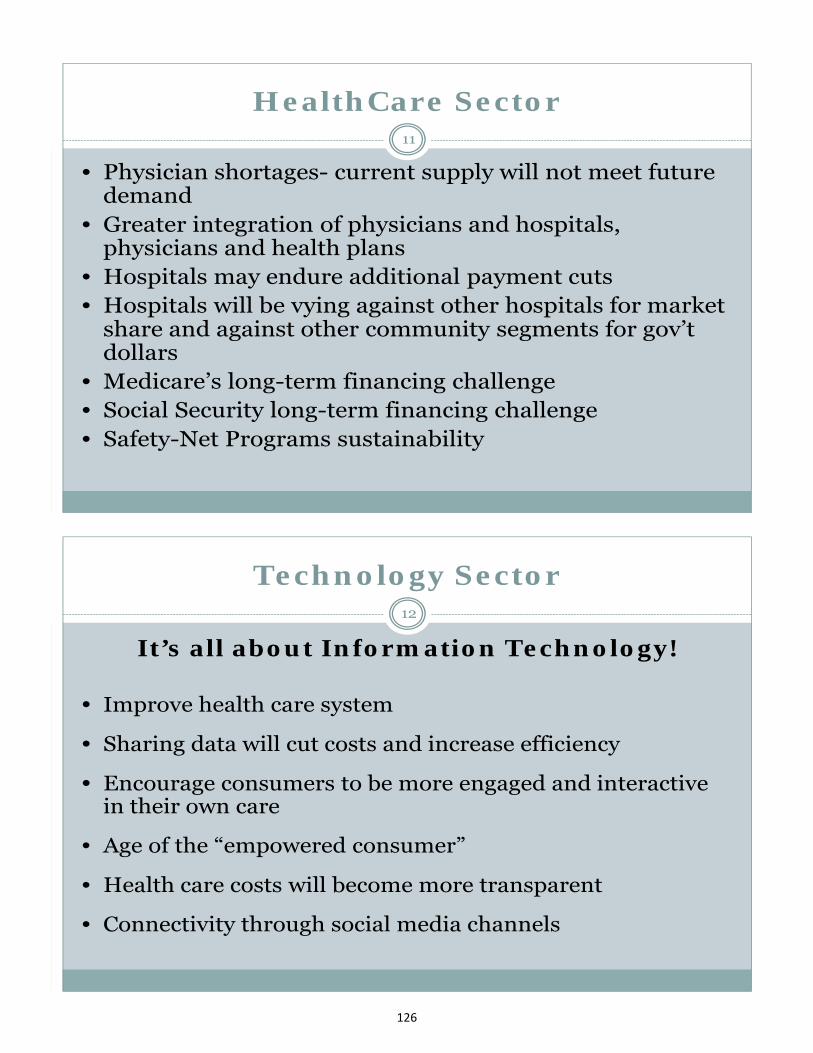
126
HealthCare Sector11
• Physician shortages- current supply will not meet future demand
• Greater integration of physicians and hospitals, physicians and health plans
• Hospitals may endure additional payment cuts• Hospitals will be vying against other hospitals for market
share and against other community segments for gov’t dollars
• Medicare’s long-term financing challenge• Social Security long-term financing challenge• Safety-Net Programs sustainability
Technology Sector12
It’s all about Information Technology!
• Improve health care system
• Sharing data will cut costs and increase efficiency
• Encourage consumers to be more engaged and interactive in their own care
• Age of the “empowered consumer”
• Health care costs will become more transparent
• Connectivity through social media channels
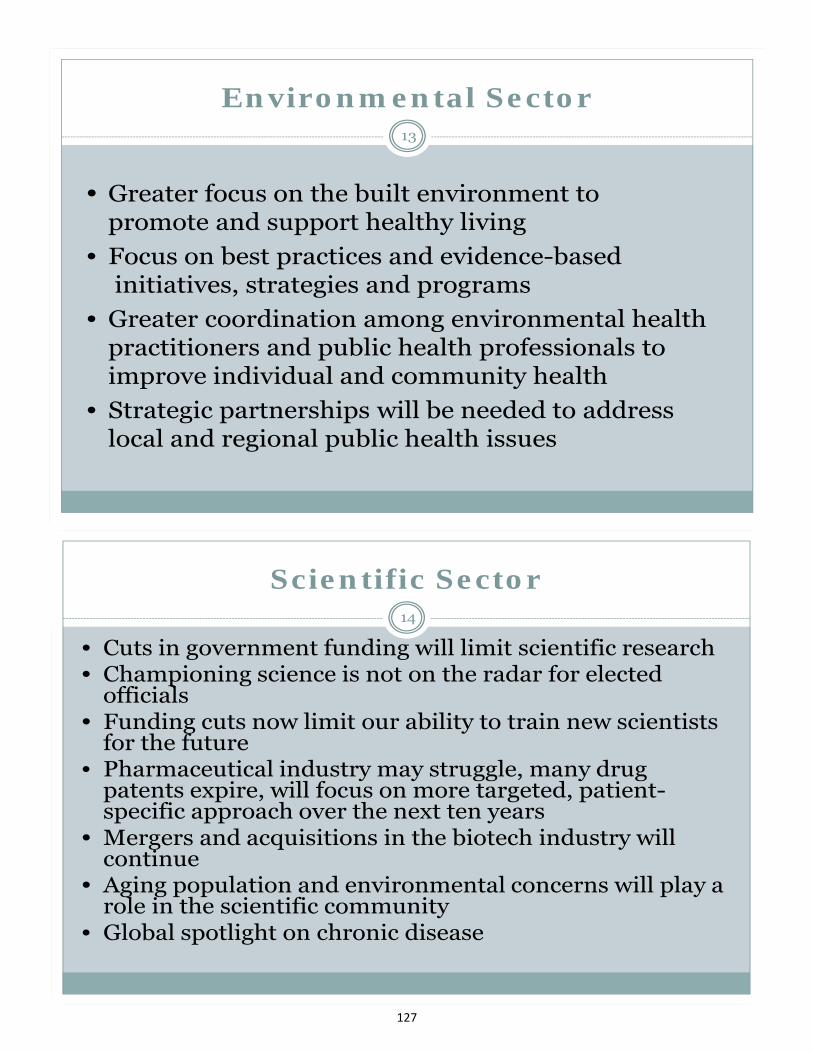
127
Environmental Sector13
• Greater focus on the built environment to promote and support healthy living
• Focus on best practices and evidence-basedinitiatives, strategies and programs
• Greater coordination among environmental health practitioners and public health professionals to improve individual and community health
• Strategic partnerships will be needed to addresslocal and regional public health issues
Scientific Sector14
• Cuts in government funding will limit scientific research • Championing science is not on the radar for elected
officials• Funding cuts now limit our ability to train new scientists
for the future• Pharmaceutical industry may struggle, many drug
patents expire, will focus on more targeted, patient-specific approach over the next ten years
• Mergers and acquisitions in the biotech industry will continue
• Aging population and environmental concerns will play a role in the scientific community
• Global spotlight on chronic disease
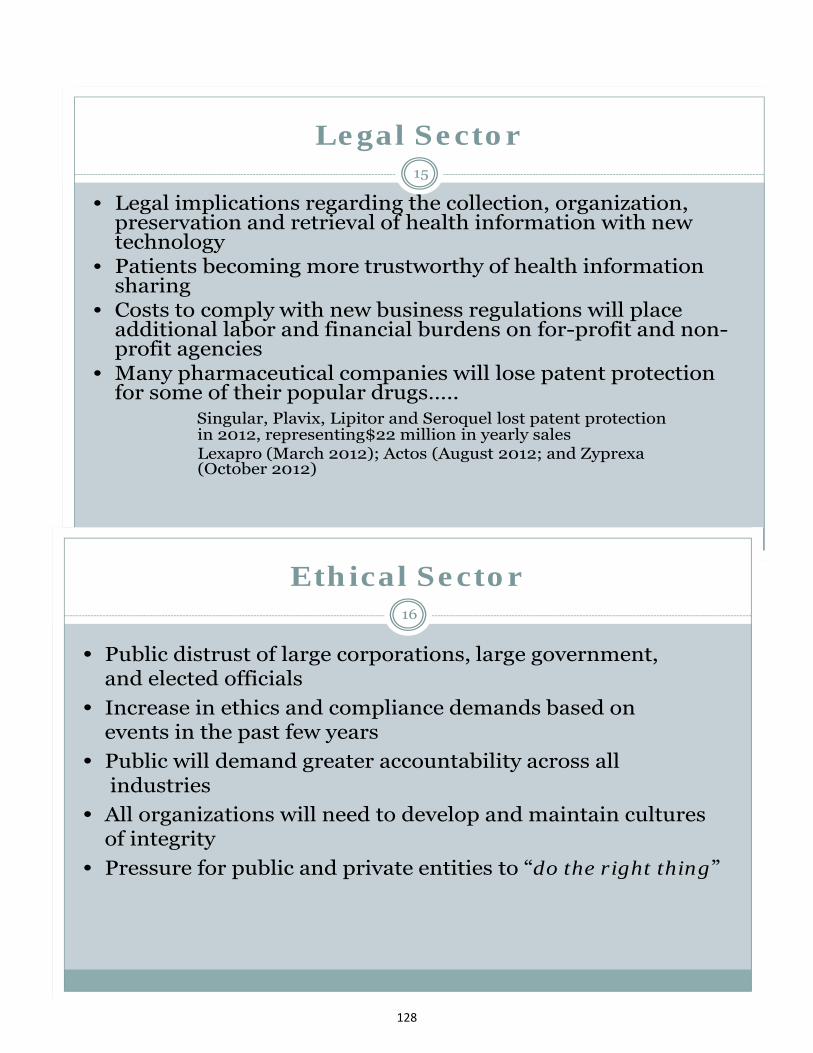
128
Legal Sector15
• Legal implications regarding the collection, organization, preservation and retrieval of health information with new technology
• Patients becoming more trustworthy of health information sharing
• Costs to comply with new business regulations will place additional labor and financial burdens on for-profit and non-profit agencies
• Many pharmaceutical companies will lose patent protection for some of their popular drugs…..
Singular, Plavix, Lipitor and Seroquel lost patent protectionin 2012, representing$22 million in yearly salesLexapro (March 2012); Actos (August 2012; and Zyprexa(October 2012)
Ethical Sector16
• Public distrust of large corporations, large government, and elected officials
• Increase in ethics and compliance demands based on events in the past few years
• Public will demand greater accountability across allindustries
• All organizations will need to develop and maintain cultures of integrity
• Pressure for public and private entities to “do the right thing”

129
APPENDIX E
ACTION CYCLE TEMPLATE
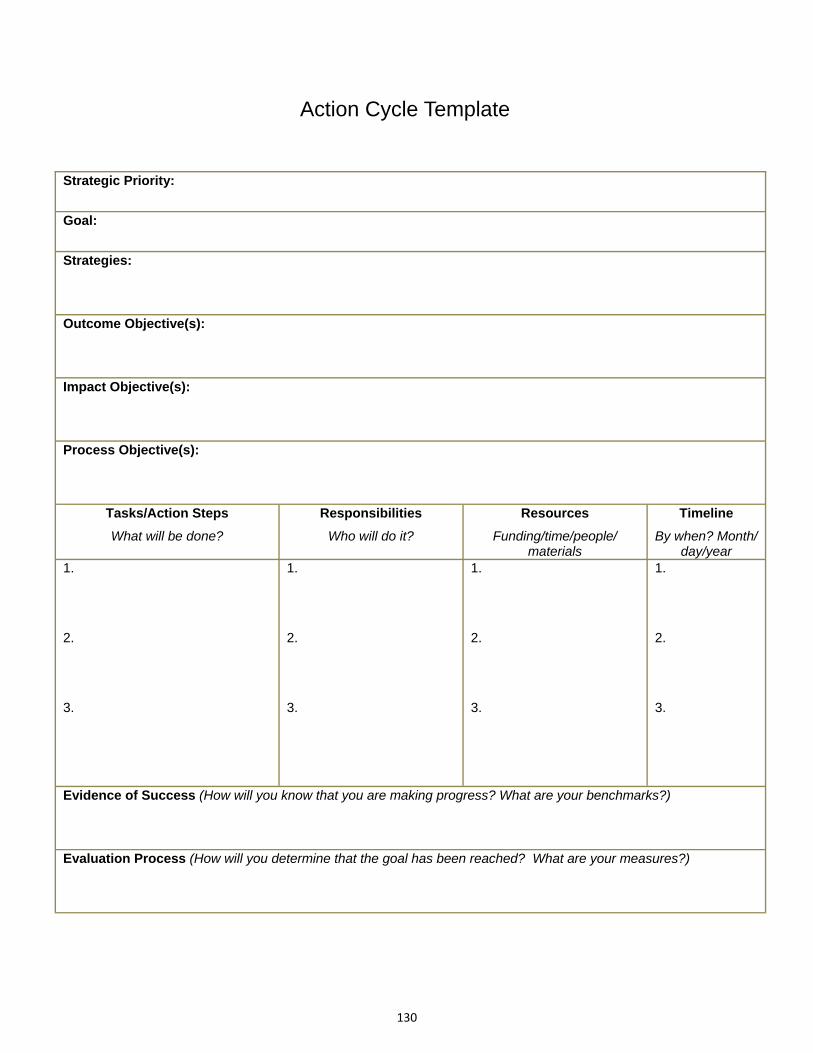
130
Strategic Priority:
Goal:
Strategies:
Outcome Objective(s):
Impact Objective(s):
Process Objective(s):
Tasks/Action Steps
What will be done?
Responsibilities
Who will do it?
Resources
Funding/time/people/materials
Timeline
By when? Month/day/year
1.
2.
3.
1.
2.
3.
1.
2.
3.
1.
2.
3.
Evidence of Success (How will you know that you are making progress? What are your benchmarks?)
Evaluation Process (How will you determine that the goal has been reached? What are your measures?)
Action Cycle Template
131
APPENDIX F
MEASURABLE HEALTH OUTCOMES
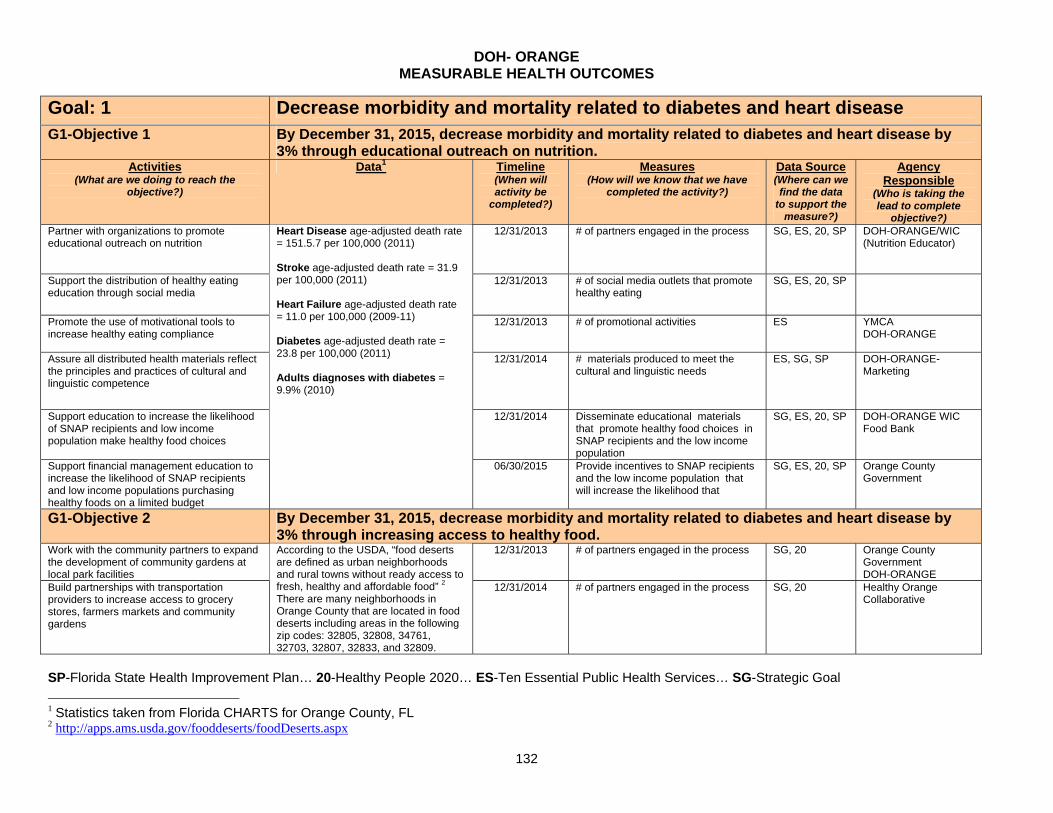
DOH- ORANGE MEASURABLE HEALTH OUTCOMES
132
Goal: 1 Decrease morbidity and mortality related to diabetes and heart disease G1-Objective 1 By December 31, 2015, decrease morbidity and mortality related to diabetes and heart disease by
3% through educational outreach on nutrition. Activities
(What are we doing to reach the objective?)
Data1 Timeline (When will activity be
completed?)
Measures (How will we know that we have
completed the activity?)
Data Source (Where can we find the data
to support the measure?)
Agency Responsible
(Who is taking the lead to complete
objective?) Partner with organizations to promote educational outreach on nutrition
12/31/2013 # of partners engaged in the process SG, ES, 20, SP DOH-ORANGE/WIC (Nutrition Educator)
Support the distribution of healthy eating education through social media
12/31/2013 # of social media outlets that promote healthy eating
SG, ES, 20, SP
Promote the use of motivational tools to increase healthy eating compliance
12/31/2013 # of promotional activities ES
YMCA DOH-ORANGE
Assure all distributed health materials reflect the principles and practices of cultural and linguistic competence
12/31/2014 # materials produced to meet the cultural and linguistic needs
ES, SG, SP DOH-ORANGE-Marketing
Support education to increase the likelihood of SNAP recipients and low income population make healthy food choices
12/31/2014 Disseminate educational materials that promote healthy food choices in SNAP recipients and the low income population
SG, ES, 20, SP DOH-ORANGE WIC Food Bank
Support financial management education to increase the likelihood of SNAP recipients and low income populations purchasing healthy foods on a limited budget
Heart Disease age-adjusted death rate = 151.5.7 per 100,000 (2011) Stroke age-adjusted death rate = 31.9 per 100,000 (2011) Heart Failure age-adjusted death rate = 11.0 per 100,000 (2009-11) Diabetes age-adjusted death rate = 23.8 per 100,000 (2011) Adults diagnoses with diabetes = 9.9% (2010)
06/30/2015 Provide incentives to SNAP recipients and the low income population that will increase the likelihood that
SG, ES, 20, SP Orange County Government
G1-Objective 2 By December 31, 2015, decrease morbidity and mortality related to diabetes and heart disease by 3% through increasing access to healthy food.
Work with the community partners to expand the development of community gardens at local park facilities
12/31/2013 # of partners engaged in the process SG, 20 Orange County Government DOH-ORANGE
Build partnerships with transportation providers to increase access to grocery stores, farmers markets and community gardens
According to the USDA, “food deserts are defined as urban neighborhoods and rural towns without ready access to fresh, healthy and affordable food” 2 There are many neighborhoods in Orange County that are located in food deserts including areas in the following zip codes: 32805, 32808, 34761, 32703, 32807, 32833, and 32809.
12/31/2014 # of partners engaged in the process SG, 20 Healthy Orange Collaborative
SP-Florida State Health Improvement Plan… 20-Healthy People 2020… ES-Ten Essential Public Health Services… SG-Strategic Goal
1 Statistics taken from Florida CHARTS for Orange County, FL 2 http://apps.ams.usda.gov/fooddeserts/foodDeserts.aspx
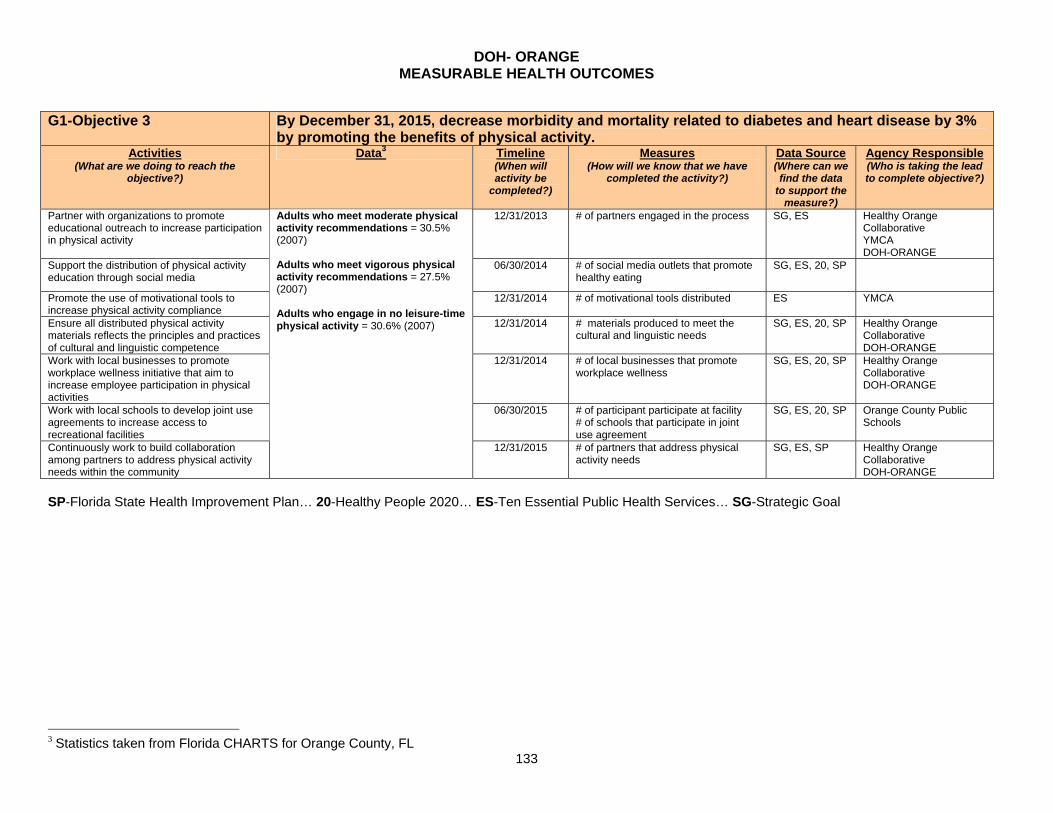
DOH- ORANGE MEASURABLE HEALTH OUTCOMES
133
G1-Objective 3 By December 31, 2015, decrease morbidity and mortality related to diabetes and heart disease by 3%
by promoting the benefits of physical activity. Activities
(What are we doing to reach the objective?)
Data3 Timeline (When will activity be
completed?)
Measures (How will we know that we have
completed the activity?)
Data Source (Where can we find the data
to support the measure?)
Agency Responsible (Who is taking the lead to complete objective?)
Partner with organizations to promote educational outreach to increase participation in physical activity
12/31/2013 # of partners engaged in the process SG, ES Healthy Orange Collaborative YMCA DOH-ORANGE
Support the distribution of physical activity education through social media
06/30/2014 # of social media outlets that promote healthy eating
SG, ES, 20, SP
Promote the use of motivational tools to increase physical activity compliance
12/31/2014 # of motivational tools distributed ES YMCA
Ensure all distributed physical activity materials reflects the principles and practices of cultural and linguistic competence
12/31/2014 # materials produced to meet the cultural and linguistic needs
SG, ES, 20, SP Healthy Orange Collaborative DOH-ORANGE
Work with local businesses to promote workplace wellness initiative that aim to increase employee participation in physical activities
12/31/2014 # of local businesses that promote workplace wellness
SG, ES, 20, SP Healthy Orange Collaborative DOH-ORANGE
Work with local schools to develop joint use agreements to increase access to recreational facilities
06/30/2015 # of participant participate at facility # of schools that participate in joint use agreement
SG, ES, 20, SP Orange County Public Schools
Continuously work to build collaboration among partners to address physical activity needs within the community
Adults who meet moderate physical activity recommendations = 30.5% (2007) Adults who meet vigorous physical activity recommendations = 27.5% (2007) Adults who engage in no leisure-time physical activity = 30.6% (2007)
12/31/2015 # of partners that address physical activity needs
SG, ES, SP Healthy Orange Collaborative DOH-ORANGE
SP-Florida State Health Improvement Plan… 20-Healthy People 2020… ES-Ten Essential Public Health Services… SG-Strategic Goal
3 Statistics taken from Florida CHARTS for Orange County, FL
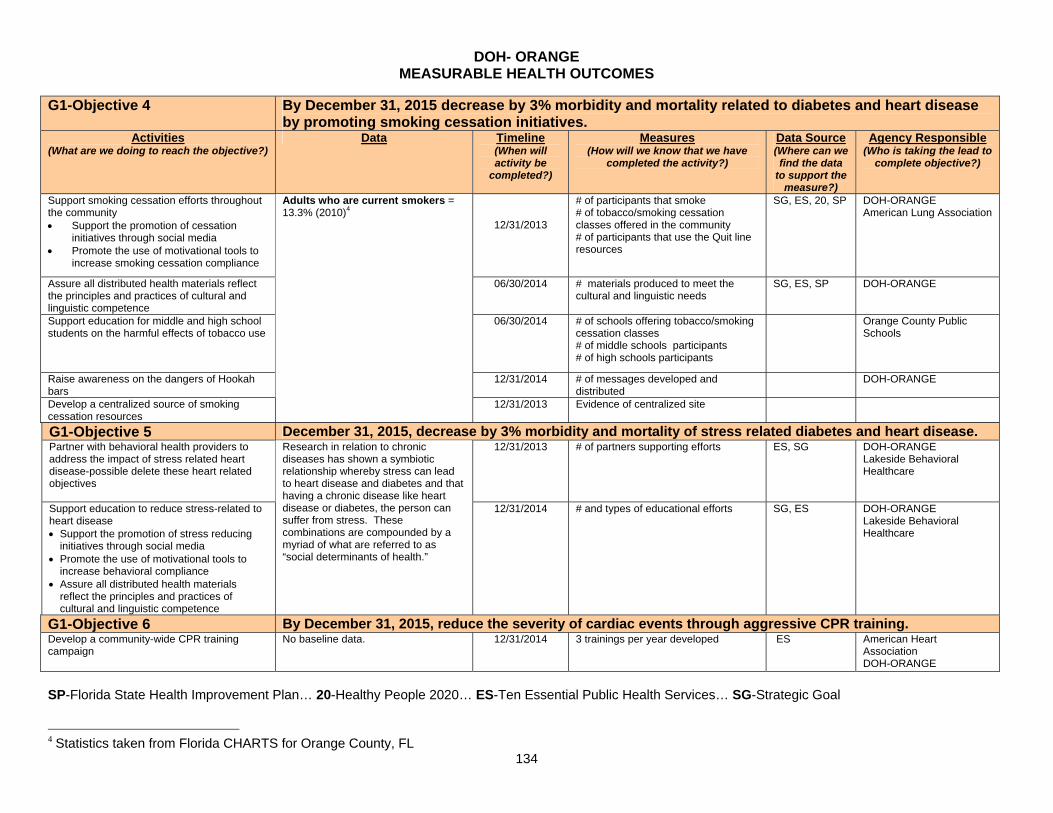
DOH- ORANGE MEASURABLE HEALTH OUTCOMES
134
G1-Objective 4 By December 31, 2015 decrease by 3% morbidity and mortality related to diabetes and heart disease by promoting smoking cessation initiatives.
Activities (What are we doing to reach the objective?)
Data Timeline (When will activity be
completed?)
Measures (How will we know that we have
completed the activity?)
Data Source (Where can we find the data
to support the measure?)
Agency Responsible (Who is taking the lead to
complete objective?)
Support smoking cessation efforts throughout the community Support the promotion of cessation
initiatives through social media Promote the use of motivational tools to
increase smoking cessation compliance
12/31/2013
# of participants that smoke # of tobacco/smoking cessation classes offered in the community # of participants that use the Quit line resources
SG, ES, 20, SP
DOH-ORANGE American Lung Association
Assure all distributed health materials reflect the principles and practices of cultural and linguistic competence
06/30/2014 # materials produced to meet the cultural and linguistic needs
SG, ES, SP DOH-ORANGE
Support education for middle and high school students on the harmful effects of tobacco use
06/30/2014 # of schools offering tobacco/smoking cessation classes # of middle schools participants # of high schools participants
Orange County Public Schools
Raise awareness on the dangers of Hookah bars
12/31/2014 # of messages developed and distributed
DOH-ORANGE
Develop a centralized source of smoking cessation resources
Adults who are current smokers = 13.3% (2010)4
12/31/2013 Evidence of centralized site
G1-Objective 5 December 31, 2015, decrease by 3% morbidity and mortality of stress related diabetes and heart disease. Partner with behavioral health providers to address the impact of stress related heart disease-possible delete these heart related objectives
12/31/2013 # of partners supporting efforts ES, SG DOH-ORANGE Lakeside Behavioral Healthcare
Support education to reduce stress-related to heart disease Support the promotion of stress reducing
initiatives through social media Promote the use of motivational tools to
increase behavioral compliance Assure all distributed health materials
reflect the principles and practices of cultural and linguistic competence
Research in relation to chronic diseases has shown a symbiotic relationship whereby stress can lead to heart disease and diabetes and that having a chronic disease like heart disease or diabetes, the person can suffer from stress. These combinations are compounded by a myriad of what are referred to as “social determinants of health.”
12/31/2014 # and types of educational efforts SG, ES DOH-ORANGE Lakeside Behavioral Healthcare
G1-Objective 6 By December 31, 2015, reduce the severity of cardiac events through aggressive CPR training. Develop a community-wide CPR training campaign
No baseline data. 12/31/2014 3 trainings per year developed ES American Heart Association DOH-ORANGE
SP-Florida State Health Improvement Plan… 20-Healthy People 2020… ES-Ten Essential Public Health Services… SG-Strategic Goal 4 Statistics taken from Florida CHARTS for Orange County, FL
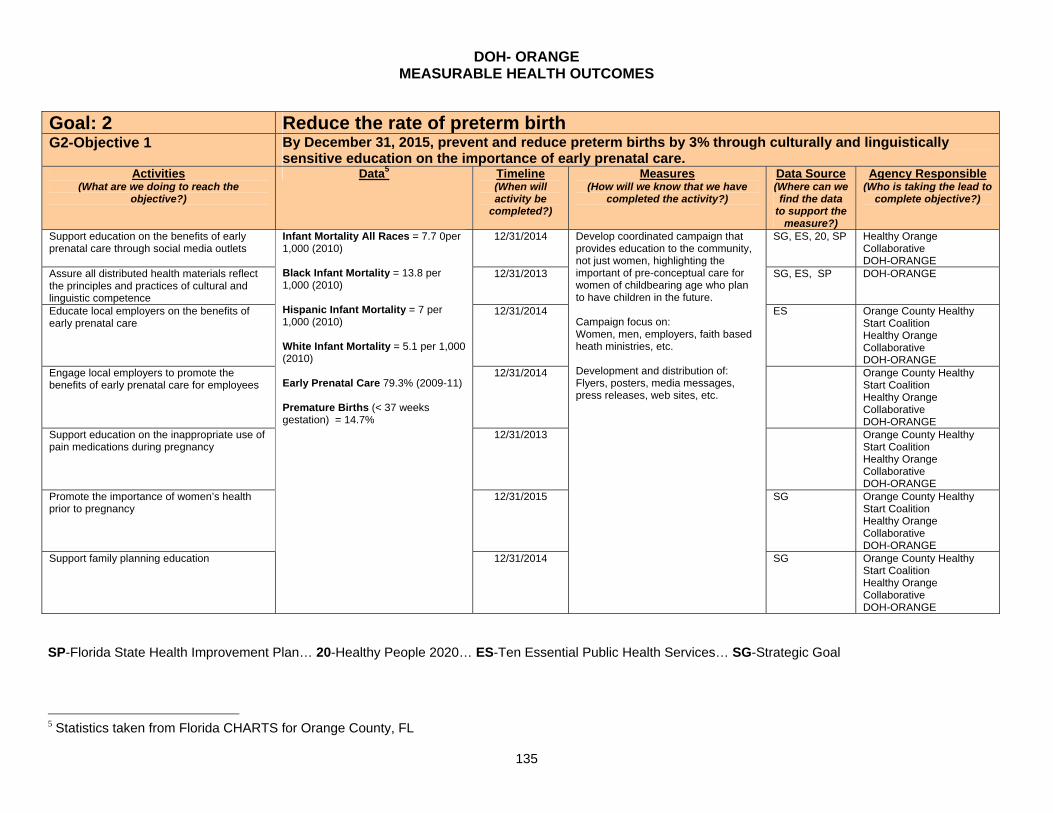
DOH- ORANGE MEASURABLE HEALTH OUTCOMES
135
Goal: 2 Reduce the rate of preterm birth G2-Objective 1 By December 31, 2015, prevent and reduce preterm births by 3% through culturally and linguistically
sensitive education on the importance of early prenatal care. Activities
(What are we doing to reach the objective?)
Data5 Timeline (When will activity be
completed?)
Measures (How will we know that we have
completed the activity?)
Data Source (Where can we find the data
to support the measure?)
Agency Responsible (Who is taking the lead to
complete objective?)
Support education on the benefits of early prenatal care through social media outlets
12/31/2014 SG, ES, 20, SP Healthy Orange Collaborative DOH-ORANGE
Assure all distributed health materials reflect the principles and practices of cultural and linguistic competence
12/31/2013 SG, ES, SP DOH-ORANGE
Educate local employers on the benefits of early prenatal care
12/31/2014 ES Orange County Healthy Start Coalition Healthy Orange Collaborative DOH-ORANGE
Engage local employers to promote the benefits of early prenatal care for employees
12/31/2014 Orange County Healthy Start Coalition Healthy Orange Collaborative DOH-ORANGE
Support education on the inappropriate use of pain medications during pregnancy
12/31/2013 Orange County Healthy Start Coalition Healthy Orange Collaborative DOH-ORANGE
Promote the importance of women’s health prior to pregnancy
12/31/2015 SG Orange County Healthy Start Coalition Healthy Orange Collaborative DOH-ORANGE
Support family planning education
Infant Mortality All Races = 7.7 0per 1,000 (2010) Black Infant Mortality = 13.8 per 1,000 (2010) Hispanic Infant Mortality = 7 per 1,000 (2010) White Infant Mortality = 5.1 per 1,000 (2010) Early Prenatal Care 79.3% (2009-11)
Premature Births (< 37 weeks gestation) = 14.7%
12/31/2014
Develop coordinated campaign that provides education to the community, not just women, highlighting the important of pre-conceptual care for women of childbearing age who plan to have children in the future. Campaign focus on: Women, men, employers, faith based heath ministries, etc. Development and distribution of: Flyers, posters, media messages, press releases, web sites, etc.
SG Orange County Healthy Start Coalition Healthy Orange Collaborative DOH-ORANGE
SP-Florida State Health Improvement Plan… 20-Healthy People 2020… ES-Ten Essential Public Health Services… SG-Strategic Goal
5 Statistics taken from Florida CHARTS for Orange County, FL
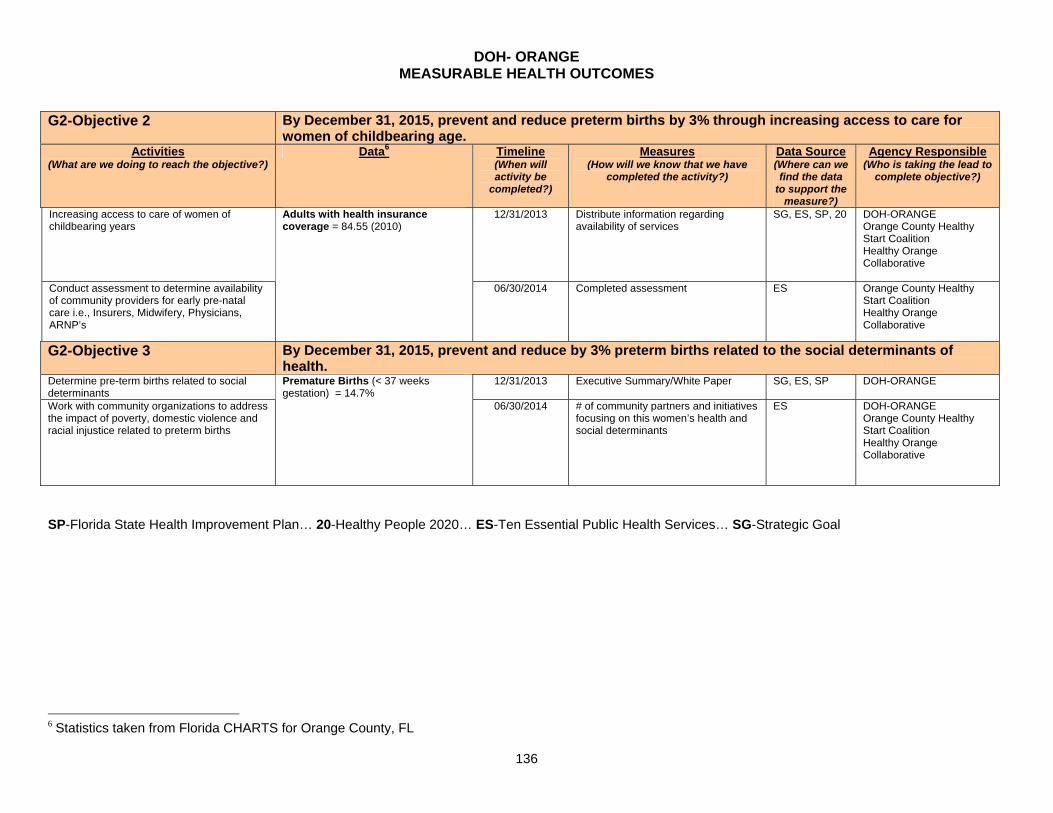
DOH- ORANGE MEASURABLE HEALTH OUTCOMES
136
G2-Objective 2 By December 31, 2015, prevent and reduce preterm births by 3% through increasing access to care for
women of childbearing age. Activities
(What are we doing to reach the objective?) Data6 Timeline
(When will activity be
completed?)
Measures (How will we know that we have
completed the activity?)
Data Source (Where can we find the data
to support the measure?)
Agency Responsible (Who is taking the lead to
complete objective?)
Increasing access to care of women of childbearing years
12/31/2013 Distribute information regarding availability of services
SG, ES, SP, 20 DOH-ORANGE Orange County Healthy Start Coalition Healthy Orange Collaborative
Conduct assessment to determine availability of community providers for early pre-natal care i.e., Insurers, Midwifery, Physicians, ARNP’s
Adults with health insurance coverage = 84.55 (2010)
06/30/2014 Completed assessment ES Orange County Healthy
Start Coalition Healthy Orange Collaborative
G2-Objective 3 By December 31, 2015, prevent and reduce by 3% preterm births related to the social determinants of health.
Determine pre-term births related to social determinants
12/31/2013 Executive Summary/White Paper SG, ES, SP DOH-ORANGE
Work with community organizations to address the impact of poverty, domestic violence and racial injustice related to preterm births
Premature Births (< 37 weeks gestation) = 14.7%
06/30/2014 # of community partners and initiatives focusing on this women’s health and social determinants
ES DOH-ORANGE Orange County Healthy Start Coalition Healthy Orange Collaborative
SP-Florida State Health Improvement Plan… 20-Healthy People 2020… ES-Ten Essential Public Health Services… SG-Strategic Goal
6 Statistics taken from Florida CHARTS for Orange County, FL
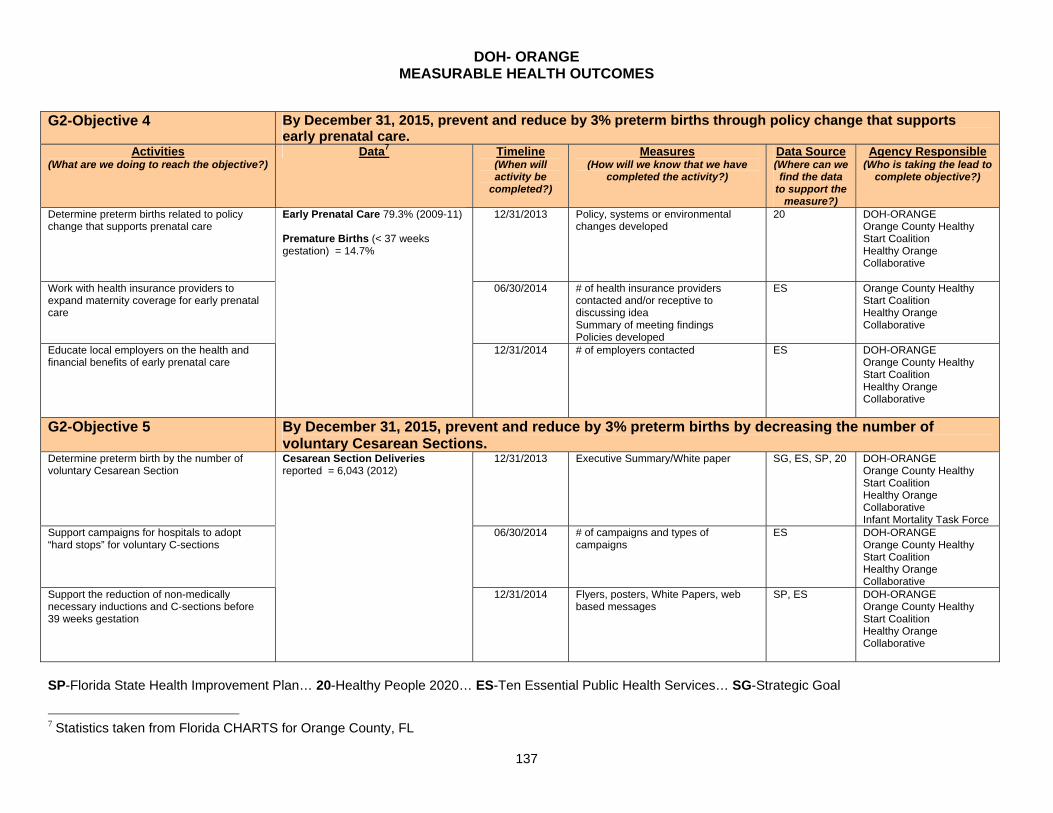
DOH- ORANGE MEASURABLE HEALTH OUTCOMES
137
G2-Objective 4 By December 31, 2015, prevent and reduce by 3% preterm births through policy change that supports
early prenatal care. Activities
(What are we doing to reach the objective?) Data7 Timeline
(When will activity be
completed?)
Measures (How will we know that we have
completed the activity?)
Data Source (Where can we find the data
to support the measure?)
Agency Responsible (Who is taking the lead to
complete objective?)
Determine preterm births related to policy change that supports prenatal care
12/31/2013 Policy, systems or environmental changes developed
20 DOH-ORANGE Orange County Healthy Start Coalition Healthy Orange Collaborative
Work with health insurance providers to expand maternity coverage for early prenatal care
06/30/2014 # of health insurance providers contacted and/or receptive to discussing idea Summary of meeting findings Policies developed
ES Orange County Healthy Start Coalition Healthy Orange Collaborative
Educate local employers on the health and financial benefits of early prenatal care
Early Prenatal Care 79.3% (2009-11) Premature Births (< 37 weeks gestation) = 14.7%
12/31/2014 # of employers contacted ES DOH-ORANGE Orange County Healthy Start Coalition Healthy Orange Collaborative
G2-Objective 5 By December 31, 2015, prevent and reduce by 3% preterm births by decreasing the number of voluntary Cesarean Sections.
Determine preterm birth by the number of voluntary Cesarean Section
12/31/2013 Executive Summary/White paper SG, ES, SP, 20 DOH-ORANGE Orange County Healthy Start Coalition Healthy Orange Collaborative Infant Mortality Task Force
Support campaigns for hospitals to adopt “hard stops” for voluntary C-sections
06/30/2014 # of campaigns and types of campaigns
ES DOH-ORANGE Orange County Healthy Start Coalition Healthy Orange Collaborative
Support the reduction of non-medically necessary inductions and C-sections before 39 weeks gestation
Cesarean Section Deliveries reported = 6,043 (2012)
12/31/2014 Flyers, posters, White Papers, web based messages
SP, ES DOH-ORANGE Orange County Healthy Start Coalition Healthy Orange Collaborative
SP-Florida State Health Improvement Plan… 20-Healthy People 2020… ES-Ten Essential Public Health Services… SG-Strategic Goal
7 Statistics taken from Florida CHARTS for Orange County, FL
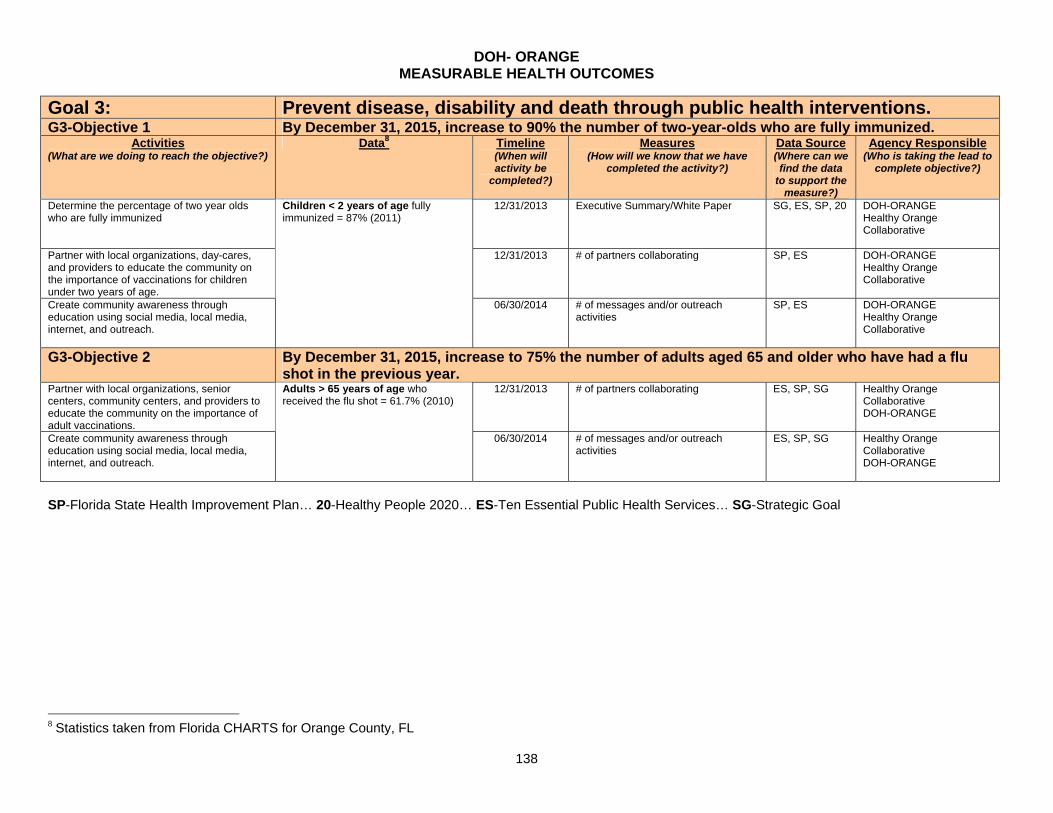
DOH- ORANGE MEASURABLE HEALTH OUTCOMES
138
Goal 3: Prevent disease, disability and death through public health interventions. G3-Objective 1 By December 31, 2015, increase to 90% the number of two-year-olds who are fully immunized.
Activities (What are we doing to reach the objective?)
Data8 Timeline (When will activity be
completed?)
Measures (How will we know that we have
completed the activity?)
Data Source (Where can we find the data
to support the measure?)
Agency Responsible (Who is taking the lead to
complete objective?)
Determine the percentage of two year olds who are fully immunized
12/31/2013 Executive Summary/White Paper SG, ES, SP, 20 DOH-ORANGE Healthy Orange Collaborative
Partner with local organizations, day-cares, and providers to educate the community on the importance of vaccinations for children under two years of age.
12/31/2013 # of partners collaborating SP, ES DOH-ORANGE Healthy Orange Collaborative
Create community awareness through education using social media, local media, internet, and outreach.
Children < 2 years of age fully immunized = 87% (2011)
06/30/2014 # of messages and/or outreach activities
SP, ES DOH-ORANGE Healthy Orange Collaborative
G3-Objective 2 By December 31, 2015, increase to 75% the number of adults aged 65 and older who have had a flu shot in the previous year.
Partner with local organizations, senior centers, community centers, and providers to educate the community on the importance of adult vaccinations.
12/31/2013 # of partners collaborating ES, SP, SG Healthy Orange Collaborative DOH-ORANGE
Create community awareness through education using social media, local media, internet, and outreach.
Adults > 65 years of age who received the flu shot = 61.7% (2010)
06/30/2014 # of messages and/or outreach activities
ES, SP, SG Healthy Orange Collaborative DOH-ORANGE
SP-Florida State Health Improvement Plan… 20-Healthy People 2020… ES-Ten Essential Public Health Services… SG-Strategic Goal
8 Statistics taken from Florida CHARTS for Orange County, FL
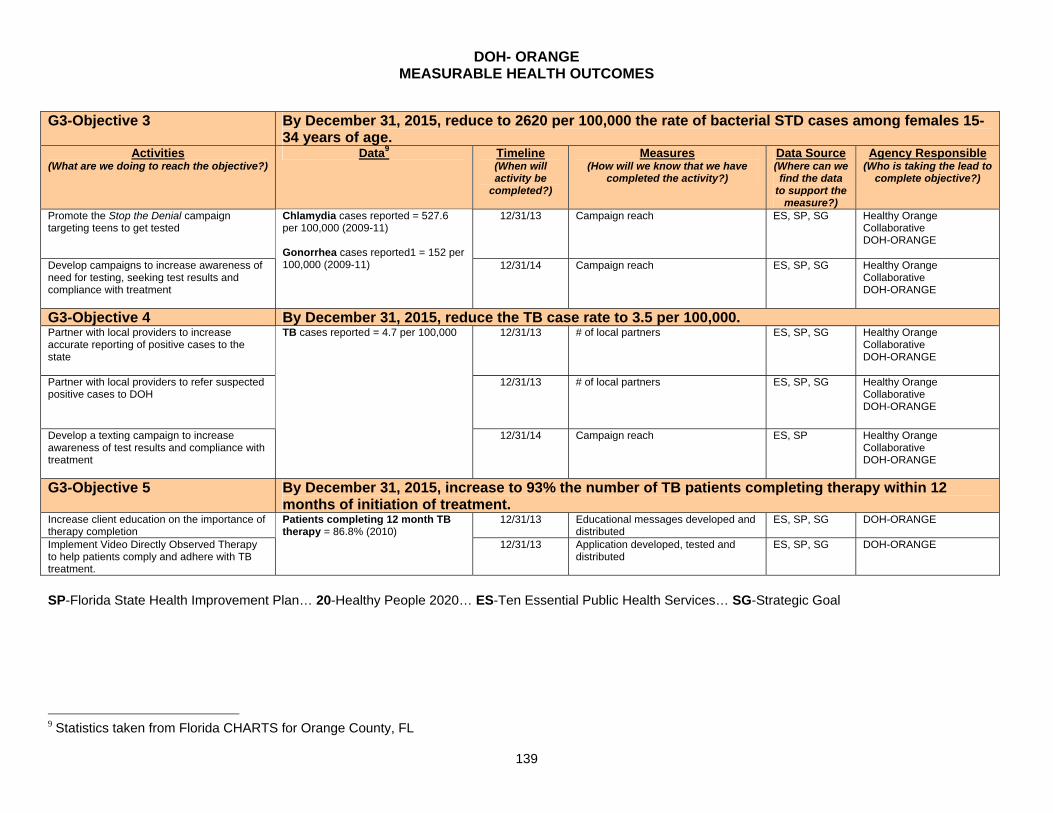
DOH- ORANGE MEASURABLE HEALTH OUTCOMES
139
G3-Objective 3 By December 31, 2015, reduce to 2620 per 100,000 the rate of bacterial STD cases among females 15-
34 years of age. Activities
(What are we doing to reach the objective?) Data9 Timeline
(When will activity be
completed?)
Measures (How will we know that we have
completed the activity?)
Data Source (Where can we find the data
to support the measure?)
Agency Responsible (Who is taking the lead to
complete objective?)
Promote the Stop the Denial campaign targeting teens to get tested
12/31/13 Campaign reach ES, SP, SG Healthy Orange Collaborative DOH-ORANGE
Develop campaigns to increase awareness of need for testing, seeking test results and compliance with treatment
Chlamydia cases reported = 527.6 per 100,000 (2009-11) Gonorrhea cases reported1 = 152 per 100,000 (2009-11) 12/31/14 Campaign reach ES, SP, SG Healthy Orange
Collaborative DOH-ORANGE
G3-Objective 4 By December 31, 2015, reduce the TB case rate to 3.5 per 100,000. Partner with local providers to increase accurate reporting of positive cases to the state
12/31/13 # of local partners ES, SP, SG Healthy Orange Collaborative DOH-ORANGE
Partner with local providers to refer suspected positive cases to DOH
12/31/13 # of local partners ES, SP, SG Healthy Orange Collaborative DOH-ORANGE
Develop a texting campaign to increase awareness of test results and compliance with treatment
TB cases reported = 4.7 per 100,000
12/31/14 Campaign reach ES, SP Healthy Orange Collaborative DOH-ORANGE
G3-Objective 5 By December 31, 2015, increase to 93% the number of TB patients completing therapy within 12 months of initiation of treatment.
Increase client education on the importance of therapy completion
12/31/13 Educational messages developed and distributed
ES, SP, SG DOH-ORANGE
Implement Video Directly Observed Therapy to help patients comply and adhere with TB treatment.
Patients completing 12 month TB therapy = 86.8% (2010)
12/31/13 Application developed, tested and distributed
ES, SP, SG DOH-ORANGE
SP-Florida State Health Improvement Plan… 20-Healthy People 2020… ES-Ten Essential Public Health Services… SG-Strategic Goal
9 Statistics taken from Florida CHARTS for Orange County, FL
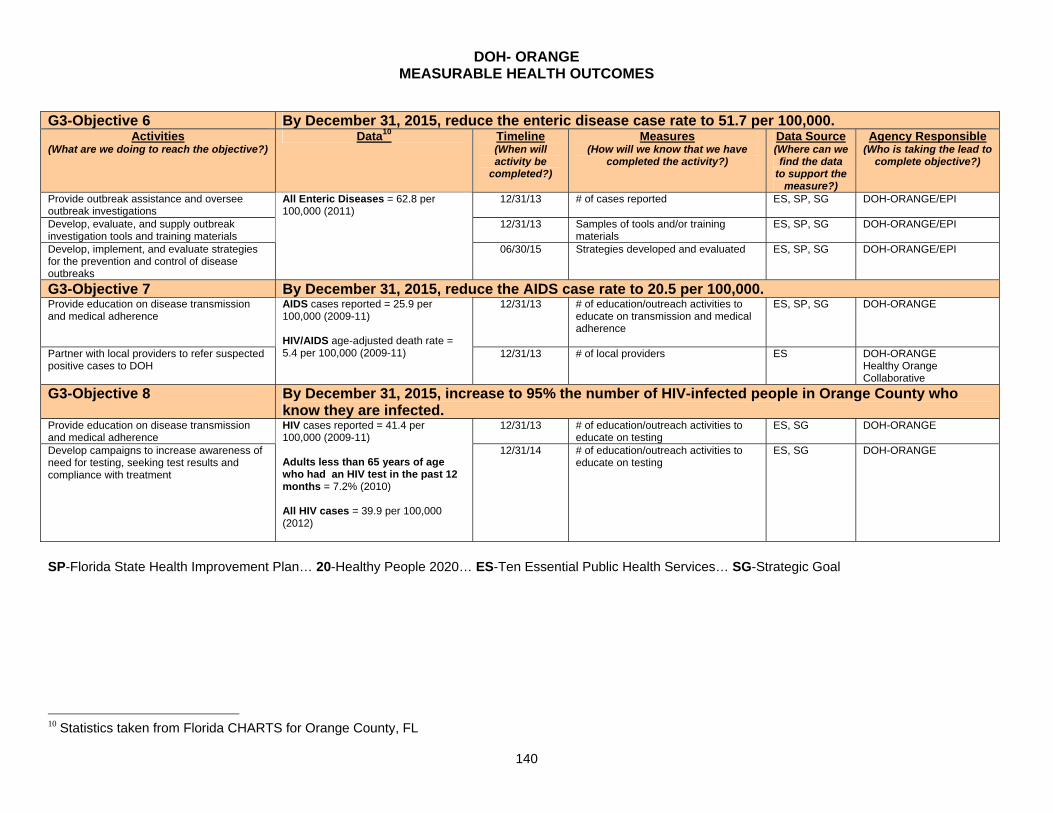
DOH- ORANGE MEASURABLE HEALTH OUTCOMES
140
G3-Objective 6 By December 31, 2015, reduce the enteric disease case rate to 51.7 per 100,000.
Activities (What are we doing to reach the objective?)
Data10 Timeline (When will activity be
completed?)
Measures (How will we know that we have
completed the activity?)
Data Source (Where can we find the data
to support the measure?)
Agency Responsible (Who is taking the lead to
complete objective?)
Provide outbreak assistance and oversee outbreak investigations
12/31/13 # of cases reported ES, SP, SG DOH-ORANGE/EPI
Develop, evaluate, and supply outbreak investigation tools and training materials
12/31/13 Samples of tools and/or training materials
ES, SP, SG DOH-ORANGE/EPI
Develop, implement, and evaluate strategies for the prevention and control of disease outbreaks
All Enteric Diseases = 62.8 per 100,000 (2011) 06/30/15 Strategies developed and evaluated ES, SP, SG DOH-ORANGE/EPI
G3-Objective 7 By December 31, 2015, reduce the AIDS case rate to 20.5 per 100,000. Provide education on disease transmission and medical adherence
12/31/13 # of education/outreach activities to educate on transmission and medical adherence
ES, SP, SG DOH-ORANGE
Partner with local providers to refer suspected positive cases to DOH
AIDS cases reported = 25.9 per 100,000 (2009-11) HIV/AIDS age-adjusted death rate = 5.4 per 100,000 (2009-11) 12/31/13 # of local providers ES DOH-ORANGE
Healthy Orange Collaborative
G3-Objective 8 By December 31, 2015, increase to 95% the number of HIV-infected people in Orange County who know they are infected.
Provide education on disease transmission and medical adherence
12/31/13 # of education/outreach activities to educate on testing
ES, SG DOH-ORANGE
Develop campaigns to increase awareness of need for testing, seeking test results and compliance with treatment
HIV cases reported = 41.4 per 100,000 (2009-11) Adults less than 65 years of age who had an HIV test in the past 12 months = 7.2% (2010) All HIV cases = 39.9 per 100,000 (2012)
12/31/14 # of education/outreach activities to educate on testing
ES, SG DOH-ORANGE
SP-Florida State Health Improvement Plan… 20-Healthy People 2020… ES-Ten Essential Public Health Services… SG-Strategic Goal
10 Statistics taken from Florida CHARTS for Orange County, FL