Chinese Economy
17
Chinese Economy China’s Economy in Pictures Tutor2u, November 2007
-
Upload
traugott-nigel -
Category
Documents
-
view
32 -
download
0
description
Chinese Economy. China’s Economy in Pictures Tutor2u, November 2007. - PowerPoint PPT Presentation
Transcript of Chinese Economy

Chinese Economy
China’s Economy in Pictures
Tutor2u, November 2007

Annual percentage change in real national output
Growth Rates for selected Countries
Source: Reuters EcoWin
00 01 02 03 04 05 06 07
0
1
2
3
4
5
6
7
8
9
10
11
12
Per
cent
0
1
2
3
4
5
6
7
8
9
10
11
12
USA
India
UK
China

Annual percentage change in consumer prices
China - Consumer Price Inflation
Source: Reuters EcoWin
95 96 97 98 99 00 01 02 03 04 05 06 07
Per
cent
-14.0
-12.0
-10.0
-8.0
-6.0
-4.0
-2.0
0.0
2.0
4.0
6.0

US dollars, billions
China - Balance of payments - Current Account
Source: Reuters EcoWin
86 87 88 89 90 91 92 93 94 95 96 97 98 99 00 01 02 03 04 05 06
US
Dol
lars
(bi
llions
)
-50
0
50
100
150
200
250
Annual current account balances - $ billion, source: IMF
Current account of the BoP for China and the USA
Source: Reuters EcoWin
90 91 92 93 94 95 96 97 98 99 00 01 02 03 04 05 06
US
Dol
lars
(bi
llions
)
-900
-800
-700
-600
-500
-400
-300
-200
-100
0
100
200
300
China
USA
United States -811.486G
China 249.866G

Monthly output of cars
China's Production of Motor Vehicles
Source: Reuters EcoWin
00 01 02 03 04 05 06 07
0
50000
100000
150000
200000
250000
300000
350000
400000
450000
500000
Uni
ts
0
50000
100000
150000
200000
250000
300000
350000
400000
450000
500000

Average of daily rates, Chinese Yuan /US Dollar exchange rate monthly average
China - US$ exchange rate
Source: Reuters EcoWin
95 96 97 98 99 00 01 02 03 04 05 06 07
CN
Y/U
SD
7.5
7.6
7.7
7.8
7.9
8.0
8.1
8.2
8.3
8.4
8.5

Annual percentage change in the volume of exports
China's Export Boom
Source: Reuters EcoWin
89 90 91 92 93 94 95 96 97 98 99 00 01 02 03 04 05 06 07 08
-10
-5
0
5
10
15
20
25
Per
cent
-10
-5
0
5
10
15
20
25

Billions of US dollars
China's Mountain of Foreign Currency Reserves
Source: Reuters EcoWin
90 91 92 93 94 95 96 97 98 99 00 01 02 03 04 05 06 07
thou
sand
billi
ons
0.00
0.25
0.50
0.75
1.00
1.25
1.50
US
$s
(tho
usa
nd b
illion
s)
0.00
0.25
0.50
0.75
1.00
1.25
1.50

Yuan, trillion (trillion = thousand billion)
China's Net Foreign Assets
Source: Reuters EcoWin
00 01 02 03 04 05 06
thou
sand
billi
ons
0
1
2
3
4
5
6
7
8
9
10
11
Nat
iona
l Cur
renc
y (t
hous
and
billio
ns)
0
1
2
3
4
5
6
7
8
9
10
11

Mid year population, billions of people
The Challenge of Population Shift
Source: Reuters EcoWin
90 91 92 93 94 95 96 97 98 99 00 01 02 03 04 05 06
Per
son
(billi
ons
)
0.3
0.4
0.5
0.6
0.7
0.8
0.9
1.0
1.1
1.2
1.3
1.4
Total
Rural population
Urban population
Population, rural, total 737.42M
Population, total 1.31448G
Population, urban, total 577.06M
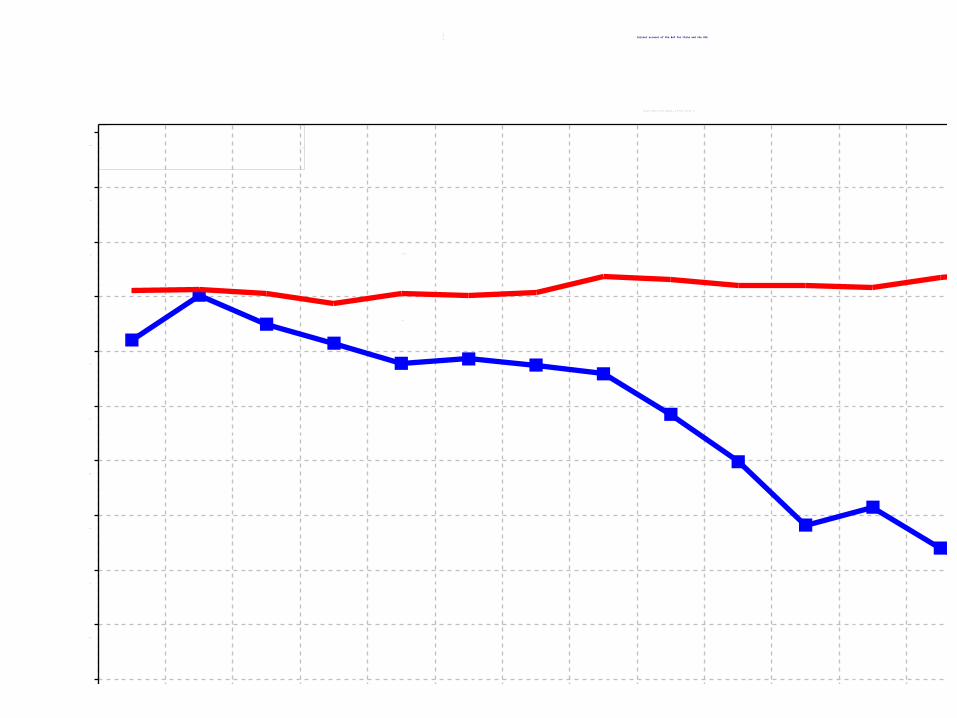
Annual data, $ billion
China - Balance of Trade In Goods in Services
Goods and Services Goods
Source: Reuters EcoWin
90 91 92 93 94 95 96 97 98 99 00 01 02 03 04 05 06
US
D (
billio
ns)
-25
0
25
50
75
100
125
150
175
200
225
Trade in goods
Trade in goods and services

Net investment income from external assets, $ billion
China - Net Investment Income
Source: Reuters EcoWin
97 98 99 00 01 02 03 04 05 06
US
D (
billio
ns)
-20
-15
-10
-5
0
5
10
15

Millions of tonnes per month, seasonally adjusted
China - Cargo handled at ports
Source: Reuters EcoWin
90 91 92 93 94 95 96 97 98 99 00 01 02 03 04 05 06 07
tonn
es (
milli
ons)
0
50
100
150
200
250
300
350
China, Component series, Cargo handled at ports, Original series, Cargo handled at ports, SA 326.926M

Quarterly current account balance in $ billions
United States - Current Account Deficit with China
Source: Reuters EcoWin
90 91 92 93 94 95 96 97 98 99 00 01 02 03 04 05 06 07
US
D (
billio
ns)
-70
-60
-50
-40
-30
-20
-10
0

percentage of the labour force
China, Unemployment, Urban area, rate
Source: Reuters EcoWin
85 86 87 88 89 90 91 92 93 94 95 96 97 98 99 00 01 02 03 04 05 06
Per
cent
1.5
2.0
2.5
3.0
3.5
4.0
4.5

Per cent
China - One Year Lending Interest Rate
Source: Reuters EcoWin
95 96 97 98 99 00 01 02 03 04 05 06 07 08
Per
cent
5
6
7
8
9
10
11
12
13