China cosmetics market report, 2014 2017
16
China Cosmetics Market Report, 2014-2017 Feb. 2015
-
Upload
researchinchina -
Category
Data & Analytics
-
view
435 -
download
0
Transcript of China cosmetics market report, 2014 2017
China Cosmetics Market Report, 2014-2017
Feb. 2015
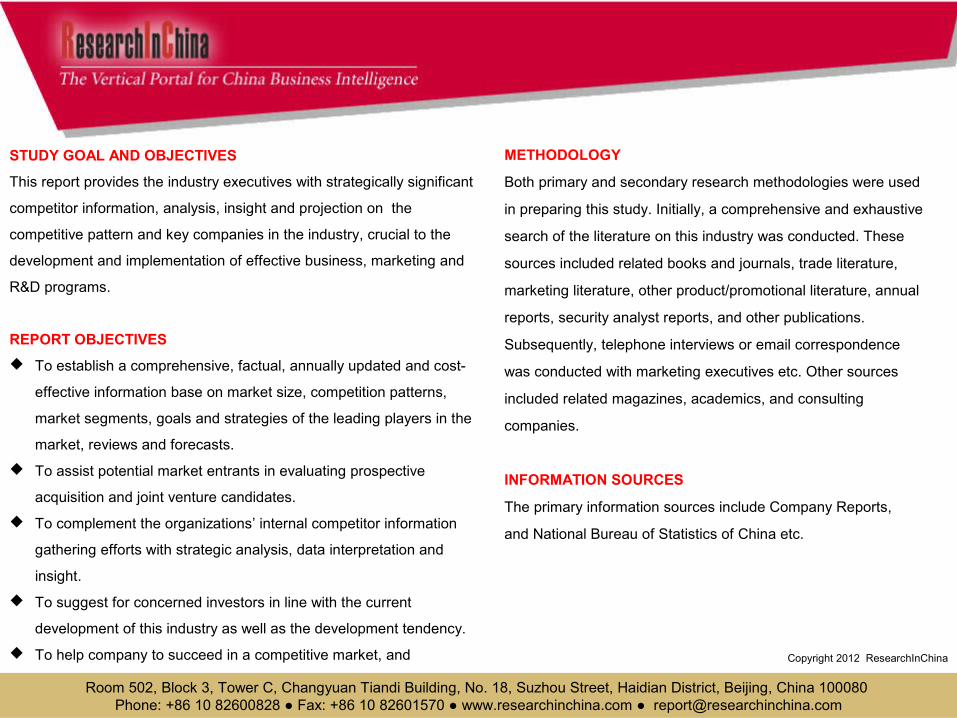
METHODOLOGY
Both primary and secondary research methodologies were used
in preparing this study. Initially, a comprehensive and exhaustive
search of the literature on this industry was conducted. These
sources included related books and journals, trade literature,
marketing literature, other product/promotional literature, annual
reports, security analyst reports, and other publications.
Subsequently, telephone interviews or email correspondence
was conducted with marketing executives etc. Other sources
included related magazines, academics, and consulting
companies.
INFORMATION SOURCES
The primary information sources include Company Reports,
and National Bureau of Statistics of China etc.
STUDY GOAL AND OBJECTIVES
This report provides the industry executives with strategically significant
competitor information, analysis, insight and projection on the
competitive pattern and key companies in the industry, crucial to the
development and implementation of effective business, marketing and
R&D programs.
REPORT OBJECTIVES
To establish a comprehensive, factual, annually updated and cost-
effective information base on market size, competition patterns,
market segments, goals and strategies of the leading players in the
market, reviews and forecasts.
To assist potential market entrants in evaluating prospective
acquisition and joint venture candidates.
To complement the organizations’ internal competitor information
gathering efforts with strategic analysis, data interpretation and
insight.
To suggest for concerned investors in line with the current
development of this industry as well as the development tendency.
To help company to succeed in a competitive market, and
understand the size and growth rate of any opportunity.
Room 502, Block 3, Tower C, Changyuan Tiandi Building, No. 18, Suzhou Street, Haidian District, Beijing, China 100080 Phone: +86 10 82600828 ● Fax: +86 10 82601570 ● www.researchinchina.com ● [email protected]
Copyright 2012 ResearchInChina
Abstract
China’s cosmetics market has been booming in recent years and already become the world’s second largest cosmetics consumer Market second only to America, with annual volume of retail sales approximating RMB200 billion. In 2014, influenced by such factors as the economic slowdown, China’s cosmetics market registered
the lowest growth rate (12.3%) since 2005; the total volume of retail sales of enterprises (each with annual revenue of above RMB20 million) dropped to RMB172.47 billion.
However, as consumers are in constant pursuit of beauty, cosmetics
marketing channels are increasingly mature plus the unceasing Release of demand from second- and third-tier cities in China, the Chinese cosmetics market will continue to maintain steady growth in the future, with the total volume of retail sales of enterprises (each with annual revenue of above RMB20 million) expected to be RMB245.3 billion by 2017.
China’s cosmetics market has been booming in recent years and already become the world’s second largest cosmetics consumer Market second only to America, with annual volume of retail sales approximating RMB200 billion. In 2014, influenced by such factors as the economic slowdown, China’s cosmetics market registered
the lowest growth rate (12.3%) since 2005; the total volume of retail sales of enterprises (each with annual revenue of above RMB20 million) dropped to RMB172.47 billion. Room 502, Block 3, Tower C, Changyuan Tiandi Building, No. 18, Suzhou Street, Haidian District, Beijing, China 100080
Phone: +86 10 82600828 ● Fax: +86 10 82601570 ● www.researchinchina.com ● [email protected]
Copyright 2012ResearchInChina
However, as consumers are in constant pursuit of beauty, cosmetics marketing channels are increasingly mature plus the unceasing release of demand from second- and third-tier cities in China, the Chinese cosmetics market will continue to maintain steady growth in the future, with the total volume of retail sales of enterprises (each with annual revenue of above RMB20 million) expected to be RMB245.3 billion by 2017.
Skin care and make-ups account for the largest share of cosmetics consumption in China, with total volume of retail sales representing a combined 61.2% in 2013, of which skin care products ranked first with a proportion of 48.0%. In addition, the change of men’s skin care concept has led to a constant release of men’s cosmetics market with total volume of retail sales accounting for 4.6% in 2013, and in the future the proportion will be further raised.
So far, foreign-funded enterprises still play a dominant role in China’s cosmetics market, accounting for roughly 86% of the total volume of retail sales. To cater to the demand of Chinese cosmetics consumers and improve their market share in the China, L'Oreal, Estee Lauder, Procter & Gamble, Shiseido and other foreign companies have constantly adjusted brand strategies and intensified the building of channels. Meanwhile, Chinese domestic companies led by Jahwa and Marubi are also stepping up the layout of cosmetics market.
L'Oreal is the world’s largest cosmetics company. In 2013 it recorded revenue of EUR21.288 billion in cosmetics business, a yr-on-yr rise of 2.3%. In recent years, L'Oreal has constantly adjusted its brand strategy in China: re-introduction of Inneov oral medical cosmetics which was withdrawn from China in early 2013; a full suspension of Garnier in China in 2014.
As one of the world’s major cosmetics companies, Estee Lauder is engaged in skin care and make-ups. As of January 2015, it has 124 counters in 51 Chinese cities. Besides, it authorized T-mall, an e-commerce website, for the first time in May 2014 to develop China’s e-commerce channel market. Shanghai Jahwa, a major listed cosmetics company in China, has SIX GOD, MAXAM, HERBORIST, gf and other priority brands. In early 2015 it embarked on the Qingpu Base Removal Project worth a total of RMB1.355 billion, expected to be put into production in 2018; the new plant can undertake an estimated 130,000-ton configuration production and 600-million-piece filling production.
As one of China’s leading cosmetics companies, MARUBI focuses on facial and eye skin care products, in possession of MARUBI and HARUKI brand. In July 2013, it received LCapitalAsia investment from Louis Vuitton Mo?t Hennessy (LVHM); in June 2014, it planned IPO placement and implementation of cosmetics production and construction project, which could expand the company’s existing capacity by 160% once reaching designed capacity.
China Cosmetics Market Report, 2014-2017 highlights the followings:China’s cosmetics market size, import and export, product structure, channel structure, regional structure, tariff policy, etc.;Development status, market size and development trend of major cosmetics channels e.g. department store, supermarket, franchised store, e-commerce, direct marketing;Market size, competition pattern, channel development of major cosmetics segments e.g. skin care, make-ups, perfume, men’s cosmetics, infant & child care products; Operation and development-in-China of 4 global cosmetics companies;Operation, development strategy, etc. of 12 Chinese cosmetics companies.
Room 502, Block 3, Tower C, Changyuan Tiandi Building, No. 18, Suzhou Street, Haidian District, Beijing, China 100080 Phone: +86 10 82600828 ● Fax: +86 10 82601570 ● www.researchinchina.com ● [email protected]
Copyright 2012ResearchInChina
Room 502, Block 3, Tower C, Changyuan Tiandi Building, No. 18, Suzhou Street, Haidian District, Beijing, China 100080 Phone: +86 10 82600828 ● Fax: +86 10 82601570 ● www.researchinchina.com ● [email protected]
Copyright 2012ResearchInChina
1. Overview
1.1 Definition
1.2 Classification
2. Development of China Cosmetics Market
2.1 Market Size
2.2 Import and Export
2.2.1 Export
2.2.2 Import
2.3 Product Structure
2.4 Channel Structure
2.5 Regional Structure
2.6 Enterprise Pattern
2.7 Duties and Policies
3. Cosmetics Market Channels
3.1 Department Store
3.1.2 Characteristics
3.1.2 Mode of Operation
3.1.3 Development Trend
3.2 Supermarket
3.2.1 Development Status
3.2.2 Development Trend
3.3 Franchised Store
3.3.1 Development Status
3.3.2 Mode of Channel Development
3.3.3 Development Trend
Table of contents
Room 502, Block 3, Tower C, Changyuan Tiandi Building, No. 18, Suzhou Street, Haidian District, Beijing, China 100080 Phone: +86 10 82600828 ● Fax: +86 10 82601570 ● www.researchinchina.com ● [email protected]
3.4 E-commerce
3.4.1 Market Size
3.4.2 E-commerce Pattern
3.4.3 Main E-commerce
3.5 Others
3.5.1 Direct Marketing
3.5.2 Drugstore
4. Cosmetics Market Segments
4.1 Skin Care
4.1.1 Market Size
4.1.2 Market Structure
4.1.3 Competition Pattern
4.1.4 Mass Products
4.2 Make-ups
4.2.1 Market Status
4.2.2 Brand Pattern
4.2.3 Developments of Multinational Enterprises
4.3 Perfume
4.3.1 Consumption Status
4.3.2 Competition Pattern
4.3.3 Import and Export
4.3.4 Channel
5. Other Emerging Market Segments
5.1 Men's Cosmetics
5.1.1 Market Size
5.1.2 Market Structure
5.1.3 Competition Pattern
5.1.4 Channel
5.1.5 Market Characteristics
5.2 Cosmeceuticals
5.2.1 Market Status
5.2.2 Major Enterprise
5.2.3 Channel
5.3 Infant & Child Care Product
5.3.1 Development Status
5.3.2 Industry Structure
5.3.3 Channel
6. Major Cosmetics Companies Worldwide
6.1 L'Oreal
6.1.1 Profile
6.1.2 Operation
6.1.3 Revenue Structure
6.1.4 R&D
6.1.5 Cosmetics Business
6.1.6 Development in China
6.2 Estee Lauder
6.2.1 Profile
6.2.2 Operation
6.2.3 Revenue Structure
6.2.4 R&D
6.2.5 Distribution Channel
6.2.6 Development in China
6.3 Procter & Gamble
6.3.1 Profile
6.3.2 Operation
6.3.3 Revenue Structure
6.3.4 Gross Margin
6.3.5 R&D
6.3.6 Cosmetics Business
6.3.7 Channel
6.3.8 Development in China
6.4 Shiseido
6.4.1 Profile
6.4.2 Operation
6.4.3 Revenue Structure
6.4.4 Channel
6.4.5 R&D
6.4.6 Cosmetics Business
6.4.7 Development in China
7. Major Cosmetic Companies in China
7.1 Shanghai Jahwa United Co., Ltd. (600315)
7.1.1 Profile
7.1.2 Operation
7.1.3 Revenue Structure
7.1.4 Gross Margin
7.1.5 Channel
7.1.6 Brand
7.1.7 Development Prospect
Table of contents
Room 502, Block 3, Tower C, Changyuan Tiandi Building, No. 18, Suzhou Street, Haidian District, Beijing, China 100080 Phone: +86 10 82600828 ● Fax: +86 10 82601570 ● www.researchinchina.com ● [email protected]
7.2 Jiangsu LONGLIQI Bio-Science Co., Ltd. (Longrich)
7.2.1 Profile
7.2.2 Operation
7.2.3 Channel
7.3 Shanghai Inoherb Cosmetics Co., Ltd.
7.3.1 Profile
7.3.2 Operation
7.3.3 Revenue Structure
7.3.4 Gross Margin
7.3.5 Channel
7.3.6 Production and Sales
7.4 JALA Corporation
7.4.1 Profile
7.4.2 Operation
7.4.3 Channel
7.4.4 Chcedo
7.5 Zhejiang Osmun Group
7.5.1 Profile
7.5.2 Operation
7.5.3 Channel Construction
7.5.4 Brand
7.6 Zhejiang Proya Cosmetics Co., Ltd
7.7 Tianjin Yumeijing Group Co., Ltd.
7.8 Softto Co., Ltd. (000662)
7.8.1 Profile
7.8.2 Operation
7.8.3 Revenue Structure
7.8.4 Gross Margin
7.8.5 Developments
7.9 BaWang International (Group) Holding Limited
7.9.1 Profile
7.9.2 Operation
7.9.3 Revenue Structure
7.9.4 Brand
7.9.5 Channel
7.9.6 Development Prospect
7.10 Guangzhou Huanya Cosmetics Technology Co., Ltd.
7.10.1 Brand and Channel
7.10.2 Investment and Project Construction
7.11 Guangdong Marubi Biotechnology Co., Ltd.
7.11.1 Profile
7.11.2 Operation
7.11.3 Revenue Structure
7.11.4 Channel
7.11.5 Production and Sales
7.11.6 Brand
7.11.7 Construction Project
7.12 KOSé Corporation
8. Conclusion and Forecast
8.1 Enterprise and Brand
8.1.1 Enterprise
8.1.2 Brand
8.1.3 Foreign-Capital Development in China
8.2 Forecast
• Classification of Cosmetics
• Retail Sales and YoY Growth of Cosmetics in China, 2005-2014
• Import Volume and Value of Cosmetics in China, 2011-2014
• Export Volume and Value of Cosmetics in China, 2011-2014
• Retail Sales Structure of Cosmetics in China (by Product), 2013-2014
• Total Retail Sales Structure of Cosmetics in China (by Channel), 2010-2014
• Retail Sales Structure of Cosmetics Consumption in China (by Region), 2014
• Cosmetics Enterprise Structure in China, 2013
• Customs Duty Rates of Main Cosmetics in China, 2015
• Policies Regarding Cosmetics in China, 2007-2015
• Comparison of Distribution Channels of Cosmetics in China
• Channel Distribution of Cosmetics in China (by Enterprise / Brand), 2014
• Operation Model of Department Store as a Sales Channel for Cosmetics
• Number of Major Cosmetics Franchise Stores and Shops in Mainland China, 2012&2015
• Stage of Multinational Brand Penetrating Franchised Store Channel, 2003-2014
• Transaction Size and YoY Growth of China Cosmetics Online Shopping Market, 2008-2017E
• Cost Structure of Cosmetics E-commerce in China, 2013
• Consideration of Purchasing Cosmetics Online in China, 2014
• Online Marketing Channel of Cosmetics in China
• Direct Selling Income of Top Chinese Directing Selling Cosmetics Companies in China, 2011-2013
• China’s Skin Care Market Size and YoY Growth, 2009-2017E
• China’s Skin Care Market Sales Structure (by Product), 2013
• Proportion of Whitening Product in China, 2013
• Classification of China Facial Mask Market (by Price), 2014
• Leading Brands of China Facial Mask Market, 2009-2014
Selected Charts
Room 502, Block 3, Tower C, Changyuan Tiandi Building, No. 18, Suzhou Street, Haidian District, Beijing, China 100080 Phone: +86 10 82600828 ● Fax: +86 10 82601570 ● www.researchinchina.com ● [email protected]
• Retail Sales and Market Share of Top 10 Skin Care Brands in China Cosmetics Market, 2012
• Brand Distribution of China Cosmetics Market (by Price) (RMB)
• Representative Brands of Mass Skin Care
• China’s Make-up Market Size, 2006-2017E
• Make-up Use Attention of Chinese Consumers, 2013
• Digital Asset Value of Top 10 Chinese Make-up Brands, 2014
• Top 10 Chinese Perfume Enterprises and Their Market Share, 2013
• China’s Import Volume and Value of Perfume and Floral Water, 2008-2014
• China’s Export Volume and Value of Perfume and Floral Water, 2008-2014
• China Men’s Cosmetics Market Structure, 2013
• China Men’s Cosmetics Brand Pattern
• Channel Pattern of Men’s Product, 2013
• China’s Cosmeceuticals Sales Structure (by Field), 2013
• Products of Chinese Companies Involved in Cosmeceuticals Production
• Industry Pattern of Children’s Product
• Channel Pattern of Infant & Child Cosmetics, 2010-2014
• Revenue and Net Income of L'Oreal, 2006-2014
• Revenue Breakdown and Structure of L'Oreal (by Business), 2011-2014
• Revenue Breakdown and Structure of L'Oreal (by Region), 2011-2014
• R&D Costs and % of Total Revenue of L'Oreal, 2008-2014
• Cosmetics Revenue and Operating Income of L'Oreal, 2009-2014
• Cosmetics Revenue Breakdown and Structure of L'Oreal (by Department), 2011-2014
• Cosmetics Revenue Structure of L'Oreal (by Business), 2010-2013
• Cosmetics Revenue Breakdown and Structure of L'Oreal (by Region), 2011-2014
Selected Charts
Room 502, Block 3, Tower C, Changyuan Tiandi Building, No. 18, Suzhou Street, Haidian District, Beijing, China 100080 Phone: +86 10 82600828 ● Fax: +86 10 82601570 ● www.researchinchina.com ● [email protected]
• Cosmetics Production Structure of L'Oreal (by Region), 2012
• Revenue of L'Oreal in China, 2007-2013
• Distribution of L'Oreal Counters in China (by Brand/City) as of Jan 2015
• Net Revenue and Operating Income of Estee Lauder, FY2008-FY2015E
• Net Revenue Breakdown of Estee Lauder (by Product), FY2008-FY2015E
• Revenue Breakdown of Estee Lauder (by Region), FY2008-FY2015E
• R&D Costs and % of Total Revenue of Estee Lauder, FY2010-FY2014
• Net Revenue Structure of Estee Lauder (by Dealer Channel), FY2014
• Main Events of Estee Lauder in China
• Number of Estee Lauder Counters in China as of Jan 2015
• Brand Distribution of Procter & Gamble by Department, 2015
• Net Revenue and Net Income of Procter & Gamble, FY2008-FY2015E
• Net Revenue Breakdown and Structure of Procter & Gamble (by Business), FY2012-FY2014
• Net Income Structure of Procter & Gamble (by Region), FY2011-FY2014
• Gross Margin of Procter & Gamble, FY2008-FY2014
• R&D Costs and % of Total Revenue of Procter & Gamble, FY2008-FY2014
• Cosmetics Classification and Brand of Procter & Gamble
• Net Revenue and Net Income of Cosmetics Business of Procter & Gamble, FY2010-FY2014
• Brand Distribution of Procter & Gamble in China
• Distribution of SK-II Counters in China as of Jan 2015
• Net Revenue and Net Income of Shiseido, FY2007-FY2014
• Revenue Breakdown and Structure of Shiseido (by Product), FY2010-FY2014
• Net Revenue Breakdown of Shiseido (by Region), FY2008-FY2014
• Overseas Revenue and % of Total Revenue of Shiseido, FY2008-FY2014
• Sales Channel Distribution of Shiseido in Japan
Selected Charts
Room 502, Block 3, Tower C, Changyuan Tiandi Building, No. 18, Suzhou Street, Haidian District, Beijing, China 100080 Phone: +86 10 82600828 ● Fax: +86 10 82601570 ● www.researchinchina.com ● [email protected]
• Revenue and Operating Margin of Harvatek, 2000-2014
• Monthly Revenue of Harvatek, Dec. 2012-Dec. 2014
• Revenue and Gross Margin of Tekcore, 2005-2014
• Revenue and Operating Margin of Tekcore, 2008-2014
• Monthly Revenue and Growth Rate of Tekcore, Dec. 2012-Dec. 2014
• Revenue and Operating Margin of Unity Opto, 2004-2014
• Monthly Revenue and Growth Rate of Unity Opto, Dec. 2012-Dec. 2014
• Revenue and Operating Income of Huga Optotech, 2004-2012
• Monthly Revenue and Growth Rate of Huga Optotech, May, 2010-May, 2012
• Revenue and Operating Margin of Lextar Electronics, 2009-2014
• Monthly Revenue and Growth Rate of Lextar Electronics, Dec. 2012-Dec. 2014
• Organizational Structure of Tyntek
• Revenue and Operating Margin of Tyntek, 2004-2014
• Monthly Revenue and Growth Rate of Tyntek, Dec. 2012-Dec. 2014
• Revenue and Operating Margin of Edison Opto, 2006-2014
• Monthly Revenue and Growth Rate of Edison Opto, Dec. 2012-Dec. 2014
• Revenue and Gross Margin of AOT, 2010-2014
• AOT’s Monthly Revenue, Dec. 2012-Dec. 2014
• AOT’s Key Customers
• AOT’s Revenue Breakdown by Application, 2013Q1-2014Q3
• AOT’s Technology Roadmap
• Revenue and Net Income of Epiligh Technology, 2008-2012
• Revenue and Operating Margin of Silan Microelectronics, 2006-2014
• Revenue and Net Income of Silan Azure, 2007-2011
• Revenue and Gross Margin of Sanan Optoelectronics, 2005-2014
• Revenue Breakdown of Sanan Optoelectronics by Business, 2009-2012
Selected Charts
Room 502, Block 3, Tower C, Changyuan Tiandi Building, No. 18, Suzhou Street, Haidian District, Beijing, China 100080 Phone: +86 10 82600828 ● Fax: +86 10 82601570 ● www.researchinchina.com ● [email protected]
• Channel Distribution of Shiseido (by Brand), FY2014
• R&D Costs and % of Total Revenue of Shiseido, FY2008-FY2013
• Distribution of Shiseido’s Research Institutes (by Country)
• Cosmetics Classification of Shiseido
• Brand Distribution of Shiseido (by Country)
• Net Revenue of Shiseido in China, 2010-2014
• Subsidiaries of Shiseido in China, FY2014
• Revenue and Net Income of Shanghai Jahwa, 2008-2014
• Operating Revenue Breakdown of Shanghai Jahwa (by Business), 2013-2014
• Operating Revenue Breakdown of Shanghai Jahwa (by Region), 2013-2014
• Gross Margin of Shanghai Jahwa (by Business), 2012-2014
• Positioning (by Brand) and Main Sales Channels of Shanghai Jahwa
• Sales Structure of Shanghai Jahwa (by Channel), 2013-2014
• Gross Profit of Shanghai Jahwa (by Brand), 2012-2013
• Main Cosmetics Brand of Shanghai Jahwa
• Main Brand Price of Shanghai Jahwa
• Market Share of SIX GOD (by Product), 2012&2014
• Market Share of MAXAM Hand Care, 2001-2009
• HERBORIST Brand Product
• Revenue and Net Income of Shanghai Jahwa, 2013-2017E
• Main Brand of Longrich
• Development of Longrich, 2002-2015
• Global Research Center of Longrich
• Revenue of Longrich, 2009-2014
• Revenue and Net Income of INOHERB, 2009-2014
Selected Charts
Room 502, Block 3, Tower C, Changyuan Tiandi Building, No. 18, Suzhou Street, Haidian District, Beijing, China 100080 Phone: +86 10 82600828 ● Fax: +86 10 82601570 ● www.researchinchina.com ● [email protected]

• Revenue Breakdown and Structure of INOHERB (by Product), 2009-2012
• Revenue Breakdown of INOHERB (by Region), 2009-2012
• Gross Margin of INOHERB (by Product), 2009-2012
• Revenue Structure of INOHERB (by Channel), 2011&2013
• Channel Model and Sales Terminal of INOHERB Product
• Distribution of INOHERB Counters in Mainland China as of Jan 2015
• Production Capacity of INOHERB Product (by Factory), 2009-2011
• Output and Sales Volume of INOHERB (by Product), 2009-2011
• Production Base of JALA Corporation
• Sales of JALA Corporation, 2011-2014
• Distribution of Chcedo Counters in Mainland China as of Jan 2015
• Sales of Osmun, 2010-2014
• Retail Sales Growth of Department Store Channel of Proya (by Brand), Jan-Nov 2014
• Number of Proya Counters in Mainland China (by City) as of Jan 2015
• Revenue of Tianjin Yumeijing Group, 2007-2014
• Revenue and Net Income of Softto, 2008-2014
• Operating Revenue Breakdown of Softto (by Product), 2008-2014
• Gross Margin of Softto (by Product), 2008-2014
• Revenue and Net Income of BaWang, 2008-2014
• Revenue Breakdown and Structure of BaWang (by Product), 2012-2014
• Revenue Breakdown and Structure of BaWang (by Region), 2012-2013
• Brand Distribution of BaWang
• Revenue Breakdown and Structure of BaWang (by Brand), 2011-2014
• Channel Distribution of BaWang (by Brand), 2013-2014
• Development Target of BaWang International (Group) Holding Limited
Selected Charts
Room 502, Block 3, Tower C, Changyuan Tiandi Building, No. 18, Suzhou Street, Haidian District, Beijing, China 100080 Phone: +86 10 82600828 ● Fax: +86 10 82601570 ● www.researchinchina.com ● [email protected]
• Cosmetics Brand and Product Development of Guangzhou Huanya Cosmetics Technology, 2012-2015
• Brand of Guangzhou Huanya Cosmetics Technology
• Revenue and Net Income of Guangdong Marubi Biotechnology, 2011-2013
• Revenue Breakdown and Structure of Marubi (by Product), 2011-2013
• Revenue Breakdown and Structure of Marubi (by Region), 2011-2013
• Revenue Breakdown and Structure of Marubi (by Channel), 2011-2013
• Dealers of Marubi (by Sales) as of end-2013
• Terminal Sales Points of Marubi (by Region/Form) as of end-2013
• Capacity and Capacity Utilization of Marubi, 2011-2013
• Output, Sales Volume and Sales-Output Ratio of Marubi (by Product), 2011-2013
• Revenue Breakdown and Structure of Marubi (by Brand), 2011-2013
• Revenue Breakdown and Structure of Marubi? (by Product), 2011-2013
• Revenue Breakdown and Structure of CAC? (by Product), 2011-2013
• Fundraising Project Overview of Guangdong Marubi Biotechnology, 2014
• Brand Distribution of KOSé Cosmetics (by Channel), 2014
• Operating Revenue of KOSé Corporation, 2007-2010
• Revenue of Cosmetics Companies in China, 2013-2014
• Local Cosmetics Financing Events in China, 2013-2014
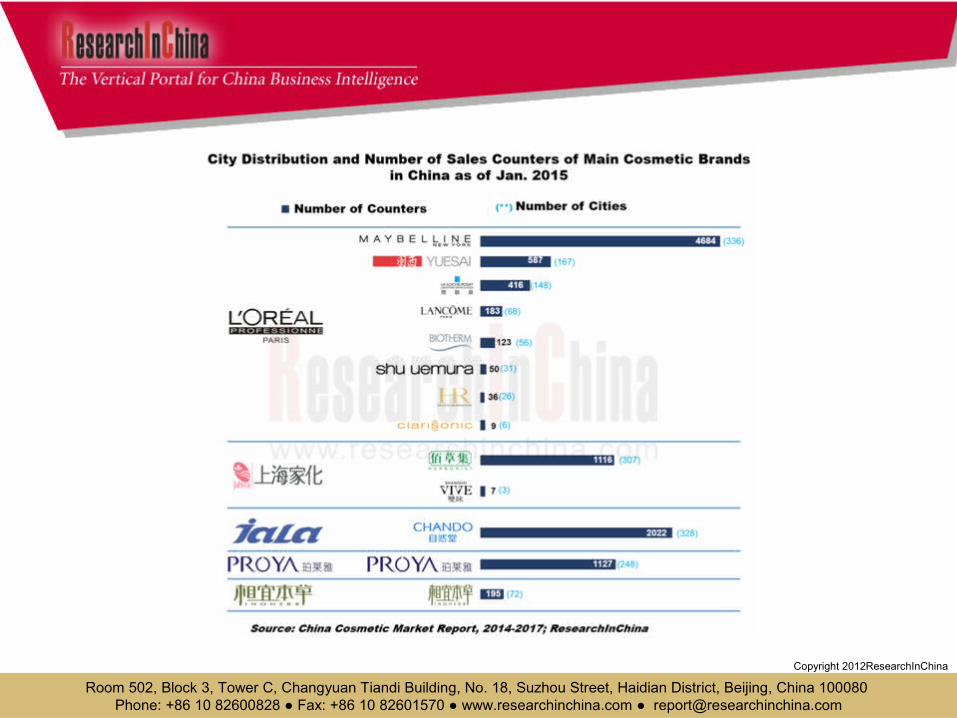
• Counters of Main Cosmetics Brands in China (by City) as of Jan 2015
• Comparison of Development-in-China of Multinational Cosmetics Companies, 2013-2014
• M&A of Local Cosmetics Brands by Foreign Companies and Developments, 2013-2014
• Total Retail Sales and YoY Growth of Chinese Cosmetics Companies above Designated Size, 2013-2017E
Selected Charts
Room 502, Block 3, Tower C, Changyuan Tiandi Building, No. 18, Suzhou Street, Haidian District, Beijing, China 100080 Phone: +86 10 82600828 ● Fax: +86 10 82601570 ● www.researchinchina.com ● [email protected]
You can place your order in the following alternative ways:
1.Order online at www.researchinchina.com
2.Fax order sheet to us at fax number:+86 10 82601570
3. Email your order to: [email protected]
4. Phone us at +86 10 82600828/ 82601561
Party A:Name:Address:Contact Person: TelE-mail: Fax
Party B:Name: Beijing Waterwood Technologies Co., Ltd (ResearchInChina)Address: Room 502, Block 3, Tower C, Changyuan Tiandi Building, No. 18,
Suzhou Street, Haidian District, Beijing, China 100080Contact Person:
Liao Yan Phone:
86-10-82600828
E-mail: [email protected] Fax: 86-10-82601570Bank details:
Beneficial Name: Beijing Waterwood Technologies Co., LtdBank Name: Bank of Communications, Beijing BranchBank Address: NO.1 jinxiyuan shijicheng,Landianchang,Haidian District,BeijingBank Account No #: 110060668012015061217Routing No # : 332906Bank SWIFT Code: COMMCNSHBJG
Title Format Cost
Total
Choose type of format
PDF (Single user license) …………..2,400 USD
Hard copy ………………….……. 2,550 USD
PDF (Enterprisewide license)…....... 3,700 USD
※ Reports will be dispatched immediately
once full payment has been received.
Payment may be made by wire transfer or
credit card via PayPal.
How to Buy
Room 502, Block 3, Tower C, Changyuan Tiandi Building, No. 18, Suzhou Street, Haidian District, Beijing, China 100080 Phone: +86 10 82600828 ● Fax: +86 10 82601570 ● www.researchinchina.com ● [email protected]

About ResearchInChina
ResearchInChina (www.researchinchina.com) is a leading independent provider of China business intelligence. Our research is designed to meet the diverse planning and information needs of businesses, institutions, and professional investors worldwide. Our services are used in a variety of ways, including strategic planning, product and sales forecasting, risk and sensitivity management, and as investment research.
Our Major Activities
Multi-users market reports
Database-RICDB
Custom Research
Company Search
RICDB (http://www.researchinchina.com/data/database.html ), is a visible financial data base presented by map and graph covering global and China macroeconomic data, industry data, and company data. It has included nearly 500,000 indices (based on time series), and is continuing to update and increase. The most significant feature of this base is that the vast majority of indices (about 400,000) can be displayed in map.
After purchase of our report, you will be automatically granted to enjoy 2 weeks trial service of RICDB for free.
After trial, you can decide to become our formal member or not. We will try our best to meet your demand. For more information, please find at www.researchinchina.com
For any problems, please contact our service team at:
Room 502, Block 3, Tower C, Changyuan Tiandi Building, No. 18, Suzhou Street, Haidian District, Beijing, China 100080 Phone: +86 10 82600828 ● Fax: +86 10 82601570 ● www.researchinchina.com ● [email protected]
RICDB service