CHICAGO PUBLIC SCHOOLS FY2017 PROPOSED ... EXECUTIVE SUMMARY The Civic Federation cannot support the...
93
CHICAGO PUBLIC SCHOOLS FY2017 PROPOSED BUDGET: Analysis and Recommendations August 23, 2016
Transcript of CHICAGO PUBLIC SCHOOLS FY2017 PROPOSED ... EXECUTIVE SUMMARY The Civic Federation cannot support the...

CHICAGO PUBLIC SCHOOLS
FY2017 PROPOSED BUDGET:
Analysis and Recommendations
August 23, 2016

2
TABLE OF CONTENTS EXECUTIVE SUMMARY ......................................................................................................................................... 4
CIVIC FEDERATION POSITION ........................................................................................................................... 6
ISSUES OF CONCERN .................................................................................................................................................. 6 The FY2017 Budget Relies on Uncertain Revenue and Provides No Detailed Alternative Plan ......................... 6 Ongoing Structural Deficit ................................................................................................................................... 7 Draining Reserve Funds to Balance the Budget .................................................................................................. 7 Cash-Flow Problems ............................................................................................................................................ 8 Pension Funding Crisis ........................................................................................................................................ 8 Increased Long-Term Borrowing without a Five-Year Capital Improvement Plan ............................................. 9
ISSUES THE CIVIC FEDERATION SUPPORTS ................................................................................................................ 9 Savings through Cost-Cutting Measures and Management Efficiencies ............................................................. 9 Reinstatement of the Dedicated Teacher Pension Levy ..................................................................................... 10 Increased State Funding to CPS ........................................................................................................................ 11 Phase-out of Pension Pick-up for Non-Union Employees ................................................................................. 11 Not Using Scoop and Toss to Close the FY2017 Budget Deficit ........................................................................ 11 Additional Property Tax Revenue ...................................................................................................................... 12
CIVIC FEDERATION RECOMMENDATIONS ................................................................................................................ 12 CPS Should Produce a Public and Transparent Contingency Plan .................................................................. 12 Implement a Formal Long-Term Financial Plan ............................................................................................... 12 Rebuild Budgetary Reserves to Avoid Cash Crises ............................................................................................ 13 End Employer “Pick-up” of Employee Pension Contributions for All Employees ............................................ 13 Consolidate the Chicago Teachers’ Pension Fund with the Teachers’ Retirement System ............................... 14 Create a Policy Eliminating the Practice of Scoop and Toss Borrowing .......................................................... 15 Develop and Release a Five-Year Capital Improvement Plan Before Issuing Additional Long-Term Debt for
Capital Spending ................................................................................................................................................ 15 Continue Advocating for New Equitable Illinois School Aid Formula .............................................................. 15 Present Consistent Budget Figures Across Platforms........................................................................................ 16 Make Budget Hearings More Accessible to the Public ...................................................................................... 16
ACKNOWLEDGEMENTS .................................................................................................................................... 17
FY2017 DEFICIT DRIVERS AND GAP-CLOSING MEASURES ...................................................................... 18
DEFICIT DRIVERS .................................................................................................................................................... 18 GAP-CLOSING MEASURES ....................................................................................................................................... 18
APPROPRIATIONS ................................................................................................................................................. 20
TOTAL APPROPRIATIONS FOR FY2017 .................................................................................................................... 20 FIVE-YEAR APPROPRIATION TRENDS FOR ALL FUNDS BY FUND AND TYPE ............................................................ 21 TWO-YEAR AND FIVE-YEAR APPROPRIATION TRENDS FOR GENERAL OPERATING FUNDS ..................................... 23
Appropriations for General Operating Funds by Type ...................................................................................... 23 Appropriations for Operating Funds by Location ............................................................................................. 25
RESOURCES ............................................................................................................................................................. 27
FUND DESCRIPTIONS AND STRUCTURE .................................................................................................................... 28 TOTAL RESOURCES FOR FY2017 ............................................................................................................................. 29 TWO-YEAR AND FIVE-YEAR ALL FUNDS RESOURCE TRENDS BY SOURCE .............................................................. 32
Local Revenue .................................................................................................................................................... 33 State Revenue ..................................................................................................................................................... 34 Federal Revenue ................................................................................................................................................ 35 Other Resources ................................................................................................................................................. 36
PROPERTY TAX LEVY AND REVENUE ...................................................................................................................... 36 Timing of CPS Property Tax Receipts and the New Revenue Recognition Policy ............................................. 40

3
PERSONNEL ............................................................................................................................................................. 41
TWO-YEAR AND FIVE-YEAR FULL-TIME EQUIVALENT (FTE) POSITIONS BY TYPE ................................................. 41 TWO-YEAR AND FIVE-YEAR PERSONNEL APPROPRIATIONS FOR GENERAL OPERATING FUNDS.............................. 42
ENROLLMENT ........................................................................................................................................................ 44
RESERVES ................................................................................................................................................................ 46
FUND BALANCE POLICIES AND DEFINITIONS ........................................................................................................... 46 Components of Fund Balance ............................................................................................................................ 47 GFOA Best Practices ......................................................................................................................................... 47
AUDITED FUND BALANCE RATIO: FY2006-FY2015 ............................................................................................... 48 CHICAGO BOARD OF EDUCATION FUND BALANCE POLICY ......................................................................................... 49 USE OF RESERVES TO BALANCE THE FY2017 BUDGET ........................................................................................... 50 DISCUSSION OF CASH FLOW .................................................................................................................................... 51
MUNICIPAL EMPLOYEES’ PENSION FUND .................................................................................................... 52
TEACHERS’ PENSION FUND ............................................................................................................................... 54
PLAN DESCRIPTION ................................................................................................................................................. 54 MEMBERSHIP ........................................................................................................................................................... 54 SUMMARY OF KEY TEACHERS’ PENSION FUND BENEFITS ....................................................................................... 55 PENSION CONTRIBUTIONS ....................................................................................................................................... 56
Employer Contributions ..................................................................................................................................... 56 Employee Contributions ..................................................................................................................................... 59
PENSION FUND INDICATORS .................................................................................................................................... 60 Funded Ratios .................................................................................................................................................... 60 Unfunded Actuarial Accrued Liability ............................................................................................................... 61 Investment Rate of Return .................................................................................................................................. 63 Pension Liabilities as Reported Under Governmental Accounting Standards Board Statements Number 67 and
68 ....................................................................................................................................................................... 64
OTHER POST EMPLOYMENT BENEFITS (OPEB) .......................................................................................... 67
LIABILITIES ............................................................................................................................................................ 69
SHORT-TERM LIABILITIES ....................................................................................................................................... 69 Short-Term Liabilities as a Percentage of Net Operating Revenues .................................................................. 70 Short-Term Borrowing ....................................................................................................................................... 72 Accounts Payable Trends ................................................................................................................................... 72 Current Ratio ..................................................................................................................................................... 73
LONG-TERM LIABILITIES ......................................................................................................................................... 75 CPS LONG-TERM DEBT ........................................................................................................................................... 77
Financing CPS Debt .......................................................................................................................................... 77 CPS DEBT CRISIS .................................................................................................................................................... 78
Increasing Long-Term Debt at Same Time CPS Faces Multiple Financial Pressures ...................................... 78 Rising Debt Burden on Taxpayers ..................................................................................................................... 80 Costly Termination of Interest Rate Swap Agreements ...................................................................................... 81 Use of Costly Scoop-and-Toss Financing that Backloads Debt Service Payments ............................................ 82 Increased Amounts of Short-Term Borrowing Due to Liquidity Crisis .............................................................. 83 CPS Bond Ratings are Below Investment Grade ............................................................................................... 84 Debt Service Appropriations as a Percentage of Total Appropriations............................................................. 86
CAPITAL BUDGET ................................................................................................................................................. 86
CAPITAL PROJECT REVENUES AND SPENDING: FY2012-FY2017 ............................................................................ 89 CPS FY2016-FY2020 Capital Improvement Plan .............................................................................................. 90
APPENDIX ................................................................................................................................................................ 91
LONG-TERM FINANCIAL PLANNING BEST PRACTICES ............................................................................................. 91

4
EXECUTIVE SUMMARY
The Civic Federation cannot support the Chicago Public Schools’ (CPS) proposed Fiscal Year 2017
operating budget of $5.46 billion because it continues to rely on uncertain revenues, one-time revenue
sources and costly short-term borrowing. The Federation urges CPS to develop a public and
transparent contingency plan for members of the Board of Education to approve in the event that
the revenue sources the District is relying on fail to materialize.
The Civic Federation is encouraged by some improvements in the District’s financial position from even
a few months ago. The significant expenditure reductions the District has made as well as revenue from
the State and property taxpayers will allow the District to make it through another year. This does not
mean that the District is now in good financial shape and its crisis is over. Far from it.
The District’s FY2017 budget represents a small step back from the edge of the insolvency cliff. CPS still
faces severe fiscal challenges, including a gaping structural deficit, a pension funding crisis and a below
investment grade credit rating that makes borrowing extremely expensive. The District will need to close
a $1.14 billion operating budget deficit. To close the deficit, CPS is relying on $215.2 million in uncertain
State pension funding that depends on the General Assembly and Governor agreeing on pension reforms
as well as a favorable outcome from contentious labor negotiations with the Chicago Teachers Union. The
District has depleted its reserves, leaving no cushion to handle further shortfalls, so it is relying on
increased short-term borrowing of $1.56 billion to cover its cash flow problems, with $35.0 million in
interest payments projected for FY2017. It also has plans for an enormous $945.0 bond issuance for
capital improvements at a time when it faces sky high interest rates and without an updated five-year
Capital Improvement Plan. With limited control over its revenues,1 CPS will be forced to make additional
cuts if funding it is relying on fails to materialize in FY2017.
The Civic Federation remains concerned about the District’s serious financial issues. CPS must continue
to take actions to bring itself closer to fiscal solvency, but it must also continue to receive long-term
sustainable assistance from the State of Illinois. The Civic Federation recommends that the District
provide a plan detailing how it will balance revenues with expenditures in the event that revenue and/or
labor contract savings are not realized in FY2017 and that it continue to work with the State to secure
equitable funding.
The Civic Federation offers the following key findings from the FY2017 Proposed Budget:
The FY2017 proposed budget general operating expenses are projected to decrease by $232.0
million, or 4.1%, compared to the approved FY2016 budget due to layoffs, elimination of vacant
positions and other management efficiencies;
General operating revenues are also projected to decrease by $232.0 million, or 4.1%, compared
to the approved FY2016 budget;
Employee benefits spending has increased by 57.1%, or $495.0 million, since FY2013;
The FY2017 proposed budget will again rely on short-term borrowing through up to $1.56 billion
in Tax Anticipation Notes (TANs), with an estimated cost of $35.0 million in interest;
The number of total Full-Time Equivalent (FTE) positions will decrease by 1,271.6 and the
number of teacher FTEs will decrease by 747.1, or 3.6%, compared to FY2016, which is largely
due to a decline in student enrollment;
The District plans to use $80.8 million of General Fund balance and nearly all of its remaining
debt service fund balance in FY2017, ending the fiscal year with a negative stabilization fund
balance of $158.9 million;
1 Because CPS is a non-home rule government, it has limited revenue flexibility.

5
The FY2017 proposed budget relies on $215.2 million from the State to fund teachers’ pensions
that depends on agreement between the Governor and General Assembly on pension reform;
The District will generate an additional $250.0 million in property taxes dedicated to the Chicago
Teachers’ Pension Fund and an additional $50.0 million by levying for new property and
increasing its property tax levy by 0.7%, the maximum increase allowed under the tax cap.
The Civic Federation has major concerns about the CPS FY2017 Proposed Budget:
The FY2017 budget relies on uncertain revenue and provides no detailed alternative plan if
revenue fails to materialize;
The District is experiencing an ongoing structural deficit which has resulted in a growing gap
between the spending the District engages in and the revenues it collects;
The District has drained its reserve funds to balance the budget leaving it with no cushion to deal
with future economic downturns or cash flow issues;
The District is dealing with a liquidity crisis, with no cash to smooth over the volatility associated
with the timing of revenues and expenditures, leading CPS to rely on short-term borrowing to
create cash flow;
Insufficient pension contributions and low return on investments have led to a pension funding
crisis; and
The District plans to increase its level of long-term borrowing without first presenting a five-year
Capital Improvement Plan detailing how it will fund the additional debt.
The Civic Federation supports several of the District’s initiatives in the FY2017 Proposed Budget:
In FY2017 CPS is implementing budget cuts and management efficiencies;
The District has reinstated a dedicated property tax levy to fund the Chicago Teachers’ Pension
Fund that will generate an additional $250.0 million annually;
The State has increased General State Aid for FY2017 and appropriated $215.2 million for the
Chicago Teachers’ Pension Fund;
The District has begun to eliminate pension pick-up for non-union employees;
This year’s budget does not rely on scoop and toss borrowing; and
The District will generate additional property tax revenue by increasing its property tax levy to
the maximum amount allowed under the State tax cap law and implementing the newly
established Capital Improvement Tax (CIT) levy.
The Civic Federation makes the following recommendations to Chicago Public Schools and the Chicago
Board of Education:
Provide an alternative plan to handle possible unrealized revenue;
Create and implement a long-term financial plan;
Rebuild budgetary reserves over time to avoid future cash crises;
End the employer pension pick-up for all employees;
Consolidate the Chicago Teachers’ Pension Fund (CTPF) with the Teachers’ Retirement System
(TRS) to create a more equitable pension funding structure and relieve the burden of CTPF
unfunded liabilities on CPS;
Create a debt management policy that prohibits the use of scoop and toss refinancing of long-term
bonds;
Refrain from additional long-term borrowing without a five-year Capital Improvement Plan in
place;
Continue advocating for an equitable Illinois school aid formula;
Present consistent budget figures between the budget book and online interactive reports; and
Make budget hearings more accessible to the public.

6
CIVIC FEDERATION POSITION
The Civic Federation cannot support the Chicago Public Schools’ (CPS) proposed Fiscal Year
2017 operating budget of $5.46 billion because it continues to rely on uncertain revenues, one-
time revenue sources and costly short-term borrowing. The Federation urges CPS to develop a
public and transparent contingency plan for members of the Board of Education to
approve in the event that the revenue sources the District is relying on fail to materialize.
The Civic Federation is encouraged by some improvements in the District’s financial position
from even a few months ago. The significant expenditure reductions the District has made as
well as revenue from the State and property taxpayers will allow the District to make it through
another year. This does not mean that the District is now in good financial shape and its crisis is
over. Far from it.
The District’s FY2017 budget represents a small step back from the edge of the insolvency cliff.
CPS still faces severe fiscal challenges, including a gaping structural deficit, a pension funding
crisis and a below investment grade credit rating that makes borrowing extremely expensive. The
District will need to close a $1.14 billion operating budget deficit. To close the deficit, CPS is
relying on $215.2 million in uncertain State pension funding that depends on the General
Assembly and Governor agreeing on pension reforms as well as a favorable outcome from
contentious labor negotiations with the Chicago Teachers Union. The District has depleted its
reserves, leaving no cushion to handle further shortfalls, so it is relying on increased short-term
borrowing of $1.56 billion to cover its cash flow problems, with $35.0 million in interest
payments projected for FY2017. It also has plans for an enormous $945.0 bond issuance for
capital improvements at a time when it faces sky high interest rates and without an updated five-
year Capital Improvement Plan. With limited control over its revenues,2 CPS will be forced to
make additional cuts if funding it is relying on fails to materialize in FY2017.
The Civic Federation remains concerned about the District’s serious financial issues. CPS must
continue to take actions to bring itself closer to fiscal solvency, but it must also continue to
receive long-term sustainable assistance from the State of Illinois. The Civic Federation
recommends that the District provide a plan detailing how it will balance revenues with
expenditures in the event that revenue and/or labor contract savings are not realized in FY2017
and that it continue to work with the State to secure equitable funding.
Issues of Concern
The Civic Federation has the following concerns regarding the FY2017 Proposed Budget.
The FY2017 Budget Relies on Uncertain Revenue and Provides No Detailed Alternative Plan
While CPS officials state that the FY2017 budget is balanced, it relies on $215.2 million from
the State to provide funding for the Chicago Teachers’ Pension Fund (CTPF) that is not certain.
During the spring 2016 legislative session, the General Assembly passed Senate Bill 2822, which
appropriated $215.2 million to CPS for pension funding. However, Governor Rauner has said he
2 Because CPS is a non-home rule government, it has limited revenue flexibility.

7
will not sign the bill into law unless the State legislature and Governor can come to an agreement
on pension reform.3 Despite the fact that Senate Bill 2822 makes an appropriation for one year
only, the District also projects that it will receive the same level of funding through FY2021.
Relying on this appropriation is risky given the difficulty the State has had reaching agreement
on pension reform plans. Because the District provides no plan of recourse should the funding
fail to materialize other than noting that there would need to be mid-year cuts, the FY2017
budget is in effect unbalanced.
Additionally, the FY2017 budget relies on savings from a new labor contract with the Chicago
Teachers Union (CTU) that would include the phase-out of the pension pick-up that was
previously rejected by members of the CTU. Currently, CPS contributes 7.0% of the 9.0%
required teacher contribution to the CTPF, effectively requiring teachers to contribute just 2.0%
of their salary. The District estimates that it will receive $31 million in labor savings to balance
the FY2017 budget.4 However, the Civic Federation sees cause for concern over this assumption
because a labor agreement has been difficult to reach and the CTU has threatened to strike if
CPS holds firm on the phase-out.5 Although the contract was affirmed by an independent
arbitrator, the District should not assume the savings from this disputed labor agreement with the
CTU.
The District has not provided a detailed alternative plan that would address the deficit. Simply
stating that CPS will be forced to make larger cuts is not enough. Students, teachers, parents and
taxpayers deserve to know and plan for what would happen if the District’s budget remains
unbalanced.
Ongoing Structural Deficit
Since at least FY2009, CPS has failed to consistently match expenditures to ongoing revenues.
This mismatch has resulted in a growing gap between the spending the District engages in and
the revenues it collects. The structural deficit has been exacerbated by the District’s reliance on
one-time resources such as fund balances—rather than cuts to expenditures—to close its budget
gaps. The District made some budget cuts in FY2016, but still needed to close a $1.14 billion
deficit in FY2017. CPS will not close its structural deficit until its ongoing expenditures match
available revenues. Increased property tax revenue and one-time State revenues help, but all
stakeholders must come together to make CPS’s finances sustainable over the long term.
Draining Reserve Funds to Balance the Budget
During the past several years, the District has almost completely depleted its cash reserves,
which leaves it with little ability to deal with unforeseen shortfalls. This year, the District
projects that its stabilization fund will begin and end FY2017 with a negative balance of $158.9
million, and the total operating fund will end the fiscal year with a negative balance $87.7
3 Dave McKinney and Karen Pierog. “Chicago Public Schools unveils ‘balanced’ FY2017 budget,” Reuters, August
8, 2016. http://www.reuters.com/article/us-chicago-education-idUSKCN10J2EL 4 CPS FY2017 Proposed Budget, p. 4. 5 Stefano Esposito and Rosalind Rossi. “CPS vows ‘balanced’ $5.4B budget; CTU sees cuts, threatens strike,”
Chicago Sun Times, August 8, 2016. http://chicago.suntimes.com/news/cps-expected-to-release-2016-17-budget-
later-monday/

8
million. The Workers’ Compensation/Tort Fund is projected to end the fiscal year with a balance
of $20.7 million. The budget also projects using almost all of the debt service stabilization fund,
leaving only $100,000 at end of FY2017. In the past, the CPS budget office has stated that it
aims to leave at least $100 million in the debt service stabilization fund,6 so the departure from
that target is a cause for concern. In fact, the District will fall short of all of its own fund balance
targets in FY2017.
Building a financial cushion to deal with future economic downturns is a key element in
restoring CPS to fiscal stability. The adequacy of reserves is one of the factors considered by
credit rating agencies in assessing a state’s financial condition. CPS has already received credit
rating downgrades in the 2015 and 2016, and now holds a below investment grade credit rating.
The low credit rating makes it difficult and expensive to borrow money, so rebuilding and
maintaining a stabilization fund balance is imperative.
Cash-Flow Problems
In addition to its pension crisis and structural deficit, CPS is continuing to experience a
significant liquidity crisis that is the result of both the draw-down of fund balance and the change
to the revenue recognition period the District used to help close its FY2015 budget deficit. The
majority of the District’s revenues are received late in the fiscal year while large expenses such
as payroll must be distributed consistently throughout the year.7 In recent years, CPS had relied
on its budgetary reserves as a cash flow bridge until it received its property tax revenues. After
reserves were depleted, the District had to rely on short-term borrowing through Tax
Anticipation Notes (TANs), which are payable with dedicated revenues including property tax
collections. The District used a $700.0 million line of credit in FY2015 to make year-end
pension payments, and issued another $1.065 billion in TANs in FY2016. CPS plans to issue up
to $1.56 billion in Tax Anticipation Notes in FY20178 and projects it will need to pay $35
million in TAN interest costs in FY2017.9 This is an alarmingly large amount of money to
borrow on a short-term basis, and will come at a high cost. The District’s low credit rating has
hindered the District’s ability to borrow and makes short-term borrowing extremely expensive.
The Federation is concerned that CPS will again rely on short-term borrowing in FY2017 to
cover anticipated cash flow difficulties at a time when its credit rating is rated below investment
grade, resulting in high borrowing costs.
Pension Funding Crisis
CPS faces an enormous pension funding crisis that seriously threatens its long-term financial
stability. The pension crisis has been caused by a shortfall in employer contributions compared
to actuarially required pension payments, pension funding holidays, serious investment losses in
FY2008 and FY2009 and the failure of pension reform. CPS’ unfunded liabilities for teachers’
6 Communication with CPS Budget Office, July 24, 2013. The District justifies the spend-down of the debt service
reserve this year by saying it only has minimal need for the Debt Service reserve fund because it has ended its swaps
and is phasing out its variable rate debt. CPS FY2017 Proposed Budget, p. 179. 7 CPS FY2017 Proposed Budget, p. 173. 8 The Board of Education will vote on Resolution 16-0824-RS6 at its meeting on August 24, 2016. 9 CPS FY2017 Proposed Budget, p. 173.

9
pensions have risen consistently over the past ten years and its funded ratio has dropped
significantly.
After a three-year partial pension holiday in FY2011-FY2013 authorized in Public Act 96-0889,
the FY2014 contribution tripled from the previous year, growing by $404.0 million from $196.0
million in FY2013 to $600.0 million in FY2014. The CTPF is required to reach a 90.0% funded
ratio by the end of 2059, and pension obligations will continue to increase annually over most of
that time. CPS’ required employer pension contribution will reach $720.2 million in FY2017.
CPS has received little aid from the State for teacher pension funding in recent years. In FY2016
the Sate contributed $3.7 billion to the Teachers’ Retirement System (TRS) while it only
contributed the statutorily required contribution of $12.1 million to the CTPF. In FY2017 the
District projects that it will receive a total of $227.4 million in pension funding from the State.
But again, this is based on the assumption the General Assembly and Governor will agree on
pension reform and contribute an additional $215.2 million to the CTPF. This funding is
uncertain at best. Even if the $215.2 million comes through, CPS will still not be at parity
compared to the State’s $4.0 billion projected FY2017 contribution to the TRS.
Increased Long-Term Borrowing without a Five-Year Capital Improvement Plan
In addition to $725 million in long-term debt that the District issued in February 2016, CPS has
announced that it plans to issue another $945.0 million in bonds to finance capital projects over
several years partly backed by a new property tax levy dedicated to capital funding that was
approved last year by the Chicago City Council and first levied in the 2015 tax year.10 The
volume at which CPS intends to issue long-term debt, as well as the high borrowing cost due to
CPS' below investment grade credit rating are of great concern to the Civic Federation. The
District has not released a plan detailing what capital projects the additional bonds would fund.
CPS has said its statutorily required five-year Capital Improvement Plan (CIP) was delayed by
the District’s fiscal uncertainty. Now that the District’s future is less uncertain, it should issue an
updated CIP before it asks the Board of Education members to approve and taxpayers to fund
huge amounts of borrowing. Additionally, the District already faces challenges meeting
expenditures in areas such as personnel and retirement costs, and its debt payments are projected
to grow. Such concerns must be balanced against the District’s significant capital improvement
backlog.
Issues the Civic Federation Supports
The Civic Federation supports several of the District’s initiatives in the FY2017 Proposed
Budget.
Savings through Cost-Cutting Measures and Management Efficiencies
The District took several steps in FY2016 that will carry over into FY2017 to reduce the deficit.
These include eliminating 433 staff positions, phasing out the pension pick-up for non-union
10 Juan Perez, Jr. “Chicago Public Schools sets hearing on another massive bond issue,” Chicago Tribune, August
16, 2016. http://www.chicagotribune.com/news/local/breaking/ct-cps-bond-issue-planned-met-20160816-story.html
10
employees, controlling central office costs and increased internal efficiencies.11 The FY2017
budget also plans for further management reforms and efficiencies to close the budget deficit,
including the centralization of financial accounting functions, reducing central office staff,
procurement reform, and transportation and scheduling efficiencies.12 Additionally, the District
will capture more revenue through federal fund reimbursements for Medicaid due to better
management processes.
The District estimates that it made $740 million in expenditure reductions between FY2011 and
FY2015. These, in addition the cuts made in FY2016 and FY2017, reflect a serious effort to cut
costs and better manage scarce resources by improving the District’s operational efficiencies.
Reinstatement of the Dedicated Teacher Pension Levy
The District relies heavily on property tax revenue to fund its operations. Property tax revenue
comprises 48% of the District’s total state, local and federal revenues for its general operating
fund. Prior to 1993, CPS had a property tax levy dedicated to funding the Chicago Teachers’
Pension Fund, which the District proposed to divert to general operating funds. On May 3, 1993,
the Civic Federation warned that redirecting the pension fund tax levy to fund general operations
would have a serious impact on the funded ratio of the CTPF and that CPS would fall into
financial trouble if the State did not provide a stable source of revenues.13 Both of those concerns
came to fruition.
The lack of a dedicated levy, in combination with new statutory funding language that allowed
the District to skip pension contributions if it was over 90% funded contributed to the pension
fund’s dwindling funded ratio.
In summer 2016 the General Assembly passed Public Act 99-0521, allowing CPS to levy a
property tax dedicated to the Chicago Teachers’ Pension Fund. The tax rate of 0.383% will
generate about $250 million per year. The Civic Federation supports the State’s efforts to help
the District improve its pension funding levels.
The Civic Federation recognizes that multiple Chicago property tax increases have taken place in
recent months, which are painful for homeowners and businesses. The City of Chicago has also
increased property taxes to fund the Police and Fire pension funds.14 However, Given CPS’
enormous fiscal challenges and the continued inconsistency of funding from the State of Illinois,
the Civic Federation supports these property tax increases because they will provide the District
with a reliable and recurring source of ongoing revenue to help fund its enormous pension
obligations.
11 CPS FY2017 Proposed Budget, pp. 6-7. 12 CPS FY2017 Proposed Budget, pp. 8-9. 13 Civic Federation, “Statement on the Chicago Public Schools Budget,” Bulletin No. 1089, September 2, 1993. 14 Hal Dardick. “Emanuel defends property tax increase,” Chicago Tribune, August 1, 2016.
http://www.chicagotribune.com/news/local/politics/ct-rahm-emanuel-property-taxes-0802-20160801-story.html

11
Increased State Funding to CPS
This year for the first time since FY2009, the State has increased funding to the District. In
recent years, the State had consistently decreased General State Aid and other state funding. The
declines in State revenue have significantly contributed to the fiscal challenges the District faces.
In FY2017, the State has allocated to the District $102.4 million through the Supplemental Low
Income grant Equalization Formula Grant or “poverty grant,” $74.0 million in hold harmless
supplemental grant funding and a $29.0 million early childhood grant. While these GSA
increases are for one year only, they help ease the financial burden CPS faces. The Civic
Federation commends CPS for working with State legislators to secure the short-term funding
and the State for starting to take responsibility for its duty to assist its largest school district.
In addition to increased General State Aid, the State has also appropriated additional pension
funding for the Chicago Teachers’ Pension Fund (CTPF). Between FY2011 and FY2014, the
state only made its statutorily required contribution to the Chicago Teachers’ Pension Fund of
$12.0 million. This year, the State has agreed to contribute an additional $215.2 million as part of
the employer contribution to the CTPF.15 The pension fund will only receive this additional
payment if the General Assembly and Governor agree on and pass pension reform. If pension
reform passes, CPS will receive a total of $227.4 million from the State to put toward the
District’s employer contribution to the CTPF.
Phase-out of Pension Pick-up for Non-Union Employees
CPS has already begun phasing out the pension pickup for central office, regional and non-union
support staff employees and eliminated it completely for new employees in those offices. The
Federation supports the District’s efforts to phase out pension pick-up for non-union employees.
Previously, the District paid 7.0% of the 8.5% employee contribution. In FY2016 the pick-up
decreased from 7.0% to 5.0%, and by FY2018 non-union employees will pay the full 8.5%
contribution.16 The phase-out saved the District $2.9 million in FY2016 and will continue to
reduce costs in the future. The District estimates that shifting the pickup costs to employees will
save nearly $21.0 million through FY2018 and $11.1 million annually when fully phased in. The
Civic Federation commends the District for phasing out pension pick-up for non-union
employees and supports expanding the phase out of the pension pick-up to all employees.
Not Using Scoop and Toss to Close the FY2017 Budget Deficit
Unlike in past year budgets, the FY2017 budget does not rely on any scoop and toss borrowing.
In its FY2016 proposed budget, CPS relied on $200.0 million dollars in “scoop and toss” bond
refunding. Scoop and toss is a refinancing mechanism that allows a government to use long term
borrowing to push off short term debt costs to future years in order to free up cash. This is an
unsustainable and ultimately costly practice. The Civic Federation commends the District for
refraining from the use of scoop and toss and recommends that it continue to avoid scoop and
toss in the future.
15 Senate Bill 2822. Available at http://www.ilga.gov/legislation/99/SB/PDF/09900SB2822ham003.pdf. 16 CPS FY2017 Proposed Budget, p. 6.
12
Additional Property Tax Revenue
CPS needs to close its structural budget gap in order to start on the path to fiscal sustainability.
Therefore, revenue increases are essential in addition to budget cuts. CPS proposes to increase its
property tax levy by 0.7% (the maximum amount allowed under the State tax cap law) and levy
for new property to generate an additional $50.0 million in property tax revenue.
This year’s capital budget includes borrowing based on the new Capital Improvement Tax (CIT)
levy that the Board also approved and the City Council passed in summer 2015.17 The CIT levy
is an annual property tax levy dedicated exclusively to school construction projects. The CIT is
projected to generate approximately $45.0 million per year. 18
CIvic Federation Recommendations
The Civic Federation makes the following recommendations to Chicago Public Schools and the
Chicago Board of Education.
CPS Should Produce a Public and Transparent Contingency Plan
No alternative plan has been put forth by the District detailing how it will handle a shortfall of
$215.2 million if the State fails to pass a pension reform plan or if it is unable to come to an
agreement with the Chicago Teachers Union. Therefore, the Civic Federation urges the Board of
Education to call for a detailed contingency plan. The Board should specify that the contingency
plan be realistic and not rely on borrowing for operations or the other unsustainable actions. The
District is already facing a precarious financial position with no stabilization fund reserves, a
below investment grade rating that makes borrowing very costly, and uncertainty about renewal
of the District’s short-term line of credit. The District’s structural deficit makes it likely that CPS
will be forced to make further cuts if projected revenues do not materialize. The uncertainty
surrounding its finances is damaging to the District’s reputation among residents and investors.
The Civic Federation strongly urges the Board of Education to request an alternative budget plan
that provides stakeholders with a detailed description of the significant cuts that will
unfortunately be unavoidable in the absence of additional revenue.
Implement a Formal Long-Term Financial Plan
CPS’ many financial challenges are a product of years of short-sighted budgeting and will take
many more years to resolve. While some contributing factors to the District’s fiscal crisis are
beyond its control, the District bears the ultimate responsibility for its crisis and should develop a
comprehensive, publicly-shared, long-term financial plan for a return to sustainability. The long-
term plan should provide a blueprint to create structural balance and replenish reserves to a level
that complies with the District’s fund balance policies over several years. While the District
provides budgetary projections through FY2021 in its budget book and may internally use or
implement features of a long-term financial plan, it does not currently develop a publicly-shared
17 CPS FY2017 Proposed Budget, p. 16. 18 CPS FY2017 Proposed Budget, p. 16.

13
long-term financial plan. The District should establish and publicly release a detailed, prioritized
long-term plan on an annual basis.19
With the additional State funding provided this budgetary year, it is appropriate for the District to
outline the role the State of Illinois will play in supporting the District’s finances, though it
should also plan for the alternatives that would be necessary if the State fails to deliver on its
promise this year or in future years. A long-term plan can set expectations and help convince
stakeholders that the District will not remain in crisis forever.
Rebuild Budgetary Reserves to Avoid Cash Crises
The Civic Federation recommends that as part of its long-term financial plan CPS should rebuild
its budgetary reserves over several years to avoid future cash-flow crises. In FY2017 CPS will
continue to deplete its operating fund and debt service fund reserves to balance its budget and
will not maintain any balance in its stabilization fund. CPS projects that a negative balance of
$158.9 million will be left in the district’s general operating stabilization fund at year-end. CPS
also will use $20.5 million from its debt service stabilization fund to pay for debt service
expenses in FY2017, leaving just $100,000 million in the fund at the end of the fiscal year.
Because reserves are depleted, the District will need to rely on short-term borrowing to cover
cash flows, which is extremely expensive and will cost the District more in the long run.
According to public finance experts, all governments should place a portion of their general
operating revenues in a general fund reserve.20 Reserve funds are savings accounts that
governments can use to address revenue shortfalls or unanticipated expenditures and to help
stabilize tax rates. Governments that maintain adequate reserves are better positioned to deal
with funding issues in bad times. Putting money into reserves is a more fiscally prudent action
than spending surplus funds on new or expanded programs.
In August 2008, CPS adopted its Fund Balance policy which would maintain the minimum target
stabilization fund balance of 5.0% of general operating and debt service expenditures. The
District has not met that target for several years. CPS must find a way to replenish its reserves
over several years from a combination of revenues and expenditure cuts.21
End Employer “Pick-up” of Employee Pension Contributions for All Employees
Employee contributions to the CTPF are statutorily set at 9.0% of the employee’s salary. CPS
currently “picks up” 7.0% of the 9.0% annual employee pension contribution for teachers,
meaning it pays 7.0% of the employee 9.0% contribution on behalf of teachers. Teachers
effectively pay just 2.0% of their annual salary toward their pensions. Pension contributions are
already picked up for non-teacher union employees, meaning those employees only contribute
19 For further discussion of long-term planning, see the Appendix on p. 91. Guidance on long term financial
planning is available at the National Advisory Council on State and Local Budgeting and the Government Finance
Officers Association at www.gfoa.org. 20 Government Finance Officers Association, Best Practice: Determining the Appropriate Level of Unrestricted
Fund Balance in the General Fund, October 2009. 21 The Government Finance Officers Association offers “best practice” recommendations on replenishment of a
government’s General Fund fund balance. See GFOA, “Replenishing Fund Balance in the General Fund” (2011).
14
1.5% of their annual salary. The CPS administration proposed to phase out the pension pick-up
for teachers as part of a contract with the Chicago Teachers Union (CTU), but that contract was
voted down by some members of the CTU in January 2016. The CTU has called the end of the
pickup a pay cut and has threatened to strike.
The Civic Federation opposed the pension pick-up when it was first proposed in 1981 and
continues to believe employees must share in the increasing cost of their pension benefits.22
Therefore, the Federation supports the District in its goal to eliminate what has become an
unaffordable benefit. The Federation recommends that the District continue to pursue a phase-
out of pension pick-up for ALL employees.
Consolidate the Chicago Teachers’ Pension Fund with the Teachers’ Retirement System
The Civic Federation recommends that CPS work with the General Assembly and the Teachers’
Retirement System (TRS) to consolidate the Chicago Teachers’ Pension Fund (CTPF) with TRS.
Consolidating the funds would eliminate the current inequitable funding structure under which
Chicago taxpayers pay for both nearly the entire cost of Chicago teacher pensions as well as
downstate and suburban teachers’ pension costs. It would achieve some cost efficiencies as
duplicative functions were eliminated.
Under a consolidation plan, the CTPF pension board would be abolished and the TRS pension
board would assume responsibility for all teacher pension funds. The consolidated Board would
include proportional representation for Chicago. However, the current separate member plans
would be maintained. The State of Illinois would assume responsibility for unfunded liabilities of
the Chicago Teachers’ Pension Fund while CPS would continue to fund the pension fund’s
normal cost (the annual cost of the pension plan’s benefits). For CPS, the employer normal cost
includes administrative expenses. Adjusted for the fact that CPS makes its contribution at the end
of the fiscal year, the employer normal cost including administrative expenses adjusted for
timing for FY2015 was $145.7 million.23 State assumption of the CTPF unfunded liability
would have reduced the District’s FY2015 required contribution by approximately $488 million,
helping to stabilize its finances.
The current situation by which local school districts have the power to incur expenses while the
State of Illinois must pay those expenses is unsustainable and fiscally reckless. Rather, we
believe that all school districts in Illinois should assume funding the normal cost and
administrative costs of their employee pensions. The shift would help inject greater fiscal
accountability into school district operations and budgeting. It could be achieved gradually, over
a period of three years, to allow school districts sufficient time to adjust to the change. The shift
would eventually offset the cost of assuming the CTPF unfunded liability.
It is reasonable for the State of Illinois to continue to assume financial responsibility for the
unfunded liability of all school districts because:
22 Civic Federation statement made at the Chicago Board of Education public budget hearing on November 9, 1983. 23 Of that total amount, administrative expenses for FY2015 were $11.7 million. These expenses will grow by
roughly 5% per year in the future. See FY2015 CTPF Actuarial Valuation, p. 45 at:
http://www.ctpf.org/AnnualReports/Actuarial2015.pdf.

15
The State created the current expensive and unsustainable situation which has led to
nearly $62 billion in unfunded liabilities for TRS and $9.6 billion for CTPF; 24 and
Paying these enormous costs is beyond the capability of local school districts to readily
absorb. This is particularly true as they rely heavily on property taxes to fund their
operations and many are subject to the property tax extension limitation law (PTELL),
which limits levy increases to 5% or the rate of inflation, whichever is less.
Create a Policy Eliminating the Practice of Scoop and Toss Borrowing
The Civic Federation commends the District for refraining from the use of scoop and toss in the
FY2017 budget. Scoop and toss extends the life of outstanding principal by pushing debt
payments to future years, which frees up money in the short term but creates a larger debt burden
in the long term. The District has used this practice regularly in recent years. While this
refinancing mechanism has allowed the District to balance its operating budgets, it is
unsustainable and costly. By reducing the amount of principal pushed off into the future, CPS
would reduce the cost of its long-term debt while ensuring current expenses and capital expenses
are not borne entirely by future generations. The Civic Federation recommends that the District
create a rule within its debt management policy that prohibits the use of long-term refunding
bonds to make current year principal payments, or scoop and toss refinancing.
Develop and Release a Five-Year Capital Improvement Plan Before Issuing Additional Long-
Term Debt for Capital Spending
Public Act 97-0474 requires CPS to prepare and publish a five-year capital improvement plan
(CIP). The capital improvement plan identifies and prioritizes capital needs throughout the
district, provides a timeline for completing projects and identifies funding sources for projects.
As of the publication of this report, CPS has not yet produced its five-year CIP despite the fact
that the District intends to issue an enormous $945.0 million in additional long-term debt.
Therefore, the public has no way of knowing how the District intends to fund this additional
debt. The District should publish a thoughtful and comprehensive five-year CIP before
considering issuing any further debt. The CIP should be publicly available for stakeholders on
the CPS website.
Continue Advocating for New Equitable Illinois School Aid Formula
The Civic Federation supports efforts to revise the Illinois school aid formula. The current school
funding system relies heavily on local property taxes, which has created a large resource
disparity between property rich and property poor districts. We believe that there should be a
single state school aid formula based primarily on providing increased funding for school
districts that are unable to adequately fund educational opportunities as well as those districts
with large numbers of children in need.
24 As of June 30, 2015, TRS had an unfunded liability of $61.7 billion based on the market value of assets and $62.7
billion based on asset smoothing. Teachers’ Retirement System of the State of Illinois, Actuarial Valuation Report,
June 30, 2015 Actuarial Valuation of Pension Benefits, January 7, 2016, p. 28.

16
We do not endorse any particular funding plan at this time but will review legislative proposals
as they are introduced.
Present Consistent Budget Figures Across Platforms
CPS presents its budget information in both a budget book format and in online interactive
budget reports.25 Funds are grouped slightly differently in the interactive budget compared to the
budget book. According to CPS, the reason for this difference in presentation of the online
interactive reports is to provide the public with more detail from a practical spending and school-
based perspective. However, presenting numbers that do not match between the budget book and
the online interactive budget without an explanation or comparison is confusing for readers. If
the District wishes to make its budget more understandable to the general public, it should
consider creating a popular budget summary to provide a practical summary of the District’s
spending plans for the general public and explain the connection between the budget book to the
interactive reports.
Make Budget Hearings More Accessible to the Public
This year, CPS scheduled two public hearings on the proposed budget, both on the same day and
during business hours at the CPS central office in the Loop.26 The purpose of the budget hearings
is to involve community input, but holding the hearings in the middle of the day at only one
location makes it difficult for working parents and other stakeholders to attend the hearings. In
past years, CPS offered budget hearings throughout the City on multiple days during evening
hours. The Civic Federation recommends that CPS revert back to holding budget hearings
outside of business hours on multiple dates in neighborhoods throughout the City in order to
increase public participation and make it easier for members of the public to attend the hearings.
25 The interactive portion of the CPS Proposed FY2017 Budget can be found online on the CPS budget website:
http://cps.edu/FY17Budget/Pages/FY17Budget.aspx. 26 The District did, however, hold three separate capital hearings in various locations around the city.

17
ACKNOWLEDGEMENTS
We would like to express our appreciation to Chicago Public Schools Senior Vice President of
Finance Ronald DeNard, Deputy of Management and Budget Matt Walter and Budget Manager
Cameron Mock for their work in preparing this budget, providing the Civic Federation staff with
a budget briefing and for their willingness to answer the Civic Federation’s questions.

18
FY2017 DEFICIT DRIVERS AND GAP-CLOSING MEASURES
In FY2017, Chicago Public Schools (CPS) faces a massive budget deficit of approximately $1.14
billion. This section details some of the drivers that have caused the deficit in recent years and
actions the District plans to take to close it.
Deficit Drivers
For the past several years, the District has operated with a structural deficit driven by the
consistent use of one-time funding sources, draining budgetary reserves, decreases in General
State Aid (GSA) and a lack of pension funding from the State of Illinois. A 2015 report provided
to CPS by consulting and accounting firm Ernst & Young stated that the District effectively ran a
$500.0 million structural deficit from FY2011 through FY2014, which was obscured by the use
of one-time revenue sources and partial pension holidays. 27
The FY2017 budget again relies on one-time and uncertain pension funding from the State and
$80.8 million in general operating fund balance, and nearly depletes the debt service stabilization
fund. The result is that the District will not meet any of its fund balance targets in FY2017.
Chicago Public Schools has completely depleted its operating fund balance over the years to
close its ongoing budget deficits. The continuous use of its fund balance each year to close the
prior year’s deficit has left the District no cushion to handle everyday cash flow issues.28
Another driver of the structural deficit is increasing pension liabilities. Required pension
contributions have increased significantly since the termination of a pension holiday after
FY2013. Employer contributions from CPS will continue to increase consistently from $506.0
million in FY2017 to $601.0 million in FY2021.29 Those projections are likely low because they
are based on the assumption that the State will contribute at least $227.4 million each year
through FY2021. This $227.4 million includes $215.2 million in State pension funding that is
contingent on the Governor and the General Assembly reaching an agreement on a significant
pension reform bill. Such funding is at best questionable given the lack of consensus between the
legislature and Governor on pension reform.
Gap-Closing Measures
The table below lists the actions that CPS will take in FY2017 to close the $1.14 billion
operating budget deficit. The District took several steps in FY2016 that will carry over into
FY2017 to reduce the deficit. These included school budget reductions, increased internal
efficiencies, elimination of central office staff positions and decreasing non-union employee
pension and healthcare contributions made by CPS.30 State legislative measures approved at the
close of the State’s fiscal year will allow the District to generate $250.0 million in additional
Chicago property tax revenue for the Chicago Teachers’ Pension Fund, and to receive a $102.4
27 Ernst & Young, “Board of Education—City of Chicago Structural Deficit Discussion Document.” May 22, 2015.
http://www.scribd.com/doc/269588560/CPS-Discussion-Document. 28 For further discussion of reserves, see p. 46 of this analysis. 29 CPS FY2017 Proposed Budget, p. 14. 30 CPS FY2017 Proposed Budget, pp. 6-7.

19
million equity grant,31 $74.0 million in General State Aid supplemental grant funds and a $29.0
million early childhood education grant. Additionally, the District expects to receive $215.2
million in State funding for the Chicago Teachers’ Pension Fund by June 1, 2017. However, as
mentioned above, the State will only make this payment if the Governor and General Assembly
come to an agreement on pension reform legislation.
The District estimates that a budget gap of $300 million will remain after accounting for the
State grant funding, the $215.2 million teachers’ pension contribution, additional property tax
revenue and FY2016 cost saving actions. The District plans to implement further management
reforms and efficiencies to close the remainder of the budget deficit in FY2017 through
centralization and streamlining of administrative functions, procurement reform, increased
federal fund reimbursements for Medicaid and transportation and scheduling efficiencies.32
31 Illinois State Board of Education, Public Act 99-0524 Grant Appropriations Forecast by School District, Excel
Spreadsheet. Last accessed at http://www.isbe.net/budget/ on July 14, 2016. 32 Information provided by Chicago Public Schools officials, August 8, 2016.
FY2016 CPS Cost Savings Initiatives 173$
GSA Poverty Grant (Equity Grant) 102$
GSA Hold Harmless (Supplementary Grant) 74$
Early Childhood Grant 29$
Chicago Pension Property Tax 250$
State Pension Contribution 215$
Remaining Deficit After Above Measures Taken 300$
Sweep Vacancy Savings for Deficit Reduction 58$
Reprogramming Grants to Classrooms 35$
Centralized Purchasing Savings 35$
Anticipated Labor Savings 31$
Phase-In of Shared Services 26$
Charter School Share of Central Efficiencies 20$
Reduction Non-School Based Employees (since Jan.) 17$
Savings from Teacher Retirements & Resignations 17$
New TIF Revenue 15$
Scheduling Efficiencies 15$
Improved Medicaid Collections 12$
Additional Central Office Streamlining 10$
Additional Revenue 6$
Central Summer Program Reductions 3$
Total Budget Deficit 1,143$
Source: CPS FY2017 Proposed Budget, pp. 7-8.
CPS Actions to Close the FY2017 Budget Gap
(in $ millions)

20
APPROPRIATIONS
This section presents an analysis of CPS appropriation trends, including appropriations by
source, type and location. The section includes two- and five-year appropriation trends for all
funds and two- and five-year appropriation trends for general operating funds. Proposed FY2017
appropriations are compared with FY2013, FY2014 and FY2015 actuals when available or
amended and adopted appropriations and with FY2016 adopted appropriations.
Total Appropriations for FY2017
The following chart shows total FY2017 proposed appropriations for all funds. The Chicago
Public Schools’ FY2017 Proposed Budget of $6.36 billion consists of an appropriation of
approximately $5.5 billion in the General Operating Fund, $337.5 million in the Capital Projects
Funds and $563.7 million in the Debt Service Funds. The General Operating Fund represents
85.8% of the total budget, the Capital Projects Fund represents 5.3% and the Debt Service Fund
represents 8.9%.
The General Operating Fund finances employees’ salaries and benefits, contractual services,
charter school tuition transfers and other day-to-day expenditures. The General Operating Fund
includes the General Fund and the Special Revenue Funds. The General Fund is the primary fund
used for instructional, professional, maintenance and administrative activities. The Special
Revenue Funds receive revenues that are legally required to be expended only for specific
Capital Projects Fund$337.5
5.3%
Debt Service Fund$563.7
8.9%
General Operating Funds
$5,459.9 85.8%
CPS FY2017 Appropriations for All Funds by Fund(in $ millions)
Source: CPS FY2017 Proposed Budget, Interactive Reports, Revenues & Expenditures, available at www.cps.edu (last visited August 9, 2016).
Total FY2017Proposed Appropriations
for All Funds: $6,361.1 million

21
purposes such as School Breakfast and Lunch Programs, Supplemental General State Aid for
additional instruction to low-income students and other grant funds. The Capital Projects Funds
are for acquisition and construction of capital facilities or equipment. The Debt Service Funds
are for the accumulation of resources for, and the payment of, principal and interest on long-term
debt.33
Five-Year Appropriation Trends for All Funds by Fund and Type
The FY2017 proposed budget of $6.36 billion is a decrease of 0.7%, or $46.9 million, from the
FY2016 approved budget of $6.41 billion. Appropriations for the General Operating Fund,
which consists of the General Fund and Special Revenue Funds, will decline by 4.1%, or $232.0
million, below the FY2016 approved budget. The $232.0 million decline in the General Fund
and Special Revenue Funds is primarily due to a reduction in salary expenses as a result of
layoffs, vacancy savings as well as potential savings tied to the Chicago Teachers’ Union labor
contract that has yet to be approved by union members.34 The Capital Projects Funds will
increase by $160.0 million, or 90.1%, over the two-year period. The Debt Service Funds will
increase by 4.7%, or $25.1 million, over the two-year period to $563.7 million in FY2017.
Over the five-year period, total appropriations for all funds will increase by $556.9 million, or
9.6%, increasing from $5.8 billion in the FY2013 amended budget to nearly $6.4 billion in the
FY2017 proposed budget. The General Operating Funds will increase by $227.7 million, or
4.4%, over the five-year period. Appropriations for the Capital Projects Fund will increase by
$167.7 million, or 98.8%, above the FY2013 amended budget. The Debt Service Funds will
increase by 40.2%, or $161.5 million, over the five-year period.
The chart below shows a trend analysis of appropriations for all funds by type of expense for the
FY2017 proposed budget, FY2016, FY2015 and FY2014 approved budgets and FY2013
amended budget. Appropriations for salaries will decline by the largest dollar amount between
the two years, decreasing by $204.1 million, or 8.0%, while appropriations for equipment will
increase by the largest dollar amount between the two years, increasing by $163.1 million, or
82.4%. The decline in salaries is primarily due to the reduction of 400 central office positions,
vacancy savings as well as potential savings related to a labor agreement with teaching staff.35
The increase in equipment is primarily due to increased funding available for capital
33 CPS FY2017 Proposed Budget, Appendix E – Glossary. 34 CPS FY2017 Proposed Budget, p. 22. 35 CPS FY2017 Proposed Budget, p. 22.
FY2013 FY2014 FY2015 FY2016 FY2017
Amended Adopted Adopted Adopted Proposed $ Change % Change $ Change % Change
General Operating Funds 5,232.2$ 5,592.3$ 5,756.2$ 5,691.8$ 5,459.9$ (232.0)$ -4.1% 227.7$ 4.4%
Capital Projects Funds 169.8$ 349.1$ 509.9$ 177.6$ 337.5$ 160.0$ 90.1% 167.7$ 98.8%
Debt Service Funds 402.2$ 613.2$ 603.8$ 538.6$ 563.7$ 25.1$ 4.7% 161.5$ 40.2%
Total Appropriation 5,804.2$ 6,554.5$ 6,869.9$ 6,408.0$ 6,361.1$ (46.9)$ -0.7% 556.9$ 9.6%
Note: Because of rounding, minimal differences may occur in totaling rows and columns.
(in $ millions)
Five-Year Five-YearFund Type
Two-Year Two-Year
CPS Appropriations for All Funds by Fund: FY2013-FY2017
Source: CPS FY2013 Amended Budget, p. 20; CPS FY2014 Approved Budget, Interactive Reports, Revenues & Expenditures, available at www.cps.edu (last accessed August 9, 2016);
CPS FY2015 Approved Budget, Interactive Reports, Revenues & Expenditures, available at www.cps.edu (last visited August 9, 2016); FY2016 Proposed Budget, Interactive Reports,
Revenues & Expenditures, available at www.cps.edu (last visited August 9, 2016); and FY2017 Proposed Budget, Interactive Reports, Revenues & Expenditures, available at
www.cps.edu (last visited August 9, 2016).

22
improvement projects as a result of the new Capital Improvement Tax Levy.36 The increase in
debt service is primarily due to a debt restructuring that took place in FY2016, which temporarily
reduced debt service payments.37 Appropriations for benefits are projected to increase over the
two-year period by $28.9 million, which is primarily the result of an increase in pension
payments and rising healthcare costs. However, the increase is offset by management efficiencies
and savings, such as requiring non-union non-teacher employees to contribute a higher portion of
their salaries towards their healthcare and pension expenses.38 Contingencies will decline by
$21.5 million, or 8.0% over the two-year period. Contingencies include two types of funding: 1)
funding that has been budgeted, but has yet to be allocated and 2) grant funding that has yet to be
confirmed or allocated to a specific school or program. Once the item, program or school
allocation has been decided, the funds are moved to a separate line item of the budget.39
Over the five-year period, appropriations for all funds will increase by $556.8 million or 9.6%.
The largest dollar increase over the five-year period by type is debt, which increased by $560.7
million. This is primarily due to the District issuing debt to cover operating expenses and its
capital construction program. The second largest dollar increase over the five-year period is
benefits, which increased by $461.8 million, or 51.3%. The increase in benefits appropriations is
primarily due to increased teacher pension contributions and increased healthcare costs.40
Contingencies will decrease over the five-year period by $324.8 million, or 56.7%. As noted
above, contingencies include funding that has been budgeted but has yet to be allocated. Salaries
will also see a decline over the five-year period decreasing by $305.1 million, or 11.5%. As
previously noted, the decline in salaries is primarily the result of layoffs, vacancy savings and
potential savings tied to the Chicago Teachers’ Union labor contract that has yet to be approved
by union members.41
36 CPS FY2017 Proposed Budget, pp. 15-16. 37 CPS FY2017 Proposed Budget, p. 24. 38 CPS FY2017 Proposed Budget, pp. 6-7. 39 CPS FY2017 Proposed Budget, p. 22. 40 CPS FY2017 Proposed Budget, pp. 4 and 11. 41 CPS FY2017 Proposed Budget, p. 22.
FY2013 FY2014 FY2015 FY2017 Two-Year Two-Year Five-Year Five-Year
Amended Approved Approved Proposed $ Change % Change $ Change % Change
Salaries 2,655.7$ 2,562.6$ 2,612.3$ 2,554.7$ 2,350.6$ (204.1)$ -8.0% (305.1)$ -11.5%
Benefits 899.5$ 1,251.4$ 1,310.0$ 1,332.5$ 1,361.4$ 28.9$ 2.2% 461.8$ 51.3%
Contracts 991.1$ 1,110.3$ 1,133.1$ 1,153.9$ 1,132.3$ (21.6)$ -1.9% 141.2$ 14.2%
Commodities 346.2$ 257.0$ 260.6$ 264.1$ 248.9$ (15.2)$ -5.8% (97.3)$ -28.1%
Equipment 217.6$ 385.0$ 550.3$ 197.9$ 361.0$ 163.1$ 82.4% 143.4$ 65.9%
Transportation 121.6$ 111.8$ 99.5$ 100.1$ 98.4$ (1.7)$ -1.7% (23.2)$ -19.1%
Contingencies 572.5$ 876.4$ 303.6$ 269.2$ 247.7$ (21.5)$ -8.0% (324.8)$ -56.7%
Debt -$ -$ 600.7$ 535.6$ 560.7$ 25.1$ 4.7% 560.7$ -
Other -$ -$ - -$ 0.001$ 0.001$ - 0.001$ -
Total 5,804.3$ 6,554.5$ 6,869.9$ 6,408.0$ 6,361.1$ (46.9)$ -0.7% 556.8$ 9.6%
Note: Because of rounding, minimal differences may occur in totaling rows and columns.
FY2016
Approved
CPS Appropriations for All Funds by Type: FY2013 - FY2017
(in $ millions)
Source: CPS FY2017 Proposed Budget, Interactive Reports, Revenues & Expenditures, available at www.cps.edu (last visited August 17, 2016); and FY2016 Approved
Budget, Revenues & Expenditures, available at www.cps.edu (last visited August 17, 2016); FY2015 Approved Budget, Revenues & Expenditures, available at
www.cps.edu (last visited August 17, 2016); FY2014 Approved Budget, Revenues & Expenditures, available at www.cps.edu (last visited August 17, 2016); and FY2013
Amended Budget, Revenues & Expenditures, available at www.cps.edu (last visited August 17, 2016).

23
Two-Year and Five-Year Appropriation Trends for General Operating Funds
The following section shows trend data for operating funds appropriations by type and location
for FY2013, FY2014 and FY2015 actual appropriations, FY2016 approved appropriations and
the FY2017 proposed appropriations.
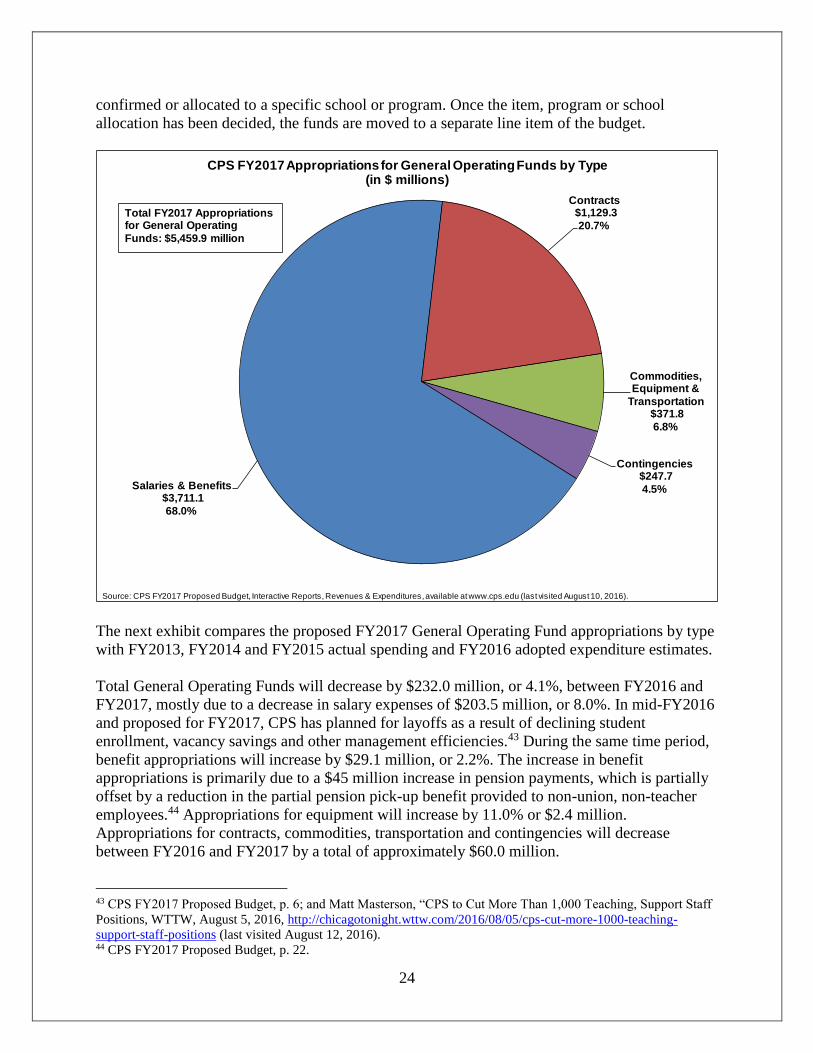
Appropriations for General Operating Funds by Type
The exhibit below shows the breakdown of the proposed FY2017 General Operating Funds
appropriations by type. The largest single portion is earmarked for salaries and benefits.
Approximately 68.0% of the operating funds, or $3.7 billion, will be for teacher salaries, non-
teacher salaries and employee benefits. Contracts, totaling approximately $1.1 billion, or 20.7%,
of the total operating budget, include professional services and contractual payments to outside
organizations that provide school support services and charter school tuition transfers. Some of
the non-personnel service appropriations support compensation costs of persons who provide
direct services to CPS but are not CPS employees. Appropriations for commodities, equipment
and transportation make up $371.8 million, or 6.8%, of the operating budget, and contingencies
account for $247.7 million, or 4.5%. Commodities include utilities, food, instructional supplies
and other supplies.42 As previously explained, contingencies include two types of funding: 1)
funding that has been budgeted but has yet to be allocated, and 2) grant funding that has yet to be
42 CPS FY2017 Proposed Budget, p. 22.
24
confirmed or allocated to a specific school or program. Once the item, program or school
allocation has been decided, the funds are moved to a separate line item of the budget.
The next exhibit compares the proposed FY2017 General Operating Fund appropriations by type
with FY2013, FY2014 and FY2015 actual spending and FY2016 adopted expenditure estimates.
Total General Operating Funds will decrease by $232.0 million, or 4.1%, between FY2016 and
FY2017, mostly due to a decrease in salary expenses of $203.5 million, or 8.0%. In mid-FY2016
and proposed for FY2017, CPS has planned for layoffs as a result of declining student
enrollment, vacancy savings and other management efficiencies.43 During the same time period,
benefit appropriations will increase by $29.1 million, or 2.2%. The increase in benefit
appropriations is primarily due to a $45 million increase in pension payments, which is partially
offset by a reduction in the partial pension pick-up benefit provided to non-union, non-teacher
employees.44 Appropriations for equipment will increase by 11.0% or $2.4 million.
Appropriations for contracts, commodities, transportation and contingencies will decrease
between FY2016 and FY2017 by a total of approximately $60.0 million.
43 CPS FY2017 Proposed Budget, p. 6; and Matt Masterson, “CPS to Cut More Than 1,000 Teaching, Support Staff
Positions, WTTW, August 5, 2016, http://chicagotonight.wttw.com/2016/08/05/cps-cut-more-1000-teaching-
support-staff-positions (last visited August 12, 2016). 44 CPS FY2017 Proposed Budget, p. 22.
Salaries & Benefits$3,711.1
68.0%
Contracts$1,129.3
20.7%
Commodities, Equipment &
Transportation$371.8
6.8%
Contingencies$247.7
4.5%
CPS FY2017 Appropriations for General Operating Funds by Type(in $ millions)
Source: CPS FY2017 Proposed Budget, Interactive Reports, Revenues & Expenditures, available at www.cps.edu (last visited August 10, 2016).
Total FY2017 Appropriations for General Operating
Funds: $5,459.9 million

25
In the five-year period between FY2013 and FY2017, total General Operating Funds
appropriations will rise by $513.6 million, or 10.4%, primarily due to significant increases in
employee benefits, contracts and contingencies that total nearly $875 million, but are offset by a
decline in salaries, commodities, equipment, transportation and other expenses. Employee
benefits will increase by $495.0 million, or 57.1%, over the five-year period, primarily due to
increased contributions to the Chicago Teachers’ Pension Fund in recent years.45 Contingencies
will increase by $247.7 million. As stated above, contingencies include funding that has been
budgeted but has yet to be allocated, which is primarily why the budgeted amounts for the
FY2016 approved and the FY2017 proposed budget are higher than actual spending for
contingencies in FY2013, FY2014 and FY2015. Appropriations for contracts will increase by
$131.9 million, or 13.2%. As previously noted, contracts include professional services and
contractual payments to outside organizations that provide school support services and charter
school tuition transfers. Appropriations for salaries will decrease by $225.6 million, or 8.8% over
the five-year period. Appropriations for commodities, equipment, transportation and other
expenses will decrease by a total of $135.2 million over the five-year period.
Appropriations for Operating Funds by Location
The exhibit below shows the breakdown of proposed FY2017 General Operating Funds
appropriations by location. School-based budgets comprise 65.0% of operating appropriations, or
nearly $3.6 billion. This includes direct costs for CPS, charter and alternative schools.
Approximately 32.4%, or $1.8 billion, will be for City-Wide/Network Offices. These are
programs and services that directly impact multiple schools across the District and include
45 CPS FY2017 Proposed Budget, p. 13.
FY2014 FY2016 FY2017
Actual Adopted Proposed $ Change % Change $ Change % Change
Salaries 2,575.5$ 2,541.5$ 2,576.5$ 2,553.4$ 2,349.9$ (203.5)$ -8.0% (225.6)$ -8.8%
Benefits 866.2$ 1,263.6$ 1,356.0$ 1,332.2$ 1,361.2$ 29.1$ 2.2% 495.0$ 57.1%
Contracts 997.4$ 1,145.3$ 1,185.9$ 1,150.9$ 1,129.3$ (21.6)$ -1.9% 131.9$ 13.2%
Commodities 305.5$ 293.0$ 280.5$ 264.1$ 248.9$ (15.2)$ -5.8% (56.6)$ -18.5%
Equipment 86.1$ 94.5$ 88.3$ 22.0$ 24.5$ 2.4$ 11.0% (61.6)$ -71.6%
Transportation 106.9$ 104.4$ 103.9$ 100.1$ 98.4$ (1.7)$ -1.7% (8.5)$ -7.9%
Contingencies -$ -$ -$ 269.2$ 247.7$ (21.5)$ -8.0% 247.7$ -
Other 8.6$ 7.8$ 2.8$ -$ 0.0$ 0.0$ - (8.6)$ -100.0%
Capital Outlay 0.1$ -$ -$ -$ -$ -$ - (0.1)$ -100.0%
Total 4,946.3$ 5,450.1$ 5,593.9$ 5,691.8$ 5,459.9$ (232.0)$ -4.1% 513.6$ 10.4%
CPS Appropriations for Operating Funds by Type: FY2013-FY2017
(in $ millions)
Five-Year Five-Year
Source: CPS FY2017 Proposed Budget, Interactive Reports, Budget by Account and Historical Expenditures, available at www.cps.edu (last visited August 9,
2016); and CPS FY2016 Approved Bduget, Interactive Reports, Budget by Account, available at www.cps.edu (last visited August 9, 2016).
Type
FY2013
Actual
FY2015
Actual
Two-Year Two-Year
Note: Because of rounding, minimal differences may occur in totaling rows and columns.

26
teacher pension contributions. Appropriations for central office will represent 2.6%, or $140.4
million, of operating appropriations.
The following chart compares two-year and five-year trends by location for the proposed
FY2017 budget to the adopted budget for FY2016 and the approved or amended budgets for
FY2013, FY2014 and FY2015. Actual expenditures by location from prior years are not
provided in the budget documents.
Over the two-year period the General Operating funds appropriations will decrease by $232.0
million, or 4.1%. School-based budget appropriations will decrease by the largest dollar amount
totaling $177.1 million, or 4.7%, over the two-year period. The City-Wide/Network Offices
appropriations will decrease by 2.3%, or $42.1 million and Central Office expenditures will
decrease by 8.3%, or $12.7 million.
Over the five-year period between the FY2013 amended budget and FY2017 proposed budget,
the General Operating Funds appropriations for school-based budgets will decrease by 1.4%, or
$49.1 million. Appropriations for City-Wide/Network Offices will rise by 26.4% or $369.6
million. This is likely due to teacher pension contributions being accounted for in the City-
Wide/Network Offices, which have increased substantially beginning in FY2014. The Central
Office appropriations will decrease by 39.8%, or $92.9 million, over the five-year period. Central
Office appropriations increased between FY2013 and FY2014 before beginning to decline again
School-Based Budgets
$3,551.3 65.0%
City-Wide/Network Offices$1,768.2
32.4%
Central Office$140.4
2.6%
CPS FY2017 Appropriations for General Operating Funds by Location (in $ millions)
Source: CPS FY2017 Proposed Budget, Interactive Reports, Find Your School Budget, available at www.cps.edu (last visited August 10, 2016).
FY2017 Total Appropriations for General Operating Funds: $5,459.9 million

27
in FY2015. The increase between FY2013 and FY2014 of approximately $85 million was
partially due to the restructuring of 700 engineer positions from being budgeted and managed by
individual schools to being controlled by the Central Office.46 The decline in Central Office
appropriations between FY2015 and the proposed FY2017 budget is due to a number of
personnel reductions, management reforms and efficiencies that have been implemented in
recent years.47 The proposed FY2017 budget continues to reduce Central Office expenditures
and streamline operations.48
RESOURCES
The following section presents total revenues and total resources that CPS plans to appropriate in
FY2017 and includes a discussion of federal, state and local resources for all funds and two-year
and five-year resource and revenue trend analyses. Proposed FY2017 revenues and resources are
compared with FY2013, FY2014 and FY2015 actuals and FY2016 approved revenues when
available.
Total revenues include all local, state and federal revenue as well as any investment income
earned. Total resources include total revenue plus other non-revenue sources such as
appropriated fund balance and net proceeds from bonds.
The FY2017 CPS budget projects cash flow issues due to the timing of debt and pension
payments that occur just before the District receives its two installments of property tax revenue
which, in the absence of a fund balance for the District to draw on, creates a cash shortfall. In
order to avoid making cuts, CPS had previously relied on spending down its budgetary reserves
to balance its recent budgets.49 However, its reserves are depleted and in FY2016 and now
FY2017 the District has turned to short-term borrowing, or Tax Anticipation Notes (TANs),50 to
provide needed cash flow between property tax payments. The District issued $700.0 million in
TANs in FY2015 and $1.065 billion in TANs in FY2016. While the District has not renewed its
46 CPS FY2013 Amended Budget, p. 14. 47 CPS FY2017 Proposed Budget, pp. 6 and 8; CPS FY2016 Approved Budget, pp. 4 and 10; and CPS FY2015
Approved Budget, pp. 4 and 7. 48 CPS FY2017 Proposed Budget, pp. 8 and 20. 49 For more information on reserves see p. 46 of this analysis. 50 TANs are backed by anticipated property tax revenues.
FY2013 FY2014 FY2015 FY2016 FY2017 Two-Year Two-Year Five-Year Five-Year
Location Amended Approved Approved Approved Proposed $ Change % Change $ Change % Change
School-Based Budgets 3,600.4$ 3,537.5$ 3,698.5$ 3,728.4$ 3,551.3$ (177.1)$ -4.7% (49.1)$ -1.4%
City-wide/Network Offices 1,398.6$ 1,735.7$ 1,796.0$ 1,810.3$ 1,768.2$ (42.1)$ -2.3% 369.6$ 26.4%
Central Office 233.3$ 319.0$ 261.8$ 153.1$ 140.4$ (12.7)$ -8.3% (92.9)$ -39.8%
Total 5,232.2$ 5,592.3$ 5,756.2$ 5,691.8$ 5,459.9$ (232.0)$ -4.1% 227.7$ 4.4%Note: Because of rounding, minimal differences may occur in totaling rows and columns.
Source: FY2013 Amended Budget, Interactive Reports, Find Your School Budget, available at www.cps.edu (last visited August 10, 2016); FY2014 Approved Budget,
Interactive Reports, Find Your School Budget, available at www.cps.edu (last visited August 10, 2016); FY2015 Approved Budget, Interactive Reports, Find Your School
Budget, available at www.cps.edu (last visited August 10, 2016); FY2016 Approved Budget, Interactive Reports, Find Your School Budget, available at www.cps.edu (last
visited August 10, 2016); and FY2017 Proposed Budget, Interactive Reports, Find Your School Budget, available at www.cps.edu (last visited August 10, 2016).
CPS Appropriations for General Operating Funds by Location: FY2013-FY2017
(in $ millions)

28
line of credit as of the publication of this report, CPS projects it will need to pay $35 million in
TAN interest costs in FY2017.51
With $480.0 million of unrealized revenues in State pension aid that never materialized in
FY2016, the District begins the fiscal year with a negative General Operating Fund balance of
$158.9 million. This figures into the $1.1 billion general operating deficit CPS will need to close
in FY2017. Additionally, the FY2017 budget relies on $215.2 million in State pension funding
that will require the Illinois legislature and Governor to come to an agreement on pension
reform. However, if the Illinois General Assembly fails to pass pension reform, Governor Rauner
has said he will not sign Senate Bill 2822 into law and the District will not receive the $215.2
million additional pension funding.
Fund Descriptions and Structure
CPS funds are grouped slightly differently in the online interactive budget52 compared to the
CPS FY2017 Budget Book. In this chapter, our analysis will focus on the fund structure outlined
in the Budget Book.
The FY2017 Proposed Budget Book presents the fund structure in conformity with Generally
Accepted Accounting Principles (GAAP). CPS has three fund types: General Operating Fund,
Debt Service Funds and Capital Projects Funds. The General Operating Fund consists of both the
General Fund and Special Revenue Funds. The General Fund is the primary operating fund of
CPS and includes the Education Fund (consisting of the Regular Education, Special Education,
Tuition-Based Preschool and School Special Income Funds) and the Building Operations and
Maintenance Fund. The Special Revenue Funds account for revenue sources that are restricted
for specific purposes and include the Supplemental General State Aid Fund, Workers’ and
Unemployment Compensation/Tort Fund, School Lunch Funds and Federal and State Grant
Funds.
According to CPS, the online Interactive Reports are meant to show a practical spending
perspective rather than a strict accounting perspective. In the Interactive Reports, like the budget
book, the General Operating Fund consists of General Funds and Special Revenues Funds.
Unlike the budget book, the General Funds include the Special Education Fund, General
Education Fund, Workers’ Compensation/Tort Fund, and Public Building Commission Fund,
and the four Special Revenue Funds include the School Generated Fund, Lunchroom Fund, No
Child Left Behind Fund and Other Grants. These funds are earmarked for special purposes and
are limited to use by the schools that generated them. The District believes this modification in
51 CPS FY2017 Proposed Budget, p. 173. 52 The interactive portion of the CPS Proposed FY2017 Budget can be found online on the CPS budget website:
https://eac.cps.k12.il.us/analytics/saw.dll?Dashboard.

29
fund grouping provides more detail and makes the interactive budget more user-friendly for the
public.
Total Resources for FY2017
In FY2017 CPS projects its total resources for all funds to be nearly $6.5 billion in local, state
and federal revenues and other resources, including $80.8 million of appropriated fund balance
and $215.2 million in state pension funding for which the District has budgeted but has not been
signed into law by the Governor. The General Operating Fund will hold the majority of resources
with 84.5%, or $5.5 billion. This includes the $80.8 million of appropriated General Operating
Fund balance. CPS spent down almost its entire budgetary reserves in FY2015 and spent most of
the remainder in FY2016. In FY2017 the District will spend fund balance from several accounts
it had previously avoided spending.53 The Capital Projects Funds, which account for financial
resources used for major capital acquisition or construction activities, will total $391.2 million,
or 6.1%, of total resources, of which nearly $331.0 million will come from net bond proceeds.
Debt Service Funds, which account for principal and interest on long-term debt, will total $608.6
million, or 9.4%, of total resources. This includes $20.5 million of appropriated Debt Service
Stabilization Fund balance.
53 For more information on fund balance see p. 47 of this analysis.
General Operating Funds
$5,459.8 84.5%
Capital Projects Funds$391.2
6.1%
Debt Service Funds$608.6
9.4%
CPS FY2017 Resources for All Funds(in $ millions)
Note: Differences in totals from the budget book are due to rounding.Source: CPS FY2017 Budget Interactive Reports, Revenues and Expenditures, available at www.cps.edu (last accessed August 10, 2017).
Total FY2017Resources for All
Funds:$6,459.5 million

30
In FY2017 41.2% of all CPS resources, or nearly $2.7 billion, will come from local property tax
revenues. This is an increase of $300 million, or 7.5%, from the prior year. General State Aid
will provide the second largest component of the CPS revenue stream in FY2017, at 16.4%, or
just over $1.1 billion. Other State Revenue, the budget’s third largest resource, encompasses all
other revenue from the State excluding General State Aid, including block and other grants, State
Pension Aid for Teachers and Driver’s Education monies. In FY2017 Other State Revenue will
compose 14.4% of the District’s budget at $931.0 million, and is driven largely by the assumed
$215.2 million State pension aid, which is in addition to the statutorily required $12.2 million
pension payment from the State.54 If the State of Illinois does not contribute $215.2 million to the
District for teachers’ pensions, Other State Revenue will decrease to $715.8 million. Federal
funds will make up the fourth largest revenue source at 13.3% of total resources, or $860.7
million. Appropriated Fund Balance will provide 1.3% of the District’s resources at $80.8
million. In FY2017 the District will receive no investment income. Other Local Revenue, Other
54 Chicago Teachers’ Pension Fund Comprehensive Annual Financial Report, FY2015, p. 92 and FY2014, p. 91.

31
Financing Sources and the Personal Property Replacement Tax account for the remaining 13.4%
of FY2017 resources at a total of $867.6 million.
The following table details the approximately $6.0 billion in total revenues and nearly $6.5
billion in total resources proposed in the CPS FY2017 proposed budget. As previously noted, if
the State does not provide $215.2 million in additional pension funding, total revenues will
decrease to $5.8 billion and total resources will decrease to $6.2 billion. In FY2017 the District
will receive nearly $3.2 billion in local government revenue, including almost $2.7 billion in net
property tax revenues. Property tax revenue in FY2017 will increase by $250 million over
FY2016 due to a legislative measure that will allow CPS to levy a special property tax dedicated
to the Chicago Teachers’ Pension Fund.55 The District will also increase its property tax levy by
0.7%, the maximum increase allowed under the Property Tax Extension Law Limit (PTELL),
and will levy for new property, to generate an additional $50.0 million in property tax revenue.
State revenues in FY2017 total nearly $2.0 billion which, again, assumes an additional $215.2
55 Public Act 99-0521
Fund Balance Revenue
$80.8 1.3%
Property Tax Revenue
$2,659.8 41.2%
Replacement Tax
$188.8 2.9%Other Local Revenue
$343.0
5.3%
General State Aid$1,059.8
16.4%
Other State Revenue$931.0
14.4%
Federal Revenue$860.6
13.3%
Investment Income$-
0.0%
Other Financing Sources
$335.7 5.2%
CPS FY2017 Resources for All Funds by Source(in $ millions)
Note: Differences in totals from the budget book are due to rounding.Source: CPS FY2017 Proposed Budget, pp. 23-25.
Total FY2017Resources for All
Funds:$6,459.5 million

32
million pension contribution from the State; if the additional pension funding does not
materialize, state revenue will fall to $1.8 billion. Federal aid is expected to remain relatively
flat, totaling $860.6 million. The District plans to use $80.8 million in General Operating Fund
balance, as well as $20.5 million in Debt Service fund balance for a total of $101.3 million in
appropriated reserves as resources in FY2017. In addition, CPS states it will issue approximately
$335.7 million in new bonds to finance the capital program, bringing total FY2017 resources to
nearly $6.5 billion.56
Two-Year and Five-Year All Funds Resource Trends by Source
Total revenues are the sum total of local, state and federal revenues and investment income. The
FY2017 budget projects a 0.6%, or $34.5 million, decrease in total revenue from FY2016
approved budget levels. However, the estimated FY2016 total revenue at year-end is $512.6
million lower than originally projected, due largely to $480.0 million in unrealized pension
funding from the State. Projected total revenue for FY2017 is 8.6% higher than the estimated
year-end FY2016 total revenue.57 If the District does not receive the $215.2 million in pension
funding it is relying on, total revenues will decrease by 4.1%, or $249.7 million from approved
FY2016 levels.
Total resources are total revenues plus other financing sources such as the proceeds of bond sales
and one time revenue sources like appropriated fund balance. The FY2017 budget projects a
7.3%, or $506.7 million, decrease in total resources from the FY2016 adopted budget. Without
56 Following the release of the FY2017 proposed budget, CPS announced it would issue an additional $945 million
in bonds to pay for capital projects. Juan Perez, Jr. “Chicago Public Schools sets hearing on another massive bond
issue,” Chicago Tribune, August 16, 2016. 57 Calculation made based on Total Revenue for FY2016 End of Year and FY2017 Budget found in the CPS
FY2017 Proposed Budget, pp. 23-24.
General
Operating Capital
Debt
Service Total
Property Taxes 2,607.8$ -$ 52.0$ 2,659.8$
Replacement Tax 130.5$ -$ 58.3$ 188.8$
Other Local Revenue 208.1$ 39.4$ 95.5$ 343.0$
Subtotal Local Revenue 2,946.4$ 39.4$ 205.8$ 3,191.6$
General State Aid 686.4$ -$ 373.4$ 1,059.8$
Other State Revenue 701.0$ 14.8$ -$ 715.8$
Budgeted Add'l State Pension Funding 215.2$ -$ -$ 215.2$
Subtotal State Revenue 1,602.6$ 14.8$ 373.4$ 1,990.8$
Federal Revenue 829.8$ 6.0$ 24.8$ 860.6$
Investment Income -$ -$ -$ -$
Total Revenues 5,378.8 60.2 604.0$ 6,043.0$
Other Financing Sources -$ 335.7$ 335.7$
Appropriated Fund Balance 80.8$ -$ -$ 80.8$
Total Resources 5,459.6$ 395.9$ 604.0$ 6,459.5$
Note: Because of rounding, differences may occur from budget book.
CPS FY2017 Revenues and Resources by Fund Type
(in $ millions)
Source: CPS FY2017 Proposed Budget, pp. 11-12 and 23-25.

33
the $215.2 million in additional pension aid from the State of Illinois, total resources will
actually decrease by a total of 10.4%, or $721.9 million, from the FY2016 adopted budget.
Over the five year period between FY2013 and FY2017, total revenues and total resources have
increased. The fluctuation in total resources over the five year period represents the District’s
reliance on unsustainable fiscal practices like drawing down fund balance reserves and
borrowing to close its ongoing structural deficit.
The table below presents the changes in revenues and resources that have taken place from the
prior year and over a five-year period. A discussion of each revenue source follows.
Local Revenue
Over the two-year and the five-year period in the above table, total local revenue is trending
upward due in large part to increases in property tax revenue and possible additional State
pension funding.
Total Local Revenues are projected to increase by 6.7%, or $200.7 million from FY2016. This is
primarily due to legislation allowing the District to reinstate the levy for teacher pensions outside
the PTELL tax cap law. The District is also increasing the general property tax levy to the 0.7%
maximum amount allowable and levying for new property. As a result of these actions, property
tax revenues are projected increase in FY2017 by $300.0 million, or 12.7%, to nearly $2.7 billion
from FY2016 budgeted levels. TIF surplus in FY2017 will total $32.5 million, compared to
$87.2 million in FY2016.58 The Personal Property Replacement Tax (PPRT), which is a
corporate income tax the State collects from corporations and other business entities and
distributes to local taxing districts, is expected to decrease by $19.0 million, or 9.1%, to $188.8
million in FY2017. Of the $188.8 million, $58.0 million is dedicated to debt service and $130.5
million is dedicated to operations.59 This $19.0 million PPRT decrease is due to an adjustment
58 CPS FY2017 Proposed Budget, p. 26. 59 CPS FY2017 Proposed Budget, p. 25.
FY2013 FY2014 FY2015 FY2016 FY2017 Two-Year Two-Year Five-Year Five-Year
Source Actual Restated* Actual Adopted Proposed $ Change % Change $ Change % Change
Property Taxes 2,211.6$ 2,204.3$ 2,304.7$ 2,359.8$ 2,659.8$ 300.0$ 12.7% 448.2$ 20.3%
Replacement Taxes 185.9$ 188.0$ 202.1$ 207.8$ 188.8$ (19.0)$ -9.1% 2.9$ 1.6%
Other Local Revenue 322.1$ 286.5$ 377.3$ 423.3$ 343.0$ (80.3)$ -19.0% 20.9$ 6.5%
Subtotal Local Revenue 2,719.6$ 2,678.7$ 2,839.6$ 2,990.9$ 3,191.6$ 200.7$ 6.7% 472.0$ 17.4%
General State Aid 1,078.4$ 1,091.6$ 1,014.4$ 952.2$ 1,059.8$ 107.6$ 11.3% (18.6)$ -1.7%
Other State Revenue 737.4$ 751.1$ 832.7$ 764.3$ 715.8$ (48.5)$ -6.3% (21.6)$ -2.9%
Budgeted Add'l State Pension Funding -$ -$ -$ 480.0$ 215.2$ (264.8)$ -55.2% 215.2$ N/A
Subtotal State Revenue 1,815.8$ 1,840.8$ 1,847.1$ 2,196.5$ 1,990.8$ (205.7)$ -9.4% 175.0$ 9.6%
Federal Revenue 845.8$ 907.2$ 798.9$ 889.9$ 860.6$ (29.3)$ -3.3% 14.8$ 1.7%
Investment Income 7.3$ 15.6$ (92.8)$ 0.2$ -$ (0.2)$ -100.0% (7.3)$ -100.0%
Total Revenues 5,388.5$ 5,442.4$ 5,392.8$ 6,077.5$ 6,043.0$ (34.5)$ -0.6% 654.5$ 12.1%
Other Financing Sources 550.1$ 138.9$ 200.2$ 809.5$ 335.7$ (473.8)$ -58.5% (214.4)$ -39.0%
Appropriated Fund Balance -$ 823.7$ 891.2$ 79.2$ 80.8$ 1.6$ 2.0% 80.8$ N/A
Total Resources 5,938.6$ 6,405.0$ 6,851.7$ 6,966.2$ 6,459.5$ (506.7)$ -7.3% 520.9$ 8.8%Note: Because of rounding, differences may occur from budget book.
CPS Revenues and Resources All Funds by Source: FY2013-FY2017
(in $ millions)
Source: CPS FY2017 Proposed Budget, pp. 23-24; CPS FY2016 Adopted Budget, p.24; CPS 2013-2015 Comprehensive Annual Financial Reports.
*Due to a change in the revenue recognition period that occurred in FY2015, FY2014 values were restated retroactively in the FY2015 CAFR. State revenue values were not available in the
restatement, so they do not add up to the restated subtotal of state revenue.

34
made by the State to recoup overpayments to the District over several years. CPS receives 27.1%
of the total Cook County PPRT share, which is equivalent to 14.0% of the statewide total.60
Over the five-year period from FY2013 to FY2017, total local revenue is projected to increase by
17.4%, or $472.0 million, from $2.7 billion in FY2013 to nearly $3.2 billion in FY2017. The
District’s property tax revenue is projected to increase by $448.2, or 20.3%. The Personal
Property Replacement Tax is projected to increase by $2.9 million, or 1.6%, and Other Local
Revenue is projected to increase by $20.9 million, or 6.5%.
State Revenue
The District projects that the State of Illinois will provide a total of nearly $2.0 billion in
revenues in the FY2017 budget. This is a $205.7 million, or 9.4%, decrease from the FY2016
adopted budget due to $480.0 million of revenue for pension funding from the State that the
District was counting on in FY2016 but did not materialize.
General State Aid (GSA) is the State of Illinois’ method of providing aid to school districts and
is made up of two grants. The Equalization Formula Grant supplements each school district’s
resources to equalize funding across the state. This distribution formula assumes that school
districts will levy for all available local property taxes first before the State provides
supplemental funding to reach the foundation level, which is the minimum level of funding that
is achieved through a combination of State and local funds. The State’s foundation level will
remain at $6,119.0 per pupil in FY2017, the same level since FY2010.61 The last time the
foundation level increased was between FY2009 and FY2010, when it rose by $160.0, or 2.7%,
from $5,959 to $6,119 per pupil. In past years, the State prorated the foundation level funding
per pupil because it was not fully funded, leading to lower amounts of GSA for CPS and other
school districts. Additionally, General State Aid consists of a Supplemental Low Income grant,
known as the “poverty grant,” to supplement districts with higher concentrations of low income
children. Together, these two grants provide GSA funding per pupil that accounts for 13.0% of
the District’s total operating budget.62
This is the first year since FY2009 that the District will receive an increase in General State Aid
(GSA). GSA for the District is projected to increase by $107.6 million, or 11.3%, to $1.06 billion
in FY2017 compared to $952.2 million in FY2016. For FY2017, the State allocated increased
funding for CPS including $74.0 million of GSA hold harmless funding, a $29.0 million increase
in early childhood funding and a $102.4 million equity grant.63 Of the $1.06 billion in total GSA,
$373.4 million will be used for debt service, which is a dramatic increase from the $42.9 million
debt service amount budgeted in FY2016. This increase is the result of the expiration of one-time
savings due to the use of scoop and toss of bond refunding in FY2016. This means that only
$686.4 million of GSA will be available for operations in FY2017, compared to $909.3 million
in FY2016, a decrease of $222.9 million.64
60 CPS FY2017 Proposed Budget, p. 27. 61 CPS FY2017 Proposed Budget, p. 30. 62 CPS FY2017 Proposed Budget, p. 30. 63 Illinois State Board of Education, Public Act 99-0524 Grant Appropriations Forecast by School District, Excel
Spreadsheet. Last accessed at http://www.isbe.net/budget/ on July 14, 2016. 64 CPS FY2017 Proposed Budget, p. 30-31.

35
Other State revenues include state support for capital projects and grant funding such as the
General Education Block Grant and Educational Services Block Grant, which include funding
for programs like early childhood education and truants alternative optional education program
(TAOEP).
In FY2015, for the first time since FY2011, the State appropriated funds beyond the statutorily
required contribution to the Chicago Teachers’ Pension Fund (CTPF) to offset a portion of the
cost of benefit increases enacted under Public Act 90-0582. However, the additional $50.0
million appropriation by the State was well below the “goal and intention,” as noted by the
General Assembly in 40 ILCS 5/17-127, to contribute an amount equivalent to 20.0% or 30.0%
of the contribution made to the downstate Teachers’ Retirement System (TRS) pension fund. In
FY2016, the State only contributed $12.0 million to the CTPF, well below the funding goal of
20.0% or 30.0% of the TRS contribution of $3.7 billion, which would have totaled $740
million.65 In FY2017, the District projects that the State will make the statutorily required State
contribution of $12.2 million to CTPF plus an additional $215.2 million, for a total of $227.4
million.66 Without state intervention to help CPS with pension contributions to the C, the District
will see an additional $215.2 million decrease from FY2016.
Total state revenue has shown an upward trend since FY2013. Between FY2013 and FY2017,
General State Aid is projected to decrease by 1.7%, or $18.6 million. Other State Revenue is
projected to decrease by 2.9%, or $21.6 million. However, the District is also relying on a $215.2
million increase in pension funding from the State, which would actually increase other state
funding by 26.3% if it were to materialize.
Federal Revenue
Federal revenue has remained relatively flat during the two-year and five-year periods. Between
FY2013 and FY2017, federal revenue is projected to increase by 1.7%, or $14.8 million. Federal
revenues are expected to decrease by $29.3 million, or 3.3%, in the two-year period from
FY2016 to FY2017. Because much of federal revenue is allocated to schools for specific funding
purposes and then not spent in the fiscal year during which it was received, CPS has historically
carried over federal funding from year to year. This carryover obscures the actual decline in
federal funding, which would be greater if not for carryover funds. It is important to note that
most federal funding is restricted and can only be used to provide supplemental programs and
services to at-risk children from low income or non-English speaking families or for neglected or
delinquent children from Pre-K through high school.67 Only Medicaid reimbursement and Impact
Aid are unrestricted funds and together account for $158.0 million, or 18.4%, of Federal
revenues.68 Federal reimbursements for CPS’s universal school breakfast and lunch programs
will decrease from $213.0 million in FY2016 to $209.0 million in FY2017 due to lower
enrollment.69
65 CPS FY2017 Proposed Budget, p. 150. 66 CPS FY2017 Proposed Budget, p. 148. 67 CPS FY2017 Proposed Budget, p. 32. 68 CPS FY2017 Proposed Budget, pp. 33-34. 69 CPS FY2017 Proposed Budget, p. 34.

36
Similar to the way GSA funding is calculated, Title I funds, which make up the majority of the
District’s federal funding, are calculated based upon Census data related to the number of
children in poverty relative to other districts. The vast majority of CPS students, 86.0%,70 are
economically disadvantaged,71 which is an indicator of poverty frequently used within school
districts to determine a school’s eligibility for Title I funds.72 The reduction in Title I funds has
been tempered because the Illinois State Board of Education (ISBE) has a 95.0% hold harmless
provision for high poverty school districts, limiting the amount of an annual reduction.73 In
FY2017 CPS expects to receive Title I-A – Low Income funding, which is the largest grant
received under the No Child Left Behind Act, of $293.0 million including $43.0 million in
allowable carryover funds.74
Other Resources
The District is projecting that investment income revenue will decrease to zero in FY2017. The
Other Financing Sources category represents proceeds from the sale of bonds.75 Other financing
sources are projected to decrease over the two-year and five-year period to $335.7 million in
FY2017. In FY2017 the District also plans to appropriate $101.3 million in fund balance, which
is a decrease of $25.5 million, or 20.1%, from FY2016.
Property Tax Levy and Revenue
CPS expects its FY2017 property tax revenues to total nearly $2.66 billion, an increase of $300.0
million from the FY2016 approved budget. The increase is primarily due to a reinstatement of
the District’s dedicated pension levy, which will allow the District to capture $250.0 million in
new revenue to fund the Chicago Teachers’ Pension Fund outside of PTELL. The additional
$50.0 million increase in revenue is attributed to $17.0 million from a 0.7% increase in the tax
extension on existing property based on the inflation rate, and $33.0 million from the tax
extension on new property and variability in the collection rate.76 CPS plans to allocate $2.61
billion of its property tax revenue to the General Operating Fund and $52.0 million to the Debt
Service Fund.77
CPS and other non-home rule taxing bodies in Cook County have been subject to the Property
Tax Extension Limitation Law (PTELL) since tax year 1994 (payable in 1995). In general, the
tax cap law allows tax extensions on existing property to rise each year by the lesser of 5.0% or
the increase in the Consumer Price Index. For 2017, the tax cap law permits a 0.7% increase on
existing property value for property tax funds subject to the law. The tax cap also allows the tax
70 CPS Office of Accountability, last updated February, 2015, http://www.cps.edu/about_cps/at-a-
glance/pages/stats_and_facts.aspx. 71 Determined by those whose families’ income is within 185.0% of the federal poverty line. 72 The State of Illinois instead uses the number of students receiving services through Medicaid, Supplemental
Nutrition Assistance Program (SNAP) and Temporary Assistance for Needy Children (TANF) in its determination
of Supplemental General State Aid (SGSA). 73 Communication with CPS Office of Budget and Management, July 16, 2014. 74 CPS FY2017 Proposed Budget, p. 32. 75 This line is called “Bonds & Other” in the CPS budget book. 76 CPS FY2017 Proposed Budget, pp. 26-27. 77 CPS FY2017 Budget Interactive Reports, Revenues and Expenditures, available at cps.edu/fy17budget.
37
rate calculated on the value of existing property to be applied to new property, thus generating
additional revenue.78
The tax year 2016 extension is paid by taxpayers in calendar year 2017 in first and second
installments. The first installment is equal to 55.0% of the prior year’s total tax bill and is due
March 1.79 The second installment includes the full year’s tax extension minus the amount
already paid in the first installment, so extension increases for a tax year are recognized by the
second installment when new tax rates are computed. Since 2012, the second installment tax bill
has been due on August 1.
The next table presents CPS actual property tax revenues from FY1991 to FY2015, estimated
revenues in FY2016 and proposed property tax revenues for FY2017. Between FY1991 and
FY2017, property tax revenues are projected to rise by 216%, or over $1.8 billion, from $842.3
million to nearly $2.7 billion. Between FY1991 and FY2015, the most recent year for which
audited data are available, CPS property tax revenues have increased by 171.7% or $1.5 billion.
79 P.A. 96-490 changed this amount from 50% to 55% of the prior year’s tax bill for tax year 2009 (first installment
due March of 2010) and thereafter. The rationale for this change was that it would mitigate taxpayers’ “sticker
shock” resulting from tax increases that appear on second installment tax bills.

38
Since FY1996, the first fiscal year that the tax cap law could limit CPS property tax revenues,
the compound annual growth rate of revenues (through FY2015 actual) was 3.9%.
Property tax years are the same as calendar years, while the CPS fiscal year runs July 1 to June
30. There is also a one-year lag in Cook County between when property taxes are levied and
when they are collected. Taxes levied in 2016 will actually be received in 2017. Previous to a
change in the District’s revenue recognition period in FY2015, the effect was that property tax
revenue was drawn from two separate tax years. However, since the District now counts revenue
collected 60 days after the end of its fiscal year on June 30 as revenue for the previous year, it
now receives both installments in the same fiscal year. The District’s upcoming FY2017 property
tax revenue will be drawn from the first and second installments of the 2016 tax year payments
in March and August.
Property Tax
Revenue
$ Change from
Previous Year
% Change from
Previous Year
FY1991 842,339$ -- --
FY1992 882,181$ 39,842$ 4.7%
FY1993 1,008,481$ 126,300$ 14.3%
FY1994 1,205,322$ 196,841$ 19.5%
FY1995 1,206,008$ 686$ 0.1%
FY1996 1,245,539$ 39,531$ 3.3%
FY1997 1,239,249$ (6,290)$ -0.5%
FY1998 1,278,734$ 39,485$ 3.2%
FY1999 1,311,664$ 32,930$ 2.6%
FY2000 1,368,081$ 56,417$ 4.3%
FY2001 1,403,657$ 35,576$ 2.6%
FY2002 1,429,871$ 26,214$ 1.9%
FY2003 1,479,968$ 50,097$ 3.5%
FY2004 1,546,335$ 66,367$ 4.5%
FY2005 1,571,065$ 24,730$ 1.6%
FY2006 1,639,237$ 68,172$ 4.3%
FY2007 1,718,249$ 79,012$ 4.8%
FY2008 1,767,760$ 49,511$ 2.9%
FY2009 1,813,917$ 46,157$ 2.6%
FY2010 1,896,540$ 82,623$ 4.6%
FY2011 2,047,163$ 150,623$ 7.9%
FY2012 1,936,655$ (110,508)$ -5.4%
FY2013 2,352,136$ 415,481$ 21.5%
FY2014 2,211,568$ (140,568)$ -6.0%
FY2015 2,289,000$ 77,432$ 3.5%
FY2016
Estimated 2,359,800$ 70,800$ 3.1%
FY2017
Proposed 2,659,800$ 300,000$ 12.7%
Source: CPS Comprehensive Annual Financial Reports, FY2015, pp.106-107;
FY2012, pp. 106-107; FY2010, pp. 98-99; FY1999, pp. 80-81; and CPS FY2017
Proposed Budget, p. 23.
CPS Property Tax Revenue: FY1991-FY2017
(in $ thousands)

39
The following graph illustrates the increase in CPS property tax extensions between tax year
1990 (payable in 1991) and tax year 2014 (payable in 2015) and the change in tax rates during
that period. While property tax extensions increased consistently, the tax rate decreased until
2009, then started to grow again in tax year 2010. The tax extension was $981.0 million in tax
year 1990 and rose gradually to nearly $2.5 billion in tax year 2015. The CPS tax rate fell from
4.246% in tax year 1990 to 2.366% in tax year 2009, before rising to 3.671% in tax year 2013
and falling again slightly to 3.450% in 2015, the most recent year for which tax rate data are
available. The District’s tax rate fell after the implementation of the tax cap law in 1994 even
though its extension rose because taxable property value grew at a faster rate than tax extensions
(rate = extension ÷ taxable value). In tax year 2010, the District’s rate began to rise again
because the taxable value of property in Chicago fell significantly.
The Property Tax Extension Limitation Law, or tax caps, limits maximum growth in the CPS
levy. Prior to 1994, the District’s tax extension was limited by a maximum rate for each property
tax fund. The fund rate limits still exist, but the tax cap law, not rate limits, has been the
operative limit on CPS tax increases since 1994.80 The limiting effect of the tax cap has also
meant that since 1994, tax increment financing has not diverted property tax revenue from CPS.
80Civic Federation, “The Cook County Property Tax Extension Process: A Primer on Levies, Tax Caps and the
Effect of Tax Increment Financing Districts,” June 22, 2013.

40
CPS receives the full extension to which it is entitled by the tax cap law. The effect of TIF is to
raise tax rates for all property taxpayers, not to divert revenue from local governments.81
Timing of CPS Property Tax Receipts and the New Revenue Recognition Policy
Prior to FY2015, property tax revenues that arrived after the end of the fiscal year could be
accounted for as long as the revenues were received within 30 days of the close of the fiscal year,
or through July 30. This window of time is known as the revenue recognition period.
Historically, Cook County sent property tax bills out late and thus received payments late. Late
payments led to delayed distributions of revenue to all of the County’s taxing bodies, including
CPS, therefore falling outside of the revenue recognition period. In summer 2012, for the first
time in over 30 years, the County sent out property tax bills on time with a due date of August 1
and CPS received the property tax funds within its 30 day revenue recognition period. The
accelerated property tax receipts left the FY2012 year-end audited General Fund with
unexpected additional fund balance. The District then assumed the same property tax revenue
receipts would occur in subsequent fiscal years.
81 Civic Federation, “The Cook County Property Tax Extension Process: A Primer on Levies, Tax Caps and the
Effect of Tax Increment Financing Districts,” June 22, 2013.
4.246%
2.366%
3.450%
0.0%
0.5%
1.0%
1.5%
2.0%
2.5%
3.0%
3.5%
4.0%
4.5%
5.0%
$-
$500,000,000.0
$1,000,000,000.0
$1,500,000,000.0
$2,000,000,000.0
$2,500,000,000.0
$3,000,000,000.0
Tax Extension ($)
Tax Rate (%)
Tax caps introduced in
1994
CPS Property Extensions and Rates: Tax Years 1990-2015

41
Beginning in FY2015, CPS adopted a new revenue recognition policy extending the period in
which property tax revenues can be recognized from 30 days after the close of the fiscal year to
60 days after the close of the fiscal year.82 CPS noted that this change would reduce the volatility
in property tax collection timing. The District acknowledges that its policy does not impact the
total amount of property tax revenue received by the District but that the timing of the property
tax receipts does impact the fiscal year in which the revenue must be recorded.83 More
importantly, it was used as an accounting mechanism to close the budget gap in FY2015.
PERSONNEL
This section of the analysis presents the District’s full-time equivalent (FTE) position count by
type and personnel appropriation trends for general operating funds by type. The analysis
compares the FY2017 proposed budget to the FY2013, FY2014, FY2015 and FY2016 approved
and amended budgets and actuals when available.
Two-Year and Five-Year Full-Time Equivalent (FTE) Positions by Type
The District’s FTE position count in FY2017 will decrease by 1,271.6 FTEs, or 3.3%, from the
FY2016 approved budget. Over the two-year period, the largest reduction in FTEs will be
teachers, which will decline by 3.6%, or 747.1 FTEs. The reduction in teacher positions is
primarily due to an overall decline in student enrollment.84 The second largest reduction in
position count will be city-wide student support, which will decrease by 7.7%, or 405.0 FTEs.
The position count for central and network offices will decline by 18.2%, or 220.9 FTEs. School
administrators will see the smallest reduction, which will decline by 4.7%, or 48.0 FTEs. School
support staff will increase by 1.5%, or 149.4 FTEs.
Between FY2013 and FY2017, total FTE positions for the District will decrease by 9.2%, or
3,778.2 FTEs. School support staff will decrease by 2,765.0 FTEs, or 21.2%, over the five-year
period. The large decline in school support staff is the result of efficiencies, streamlining and
restructuring of operations related to food service, custodial and engineering services.85 The
second largest decline will be teacher positions, which will see a decline of 1,773.1 FTEs, or
8.1%, over the five-year period. School administrators and central and network offices will also
see declines of 223.0 FTEs and 421.9 FTEs, or 18.7% and 29.9%, respectively. City-wide
student support will increase by 1,404.8 FTEs, or 40.6% over the five-year period. City-wide
student support staff has increased over the five-year period primarily due to the restructuring of
82 CPS FY2017 Proposed Budget, p. 213. 83 CPS FY2015 Proposed Budget, pp. 9-10. 84 Matt Masterson, “CPS to Cut More Than 1,000 Teaching, Support Staff Positions, WTTW, August 5, 2016,
http://chicagotonight.wttw.com/2016/08/05/cps-cut-more-1000-teaching-support-staff-positions (last visited August
12, 2016). 85 CPS FY2016 Proposed Budget, p. 11.

42
operations related to food service, custodial and engineering services, which were previously
budgeted under individual school budgets, as noted above.
Two-Year and Five-Year Personnel Appropriations for General Operating Funds
CPS total compensation costs are expected to decrease by $174.4 million, or 4.5%, in FY2017
from the FY2016 approved budget. Salaries, which constitute 63.3% of all employee
compensation, will decrease by $203.5 million, or 8.0%, over the two-year period. Benefit costs,
which include pensions, hospital and dental insurance, unemployment compensation and payroll
tax contributions for Social Security86 and Medicare, will increase by 2.2%, or $29.1 million, in
FY2017. The vast majority of this increase can be attributed to a $45.0 million net increase in the
CPS contribution toward the Chicago Teachers Pension Fund in FY2017.87 The District’s $843.6
million total contribution toward teacher pensions in FY2017 includes a 7% “pension pick-up”
of the 9% annual employee contributions. With Public Act 96-0889, the Illinois General
Assembly had granted the District budgetary relief in FY2011, FY2012 and FY2013 by lowering
its annual required pension contribution to the Chicago Teachers’ Pension Fund to an amount
equivalent to the normal cost for that fiscal year.88 In FY2015 the State contributed $62.0 million
towards the Chicago Teachers’ Pension Fund.89 In FY2016 the State contributed $12.0 million
towards the Chicago Teachers’ Pension Fund.90 In FY2017 the State will again contribute $12.0
million towards the Chicago Teachers’ Pension Fund, plus an additional $215.2 million towards
the normal cost of pensions only if the Illinois General Assembly passes pension reform.91
Over the five-year period between FY2013 to FY2017, total compensation costs will increase by
9.0%, or $307.2 million. Appropriations for teacher and non-teacher salaries will decline by
$225.6 million, or 8.8%. Appropriations for employee benefits will increase by 64.3%, or $532.8
million, between FY2013 and FY2017, rising from $828.4 million to $1.4 billion. This increase
in benefit costs can be partially attributed to a $506.8 million, or 150.5%, increase in total
teacher pension contributions including the employee contribution “pension pick-up” between
FY2013 and FY2017. CPS also picks up 7% of the 8.5% employee contribution for non-teacher
86 Non-teaching staff contribute to Social Security. 87 CPS FY2017 Proposed Budget, p. 11. 88 “Normal cost” is an actuarially calculated amount representing that portion of the present value of pension plan
benefits and administrative expenses which is allocated to a given valuation year. 89 CPS FY2017 Approved Budget, p. 142. 90 CPS FY2016 Approved Budget, p. 143. 91 CPS FY2017 Proposed Budget, p. 150, See p. 54 of this analysis for more information about Chicago Public
Schools contributions to teacher pensions.
FY2013
Amended
FY2014
Approved
FY2015
Approved
FY2016
Approved
FY2017
Proposed
Two-Year #
Change
Two-Year
% Change
Five-Year
# Change
Five-Year
% Change
Teachers 21,786.4 20,373.0 21,080.9 20,760.4 20,013.3 -747.1 -3.6% -1,773.1 -8.1%
School Administrators 1,191.0 1,084.0 1,026.0 1,016.0 968.0 -48.0 -4.7% -223.0 -18.7%
School Support Staff 13,014.0 11,086.8 10,509.5 10,099.6 10,249.0 149.4 1.5% -2,765.0 -21.2%
Central and Network Offices 1,413.0 1,430.0 1,299.5 1,212.0 991.1 -220.9 -18.2% -421.9 -29.9%
City-wide Student Support 3,461.2 4,877.8 5,290.5 5,271.0 4,866.0 -405.0 -7.7% 1,404.8 40.6%
Total 40,865.6 38,851.6 39,206.4 38,359.0 37,087.4 -1,271.6 -3.3% -3,778.2 -9.2%
Chicago Public Schools Full-Time Equivalent (FTE) Positions By Type
FY2013-FY2017
Source: CPS FY2013 Amended Budget, Interactive Reports, Home, available at www.cps.edu (last visited August 11, 2016); CPS FY2014 Approved Budget, Interactive Reports,
Positions, available at www.cps.edu (last visited August 11, 2016); CPS FY2015 Approved Budget, Interactive Reports, Positions, available at www.cps.edu (last visited August 11,
2016); and FY2016 Approved Budget, Interactive Reports, Positions, available at www.cps.edu (last visited August 11, 2016); and CPS FY2017 Proposed Budget, Interactive Reports,
Positions, available at www.cps.edu (last visited August 11, 2016).

43
union employees. However, in FY2016 the District started to phase out the pickup for non-union
non-teacher employees. The “pension pick-up” decreased from 7% to 5% and to 3% in FY2017.
In FY2018 the District will completely phase out this practice and non-union employees will
contribute the full employee portion toward their pensions.92
The next exhibit shows the District’s employee compensation expenditures as a percentage of all
operating funds expenditures. The chart compares FY2017 proposed appropriations to FY2016
approved appropriations and actual expenditures from FY2013 through FY2015. Similar to the
table above, total compensation expenditures include salaries and pension benefits for teachers
and education support staff, health expenses, Medicare and Social Security, workers’
compensation and unemployment compensation.
Over the five-year period the percentage of all operating funds appropriations dedicated to
personnel has averaged 69.3%, with a low of 68.0% in FY2017 and a high of 70.0% in FY2015.
Since FY2013 compensation expenditures have increased by 9.0%, or $307.2 million, rising
from $3.4 billion in FY2013 to $3.7 billion in FY2017. Other operating expenditures have
increased by 13.4% or $206.2 million, rising from $1.5 billion in FY2013 to $1.7 billion in
FY2017. As previously noted, compensation expenditures have increased primarily due to
increased teacher pension contributions. The increase in other expenditures is primarily due to an
increase in contractual and contingency expenditures. Contingencies include funding that has
92 CPS FY2017 Proposed Budget, p. 6.
FY2013 FY2014 FY2015 FY2016 FY2017 Two-Year Two-Year Five-Year Five-Year
Actual Actual Actual Approved Proposed $ Change % Change $ Change % Change
Salaries
Teacher Salaries 1,942.0$ 1,922.0$ 1,953.9$ 1,935.4$ 1,773.4$ (161.9)$ -8.4% (168.6)$ -8.7%
Ed. Support Salaries 633.5$ 619.5$ 622.6$ 618.0$ 576.5$ (41.5)$ -6.7% (57.0)$ -9.0%
Total Salaries 2,575.5$ 2,541.4$ 2,576.5$ 2,553.4$ 2,349.9$ (203.5)$ -8.0% (225.6)$ -8.8%
Employee Benefits
Teacher Pension Employer Portion 207.7$ 613.0$ 696.5$ 687.1$ 721.0$ 33.9$ 4.9% 513.3$ 247.1%
Teacher Pension Pickup* 129.1$ 127.4$ 129.7$ 130.9$ 122.6$ (8.2)$ -6.3% (6.5)$ -5.0%
Total Teacher Pensions 336.8$ 740.4$ 826.2$ 818.0$ 843.6$ 25.7$ 3.1% 506.8$ 150.5%
Ed. Support Pension Employer Portion 63.0$ 63.2$ 63.4$ 57.0$ 58.2$ 1.1$ 2.0% (4.8)$ -7.7%
Ed. Support Pension Pickup* 39.3$ 38.7$ 38.6$ 39.5$ 34.4$ (5.0)$ -12.8% (4.9)$ -12.3%
Total Ed. Support Pension 102.3$ 101.9$ 102.0$ 96.5$ 92.6$ (3.9)$ -4.0% (9.7)$ -9.5%
Hospitalization/Other Comp. 319.8$ 343.3$ 357.1$ 347.3$ 359.4$ 12.2$ 3.5% 39.6$ 12.4%
Unemployment Compensation 9.1$ 16.4$ 8.1$ 8.9$ 8.5$ (0.4)$ -4.7% (0.6)$ -6.6%
Medicare/Social Security 36.4$ 36.0$ 36.6$ 38.8$ 36.4$ (2.4)$ -6.1% 0.0$ 0.1%
Workers' Compensation 24.0$ 25.6$ 25.9$ 22.7$ 20.6$ (2.1)$ -9.2% (3.4)$ -14.2%
Total Employee Benefits 828.4$ 1,263.6$ 1,355.9$ 1,332.2$ 1,361.2$ 29.1$ 2.2% 532.8$ 64.3%
Total Compensation 3,403.9$ 3,805.1$ 3,932.4$ 3,885.5$ 3,711.1$ (174.4)$ -4.5% 307.2$ 9.0%
Source: CPS FY2017 Proposed Budget, Interactive Reports, Revenues & Expenditures, available at www.cps.edu (last visited August 11, 2016); CPS FY2016 Approved Budget, Interactive
Reports, Revenues & Expenditures, available at www.cps.edu (last visited August 11, 2016); Chicago Public Schools Comprehensive Annual Financial Report (CAFR) FY2015, pp. 68, 71 and 87;
FY2014, pp. 69, 71 and 81; and FY2013, pp. 81, 83 and 93.
CPS Personnel Appropriations for General Operating Funds by Type: FY2013-FY2017
(in $ millions)
*CPS "picks up" 7% of the 9% annual employee pension contribution, meaning it pays 7% of the employee 9% contribution on behalf of teachers. CPS also picks up 7% of the 8.5% employee
contribution for non-teacher union employees. However, in FY2016 the District started to phase out the pickup for non-union non-teacher employees. The “pickup” decreased from 7% to 5% and to
3% in FY2017.

44
been budgeted but has yet to be allocated, which is primarily why the budgeted and proposed
contingency expenditures are higher than actual spending for contingencies.
ENROLLMENT
CPS is projecting an overall decline of student enrollment in FY2017. According to the FY2017
proposed budget, actual FY2016 enrollment was 392,285 students, which was a decline of 0.5%,
or 1,906 fewer students than originally projected. The projected enrollment for FY2017 is
387,023 students, which is a decline of 1.3%, or 5,262 students below FY2016 actual enrollment.
$3,403.9 $3,805.1 $3,932.4 $3,885.5 $3,711.1
$1,542.5
$1,645.1 $1,661.5 $1,806.3
$1,748.8
$-
$1,000.0
$2,000.0
$3,000.0
$4,000.0
$5,000.0
$6,000.0
FY2013 Actual FY2014 Actual FY2015 Actual FY2016 Adopted FY2017 Proposed
CPS Employee Compensation Appropriations as a Percentage of Total General Operating Fund Appropriations:
FY2013-FY2017 (in $ thousands)
Compensation Expenditures Other Expenditures
Source: CPS FY2017 Proposed Budget, Interactive Reports, Revenues & Expenditures, available at www.cps.edu (last visited August 11, 2016); CPS FY2016 Adopted Budget, Interactive Reports, Revenues & Expenditures, available at www.cps.edu (last visited August 11, 2016); Chicago Public Schools Comprehensive Annual Financial Report (CAFR) FY2015, pp. 68, 71 and 87; FY2014, pp. 69, 71 and 81; FY2013, pp. 81, 83 and 93.
$4,946.4
$5,450.1$5,691.8$5,593.9
$5,495.9
Projected
2016
Actual
FY2016
Projected
FY2017
Projected 2016 -
Actual 2016
# Change
Projected 2016 -
Actual 2016
% Change
Actual FY2016 -
Projected FY2017
# Change
Actual FY2016 -
Projected FY2017
% Change
394,191 392,285 387,023 (1,906) -0.5% (5,262) -1.3%
CPS Student Actual and Projected Enrollment:
FY2016 and FY2017
Source: CPS FY2017 Proposed Budget, p. 37; and CPS FY2016 Approved Budget, p. 34.

45
As the following exhibits indicate, total actual enrollment is projected to drop by 16,438
students, or 4.1%, between FY2013 and FY2017. The decline in student enrollment is primarily
attributed to the decline in birth rates.93
CPS is projecting preschool enrollment to remain relatively flat from FY2016. Actual preschool
enrollment for FY2016 was 22,556 students and is projected to increase to 22,567 students in
FY2017. The reason for the slight increase is due to the expanded investment in Early Childhood
Education, including the addition of 53 full-day preschools opening in FY2017.94 K-12 student
enrollment is projected to decline over the two-year period, by 1.43%, or 5,273 students.
Over the five-year period total student enrollment will decline by 4.1% or 16,438 students.
Preschool student enrollment has decreased by 7.9%, or 1,940 students. K-12 student enrollment
is projected to decline by 3.8%, or 14,498 students, over the five-year period.
93 CPS FY2017 Proposed Budget, p. 36. 94 CPS FY2017 Proposed Budget, p. 37.
Actual Actual Actual Actual Projected Two-Year Two-Year Five-Year Five-Year
FY2013 FY2014 FY2015 FY2016 FY2017 # Change % Change # Change % Change
Preschool 24,507 23,671 22,873 22,556 22,567 11 0.05% (1,940) -7.9%
K-12 378,954 376,874 373,810 369,729 364,456 (5,273) -1.43% (14,498) -3.8%
Total 403,461 400,545 396,683 392,285 387,023 (5,262) -1.3% (16,438) -4.1%
Source: CPS FY2017 Proposed Budget, pp. 37 and 187.
CPS Actual and Projected Student Enrollment:
FY2013-FY2017

46
The following graphically illustrates the overall downward trend in CPS total student enrollment
from FY2013 to FY2017.
RESERVES
The section begins with an overview of the way fund balance is classified and reported based on
standards set by the Governmental Accounting Standards Board, followed by an assessment of
CPS’ unrestricted fund balance compared to best practices set by the Government Finance
Officers Association. Then, we present the District’s own fund balance policy with an
assessment of CPS’ assigned fund balance for stabilization compared to its own standards. Next,
we discuss the use of CPS’ reserves to balance the FY2017 budget, followed by a discussion of
cash flow issues that impact the District’s use of reserves.
Fund Balance Policies and Definitions
Fund balance is a term commonly used to describe the net assets of a governmental fund and
serves as a measure of budgetary reserves.95 Starting in FY2011, the audited financial statements
for CPS include a modification in fund balance reporting, as recommended by the Governmental
95 Government Finance Officers Association, Appropriate Level of Unrestricted Fund Balance in the General Fund
(Adopted October 2009).
403,461
400,545
396,683
392,285
387,023
385,000
387,000
389,000
391,000
393,000
395,000
397,000
399,000
401,000
403,000
405,000
FY2013 FY2014 FY2015 FY2016 FY2017 (Projected)
Chicago Public Schools Student Enrollment TrendsFY2013-FY2017
Source: CPS Proposed FY2017 Budget, pp. 37 and 187.
47
Accounting Standards Board (GASB). GASB Statement No. 54 shifts the focus of fund balance
reporting from the availability of fund resources for budgeting purposes to the “extent to which
the government is bound to honor constraints on the specific purposes for which amounts in the
fund can be spent.”96 Prior to GASB 54, the categories for fund balance focused on whether
resources were available for appropriation. The unreserved fund balance thus referred to
resources that did not have any external legal restrictions or constraints.97
The current method of measuring fund balance per GASB 54 examines unrestricted fund
balance. In accordance with GASB 54 modifications, the GFOA identifies unrestricted fund
balance as “only resources without a constraint on spending or for which the constraint on
spending is imposed by the government itself.”98 These resources are the combined total
of committed fund balance, assigned fund balance and unassigned fund balance. The following
section provides further detail on the current components of fund balance.
Components of Fund Balance
GASB Statement No. 54 creates five components of fund balance, though not every government
or governmental fund will report all components. The five components are:
Nonspendable fund balance – resources that inherently cannot be spent such as pre-paid
rent or the long-term portion of loans receivable. In addition, this category includes
resources that cannot be spent because of legal or contractual provisions, such as the
principal of an endowment.
Restricted fund balance – net fund resources subject to legal restrictions that are
externally enforceable, including restrictions imposed by the constitution, creditors or
laws and regulations of non-local governments.
Committed fund balance – net fund resources with self-imposed limitations set at the
highest level of decision-making which remain binding unless removed by the same
action used to create the limitation.
Assigned fund balance – the portion of fund balance reflecting the government’s intended
use of resources, with the intent established by government committees or officials in
addition to the governing board. Appropriated fund balance, or the portion of existing
fund balance used to fill the gap between appropriations and estimated revenues for the
following year, would be categorized as assigned fund balance.
Unassigned fund balance – in the General Fund, the remaining surplus of net resources
after funds have been identified in the four categories above.99
GFOA Best Practices
The Government Finance Officers Association (GFOA) recommends “at a minimum, that
general-purpose governments, regardless of size, maintain unrestricted fund balance in their
general fund of no less than two months of regular general fund operating revenues or regular
96 Steven Gauthier, “Fund Balance: New and Improved,” Government Finance Review, April 2009 and GASB
Statement No. 54, paragraph 5. 97 Steven Gauthier, “Fund Balance: New and Improved,” Government Finance Review, April 2009. 98 Government Finance Officers Association, Appropriate Level of Unrestricted Fund Balance in the General Fund
(Adopted October 2009). 99 Steven Gauthier, “Fund Balance: New and Improved,” Government Finance Review, April 2009.

48
general fund operating expenditures.”100 Two months of operating expenditures is approximately
17%. Chicago Public Schools is a special purpose government, not a general purpose
government, but its size and the relative instability of its revenue stream make it prudent for the
District to maintain adequate reserves. The GFOA statement adds that each unit of government
should adopt a formal policy that considers the unit’s own specific circumstances and that a
smaller fund balance ratio may be appropriate for the largest governments.101
Audited Fund Balance Ratio: FY2006-FY2015
This section examines the District’s fund balance between FY2006 and FY2015, which is the
most recent year of audited financial information available. A complete ten-year trend analysis of
the District’s fund balance ratio is not possible because data for FY2011 and beyond has been
classified to reflect the implementation of GASB 54, which changed the guidelines for how
governments should report fund balances. Prior to FY2011, the District categorized its
unreserved fund balance into designated to provide operating capital and undesignated fund
balance. A designation is a subset of the unreserved balance where a limitation is placed on the
use of the fund balance by the government itself for planning purposes or to earmark funds.102 A
designation is a loose classification and can be changed by the government relatively easily. As
such, when assessing unreserved fund balance levels, we examine both designated and
undesignated fund balance.
The table below shows five years of CPS General Operating Fund balance and its ratio to
General Operating Fund expenditures. Between FY2006 and FY2010, the District’s unreserved
fund balance fluctuated between a low of 4.1% in FY2010 and a high of 9.8% in FY2007 and
FY2008.103 In FY2009 and FY2010 the fund balance ratio decreased significantly due to an
increase in General Operating Fund expenditures and a drawdown of fund balance. The fund
balance maintained during this period falls well below the GFOA’s recommended fund balance
of 17%.
100 GFOA, Appropriate Level of Unrestricted Fund Balance in the General Fund (Adopted October 2009). 101 GFOA, Appropriate Level of Unrestricted Fund Balance in the General Fund (Adopted October 2009).
“Unrestricted fund balance” includes Committed, Assigned and Unassigned fund balances. 102 Steven Gauthier, “Fund Balance: New and Improved,” Government Finance Review, April 2009. 103 The General Operating Fund and General Fund both refer to the CPS primary operating fund. The audit uses the
term General Operating Fund while the budget uses General Fund.
Unreserved General
Operating Fund
Balance
General Fund
Expenditures Ratio
FY2006 $ 307,720,000 $ 4,085,093,000 7.5%
FY2007 $ 404,843,000 $ 4,146,369,000 9.8%
FY2008 $ 432,391,000 $ 4,394,685,000 9.8%
FY2009 $ 311,422,000 $ 4,742,779,000 6.6%
FY2010 $ 198,461,000 $ 4,896,142,000 4.1%
Source: CPS FY2004-FY2010 Comprehensive Annual Financial Reports.
CPS Unreserved General Operating Fund
Fund Balance Ratio:
FY2006-FY2010

49
The following table presents unrestricted fund balance for FY2011 through FY2015 following
implementation of the GASB 54 changes in fund classifications. The increase in fund balance to
18.5% at the end of FY2012 was due primarily to timing shifts in property tax revenue receipts,
which shifted approximately $350 million in revenue from FY2013 to FY2012.104 In FY2015
unrestricted fund balance fell to 4.5% of general fund expenditures. This is a significant decline
from the 16.6% ratio in FY2013 and reflects the fact that reserves were used to balance several
budgets. The fund balance levels in FY2014 and FY2015 are well below the GFOA’s
recommendations. However, the GFOA acknowledges that it may be appropriate for large
governments like CPS to maintain a smaller fund balance ratio. CPS has its own fund balance
policy, which is discussed in the next section.
Since a ten-year trend analysis of the District’s fund balance ratio is not possible, in the interest
of government transparency, the Civic Federation recommends that all local governments,
including CPS, provide ten years of fiscal data in the GASB 54 format in the statistical section of
their audited financial statements if possible. The government should also provide a guide as to
how different fund balance lines were reclassified. An accurate trend analysis can only be
conducted with reclassified data.
Chicago Board of Education Fund Balance Policy
Chicago Public Schools adopted a fund balance policy in FY2008 that establishes a target fund
balance level for its general operating funds referred to as the stabilization fund. CPS policy
requires the Board to maintain an assigned fund balance of a minimum of 5% and a maximum of
10% of the operating and debt service budgets for the new fiscal year as a stabilization fund in
the General Fund when the budget is adopted.105 If the stabilization fund falls below 5% of the
upcoming operating and debt service budget, the Chief Financial Officer must present to the
Board of Education a plan to replenish the reserves within twelve months. If restoration is not
possible within twelve months, the Board must approve an extension of the restoration plan.106
The following table demonstrates CPS’ assignment of fund balance to its stabilization fund
Between FY2008 and FY2015. In several years the District failed to designate fund balance for
104 CPS FY2012 Comprehensive Annual Financial Report, p. 12; see also page 40 of this report. 105 CPS FY2017 Proposed Budget, p. 211. 106 CPS FY2017 Proposed Budget, p. 211.
General Operating
Fund Balance
General Fund
Expenditures Ratio
FY2011 $ 577,756,000 $ 4,909,952,000 11.8%
FY2012 $ 902,872,000 $ 4,888,328,000 18.5%
FY2013 $ 819,004,000 $ 4,946,370,000 16.6%
FY2014 $ 354,719,000 $ 5,450,131,000 6.5%
FY2015 $ 254,328,000 $ 5,620,366,000 4.5%Source: CPS FY2011 Comprehensive Annual Financial Report, p. 40 and 42;
FY2012, p. 42, 44 and 103; FY2013, p. 44, 46; FY2014, p. 36, 38; FY2015, p. 36,
38.
CPS Unrestricted General Operating Fund
Fund Balance Ratio:
FY2011-FY2015

50
stabilization and instead assigned fund balance to close the following years’ budget gaps. In
FY2010 and FY2012 through FY2015, CPS did not meet its own stated fund balance policy of
maintaining a minimum of 5% stabilization fund balance. The only years the District met its
policy were in FY2008 and FY2011.
Use of Reserves to Balance the FY2017 Budget
The CPS FY2017 operating budget is $5.45 billion and the debt service budget is $563.2 million,
which equals a total of $6.02 billion. The District notes that if it were to maintain its stabilization
fund at the targeted level, the balance should be $299.0 million.107 However, the budget projects
that the District will not have any net assets in the operating fund available to assign as a
stabilization fund in FY2017.
The following table demonstrates the District’s budgeted use of fund balance in FY2017
appropriations. The General Fund for Stabilization is projected to begin and end FY2017 with a
negative balance of $158.9 million. CPS plans to spend $80.8 million of its total operating funds,
leaving operating funds with a negative balance of $87.7 at the end of FY2017. CPS will also use
$20.5 million in its debt service stabilization fund to pay for debt service expenses in FY2017,
leaving just $0.1 million in the fund at the end of FY2017.
107 CPS FY2017 Proposed Budget, p. 179.
General Operating
Fund Balance
Designated/
Assigned for
Stabilization Fund
General Operating
and Debt Service
Expenditures Ratio
FY2008 $ 258,000,000 $ 4,655,123,000 5.5%
FY2009 $ 181,200,000 $ 5,043,948,000 3.6%
FY2010 $ - $ 5,280,029,000 0.0%
FY2011 $ 289,000,000 $ 5,242,049,000 5.5%
FY2012 $ - $ 5,262,822,000 0.0%
FY2013 $ - $ 5,336,779,000 0.0%
FY2014 $ - $ 5,918,035,000 0.0%
FY2015 $ - $ 6,153,859,000 0.0%
CPS Designated/Assigned
General Operating Fund Fund Balance for Stabilization:
FY2008-FY2015
Note: CPS stated in its FY2013 and FY2014 Proposed Budgets that the stabilization
fund is equivalent to an "assigned" fund balance under GASB 54. However, in FY2013
through FY2016, CPS projected spending down its entire fund balance, meaning it
assigned no fund balance for stabilization, only for balancing the following year's
budget.
Source: CPS Comprehensive Annual Financial Reports, Balance Sheet -
Governmental Funds, FY2008-FY2015.

51
Discussion of Cash Flow
CPS acknowledges that it has liquidity issues due to the timing throughout the year when
revenues are received and expenditures are paid. The majority of the District’s revenues are
received late in the fiscal year while large expenses such as payroll must be distributed
consistently throughout the year.108 In recent years, CPS has relied on spending down its
budgetary reserves to balance its recent budgets and on short term borrowing through Tax
Anticipation Notes (TANs)109 to provide cash between property tax payments. CPS issued
$700.0 million in TANs in FY2015 and $1.065 billion in TANs in FY2016.110 The credit will be
repaid from property taxes collected largely in FY2017.
Issuing TANs requires approval for a line of credit. In 2015 and early 2016, CPS’ credit rating
was downgraded to below investment grade status by three of the major credit ratings agencies.
As of February 2016, CPS holds ratings from Standard & Poor’s, Moody’s Investors Services
and Fitch Ratings of B+, B2 and B+ respectively.111 The District’s below investment grade status
results in higher borrowing costs. CPS plans to request authorization from the Board of
Education to issue up to $1.56 billion in TANs in FY2017.112 Adding this high level of short-
term borrowing to existing cash flow issues will result in the District operating on a negative
balance throughout the next year. For a detailed snapshot of the District’s liquidity profile
through FY2017, see page 174 of the CPS FY2017 Proposed Budget Book.
Prior to FY2015, property tax revenues that arrived after the end of the fiscal year could be
accounted for as long as the revenues were received within 30 days of the close of the fiscal year,
or through July 30. This window of time is known as the revenue recognition period.
Historically, Cook County sent property tax bills out late and thus received payments late. Late
payments led to delayed distributions of revenue to all of the County’s taxing bodies, including
108 CPS FY2017 Proposed Budget, p. 173. 109 TANs are backed by anticipated property tax revenues. 110 CPS FY2017 Proposed Budget, p. 173. 111 Chicago Public Schools. “Credit Ratings” available at
http://www.cps.edu/About_CPS/Financial_information/Pages/CreditRatings.aspx. 112 The Board of Education will consider the request at the board meeting on August 24, 2016. Resolution 16-0824-
RS6.
(in $ millions)
FY2016 Estimated
End of Year Balance
FY2017
Budgeted Use
FY2017 End of
Year Balance
Appropriated General Fund Reserves -$ -$ -$
General Fund for Stabilization (158.9)$ -$ (158.9)$
Workers' Comp/Tort Fund 32.9$ 12.2$ 20.7$
Supplemental GSA 45.0$ 45.0$ -$
Other Special Revenue 23.6$ 23.6$ -$
Not Available for Appropriations 50.5$ -$ 50.5$
Total Operating Fund Budgeted for Use (6.9)$ 80.8$ (87.7)$
Debt Service Stabilization Fund 20.6$ 20.5$ 0.1$
Source: CPS FY2017 Proposed Budget, p. 178.
CPS FY2017 Use of Fund Balance

52
CPS, therefore falling outside of the revenue recognition period. In FY2013, for the first time in
over 30 years, the County sent out property tax bills on time and CPS received the property tax
funds within its 30 day revenue recognition period. The accelerated property tax receipts left the
FY2012 year-end audited General Fund with unexpected additional fund balance.
Beginning in FY2015, CPS adopted a new revenue recognition policy extending the period in
which property tax revenues can be recognized from 30 days after the close of the fiscal year to
60 days after the close of the fiscal year.113 CPS noted that this change would reduce the
volatility in property tax collection timing. The District acknowledges that its policy does not
impact the total amount of property tax revenue received by the District but that the timing of the
property tax receipts does impact the fiscal year in which the revenue must be recorded.114 More
importantly, it was used as an accounting mechanism to close the year-end budget gap. For
example, due to property tax revenues received within the revenue recognition period in
FY2015, the District was able to account for an additional $648 million within its beginning of
year fund balance.115
MUNICIPAL EMPLOYEES’ PENSION FUND
Eligible non-teaching employees of CPS participate in the City of Chicago’s Municipal
Employees’ Annuity and Benefit Fund.116 As of December 31, 2014, approximately 16,732, or
55.5%, of the 30,160 active Municipal Fund members were CPS employees.117
The employer contribution for CPS employees participating in the Municipal Fund is made by
the City of Chicago, not by CPS. The City makes most of the Municipal Fund employer
contribution through its property tax levy and through reimbursements from its enterprise funds
such as the Water, Sewer and Airport Funds.118 CPS estimates that the FY2016 Municipal Fund
contribution from the City (recorded as revenue) will be $57.3 million.119 CPS does make some
contributions to the Municipal Fund on behalf of its employees. For union employees, CPS
“picks up” 7 percentage points of the annual non-teacher employee pension contribution of
8.5%. CPS is phasing out the pick-up for non-union, non-teacher employee pensions and will
fund three percentage points of their contributions in FY2017 before ending them entirely in
FY2018. The District’s FY2017 cost for the non-teacher employee pick-up is approximately
$30.1 million and is part of the District’s budgeted pension appropriation.120 The District
additionally reimburses the City for the employer pick-up of employees funded by federal grants;
this reimbursement is budgeted at $105,095 in FY2017.121
113 CPS FY2017 Proposed Budget, p. 213. 114 CPS FY2015 Approved Budget, pp. 9-10. 115 CPS FY2015 Approved Budget, p. 175. 116 40 ILCS 5/8-110. 117 CPS FY2015 Comprehensive Annual Financial Report, p. 70. 118 City of Chicago FY2016 Budget Overview, p. 136. In the City’s FY2012 budget, the City included
reimbursement from CPS for part of the statutory employer contribution the City made for CPS employees
participating in the Municipal Fund. The reimbursement amount proposed for FY2012 was $32.5 million, but has
been postponed indefinitely given the District’s ongoing financial difficulties. 119 CPS FY2017 Proposed Budget, p. 28 and Interactive Proposed Budget, Revenues and Expenditures, available at
cps.edu/budget. 120 CPS FY2017 Proposed Budget, p. 20, 149. Civic Federation calculation. 121 CPS FY2017 Interactive Proposed Budget, Revenues and Expenditures, available at cps.edu/budget.

53
On March 24, 2016, the Illinois Supreme Court struck down Public Act 98-0641 as
unconstitutional under the Illinois Constitution’s pension protection clause (Article XIII, Section
5). P.A. 98-0641 impacted non-teacher employees of CPS, increasing their contributions toward
the fund and affecting their automatic annual annuity increase once they retire. This meant that
as of January 1, 2015, non-teachers’ contributions to the Municipal Fund were increased by 0.5%
to 9.0% from the previous 8.5% level. Non-teacher retirees were made subject to a COLA
“pause” and reductions to future annuity increases. However, since CPS does not make the
employer contribution to the Municipal Fund, it was not impacted by the legislation’s employer
funding provisions. These provisions instead were to increase the City of Chicago’s
contributions to the Municipal Fund over several years until the City was contributing at a level
that would increase the funding level to 90.0% over 40 years.
In December 2014, two lawsuits were filed in Cook County Circuit Court that challenged the
constitutionality of pension reforms for the Chicago Municipal and Laborers’ funds.122 On July
24, 2015, Circuit Court Judge Rita Novak ruled that the legislation was unconstitutional and
ordered that the increased contributions that had been made by employees starting January 1,
2015 be refunded.123 The increased employer contributions were not made.
On August 3, 2016, the City of Chicago announced that it had come to an agreement in principle
with unions on how to put the Municipal Fund, “…on a path to solvency.”124 The agreement is
intended to increase employer funding of the Municipal Fund through a new water-sewer usage
tax on consumers imposed through the City’s home rule powers. The City would increase
payments over a 40-year plan to get to 90% funded. Another provision would create a new tier of
benefits for employees hired after January 1, 2017 that would increase employee contributions
by three percentage points and reduce the retirement age to 65 from the Tier 2 level of 67. Both
the new tier of benefits for new hires and the ability for the City to contribute more to the
Municipal Fund require action by the State of Illinois to change state statute, which controls
benefit levels and employer contributions.
The financial status of the Municipal Fund is examined in the Civic Federation’s annual analysis
of the City’s budget proposal and the Federation’s annual Status of Local Pension Funding
report.125 The next section focuses on the Chicago Teachers’ Pension Fund.
122 Civic Federation, “Chicago Pension Reform Litigation on Hold Pending Illinois Supreme Court Ruling,”
February 25, 2015, https://www.civicfed.org/civic-federation/blog/chicago-pension-reform-litigation-hold-pending-
illinois-supreme-court-ruling. 123 Judge Novak’s opinion and order is available at http://chicagotonight.wttw.com/sites/default/files/article/file-
attachments/Chicago%20Pension%20Ruling.pdf. 124 City of Chicago Press Release, “Mayor Emanuel Announces Final Pension Funding Solution Reached in
Partnership with Union Leaders for Municipal Employees’ Annuity and Benefit Fund,” August 3, 2016. Available at
http://www.cityofchicago.org/content/dam/city/depts/mayor/Press%20Room/Press%20Releases/2016/July/8.3.16Fin
alPensionFunding.pdf. 125 All reports are available at civicfed.org.
54
TEACHERS’ PENSION FUND
Certified CPS teachers are enrolled in the Public School Teachers’ Pension and Retirement Fund
of Chicago (CTPF). The data presented below are for the Teachers’ Pension Fund only. The
following subsections include a plan description, membership data, benefits provided, employer
and employee contributions, future funding projections and pension fund indicators. There is also
a discussion of the Fund’s liabilities as reported according to accounting standards required by
Governmental Accounting Standards Board Statements Number 67 and 68 (GASB 67 and 68).
Unless otherwise stated, the numbers used in this chapter are statutorily required numbers used
for funding purposes.
The fiscal year of the Teachers’ Pension Fund begins on July 1 and ends on June 30, as does the
fiscal year of CPS. The most recent data available are for FY2015, which ended on June 30,
2015.
Plan Description
The Public School Teachers’ Pension and Retirement Fund of Chicago is a cost-sharing
multiple-employer defined benefit pension plan created by the Illinois legislature in 1895 to
provide retirement, death and disability benefits for teachers and employees of the Fund.
Members include certified teachers at the Chicago Public Schools and charter schools.126 Plan
benefits and contributions can only be amended through state legislation.127
The fund is governed by a 12-member Board of Trustees. As prescribed in state statute, six
trustees are elected by the teacher members of the fund, three are elected by the annuitants, one
is elected by the principal and administrative members of the Fund and two are appointed by the
Chicago Board of Education.
Members of the Chicago Teachers’ Pension Fund do not participate in the federal Social Security
system.128
Membership
In FY2015 the Teachers’ Pension Fund had 57,820 members, including 28,114 retirees and
beneficiaries receiving benefits and 29,706 active employee members. In the ten years since
FY2006, the number of retirees and beneficiaries receiving benefits increased by 27.2%, or
6,009, and has grown each year. Conversely, the number of active employee members has
declined by 14.3%, or 4,976 members, over the same period. The ratio of active employees to
beneficiaries has fallen every year since FY2006. A decline in the ratio of active employees to
retirees can create fiscal stress for an underfunded pension fund like the CTPF because it means
126 Chicago Teachers’ Pension Fund, FY2015 Comprehensive Annual Financial Report, p. 26. 127 The Chicago Teachers’ Pension Fund statute is 40 ILCS 5/17, but the fund is also governed by other parts of the
pension code such as 40 ILCS 5/1-160, which defines the changes to benefits for new employees enacted in P.A. 96-
0889. 128 CPS did not participate in Medicare until 1986 but most CTPF members are now eligible for Medicare.
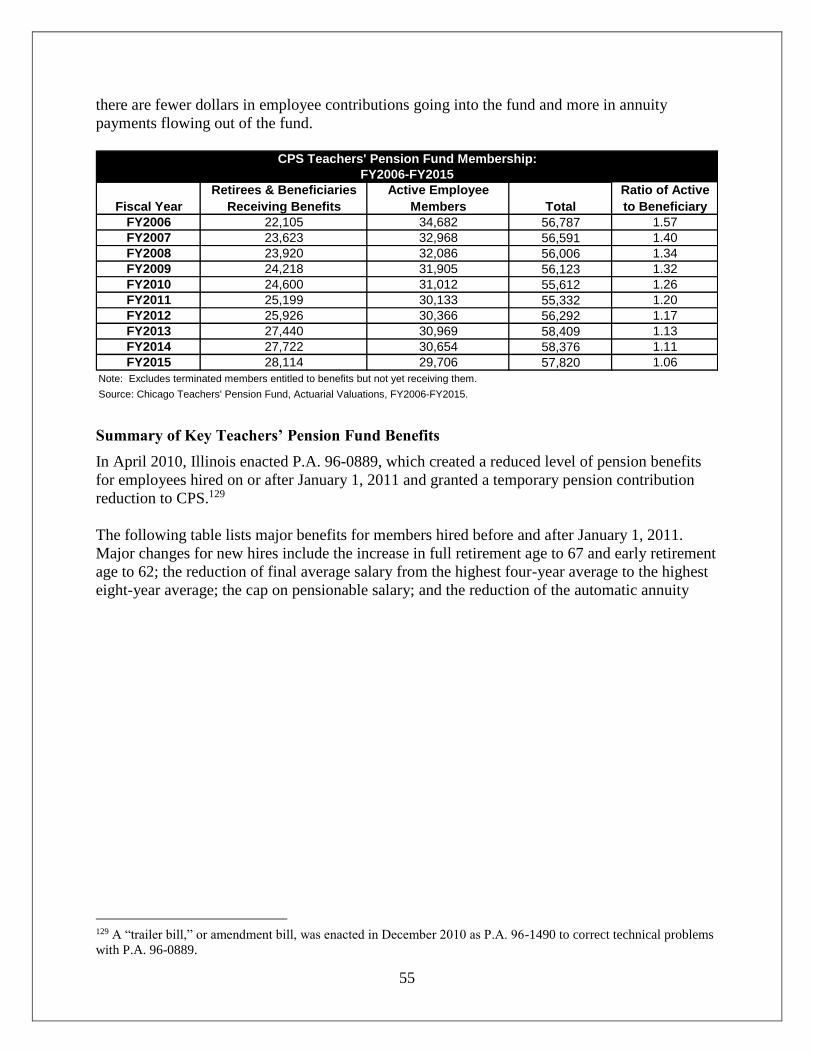
55
there are fewer dollars in employee contributions going into the fund and more in annuity
payments flowing out of the fund.
Summary of Key Teachers’ Pension Fund Benefits
In April 2010, Illinois enacted P.A. 96-0889, which created a reduced level of pension benefits
for employees hired on or after January 1, 2011 and granted a temporary pension contribution
reduction to CPS.129
The following table lists major benefits for members hired before and after January 1, 2011.
Major changes for new hires include the increase in full retirement age to 67 and early retirement
age to 62; the reduction of final average salary from the highest four-year average to the highest
eight-year average; the cap on pensionable salary; and the reduction of the automatic annuity
129 A “trailer bill,” or amendment bill, was enacted in December 2010 as P.A. 96-1490 to correct technical problems
with P.A. 96-0889.
Retirees & Beneficiaries Active Employee Ratio of Active
Receiving Benefits Members to Beneficiary
FY2006 22,105 34,682 56,787 1.57
FY2007 23,623 32,968 56,591 1.40
FY2008 23,920 32,086 56,006 1.34
FY2009 24,218 31,905 56,123 1.32
FY2010 24,600 31,012 55,612 1.26
FY2011 25,199 30,133 55,332 1.20
FY2012 25,926 30,366 56,292 1.17
FY2013 27,440 30,969 58,409 1.13
FY2014 27,722 30,654 58,376 1.11
FY2015 28,114 29,706 57,820 1.06
Note: Excludes terminated members entitled to benefits but not yet receiving them.
Source: Chicago Teachers' Pension Fund, Actuarial Valuations, FY2006-FY2015.
Fiscal Year Total
CPS Teachers' Pension Fund Membership:
FY2006-FY2015

56
increase from 3.0% compounded to the lesser of 3.0% or one half of the increase in Consumer
Price Index, simple interest.
Pension Contributions
The Teachers’ Pension Fund is funded through a combination of State, CPS and employee
contributions as described below.
Employer Contributions
The State statutes governing the Chicago Teachers’ Pension Fund require employer contributions
when the fund falls below a 90.0% funded ratio. As described on the following pages, relatively
small amounts are required from the State and from CPS pursuant to benefit enhancements
enacted in P.A. 90-582. Much larger contributions are required by CPS pursuant to P.A. 89-0015
and P.A. 96-0889 in order to bring the fund up to a 90.0% funded ratio over a 50-year period. A
contribution of $215.2 million from the State approximately equal to the normal cost of the fund
is required for FY2017 in House Amendment 3 to Senate Bill 2822, which passed both houses of
the Illinois General Assembly as part of a larger stopgap state spending agreement. However, the
legislation will not be sent to Governor Bruce Rauner to sign until and unless the Governor and
General Assembly can agree on a larger package of pension reforms for the state retirement
systems.130
130 Chicago Public Schools FY2017 Proposed Budget, p. 154. And “$5.4 billion CPS budget banks on pension
overhaul to close gap,” Bloomberg, August 9, 2016.
Employees Employees
hired before 1/1/2011 hired on or after 1/1/2011
Full Retirement Eligibility: Age
& Service
age 55 with 34 years of service; age 60
with 20 years of service; age 62 with 5
years of service
age 67 with 10 years of service
Early Retirement Eligibility:
Age & Serviceage 55 with 20 years of service age 62 with 10 years of service
Final Average Salary
highest average monthly salary for any 48
consecutive months within the last 10
years of service
highest average monthly salary for any 96
consecutive months within the last 10
years of service; pensionable salary
capped at $111,572*
Annuity Formula
Early Retirement Formula
Reduction0.5% per month under age 60 0.5% per month under age 67
Maximum Annuity
Annual Automatic COLA on
Retiree or Surviving Spouse
Annuity
3% compounded; begins at anniversary
date of retirement or 61st birthday,
whichever is later
lesser of 3% or one-half of the annual
increase in CPI-U, not compounded;
begins at the later of age 67 or the first
anniversary of retirement
Major Chicago Teachers' Pension Fund Benefit Provisions
*The maximum pensionable salary automatically increases by the lesser of 3% or one-half of the annual increase in the CPI-U. $111,572 is the 2015
limitation per the Illinois Department of Insurance.
Note: New hires are prohibited from simultaneously receiving a salary and a pension from any public employers covered by the State Pension Code
(i.e. "double-dipping").
Sources: Public School Teachers' Pension and Retirement Fund of Chicago, Statutorily Required Funding Valuation as of June 30, 2015, p. 26-27;
40 ILCS 5/9; Public Act 96-0889; and Public Act 96-1490.
2.2% of final average salary for each year of service**
** For service prior to 1998 there are different formulas for different amounts of service.
75% of final average salary

57
State Employer Contribution: The State of Illinois had traditionally contributed roughly $65.0
million each year to the Teachers’ Fund pursuant to 40 ILCS 5/17-127, which declares the
General Assembly’s “goal and intention” to contribute an amount equivalent to 20.0% or 30.0%
of the contribution it makes to the downstate Teachers’ Retirement System.131 However, the
traditional $65.0 million contribution was actually much less than the 20.0% or 30.0% intention
stated in the statute. The State’s enacted FY2010 budget reduced the usual $65.0 million
appropriation by 50.0% to $32.5 million.132 For FY2011 the State appropriated $32.5 million for
the Teachers’ Fund, but designated it specifically for retiree healthcare costs paid out of the fund,
so the amount is not considered part of the employer contribution in the calculation shown
below.133 There was no State contribution other than the statutory state contribution described
below in FY2012, FY2013, and FY2014.134 The State of Illinois’ FY2015 budget included a
$50.0 million contribution to the Chicago Teachers’ Pension Fund that is in addition to the
statutory contribution described below. This reduced the amount CPS must contribute to the fund
by $50.0 million.135 The FY2016 State of Illinois K-12 education budget, signed into law by
Governor Rauner on June 24, 2015, did not include any contribution to Chicago teachers’
pensions other than the statutory contribution. As noted above, the State may contribute more
funding to CPS pensions in FY2017 if State leaders can agree upon a larger pension reform
package.
Additional State Contribution: The State is required to make additional contributions in
FY2017 of 0.544% of teacher payroll to the Teachers’ Fund to offset a portion of the cost of
benefit increases enacted under Public Act 90-0582. No additional contributions are required if
the funded ratio is at least 90.0%. The required additional State contribution in FY2017 is
projected at $12.2 million, slightly up from FY2016.136
Additional CPS Contribution: CPS must make additional contributions of 0.58% of teacher
payroll to offset a portion of the cost of benefit increases enacted under Public Act 90-0582. No
additional contributions are required if the funded ratio is at least 90.0%. The required additional
contribution in FY2017 is projected at nearly $13.0 million, up slightly from FY2016.137
CPS Required Contribution: Under the funding plan established by P.A. 89-0015, the
minimum contribution to the Teachers’ Pension Fund was previously an amount needed to bring
the total assets of the fund up to 90.0% of the total actuarial liabilities by the end of FY2045. The
required CPS contribution was calculated as a level percentage of payroll over the years through
FY2045. The calculation for determining the CPS required contribution was the total amount of
the employer contribution less additional state appropriations, additional CPS appropriations and
http://www.chicagobusiness.com/article/20160809/NEWS13/160809850/cps-budget-uses-pension-overhaul-to-
close-gap 131 The downstate Teachers’ Retirement System covers all public school teachers in Illinois except for those teaching
in Chicago Public Schools. 132 Illinois State FY2011 Budget, pp. 5-8. 133 Information provided by the CPS budget office, August 17, 2010. 134 Chicago Public Schools FY2015 Proposed Budget, p. 147. 135 Chicago Public Schools FY2015 Proposed Budget, p. 147. 136 Chicago Teachers’ Pension Fund Comprehensive Annual Financial Report, FY2015, p. 92 and FY2014, p. 91. 137 Chicago Teachers’ Pension Fund Comprehensive Annual Financial Report, FY2015, p. 92 and FY2014, p. 91.

58
other employer appropriations.138 The funding schedule established in P.A. 89-0015 was changed
by P.A. 96-0889, enacted in April 2010. The new law reduced CPS’s required employer pension
contribution for FY2011, FY2012 and FY2013 to an amount estimated to be equivalent to the
employer’s normal cost.139 It also delayed the year that the pension fund must reach a 90.0%
funded ratio from 2045 to the end of 2059.
Prior to the passage of P.A. 96-0889, the CPS required contribution for FY2011 was calculated
to be $586.9 million, or almost double the FY2010 amount. P.A. 96-0889 reduced CPS’s
required FY2011 contribution to $187.0 million, which was approximately $158.0 million, or
45.8%, less than the prior year’s contribution.140 The table below shows the required employer
contributions for FY2010 through FY2017. The CPS required contribution for FY2013 was
$196.0 million, the FY2014 contribution was $600.0 million, the FY2015 required contribution
was $633.6 million, the FY2016 contribution was $675.1 million and the FY2017 contribution is
estimated at $720.2 million.141 However, the FY2017 contribution will be reduced to $505.0
million if the State of Illinois passes pension reform and Governor Rauner signs Senate Bill
2822. CPS makes its employer contribution to the funds at the end of its fiscal year, in June. Due
to the District’s deficit and cash flow issues, it used short term borrowing to make its
contribution on June 30, 2016.142
The exhibit below shows actuarial projections of required CPS contributions to the Teachers’
Pension Fund from FY2010 to FY2021 based on P.A. 96-0889. This exhibit does not include
extra amounts contributed for benefit enhancements. As noted above, the FY2011, FY2012 and
FY2013 amounts were fixed in State statute, but in FY2014 the required contribution was
actuarially determined as the schedule to reach 90.0% funded by the end of 2059 began. The
138 This annual required contribution must be calculated by February 28 each year, per 40 ILCS 5/17-129. 139 “Normal cost” is an actuarially calculated amount representing that portion of the present value of the pension
plan benefits and administrative expenses which is allocated to a given valuation year. 140 Actuarial projection by Goldstein & Associates for Kevin Huber, Executive Director of the Public School
Teachers’ Pension and Retirement Fund of Chicago, March 31, 2010. See also Illinois Commission on Government
Forecasting and Accountability, Illinois Public Retirement Systems: A Report on the Financial Condition of the
Chicago, Cook County and Illinois Municipal Retirement Fund Systems of Illinois, November 2010, p. 119. 141 Public School Teachers’ Pension and Retirement Fund of Chicago, Statutorily Required Funding Valuation as of
June 30, 2012, p. 25; Chicago Public Schools FY2015 Proposed Budget, p. 147; Public School Teachers’ Pension
and Retirement Fund of Chicago, Statutorily Required Funding Valuation as of June 30, 2014, p. i; Public School
Teachers’ Pension and Retirement Fund of Chicago, Actuarial Valuation and Review as of June 30, 2015, p. ii. 142 CPS FY2017 Proposed Budget, p. 153; Chicago Teachers’ Pension Fund, Current News,
http://www.ctpf.org/current_news/currentindex.htm.
FY2010 FY2011 FY2011 FY2012 FY2013 FY2014 FY2015 FY2016 FY2017
1 Total Required Employer Contribution 393,266,000$ 608,492,000$ 208,600,000$ 214,700,000$ 218,600,000$ 624,603,000$ 708,667,000$ 700,070,000$ 745,386,000$
2 State Employer Contribution* 32,522,400$ - - - - - 50,000,000$ - -
3 Additional State Contribution (P.A. 90-582)* 5,029,000$ 10,449,000$ 10,449,000$ 11,001,000$ 10,931,000$ 11,903,000$ 12,145,000$ 12,105,000$ 12,186,000$
4 Additional CPS Contribution (P.A. 90-582) 10,723,000$ 11,140,000$ 11,140,000$ 11,729,000$ 11,654,000$ 12,691,000$ 12,948,000$ 12,906,000$ 12,992,000$
CPS Required Contribution (1-2-3-4)
Per 40 ILCS 5/17-129 344,991,600$ 586,903,000$ 187,000,000$ 192,000,000$ 196,000,000$ 600,009,000$ 633,574,000$ 675,059,000$ 720,208,000$
5 State Payment Under Senate Bill 2822 215,200,000$
505,008,000$
before P.A. 96-
0889
after P.A. 96-
0889
Calculation of Required Employer Contributions to Teachers' Pension Fund
FY2010-FY2017
*At the time that the FY2010 required contribution was calculated, the State employer contribution was expected to be $65 million, and the Additional State Contribution was expected to be $10.1 million. These were the amounts used by the
actuary to calculate the final CPS Required Contribution. The FY2010 enacted State Budget ultimately appropriated only $32.5 million for the State Employer Contribution and $5.0 million for the Additional State Contribution. State of Illinois FY2011
Budget, p. 5-8.
Source: Chicago Public Schools FY2015 and FY2014 Proposed Budgets, p. 147 and 143; Chicago Teachers' Pension Fund Comprehensive Annual Financial Reports, FY2009, p. 75-76; FY2010, p. 80-81; FY2011, p. 84-85; FY2014, p. 91; Public
School Teachers' Pension and Retirement Fund of Chicago Actuarial Valuations, FY2010, p. 16, FY2011, p. 15, FY2012, p. iii, FY2013, p. iv, FY2014, p. i, FY2015, p. ii; Illinois State FY2012 Budget, Chapter 6-8; Illinois State FY2013 Budget,
Chapter 5-246; and actuarial projections by Goldstein & Associates for Kevin Huber, Executive Director of the Public School Teachers' Pension and Retirement Fund of Chicago, March 31, 2010.
CPS Required Contribution (1-2-3-4-5) if
Senate Bill 2822 Signed into Law

59
FY2014 contribution tripled from the previous year, growing by $404.0 million from $196.0
million in FY2013 to $600.0 million in FY2014. The FY2016 required contribution increased by
$41.5 million over FY2015. The required FY2015 employer contribution would have been larger
if the State of Illinois had not appropriated $50.0 million in additional funding for the Chicago
Teachers’ Pension Fund. This extra funding was not appropriated for FY2016. As noted above,
the contribution for FY2017 will decrease to $505.0 million if the SB2822 is signed into law by
Governor Rauner.
Employee Contributions
Employee contributions to the Teachers’ Pension Fund are statutorily set at 9.0% of the
employee’s salary. One percent of that 9.0% amount is for survivors’ and children’s pension
benefits.
CPS “picks up” 7.0% of the 9.0% annual employee pension contribution, meaning it pays seven
percentage points of the employee 9.0% contribution on behalf of teachers. Therefore, teachers
effectively pay 2.0% of their annual salary toward their pensions. The District’s FY2017 cost for
the 7.0% employee pick-up is approximately $127.0 million and is part of the District’s budgeted
$345.0
$187.0 $192.0 $196.0
$600.0
$683.6 $675.1
$720.2 $743.6
$767.3 $791.4
$815.7
$0.0
$100.0
$200.0
$300.0
$400.0
$500.0
$600.0
$700.0
$800.0
$900.0
FY2010 FY2011 FY2012 FY2013 FY2014 FY2015 FY2016 FY2017 FY2018 FY2019 FY2020 FY2021
CPS Required Contributions to Teachers' Pension Fund Per P.A. 96-0889: FY2010-FY2021(in $ millions)
Source: Public School Teachers' Pension and Retirement Fund of Chicago, Actuarial Valuation as of June 30, 2015, p. 37; Actuarial Valuation as of June 30, 2014, p. 24; Actuarial Valuation as of June 30, 2013, p. 25 ; Actuarial Valuation as of June 30, 2012, p. 25; Actuarial Valuation as of June 30, 2011, p. 16; Actuarial Valuation as of June 30, 2011, p. 15; and
Public Act 96-0889.

60
pension appropriation.143 CPS administration has included a phase out the pick-up as part of the
FY2017 budget. The Chicago Teachers Union has called the end of the pick-up a pay cut and a
possible cause for a strike.144
Pension Fund Indicators
The Civic Federation uses three measures to present a multi-year evaluation of the fiscal health
of the Teachers’ pension fund: funded ratios, unfunded actuarial accrued liabilities (UAAL) and
the investment rate of return. Note that the numbers used in the following section are calculated
as laid out in Illinois statute for funding purposes. A new section at the end of this chapter will
explore the funding and liabilities as calculated for reporting purposes under Governmental
Accounting Standards Board Statements 67 and 68.
Funded Ratios
This report uses two measurements of pension plan funded ratio: the actuarial value of assets
measurement and the market value of assets measurement. These ratios show the percentage of
pension liabilities covered by assets. The lower the percentage, the more difficulty a government
may have in meeting future obligations.
The actuarial value of assets measurement presents the ratio of assets to liabilities and accounts
for assets by recognizing unexpected gains and losses over a period of three to five years.145 The
market value of assets measurement presents the ratio of assets to liabilities by recognizing
investments only at current market value. Market value funded ratios are more volatile than
actuarial funded ratios due to the smoothing effect of actuarial value. However, market value
funded ratios represent how much money is actually available at the time of measurement to
cover actuarial accrued liabilities.
The following exhibit shows the actuarial and market value funded ratios for the Chicago
Teachers’ Pension Fund over the last ten years. The fund was 78.0% funded on an actuarial value
basis in FY2006, and this funded ratio fell to 49.7% in FY2013 before rising in FY2015 to
52.0%. The market value funded ratio fell from 81.4% in FY2006 to 53.7% in FY2009 and
143 CPS FY2017 Proposed Budget, pp. 20, 149. CPS also “picks up” 7.0% of employee contributions to the Chicago
Municipal Fund for some eligible non-teacher employees at a projected cost of $30.0 million in FY2017. 144Juan Perez Jr. and Marion Renault, “CPS proposes $5.4 billion budget, teacher pact similar to earlier submission,”
Chicago Tribune, August 8, 2016. http://www.chicagotribune.com/news/local/breaking/ct-chicago-schools-budget-
0809-20160808-story.html 145 For more detail on the actuarial value of assets, see Civic Federation, Status of Local Pension Funding FY2012,
October 2, 2014, https://www.civicfed.org/sites/default/files/StatusOfLocalPensionFundingFY2012.pdf The
Chicago Teachers’ Pension Fund smoothes returns over four years.
http://www.chicagotribune.com/news/local/breaking/ct-chicago-schools-budget-0809-20160808-story.html

61
recovered to 61.1% in FY2011 before fluctuating over the next several years and eventually
falling to 53.7% in FY2015.
Unfunded Actuarial Accrued Liability
Unfunded actuarial accrued liability is the dollar value of accrued liabilities not covered by the
actuarial value of assets. As shown in the exhibit below, the unfunded liability for the Teachers’
Pension Fund was nearly $3.1 billion in FY2006. Since FY2006 unfunded liabilities have
increased by 210.4%, rising to nearly $9.6 billion in ten years. In just one year, from FY2012 to
FY2013, unfunded liabilities grew by $1.6 billion. The significant increase in FY2013 despite
higher than expected investment returns (see next section) is due to changes in the actuarial
assumptions of the fund. The changes increased the fund’s unfunded actuarial accrued liability
by more than $1.0 billion compared to what the UAAL would have been without the assumption
changes. If the changes had not been made, the UAAL for the CTPF in FY2013 would have been
FY2006 FY2007 FY2008 FY2009 FY2010 FY2011 FY2012 FY2013 FY2014 FY2015
Actuarial Value 78.0% 80.4% 79.4% 73.6% 67.1% 59.9% 54.1% 49.7% 51.7% 52.0%
Market Value 81.4% 87.3% 75.5% 53.7% 55.0% 61.1% 54.5% 51.0% 55.6% 53.7%
0.0%
20.0%
40.0%
60.0%
80.0%
100.0%
120.0%
Fu
nd
ed
Ra
tio
Chicago Teachers' Pension Fund Funded Ratios -Actuarial Value of Assets and Market Value of Assets:
FY2006-FY2015
Source: Civic Federation calculations based on Chicago Teachers' Pension Fund Financial Statements, FY2006-FY2015.

62
nearly $8.6 billion.146 The UAAL increased in FY2015 from FY2014, mostly due to insufficient
employer contributions.147
A breakdown of the causes of the change in unfunded liability each year is available in the
annual actuarial valuations of the fund. The table below summarizes the changes as calculated by
the fund actuary from FY2006 to FY2015. The single largest contributor to the increase in
unfunded liability is the consistent failure of the employer contribution to be sufficient to cover
the employer’s normal cost for service earned that year, as well as the interest accrued on the
existing unfunded liability.148 This deficiency in employer contributions added $3.1 billion to the
unfunded liability between FY2006 and FY2015.
The second largest contributor to the unfunded liability over the past 10 years is a shortfall in
investment returns compared to expectations. The Fund’s annual actuarial valuation smoothes
the investment gains and losses over a period of four years, such that even if a single year’s
market rate of return exceeds the assumption, the four-year smoothed return may not. This was
146 Chicago Teachers’ Pension Fund FY2013 GASB 25 Actuarial Valuation, p. iv and FY2013 Statutory Actuarial
Valuation, p. iv. Civic Federation calculation. 147 Public School Teachers’ Pension and Retirement Fund of Chicago Statutorily Required Funding Valuation as of
June 30, 2015, p. 26. 148 Total increase in unfunded liability includes increase in FY2005 over FY2004, included in the first line of the
chart below.
$3,087.6 $2,917.5 $3,134.1
$4,140.3
$5,367.5
$6,800.0
$7,977.5
$9,586.2 $9,422.4 $9,585.2
$-
$2,000
$4,000
$6,000
$8,000
$10,000
$12,000
FY2006 FY2007 FY2008 FY2009 FY2010 FY2011 FY2012 FY2013 FY2014 FY2015
Millio
ns
Chicago Teachers' Pension Fund Unfunded Actuarial Accrued Liability:FY2006-FY2015(in $ millions)
Source: Chicago Teachers' Pension Fund Financial Statements, FY2006-FY2015.

63
the case in FY2011, when the market value rate of return was 24.7%, but the four-year smoothed
return was -0.5%, reflecting losses in FY2008 and FY2009. Conversely, in FY2014 the market
value rate of return reported in the actuarial valuation was 3.6%, far below the 7.75%
assumption, and the smoothed rate of return was 8.2% because high returns in FY2013 and
FY2014 were still being incorporated.149 However, over the ten-year period, the failure of
investment returns to meet the 8.0% or 7.75% assumption added nearly $2.0 billion to the
unfunded liability.
Investment Rate of Return
Investment income typically provides a significant portion of the funding for pension funds.
Thus, declines over a period of time can have a negative effect on pension assets. Between
FY2006 and FY2015, the Chicago Teachers’ Pension Fund average annual rate of return was
149 Chicago Teachers’ Pension Fund FY2014 Statutory Actuarial Valuation, p. 6.
Employer
Contribution
Lower/(Higher) than
Normal Cost Plus
Interest on
Unfunded Liability
Investment
Return
Lower/(Higher)
Than Assumed
Salary Increase
(Lower)/Higher
Than Assumed
Benefit
Increases
Change in
Actuarial
Assumptions,
Methods, or Data Other
Total Net UAAL
Change
FY2006 287,817,648$ (159,120,969)$ (7,751,201)$ -$ -$ 177,278,548$ 298,224,026$
FY2007 264,371,299$ (563,871,066)$ 12,680,902$ -$ -$ 69,273,370$ (217,545,495)$
FY2008 181,412,779$ 14,768,502$ 168,853,909$ -$ (386,588,901)$ 240,804,331$ 219,250,620$
FY2009 154,901,393$ 923,403,137$ 12,964,057$ -$ -$ (40,308,708)$ 1,050,959,879$
FY2010 146,648,566$ 941,589,095$ (118,648,048)$ -$ -$ 257,585,304$ 1,227,174,917$
FY2011 393,912,145$ 896,407,893$ (25,480,115)$ -$ -$ 167,678,088$ 1,432,518,011$
FY2012 532,383,133$ 685,743,831$ * -$ -$ (40,655,176)$ 1,177,471,788$
FY2013 621,672,350$ (281,738,207)$ * -$ 1,021,937,507$ 246,886,533$ 1,608,758,183$
FY2014 319,107,731$ (454,691,436)$ * -$ -$ (28,259,604)$ (163,843,309)$
FY2015 241,161,140$ (45,212,951)$ * -$ -$ (33,120,109)$ 162,828,080$
10-Year Total 3,143,388,184$ 1,957,277,829$ 42,619,504$ -$ 635,348,606$ 1,017,162,577$ 6,795,796,700$
* Change in UAAL due to salary assumptions no longer supplied separately with change in actuary in FY2012. Salary assumptions combined with Other in FY2012 and after.
Chicago Teachers' Pension Fund Reasons for Change in Unfunded Actuarial Accrued Liability:
FY2006-FY2015
Source: Chicago Teachers' Pension Fund, Actuarial Valuations, FY2006-FY2015.

64
7.66%.150 This is below the fund’s assumed rate of return of 7.75%. Returns ranged from a high
of 25.2% in FY2011 to a low of -21.7% in FY2009.
Pension Liabilities as Reported Under Governmental Accounting Standards Board Statements
Number 67 and 68
In 2012 the Governmental Accounting Standards Board (GASB) issued new accounting and
financial reporting standards for public pension plans and for governments, Statements 67 and
68. According to GASB, the new standards were intended to “improve the way state and local
governments report their pension liabilities and expenses, resulting in a more faithful
representation of the full impact of these obligations.”151 Among other disclosures, pension funds
and governments are now required to report total pension liability, fiduciary net position, net
pension liability, pension expense and actuarially determined contribution (ADC), which are
150 The Civic Federation calculates investment rate of return using the following formula: Current Year Rate of
Return = Current Year Gross Investment Income/ (0.5*(Previous Year Market Value of Assets + Current Year
Market Value of Assets – Current Year Gross Investment Income)). This is not necessarily the formula used by the
pension fund’s actuary and investment managers; thus investment rates of return reported here may differ from those
reported in a fund’s actuarial statements. However, this is a standard actuarial formula. Gross investment income
includes income from securities lending activities, net of borrower rebates. It does not subtract out related
investment and securities lending fees, which are treated as expenses. 151 Governmental Accounting Standards Board, Pension Standards for State and Local Governments. Available at:
http://www.gasb.org/jsp/GASB/Page/GASBSectionPage&cid=1176163528472.
10.7%
17.9%
-5.5%
-21.7%
14.1%
25.2%
0.0%
13.5%
18.3%
4.0%
-30.0%
-20.0%
-10.0%
0.0%
10.0%
20.0%
30.0%
FY2006 FY2007 FY2008 FY2009 FY2010 FY2011 FY2012 FY2013 FY2014 FY2015
Chicago Teachers' Pension Fund Investment Rate of Return:FY2006-FY2015
Source: Civic Federation calculations based on Chicago Teachers' Pension Fund Financial Statements, FY2006-FY2015.
10-Year Average = 7.66%

65
calculated on a different basis from previous GASB 25 and 27 pension disclosure requirements.
Both pension funds and governments must also disclose additional information about pensions in
the notes to the financial statements and in required supplementary information sections. It is
important to note that GASB intended to separate pension reporting from pension funding. Thus,
the numbers reported according to GASB 67 and 68 standards are not used to determine how
much a government must contribute to its pensions. They are a reporting, NOT a funding
requirement. Chicago Public Schools and other governments will continue to use traditional
public pension accounting methods to determine funding requirements. However, as the GASB
67 and 68 numbers can provide important new ways to understand a fund’s sustainability, the
Federation will address them here.
The Chicago Teachers’ Pension Fund began reporting according to GASB 67 in its FY2014
CAFR and actuarial valuations. The Chicago Public Schools began reporting according to GASB
68 in its FY2015 financial statements.
The total pension liability, fiduciary net position, net pension liability and ADC152 are all
calculated on a different basis both from what used to be required by GASB and from the
traditional public pension actuarial basis.
Total Pension Liability – This number is similar in concept to the actuarial accrued liability
(AAL) discussed above, but is NOT the same. The actuarial cost method and discount rate
(among other things) are different. All plans are required to use:
Entry age normal actuarial cost method and level percent of payroll. CTPF uses
projected unit credit, a different cost allocation method, for statutory reporting and
funding purposes.
Single blended discount rate, instead of basing the discount rate only on projected
investment earnings. The discount rate is used to calculate the present value of the
future obligations of a pension fund. The discount rate has an inverse relationship to
actuarial liabilities, such that a lower discount rate will result in higher liabilities.
o If a government is projected to have enough assets to cover its projected
benefit payments to current and inactive employees, it can use the expected
return on investments as its discount rate.
o If a government is projected to reach a crossover point beyond which
projected assets are insufficient to cover projected benefit payments, then a
blended discount rate must be used. Benefit payments projected to be made
from that point forward are discounted using a high-quality municipal bond
interest rate. The blended rate is a single equivalent rate that reflects the
investment rate of return and the high-quality municipal bond interest rate.
o The Chicago Teachers’ Pension Fund was not projected to reach the
crossover point, so its GASB 67 and 68 reporting is discounted at the full
7.75% assumed rate of return.
Fiduciary Net Position – This number is essentially the market value of assets in the pension
plan as of the end of the fiscal year, not the assets as calculated on an actuarially smoothed
152 Other differences and newly reported numbers are not central to the discussion here.

66
basis under previous reporting requirements. CTPF still uses smoothed actuarial value of
assets to determine statutory employer contribution requirements.
Net Pension Liability – This number is similar in concept to the unfunded actuarial accrued
liability, but again is NOT the same. It is the difference between the Total Pension Liability
and the Fiduciary Net Position of the fund. Governments are required to report the Net
Pension Liability in their Statements of Net Position in their financial statements, according
to GASB 68.
Actuarially Determined Contribution (ADC) – Another change from previous standards is
that funds are no longer required to report an Annual Required Contribution (ARC) based on
standards promulgated by GASB. Instead, the funds will calculate an Actuarially Determined
Contribution or ADC that reflects their own funding plan, unless that funding scheme does
not follow actuarial standards of practice. Then the fund must report an ADC that is
calculated according to actuarial standards of practice. It is again important to emphasize that
the ADC is a reporting and not a funding requirement. See the discussion below for a
summary of how the basis for calculating the Teachers’ Fund ADC differs from the ARC.
Difference between the ADC and ARC
Depending on the employer’s funding plan, a pension fund’s ADC may be very similar to the
previously reported ARC. The chart below summarizes the main assumptions behind the
Chicago Teachers’ Pension Fund calculations of ADC and ARC. The only difference between
the two numbers is that the ADC has a closed amortization period and the ARC had an open
amortization period. An open amortization period remains the same every year (e.g., each
valuation amortizes UAAL over 30 years), while a closed amortization period declines as each
year passes (e.g., successive valuations amortize at 30 years, 29 years, 28 years, etc.). The ADC
uses the actuarially calculated UAAL number instead of the GASB 67 net pension liability
number, which also makes it similar to the ARC. Additionally, the ADC need not follow the
GASB 67 and 68 requirement of using the market value of assets. The CTPF uses a four-year
smoothed valuation of assets.
ADC ARC
(FY2014 and After) (FY2013 and Earlier)
Amortization Period 30-year closed (28 years remaining) 30-year open
Amortization Method Level % of Payroll Level % of Payroll
Actuarial Cost Method Projected Unit Credit Projected Unit Credit
Actuarial Value of Assets 4-year smoothed 4-year smoothed
Investment Rate of Return 7.75% 7.75%
Calculation of the Actuarially Required Contribution (ADC) vs the Annual Required Contribution (ARC)
Source: Chicago Teachers' Pension Fund FY2015 and FY2012 Actuarial Valuations.

67
Chicago Teachers’ Pension Fund Reported Liabilities Under GASB Statements Number 67 and
68
The following table shows the Teachers’ Fund pension financial reporting under GASB 67 and
68. Fiduciary Net Position as a percentage of Total Pension Liabilities is analogous to a funded
ratio as calculated under actuarial standards. In contrast to other Chicago-area governments,
CTPF’s pension liability reporting under GASB 67 and 68 is not significantly different from its
statutorily reported numbers calculated on an actuarial basis. The reason is that projected assets
are forecast to be sufficient to cover projected benefit payments and therefore the full expected
rate of return on assets can be used as a discount rate. Other local governments have been
projected to reach such a crossover point beyond which projected benefit payments will exceed
assets and therefore must use a lower discount rate, which results in higher present values for
liabilities and net pension liabilities.153
OTHER POST EMPLOYMENT BENEFITS (OPEB)
Non-pension benefits provided to employees after employment ends are referred to as Other Post
Employment Benefits (OPEB). OPEB includes health insurance coverage for retirees and their
families, dental insurance, life insurance and long-term care coverage. It does not include
termination benefits such as accrued sick leave and vacation. CPS has not established an
irrevocable trust fund to account for its OPEB plan. Rather, these obligations are financed on a
pay-as-you-go basis through the Chicago Teachers’ Pension Fund (CTPF). It is important to note
that these benefits are funded by the retirement system, not by CPS.
The CTPF provides a “rebate” for a significant portion of the monthly premiums owed by those
who enroll. The rebate only applies to the retired teacher’s portion of these insurance policies,
not to the additional cost of enrolling eligible dependents. However, the rebate does apply to
eligible dependents who are survivors of deceased retirees. The Fund had previously provided
reimbursement of 70.0% of the cost of pensioners’ health insurance coverage, but it was reduced
153 For more on discount rates and how they impact measurements of the present value of liabilities, read the Civic
Federation blog: https://www.civicfed.org/iifs/blog/state-pension-liabilities-rise-due-lower-expected-investment-
returns and https://www.civicfed.org/civic-federation/blog/local-government-pension-funds-lower-their-expected-
investment-rates-return-fy.
Total Pension
Liability
Fiduciary Net
Position
Net Pension
Liability
Fiduciary Net
Position as a
Percentage
of Total
Pension
Liability
Actuarially
Determined
Contribution
FY2013 19,795,922,569$ 9,674,188,563$ 10,121,734,006$ 48.87%
FY2014 20,316,899,952$ 10,815,694,614$ 9,501,205,338$ 53.23% 719,781,746$
FY2015 20,713,217,296$ 10,689,954,320$ 10,023,262,976$ 51.61% 728,488,520$
Three-Year Change 917,294,727$ 1,015,765,757$ (98,471,030)$ 8,706,774$
Three-Year % Change 4.63% 10.50% -0.97% 1.21%
Source: FY2014 and FY2015 Chicago Teachers' Pension Fund Actuarial Valuations. FY2013 numbers were presented in the FY2014 report.
Chicago Teachers' Pension Fund GASB 67 Reporting FY2014-FY2015

68
to 60.0% on January 1, 2011 and to 50.0% on January 1, 2015. According to Illinois statute, total
payments from the Teachers’ Pension Fund to reimburse retirees may not exceed 75.0% of total
retiree health insurance costs.154
In FY2015 a total of 17,940 retirees and beneficiaries received health insurance benefits. There
were also 5,464 terminated employees who may be entitled to OPEB benefits but are not yet
receiving them and 10,575 retirees and beneficiaries entitled to benefits but not currently
receiving them.155 The Illinois Pension Code limits total annual payments paid by the pension
fund’s Board of Trustees to $65.0 million per year plus amounts authorized in previous years but
not spent.156 In FY2015 the Teachers’ Pension Fund spent $79.3 million on OPEB.157
The following exhibit shows the extent to which the aggregate cost of the CTPF’s health
insurance subsidy has increased over the past decade. From FY2006 to FY2015, insurance
premium rebates paid to beneficiaries increased by 36.1%, or $21.0 million. The health insurance
rebate has generally increased year over year, with year-to-year increases ranging from 1.5% in
FY2014 to 12.6% in FY2008. The exceptions were FY2011 and FY2012, when the subsidy
decreased by 1.3% and 12.5%, respectively, due to the reduction to the reimbursement
percentage on January 1, 2011. The health insurance rebate has represented approximately 5.4%
to 7.5% of total pension and OPEB benefit expenditures over the ten-year period.
The following exhibit shows the funded status of the teachers’ OPEB plan. The total actuarial
liability fluctuated over the ten-year period from FY2006 to FY2015. The liability was
$2.4 billion in FY2006, rose to $3.1 billion in FY2012, and fell over the next three years to $1.9
154 40 ILCS 17-142.1. 155 Chicago Teachers’ Pension Fund FY2015 Comprehensive Annual Financial Report, p. 118. 156 40 ILCS 17-142.1. 157 Chicago Teachers’ Pension Fund, FY2015 Comprehensive Annual Financial Report, p. 133.
FY2006 58,279,900$ --
FY2007 61,028,841$ 4.7%
FY2008 68,691,191$ 12.6%
FY2009 75,811,835$ 10.4%
FY2010 79,953,873$ 5.5%
FY2011 78,892,292$ -1.3%
FY2012 69,011,323$ -12.5%
FY2013 71,763,523$ 4.0%
FY2014 72,874,594$ 1.5%
FY2015 79,316,153$ 8.8%
Ten-Year Change 21,036,253$ 36.1%
Source: Chicago Teachers' Pension Fund, Comprehensive Annual Financial
Report FY2015, p. 133-134.
Total Health Insurance Premium Rebates
Paid to Retired CPS Teachers:
Health Insurance
Rebate Paid
% Change over
Previous Year
FY2006-FY2015

69
billion in FY2015. Assets as a percentage of the actuarial liability were 1.7% in FY2006 and
1.1% in FY2015. The actuarial assumptions used included a 4.5% discount rate and an annual
healthcare cost trend rate that is projected to decline by 0.5% points a year from 8.0% to 5.0%
gradually over six years.158
LIABILITIES
This section of the analysis provides an overview of the short-term and long-term liabilities of
Chicago Public Schools.
Short-Term Liabilities
Short-term liabilities are financial obligations that must be satisfied within one year. They can
include short-term debt, accounts payable, accrued payroll, amounts held for student activities
and other current liabilities. The District currently reports no short-term debt. CPS includes the
following short-term liabilities in the Governmental Funds Balance Sheet in its annual
Comprehensive Annual Financial Report:
Accounts payable: monies owed to vendors or employees for goods and services;
Accrued payroll: employee pay carried over from previous years;
Amounts held for student activities: deposits held in custody or funds that belong to
individual school accounts; and
Line of credit: Funds borrowed at year-end to make required pension payments.159
In the five-year period between FY2011 and FY2015, total short-term liabilities increased by
17.2% or $174.9 million. Most of the increase was due to a $700.0 million line of credit CPS
158 Chicago Teachers’ Pension Fund FY2015 CAFR, p. 119. 159 Chicago Public Schools FY2015 Comprehensive Annual Financial Report, p. 16.
Total Actuarial
Liability
Actuarial Value of
Assets
Unfunded Actuarial
Accrued Liability
(UAAL)
Assets as a % of
Actuarial Liability
FY2006 $ 2,373,773,770 $ 41,057,585 $ 2,332,716,185 1.7%
FY2007 $ 2,022,007,643 $ 47,401,758 $ 1,974,605,885 2.3%
FY2008 $ 2,407,122,492 $ 44,989,385 $ 2,362,133,107 1.9%
FY2009 $ 2,670,282,662 $ 49,691,750 $ 2,620,590,912 1.9%
FY2010 $ 2,864,877,305 $ 34,857,732 $ 2,830,019,573 1.2%
FY2011 $ 3,071,516,739 $ 31,324,572 $ 3,040,192,167 1.0%
FY2012 $ 3,110,316,263 $ 34,124,958 $ 3,076,191,305 1.1%
FY2013 $ 2,386,105,927 $ 35,796,904 $ 2,350,309,023 1.5%
FY2014 $ 1,938,855,895 $ 35,977,444 $ 1,902,878,451 1.9%
FY2015 $ 1,910,991,991 $ 21,713,159 $ 1,889,278,832 1.1%
Funded Status of the Chicago Public Schools Pension Fund
Other Post Employment Benefit (OPEB) Plan:
FY2006-FY2015
Source: Public School Teachers' Pension and Retirement Fund of Chicago, Actuarial Valuation and Review as of June 30,
2015, p. 60.

70
used in FY2015 at year-end to make pension payments. CPS lines of credit are agreements with
banks to provide loans that are paid off with tax anticipation notes secured by future property tax
payments.160 During the same period, accounts payable declined by 33.7% or $156.6 million and
accrued payroll fell by 72.2% or $374.5 million.
Between FY2014 and FY2015, all short-term liabilities rose by 155.0%, or $724.9 million. In
this period, accrued payroll increased by $32.3 million or 28.9%. However, here too, most of the
increase was due to $700.0 million line of credit CPS used in FY2015 at year-end to make
pension payments.161
Short-Term Liabilities as a Percentage of Net Operating Revenues
Increasing short-term (current) liabilities at the end of the year in a government’s operating funds
as a percentage of net operating revenues may be a warning sign of a government’s future
financial difficulties.162 This ratio indicator, developed by the International City/County
Management Association (ICMA), is a measure of budgetary solvency or a government’s ability
to generate enough revenue over the course of a fiscal year to meet its expenditures and avoid
deficit spending.
The following graph shows the five-year trend in the District’s short-term liabilities as a
percentage of operating revenues by category. Between FY2011 and FY2015, the ratio rose from
160
See Official Statement for $725,000,000 Board of Education of the City of Chicago Unlimited Tax Obligation
Bond (Dedicated Revenues) Series 2016A, February 3, 2016, p. 64 and Juan Perez, Jr. “Chicago school board
approves more than $1 billion in new borrowing,” Chicago Tribune, June 25, 2015. 161 Chicago Public Schools FY2015 Comprehensive Annual Financial Report, p. 16. 162 The General Operating Fund for CPS is its Governmental Funds, which are those funds used to account for
general operations. See Karl Nollenberger, Sanford Groves and Maureen G. Valente. Evaluating Financial
Condition: A Handbook for Local Government (International City/County Management Association, 2003), p. 77
and p. 169.
FY2011 FY2012 FY2013 FY2014 FY2015
Two-Year $
Change
Two-Year
% Change
Five-Year
$ Change
Five-Year
% Change
Accounts Payable 464,286$ 494,371$ 421,491$ 317,488$ 307,675$ (9,813)$ -3.1% (156,611)$ -33.7%
Accrued Payroll 518,652$ 399,792$ 473,189$ 111,812$ 144,133$ 32,321$ 28.9% (374,519)$ -72.2%
Amount Held for Student
Activities 34,840$ 34,026$ 35,536$ 38,413$ 40,888$ 2,475$ 6.4% 6,048$ 17.4%
Line of Credit -$ -$ -$ -$ 700,000$ 700,000$ --- 700,000$ ---
Total 1,017,778$ 928,189$ 930,216$ 467,713$ 1,192,696$ 724,983$ 155.0% 174,918$ 17.2%
Source: CPS Comprehensive Annual Financial Reports, Balance Sheets - Governmental Funds, FY2011 - FY2015.
CPS Short-Term Liabilities in the Governmental Funds: FY2011 - FY2015
(in $ thousands)

71
18.0% to 22.0%. The increase is due primarily to the $700.0 million line of credit CPS used in
FY2015 at year-end to make pension payments.163
163 Chicago Public Schools FY2015 Comprehensive Annual Financial Report, p. 16.
FY2011 FY2012 FY2013 FY2014 FY2015
Line of Credit 0.0% 0.0% 0.0% 0.0% 12.9%
Amount Held for Student Activities 0.6% 0.6% 0.7% 0.7% 0.8%
Accrued Payroll 9.2% 6.9% 8.8% 2.1% 2.7%
Accounts Payable 8.2% 8.6% 7.8% 5.8% 5.7%
0.0%
5.0%
10.0%
15.0%
20.0%
25.0%
Chicago Public Schools Short Term Liabilities in Governmental Funds as a % of Operating Revenues: FY2011-FY2015
Source: Chicago Public Schools Comprehesive Annual Financial Reports, FY2011-FY2015.
18.0%
16.1%17.3%
8.6%
22.0%

72
Short-Term Borrowing
In FY2016 CPS relied on short-term borrowing to cover anticipated cash flow difficulties. The
District received authorization to borrow up to $1.16 billion of short-term borrowing to bridge
the gap between revenue collections and expenses throughout that fiscal year.164 The funds were
secured through lines of credit and commercial loans and payable with dedicated revenues
including property tax collections.
The District’s lack of fund balance and resulting liquidity crisis has a price. The short-term
borrowing was expected to increase debt service costs by approximately $24.0 million in
FY2016. The District may need to use all of the $1.16 billion line of credit to make its pension
payment at the end of the year, even with assistance provide by the stopgap partial funding plan
from the State of Illinois
Accounts Payable Trends
Rising amounts of accounts payable over time may indicate a government’s difficulty in
controlling expenses or keeping up with spending pressures. Between FY2011 and FY2015,
accounts payable declined by 33.7% or $156.6 million. This was a decrease from $464.3 million
to $307.7 million. The decrease was a positive sign.
164 See Chicago Board of Education Regular Board Meeting, December 16, 2015 and CPS FY2016 Proposed
Budget, p. 13.
$464,286
$494,371
$421,491
$317,488$307,675
$-
$100,000
$200,000
$300,000
$400,000
$500,000
$600,000
FY2011 FY2012 FY2013 FY2014 FY2015
Source: CPS Comprehensive Annual Financial Reports, FY2011- FY2015.
CPS Total Accounts Payable in Governmental Funds: FY2011-FY2015 (in $ thousands)

73
The District’s ratio of accounts payable in the Governmental Funds to operating revenues has
decreased from 8.2% in FY2011 to 5.7% in FY2015. This change reflects the $156.6 million
decrease in accounts payable over this five-year period.
Current Ratio
The current ratio is a measure of liquidity. It assesses whether a government has enough cash and
other liquid resources to meet its short-term obligations as they come due. The current ratio is
calculated by dividing short-term assets by short-term liabilities. A ratio of 1.0 means that
current assets are equal to current liabilities and are sufficient to cover obligations in the near
term. Generally, a government’s current ratio should be close to 2.0 or higher.165 In addition to
the short-term liabilities listed in the previous section, the current ratio formula uses the current
assets of the District:
Cash and investments are (1) assets that are cash or can be converted into cash immediately
including petty cash, demand deposits and certificates of deposit and/or (2) any investments
that the District has made that will expire within one year including stocks and bonds that can
be liquidated quickly;
165 Steven A. Finkler. Financial Management for Public, Health and Not-for-Profit Organizations, Upper Saddle
River, NJ, 2001, p. 476.
8.2%
8.6%
7.8%
5.8%5.7%
0.0%
1.0%
2.0%
3.0%
4.0%
5.0%
6.0%
7.0%
8.0%
9.0%
10.0%
FY2011 FY2012 FY2013 FY2014 FY2015
CPS Accounts Payable as a Percentage of Operating Revenue: FY2011 - FY2015
Source: CPS Comprehensive Annual Financial Reports, FY2011-FY2015.

74
Cash and investments in escrow in the Debt Service Fund represent the amount available for
debt service payments on the Unlimited Tax General Obligation Bonds and Public Building
Commission Leases. The cash and investments in escrow in the Capital Projects Funds
represent the unspent proceeds from the Unlimited Tax General Obligation Bonds, Public
Building Commission Building Revenue Bonds, State Technology Revolving Loan Fund and
other revenues;166
Cash and investments held in school internal accounts represent the book balance for
checking and investments for individual schools;167
Receivables are monetary obligations owed to the government including property taxes,
replacement taxes and state or federal aid; and
Other assets include prepaid assets and deferred charges recorded as expenditures in the
governmental funds. Deferred charges are for bond issuance costs.168
The CPS current ratio was 2.1 in FY2015, the most recent year for which data are available. This
was a sharp 50.1% decline from a ratio of 4.1 in FY2011. The decline was driven by:
A 17.2% or $174.9, million increase in current liabilities primarily fueled by the inclusion
of a $700 million line of credit in FY2014; and
a 37.5% or $1.6 billion, decline in current assets driven in large part by a $991.3 million
decrease in cash and investments on hand. CPS used fund balance in FY2015 to balance
its budget – this was the reason for the large decrease in cash and investments.
Over the past five years, the District’s current ratio averaged 4.2. This is greater than the
benchmark of 2.0, which is considered a healthy level of liquidity. However, the falling trend is
a cause for concern.
166 Chicago Public Schools FY2015 Comprehensive Annual Financial Report, p. 41. 167 Chicago Public Schools FY2015 Comprehensive Annual Financial Report, p. 47. 168 Chicago Public Schools FY2015 Comprehensive Annual Financial Report, p. 42.
FY2011 FY2012 FY2013 FY2014 FY2015
Two-Year $
Change
Two-Year %
Change
Five-Year $
Change
Five-Year
% Change
Current Assets
Cash and Investments 1,157,460$ 1,470,892$ 1,259,273$ 254,551$ 166,113$ $ (88,438) -34.7% $ (991,347) -85.6%
Cash and Investments in Escrow 778,083$ 649,471$ 755,025$ 580,457$ 508,498$ $ (71,959) -12.4% $ (269,585) -34.6%
Cash and Investments Held in
School Internal Accounts 34,840$ 34,026$ 35,536$ 38,413$ 40,888$ $ 2,475 6.4% $ 6,048 17.4%
Receivables: Property Taxes, Net 1,022,827$ 996,968$ 1,061,198$ 1,064,710$ 1,114,780$ $ 50,070 4.7% $ 91,953 9.0%
Receivables: Replacement Taxes 24,342$ 33,182$ 35,870$ 31,920$ 33,183$ $ 1,263 4.0% $ 8,841 36.3%
Receivables: State Aid, Net 775,970$ 613,199$ 514,760$ 516,147$ 600,980$ $ 84,833 16.4% $ (174,990) -22.6%
Receivables: Federal Aid 277,650$ 202,462$ 291,336$ 211,090$ 115,513$ $ (95,577) -45.3% $ (162,137) -58.4%
Receivables: Other 146,247$ 40,533$ 159,492$ 106,791$ 58,090$ $ (48,701) -45.6% $ (88,157) -60.3%
Other Assets 2,095$ 8,581$ 5,687$ 1$ -$ $ (1) -100.0% $ (2,095) -100.0%
Total Current Assets 4,219,514$ 4,049,314$ 4,118,177$ 2,804,080$ 2,638,045$ $ (166,035) -5.9% $ (1,581,469) -37.5%
Current Liabilities
Accounts Payable 464,286$ 494,371$ 421,491$ 317,488$ 307,675$ $ (9,813) -3.1% (156,611)$ -33.7%
Accrued Payroll 518,652$ 399,792$ 473,189$ 111,812$ 144,133$ $ 32,321 28.9% (374,519)$ -72.2%
Amount Held for Student Activities 34,840$ 34,026$ 35,536$ 38,413$ 40,888$ $ 2,475 6.4% 6,048$ 17.4%
Line of Credit -$ -$ -$ -$ 700,000$ --- --- --- ---
Total Current Liabilities 1,017,778$ 928,189$ 930,216$ 467,713$ 1,192,696$ 724,983$ 155.0% 174,918$ 17.2%
Current Ratio 4.1 4.4 4.4 6.0 2.2 (0.2) -63.1% -46.6%
CPS Current Ratio in the Governmental Funds: FY2011-FY2015
(in $ thousands)
Source: CPS Comprehensive Annual Financial Reports, Balance Sheets - Governmental Funds, FY2011 - FY2015.

75
Long-Term Liabilities
This section examines trends in CPS long-term liabilities. It includes a review of trends in the
District’s total long-term liabilities and a discussion of its tax supported long-term debt. Long-
term liabilities are all of the obligations owed by a government over time.169 Increases in long-
term liabilities over time may be a sign of fiscal stress. They include long-term debt as well as:
Accrued Sick Pay Benefits: CPS provides sick pay benefits for nearly all of its employees.
Eligible employees were able to accumulate a maximum of 325 sick days granted before
July 1, 2012. If an employee reached age 65, had a minimum of 20 years of service at the
time of resignation or retirement or death, the employee (or surviving dependent in case
of employee death) was entitled to receive, as additional cash compensation, all or a
portion of her or his accumulated sick leave days. After July 1, 2012, unused sick days at
the end of a fiscal year will no longer be carried over to the next fiscal year. Payout of the
value of any unused sick days will no longer be paid out to employees. CPS budgets an
amount each year in the General Operating Fund for these estimated payments to
employees terminated in the current fiscal year.
Accrued Vacation Pay Benefits: For eligible employees, the maximum number of
accumulated unused vacation days permitted is 40 days for those employees with up to
ten years of service, 53 days for those with 11 to 20 years of service and 66 days for those
with more than 20 years of service. Eligible employees are entitled to receive 100.0% of
accumulated vacation days at their current salary rate. These amounts are paid from the
General Operating Fund.
Accrued Workers' Compensation Claims, Accrued General and Automobile Claims and
Tort Liabilities and Other Claims: CPS is substantially self-insured and assumes risk of
loss as follows:
CPS maintains commercial excess property insurance for “all risks” of physical
loss or damage with limits of $250,000,000 and Boiler and Machinery Insurance
with limits of $100,000,000 with the following deductibles:
o Data Processing Equipment & Media $50,000
o Mechanical Breakdown $50,000
o All Other Losses $500,000
Net Pension Obligations (NPO): NPO is the cumulative difference, since the effective
date of GASB Statement 27, between the annual pension cost and the employer’s
contributions to the plan. This includes the pension liability at transition (beginning
pension liability) and excludes short-term differences and unpaid contributions that have
been converted to pension-related debt. The last year NPO was reported was FY2014.
Net Pension Liabilities: Beginning in FY2015, CPS will report 100% of the Chicago
Teacher Pension Fund’s (CTPF) net pension liability in the Statement of Net Position to
comply with GASB Statement 68 requirements. Previously, this liability was reported in
the Statement of Net Position as a Net Pension Obligation or NPO (see description
above). As a result of the reporting change for pensions involved in implementing GASB
68, the amount of CPS long-term liabilities reported will increase substantially. This is
169 Descriptions of accrued sick pay benefits, accrued vacation pay benefits, accrued workers' compensation claims,
and accrued general and automobile claims and tort liabilities and other claims are found in Note 11: Other Benefits
and Claims, CPS FY2015 Comprehensive Annual Financial Report, pp. 64-66.

76
because it will reflect a more holistic approach to measuring the liabilities of the
government, which the previous NPO pension measurement did not. The amount owed
by CPS to the CTPF has not significantly changed. It’s only being reported more
transparently.
Net Other Post Employment Benefit (OPEB) Obligations: This is the cumulative
difference, since the effective date of GASB Statement 45, between the annual OPEB
cost and the employer’s contributions to its OPEB Plan.170
Between FY2011 and FY2015, total CPS long-term liabilities increased by 88.5%, or over $8.5
billion, rising from approximately $9.6 billion to $18.1 billion. Most of this increase was due to
the change in pension reporting in FY2015 which led to an increase of $6.3 billion in reported
pension liability. As noted above, the new pension liability reporting requirements of GASB
Statement 68 present a more transparent approach to measuring these liabilities than the previous
approach, rather than a one-year large increase in liabilities.
Total other long-term liabilities, which includes accrued sick leave and vacation pay, net pension
obligations/net pension liabilities and net OPEB obligations grew by 193.8% or nearly $7.8
billion over the five-year period. Net pension obligations/net pension liabilities alone increased
by 320.0% or $7.2 billion, while net OPEB obligations grew by 58.3%, rising from
approximately $1.1 billion to nearly $1.8 billion.
Total long-term CPS debt increased by $689.5 million, or 12.4%, over the five-year period. CPS
long-term debt includes general obligation bonds, leases securing Public Building Commission
bonds and capital leases. These liabilities are secured by property tax revenues or State of Illinois
school construction grants. General obligation debt is the only type of long-term debt that
increased in this time period.
170 Non-pension benefits provided to employees after employment ends are referred to as Other Post-Employment
Benefits (OPEB). OPEB includes health insurance coverage for retirees and their families, dental insurance, life
insurance and term care coverage. It does not include termination benefits such as accrued sick leave and vacation.
CPS has not established an irrevocable trust fund to account for its OPEB plan. These obligations are financed on a
pay-as-you-go basis through the Chicago Teachers’ Pension Fund. It is important to note that these benefits are
funded by the retirement system, not by CPS.
Two-Year Two-Year Five-Year Five-Year
Type of Obligation FY2011 FY2012 FY2013 FY2014 FY2015 $ Change % Change $ Change % Change
General Obligation Bonds* 5,249,147$ 5,593,686$ 6,058,398$ 5,944,516$ 6,073,049$ 128,533$ 2.2% 823,902$ 15.7%
Leases Securing PBC Bonds 330,375$ 299,780$ 267,330$ 232,940$ 196,470$ (36,470)$ -15.7% (133,905)$ -40.5%
Capital Leases 2,100$ 1,925$ 1,750$ 1,575$ 1,575$ -$ 0.0% (525)$ -25.0%
Subtotal Long-Term Debt 5,581,622$ 5,895,391$ 6,327,478$ 6,179,031$ 6,271,094$ 92,063$ 1.5% 689,472$ 12.4%
Accrued Sick Pay Benefits 459,823$ 354,692$ 365,299$ 357,321$ 342,293$ (15,028)$ -4.2% (117,530)$ -25.6%
Accrued Vacation Pay Benefits 66,389$ 65,518$ 69,853$ 60,992$ 59,044$ (1,948)$ -3.2% (7,345)$ -11.1%
Accrued Workers' Compensation Claims 109,735$ 115,296$ 114,268$ 129,280$ 132,699$ 3,419$ 2.6% 22,964$ 20.9%
Accrued General and Automobile Claims 5,343$ 5,398$ 5,808$ 6,218$ 8,212$ 1,994$ 32.1% 2,869$ 53.7%
Tort Liabilities and Other Claims 2,000$ 2,000$ 3,278$ 10,778$ 21,578$ 10,800$ 100.2% 19,578$ 978.9%
Net Pension Obligation/Net Pension Liability** 2,262,010$ 2,618,836$ 3,020,049$ 3,190,380$ 9,501,206$ 6,310,826$ 197.8% 7,239,196$ 320.0%
Net OPEB Obligation 1,130,197$ 1,335,928$ 1,536,593$ 1,680,247$ 1,789,441$ 109,194$ 6.5% 659,244$ 58.3%
Subtotal Other Long-Term Liabilities 4,035,497$ 4,497,668$ 5,115,148$ 5,435,216$ 11,854,473$ 6,419,257$ 118.1% 7,818,976$ 193.8%
Grand Total Long-Term Liabilities 9,617,119$ 10,393,059$ 11,442,626$ 11,614,247$ 18,125,567$ 6,511,320$ 56.1% 8,508,448$ 88.5%* Outstanding principal.
** Beginning in FY2015, Governments will report 100% of their net pension liabilities rather than the net pension obligations.
CPS Long-Term Liabilities: FY2011-FY2015
(in $ thousands)
Source: CPS Comprehensive Annual Financial Reports, Notes 8, 9, 11 and 12, FY2011-FY2015.
Beginning in FY2013, CPS includes information about accumulated resources restricted to repaying the principal of outstanding general obligation debt. These amounts are subtracted from the total CPS GO debt in order to
calculate a net total primary amount. For years prior to FY2013, total outstanding GO debt per capita is total debt divided by population. In FY2013 and succeeding years, the per capita ratio is the net total GO debt divided by
population. See the FY2014 CPS Comprehensive Annual Financial Report, p. 138.

77
CPS Long-Term Debt
CPS has an enormous physical plant, with 660 schools and a downtown administrative
headquarters that must be maintained.171 To finance maintenance, rehabilitation of construction
of the physical plant, CPS borrows funds by issuing long-term bonds.172 Principal and interest
costs are retired by annual debt service payments and funded by property taxes and other
revenues. As these capital projects are expensive and utilized for public purposes over a period
of decades, it is reasonable to spread the cost of funding them over the life of the project with
borrowing. In that way, everyone benefiting from the projects helps pay for them, assuring
intergenerational equity. This is in contrast to annual operations, which are financed from
revenues on an annual or pay-as-you-go basis.
Financing CPS Debt
CPS long-term debt for capital and operating purposes consists of general obligation bonds,
leases securing Public Building Commission (PBC) bonds, asbestos abatement loans, capital
leases and notes payable. Debt service payments are made from a variety of resources, including:
State Aid is the most significant source of funding for CPS debt issues. It includes: 1)
General State Aid funds; and 2) State School Construction funds administered through
the Illinois Capital Development Board;
Property tax revenues provided to CPS from the City. There is an intergovernmental
agreement between the City of Chicago and CPS through which the City levies taxes to
pay for some of the school district’s capital needs. The intergovernmental agreement was
approved on October 1, 1997 and has been used to fund and refund several bond
issuances.173 These revenues are not listed as a line item in the City budget revenue
estimates;174
An additional Capital Improvement CPS property tax levy the City of Chicago approved
for CPS as of 2016. In October 2015, as part of the City of Chicago’s fiscal year 2016
budget, a new Capital Improvement Tax Levy for CPS was approved as was
implemented in the CPS FY2016 budget. The Capital Improvement Tax Levy was
created by the Illinois State legislature in 2002, but not previously implemented. The
Capital Improvement Tax Levy is outside of CPS’s property tax cap limitation and may
increase by the rate of inflation in future years. The statute authorizing the Capital
171 CPS Stats and Facts at http://www.cps.edu/About_CPS/At-a-glance/Pages/Stats_and_facts.aspx. 172 They also pay for some capital costs from annual cash receipts on a pay as you go basis, but large projects are
typically paid for through borrowing. 173
According to the debt service schedule for bonds covered by this intergovernmental agreement, City of Chicago
payments for school bonds were to increase from $18.8 million in 2008 to $91.0 million in 2009 and will remain at
$91.0 million annually through 2018. The intergovernmental agreement is not mentioned in the City’s budget
documents. See Board of Education of the City of Chicago Unlimited Tax General Obligation Refunding Bond
Official Statement, Series 2007A, p. 2, available at http://emma.msrb.org/MS263138-MS238446-MD465315.pdf.
See also Chicago Public Schools Comprehensive Annual Financial Report for the Year Ended June 30, 2008, pp. 57,
58, 155. 174 City of Chicago, FY2016 Budget Recommendations, pp. 132-138.

78
Improvement Tax allows the levy to be used for either expenditures on capital projects or
to pay for debt service on bonds that are used to finance capital projects; 175
Personal property replacement tax revenues distributed by the State of Illinois;
Federal aid; and
One-time local revenues from sources such as the District’s share of tax increment
financing (TIF) surpluses declared by the City of Chicago or revenues accruing to CPS
upon the dissolution of a City of Chicago TIF district.
CPS Debt Crisis
CPS faces mounting fiscal difficulties related to its outstanding debt burden and its risky
financial practices. These include:
Increasing amounts of outstanding long-term debt at the same time CPS faces multiple
serious financial challenges;
A rising debt burden on taxpayers;
The use of costly scoop-and-toss financing that backloads debt service payments;
The costly termination of interest rate swap agreements;
Increasing amounts of short-term borrowing due to a liquidity crisis; and
Bond credit ratings well below investment grade
On February 3, 2016, CPS sold $725 million in 28-year tax-exempt long-term debt. The bond
yields were priced at 8.5%, a very high rate reflecting the District’s non-investment grade credit
ratings. The interest rate was an increase from the previous week when CPS had offered 25-year
bonds at 7.75% interest before pulling the deals off the market.176 CPS stated the bond sale was
necessary to provide sufficient liquidity to operate the schools through the end of FY2016. The
District noted in a press release that:177
CPS would make its February 15 debt service payments;
These bonds would largely reimburse the operating fund for expenses that the District
had already paid, including capital expenses;
The bonds include $206 million of debt restructuring to provide immediate budgetary
relief in FY2016;
CPS would postpone its plan to convert variable-rate debt to fixed-rate debt; and
CPS would postpone reimbursing the general operating fund for some of the swap
termination fees.
Increasing Long-Term Debt at Same Time CPS Faces Multiple Financial Pressures
General obligation debt is the largest component of the District’s long-term debt portfolio,
averaging 92.5% of total long-term debt issued from FY2005 to FY2014. Other forms of long-
term debt issued by the District include leases securing Public Building Commission bonds and
175 CPS FY2015 Comprehensive Annual Financial Report, p. 78. 176 Heather Gillers. “CPS borrows at steep interest rate,” Chicago Tribune, February 4, 2016. 177 Chicago Public Schools. CPS Statement on Today’s Bond Sale, February 3, 2016 at
http://cps.edu/News/Press_releases/Pages/PR1_02_03_16.aspx.

79
capital leases. General obligation debt is guaranteed by property taxes and is backed by the full
faith and credit of the District.
CPS general obligation debt increased by 48.4%, or $1.9 billion, between FY2006 and FY2015.
This represents an increase from $4.1 billion to $6.1 billion.178 General obligation debt fell
slightly in FY2014 from the previous year by $113.8 million or 1.9%. However, it rose in
FY2015 to $6.1 billion due to the issuance of $200.0 million in additional capital purpose bonds.
CPS had also authorized the issuance of $1.16 billion in additional General Obligation bonds for
FY2016. To date CPS has borrowed $725 million for these purposes at the extraordinarily high
interest rate of 8.5%.179
Although more than $100.0 million of the new borrowing authority is intended to refund existing
principal in order to scoop-and-toss existing debt into the future for budgetary relief, the
remainder will increase the outstanding debt in FY2016. The increase in large part reflects an
increase in the District’s capital construction program over the past several years.
Increases in government-issued general obligation debt bear watching as they are a potential sign
of escalating financial risk. The concern is that unless a government secures additional revenues
or reduces spending at the same time it increases its debt burden, it may have difficulty making
principal and interest payments at some point in the future. There is a particular concern with
178 Beginning in 2013, CPS included information in its CAFR about accumulated resources that are restricted to
paying the principal of outstanding general bonded debt. These accumulated resources will be subtracted from the
total primary government amount in order to calculate a net total primary government amount. For all years prior to
FY2013, total net outstanding debt per capita reported in the CAFR is the total primary government amount divided
by population. CPS FY2015 Comprehensive Annual Financial Report, p. 146. 179 Heather Gillers. “CPS borrows $725 million at extraordinarily high interest rate,” Chicago Tribune, February 3,
2016 at http://www.chicagotribune.com/news/local/breaking/ct-chicago-public-schools-bonds-0204-20160203-
story.html.

80
CPS because the District also faces serious and continuing challenges in meeting its rising
expenditures in areas such as personnel and retirement costs.
Rising Debt Burden on Taxpayers
A commonly used measure of the debt burden on citizens is general obligation debt per capita.
This indicator divides CPS general obligation debt per year by the population of the jurisdiction.
Increases in the ratio bear watching as a potential sign of increasing financial risk in much the
same manner as increases in total debt outstanding figures do.
Overall, CPS general obligation debt per capita increased by 68.8% between FY2006 and
FY2015, rising from $1,335 to $2,253. The increase reflects a significant increase in direct debt,
but is not the same as the dollar percentage increase over time for general obligation debt
because the City’s population has decreased by 6.9% over the time period, falling from
2,896,016 to 2,695,598.180 Between FY2013 and FY2014, CPS general obligation debt per
capita declined slightly by 1.9% from $2,248 to $2,205. However, it rose again to $2,253 in
FY2015.181 As mentioned above, due to the additional bonds sold in FY2015 and the sale of
180 CPS FY2015 Comprehensive Annual Financial Report, p. 147. 181 CPS FY2015 Comprehensive Annual Financial Report, p. 147.
$4,092 $4,092 $4,277 $4,221
$4,905
$5,249
$5,594
$6,058 $5,945
$6,073
$-
$1,000
$2,000
$3,000
$4,000
$5,000
$6,000
$7,000
FY2006 FY2007 FY2008 FY2009 FY2010 FY2011 FY2012 FY2013 FY2014 FY2015
CPS General Obligation Debt: FY2006-FY2015 (In $ millions)
CPS FY2015 Comprehensive Annual Financial Report, pp. 146-147.
10-Year Increase of 48.4%($1,981,000)

81
$725.0 million in bonds in FY2016, the general obligation debt per capita trend is expected to
rise in subsequent years.
The very large increase in debt burden is a cause of concern because pension funding challenges
of the City of Chicago, which has coterminous boundaries with CPS required that government to
significantly raise its property tax levy in 2016 by 51.4% to $1.26 billion. Other overlapping
governments such as the Metropolitan Water Reclamation District have also increased property
taxes in the same period. Therefore taxpayers’ total per capita property tax burden in 2016 will
rise dramatically for residents and businesses located in the City of Chicago.
Costly Termination of Interest Rate Swap Agreements
Between 2003 and 2007, CPS issued approximately $1 billion worth of auction rate securities.
Most of these were paired with complex and risky interest rate swaps. Under terms of the swap
agreements, CPS was required to maintain investment grade credit ratings. Failure to maintain
such ratings would lead to termination of the agreements and the requirement that CPS make
penalty payments to the lending institutions.182
In March 2015 Moody’s Investors Services, Standard & Poor’s and Fitch Ratings downgraded
the credit of CPS to below investment grade status. This began to trigger certain defaults,
182 Dan Mihalopoulos and Lauren Fitzpatrick, Chicago Sun-Times, “CPS facing $200 million-plus penalties as bond
ratings plunge,” March 20, 2015.
$1,335 $1,413
$1,477 $1,458
$1,819
$1,947
$2,075
$2,248 $2,205
$2,253
$-
$500
$1,000
$1,500
$2,000
$2,500
FY2006 FY2007 FY2008 FY2009 FY2010 FY2011 FY2012 FY2013 FY2014 FY2015
CPS General Obligation Debt Per Capita: FY2006-FY2015
Source: CPS FY2015 Comprehensive Annual Financial Report, p. 147.
10-Year Increase of 68.8%($1.9 billion)

82
termination events and increases in interest rates for various CPS debt instruments. In response,
CPS terminated all ten of its outstanding interest rate swap agreements as of December 3,
2015.183
The original total estimated termination value of the swaps was $285 million. CPS was able to
reduce the amount by roughly $50 million through negotiations to $234.3 million. That sum was
proposed to be paid for with $142.3 million from the District’s Stabilization Fund and $86.4
million from the proceeds of tax anticipation notes.184
As noted above, on February 3, 2016, CPS postponed its plan to convert variable-rate debt to
fixed-rate debt and it will postpone reimbursing the general operating fund for some of the swap
termination fees.185
Interest Rate Swap Clawbacks
The issuance of variable rate debt with associated derivative instruments is a risky endeavor.
Some governments, such as the Cities of Modesto, California and Houston, Texas have
successfully negotiated settlements from investment banks after claiming that the banks did not
provide sufficient warning about the risks of auction-rate debt. 186
CPS failed to file such a claim to the Financial Industry Regulatory authority (FINRA), an
industry self-regulatory arbitration panel during a six-year eligibility period. It could still seek
damages through the Illinois court system, as no deadline applies in that venue.187 Many have
claimed that pursuing litigation to win “clawbacks” or refunds from the investment banks for
these bond deals this could be a partial solution to CPS’s fiscal problems.
The Civic Federation cannot opine on the possible outcome of litigation intended to claw back
previous swaps payments or fees. However, it is important to point out that even if a large
portion of the funds paid to the counterparties to these deals was returned, it would not be
enough to solve the immediate financial crisis facing the Chicago Public Schools or any other
government in a similar situation. It would also likely be a very lengthy process.
Use of Costly Scoop-and-Toss Financing that Backloads Debt Service Payments
The scoop-and-toss debt financing method involves refunding outstanding bonds to reduce
current year payments by pushing off large principal debt payments to future years. This
provides budgetary relief in the beginning years as debt service expenses are reduced, but in the
long-term it increases the total cost of borrowing.
183 Preliminary Official Statement Dated January 14, 2016, Board of Education of the City of Chicago, p. 65. 184 Preliminary Official Statement Dated January 14, 2016, Board of Education of the City of Chicago, p. 65. 185 Chicago Public Schools. CPS Statement on Today’s Bond Sale, February 3, 2016 at
http://cps.edu/News/Press_releases/Pages/PR1_02_03_16.aspx. 186 Heather Gillers. Chicago Tribune, “Cash-crunched Chicago schools missed chance to file claim against banks,”
July 14, 2015. 187 Heather Gillers. Chicago Tribune, “Cash-crunched Chicago schools missed chance to file claim against banks,”
July 14, 2015.

83
In the FY2016 budget, the District included a scoop-and-toss refunding as part of the proposed
budget balancing actions rather than pay the principal portion of the debt service owed using
General State Aid. The District issued a refunding bond in February 2016 to repay the principal
amounts owed in FY2016, which allowed CPS to use $254.0 million in General State Aid that
would have been dedicated to the principal payments and additional debt service reserves for
operations instead. In sum, CPS intended to use $200.0 million of this scoop-and-toss bond
refunding as a one-time resource to help close its $1.2 billion FY2016 deficit. 188 The FY2017
CPS budget does not use scoop-and-toss financing.
By pushing these principal payments due in FY2016 out into future years, the District will
greatly increase the cost of the original capital projects and services paid for with the bonds to
provide short-term budgetary relief.
Increased Amounts of Short-Term Borrowing Due to Liquidity Crisis
In addition to its pension crisis and structural deficit, CPS is also experiencing a significant
liquidity crisis that is the result of both the drawdown of nearly its entire budgetary reserves over
the last several budget years and the change to the revenue recognition period CPS used to close
the FY2015 budget deficit. At the end of FY2015, CPS reported it would not have enough cash
on hand to make its required $634.0 million pension payment. This was a result of the drawdown
of its fund balance throughout FY2015 and the fact that CPS was relying on property tax revenue
to balance its budget that would not come in until July and August, after the end of the fiscal year
on June 30. CPS expanded its line of credit by $200.0 million to a total of $700.0 million in order
to provide the liquidity necessary to make the full pension payment on time.189
The District relied on an increased level of short-term borrowing in FY2016 to cover anticipated
cash flow difficulties. The District accessed $1.16 billion of short-term borrowing to bridge the
gap between revenue collections and expenses throughout the fiscal year.190 The funds were
secured through lines of credit and commercial loans and payable with dedicated revenues
including property tax collections.
In December 2015, after the FY2016 CPS budget was approved, the Board of Education
approved an additional $130.0 million in short-term borrowing to smooth over delays in State
funding. At that time, the State was late on providing $210.0 million in payments owed to CPS;
this included $150.0 million in block grants.191
The District’s lack of fund balance and resulting liquidity crisis has a price. In FY2016, CPS
issued a total of nearly $1.1 million in TANs to support liquidity. That short-term borrowing was
projected to increase debt service costs by approximately $24.0 million. In FY2017 the District
188 CPS FY2016 Proposed Budget, p. 4; Communication with Chicago Public Schools Budget Office, August 10,
2015. 189 CPS FY2016 Proposed Budget, p. 169. 190 See Chicago Board of Education Regular Board Meeting, December 16, 2015 and CPS FY2016 Proposed
Budget, p. 13. 191 Chicago Board of Education Regular Board Meeting, Proceedings, December 16, 2015 at
http://www.cpsboe.org/content/documents/dec16_2015proceedings.pdf.

84
plans to issue additional TANs and has budgeted approximately $35.0 million in interest costs.192
The short-term focus of the last several Chicago Public Schools budgets has a real cost both in
terms of borrowing cost and public and investor confidence in the District.
CPS Bond Ratings are Below Investment Grade
In 2015 and 2016 the Chicago Public Schools continued on a path of steadily falling credit
ratings as the District struggled to finance its mounting debt and pension obligations and
depleted its reserves.
As of February 2016, Standard & Poor’s, Moody’s Investors Services and Fitch Ratings rate CPS
debt as being below investment grade status, with ratings of B+, B2 and B+ respectively. Kroll
still rates CPS debt as investment grade with a rating BBB-. The most recent downgrades came
in early 2016 and throughout 2015.
2016 Downgrades
Moody’s Investors Services downgraded CPS credit on January 29, 2016 from B1 to B2 because
of the District’s continuing severe liquidity situation, its need to access the credit markets to fund
ongoing operations and its structurally unbalanced budget.193
On January 19, 2016 Fitch Ratings downgraded Chicago Public Schools’ approximately $6.1
billion of outstanding unlimited tax general obligation debt from BB+ to B+ with a negative
rating outlook. The rating agency cited the District’s $480.0 million unbalanced FY2016 budget
and its enormous unfunded pension liabilities as the reason for the downgrade.194
On January 15, 2016 Standard and Poor’s downgraded CPS debt by two notches, from BB to B+
status. The rating agency cited a number of factors as the reason for the downgrade, including
192 Chicago Public Schools FY2017 Proposed Budget, p. 173. 193 Moody’s Investors Services, “Rating Update: Moody’s downgrades Chicago Board of Education, IL’s GO to B2;
outlook negative,” January 29, 2016. 194 Fitch Ratings. “Fitch Downgrades Chicago Board of Ed (IL) ULTGOs to ‘B+’; Outlook Negative,” January 19,
2016.
Name of Agency 2006 2007 2008 2009 2010 2011 2012 2013 2014 2015 2016
Kroll Bond Rating Agency BBB+ BBB*
BBB- **
Fitch Ratings A+ A+ A+ A+ AA- A+ A A- A- BBB- B+
Standard & Poor's Rating ServicesA+ AA- AA- AA- AA- AA- A+ A+ A+ A- B+
Moody's Investor Services A2 A1 A1 A1 Aa2 Aa3 A2 A3 Baa1 Ba3 B2
*Series 2016AB
** Prior Issues
Source: Chicago Public Schools. “Credit Ratings at
http://www.cps.edu/About_CPS/Financial_information/Pages/CreditRatings.aspx. Modified February 1, 2016.
Chicago Public Schools Credit Ratings: 2006-February, 2016

85
cash-flow concerns, a FY2016 budget built on an assumption of state assurance and union
concessions and the District’s limited ability to raise new revenues.195
2015 Downgrades
Moody’s Investors Services downgraded CPS credit from Ba3 to B1 on December 21, 2015. The
rating agency cited the District’s precarious liquidity situation which has resulted in large scale
cash flow borrowing and the structurally unbalanced CPS budget.196
On August 27, 2015 Kroll Bond Rating Agency downgraded the credit rating of CPS general
obligation bonds from BBB+ to BBB- and revised the outlook to negative. The decision was
based on the District’s adoption of a structurally unbalanced FY2016 budget, reliance on non-
recurring revenue, its weak liquidity position and increased dependence on external cash flow
borrowing for operations.197
In August 2015, Standard & Poor’s (S&P) downgraded CPS credit to BB from a BBB rating
with a negative outlook. S&P cited the District’s structural budget deficit, its decision to rely on
$480.0 million in uncommitted state aid in its budget and its plan to borrow $200.0 million in
order to push off debt payments coming due.198
In July 2015, Fitch downgraded the Chicago Public Schools’ credit rating to BB+ from BBB-
with a negative outlook. Fitch cited the District’s structural budget gap, lack of reserves,
enormous pension liabilities, high debt levels and a record of contentious negotiations with
organized labor as the reasons for the downgrade. Fitch noted that CPS has limited options for
improving the situation. 199
In May 2015 Moody’s dropped CPS’ rating three notches to Ba3 from Baa3, with a continuing
negative outlook. 200
In March 2015 Fitch downgraded CPS’ credit rating three notches to BBB- with a negative
outlook. Moody’s cut its rating two notches to Baa3, one level above non-investment grade
status, and Standard & Poor’s cut it two notches to A-.201 The downgrades triggered penalties
195 Juan Perez, Jr., Chicago Tribune, "CPS gets harsh notice on debt: Standard & Poor's further downgrades district's
rating," January 16, 2016. 196 Moody’s Investors Services. Moody's downgrades Chicago Board of Education, IL's GO to B1; rating under
review for further downgrade,” December 2015. 197 Kroll Bond Rating Agency. “Kroll Bond Rating Agency Downgrades Rating on the Board of Education of the
City of Chicago’s General Obligation Bonds,” August 27, 2015 at
https://www.krollbondratings.com/announcements/1598. 198
Standard & Poor’s, “Chicago Board of Education GO Rating Lowered To 'BB' From 'BBB' On Structural
Imbalance And Low Liquidity,” August 14, 2015. 199 Fitch Ratings. “Fitch Downgrades Chicago Board of Ed (IL) ULTGOs to BBB+; Negative Watch,” July 7, 2015. 200 Lauren Fitzpatrick and Tina Sfondeles, “Chicago public schools and park district’s debt downgraded to junk
status,” Chicago Sun-Times, May 13, 2015. 201 Reuters, “Update 2-Fitch Downgrades Chicago Board of Education rating to BBB-,” March 20, 2015.

86
under the terms of the District’s debt swap agreements with financial institutions of well over
$200 million.202
Debt Service Appropriations as a Percentage of Total Appropriations
The ratio of debt service expenditures as a percentage of total Governmental Fund expenditures
is frequently used by rating agencies to assess debt burden. The rating agencies consider a debt
burden high if this ratio is between 15.0% and 20.0%.203 Although the debt service ratio for CPS
will increase significantly from 6.7% in FY2013 to 10.3% in FY2017, it is still below the 15%
threshold. Between FY2013 and FY2017, the debt service ratio averaged 8.9%.
It is important to note that rather than pay the principal portion of the debt service owed in
FY2016 using General State Aid, the District included a scoop-and-toss refunding as part of its
proposed budget balancing actions. The District issued a refunding bond to repay the principal
amounts owed in FY2016, which allowed CPS to use $254.0 million in GSA that would have
been dedicated to the principal payments and additional debt service reserves for operations
instead. By pushing these principal payments due in FY2016 out into future years, the District
will greatly increase the cost of the original capital projects and services paid for with the bonds
to provide short-term budgetary relief.
CPS will not be using scoop-and-toss refunding in FY2017. This means that the General State
Aid (GSA) that was freed up for use on operating expenses in FY2016 as a result of this
restructuring, will again be used for debt service.204
CAPITAL BUDGET
Information about CPS capital projects can be found in the capital budget section of the proposed
FY2017 budget and in the FY2016-FY2020 capital improvement plan on the District’s website.
The FY2017-2021 capital improvement plan is not yet available).205
202 Dan Mihalopoulos and Lauren Fitzpatrick, “CPS facing $200 million-plus penalties as bond ratings plunge,”
Chicago Sun-Times, March 20, 2015. 203 Standard & Poor’s, Public Finance Criteria 2007, p. 64. See also Moody’s, General Obligation Bonds Issued by
U.S. Local Governments, October 2009, p. 18. 204 Chicago Public Schools FY2017 Proposed Budget, p. 24. 205
Located at http://cps.edu/fy17budget/Pages/capital.aspx and Chicago Public Schools FY2017 Proposed Budget,
pp. 155-162.
FY2013
Actual
FY2014
Actual
FY2015
Actual
FY2016
Estimated
FY2017
Proposed $ Change
%
Change
Debt Service Appropriations 390.4$ 467.9$ 533.5$ 538.1$ 563.2$ 172.80$ 44.3%
Total Appropriations 5,804.3$ 5,312.2$ 5,756.3$ 5,691.8$ 5,459.8$ (344.50)$ -5.9%
Debt Service as a % of Total
Appropriations 6.7% 8.8% 9.3% 9.5% 10.3%
Chicago Public Schools Budgeted Debt Service Appropriations as of % of Total Appropriations:
FY2013-FY2017
Sources: CPS Proposed FY2017 Budget, pp. 12 and 168; CPS FY2016 Proposed Budget, pp. 9 and 161; CPS FY2015 Proposed Budget at
http://www.cps.edu/fy15budget/Pages/debtmanagement.aspx and FY2014 Estimated Budget, p. 7; Previous budget data from www.cps.edu.

87
In its FY2017 budget, CPS proposes spending $337.5 million for capital projects. However, on
August 16, 2016 CPS announced that it would sell up to $945 million in bonds for construction
projects and other expenses. 206 Details of how the funds would be used would be provided in
supplemental capital budget to be released in the fall.207
The largest single amount in the proposed FY2017 budget, or 51.3% of the total, will be $173.2
million for projects intended to provide relief from overcrowding. This is followed by funding
for building repair and modernization, which will consume $116.7 million or 34.6% of all capital
spending. The “other” category, will be 7.1% of total spending, or $23.9 million. It includes
funding for capital project support services as well as legal and regulatory requirements. Finally,
$23.8 million will be spent under the rubric of programmatic investments; this will include
funding for the re-opening of Dyett High School, new educational programming and adding air
conditioning to every classroom in every school.208
206 Juan Perez, Jr. “Chicago Public Schools sets hearing on another massive bond issue,” Chicago Tribune, August
16, 2016. 207 Chicago Public Schools FY2017 Proposed Budget, pp. 5-6. 208 Chicago Public Schools FY2017 Budget, pp. 161-162.
Building Repairs & Modernization
$116,657 34.6%
Overcrowding Relief$173,180
51.3%
Other$23,910
7.1%
Programmatic Investments
$23,760 7.0%
CPS FY2017 Proposed Capital Budget (in $ thousands)
Source: CPS FY2017 Proposed Budget, p. 158.
FY2017 Proposed Capital Budget Total:$337.5 million

88
The FY2017 capital budget will be funded primarily with debt proceeds. About $265.9 million,
or 78.8% of all resources used, will be from debt. Roughly 16.0%, or $54.0 million, will be
derived from Chicago tax increment financing (TIF) funding and 5.2% will come from federal
grants.
Debt Proceeds$265,907
78.8%
Federal Grants$17,600
5.2%
TIF Funding$54,000
16.0%
CPS Funding Sources for FY2017 Proposed Capital Budget (in $ thousands)
Source: CPS FY2017 Proposed Budget, p. 158.
FY2017 Proposed Capital Budget Total:$337.5 million

89
Capital Project Revenues and Spending: FY2012-FY2017
This section presents information about two-and five-year trends in CPS capital budget spending.
The exhibit that follows shows capital revenues and expenses (outlays) to be incurred in FY2017
regardless of the year in which the project was appropriated. The fund balance amount shown is
the difference between expected FY2017 capital expenses versus revenues; the amount unspent
in one fiscal year carries forward into the next fiscal year.209
Here are some of the significant two-year changes between the FY2016 estimated and the
FY2017 proposed budget:
Total capital revenues will decrease by $70.3 million, or 53.9%, from $130.5 million to
$60.2 million;
State of Illinois revenues are expected to decrease from $33.6 million to $14.8 million, or
56.0%. Of the $14.8 million amount, $13.3 million will be derived from gaming revenue
and will be used for new capital projects and $1.5 million will be Illinois Green
Infrastructure Grants for prior year capital projects;210
Local revenues are expected to fall sharply from $96.6 million in FY2016 to $39.4
million in FY2017. Approximately $29.0 million of the FY2016 amount will be from
TIF-related projects and $10.0 million will derive from other local funding sources;211
and
Federal outlays will increase from $0.3 million to $6.0 million. The federal revenue total
is an expected $6 million in Federal E-Rate funding for upgrades to the District’s IT
infrastructure.212
On the expenditure side, capital outlays will fall to $227.1 million in FY2017 from $266.4
million in the previous year; this is a decrease of 14.8%. In the same period, bond issuance will
decrease by 7.4%, falling from $357.6 million to $331.0 million. It is important to note that
capital outlay figures may increase dramatically in the fall if the supplemental capital budget
authorizing up to $945 million in bonds is approved.
The end of year fund balance is expected to rise from $87.8 million to $251.9 million.
Over the five-year period between FY2013 actual spending and the FY2017 proposed budget,
total capital revenues will decrease by 45.5%, or $50.2 million. Capital outlays will fall by
54.0% or $266.4 million, dropping from $493.5 million to $227.1 million. The end of year fund
balance will increase by 44.9%, rising from $173.8 million in FY2013 to $251.9 million in
FY2017.
209 CPS FY2017 Proposed Budget, p. 160. 210 CPS FY2017 Proposed Budget, p. 160. 211 CPS FY2017 Proposed Budget, p. 160. 212 CPS FY2017 Proposed Budget, p. 160.

90
CPS FY2016-FY2020 Capital Improvement Plan
Public Act 97-0474 requires CPS to prepare and publish a five-year capital improvement plan
(CIP). This requirement was amended by P.A. 97-1133 to also require development of a 10-year
Educational Facilities Master Plan. That plan will be used to guide completion of the FY2017
capital budget and five-year capital improvement plan. The plan’s goals include: 1) using
educational goals to guide the direction of capital programming; 2) maintaining health and safety
of students and staff; 3) supporting a full school day; 4) relieving overcrowding; and 5)
identifying partners for external funding support.
The FY2017-FY20201 capital improvement plan is not yet available. CPS announced that on
August 16, 2016 that it would sell up to $954 million in bonds for construction projects and other
expenses. 213 Details of how the funds would be used would be provided in supplemental capital
budget to be released in the fall.214
213 Juan Perez, Jr. “Chicago Public Schools sets hearing on another massive bond issue,” Chicago Tribune, August
16, 2016. 214 Chicago Public Schools FY2017 Proposed Budget, pp. 5-6.
FY2016 FY2017
FY2013 FY2014 FY2015 Estimated Proposed Two-Year Two-Year Five-Year Five-Year
Actual Actual Actual Budget Budget $ Change % Change $ Change % Change
Beginning of Year Fund Balance 88.8$ 173.8$ (92.0)$ (133.9)$ 87.8$ 221.7$ -165.6% (1.0)$ -1.1%
Revenues
Local Revenue 88.0$ 37.2$ 155.5$ 96.6$ 39.4$ (57.2)$ -59.2% (48.6)$ -55.2%
State Revenue 6.9$ 37.8$ 32.1$ 33.6$ 14.8$ (18.8)$ -56.0% 7.9$ -
Federal Revenue 13.6$ 14.9$ 6.4$ 0.3$ 6.0$ 5.7$ --- (7.6)$ -55.9%
Interest Earnings 1.9$ -$ -$ -$ -$ -$ - (1.9)$ ---
Total Revenue 110.4$ 89.9$ 194.0$ 130.5$ 60.2$ (70.3)$ -53.9% (50.2)$ -45.5%
Expenditures
Capital Outlay 493.5$ 487.0$ 384.1$ 266.4$ 227.1$ (39.3)$ -14.8% (266.4)$ -54.0%
Bond Issuance 468.0$ 131.3$ 148.5$ 357.6$ 331.0$ (26.6)$ -7.4% (137.0)$ -29.3%
End of Year Fund Balance 173.8$ (92.0)$ (133.9)$ 87.8$ 251.9$ 164.1$ 186.9% 78.1$ 44.9%
Source: CPS FY2013 Amended Budget, p. 131, FY2015 Proposed Budget, p. 157 and FY2016 Proposed Budget, p. 150 and FY2017 Proposed Budget, p. 160.
CPS Capital Revenues and Outlays to be Incurred in FY2017
(in $ millions)
91
APPENDIX
Long-Term Financial Planning Best Practices
The National Advisory Council on State and Local Budgeting (NACSLB) and the Government
Finance Officers Association (GFOA) both recommend that all governments formally adopt a
long-term financial plan as a key component of a sound budget process.215 A long-term financial
plan typically includes the following components:
A review of historical financial and programmatic trends;
Multi-year projections of revenues, expenditures and debt;
An analysis of those multi-year trends and projections; and
Modeling of options to address problems and opportunities, which helps governments
address fiscal challenges before they become fiscal crises.
A key component of financial planning is engaging all stakeholders in the process of developing
the plan. The GFOA describes long-term financial planning as “not just a staff-driven process. It
is consensus-driven and inclusive, involving elected officials, staff and the public.”216 Among
other benefits, involving all stakeholders can help staff refine forecasts, institutionalize planning
processes and promote strategic decision-making.
215 More information on the National Advisory Council on State and Local Budgeting and the Government Finance
Officers Association at www.gfoa.org. 216
Government Finance Officers Association, “An Introduction to Financial Planning,”
(http://www.gfoa.org/downloads/LTFPbrochure.pdf.

92
The GFOA has developed a four-phase approach217 to financial planning for school districts: the
mobilization phase, the analysis phase, the decision phase and the execution phase as illustrated
in the following GFOA infographic.
The Four Phases of Long-Term Financial Planning
The GFOA notes that “for a variety of reasons, true structural balance may not be possible for a
government at a given time. In such a case, using reserves to balance the budget may be
considered but only in the context of a plan to return to structural balance, replenish fund
balance, and ultimately remediate the negative impacts of any other short-term balancing actions
217 Government Finance Officers Association, “Making the Grade: Long-Term Financial Planning for Schools”
http://www.gfoa.org/sites/default/files/GFOAMakingtheGradeLTFPforSchools.pdf (last visited on July 17, 2014).

93
that may be taken.”218 By developing a long-term financial plan in the model presented by the
GFOA for school districts and already utilized successfully by other school districts in Illinois,219
CPS can link its annual budgets together into a cohesive program that better articulates its
funding assistance needs to the public and policymakers. The long-term financial plan should be
public, detailed, prioritized and address the District’s policy and programming priorities and how
CPS plans to use the District’s resources to address these priorities. The plan should be updated
yearly as it should serve as an important accountability component to each year’s budget by
informing stakeholders how CPS plans to achieve its mission.
218 Government Finance Officers Association, “Making the Grade: Long-Term Financial Planning for Schools”
http://www.gfoa.org/sites/default/files/GFOAMakingtheGradeLTFPforSchools.pdf (last visited on July 17, 2014). 219 See discussion of Geneva Community Unit School District 304 in Illinois in Government Finance Officers
Association, “Making the Grade: Long-Term Financial Planning for Schools.”