CHICAGO PUBLIC SCHOOLS FY2016 PROPOSED ... EXECUTIVE SUMMARY The Civic Federation opposes the...
92
CHICAGO PUBLIC SCHOOLS FY2016 PROPOSED BUDGET: Analysis and Recommendations August 25, 2015
Transcript of CHICAGO PUBLIC SCHOOLS FY2016 PROPOSED ... EXECUTIVE SUMMARY The Civic Federation opposes the...

CHICAGO PUBLIC SCHOOLS
FY2016 PROPOSED BUDGET:
Analysis and Recommendations
August 25, 2015
2
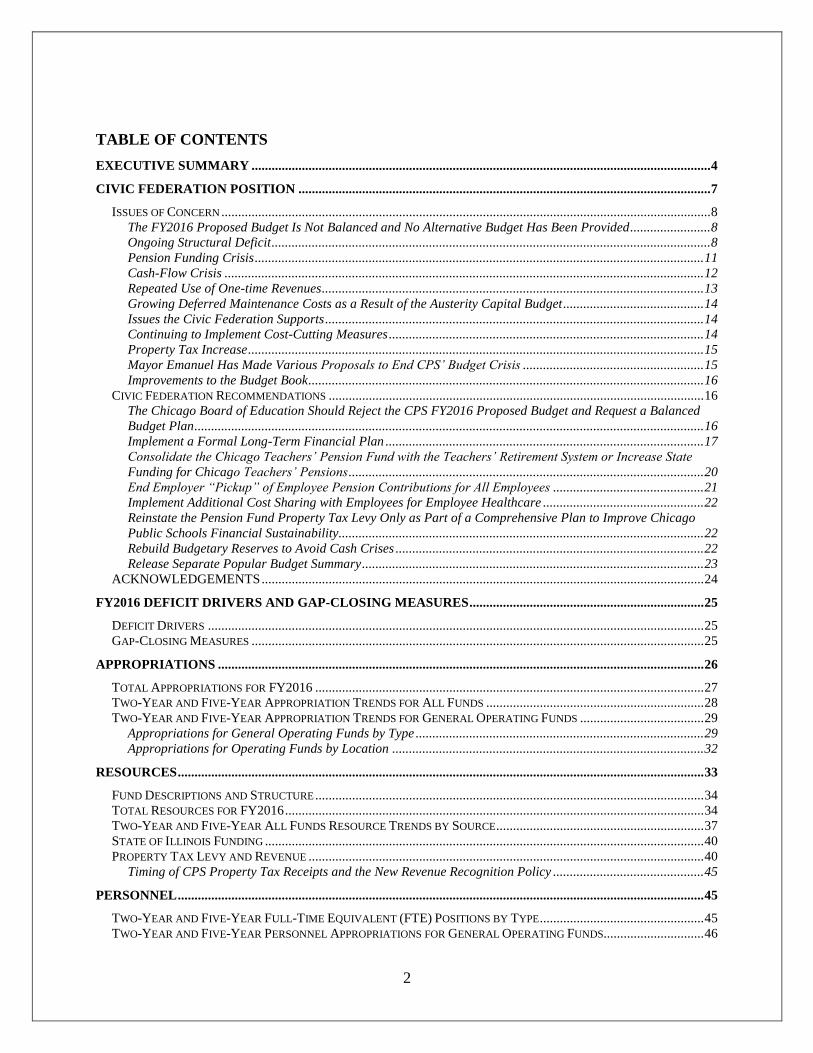
TABLE OF CONTENTS EXECUTIVE SUMMARY ......................................................................................................................................... 4
CIVIC FEDERATION POSITION ........................................................................................................................... 7
ISSUES OF CONCERN .................................................................................................................................................. 8 The FY2016 Proposed Budget Is Not Balanced and No Alternative Budget Has Been Provided ........................ 8 Ongoing Structural Deficit ................................................................................................................................... 8 Pension Funding Crisis ...................................................................................................................................... 11 Cash-Flow Crisis ............................................................................................................................................... 12 Repeated Use of One-time Revenues .................................................................................................................. 13 Growing Deferred Maintenance Costs as a Result of the Austerity Capital Budget .......................................... 14 Issues the Civic Federation Supports ................................................................................................................. 14 Continuing to Implement Cost-Cutting Measures .............................................................................................. 14 Property Tax Increase ........................................................................................................................................ 15 Mayor Emanuel Has Made Various Proposals to End CPS’ Budget Crisis ...................................................... 15 Improvements to the Budget Book ...................................................................................................................... 16
CIVIC FEDERATION RECOMMENDATIONS ................................................................................................................ 16 The Chicago Board of Education Should Reject the CPS FY2016 Proposed Budget and Request a Balanced
Budget Plan ........................................................................................................................................................ 16 Implement a Formal Long-Term Financial Plan ............................................................................................... 17 Consolidate the Chicago Teachers’ Pension Fund with the Teachers’ Retirement System or Increase State
Funding for Chicago Teachers’ Pensions .......................................................................................................... 20 End Employer “Pickup” of Employee Pension Contributions for All Employees ............................................. 21 Implement Additional Cost Sharing with Employees for Employee Healthcare ................................................ 22 Reinstate the Pension Fund Property Tax Levy Only as Part of a Comprehensive Plan to Improve Chicago
Public Schools Financial Sustainability............................................................................................................. 22 Rebuild Budgetary Reserves to Avoid Cash Crises ............................................................................................ 22 Release Separate Popular Budget Summary ...................................................................................................... 23
ACKNOWLEDGEMENTS .................................................................................................................................... 24
FY2016 DEFICIT DRIVERS AND GAP-CLOSING MEASURES ...................................................................... 25
DEFICIT DRIVERS .................................................................................................................................................... 25 GAP-CLOSING MEASURES ....................................................................................................................................... 25
APPROPRIATIONS ................................................................................................................................................. 26
TOTAL APPROPRIATIONS FOR FY2016 .................................................................................................................... 27 TWO-YEAR AND FIVE-YEAR APPROPRIATION TRENDS FOR ALL FUNDS ................................................................. 28 TWO-YEAR AND FIVE-YEAR APPROPRIATION TRENDS FOR GENERAL OPERATING FUNDS ..................................... 29
Appropriations for General Operating Funds by Type ...................................................................................... 29 Appropriations for Operating Funds by Location ............................................................................................. 32
RESOURCES ............................................................................................................................................................. 33
FUND DESCRIPTIONS AND STRUCTURE .................................................................................................................... 34 TOTAL RESOURCES FOR FY2016 ............................................................................................................................. 34 TWO-YEAR AND FIVE-YEAR ALL FUNDS RESOURCE TRENDS BY SOURCE .............................................................. 37 STATE OF ILLINOIS FUNDING ................................................................................................................................... 40 PROPERTY TAX LEVY AND REVENUE ...................................................................................................................... 40
Timing of CPS Property Tax Receipts and the New Revenue Recognition Policy ............................................. 45
PERSONNEL ............................................................................................................................................................. 45
TWO-YEAR AND FIVE-YEAR FULL-TIME EQUIVALENT (FTE) POSITIONS BY TYPE ................................................. 45 TWO-YEAR AND FIVE-YEAR PERSONNEL APPROPRIATIONS FOR GENERAL OPERATING FUNDS.............................. 46
3
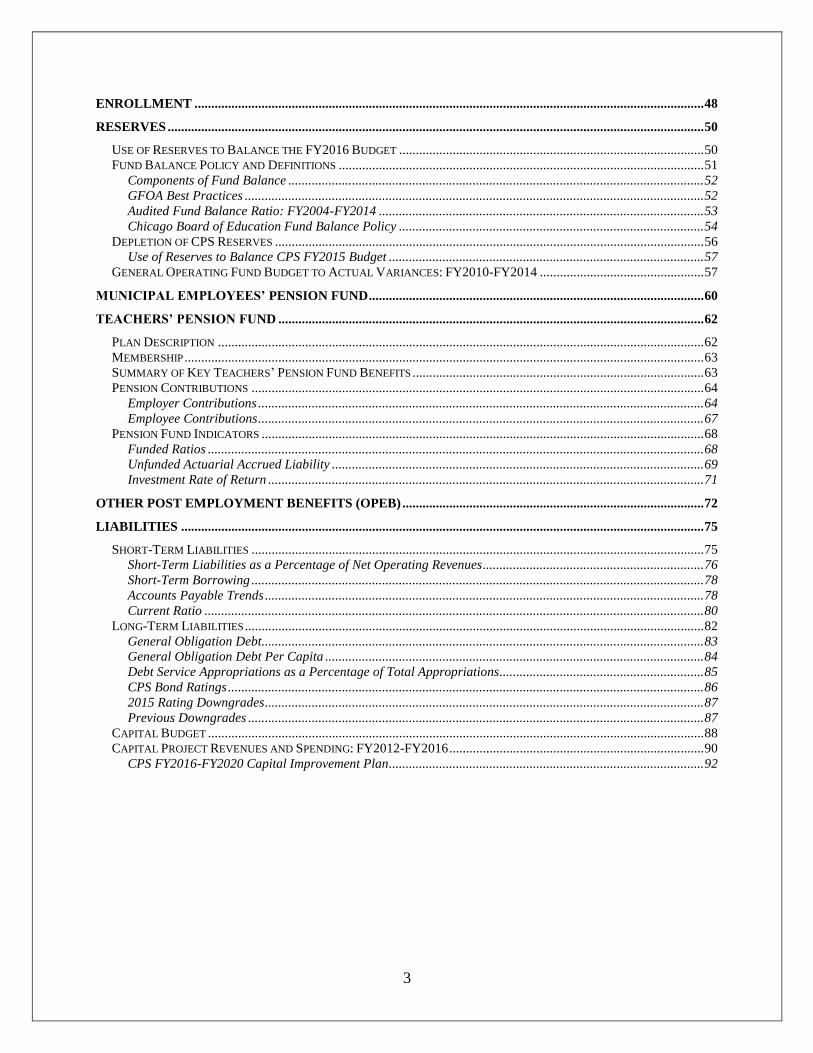
ENROLLMENT ........................................................................................................................................................ 48
RESERVES ................................................................................................................................................................ 50
USE OF RESERVES TO BALANCE THE FY2016 BUDGET ........................................................................................... 50 FUND BALANCE POLICY AND DEFINITIONS ............................................................................................................. 51
Components of Fund Balance ............................................................................................................................ 52 GFOA Best Practices ......................................................................................................................................... 52 Audited Fund Balance Ratio: FY2004-FY2014 ................................................................................................. 53 Chicago Board of Education Fund Balance Policy ........................................................................................... 54
DEPLETION OF CPS RESERVES ................................................................................................................................ 56 Use of Reserves to Balance CPS FY2015 Budget .............................................................................................. 57
GENERAL OPERATING FUND BUDGET TO ACTUAL VARIANCES: FY2010-FY2014 ................................................. 57
MUNICIPAL EMPLOYEES’ PENSION FUND .................................................................................................... 60
TEACHERS’ PENSION FUND ............................................................................................................................... 62
PLAN DESCRIPTION ................................................................................................................................................. 62 MEMBERSHIP ........................................................................................................................................................... 63 SUMMARY OF KEY TEACHERS’ PENSION FUND BENEFITS ....................................................................................... 63 PENSION CONTRIBUTIONS ....................................................................................................................................... 64
Employer Contributions ..................................................................................................................................... 64 Employee Contributions ..................................................................................................................................... 67
PENSION FUND INDICATORS .................................................................................................................................... 68 Funded Ratios .................................................................................................................................................... 68 Unfunded Actuarial Accrued Liability ............................................................................................................... 69 Investment Rate of Return .................................................................................................................................. 71
OTHER POST EMPLOYMENT BENEFITS (OPEB) .......................................................................................... 72
LIABILITIES ............................................................................................................................................................ 75
SHORT-TERM LIABILITIES ....................................................................................................................................... 75 Short-Term Liabilities as a Percentage of Net Operating Revenues .................................................................. 76 Short-Term Borrowing ....................................................................................................................................... 78 Accounts Payable Trends ................................................................................................................................... 78 Current Ratio ..................................................................................................................................................... 80
LONG-TERM LIABILITIES ......................................................................................................................................... 82 General Obligation Debt.................................................................................................................................... 83 General Obligation Debt Per Capita ................................................................................................................. 84 Debt Service Appropriations as a Percentage of Total Appropriations............................................................. 85 CPS Bond Ratings .............................................................................................................................................. 86 2015 Rating Downgrades ................................................................................................................................... 87 Previous Downgrades ........................................................................................................................................ 87
CAPITAL BUDGET .................................................................................................................................................... 88 CAPITAL PROJECT REVENUES AND SPENDING: FY2012-FY2016 ............................................................................ 90
CPS FY2016-FY2020 Capital Improvement Plan .............................................................................................. 92
4
EXECUTIVE SUMMARY
The Civic Federation opposes the Chicago Public Schools’ (CPS) proposed Fiscal Year 2016 operating
budget of $5.7 billion because it assumes the State of Illinois will provide an additional $480.0 million at
some point this year. Such funds have not been appropriated by the State, so the budget is not balanced.
We urge the Board of Education to reject this budget and call for a budget with a detailed
contingency plan.
It is financially risky for the District to base its spending on the hope of additional funds from the State of
Illinois and it is irresponsible that they did not provide a detailed alternative spending plan should the
State, which has not been able to pass its own budget, fail to provide nearly half a billion dollars in
additional funding to CPS. In the budget document, CPS says it will make cuts and/or engage in
“unsustainable borrowing” if the State of Illinois does not provide additional pension funding. This is not
an appropriate contingency plan. The Civic Federation strongly believes that all stakeholders, including
students, parents, employees, taxpayers and legislators, are entitled to information about precisely what
consequences will follow if gridlock continues at the State and no additional funds are appropriated.
The Board of Education should call for an alternative spending plan that specifies the actions CPS will
take if it doesn’t receive additional revenue from the State of Illinois. Such a contingency plan must be
realistic and must not rely on borrowing for operations or other unsustainable actions such as a pension
funding holiday. Unfortunately, and in the absence of additional operating resources, the plan will have to
rely on significant and painful spending cuts. While the Federation understands that the District might not
want to unduly frighten parents and employees with a “doomsday budget” it is also true that the
uncertainty surrounding their proposed plan is damaging to the District’s reputation, as seen in a recent
downgrade of the District’s credit rating by Standard & Poor’s to below investment grade that was partly
made in response to its proposed deficit budget. It would also be helpful for State legislators to
understand the exact consequences of a failure to act on their part.
The Chicago Public Schools has played a significant role in its own crisis and the massive $1.2 billion
initial budget shortfall it faced this year, but it is also important to recognize that many factors directly
impacting the District’s finances are beyond its control, including falling state and federal revenue and
insufficient pension funding from the State of Illinois. While it is imprudent for the District to count on
additional funding from a dysfunctional State of Illinois, this does not absolve the State of its duty to step
in and assist its largest school district. Whether through additional pension funding, permission to levy a
larger property tax or consolidating the Chicago Teachers’ Pension Fund with the downstate and suburban
Teachers’ Retirement System, or some combination of these actions, it is imperative that the State take
responsibility for its role in the CPS crisis and do its part to help set the District on a sustainable fiscal
path.
The Civic Federation believes CPS has reached a very precarious and potentially devastating short-term
and long-term financial position where the District faces a cash crisis, its bond status is rated below
investment grade by three of the four major bond rating agencies and it faces enormous and growing
legacy debt and pension obligations, to name only several of its multiplicity of dire fiscal issues. While
for the last several years the District has been able to use budget gimmicks to achieve short-term balance
at the cost of long-term financial stability, it has now run out of ways to delay the inevitable and has
reached a turning point. If stakeholders do not come together to develop a multi-year plan to restore fiscal
structure to the District that involves increased revenues, difficult cuts and pension changes, the
Federation is deeply concerned that CPS could fail, with devastating and lasting consequences for the
future of Chicago and Illinois.
5
The Civic Federation offers the following key findings on the FY2016 Proposed Budget:
The proposed FY2016 total all funds budget of $6.4 billion is a decrease of 6.8%, or $466.0
million, from the FY2015 adopted total all funds approved budget of $6.9 billion. The Capital
Projects Funds will decline by $332.3 million, or 65.2%, over the two-year period;
The proposed FY2016 operating budget of $5.69 billion is a decrease of 1.2% or $68.5 million
from the FY2015 adopted operating budget of $5.76 billion;
The District will rely on the hope of $480.0 million in additional pension funding from the State
of Illinois to balance its budget;
The District is turning to short-term borrowing, or Tax Anticipation Notes (TANs) with an
additional borrowing cost of $24.0 million,1 to secure cash flow since it has drained its budgetary
reserves;
The District’s FTE position count in FY2016 will decrease by 847.4 FTEs, or 2.2%, from the
FY2015 approved budget. In the two-year period, the largest reduction in positions will be school
support staff, which will decline by 3.9%, or 409.9 FTEs;
In FY2016 CPS will continue to deplete its dwindling operating fund reserves to balance its
budget and will not maintain its stabilization fund fund balance at targeted levels; and
The FY2016 State of Illinois K-12 education budget, signed into law by Governor Rauner on
June 24, 2015, did not include any contribution to Chicago teachers’ pensions other than the
statutory contribution.
The Civic Federation has major concerns about the CPS FY2016 Proposed Budget:
The District is proposing an unbalanced budget, which relies on $480.0 million in pension relief
from the State of Illinois and no alternative budget has been provided to detail the actions the
District would take if Illinois does not provide additional funding;
The District has an ongoing structural deficit;
The District continues to face a pension crisis that has been exacerbated by recent court decisions;
The District is also experiencing a significant liquidity crisis due to the drawdown of nearly its
entire budgetary reserves over the last several years and the change to the revenue recognition
period in FY2015;
The District has repeatedly used one-time revenue resources to pay for ongoing expenditures; and
The District is understandably reducing the scope of its capital investments, but deferring
maintenance will add to long-term costs.
The Civic Federation supports several of the District’s initiatives in the FY2016 Proposed Budget:
The District’s $200.0 million in proposed cuts to the budget are a step toward aligning
expenditures with ongoing revenues;
The District’s proposal to increase its property tax levy by 0.8% (the maximum allowed under
State tax law) and levy for new property;
Action by Mayor Emanuel to outline two proposals to end the budget crisis at CPS, involving the
State of Illinois and other stakeholders; and
Improvements made by the District to the FY2016 budget by including a new cash-flow chapter
and more information about expenditure trends.
1 TANs are backed by anticipated property tax revenues.
6
The Civic Federation makes the following recommendations to Chicago Public Schools and the Chicago
Board of Education:
The Board should reject the FY2016 Proposed Budget based on the previously mentioned
concerns and call for a detailed alternative budget should the hoped-for $480 million in extra
pension funding from the State of Illinois not be realized;
The District must implement and make publicly available a long-term financial plan;
The State should consolidate the Chicago Teachers’ Pension Fund with the State Teachers’
Retirement System or at least significantly increase its funding to the Chicago Teachers’ Pension
Fund;
The District should implement additional healthcare cost sharing with employees;
The District should reinstate the pension fund property tax levy only as part of a comprehensive
plan to improve Chicago Public Schools financial sustainability;
The District should end the pension “pickup” of 7.0% for all employees; and
The District must find the means to rebuild its budgetary reserves once it has overcome its current
fiscal crisis so it can address cash-flow issues in the future without resorting to borrowing.

7
CIVIC FEDERATION POSITION
The Civic Federation opposes the Chicago Public Schools’ (CPS) proposed Fiscal Year 2016
operating budget of $5.7 billion because it assumes the State of Illinois will provide an additional
$480.0 million at some point this year. Such funds have not been appropriated by the State, so
the budget is not balanced. We urge the Board of Education to reject this budget and call for
a budget with a detailed contingency plan.
It is financially risky for the District to base its spending on the hope of additional funds from the
State of Illinois and it is irresponsible that they did not provide a detailed alternative spending
plan should the State, which has not been able to pass its own budget, fail to provide nearly half
a billion dollars in additional funding to CPS. In the budget document, CPS says it will make
cuts and/or engage in “unsustainable borrowing” if the State of Illinois does not provide
additional pension funding. This is not a contingency plan. The Civic Federation strongly
believes that all stakeholders, including students, parents, employees, taxpayers and legislators,
are entitled to information about precisely what consequences will follow if gridlock continues at
the State and no additional funds are appropriated.
The Board of Education should call for an alternative spending plan that specifies the actions
CPS will take if it doesn’t receive additional revenue from the State of Illinois. Such a
contingency plan must be realistic and must not rely on borrowing for operations or other
unsustainable actions such as a pension funding holiday. Unfortunately, and in the absence of
additional operating resources, the plan will have to rely on significant and painful spending cuts.
While the Federation understands that the District might not want to unduly frighten parents and
employees with a “doomsday budget” it is also true that the uncertainty surrounding their
proposed plan is damaging to the District’s reputation, as seen in a recent downgrade of the
District’s credit rating by Standard & Poor’s to below investment grade that was made in direct
response to its proposed deficit budget. It would also be helpful for State legislators to
understand the exact consequences of a failure to act on their part.
The Chicago Public Schools has played a significant role in its own crisis and the massive $1.2
billion initial budget shortfall it faced this year, but it is also important to recognize that many
factors directly impacting the District’s finances are beyond its control, including falling state
and federal revenue and insufficient pension funding from the State of Illinois. While it is
imprudent for the District to count on additional funding from a dysfunctional State of Illinois,
this does not absolve the State of its duty to step in and assist its largest school district. Whether
through additional pension funding, permission to levy a larger property tax or consolidating the
Chicago Teachers’ Pension Fund with the downstate and suburban Teachers Retirement System,
or some combination of these actions, it is imperative that the State take responsibility for its role
in the CPS crisis and do its part to help set the District on a sustainable fiscal path.
The Civic Federation believes CPS has reached a very precarious and potentially devastating
short-term and long-term financial position where the District faces a cash crisis, its bond status
is rated below investment grade by three of the four major bond rating agencies and it faces
enormous and growing legacy debt and pension obligations, to name only several of its
multiplicity of dire fiscal issues. While for the last several years the District has been able to use
budget gimmicks to achieve short-term balance at the cost of long-term financial stability, it has

8
now run out of ways to delay the inevitable and has reached a turning point. If stakeholders do
not come together to develop a multi-year plan to restore fiscal structure to the District that
involves increased revenues, difficult cuts and pension changes, the Federation is deeply
concerned that CPS could fail, with devastating and lasting consequences for the future of
Chicago and Illinois.
Issues of Concern
The Civic Federation has the following concerns regarding the FY2016 Proposed Budget.
The FY2016 Proposed Budget Is Not Balanced and No Alternative Budget Has Been Provided
The CPS Proposed Budget is not balanced because it is depends on the vague hope that the
District will receive $480.0 million dollars in pension relief from the State of Illinois. The
District states explicitly, “To present a balanced budget and to ensure that we are continuing to
protect classrooms, CPS is relying on $500 million in pension funding equity from Springfield.”2
Relying on nonexistent money and on nearly $400.0 million in non-recurring revenues3 to
balance the budget is financially risky and conflicts with public budgeting and finance
fundamentals. The State of Illinois faces its own deep fiscal crisis, with a multi-billion dollar
budget deficit and if it does not provide additional funding to CPS, the District will run at least a
$480.0 million deficit. Worse, the District has not provided a detailed alternative plan that would
address the deficit. Simply stating that CPS will be forced to make larger cuts and/or
“unsustainable” borrowing is not enough. Students, teachers, parents and taxpayers deserve to
know and plan for what would happen if the District’s unbalanced budget is implemented.
Ongoing Structural Deficit
Since at least FY2009, CPS has failed to consistently match expenditures to ongoing revenues.
This mismatch has resulted in a growing gap between the spending the District engages in and
the revenues it collects. The structural deficit has been exacerbated by the District’s reliance on
one-time resources such as fund balances—rather than cuts to expenditures—to close its budget
gaps. In FY2016 the District is once again relying on non-recurring resources such as scoop and
toss borrowing to fill much of the budget gap in addition to the hope that the State will provide
an additional $480.0 million in pension funding.
2 CPS FY2016 Proposed Budget, p. 4. 3 Chicago Public Schools, “FY 16 Budget Overview,” August 10, 2015, p. 11. CPS is using $255 million in non-
recurring savings from debt restructuring, $62 million in TIF surplus and $75 million in reserves, in addition to $200
million in previously announced cuts, increased recurring property tax revenues of $80 million and the hope for
$480 million in extra pension funding from the State of Illinois to close a $1.2 billion shortfall. See page 22 of this
report for more information.
9
Recently, Ernst & Young, a financial consulting and accounting firm, prepared a report for CPS
which analyzed its financial condition and provided deficit projections.4 The firm’s analysis
indicated that the District’s structural deficit between FY2011 and FY2014 has been obscured by
its use of one-time revenues and pension payment holidays. It attributes the structural deficit,
which Ernst & Young pegged at $500.0 million, to the following factors:
State funding issues;
Long-term liabilities;
Compensation increases; and
Operational problems.
The following sections discuss these deficit drivers, adding the Civic Federation’s analysis and
calculations to those contained in the Ernst & Young report.
State Funding Issues
Reduction in State Pension Contributions and Inequitable Pension Funding Structure
The State of Illinois has reduced its “employer contribution” to the Chicago Teachers’ Pension
Fund (CTPF) in recent years. The State had traditionally contributed roughly $65.0 million5 each
year to the Teachers’ Pension Fund in addition to statutorily required contribution for previous
benefit enhancements. This is despite 40 ILCS 5/17-127, which declares the General Assembly’s
“goal and intention” to contribute an amount equivalent to 20.0% or 30.0% of the contribution it
makes to the downstate Teachers’ Retirement System. The State’s total employer contribution
decreased from $65.0 million in FY2009 to $32.5 million in FY2010. In FY2011 the State
appropriated $32.5 million for the Teachers’ Fund, but designated it specifically for retiree
healthcare costs paid out of the fund. There was no State “employer contribution” in FY2012-
FY2014 or in FY2016.6 In FY2015 the State appropriated an additional $50.0 million to the
Chicago Teachers’ Pension Fund, approximately 6.0% of the State’s “goal and intention,” but
made no additional contribution in the FY2016 K-12 Education Budget. This treatment is
fundamentally unfair to Chicago taxpayers, whose tax dollars are used to fund pensions for both
downstate and Chicago teachers, while the remainder of the State does not share the burden for
funding Chicago teachers’ pensions. CPS made its full required FY2015 contribution of $634.0
million to the CTPF only through short-term borrowing and its FY2016 contribution is scheduled
to increase to $671.0 million. In part because the State has not lived up to its stated funding goal
for Chicago teachers’ pensions and has cut even its small previous contribution, CPS funding
that could be devoted to the classroom is instead used for its pension contribution.
Decreases in General State Aid
Public Act 90-548 created the Illinois Education Funding Advisory Board (EFAB) in 1997. As
stated in 105 ILCS 5/18-8.05(M), the statutory charge of the EFAB is to “make commendations
[to the General Assembly] for the foundation level…and supplemental general State aid grant
4 Ernst & Young, “Board of Education—City of Chicago Structural Deficit Discussion Document.” May 22, 2015.
http://www.scribd.com/doc/269588560/CPS-Discussion-Document. 5 A contribution of $65 million has not represented 20% of TRS funding since 1996. 6 In FY2012-FY2014 the State made only the nominal statutorily required contribution related to a benefit
enhancement granted in the 1990s.

10
level.” The foundation level is the State of Illinois’ sanctioned minimum level of funding per
pupil that is achieved through a combination of State and local funds. The majority of the State
revenue received by CPS comes from the General State Aid (GSA) grant program. GSA is
composed of two parts: a per-pupil formula grant and a supplemental GSA grant. The per-pupil
formula grant is based upon the foundation level, whereas the supplemental grant (formerly
referred to as the poverty grant) provides additional funding based on a district’s percentage of
low-income students. The GSA distribution to school districts is based on a number of factors,
including local property tax capacity. The formula assumes that school districts will levy for all
available local property taxes first before the State provides additional funding to reach the
foundation level. Even though the EFAB has made recommendations to increase the statutory
funding level, the foundation level has remained at $6,119.0 per student since FY2010.
Furthermore, the statewide appropriation has been insufficient since FY2012 to pay for the full
foundation level, resulting in a prorated amount of the funding: in FY2016, State grants will be
made at 92.0% of the foundation level. CPS is estimating State revenue losses of $110.0 million
from FY2015 to FY2016. Again, because of the decreases in GSA, less money is available for
students, classrooms and operations.
Long-Term Liabilities
The District’s long-term liabilities grew by over $2.9 billion, or 33.4%, between FY2010 and
FY2014 to a total of $11.6 billion. Long-term liabilities will continue to increase in FY2016 as
the District plans to issue an additional $849.5 million in bonds.7 Because the District has been
and continues to borrow to cover operations, its debt service costs, already large, will continue to
increase in the future. CPS currently has $6.2 billion in outstanding debt. Debt service for
FY2016 will be approximately $538.6 million, which is usually paid largely through GSA.
However, in FY2016, CPS will once again look to bond restructuring and one-time revenues to
free up $254.0 million in GSA which can be appropriated to operations. This is a sign that the
District’s level of indebtedness may not be sustainable with current revenue sources. The
District’s long-term liabilities are expected to grow dramatically in FY2016 due to the recently
authorized sale of $1.2 billion in General Obligation bonds.
In addition to the District’s bonded indebtedness, it also faces $9.4 billion in unfunded pension
liabilities and growing annual contributions for the next forty-odd years. Annual contributions
will reach $757.8 million in FY2020, $1.0 billion in FY2030 and nearly $1.5 billion in FY2059
as CPS makes the required contributions to raise the funding level from the current 51.7% on an
actuarial basis to 90.0% by the end of 2059. As noted above, CPS is unique among school
districts in the State of Illinois because the District is required to cover nearly the entire cost of
its teacher pensions. All other downstate and suburban teachers’ pension costs are covered
almost entirely by the State of Illinois. This places a heavy burden on Chicago taxpayers, the
Chicago tax base and the District’s budget, that has been compounded by a CPS-requested and
state-granted three-year partial pension holiday that ended in FY2014.
7 CPS FY2016 Budget Interactive Reports, Revenues and Expenditures available at www.cps.edu (last accessed
August 19, 2015).
11
Compensation Increases
Other drivers of the structural deficit identified in the Ernst & Young report include
compensation issues.8 Ernst & Young noted that annual growth in teacher salaries of 4.0-5.0%
per year on average was much higher than annual revenue growth, leading to budgetary
pressures. The District’s practice of “picking up” seven percentage points of its employees’
pension contributions was cited as another source of pressure on the budget and one that puts
Chicago teachers’ pension contributions outside the mainstream nationwide.9 In FY2016 CPS is
budgeting a total of $171.0 million for the 7.0% pickup.10 The final source of compensation
pressures Ernst & Young highlighted in their report was comparatively low levels of healthcare
cost sharing with employees. Their analysis showed that CPS employees contribute less toward
their insurance premiums than the national average, particularly for dependent coverage.11
Operational Problems
Ernst & Young attribute part of the blame for the District’s structural deficit on budgeting
practices which include insufficient budget cuts to match expenditures to available revenues.12
While the District includes $200.0 million in difficult cuts in the FY2016 budget and says it has
made $748.0 million in central office cuts in previous years, they have not been sufficient to
offset declining revenue and growing expenditures. Instead, the District has used one-time
revenues to close its deficits, leading to its ongoing liquidity crisis and even higher expenses
from short-term cash flow borrowing.
While the District was able to put off making tough choices to structurally balance its budget for
several years through budget gimmicks and unsustainable use of nonrecurring revenue, it has
reached a point where it must work with all stakeholders to raise revenue and cut expenditures so
that it can provide essential services that are affordable to taxpayers.
Pension Funding Crisis
The Civic Federation continues to be deeply concerned about the growing pension funding crisis
the District faces, which has been compounded by recent court decisions. The Chicago Teachers’
Pension Fund was 100.0% funded on an actuarial basis in FY2001. Since then, the fund’s
funding level has fallen significantly: from 79.0% in FY2005 to 51.7% in FY2014.13 Since
FY2005 unfunded liabilities have increased by $6.6 billion or 237.8%, rising to $9.4 billion in
ten years. In just one year, from FY2012 to FY2013, unfunded liabilities grew by $1.6 billion. A
shortfall in employer contributions compared to actuarially required pension payments, a three-
year partial pension holiday, investment losses and a lack of pension reform have all contributed
8 Ernst & Young, “Board of Education—City of Chicago Structural Deficit Discussion Document.” May 22, 2015,
p. 20-21. http://www.scribd.com/doc/269588560/CPS-Discussion-Document. 9 Ernst & Young, “Board of Education—City of Chicago Structural Deficit Discussion Document.” May 22, 2015,
pp. 20-21, 32. http://www.scribd.com/doc/269588560/CPS-Discussion-Document. 10 CPS FY2016 Proposed Budget, p. 141. 11Ernst & Young, “Board of Education—City of Chicago Structural Deficit Discussion Document.” May 22, 2015.
http://www.scribd.com/doc/269588560/CPS-Discussion-Document. 1212 Ernst & Young, “Board of Education—City of Chicago Structural Deficit Discussion Document.” May 22,
2015, p. 21. http://www.scribd.com/doc/269588560/CPS-Discussion-Document. 13 Funding levels here are reported on an actuarial basis.

12
to the District’s enormous pension obligations and accelerated the District into a deeper state of
financial crisis.
Last year, the District announced that it was seeking the same pension benefit reforms for
Chicago teachers that were passed by the State of Illinois for downstate and suburban teachers’
pensions in December 2013.14 CPS estimated it could save $250.0 million from its nearly $700.0
million FY2015 projected contribution to the fund through the reform measures. However, since
that announcement was made, the State reform law has been struck down by the Illinois Supreme
Court as a violation of the Illinois Constitution’s pension protection clause.15 The pension
funding and benefit reforms for non-teacher CPS employees enrolled in the City of Chicago’s
Municipal Pension Fund that were passed by the State of Illinois in Spring 2014 were struck
down by Cook County Circuit Court Judge Rita Novak on July 24, 2015.16 In her ruling, Judge
Novak cited the Illinois Supreme Court’s ruling against the State pension reform legislation.
Immediately following the verdict, the City of Chicago announced that it would appeal the ruling
and soon thereafter the Illinois Supreme Court said it would hear the case, with oral arguments
set for November 2015.17 While the City of Chicago says that its arguments for the
constitutionality of its reforms are different from the police powers argument used by the State of
Illinois, it remains to be seen whether the Illinois Supreme Court will allow any changes to
existing public pension benefits for any pension fund. If no changes can be made to the pension
benefits for current or retired Chicago teachers, it will make it even more difficult and more
expensive for the District to balance its budget going forward and end its fiscal crisis, absent
additional funding from the State of Illinois or devastating cuts.
Cash-Flow Crisis
In addition to its pension crisis and structural deficit, CPS is also experiencing a significant
liquidity crisis that is the result of both the drawdown of nearly its entire budgetary reserves over
the last several budget years and the change to the revenue recognition period CPS used to close
the FY2015 budget deficit. At the end of FY2015, CPS reported it would not have enough cash
on hand to make its required $634.0 million pension payment. This was a result of the drawdown
of its fund balance throughout FY2015 and the fact that CPS was relying on property tax revenue
to balance its budget that would not come in until July and August, after the end of the fiscal year
14 David Vitale and Barbara Byrd-Bennett, “Op-Ed: CPS wants pension reform in Springfield this year,” Chicago
Tribune, March 7, 2014. 15 Illinois Supreme Court, In re Pension Reform Litigation, 2015 IL 118585, May 8, 2015. Available at
http://www.illinoiscourts.gov/OPINIONS/SupremeCourt/2015/118585.pdf. See also
https://www.civicfed.org/iifs/blog/supreme-court-pension-ruling-adds-fy2016-budget-pressures. 16 Judge Novak’s opinion and order is available at http://chicagotonight.wttw.com/sites/default/files/article/file-
attachments/Chicago%20Pension%20Ruling.pdf. The City of Chicago provides the employer funding for the
approximately 17,095, or 55.8%, of the 30,647 active Municipal Fund members who are CPS employees, so the
ruling would not impact the District’s pension contribution. However, the case is important to the process of
litigating whether any pension benefits can be changed after they are granted. 17 Associated Press, “Illinois Supreme Court to hear Chicago pensions case,” August 13, 2015.
http://abc7chicago.com/politics/illinois-supreme-court-to-hear-chicago-pensions-case/927904/
13
on June 30. CPS expanded its line of credit by $200.0 million to a total of $700.0 million in order
to provide the liquidity necessary to make the full pension payment on time.18
The District will rely on an increased level of short-term borrowing in FY2016 to cover
anticipated cash flow difficulties. The District will access $935.0 million of short-term
borrowing to bridge the gap between revenue collections and expenses throughout the fiscal
year.19 The funds will be secured through lines of credit and commercial loans and payable with
dedicated revenues including property tax collections. The District’s lack of fund balance and
resulting liquidity crisis has a price. The short-term borrowing will increase debt service costs by
approximately $24.0 million in FY2016. The District anticipates it will need to use all of the
$935.0 million line of credit to make its pension payment at the end of the year, even if it gets an
extra $480.0 million from the State of Illinois and not taking into account any salary increases
that could result from still ongoing negotiations with the Chicago Teachers Union.20 The short-
term focus of the last several Chicago Public Schools budgets have a real cost both in terms of
borrowing cost and public and investor confidence in the District.
Repeated Use of One-time Revenues
The District has repeatedly used one-time revenue to pay for ongoing expenditures without
providing any detailed plan for how it would undo the negative impacts of its short-term
balancing act. Having nearly drained its budgetary reserves in prior years, this year CPS is
relying on $200.0 million dollars in “scoop and toss” bond refunding, $55.0 million in one-time
sources to pay debt service, $62.0 million in Tax Increment Finance (TIF) surplus from the City
of Chicago and $75.0 million in its dwindling reserves for a total of $392 million in one-time
resources to help close its $1.2 billion deficit. 21 Such one-time sources are in addition to the
vague hope that the District will receive $480.0 million in funding from the State. The National
Advisory Council on State and Local Budgeting Practice advises that one-time, or non-recurring,
revenues cannot be “relied on in future budget periods.”22 Occasional use of reserve funds may
be reasonable, particularly if there is a severe economic situation or if a government has
historically maintained an adequate cushion for contingencies or delayed revenues. However, as
noted above, Chicago Public Schools has maintained a structural deficit for many years and has
almost completely depleted its fund balance to close its previous year’s deficit, with the result
18 CPS FY2016 Proposed Budget, p. 169. 19 CPS FY2016 Proposed Budget, p. 13. 20 CPS FY2016 Proposed Budget, p. 169. 21 CPS FY2016 Proposed Budget, p. 4; Communication with Chicago Public Schools Budget Office, August 10,
2015. 22 National Advisory Council on State and Local Budgeting Practice, A Framework for Improved State and Local
Government Budgeting and Recommended Budget Practices, 1998.
http://www.co.larimer.co.us/budget/budget_practices.pdf.
14
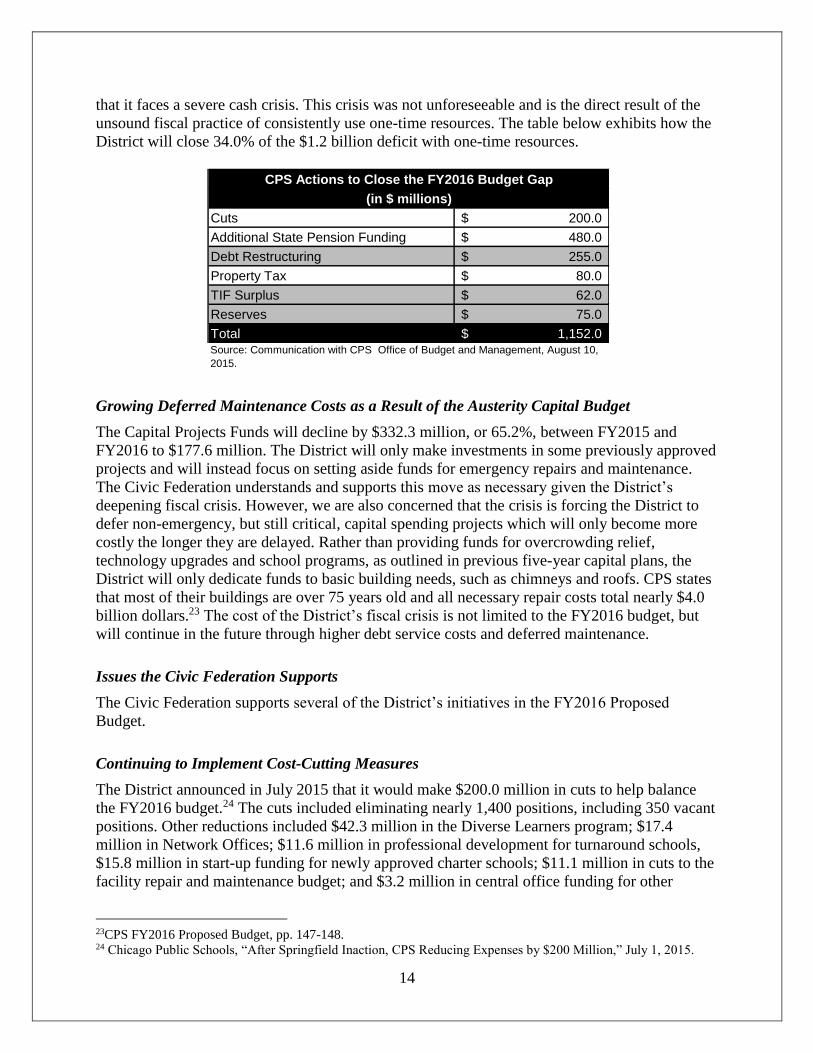
that it faces a severe cash crisis. This crisis was not unforeseeable and is the direct result of the
unsound fiscal practice of consistently use one-time resources. The table below exhibits how the
District will close 34.0% of the $1.2 billion deficit with one-time resources.
Growing Deferred Maintenance Costs as a Result of the Austerity Capital Budget
The Capital Projects Funds will decline by $332.3 million, or 65.2%, between FY2015 and
FY2016 to $177.6 million. The District will only make investments in some previously approved
projects and will instead focus on setting aside funds for emergency repairs and maintenance.
The Civic Federation understands and supports this move as necessary given the District’s
deepening fiscal crisis. However, we are also concerned that the crisis is forcing the District to
defer non-emergency, but still critical, capital spending projects which will only become more
costly the longer they are delayed. Rather than providing funds for overcrowding relief,
technology upgrades and school programs, as outlined in previous five-year capital plans, the
District will only dedicate funds to basic building needs, such as chimneys and roofs. CPS states
that most of their buildings are over 75 years old and all necessary repair costs total nearly $4.0
billion dollars.23 The cost of the District’s fiscal crisis is not limited to the FY2016 budget, but
will continue in the future through higher debt service costs and deferred maintenance.
Issues the Civic Federation Supports
The Civic Federation supports several of the District’s initiatives in the FY2016 Proposed
Budget.
Continuing to Implement Cost-Cutting Measures
The District announced in July 2015 that it would make $200.0 million in cuts to help balance
the FY2016 budget.24 The cuts included eliminating nearly 1,400 positions, including 350 vacant
positions. Other reductions included $42.3 million in the Diverse Learners program; $17.4
million in Network Offices; $11.6 million in professional development for turnaround schools,
$15.8 million in start-up funding for newly approved charter schools; $11.1 million in cuts to the
facility repair and maintenance budget; and $3.2 million in central office funding for other
23CPS FY2016 Proposed Budget, pp. 147-148. 24 Chicago Public Schools, “After Springfield Inaction, CPS Reducing Expenses by $200 Million,” July 1, 2015.
Cuts 200.0$
Additional State Pension Funding 480.0$
Debt Restructuring 255.0$
Property Tax 80.0$
TIF Surplus 62.0$
Reserves 75.0$
Total 1,152.0$
CPS Actions to Close the FY2016 Budget Gap
(in $ millions)
Source: Communication with CPS Office of Budget and Management, August 10,
2015.
15
school programs. The District had planned to save $9.2 million from changing high school start
times, but will save less than planned due to a reduction to the number of schools impacted by
the change in response to parent criticism.25 These lost savings will be partially offset by savings
garnered for FY2016 from the District phasing out of the pension “pick-up” for non-union
employees over three years.26 This initiative was announced on August 12, 2015, after the
release of the FY2016 Proposed Budget.
The expenditure reductions by CPS in FY2016 and the $740 million in expenditure reductions
made between FY2011 and FY2015 reflect a serious effort to cut costs and better manage scarce
resources by improving the District’s operational efficiency.
Property Tax Increase
This year CPS proposes to increase its property tax levy by 0.8% (the maximum amount allowed
under the State tax cap law). In FY2016 nearly $2.4 billion, or 33.7% of all CPS resources, will
come from local property tax revenues. This will generate an additional $19.0 million over
FY2015. The District also plans to levy for a significant amount of new property that has been
made available outside the tax cap, as allowed under state law. Levying for new property will
bring in approximately $61.0 million in much-needed additional property tax revenue in
FY2016.
The Civic Federation recognizes that property tax increases for homeowners and businesses can
be painful. Given CPS’ enormous fiscal challenges and the continued inconsistency of future
funding from the State of Illinois, the Civic Federation supports the property tax increase as it
will allow the District to access a reliable source of ongoing revenue. However, the Federation
notes the tax increase might be more palatable to stakeholders if it were implemented in the
context of a more fiscally responsible budget plan.
Mayor Emanuel Has Made Various Proposals to End CPS’ Budget Crisis
On July 1, 2015, Chicago Mayor Rahm Emanuel laid out his comprehensive plans to address the
nearly $1.2 billion deficit and ongoing fiscal crisis at CPS. The Mayor presented two alternatives
to Springfield and all CPS stakeholders. Option A, or the “Uniform Approach,” would
consolidate pension systems for all teachers in the state. Option B, or the “All In Approach”
would have the State contribute the normal pension costs for CPS, restore the pension levy to the
0.26% rate, employees would pick up the entire 9.0% pension costs, the State would increase
education funding by 25.0% and other school districts around Illinois would contribute to their
own pension funds.27 The Civic Federation commends Mayor Emanuel for putting forward plans
25 Juan Perez, Jr. “Chicago Public Schools backs off on schedule changes,” Chicago Tribune, August, 10, 2015.
http://www.chicagotribune.com/news/ct-cps-bell-schedule-met-0811-20150810-story.html. 26 Chicago Public Schools, “New Employees Will Not Be Eligible For Pickup, Which Will Be Phased Out For
Existing Employees,” August, 12, 2015. http://cps.edu/News/Press_releases/Pages/PR1_8_12_2015.aspx. And
Communication with Chicago Public Schools Budget Office, August 20, 2015. 27 Office of the Mayor of the City of Chicago Press Office, “Comprehensive Plan to Address CPS Budget Crisis,
Warns of Deeper Cuts,” July 1, 2015.
http://www.cityofchicago.org/city/en/depts/mayor/press_room/press_releases/2015/july/mayor-emanuel-lays-out-
comprehensive-plan-to-address-cps-budget-.html
16
that, if accepted and implemented by Springfield, CPS management and the unions, would
address the District’s fiscal crisis through shared sacrifice. It is important for State leaders,
unions and the public to understand the scope of the actions that will be necessary to improve
CPS’ fiscal future and Mayor Emanuel’s proposals helped to advance that understanding.
Improvements to the Budget Book
The Federation is pleased the District made some improvements to its budget book, including a
new cash-flow analysis chapter and some additional information about expenditure trends. The
Cash Management chapter provides additional detail about the timing of revenues and
expenditures and how they do not match up throughout the year, requiring budgetary reserves to
compensate for lags between levying for revenues and when they are received, compared to
when major expenditures are made. The chapter also provides a chart showing the District’s cash
balances throughout FY2015 and projected into FY2016, showing where cash flow borrowing
has been and will continue to be necessary to cover its debt service and pension payments.
Last year, the Civic Federation highlighted a dearth of information about expenditure trends on a
District-wide basis in the budget book, particularly in comparison to the wealth of information
provided about revenues. While the Federation appreciates the sheer amount of granular data on
the budget the District is able to provide through its online interactive budget, we noted that it is
important for CPS to continue to provide context to the numbers through textual explanations
that can only be provided in the budget book. This year, the budget book contained a section
dedicated to explaining expenditure trends, an improvement over last year.
Civic Federation Recommendations
The Civic Federation makes the following recommendations to Chicago Public Schools and the
Chicago Board of Education.
The Chicago Board of Education Should Reject the CPS FY2016 Proposed Budget and
Request a Balanced Budget Plan
The Chicago Public Schools proposed Fiscal Year 2016 operating budget is not balanced. It
assumes the State of Illinois will provide an additional $480.0 million at some point this year,
despite the State’s own significant multi-billion deficit and lack of an enacted budget. No
detailed alternative plan has been put forth by the District that would inform stakeholders of
what will happen should the State not appropriate nearly half a billion dollars to CPS. The Civic
Federation strongly believes that the public is entitled to information about the consequences of a
failure to act on the part of the State of Illinois. Therefore, the Federation urges the Board of
Education to reject the proposed financially risky FY2016 deficit budget and call for a budget
with a detailed contingency plan.
The Board should specify that the contingency plan be realistic and not rely on borrowing for
operations or the other unsustainable actions the District has hinted it might use to close its
deficit if funds from the State do not materialize.28 It must also not rely on a pension holiday, as
28 CPS FY2016 Proposed Budget, p. 4.
17
is being considered in legislation that was recently approved by the Illinois Senate.29 The
alternative budget should provide stakeholders with a detailed description of the significant cuts
that will unfortunately be unavoidable in the absence of additional revenue. While the Federation
understands that the District might not want to alarm the people of Chicago with a “doomsday
budget” that might not come to pass, it is also true that the uncertainty surrounding their finances
is damaging to the District’s reputation among residents and investors. The latter can be seen in
recent downgrades of the District’s debt rating to below investment grade by three rating
agencies, particularly S&P’s August 2015 downgrade that was made partly in direct response to
the proposed deficit budget.30 The Federation also strongly believes that it would also be helpful
for state leaders to better understand the negative consequences of Illinois’ own budget standoff
on local governments.
Implement a Formal Long-Term Financial Plan
To successfully navigate this current fiscal crisis, the District will need to go beyond crafting ad
hoc budgets that address expenditures and revenues for one year only. Going forward, CPS needs
to take a long-term, comprehensive approach that will articulate the present and future
educational needs of its students, the actions the District must take to meet those needs and the
District’s plan to fund those needs. While there is no doubt that there are contributing factors to
the District’s fiscal crisis that are beyond its control, the District bears the ultimate responsibility
for its crisis and needs to begin the process of addressing its monumental structural deficit by
developing a comprehensive, publicly-shared, long-term financial plan. A long-term financial
plan would educate and involve the public by presenting to them the District’s education policy
objectives, while exploring options available to CPS to achieve these goals. The CPS fiscal crisis
is a product of many years of short-sighted budgeting and will take many more years to resolve.
Only by explicitly outlining a comprehensive, long-term plan that includes both revenue and
expenditure reforms, can CPS right its current cost structure and commit to a real estate and
programming footprint that is sustainable going forward. With this budgetary year, it will also be
important for the District to outline a role for the State of Illinois in helping to right the District’s
finances, though it should also plan the alternatives that would be necessary if no help comes
from Springfield this year or in future years.
While the District provides budgetary projections through FY2020 in its budget book and may
internally use or implement features of a long-term financial plan, it does not currently develop a
publicly-shared long-term financial plan.31 Given its present state of fiscal jeopardy, increasing
pension payments and projected budget deficits of $931.0 million in FY2017, $938.8 million in
FY2018, and $929.0 million in FY201932 it is imperative that CPS institute a formal and public
29 Senate Bill 318, Amendments 1-3.
http://ilga.gov/legislation/billstatus.asp?DocNum=318&GAID=13&GA=99&DocTypeID=SB&LegID=84279&Sess
ionID=88 30 Standard & Poor’s, “Chicago Board of Education GO Rating Lowered To 'BB' From 'BBB' On Structural
Imbalance And Low Liquidity,” August 14, 2015. 31 Along with a long-term financial plan, CPS needs to develop a plan for replenishing its fund balance, in keeping
with the District’s own fund balance policy. The GFOA also offers “best practice” recommendations on
replenishment of a government’s General Fund fund balance. See GFOA, “Replenishing Fund Balance in the
General Fund” (2011). 32 CPS FY2016 Proposed Budget, p. 15.
18
financial planning process. Resolving CPS’s financial instability will require more dramatic and
painful budget cuts throughout the District. Given that the majority of the CPS budget is
dedicated to school-based budgets, these cuts may include more drastic reductions that further
impact the classroom, including more cuts and additional layoffs.
The National Advisory Council on State and Local Budgeting (NACSLB) and the Government
Finance Officers Association (GFOA) both recommend that all governments formally adopt a
long-term financial plan as a key component of a sound budget process.33 A long-term financial
plan typically includes the following components:
A review of historical financial and programmatic trends;
Multi-year projections of revenues, expenditures and debt;
An analysis of those multi-year trends and projections; and
Modeling of options to address problems and opportunities, which helps governments
address fiscal challenges before they become fiscal crises.
A key component of financial planning is engaging all stakeholders in the process of developing
the plan. The GFOA describes long-term financial planning as “not just a staff-driven process. It
is consensus-driven and inclusive, involving elected officials, staff and the public.”34 Among
other benefits, involving all stakeholders can help staff refine forecasts, institutionalize planning
processes and promote strategic decision-making.
33 More information on the National Advisory Council on State and Local Budgeting and the Government Finance
Officers Association at www.gfoa.org. 34
Government Finance Officers Association, “An Introduction to Financial Planning,”
(http://www.gfoa.org/downloads/LTFPbrochure.pdf.
19
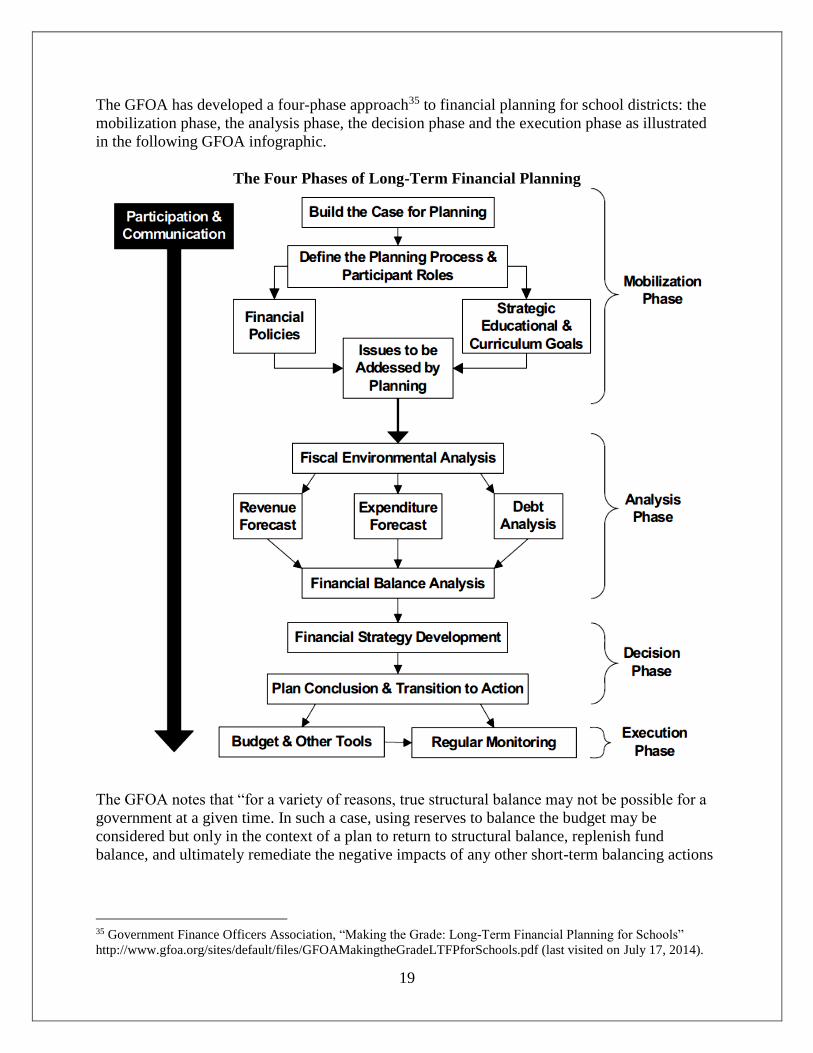
The GFOA has developed a four-phase approach35 to financial planning for school districts: the
mobilization phase, the analysis phase, the decision phase and the execution phase as illustrated
in the following GFOA infographic.
The Four Phases of Long-Term Financial Planning
The GFOA notes that “for a variety of reasons, true structural balance may not be possible for a
government at a given time. In such a case, using reserves to balance the budget may be
considered but only in the context of a plan to return to structural balance, replenish fund
balance, and ultimately remediate the negative impacts of any other short-term balancing actions
35 Government Finance Officers Association, “Making the Grade: Long-Term Financial Planning for Schools”
http://www.gfoa.org/sites/default/files/GFOAMakingtheGradeLTFPforSchools.pdf (last visited on July 17, 2014).

20
that may be taken.”36 CPS has experienced a structural imbalance for over half a decade.
Furthermore, it has repeatedly used one-time revenue to pay for ongoing expenditures without
providing any plan for how it would undo the negative impacts of its short-term balancing act.
This year CPS is relying on an unappropriated revenue from the State totaling $480.0 million and
nearly $400.0 million in various non-recurring revenue sources. By developing a long-term
financial plan in the model presented by the GFOA for school districts and already utilized
successfully by other school districts in Illinois,37 CPS can link its annual budgets together into a
cohesive program that better articulates its needs with the public and policymakers. CPS says it
needs pension funding assistance from the State. The District must, therefore, make a case and
show the consequences of a failure to come up with spending and revenue reforms.
In order to achieve a proper and equitable right-sizing strategy and to meet the needs of all
Chicago students, the District must establish and publicly release a detailed, prioritized long-term
plan. The plan should address explicitly the District’s policy and programming priorities and
how CPS plans to use the District’s resources to address these priorities. The plan should be
updated yearly as it should serve as an important accountability component to each year’s budget
by informing stakeholders how CPS plans to achieve its mission.
Consolidate the Chicago Teachers’ Pension Fund with the Teachers’ Retirement System or
Increase State Funding for Chicago Teachers’ Pensions
In previous years the Federation made recommendations that the District pursue pension reforms
ranging from benefit changes to governance improvements in order to improve the
administration, transparency, accountability and fiscal sustainability of the Chicago Teachers’
Pension Fund (CTPF). With the constitutionality of pension benefit reforms in question until all
litigation surrounding recent reform legislation has been adjudicated, the Federation makes the
following recommendations to improve the financial sustainability of the CTPF.
The Civic Federation recommends that CPS work with legislators and the Teachers’ Retirement
System (TRS), which covers all public school teachers in Illinois except for CPS teachers to
consolidate the Chicago Teachers’ Pension Fund with TRS.
If consolidation fails, at the very least the State of Illinois should significantly increase its level
of funding for the Chicago Teachers’ Pension Fund to improve pension funding equity between
Chicago taxpayers and downstate and suburban taxpayers.
36 Government Finance Officers Association, “Making the Grade: Long-Term Financial Planning for Schools”
http://www.gfoa.org/sites/default/files/GFOAMakingtheGradeLTFPforSchools.pdf (last visited on July 17, 2014). 37 See discussion of Geneva Community Unit School District 304 in Illinois in Government Finance Officers
Association, “Making the Grade: Long-Term Financial Planning for Schools.”

21
End Employer “Pickup” of Employee Pension Contributions for All Employees
Employee contributions to the CTPF are statutorily set at 9.0% of the employee’s salary.
Employee contributions by non-teacher employees to the Chicago Municipal Fund are set at
9.0% of the employee’s salary for 2015.38
CPS “picks up” 7.0% of the 9.0% annual employee pension contribution for both teachers and
non-teaching staff, meaning it pays seven percentage points of the employee 9.0% contribution
on behalf of employees. Therefore, in 2015, employees effectively pay 2.0% of their annual
salary toward their pensions. The District’s FY2016 cost for the 7% employee pick-up for
teachers is approximately $131.0 million and is part of the District’s budgeted pension
appropriation.39 CPS administration has said that they would like to phase out the pickup for
teachers as part of a pending contract still being negotiated with the Chicago Teachers Union
(CTU). The CTU has called the end of the pickup a pay cut and a possible cause for a strike, but
has not completely ruled out phasing out the pickup.40 The FY2016 cost for the pickup for non-
teacher employees is $40.0 million.41
CPS announced it would be phasing out the pension pickup for central office, regional and non-
union support staff employees in August 2015 and eliminated it completely for new employees
in those offices. The District estimates that shifting the pickup costs to employees will save
nearly $21.0 million over the next three years and $11.1 million annually when fully phased in.
In FY2016, existing employees will pick up an added 2.0% of their pension costs, which
will save $2.8 million;
In FY2017, existing employees will pick up another 2.0% of their pension costs, which
will save $3.9 million; and,
In FY2018, employees will pick up the full employee pension costs, which will save $4.3
million.42
The Civic Federation believes employees must share in the increasing cost of their pension
benefits and supports the District in its goal to eliminate what has become an unaffordable
benefit.
38 Per the pension benefit reforms included in Public Act 98-0641, employee contributions to the Municipal Fund,
including Board of Education employee members, increase by half a percentage point per year over five years.
Starting January 1, 2015, employee contributions for members of the Municipal Fund increased from 8.5% to 9.0%.
If the reforms are upheld in the Illinois Supreme Court, contributions will increase again to 9.5% on January 1,
2016. If the reforms are struck down, the increased contributions made by employees at the City of Chicago and
CPS will likely be refunded. 39 CPS FY2016 Proposed Budget, p. 141. 40 Lauren Fitzpatrick and Fran Spielman, “Emanuel to ask CTU to phase out 7 percent pension pickup,” Chicago
Sun-Times, August 13, 2015, p. 10. 41 CPS FY2016 Proposed Budget, p. 141 42 Chicago Public Schools, New Employees Will Not Be Eligible For Pickup, Which Will Be Phased Out For
Existing Employees, August, 12, 2015. http://cps.edu/News/Press_releases/Pages/PR1_8_12_2015.aspx.

22
Implement Additional Cost Sharing with Employees for Employee Healthcare
As described above, the consulting firm Ernst & Young prepared a report for CPS which
analyzed its financial condition and provided deficit projections.43 Their analysis showed that
CPS employees contribute less toward their health insurance premiums than the national
average, particularly for dependent coverage.44 In order to lower costs and make the benefits the
District provides more fiscally sustainable, CPS should explore increasing the level of
contributions employees must make toward their own and their dependents’ health insurance. In
addition to higher contributions toward premiums, the District should also look into savings it
might garner from increasing co-pays and adjusting its networks. As with the phase-out of the
pension pickup, CPS should move to increase cost sharing for healthcare immediately for central
office, regional and non-union support staff employees and then work to include such changes in
union contracts.
Reinstate the Pension Fund Property Tax Levy Only as Part of a Comprehensive Plan to
Improve Chicago Public Schools Financial Sustainability
On May 3, 1993, the Civic Federation warned that unless the State of Illinois increased its
financial commitment to provide state revenue for education, CPS and other school districts in
the State would fall into deeper financial trouble. The Civic Federation warned that in order to
fix the basic funding problem, the State needed to provide a stable source of revenues to schools
while demanding more accountability from schools for educational performance and more
efficient administration.45 The Civic Federation was also concerned that redirecting the pension
fund tax levy to fund general operations would have a serious impact on the funded ratio of the
CTPF. Both concerns have come to fruition. The Civic Federation recommends that the pension
fund property tax levy be reinstated, but only in the context of a comprehensive, long-term
financial plan. It is also important that the pension levy not be transferred from the operating
levy, as proposed in various pieces of legislation currently being considered in the Illinois
General Assembly, which would only exacerbate the District’s budget deficit.46
Rebuild Budgetary Reserves to Avoid Cash Crises
The Civic Federation recommends that as part of its long-term financial plan CPS should rebuild
its budgetary reserves to avoid future cash-flow crises. In FY2016 CPS will continue to deplete
its operating fund reserves to balance its budget and will not maintain its stabilization fund
balance at targeted levels. A total of $75.1 million in operating fund reserves is budgeted for use,
including $4.5 million in appropriated general fund reserves. CPS projects that $67.5 million will
be left in the district’s operating fund stabilization fund at year-end. Short-term borrowing to
cover cash-flows rather than reserves is extremely expensive and will cost the District
approximately $24.0 million in FY2016.
43 Ernst & Young, “Board of Education—City of Chicago Structural Deficit Discussion Document.” May 22, 2015.
http://www.scribd.com/doc/269588560/CPS-Discussion-Document. 44Ernst & Young, “Board of Education—City of Chicago Structural Deficit Discussion Document.” May 22, 2015.
http://www.scribd.com/doc/269588560/CPS-Discussion-Document 45 Civic Federation, Statement on the Chicago Public Schools Budget, Bulletin No. 1089, September 2, 1993. 46 House Bill 3695 and Senate Bill 318, among other plans include this unsustainable provision.

23
CPS also will use $47.6 million in its debt service stabilization fund to pay for debt service
expenses in FY2016, leaving just $9.5 million in the fund at the end of the fiscal year. CPS is
using Debt Service Fund reserves to pay for debt service because this maneuver will allow the
District to allocate State GSA funding, which would otherwise have gone directly to pay for debt
service, to general operations.47
The Government Finance Officers Association (GFOA) recommends “at a minimum, that
general-purpose governments, regardless of size, maintain unrestricted fund balance in their
general fund of no less than two months of regular general fund operating revenues or regular
general fund operating expenditures.”48 Two months of operating expenditures is approximately
17.0%. Chicago Public Schools is a special purpose government, not a general purpose
government, but its size and the relative instability of its revenue stream make it prudent for the
District to maintain adequate reserves. The GFOA statement adds that each unit of government
should adopt a formal policy that considers the unit’s own specific circumstances and that a
smaller fund balance ratio may be appropriate for the largest governments.49 In August 2008,
CPS adopted its Fund Balance policy which would maintain the minimum target fund balance of
5.0% of spending. However, the CPS FY2015 Proposed Budget—like the FY2009, FY2010,
FY2013, and FY2014 budgets before it—closed an $876.3 million budget deficit with an almost
complete drawdown of its unrestricted reserves leaving only $75.1 million in reserves for
FY2016 which are dedicated to the General Operating Fund,50 a reserve of only 1.1%. CPS must
find a way to replenish its reserves once it exits its fiscal crisis from new revenue combined with
expenditure cuts.
Release Separate Popular Budget Summary
CPS funds are grouped slightly differently in the online interactive budget51 as compared to the
CPS FY2016 Budget Book. According to CPS, the online Interactive Reports display funds from
a practical spending perspective rather than a strict accounting perspective. For instance, there
are four Special Revenue Funds included in the General Fund in the Budget Book, but they are
broken out into separate funds, although though they are still part of the General Fund, in the
Interactive Budget. The Special Revenue Funds include the School Generated Fund, Lunchroom
Fund, No Child Left Behind Fund, and Other Grants. These funds are classified under the
General Fund from an accounting perspective, but funds are earmarked for special purposes and
are limited to use by the schools that generated them. The District believes this modification in
fund grouping is easier to understand and will help the interactive budget be more user-friendly
for the public. However, having numbers that do not match between the budget book and the
online interactive budget can be confusing for readers. If the District wishes to make its budget
more understandable to the general public, it should consider creating a popular budget summary
in addition to the budget book and online interactive data portal. In this way, the interactive
budget could serve as an extension of the budget book, providing more detailed data, and the
47 CPS FY2016 Proposed Budget, p. 11 and 146. 48 GFOA, Appropriate Level of Unrestricted Fund Balance in the General Fund (Adopted October 2009). 49 GFOA, Appropriate Level of Unrestricted Fund Balance in the General Fund (Adopted October 2009).
“Unrestricted fund balance” includes Committed, Assigned and Unassigned fund balances. 50 CPS FY2016 Proposed Budget, p. 171. 51 The interactive portion of the CPS Proposed FY2016 Budget can be found online on the CPS budget website:
https://supplier.csc.cps.k12.il.us/analytics/saw.dll?Dashboard.
24
popular budget summary would serve as a practical summary of the District’s spending plans for
the general public.
ACKNOWLEDGEMENTS
We would like to express our appreciation to Chief Financial Officer Ginger Ostro, Treasurer
Jennie Huang Bennett, Budget Director Michael Moss and the staff of the CPS Budget Office for
their work in preparing this budget and their willingness to answer the Civic Federation’s
questions.

25
FY2016 DEFICIT DRIVERS AND GAP-CLOSING MEASURES
In FY2016, the District faces a massive budget deficit of nearly $1.2 billion. This section details
some of the drivers of the annual deficit and the structural deficit the District has run for at least
half a decade.
Deficit Drivers
As noted above, a recent report provided to CPS by Ernst & Young, the consulting and
accounting firm, stated that the District has effectively been running a $500.0 million structural
deficit for the past four budget years, FY2011 through FY2014, but it has been obscured by the
use of one-time revenue sources and partial pension holidays. Ernst & Young said the four
primary deficit drivers for the District were funding issues, long-term liabilities, compensation
increases and operational problems.52 Both CPS and Ernst & Young identify decreases in
General State Aid (GSA) and lack of pension funding from the State of Illinois as major deficit
drivers.
An additional driver of the FY2016 $1.2 billion budget deficit was the use of one-time resources
to balance the FY2015 budget. Because the hundreds of millions of dollars in fund balance that
were used in FY2015 to help close that year’s deficit are not recurring revenues, the District
could not use them again in FY2016, leaving a shortfall in resources.
Gap-Closing Measures
The District announced in July 2015 that it would make $200.0 million in cuts to help balance
the FY2016 budget.53 The cuts included eliminating nearly 1,400 positions, including 350 vacant
positions. Other reductions included $42.3 million in the Diverse Learners program; $17.4
million in Network Offices; $11.6 million in professional development for turnaround schools,
$15.8 million in start-up funding for newly approved charter schools; $11.1 million in cuts to the
facility repair and maintenance budget; and $3.2 million in central office funding for other
school programs.
The District has repeatedly used one-time revenue to pay for ongoing expenditures without
providing any detailed plan for how it would undo the negative impacts of its short-term
balancing act. Having nearly drained its budgetary reserves in prior years, this year CPS is
relying on $200.0 million dollars in “scoop and toss” bond refunding, $55.0 million in one-time
sources to pay debt service, $62.0 million in Tax Increment Finance (TIF) surplus from the City
of Chicago and $75.0 million in its dwindling reserves for a total of $392 million in one-time
resources to help close its $1.2 billion deficit. 54 Such one-time sources are in addition to the
vague hope that the District will receive $480.0 million in funding from the State. The National
Advisory Council on State and Local Budgeting Practice advises that one-time, or non-recurring,
52 Ernst & Young, “Board of Education—City of Chicago Structural Deficit Discussion Document.” May 22, 2015.
http://www.scribd.com/doc/269588560/CPS-Discussion-Document. 53 Chicago Public Schools, “After Springfield Inaction, CPS Reducing Expenses by $200 Million,” July 1, 2015. 54 CPS FY2016 Proposed Budget, p. 4; Communication with Chicago Public Schools Budget Office, August 10,
2015.

26
revenues cannot be “relied on in future budget periods.”55 Occasional use of reserve funds may
be reasonable, particularly if there is a severe economic situation or if a government has
historically maintained an adequate cushion for contingencies or delayed revenues. However, as
noted above, Chicago Public Schools has maintained a structural deficit for many years and has
almost completely depleted its fund balance to close its previous year’s deficit, with the result
that it faces a severe cash crisis. This crisis was not unforeseeable and is the direct result of the
unsound fiscal practice of consistently use one-time resources. The table below exhibits how the
District will close 34.0% of the $1.2 billion deficit with one-time resources.
APPROPRIATIONS
This section presents an analysis of CPS appropriation trends, including appropriations by type,
source and location. The section includes two- and five-year appropriation trends for all funds
and two- and five-year appropriation trends for general operating funds.56 Proposed FY2016
appropriations are compared with FY2012, FY2013 and FY2014 actuals and FY2015 approved
appropriations.
55 National Advisory Council on State and Local Budgeting Practice, A Framework for Improved State and Local
Government Budgeting and Recommended Budget Practices, 1998.
http://www.co.larimer.co.us/budget/budget_practices.pdf. 56 The Civic Federation has traditionally analyzed five-year appropriation trends for all funds, but the FY2016
Proposed Budget does not provide consistent data for fiscal years 2012 through 2016. Therefore, five-year historical
trend comparisons cannot be completed for all sections of the appropriations section of this analysis.
Cuts 200.0$
State Pension Relief 480.0$
Debt Restructuring 255.0$
Property Tax 80.0$
TIF Surplus 62.0$
Reserves 75.0$
Total 1,152.0$
Source: Communication with CPS Budget Office, August 10, 2015.
CPS Actions to Close the FY2016 Budget Gap
(in $ millions)

27
Total Appropriations for FY2016
The $6.4 billion CPS FY2016 Proposed Appropriations Budget consists of an approximately
$5.7 billion appropriation in the General Operating Fund, $177.6 million in the Capital Projects
Funds and $538.6 million in the Debt Service Funds. The General Operating Fund represents
88.8% of the total budget, the Capital Projects Fund represents 2.8% and the Debt Service Fund
represents 8.4%. The following chart shows total FY2016 proposed appropriations for all funds.
The General Operating Fund finances employees’ salaries and benefits, contractual services,
charter school tuition transfers and other day-to-day expenditures. The General Operating Fund
includes the General Fund and the Special Revenue Funds. The General Fund is the primary fund
used for instructional, professional, maintenance and administrative activities. The Special
Revenue Funds receive revenues that are legally required to be expended only for specific
purposes such as School Breakfast and Lunch Programs, Supplemental General State Aid for
additional instruction to low-income students and other grant funds. The Capital Projects Funds
are for construction and other capital expenditures. The Debt Service Funds are for payment of
long-term debt, such as bond issuances and lease obligations.57
57 CPS FY2016 Proposed Budget, Appendix E – Glossary.
Capital Projects Fund$177.6
2.8%
Debt Service Fund$538.6
8.4%
General Operating Funds
$5,687.7 88.8%
CPS FY2016 Appropriations for All Funds by Fund(in $ millions)
Source: CPS FY2016 Proposed Budget, Interactive Reports, Revenues & Expenditures, available at www.cps.edu (last visited August 11, 2015).
Total FY2016Proposed Appropriations
for All Funds: $6,403.9 million

28
Two-Year and Five-Year Appropriation Trends for All Funds
The proposed FY2016 $6.4 billion budget is a decrease of 6.8%, or $466.0 million, from the
FY2015 approved budget of $6.9 billion. The Capital Projects Funds will decline by $332.3
million, or 65.2%, over the two-year period. Appropriations for the General Operating Fund,
which consists of the General Fund and Special Revenue Funds, will decline by 1.2%, or $68.5
million, over the FY2015 approved budget. The Debt Service Funds will decrease by 10.8%, or
$65.2 million, in FY2016.
Over the five-year period total appropriations for all funds will increase by $492.7 million, or
8.3%, increasing from $5.9 billion from the FY2012 approved budget to $6.4 billion proposed in
FY2016. The General Operating Funds will increase by $577.5 million, or 11.3%, over the five-
year period. Appropriations for the Capital Projects Fund will decrease by $213.5 million, or
54.6%, below the FY2012 approved budget. The Debt Service Funds will increase by 31.4%, or
$128.7 million, over the five-year period.
The chart below shows a comparison of appropriations for all funds by type of expense for the
FY2015 approved budget and the FY2016 proposed budget. Appropriations for equipment will
decline by the largest dollar amount between the two years, decreasing by $352.4 million, or
64.0%. Appropriations for debt will decline significantly, shrinking by $65.0 million, or 10.8%.
The decline in debt service is primarily due to the planned restructuring of bonds and one-time
revenue sources to cover debt service payments in FY2016.58 Salaries will also decline between
the two years by $57.6 million. The decline in appropriations for salaries reflects the reduction of
1,400 positions, including 350 vacant positions.59 Appropriations for benefits will increase over
the two-year period by $25.4 million, which is primarily the result of a $42.0 million increase in
pension contributions.60 Contingencies will decline by $34.4 million, or 11.3% over the two-year
period. Contingencies include two types of funding: 1) funding that has been budgeted, but has
yet to be allocated and 2) grant funding that has yet to be confirmed or allocated to a specific
school or program. Once the item, program or school allocation has been decided, the funds are
moved to a separate line item of the budget.61
58 CPS FY2016 Proposed Budget, p. 24. 59 CPS FY2016 Proposed Budget, p. 22. 60 CPS FY2016 Proposed Budget, p. 23. 61 CPS FY2014 Proposed Budget, p. 16.
FY2012 FY2013 FY2014 FY2015 FY2016
Approved Approved Appproved Approved Proposed $ Change % Change $ Change % Change
General Operating Funds 5,110.2$ 5,162.3$ 5,592.3$ 5,756.2$ 5,687.7$ (68.5)$ -1.2% 577.5$ 11.3%
Capital Projects Funds 391.1$ 169.8$ 349.1$ 509.9$ 177.6$ (332.3)$ -65.2% (213.5)$ -54.6%
Debt Service Funds 409.9$ 394.5$ 613.2$ 603.8$ 538.6$ (65.2)$ -10.8% 128.7$ 31.4%
Total Appropriation 5,911.2$ 5,726.6$ 6,554.5$ 6,869.9$ 6,403.9$ (466.0)$ -6.8% 492.7$ 8.3%
Note: Because of rounding, minimal differences may occur in totaling rows and columns.
(in $ millions)
FY2012-
FY2016
FY2012-
FY2016
Source: CPS FY2012 Approved Budget, p. 21; CPS FY2013 Approved Budget, p. 19; CPS FY2014 Approved Budget, Interactive Reports,
Revenues & Expenditures, available at www.cps.edu (last accessed August 17, 2015); CPS FY2015 Approved Budget, Interactive Reports,
Revenues & Expenditures, available at www.cps.edu (last visited August 11, 2015); and FY2016 Proposed Budget, Interactive Reports, Revenues &
Expenditures, available at www.cps.edu (last visited August 11, 2015).
Fund Type
FY2015 to
FY2016
FY2015 to
FY2016
CPS Appropriations for All Funds by Fund: FY2012-FY2016

29
Two-Year and Five-Year Appropriation Trends for General Operating Funds
The following section shows trend data for operating funds appropriations by type and location
for FY2012, FY2013 and FY2014 actual appropriations, FY2015 approved appropriations and
the FY2016 proposed appropriations.
Appropriations for General Operating Funds by Type
The exhibit below shows the breakdown of FY2016 General Operating Funds appropriations by
type. The largest single portion is earmarked for salaries and benefits. Approximately 68.4% of
the operating funds, or $3.9 billion, will be for teacher salaries, non-teacher salaries and
employee benefits. Contracts, totaling over $1.2 billion, or 20.2%, of the total operating budget,
include professional services and contractual payments to outside organizations that provide
school support services and charter school tuition transfers. Some of the non-personnel service
appropriations support compensation costs of persons who provide direct services to CPS but are
not CPS employees. Appropriations for commodities, equipment and transportation make up
$379.2 million, or 6.7%, of the operating budget, while contingencies account for $269.2 million,
or 4.7%. Commodities include utilities, food, instructional supplies and other supplies.62 As
previously explained, contingencies include two types of funding: 1) funding that has been
budgeted but has yet to be allocated, and 2) grant funding that has yet to be confirmed or
allocated to a specific school or program. Once the item, program or school allocation has been
decided, the funds are moved to a separate line item of the budget.
62 CPS FY2016 Proposed Budget, p. 23.
$ Change % Change
Salaries 2,612.3$ 2,554.7$ (57.6)$ -2.2%
Benefits 1,310.0$ 1,335.4$ 25.4$ 1.9%
Contracts 1,133.1$ 1,153.9$ 20.8$ 1.8%
Commodities 260.6$ 264.1$ 3.5$ 1.3%
Equipment 550.3$ 197.9$ (352.4)$ -64.0%
Transportation 99.5$ 93.1$ (6.4)$ -6.4%
Contingencies 303.6$ 269.2$ (34.4)$ -11.3%
Debt 600.7$ 535.6$ (65.0)$ -10.8%
Total 6,869.9$ 6,403.9$ (466.0)$ -6.8%
Note: Because of rounding, minimal differences may occur in totaling rows and columns.
Source: CPS FY2015 Approved Budget, Interactive Reports, Revenues & Expenditures,
available at www.cps.edu (last visited August 11, 2015); and FY2016 Proposed Budget,
Revenues & Expenditures, available at www.cps.edu (last visited August 11, 2015).
CPS Appropriations for All Funds by Type: FY2015 & FY2016
(in $ millions)
Type
FY2015
Approved
FY2016
Proposed
FY2015 to
FY2016
FY2015 to
FY2016

30
The next exhibit compares proposed FY2016 General Operating Fund appropriations by type
with FY2012, FY2013 and FY2014 actuals and FY2015 approved expenditure estimates. Total
General Operating Funds will decrease by $68.5 million, or 1.2%, between FY2015 and FY2016,
mostly due to a decrease in salary expenses of $58.1 million, or 2.2%. Benefit appropriations
will increase by $25.3 million, or 1.9%, over the two-year period. Appropriations for benefits,
contracts and commodities will increase between FY2015 and FY2016 by a total of
approximately $50.7 million.
In the five-year period between FY2012 and FY2016, total General Operating Funds
appropriations will rise by $799.4 million, or 16.4%, due to significant increases in employee
benefits, contracts and contingencies that total approximately $978.5 million. As stated above,
contingencies include funding that has been budgeted but has yet to be allocated, which is
primarily why the budgeted amounts for the FY2015 approved and FY2016 proposed budget is
higher than actual spending for contingencies in FY2012, FY2013 and FY2014. Employee
benefits will increase by $496.2 million, or 59.1%, over the five-year period. Appropriations for
contracts will increase by $213.2 million, or 22.7%. Appropriations for salaries, commodities,
equipment, transportation and other expenses will decrease by a total of $179.1 million over the
five-year period.
Salaries & Benefits$3,888.4
68.4%
Contracts$1,150.9
20.2%
Commodities, Equipment &
Transportation$379.2
6.7%
Contingencies$269.2
4.7%
CPS FY2016 Appropriations for General Operating Funds by Type(in $ millions)
Source: CPS FY2016 Proposed Budget, Interactive Reports, Revenues & Expenditures, available at www.cps.edu (last visited August 11, 2015).
Total FY2016 Appropriations for General Operating
Funds: $5,687.7 million

31
FY2014 FY2016
Actual Proposed $ Change % Change $ Change % Change
Salaries 2,645.1$ 2,575.5$ 2,541.5$ 2,611.5$ 2,553.4$ (58.1)$ -2.2% (91.7)$ -3.5%
Benefits 838.9$ 866.2$ 1,263.6$ 1,309.7$ 1,335.1$ 25.3$ 1.9% 496.2$ 59.1%
Contracts 937.7$ 997.4$ 1,145.3$ 1,129.0$ 1,150.9$ 21.9$ 1.9% 213.2$ 22.7%
Commodities 272.7$ 305.5$ 293.0$ 260.6$ 264.1$ 3.5$ 1.3% (8.6)$ -3.2%
Equipment 74.8$ 86.1$ 94.5$ 41.4$ 22.0$ (19.4)$ -46.9% (52.8)$ -70.6%
Transportation 109.4$ 106.9$ 104.4$ 99.5$ 93.1$ (6.4)$ -6.4% (16.3)$ -14.9%
Contingencies -$ -$ -$ 304.6$ 269.2$ (35.4)$ -11.6% 269.2$ -
Other 9.7$ 8.6$ 7.8$ -$ -$ -$ - (9.7)$ -100.0%
Capital Outlay 0.1$ -$ -$ -$ -$ - -$ -
Total 4,888.3$ 4,946.3$ 5,450.1$ 5,756.2$ 5,687.7$ (68.5)$ -1.2% 799.4$ 16.4%
CPS Appropriations for Operating Funds by Type: FY2012-FY2016
(in $ millions)
FY2012 to
FY2016
FY2012 to
FY2016
Source: CPS FY2016 Proposed Budget, Interactive Reports, Budget by Account and Historical Expenditures, available at www.cps.edu (last visited August 11,
2015).
Type
FY2012
Actual
FY2013
Actual
FY2015
Adopted
FY2015 to
FY2016
FY2015 to
FY2016
Note: Because of rounding, minimal differences may occur in totaling rows and columns.
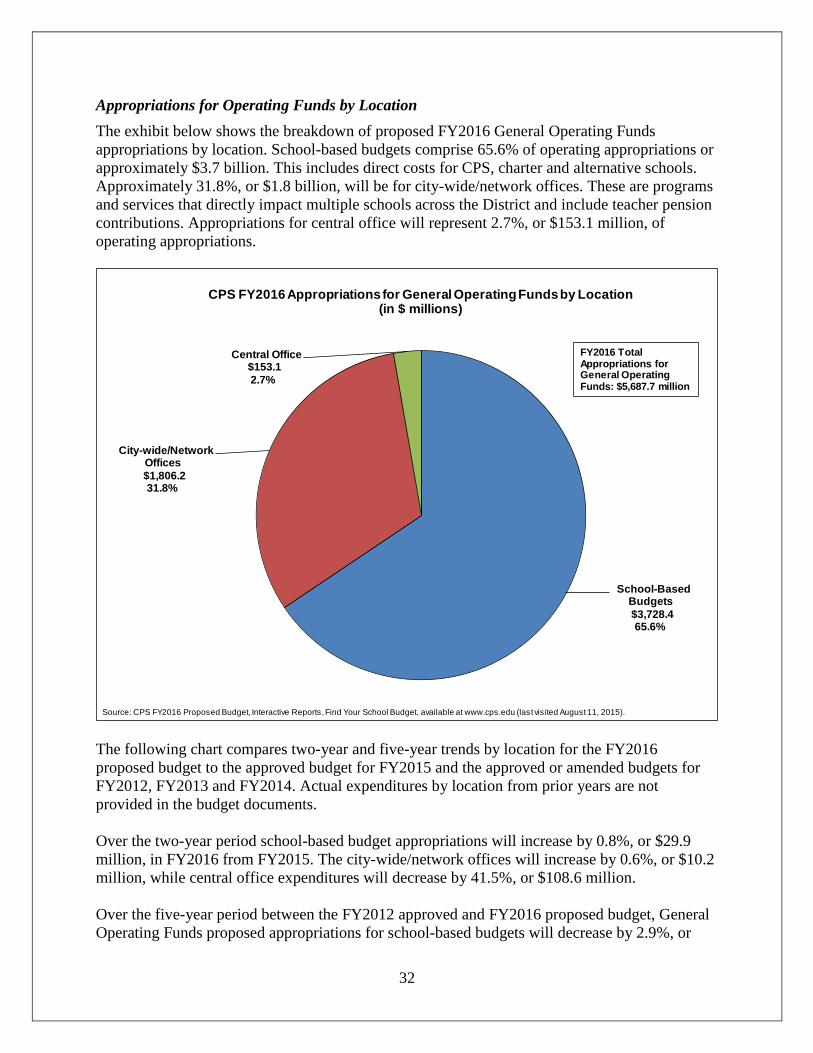
32
Appropriations for Operating Funds by Location
The exhibit below shows the breakdown of proposed FY2016 General Operating Funds
appropriations by location. School-based budgets comprise 65.6% of operating appropriations or
approximately $3.7 billion. This includes direct costs for CPS, charter and alternative schools.
Approximately 31.8%, or $1.8 billion, will be for city-wide/network offices. These are programs
and services that directly impact multiple schools across the District and include teacher pension
contributions. Appropriations for central office will represent 2.7%, or $153.1 million, of
operating appropriations.
The following chart compares two-year and five-year trends by location for the FY2016
proposed budget to the approved budget for FY2015 and the approved or amended budgets for
FY2012, FY2013 and FY2014. Actual expenditures by location from prior years are not
provided in the budget documents.
Over the two-year period school-based budget appropriations will increase by 0.8%, or $29.9
million, in FY2016 from FY2015. The city-wide/network offices will increase by 0.6%, or $10.2
million, while central office expenditures will decrease by 41.5%, or $108.6 million.
Over the five-year period between the FY2012 approved and FY2016 proposed budget, General
Operating Funds proposed appropriations for school-based budgets will decrease by 2.9%, or
School-Based Budgets
$3,728.4 65.6%
City-wide/Network Offices
$1,806.2 31.8%
Central Office$153.1
2.7%
CPS FY2016 Appropriations for General Operating Funds by Location (in $ millions)
Source: CPS FY2016 Proposed Budget, Interactive Reports, Find Your School Budget, available at www.cps.edu (last visited August 11, 2015).
FY2016 Total Appropriations for General Operating Funds: $5,687.7 million
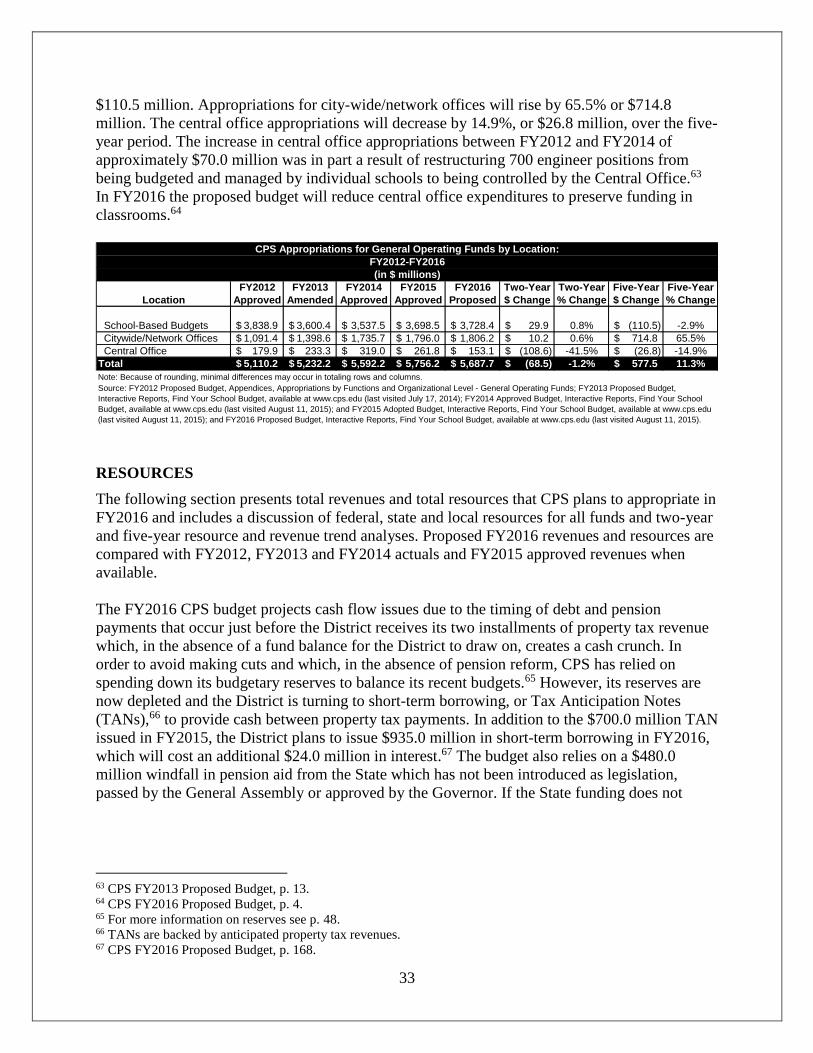
33
$110.5 million. Appropriations for city-wide/network offices will rise by 65.5% or $714.8
million. The central office appropriations will decrease by 14.9%, or $26.8 million, over the five-
year period. The increase in central office appropriations between FY2012 and FY2014 of
approximately $70.0 million was in part a result of restructuring 700 engineer positions from
being budgeted and managed by individual schools to being controlled by the Central Office.63
In FY2016 the proposed budget will reduce central office expenditures to preserve funding in
classrooms.64
RESOURCES
The following section presents total revenues and total resources that CPS plans to appropriate in
FY2016 and includes a discussion of federal, state and local resources for all funds and two-year
and five-year resource and revenue trend analyses. Proposed FY2016 revenues and resources are
compared with FY2012, FY2013 and FY2014 actuals and FY2015 approved revenues when
available.
The FY2016 CPS budget projects cash flow issues due to the timing of debt and pension
payments that occur just before the District receives its two installments of property tax revenue
which, in the absence of a fund balance for the District to draw on, creates a cash crunch. In
order to avoid making cuts and which, in the absence of pension reform, CPS has relied on
spending down its budgetary reserves to balance its recent budgets.65 However, its reserves are
now depleted and the District is turning to short-term borrowing, or Tax Anticipation Notes
(TANs),66 to provide cash between property tax payments. In addition to the $700.0 million TAN
issued in FY2015, the District plans to issue $935.0 million in short-term borrowing in FY2016,
which will cost an additional $24.0 million in interest.67 The budget also relies on a $480.0
million windfall in pension aid from the State which has not been introduced as legislation,
passed by the General Assembly or approved by the Governor. If the State funding does not
63 CPS FY2013 Proposed Budget, p. 13. 64 CPS FY2016 Proposed Budget, p. 4. 65 For more information on reserves see p. 48. 66 TANs are backed by anticipated property tax revenues. 67 CPS FY2016 Proposed Budget, p. 168.
FY2012 FY2013 FY2014 FY2015 FY2016 Two-Year Two-Year Five-Year Five-Year
Location Approved Amended Approved Approved Proposed $ Change % Change $ Change % Change
School-Based Budgets 3,838.9$ 3,600.4$ 3,537.5$ 3,698.5$ 3,728.4$ 29.9$ 0.8% (110.5)$ -2.9%
Citywide/Network Offices 1,091.4$ 1,398.6$ 1,735.7$ 1,796.0$ 1,806.2$ 10.2$ 0.6% 714.8$ 65.5%
Central Office 179.9$ 233.3$ 319.0$ 261.8$ 153.1$ (108.6)$ -41.5% (26.8)$ -14.9%
Total 5,110.2$ 5,232.2$ 5,592.2$ 5,756.2$ 5,687.7$ (68.5)$ -1.2% 577.5$ 11.3%
Note: Because of rounding, minimal differences may occur in totaling rows and columns.
Source: FY2012 Proposed Budget, Appendices, Appropriations by Functions and Organizational Level - General Operating Funds; FY2013 Proposed Budget,
Interactive Reports, Find Your School Budget, available at www.cps.edu (last visited July 17, 2014); FY2014 Approved Budget, Interactive Reports, Find Your School
Budget, available at www.cps.edu (last visited August 11, 2015); and FY2015 Adopted Budget, Interactive Reports, Find Your School Budget, available at www.cps.edu
(last visited August 11, 2015); and FY2016 Proposed Budget, Interactive Reports, Find Your School Budget, available at www.cps.edu (last visited August 11, 2015).
CPS Appropriations for General Operating Funds by Location:
FY2012-FY2016
(in $ millions)

34
materialize, the District proposes more unsustainable borrowing and further cuts, which could
affect the classroom.
Fund Descriptions and Structure
CPS funds are grouped slightly differently in the online interactive budget68 as compared to the
CPS FY2016 Budget Book. According to CPS, the online Interactive Reports display funds from
a practical spending perspective rather than a strict accounting perspective. For instance, there
are four Special Revenue Funds included in the General Fund in the Budget Book, but they are
broken out into separate funds, although though they are still part of the General Fund, in the
Interactive Budget. The Special Revenue Funds include the School Generated Fund, Lunchroom
Fund, No Child Left Behind Fund, and Other Grants. These funds are classified under the
General Fund from an accounting perspective, but funds are earmarked for special purposes and
are limited to use by the schools that generated them. The District believes this modification in
fund grouping is easier to understand and will help the interactive budget be more user-friendly
for the public.
In this chapter, our analysis will rely on the fund structure as outlined in the FY2016 Proposed
Budget, which conforms to Generally Accepted Accounting Principles (GAAP). CPS has three
fund types: General Operating Fund, Debt Service Funds and Capital Projects Funds. The
General Operating Fund consists of both the General Fund and Special Revenue Funds. The
General Fund is the primary operating fund of CPS and consists of the General Education Fund,
Building Operations and Maintenance Fund, Special Education Fund and the Workers’ and
Unemployment Compensation/Tort Fund. The Special Revenues Funds account for specific
revenue sources that are restricted for specific purposes other than debt service or capital
projects.
Total Resources for FY2016
In FY2016 CPS projects its total resources for all funds will be nearly $7.0 billion in local, state
and federal revenues and other resources, including $75.1 million of appropriated fund balance
and $480.0 million in state pension funding for which the District has budgeted but no
appropriation has been made by the State of Illinois. The General Operating Fund will hold the
majority of resources with 81.7%, or $5.7 billion. This includes the $75.1 million of appropriated
General Operating Fund balance, which is a dramatic decrease of 92.0% from fund balance
appropriated in FY2015 because CPS has spent down almost its entire budgetary reserves. The
Capital Projects Funds, which account for financial resources used for major capital acquisition
or construction activities, will total $706.4 million, or 10.1%, of total resources of which more
than half will come from a $515.0 million in net bond proceeds. Debt Service Funds, which
68 The interactive portion of the CPS Proposed FY2016 Budget can be found online on the CPS budget website:
https://supplier.csc.cps.k12.il.us/analytics/saw.dll?Dashboard.

35
account for principal and interest on long-term debt, will total $568.1 million, or 8.2%, of total
resources.
In FY2016 33.7% of all CPS resources, or nearly $2.4 billion, will come from local property tax
revenues. General State Aid provided the second largest component of the CPS revenue stream
in FY2015, at 14.9% or just over $1.0 billion, but in FY2016 it is the third largest component of
the budget at 13.6%, or $952.2 million. In FY2016, Other State Revenue, which encompasses all
revenue from the State less General State Aid, including block and other grants, State Pension
Aid for Teachers and Driver’s Education monies, is the second largest component of the
District’s budget at 17.8%, or $1.2 billion, and is driven largely by the assumed $480.0 million
pension aid and the statutorily required $12.1 million pension payment from the State. If Illinois
does not contribute the $480.0 million to the District, Other State Revenue will decrease by
21.9% to $764.3 million. Federal funds will be the fourth largest source of revenues at 12.7% of
the total, or $889.9 million, followed closely by Other Financing sources which is projected to
bring in $849.9 million in revenues including $555.0 million in borrowing. Appropriated Fund
Balance will provide only 1.1% of the District’s resources at $75.1 million, down 92.0% from
General Operating Funds
$5,687.7 81.7%
Capital Projects Funds$706.4
10.1%
Debt Service Funds$568.1
8.2%
CPS FY2016 Resources for All Funds(in $ millions)
Source: CPS FY2016 Proposed Budget, p. 25; Interactive Reports, Revenues and Expenditures , available at w ww.cps.edu (last accessed August 17, 2015).
Total FY2016Resources for All
Funds:$6,962.2 million
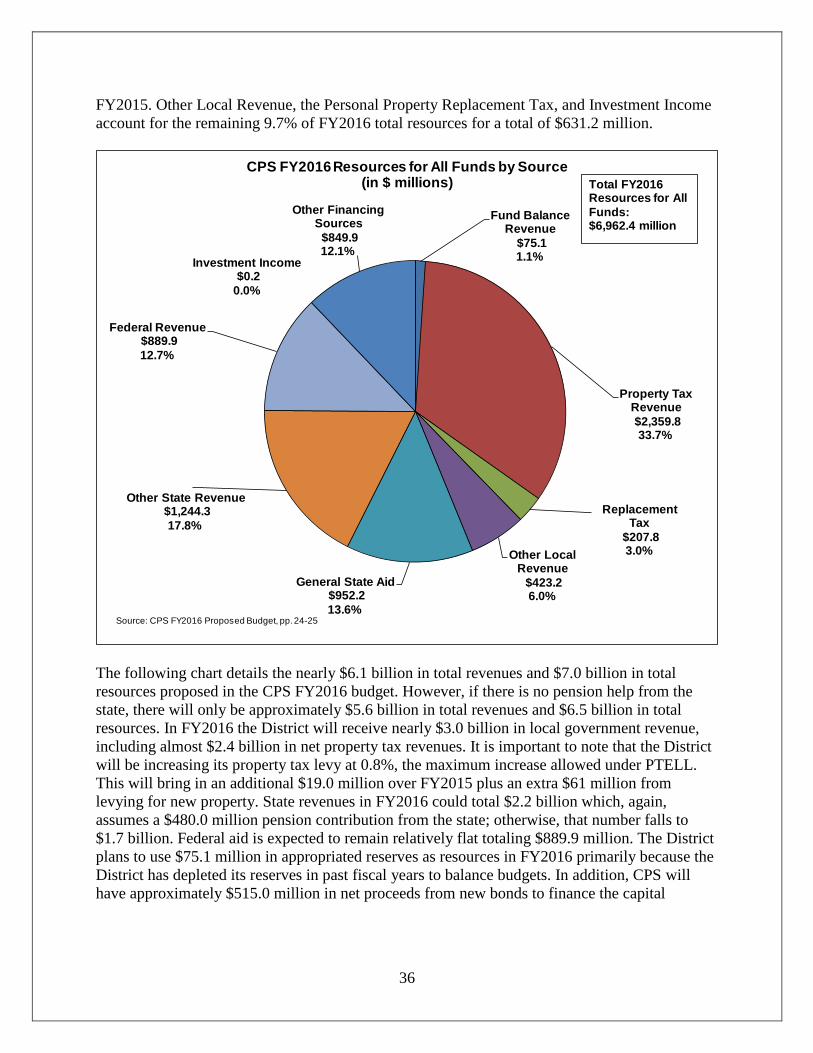
36
FY2015. Other Local Revenue, the Personal Property Replacement Tax, and Investment Income
account for the remaining 9.7% of FY2016 total resources for a total of $631.2 million.
The following chart details the nearly $6.1 billion in total revenues and $7.0 billion in total
resources proposed in the CPS FY2016 budget. However, if there is no pension help from the
state, there will only be approximately $5.6 billion in total revenues and $6.5 billion in total
resources. In FY2016 the District will receive nearly $3.0 billion in local government revenue,
including almost $2.4 billion in net property tax revenues. It is important to note that the District
will be increasing its property tax levy at 0.8%, the maximum increase allowed under PTELL.
This will bring in an additional $19.0 million over FY2015 plus an extra $61 million from
levying for new property. State revenues in FY2016 could total $2.2 billion which, again,
assumes a $480.0 million pension contribution from the state; otherwise, that number falls to
$1.7 billion. Federal aid is expected to remain relatively flat totaling $889.9 million. The District
plans to use $75.1 million in appropriated reserves as resources in FY2016 primarily because the
District has depleted its reserves in past fiscal years to balance budgets. In addition, CPS will
have approximately $515.0 million in net proceeds from new bonds to finance the capital
Fund Balance Revenue
$75.1 1.1%
Property Tax Revenue
$2,359.8 33.7%
Replacement Tax
$207.8 3.0%Other Local
Revenue
$423.2 6.0%
General State Aid$952.2
13.6%
Other State Revenue$1,244.3
17.8%
Federal Revenue$889.9
12.7%
Investment Income$0.2
0.0%
Other Financing Sources
$849.9 12.1%
CPS FY2016 Resources for All Funds by Source(in $ millions)
Source: CPS FY2016 Proposed Budget, pp. 24-25
Total FY2016Resources for All
Funds:$6,962.4 million
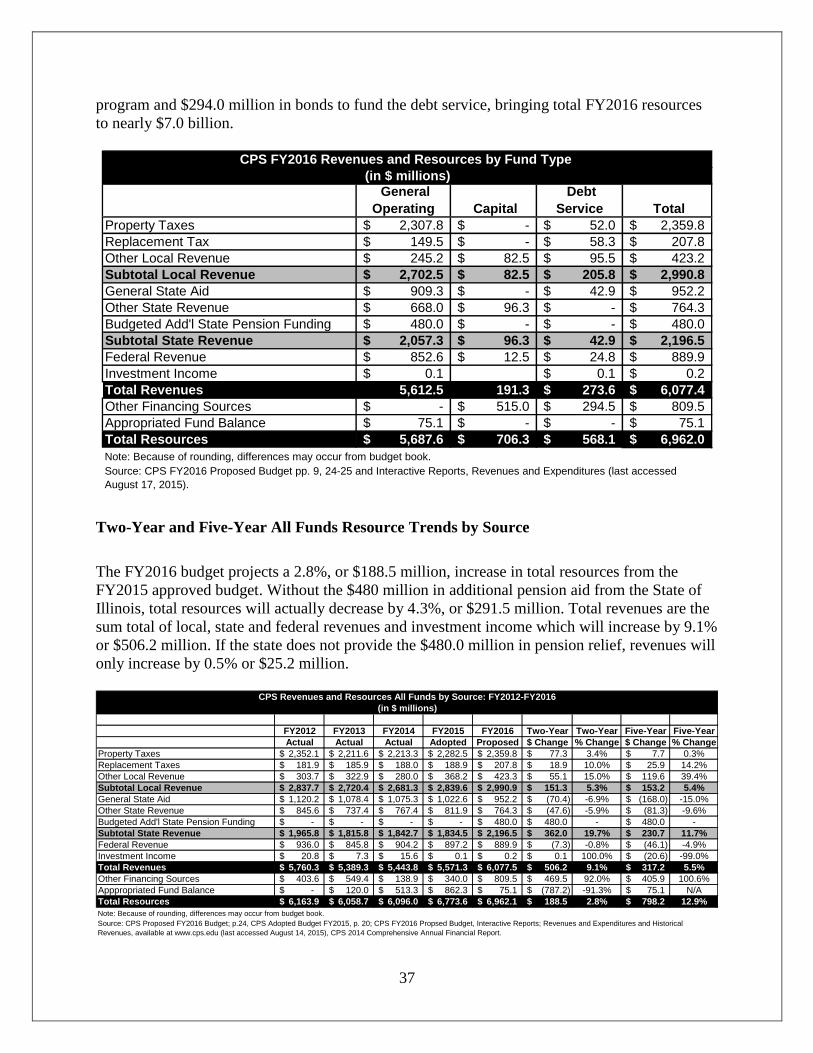
37
program and $294.0 million in bonds to fund the debt service, bringing total FY2016 resources
to nearly $7.0 billion.
Two-Year and Five-Year All Funds Resource Trends by Source
The FY2016 budget projects a 2.8%, or $188.5 million, increase in total resources from the
FY2015 approved budget. Without the $480 million in additional pension aid from the State of
Illinois, total resources will actually decrease by 4.3%, or $291.5 million. Total revenues are the
sum total of local, state and federal revenues and investment income which will increase by 9.1%
or $506.2 million. If the state does not provide the $480.0 million in pension relief, revenues will
only increase by 0.5% or $25.2 million.
General
Operating Capital
Debt
Service Total
Property Taxes 2,307.8$ -$ 52.0$ 2,359.8$
Replacement Tax 149.5$ -$ 58.3$ 207.8$
Other Local Revenue 245.2$ 82.5$ 95.5$ 423.2$
Subtotal Local Revenue 2,702.5$ 82.5$ 205.8$ 2,990.8$
General State Aid 909.3$ -$ 42.9$ 952.2$
Other State Revenue 668.0$ 96.3$ -$ 764.3$
Budgeted Add'l State Pension Funding 480.0$ -$ -$ 480.0$
Subtotal State Revenue 2,057.3$ 96.3$ 42.9$ 2,196.5$
Federal Revenue 852.6$ 12.5$ 24.8$ 889.9$
Investment Income 0.1$ 0.1$ 0.2$
Total Revenues 5,612.5 191.3 273.6$ 6,077.4$
Other Financing Sources -$ 515.0$ 294.5$ 809.5$
Appropriated Fund Balance 75.1$ -$ -$ 75.1$
Total Resources 5,687.6$ 706.3$ 568.1$ 6,962.0$
Note: Because of rounding, differences may occur from budget book.
Source: CPS FY2016 Proposed Budget pp. 9, 24-25 and Interactive Reports, Revenues and Expenditures (last accessed
August 17, 2015).
CPS FY2016 Revenues and Resources by Fund Type
(in $ millions)
FY2012 FY2013 FY2014 FY2015 FY2016 Two-Year Two-Year Five-Year Five-Year
Actual Actual Actual Adopted Proposed $ Change % Change $ Change % Change
Property Taxes 2,352.1$ 2,211.6$ 2,213.3$ 2,282.5$ 2,359.8$ 77.3$ 3.4% 7.7$ 0.3%
Replacement Taxes 181.9$ 185.9$ 188.0$ 188.9$ 207.8$ 18.9$ 10.0% 25.9$ 14.2%
Other Local Revenue 303.7$ 322.9$ 280.0$ 368.2$ 423.3$ 55.1$ 15.0% 119.6$ 39.4%
Subtotal Local Revenue 2,837.7$ 2,720.4$ 2,681.3$ 2,839.6$ 2,990.9$ 151.3$ 5.3% 153.2$ 5.4%
General State Aid 1,120.2$ 1,078.4$ 1,075.3$ 1,022.6$ 952.2$ (70.4)$ -6.9% (168.0)$ -15.0%
Other State Revenue 845.6$ 737.4$ 767.4$ 811.9$ 764.3$ (47.6)$ -5.9% (81.3)$ -9.6%
Budgeted Add'l State Pension Funding -$ -$ -$ -$ 480.0$ 480.0$ - 480.0$ -
Subtotal State Revenue 1,965.8$ 1,815.8$ 1,842.7$ 1,834.5$ 2,196.5$ 362.0$ 19.7% 230.7$ 11.7%
Federal Revenue 936.0$ 845.8$ 904.2$ 897.2$ 889.9$ (7.3)$ -0.8% (46.1)$ -4.9%
Investment Income 20.8$ 7.3$ 15.6$ 0.1$ 0.2$ 0.1$ 100.0% (20.6)$ -99.0%
Total Revenues 5,760.3$ 5,389.3$ 5,443.8$ 5,571.3$ 6,077.5$ 506.2$ 9.1% 317.2$ 5.5%
Other Financing Sources 403.6$ 549.4$ 138.9$ 340.0$ 809.5$ 469.5$ 92.0% 405.9$ 100.6%
Apppropriated Fund Balance -$ 120.0$ 513.3$ 862.3$ 75.1$ (787.2)$ -91.3% 75.1$ N/A
Total Resources 6,163.9$ 6,058.7$ 6,096.0$ 6,773.6$ 6,962.1$ 188.5$ 2.8% 798.2$ 12.9%
Note: Because of rounding, differences may occur from budget book.
CPS Revenues and Resources All Funds by Source: FY2012-FY2016
(in $ millions)
Source: CPS Proposed FY2016 Budget; p.24, CPS Adopted Budget FY2015, p. 20; CPS FY2016 Propsed Budget, Interactive Reports; Revenues and Expenditures and Historical
Revenues, available at www.cps.edu (last accessed August 14, 2015), CPS 2014 Comprehensive Annual Financial Report.
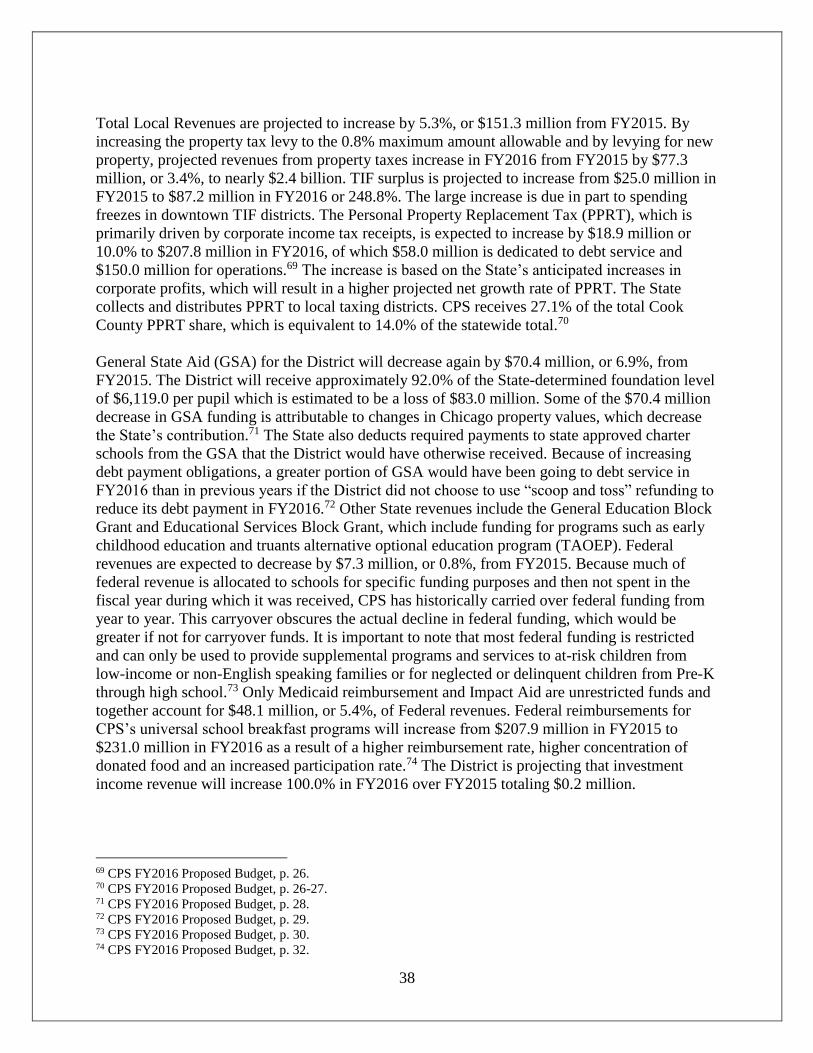
38
Total Local Revenues are projected to increase by 5.3%, or $151.3 million from FY2015. By
increasing the property tax levy to the 0.8% maximum amount allowable and by levying for new
property, projected revenues from property taxes increase in FY2016 from FY2015 by $77.3
million, or 3.4%, to nearly $2.4 billion. TIF surplus is projected to increase from $25.0 million in
FY2015 to $87.2 million in FY2016 or 248.8%. The large increase is due in part to spending
freezes in downtown TIF districts. The Personal Property Replacement Tax (PPRT), which is
primarily driven by corporate income tax receipts, is expected to increase by $18.9 million or
10.0% to $207.8 million in FY2016, of which $58.0 million is dedicated to debt service and
$150.0 million for operations.69 The increase is based on the State’s anticipated increases in
corporate profits, which will result in a higher projected net growth rate of PPRT. The State
collects and distributes PPRT to local taxing districts. CPS receives 27.1% of the total Cook
County PPRT share, which is equivalent to 14.0% of the statewide total.70
General State Aid (GSA) for the District will decrease again by $70.4 million, or 6.9%, from
FY2015. The District will receive approximately 92.0% of the State-determined foundation level
of $6,119.0 per pupil which is estimated to be a loss of $83.0 million. Some of the $70.4 million
decrease in GSA funding is attributable to changes in Chicago property values, which decrease
the State’s contribution.71 The State also deducts required payments to state approved charter
schools from the GSA that the District would have otherwise received. Because of increasing
debt payment obligations, a greater portion of GSA would have been going to debt service in
FY2016 than in previous years if the District did not choose to use “scoop and toss” refunding to
reduce its debt payment in FY2016.72 Other State revenues include the General Education Block
Grant and Educational Services Block Grant, which include funding for programs such as early
childhood education and truants alternative optional education program (TAOEP). Federal
revenues are expected to decrease by $7.3 million, or 0.8%, from FY2015. Because much of
federal revenue is allocated to schools for specific funding purposes and then not spent in the
fiscal year during which it was received, CPS has historically carried over federal funding from
year to year. This carryover obscures the actual decline in federal funding, which would be
greater if not for carryover funds. It is important to note that most federal funding is restricted
and can only be used to provide supplemental programs and services to at-risk children from
low-income or non-English speaking families or for neglected or delinquent children from Pre-K
through high school.73 Only Medicaid reimbursement and Impact Aid are unrestricted funds and
together account for $48.1 million, or 5.4%, of Federal revenues. Federal reimbursements for
CPS’s universal school breakfast programs will increase from $207.9 million in FY2015 to
$231.0 million in FY2016 as a result of a higher reimbursement rate, higher concentration of
donated food and an increased participation rate.74 The District is projecting that investment
income revenue will increase 100.0% in FY2016 over FY2015 totaling $0.2 million.
69 CPS FY2016 Proposed Budget, p. 26. 70 CPS FY2016 Proposed Budget, p. 26-27. 71 CPS FY2016 Proposed Budget, p. 28. 72 CPS FY2016 Proposed Budget, p. 29. 73 CPS FY2016 Proposed Budget, p. 30. 74 CPS FY2016 Proposed Budget, p. 32.
39
Similar to the way GSA funding is calculated, Title I funds, which make up the majority of the
District’s federal funding, are calculated based upon Census data related to the number of
children in poverty relative to other districts. The vast majority of CPS students, 86.0%,75 are
economically disadvantaged,76 which is an indicator of poverty frequently used within school
districts to determine a school’s eligibility for Title I funds.77 However, because the percentage
of children living in poverty nationwide has increased,78 CPS’s proportion has continued to
decline. The reduction in Title I funds has been tempered because the Illinois State Board of
Education (ISBE) has a 95.0% hold harmless provision for high poverty school districts, limiting
the amount of an annual reduction.79 In FY2016 CPS expects to receive $252.0 million in Title I
funds with $69.0 million in allowable carryover funds, so the total grant amount will be $321.0
million.80
In FY2016 the category of Other Financing Sources represents the District’s plan to issue
approximately $515.0 million net amount of new bonds to fund its capital program and $294.5
million to fund its debt service fund. In FY2016 the District also plans to appropriate $75.1
million in fund balance, bringing total resources for the FY2016 budget up to nearly $7.0 billion.
This is an increase of a 1.6%, or $110.4 million, in total resources over the FY2015 budget.
Over the five-year period from FY2012 to FY2016, General State Aid is projected to decrease by
15.0%, or $168.0 million; federal revenue is projected to decrease by 4.9%, or $46.1 million; and
investment income is projected to decrease by 99.0%, or $20.6 million. Other State Revenue is
projected to increase by 49.0%, or $409.1, million but that projection is skewed because CPS is
assuming that they will receive a $480.0 million State pension contribution; without the pension
aid, Other State Revenue actually decreases by 8.5%, or $70.9 million, from FY2012 to
FY2016.The Personal Property Replacement Tax increases by $25.9 million, or 14.2%, and
Other Local Revenue increases by $119.6 million, or 39.4%, due mostly to TIF surpluses and
spending freezes in downtown TIF districts. The increase in the District’s property tax levy in
FY2016 compared to FY2012 is not significantly different with an increase of 0.3%, or $7.7
million. Local revenues increase by $153.2 million from $2.8 billion in FY2012 to nearly $3.0
billion in FY2016.
In both the two-year and the five-year trend analysis, total revenues and total resources are
trending upwards. While total revenues include local, state and federal revenues, total resources
include all total revenues as well as the proceeds of bond sales and one time revenue sources like
appropriated fund balance. The upward trend in total resources represents the District’s reliance
75 CPS Office of Accountability, last updated February, 2015, http://www.cps.edu/about_cps/at-a-
glance/pages/stats_and_facts.aspx. 76 Determined by those whose families’ income is within 185.0% of the federal poverty line. 77 The State of Illinois instead uses the number of students receiving services through Medicaid, Supplemental
Nutrition Assistance Program (SNAP) and Temporary Assistance for Needy Children (TANF) in its determination
of Supplemental General State Aid (SGSA). 78 National Center for Education Statistics, Table 102.40. Poverty rates for all persons and poverty status of 5- to 17-
year-olds, by region and state: Selected years, 1990 through 2012. 79 Communication with CPS Office of Budget and Management, July 16, 2014. 80 CPS FY2016 Proposed Budget, p. 30.
40
on unsustainable fiscal practices like drawing down fund balance reserves, borrowing, and an
unrealized windfall to close its ongoing and worsening structural deficit.
State of Illinois Funding
The State of Illinois may provide a total of nearly $2.2 billion of revenues in the FY2016 budget,
which is a $362.0 million increase from the FY2015 adopted budget. Without state intervention
to help CPS with its pension payment to the Chicago Teachers’ Pension Fund, the District will
see a $118.0 million decrease from FY2015.
The General State Aid (GSA) foundation level is the State of Illinois’ sanctioned minimum level
of funding per pupil that is achieved through a combination of State and local funds and accounts
for 16.0% of the total operating budget.81 The GSA distribution to school districts is based on a
number of factors, including local property tax capacity. The GSA distribution formula assumes
that school districts will levy for all available local property taxes first before the State provides
additional funding to reach the foundation level.
The State’s foundation level will remain at $6,119.0 per pupil in FY2016, the same level since
FY2010. The last time the foundation level increased was between FY2009 and FY2010, when it
rose by $160.0, or 2.7%, from $5,959 to $6,119 per pupil. Because the statewide appropriation is
insufficient to pay for the foundation level this year, all school districts will receive a proration
of 92% of their calculated GSA. GSA revenue is estimated to be just over $952.2 million in
FY2016, a decrease of $70.0 million from the FY2015 budget. Of this amount, $42.9 million will
be used for debt service.
In FY2015, the first time since FY2011, the State appropriated funds beyond the statutorily
required contribution to the Chicago Teachers’ Pension Fund to offset a portion of the cost of
benefit increases enacted under Public Act 90-0582. In FY2016, the statutorily required amount
is $12.1 million. In FY2015 the State contributed an additional $50.0 million to the Chicago
Teachers’ Pension Fund. It is important to note that this appropriation by the State is well below
the “goal and intention,” as noted by the General Assembly in 40 ILCS 5/17-127, to contribute
an amount equivalent to 20.0% or 30.0% of the contribution made to the downstate Teachers’
Retirement System (TRS) pension fund. For FY2016 the State will appropriate $3.7 billion to
TRS. In FY2015 if the State had followed through on its “goal and intention” of a 20.0%-30.0%
contribution to the Chicago Teachers’ Pension Fund, this would amount to a $700.0 million
payment to the District’s pension fund rather than its $62.1 million contribution.82
Property Tax Levy and Revenue
CPS expects its FY2016 property tax revenues to total nearly $2.4 billion, an increase of $77.3
million from the FY2015 approved budget. The increase is the result of an increase in the levy of
0.8%, the maximum amount allowed under state law and levying to capture growth from all new
property.
81 CPS FY2016 Proposed Budget, pp. 27-28. 82 CPS FY2016 Proposed Budget, p.142.

41
CPS and other non-home rule taxing bodies in Cook County have been subject to the Property
Tax Extension Limitation Law (PTELL) since tax year 1994 (payable in 1995). In general, the
tax cap law allows tax extensions on existing property to rise each year by the lesser of 5.0% or
the increase in Consumer Price Index. For tax year 2015, the tax cap law permits a 0.8% increase
on existing property value for property tax funds subject to the law. The tax cap also allows the
tax rate calculated on the value of existing property to be applied to new property, thus
generating additional revenue.83
The tax year 2015 extension is paid by taxpayers in 2016 in first and second installments. The
first installment is equal to 55.0% of the prior year’s total tax bill.84 The second installment
includes the full year’s tax extension minus the amount already paid in the first installment, so
extension increases for a tax year are recognized by the second installment when new tax rates
are computed.
The following graph depicts the allocation of expected FY2016 property tax revenues among
funds. Just over $1.6 billion, or 71.4%, is distributed to the General Education Fund to finance
CPS operations. The second largest amount, $306.5 million, or 13.3%, will be designated to
Public Building Commission leases and debt service payments. CPS will appropriate $277.7
million, or 11.8%, to the Special Education Fund; $76.2 million, or 3.3%, will be used for the
83 Civic Federation, “The Cook County Property Tax Extension Process: A Primer on Levies, Tax Caps and the
Effect of Tax Increment Financing Districts,” June22, 2013. 84 P.A. 96-490 changed this amount from 50% to 55% of the prior year’s tax bill for tax year 2009 (first installment
due March of 2010) and thereafter. The rationale for this change was that it would mitigate taxpayers’ “sticker
shock” resulting from tax increases that appear on second installment tax bills.

42
Workers’ and Unemployment Compensation/Tort Fund; and $52.0 million, or 2.2%, will be
dedicated to the debt service fund.
The next exhibit presents CPS actual property tax revenues from FY1991 actual revenues to
FY2014 and FY2015-FY2016 proposed revenues. Over that period, property tax revenues are
projected to rise by 64.3%, or over $1.5 billion, from $842.3 million to nearly $2.4 billion.
Between FY1991 and FY2014, the most recent year for which audited data are available, CPS
property tax revenues have increased by 61.9% or $1.4 billion. However, property tax collections
in FY2014 declined by 6.0%, or $140.6 million, from FY2013. Since FY1996, the first fiscal
General Fund$2,072.1
92.8%
Tort Fund$106.4
4.8%
PBC Leases & Debt Service
$55.2 2.5%
Special Education Fund,
$277.7 11.8%
Debt Service Fund, $52.0
2.2%
Distribution of CPS FY2016 Property Tax Revenues:(in $ millions)
Source: CPS FY2016 Proposed Budget. Interactive Reports, Revenues and Expenditures, available at www.cps.edu (ast visited August 18, 2015).
Total FY2016 Property Tax
Revenues: $2,359.8 million

43
year that the tax cap law could limit CPS property tax revenues, the compound annual growth
rate of revenues (through FY2014 actual) was 3.7%.
The following graph illustrates the increase in CPS property tax extensions (different from fiscal
year revenues) between tax year 1990 (payable in 1991) and tax year 2014 (payable in 2015) as
well as the decrease in tax rates up through tax year 2009 before rates began to grow again in tax
year 2010. Property tax years are the same as calendar years. However, the CPS fiscal year runs
July 1 to June 30. There is also a one-year lag in Cook County between when property taxes are
levied and when they are collected. Taxes levied in 2015 will actually be received in 2016. The
effect is that property tax funds available during the District’s upcoming FY2016 will be drawn
from part of tax year 2014 and part of tax year 2015. The tax extension was $981.0 million in tax
year 1990 and rose gradually to $2.2 billion in tax year 2014. The CPS tax rate fell from 4.246%
in tax year 1990 to 2.366% in tax year 2009 before rising to 3.671% in tax year 2013 and
Property Tax
Revenue
$ Change from
Previous Year
% Change from
Previous Year
FY1991 842,339$ -- --
FY1992 882,181$ 39,842$ 4.7%
FY1993 1,008,481$ 126,300$ 14.3%
FY1994 1,205,322$ 196,841$ 19.5%
FY1995 1,206,008$ 686$ 0.1%
FY1996 1,245,539$ 39,531$ 3.3%
FY1997 1,239,249$ (6,290)$ -0.5%
FY1998 1,278,734$ 39,485$ 3.2%
FY1999 1,311,664$ 32,930$ 2.6%
FY2000 1,368,081$ 56,417$ 4.3%
FY2001 1,403,657$ 35,576$ 2.6%
FY2002 1,429,871$ 26,214$ 1.9%
FY2003 1,479,968$ 50,097$ 3.5%
FY2004 1,546,335$ 66,367$ 4.5%
FY2005 1,571,065$ 24,730$ 1.6%
FY2006 1,639,237$ 68,172$ 4.3%
FY2007 1,718,249$ 79,012$ 4.8%
FY2008 1,767,760$ 49,511$ 2.9%
FY2009 1,813,917$ 46,157$ 2.6%
FY2010 1,896,540$ 82,623$ 4.6%
FY2011 2,047,163$ 150,623$ 7.9%
FY2012 1,936,655$ (110,508)$ -5.4%
FY2013 2,352,136$ 415,481$ 21.5%
FY2014 2,211,568$ (140,568)$ -6.0%
FY2015
Estimated 2,289,000$ 77,432$ 3.5%
FY2016
Proposed 2,359,800$ 70,800$ 3.1%
Source: CPS Comprehensive Annual Financial Reports, FY2013, p.112, FY2012,
pp. 106-107; FY2010, pp. 98-99; FY1999, pp. 80-81; and CPS FY2016 Proposed
Budget, p. 24.
CPS Property Tax Revenue: FY1991-FY2016
(in $ thousands)

44
remained nearly flat for FY2014 at about 3.660%, the most recent year for which tax rate data
are available. The District’s tax rate fell after the implementation of the tax cap law even though
its extension rose because taxable property value was growing much faster than extensions (rate
= extension ÷ taxable value). Starting in tax year 2010, the District’s rate started to rise again
because the taxable value of property in Chicago fell significantly.
The Property Tax Extension Limitation Law, or tax caps, took effect in 1994, limiting the
maximum growth in the levy. Prior to 1994, the District’s tax extension was limited by a
maximum rate for each property tax fund. The fund rate limits still exist, but the tax cap law, not
rate limits, has been the operative limit on CPS tax increases since 1994.85 The limiting effect of
the tax cap has also meant that since 1994, tax increment financing has not diverted property tax
revenue from CPS. CPS receives the full extension to which it is entitled by the tax cap law. The
effect of TIF is to raise tax rates for all property taxpayers, not to divert revenue from local
governments.86
85Civic Federation, “The Cook County Property Tax Extension Process: A Primer on Levies, Tax Caps and the
Effect of Tax Increment Financing Districts,” June22, 2013. 86 Civic Federation, “The Cook County Property Tax Extension Process: A Primer on Levies, Tax Caps and the
Effect of Tax Increment Financing Districts,” June22, 2013..
4.246%
2.366%
3.660%
0.0%
0.5%
1.0%
1.5%
2.0%
2.5%
3.0%
3.5%
4.0%
4.5%
5.0%
$-
$500,000,000.0
$1,000,000,000.0
$1,500,000,000.0
$2,000,000,000.0
$2,500,000,000.0
Tax Extension ($)
Tax Rate (%)
Tax caps introduced in
1994
CPS Property Extensions and Rates: Tax Years 1990-2014

45
Timing of CPS Property Tax Receipts and the New Revenue Recognition Policy
CPS announced in April 201487 that the District would be extending its revenue recognition
period in FY2015 from 30 days after the close of the fiscal year to 60 days after the close of the
fiscal year. CPS noted that this change would reduce property tax collection volatility, but more
importantly, it would be used as an accounting mechanism to close the FY2015 budget gap. The
revenue recognition period remains the same for FY2016.
Under the prior revenue recognition period, property tax revenues were recognized in the same
fiscal year as long as the revenues were received within 30 days of the close of the fiscal year, or
through July 30. Between July 1 and July 30, 2012, the District collected $244.0 million in
property tax revenues that had been budgeted for receipt in FY2013. The early payment was due
to the fact that Cook County, which administers the property tax system, sent the second
installment 2011 property tax bills out on time for the first time in over 30 years, with a due date
of August 1, 2012. The continuation of the August 1 due date in FY2013 thus “normalized”
collections over the fiscal year’s budgeted property tax extension and the result was an overall
decrease in FY2013 collections as compared to FY2012, as CPS basically booked 13 months of
property tax payments in FY2012 and 12 months in FY2013. Historically, the County sent
property tax bills out late and thus received payments late, which led to delayed distributions of
revenue to all of its taxing bodies, including CPS.
CPS acknowledges that this volatility in the timing of tax receipts does not impact the total
amount of property tax revenue received by the District, but that the timing of the property tax
receipts instead impacts the fiscal year in which the revenue must be recorded.88 The accelerated
2012 property tax receipts, along with earlier than expected State block grant payments, left the
FY2012 year-end audited General Fund with $350.0 million of unexpected additional fund
balance. The FY2014 proposed budget assumed a similar amount of property tax revenue to
what was collected in July 2012 to be collected in July 2013 and July 2014. For FY2016 the
District expects an additional $11.0 million in property tax revenue as a result of the 60 day
recognition period.89
PERSONNEL
This section of the analysis presents the District’s full-time equivalent (FTE) position count by
type and personnel appropriation trends for general operating funds by type. The analysis
compares the FY2016 proposed budget to the FY2012, FY2013, FY2014 and FY2015 approved
budgets and FY2012 actuals when available.
Two-Year and Five-Year Full-Time Equivalent (FTE) Positions by Type
The District’s FTE position count in FY2016 will decrease by 847 FTEs, or 2.2%, from the
FY2015 approved budget. In the two-year period, the largest reduction in FTEs will be school
support staff, which will decline by 3.9%, or 409.9 FTEs. The second largest reduction in
position count will be teachers, which will decrease by 1.5%, or 320.5 FTEs, while school
87 See CPS press release, “CPS Projects to Boost Base Per Pupil Spending by Nearly $250,” from April 9, 2014. 88 CPS FY2015 Proposed Budget, pp. 9-10. 89CPS FY2016 Proposed Budget, p. 9.
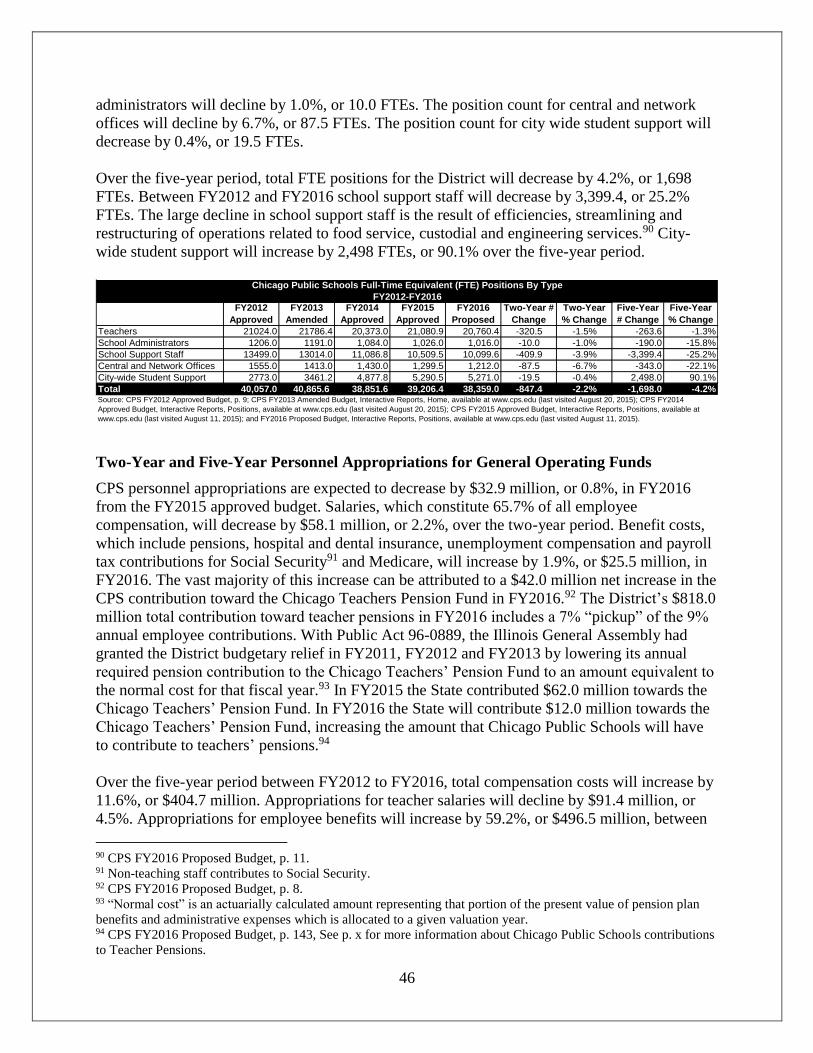
46
administrators will decline by 1.0%, or 10.0 FTEs. The position count for central and network
offices will decline by 6.7%, or 87.5 FTEs. The position count for city wide student support will
decrease by 0.4%, or 19.5 FTEs.
Over the five-year period, total FTE positions for the District will decrease by 4.2%, or 1,698
FTEs. Between FY2012 and FY2016 school support staff will decrease by 3,399.4, or 25.2%
FTEs. The large decline in school support staff is the result of efficiencies, streamlining and
restructuring of operations related to food service, custodial and engineering services.90 City-
wide student support will increase by 2,498 FTEs, or 90.1% over the five-year period.
Two-Year and Five-Year Personnel Appropriations for General Operating Funds
CPS personnel appropriations are expected to decrease by $32.9 million, or 0.8%, in FY2016
from the FY2015 approved budget. Salaries, which constitute 65.7% of all employee
compensation, will decrease by $58.1 million, or 2.2%, over the two-year period. Benefit costs,
which include pensions, hospital and dental insurance, unemployment compensation and payroll
tax contributions for Social Security91 and Medicare, will increase by 1.9%, or $25.5 million, in
FY2016. The vast majority of this increase can be attributed to a $42.0 million net increase in the
CPS contribution toward the Chicago Teachers Pension Fund in FY2016.92 The District’s $818.0
million total contribution toward teacher pensions in FY2016 includes a 7% “pickup” of the 9%
annual employee contributions. With Public Act 96-0889, the Illinois General Assembly had
granted the District budgetary relief in FY2011, FY2012 and FY2013 by lowering its annual
required pension contribution to the Chicago Teachers’ Pension Fund to an amount equivalent to
the normal cost for that fiscal year.93 In FY2015 the State contributed $62.0 million towards the
Chicago Teachers’ Pension Fund. In FY2016 the State will contribute $12.0 million towards the
Chicago Teachers’ Pension Fund, increasing the amount that Chicago Public Schools will have
to contribute to teachers’ pensions.94
Over the five-year period between FY2012 to FY2016, total compensation costs will increase by
11.6%, or $404.7 million. Appropriations for teacher salaries will decline by $91.4 million, or
4.5%. Appropriations for employee benefits will increase by 59.2%, or $496.5 million, between
90 CPS FY2016 Proposed Budget, p. 11. 91 Non-teaching staff contributes to Social Security. 92 CPS FY2016 Proposed Budget, p. 8. 93 “Normal cost” is an actuarially calculated amount representing that portion of the present value of pension plan
benefits and administrative expenses which is allocated to a given valuation year. 94 CPS FY2016 Proposed Budget, p. 143, See p. x for more information about Chicago Public Schools contributions
to Teacher Pensions.
FY2012
Approved
FY2013
Amended
FY2014
Approved
FY2015
Approved
FY2016
Proposed
Two-Year #
Change
Two-Year
% Change
Five-Year
# Change
Five-Year
% Change
Teachers 21024.0 21786.4 20,373.0 21,080.9 20,760.4 -320.5 -1.5% -263.6 -1.3%
School Administrators 1206.0 1191.0 1,084.0 1,026.0 1,016.0 -10.0 -1.0% -190.0 -15.8%
School Support Staff 13499.0 13014.0 11,086.8 10,509.5 10,099.6 -409.9 -3.9% -3,399.4 -25.2%
Central and Network Offices 1555.0 1413.0 1,430.0 1,299.5 1,212.0 -87.5 -6.7% -343.0 -22.1%
City-wide Student Support 2773.0 3461.2 4,877.8 5,290.5 5,271.0 -19.5 -0.4% 2,498.0 90.1%
Total 40,057.0 40,865.6 38,851.6 39,206.4 38,359.0 -847.4 -2.2% -1,698.0 -4.2%
Chicago Public Schools Full-Time Equivalent (FTE) Positions By Type
FY2012-FY2016
Source: CPS FY2012 Approved Budget, p. 9; CPS FY2013 Amended Budget, Interactive Reports, Home, available at www.cps.edu (last visited August 20, 2015); CPS FY2014
Approved Budget, Interactive Reports, Positions, available at www.cps.edu (last visited August 20, 2015); CPS FY2015 Approved Budget, Interactive Reports, Positions, available at
www.cps.edu (last visited August 11, 2015); and FY2016 Proposed Budget, Interactive Reports, Positions, available at www.cps.edu (last visited August 11, 2015).

47
FY2012 and FY2016, rising from $838.6 million to $1.3 billion. This increase in benefit costs
can be attributed to a $482.3 million increase in total teacher pension contributions including the
employee contribution “pick-up” between FY2012 and FY2016.
The next exhibit shows the District’s employee compensation expenditures as a percentage of all
operating funds expenditures. The chart compares actual expenditures from FY2012 through
FY2014 to approved FY2015 and proposed FY2016 appropriations. Similar to the table above,
total compensation expenditures include salaries and pension benefits for teachers and Education
Support staff, health expenses, Medicare and Social Security, workers’ compensation and
unemployment compensation. The percentage of all operating funds appropriations dedicated to
personnel has averaged 69.3%, with a low of 68.1% in FY2015 and a high of 71.3% in FY2012.
Since FY2012, compensation expenditures have increased by 11.6%, while other operating
expenditures have increased by 28.1%, indicating that while the District’s operating budget has
FY2012 FY2013 FY2014 FY2015 FY2016 Two-Year Two-Year Five-Year Five-Year
Actual Actual Actual Adopted Proposed $ Change % Change $ Change % Change
Salaries
Teacher Salaries 2,026.8$ 1,942.0$ 1,940.2$ 1,986.0$ 1,935.4$ (50.6)$ -2.5% (91.4)$ -4.5%
Ed. Support Salaries 618.3$ 633.5$ 621.1$ 625.5$ 618.0$ (7.5)$ -1.2% (0.3)$ 0.0%
Total Salaries 2,645.1$ 2,575.5$ 2,561.3$ 2,611.5$ 2,553.4$ (58.1)$ -2.2% (91.7)$ -3.5%
Employee Benefits
Teacher Pension Employer Portion 205.3$ 207.7$ 613.0$ 661.4$ 687.1$ 25.7$ 3.9% 481.8$ 234.7%
Teacher Pension Pickup* 130.4$ 129.1$ 127.4$ 133.7$ 130.9$ (2.8)$ -2.1% 0.5$ 0.3%
Total Teacher Pensions 335.7$ 336.8$ 740.4$ 795.1$ 818.0$ 22.8$ 2.9% 482.3$ 143.7%
Ed. Support Pension Employer Portion 61.6$ 63.0$ 63.2$ 61.1$ 59.9$ (1.2)$ -1.9% (1.7)$ -2.7%
Ed. Support Pension Pickup* 38.4$ 39.3$ 38.7$ 40.3$ 39.5$ (0.8)$ -2.1% 1.1$ 2.8%
Total Ed. Support Pension 100.0$ 102.3$ 101.9$ 101.4$ 99.4$ (2.0)$ -2.0% (0.6)$ -0.6%
Hospitalization/Other Comp. 324.9$ 319.8$ 343.3$ 341.4$ 347.3$ 5.8$ 1.7% 22.4$ 6.9%
Unemployment Compensation 17.1$ 9.1$ 16.4$ 9.1$ 8.9$ (0.2)$ -2.4% (8.2)$ -47.8%
Medicare/Social Security 34.9$ 36.4$ 36.0$ 39.5$ 38.8$ (0.7)$ -1.8% 3.9$ 11.2%
Workers' Compensation 26.0$ 24.0$ 25.6$ 23.2$ 22.7$ (0.6)$ -2.4% (3.3)$ -12.8%
Total Employee Benefits 838.6$ 828.4$ 1,263.6$ 1,309.9$ 1,335.1$ 25.2$ 1.9% 496.5$ 59.2%
Total Compensation 3,483.7$ 3,403.9$ 3,825.0$ 3,921.3$ 3,888.4$ (32.9)$ -0.8% 404.7$ 11.6%
Source: CPS FY2016 Proposed Budget, Interactive Reports, Revenues & Expenditures, available at www.cps.edu (last visited August 12, 2015); Chicago Public Schools Comprehensive Annual
Financial Report (CAFR) FY2014, pp. 69, 71 and 81; FY2013, pp. 81, 83 and 93; and FY2012 CAFR, pp. 76, 78 and 88..
CPS Personnel Appropriations for General Operating Funds by Type: FY2012-FY2016
(in $ millions)
*CPS "picks up" 7% of the 9% annual employee pension contribution, meaning it pays 7% of the employee 9% contribution on behalf of teachers and 7% of the 8.5% or 9.0% contribution on behalf
of non-teacher employees.
Note: The City of Chicago makes employer contributions for non-teachers on behalf of Chicago Public Schools (CPS). CPS logs these contributions as revenue and passes them through to the
Municipal Employees Pension Fund. See p. 60 for more information. $22.5 million and $6.8 million in federal funds contribute to FY2012 expenditures for the Teacher Pension Employer Portion
and the Ed. Support Pension Employer Portion, respectively. $18.8 million and $6.3 million in federal funds contribute to FY2013 expenditures for the Teacher Pension Employer Portion and the
Ed. Support Pension Employer Portion, respectively. $18.9 million and $5.6 million in federal funds contribute to FY2014 approved appropriations for the Teacher Pension Employer Portion and the
Ed. Support Pension Employer Portion, respectively. $20.3 million and $5.3 million in federal funds contribute to FY2015 approved appropriations for the Teacher Pension Employer Portion and
the Ed. Support Employer Portion, respectively. $21.6 million and $4.7 million in federal funds contribute to FY2016 proposed appropriations for the Teacher Pension Employer Portion and the Ed.
Support Pension Employer Portion, respectively.

48
steadily increased, a growing portion of the budget has been dedicated to non-personnel related
costs.
ENROLLMENT
CPS is projecting essentially flat overall student enrollment across the system in FY2016 as
compared to FY2015 total enrollment. According to the FY2016 proposed budget, actual
FY2015 enrollment was 396,683 but was projected to be 400,545 students or 3,862 more than
FY2015 actual enrollment. The projected enrollment for FY2016 is 394,191 students.
As the following exhibits indicate, total actual enrollment is projected to drop by 9,960 students,
or 2.5%, between FY2012 and FY2016. Enrollment on the whole has been declining since
FY2012.
$3,483.7 $3,403.9 $3,825.0 $3,921.3 $3,888.4
$1,404.6 $1,542.4
$1,635.1 $1,834.9 $1,799.3
$-
$1,000.0
$2,000.0
$3,000.0
$4,000.0
$5,000.0
$6,000.0
$7,000.0
FY2012 Actual FY2013 Actual FY2014 Actual FY2015 Adopted FY2016 Proposed
CPS Employee Compensation Appropriations as a Percentage of Total General Operating Fund Appropriations:
FY2012-FY2016 (in $ thousands)
Compensation Expenditures Other Expenditures
Source: CPS FY2016 Proposed Budget, Interactive Reports, Revenues & Expenditures, available at www.cps.edu (last visited August 12, 2015); CPS FY2015 Adopted Budget, Interactive Reports, Revenues & Expenditures, available at www.cps.edu (last visited August 12, 2015); Chicago Public Schools Comprehensive Annual Financial Report (CAFR) FY2014, pp. 69, 71 and 81; FY2013, pp. 81, 83 and 93; and FY2012 CAFR, pp. 76, 78 and 88..
$4,888.3 $4,946.3
$5,756.2$5,460.1
$5,687.7
Projected
2015
Actual
FY2015
Projected
FY2016 # Change % Change
400,545 396,683 394,191 (2,492) -0.63%
CPS Student Actual and Projected Enrollment:
FY2015 and FY2016
Source: CPS FY2016 Proposed Budget, p. 34.
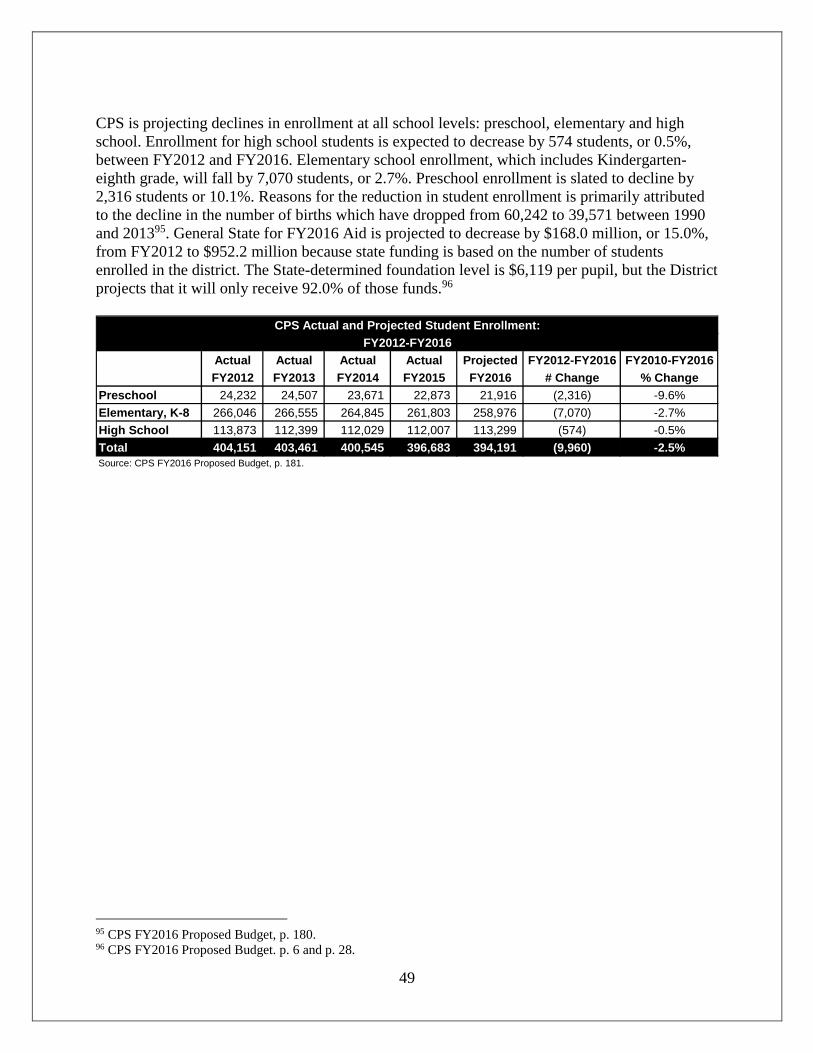
49
CPS is projecting declines in enrollment at all school levels: preschool, elementary and high
school. Enrollment for high school students is expected to decrease by 574 students, or 0.5%,
between FY2012 and FY2016. Elementary school enrollment, which includes Kindergarten-
eighth grade, will fall by 7,070 students, or 2.7%. Preschool enrollment is slated to decline by
2,316 students or 10.1%. Reasons for the reduction in student enrollment is primarily attributed
to the decline in the number of births which have dropped from 60,242 to 39,571 between 1990
and 201395. General State for FY2016 Aid is projected to decrease by $168.0 million, or 15.0%,
from FY2012 to $952.2 million because state funding is based on the number of students
enrolled in the district. The State-determined foundation level is $6,119 per pupil, but the District
projects that it will only receive 92.0% of those funds.96
95 CPS FY2016 Proposed Budget, p. 180. 96 CPS FY2016 Proposed Budget. p. 6 and p. 28.
Actual Actual Actual Actual Projected FY2012-FY2016 FY2010-FY2016
FY2012 FY2013 FY2014 FY2015 FY2016 # Change % Change
Preschool 24,232 24,507 23,671 22,873 21,916 (2,316) -9.6%
Elementary, K-8 266,046 266,555 264,845 261,803 258,976 (7,070) -2.7%
High School 113,873 112,399 112,029 112,007 113,299 (574) -0.5%
Total 404,151 403,461 400,545 396,683 394,191 (9,960) -2.5%
Source: CPS FY2016 Proposed Budget, p. 181.
CPS Actual and Projected Student Enrollment:
FY2012-FY2016
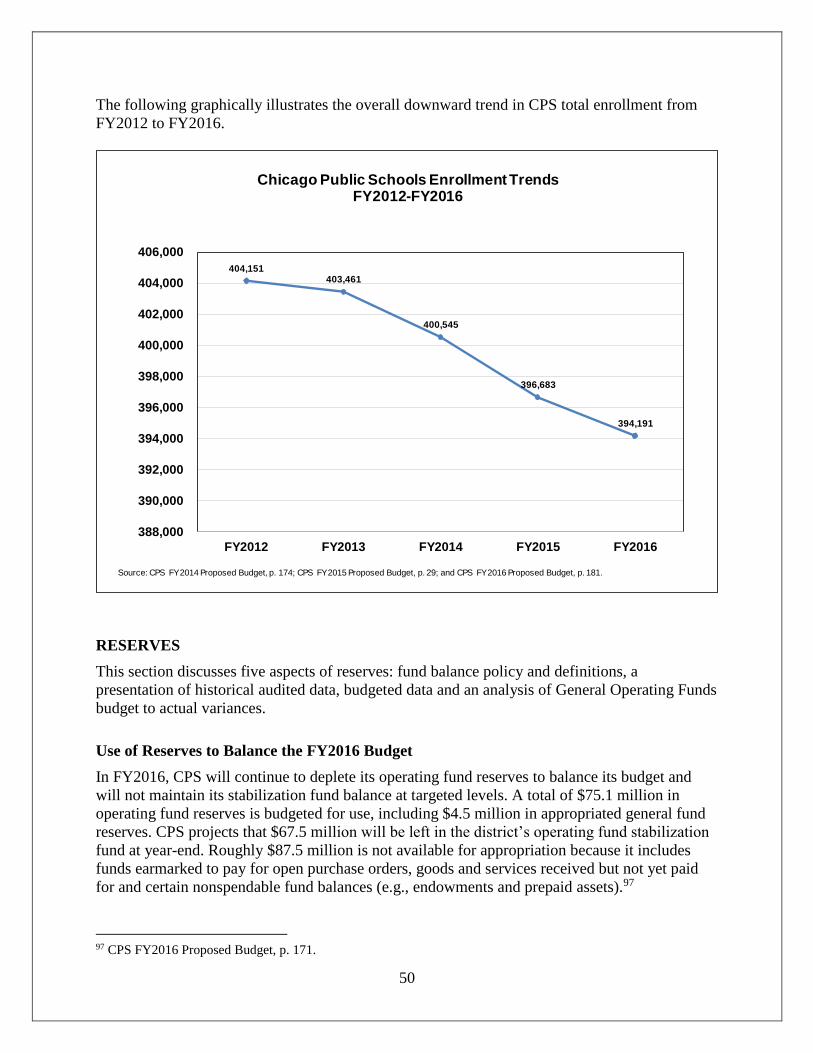
50
The following graphically illustrates the overall downward trend in CPS total enrollment from
FY2012 to FY2016.
RESERVES
This section discusses five aspects of reserves: fund balance policy and definitions, a
presentation of historical audited data, budgeted data and an analysis of General Operating Funds
budget to actual variances.
Use of Reserves to Balance the FY2016 Budget
In FY2016, CPS will continue to deplete its operating fund reserves to balance its budget and
will not maintain its stabilization fund balance at targeted levels. A total of $75.1 million in
operating fund reserves is budgeted for use, including $4.5 million in appropriated general fund
reserves. CPS projects that $67.5 million will be left in the district’s operating fund stabilization
fund at year-end. Roughly $87.5 million is not available for appropriation because it includes
funds earmarked to pay for open purchase orders, goods and services received but not yet paid
for and certain nonspendable fund balances (e.g., endowments and prepaid assets).97
97 CPS FY2016 Proposed Budget, p. 171.
404,151 403,461
400,545
396,683
394,191
388,000
390,000
392,000
394,000
396,000
398,000
400,000
402,000
404,000
406,000
FY2012 FY2013 FY2014 FY2015 FY2016
Chicago Public Schools Enrollment TrendsFY2012-FY2016
Source: CPS FY2014 Proposed Budget, p. 174; CPS FY2015 Proposed Budget, p. 29; and CPS FY2016 Proposed Budget, p. 181.

51
CPS also will use $47.6 million in its debt service stabilization fund to pay for debt service
expenses in FY2016, leaving just $9.5 million in the fund at the end of the fiscal year. CPS is
using Debt Service Fund reserves to pay for debt service because this maneuver will allow the
District to allocate State funding, which would otherwise have gone directly to pay for debt
service, to general operations.98 The District proposes to pay for capital expenditures using Debt
Service Fund fund balance on an interim basis. When available fund balance is used to the extent
possible, the District will use a $300.0 million line of credit established in FY2014. When the
District hits a threshold of $300.0 million in capital expenditures, it will sell fixed rate bonds, the
proceeds of which will be used to pay for interest incurred on the line of credit.99
Fund Balance Policy and Definitions
Fund balance is a term commonly used to describe the net assets of a governmental fund and
serves as a measure of budgetary reserves.100 Starting in FY2011, the audited financial
statements for CPS include a modification in fund balance reporting, as recommended by the
Governmental Accounting Standards Board (GASB). GASB Statement No. 54 shifts the focus of
fund balance reporting from the availability of fund resources for budgeting purposes to the
“extent to which the government is bound to honor constraints on the specific purposes for which
amounts in the fund can be spent.”101 Prior to GASB 54, the categories for fund balance focused
on whether resources were available for appropriation. The unreserved fund balance thus
referred to resources that did not have any external legal restrictions or constraints.102
The current method of measuring fund balance per GASB 54 examines unrestricted fund
balance. In accordance with GASB 54 modifications, the GFOA identifies unrestricted fund
balance as “only resources without a constraint on spending or for which the constraint on
98 CPS FY2015 Proposed Budget, p. 11 and 146. 99 CPS FY2015 Proposed Budget, p. 158. 100 Government Finance Officers Association, Appropriate Level of Unrestricted Fund Balance in the General Fund
(Adopted October 2009). 101 Steven Gauthier, “Fund Balance: New and Improved,” Government Finance Review, April 2009 and GASB
Statement No. 54, paragraph 5. 102 Steven Gauthier, “Fund Balance: New and Improved,” Government Finance Review, April 2009.
(in $ millions)FY2015
Estimated End of
Year Balance
FY2016
Budgeted Use
FY2016 End of
Year Balance
Appropriated General Fund Reserves -$ 4.5$ -$
General Fund for Stabilization 72.0$ -$ 67.5$
Workers' Comp/Tort Fund 29.2$ 9.5$ 19.7$
Supplemental GSA 48.3$ 39.7$ 8.6$
Other Special Revenue 26.1$ 21.4$ 4.7$
Not Available for Appropriations 87.5$ -$ 87.5$
Total Operating Fund Budgeted for Use 263.1$ 75.1$ 188.0$
Debt Service Stabilization Fund 57.1$ 47.6$ 9.5$
Source: CPS FY2016 Budget, pp. 172-173.
CPS FY2016 Use of Fund Balance

52
spending is imposed by the government itself.”103 These resources are the combined total
of committed fund balance, assigned fund balance and unassigned fund balance. The following
section provides details on the current components of fund balance.
Components of Fund Balance
GASB Statement No. 54 creates five components of fund balance, though not every government
or governmental fund will report all components. The five components are:
Nonspendable fund balance – resources that inherently cannot be spent such as pre-paid
rent or the long-term portion of loans receivable. In addition, this category includes
resources that cannot be spent because of legal or contractual provisions, such as the
principal of an endowment.
Restricted fund balance – net fund resources subject to legal restrictions that are
externally enforceable, including restrictions imposed by the constitution, creditors or
laws and regulations of non-local governments.
Committed fund balance – net fund resources with self-imposed limitations set at the
highest level of decision-making which remain binding unless removed by the same
action used to create the limitation.
Assigned fund balance – the portion of fund balance reflecting the government’s intended
use of resources, with the intent established by government committees or officials in
addition to the governing board. Appropriated fund balance, or the portion of existing
fund balance used to fill the gap between appropriations and estimated revenues for the
following year, would be categorized as assigned fund balance.
Unassigned fund balance – in the General Fund, the remaining surplus of net resources
after funds have been identified in the four categories above.104
GFOA Best Practices
The Government Finance Officers Association (GFOA) recommends “at a minimum, that
general-purpose governments, regardless of size, maintain unrestricted fund balance in their
general fund of no less than two months of regular general fund operating revenues or regular
general fund operating expenditures.”105 Two months of operating expenditures is approximately
17.0%. Chicago Public Schools is a special purpose government, not a general purpose
government, but its size and the relative instability of its revenue stream make it prudent for the
District to maintain adequate reserves. The GFOA statement adds that each unit of government
should adopt a formal policy that considers the unit’s own specific circumstances and that a
smaller fund balance ratio may be appropriate for the largest governments.106
103 Government Finance Officers Association, Appropriate Level of Unrestricted Fund Balance in the General Fund
(Adopted October 2009). 104 Steven Gauthier, “Fund Balance: New and Improved,” Government Finance Review, April 2009. 105 GFOA, Appropriate Level of Unrestricted Fund Balance in the General Fund (Adopted October 2009). 106 GFOA, Appropriate Level of Unrestricted Fund Balance in the General Fund (Adopted October 2009).
“Unrestricted fund balance” includes Committed, Assigned and Unassigned fund balances.

53
Audited Fund Balance Ratio: FY2004-FY2014
The exhibit below shows seven years of CPS General Operating Fund fund balance and its ratio
to General Operating Fund expenditures. A complete ten-year trend analysis of the District’s
fund balance ratio including the most recent FY2014 numbers is not possible because data for
FY2011 and beyond has been classified differently. Data after FY2011 reflect the
implementation of GASB 54, which changed the guidelines for how governments should report
fund balances.
Prior to FY2011, the District categorized its unreserved fund balance into designated to provide
operating capital and undesignated fund balance. A designation is a subset of the unreserved
balance where a limitation is placed on the use of the fund balance by the government itself for
planning purposes or to earmark funds.107 A designation is a loose classification and can be
changed by the government relatively easily. As such, when comparing unreserved fund balance
levels, we examine both designated and undesignated fund balance. Between FY2004 and
FY2010, the District’s unreserved fund balance fluctuated between 4.1% in FY2010 and 9.8% in
FY2007 and FY2008.108 In FY2009 and FY2010 the fund balance ratio decreased significantly
due to an increase in General Operating Fund expenditures and a drawdown of fund balance.
The following chart presents unrestricted fund balance for FY2011 through FY2014. In FY2014,
unrestricted fund balance fell to $354.7 million, or 6.5%, of general fund expenditures. This is
down sharply from the 16.6% ratio in FY2013 as reserves were used to balance the budget. The
increase in fund balance at the end of FY2012 was due primarily to timing shifts in property tax
107 Steven Gauthier, “Fund Balance: New and Improved,” Government Finance Review, April 2009. 108 The General Operating Fund and General Fund both refer to the CPS primary operating fund. The audit uses the
term General Operating Fund while the budget uses General Fund.
Unreserved General
Operating Fund
Balance
General Fund
Expenditures Ratio
FY2004 $ 196,510,000 $ 3,758,510,000 5.2%
FY2005 $ 248,546,000 $ 3,862,396,000 6.4%
FY2006 $ 307,720,000 $ 4,085,093,000 7.5%
FY2007 $ 404,843,000 $ 4,146,369,000 9.8%
FY2008 $ 432,391,000 $ 4,394,685,000 9.8%
FY2009 $ 311,422,000 $ 4,742,779,000 6.6%
FY2010 $ 198,461,000 $ 4,896,142,000 4.1%
Source: CPS FY2004-FY2010 Comprehensive Annual Financial Reports.
CPS Unreserved General Operating Fund
Fund Balance Ratio:
FY2004-FY2010
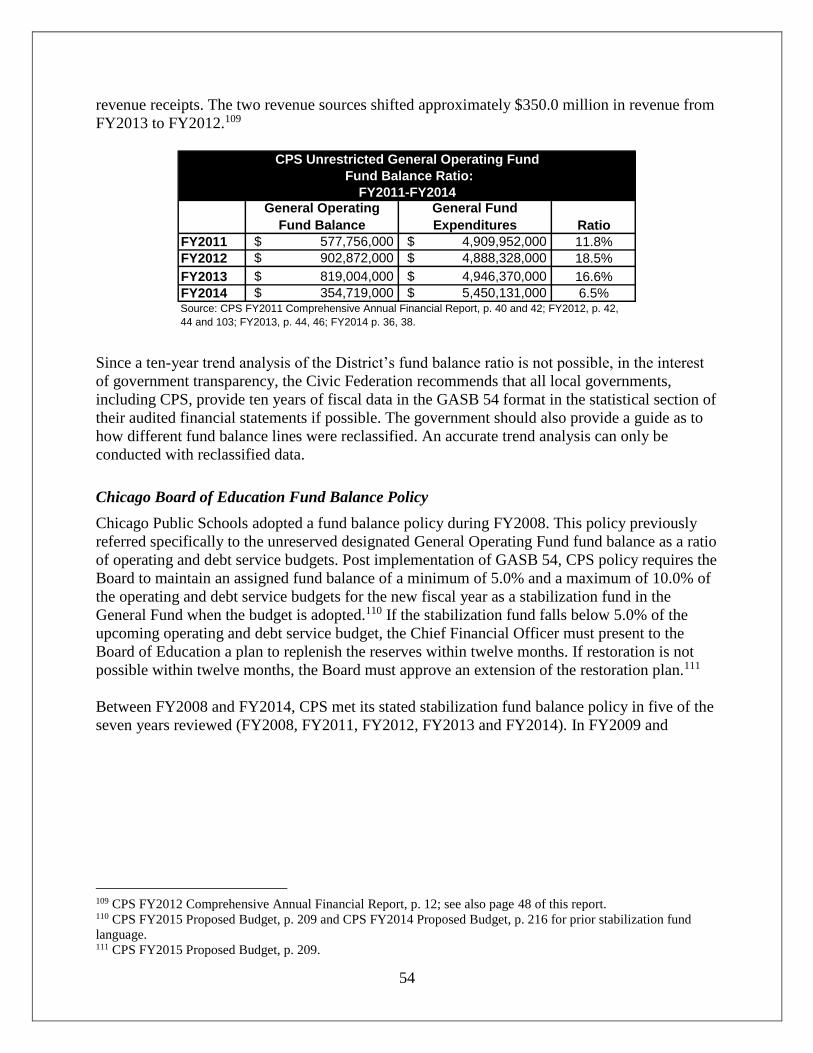
54
revenue receipts. The two revenue sources shifted approximately $350.0 million in revenue from
FY2013 to FY2012.109
Since a ten-year trend analysis of the District’s fund balance ratio is not possible, in the interest
of government transparency, the Civic Federation recommends that all local governments,
including CPS, provide ten years of fiscal data in the GASB 54 format in the statistical section of
their audited financial statements if possible. The government should also provide a guide as to
how different fund balance lines were reclassified. An accurate trend analysis can only be
conducted with reclassified data.
Chicago Board of Education Fund Balance Policy
Chicago Public Schools adopted a fund balance policy during FY2008. This policy previously
referred specifically to the unreserved designated General Operating Fund fund balance as a ratio
of operating and debt service budgets. Post implementation of GASB 54, CPS policy requires the
Board to maintain an assigned fund balance of a minimum of 5.0% and a maximum of 10.0% of
the operating and debt service budgets for the new fiscal year as a stabilization fund in the
General Fund when the budget is adopted.110 If the stabilization fund falls below 5.0% of the
upcoming operating and debt service budget, the Chief Financial Officer must present to the
Board of Education a plan to replenish the reserves within twelve months. If restoration is not
possible within twelve months, the Board must approve an extension of the restoration plan.111
Between FY2008 and FY2014, CPS met its stated stabilization fund balance policy in five of the
seven years reviewed (FY2008, FY2011, FY2012, FY2013 and FY2014). In FY2009 and
109 CPS FY2012 Comprehensive Annual Financial Report, p. 12; see also page 48 of this report. 110 CPS FY2015 Proposed Budget, p. 209 and CPS FY2014 Proposed Budget, p. 216 for prior stabilization fund
language. 111 CPS FY2015 Proposed Budget, p. 209.
General Operating
Fund Balance
General Fund
Expenditures Ratio
FY2011 $ 577,756,000 $ 4,909,952,000 11.8%
FY2012 $ 902,872,000 $ 4,888,328,000 18.5%
FY2013 $ 819,004,000 $ 4,946,370,000 16.6%
FY2014 $ 354,719,000 $ 5,450,131,000 6.5%
CPS Unrestricted General Operating Fund
FY2011-FY2014
Fund Balance Ratio:
Source: CPS FY2011 Comprehensive Annual Financial Report, p. 40 and 42; FY2012, p. 42,
44 and 103; FY2013, p. 44, 46; FY2014 p. 36, 38.

55
FY2010, CPS attributed the declines in the stabilization fund to a delay in payments from the
State of Illinois.
In FY2015 CPS changed its revenue recognition policy from 30 to 60 days to capture revenues
collected two months after the close of the fiscal year on June 30 (see discussion that follows).
As a result of this policy, CPS was able to access $648.0 million from reserves in FY2015 for
budgetary use. Most of these funds were used to balance the FY2015 budget; approximately
$72.0 million was left in the FY2016 stabilization fund. Roughly $4.5 million of the $72.0
million will be used to close the FY2016 budget gap, leaving just $67.5 million available for
General Fund stabilization purposes. The reserves in FY2015 and FY2016 are just 1.1% of
general operating and debt service fund budgets, well below the CPS fund balance policy
minimum target of 5%.112
112 CPS FY2016 Proposed Budget, pp. 171-172.
General Operating
Fund Balance
General Operating and
Debt Service
Expenditures Ratio
FY2008 $ 258,000,000 $ 4,655,123,000 5.5%
FY2009 $ 181,200,000 $ 5,043,948,000 3.6%
FY2010 $ - $ 5,280,029,000 0.0%
FY2011 $ 515,224,000 $ 5,242,049,000 9.8%
FY2012 $ 459,297,000 $ 5,262,822,000 8.7%
FY2013 $ 819,004,000 $ 5,336,779,000 15.3%
FY2014 $ 354,719,000 $ 5,918,035,000 6.0%
Source: CPS Comprehensive Annual Financial Reports, FY2008-FY2014.
FY2008-FY2014 (Audited)
CPS Unreserved, Designated/Assigned
General Operating Fund Fund Balance Ratio:
Note: CPS stated in its FY2013 and FY2014 Proposed Budgets that the stabilization fund is
equivalent to an "assigned" fund balance under GASB 54. Thus, the FY2011, FY2012, FY2013
and FY2014 fund balances are the sum of the assigned fund balances reported in their
respective Comprehensive Annual Financial Reports.
General Operating
Fund Balance
General Operating and
Debt Service
Expenditures Ratio
FY2015 $ 72,000,000 $ 6,360,100,000 1.1%
FY2016 $ 67,500,000 $ 6,226,300,000 1.1%
CPS Unreserved, Designated/Assigned
General Operating Fund Fund Balance Ratio:
FY2015-FY2016 (Budgeted)
Sources: CPS FY2016 Proposed Budget, p. 173 and CPS FY2016 Proposed Budget,
Interactive Reports, Revenues & Expenditures, available at www.cps.edu (last visited August
11, 2015).
56
Depletion of CPS Reserves
The CPS FY2014 budget anticipated using all available fund balance in the General Fund of
$562.7 million to balance the budget. However, the actual amount of unrestricted General Fund
reserves used in FY2014 was approximately $404.3 million. This was the result of much lower
than estimated expenditures in FY2014 that led to a smaller than anticipated end of year budget
deficit to close with fund balance.
Additional fund balance was available for appropriation in FY2015 because of two important
fiscal events.
First, CPS received additional property tax revenue during the July 1-July 30, 2013 period that
had to be counted as FY2013 revenue instead of FY2014 revenue because it was collected during
the 30-day revenue recognition period. CPS used this extra property tax revenue to reduce its
FY2013 year-end budget deficit. Along with other adjustments, this left only a $119.0 million
deficit at the end of FY2013 to be covered with fund balance. Because CPS did not decide to
reduce expected FY2014 revenues by the amount of extra property tax revenue and instead
decided to count on collecting the same amount in July of FY2014 as in July of FY2013, there
was a greater amount of fund balance at the end of FY2013 than had been expected. This meant
that there was additional fund balance left after covering the lower than expected FY2014 deficit
that was used to close the FY2015 deficit.113
Second, CPS changed its revenue recognition period. Before FY2015, the District’s revenue
recognition period, that is the amount of time after the end of the fiscal year on June 30 that
revenue received by CPS counts toward the previous fiscal year’s revenue rather than the current
fiscal year, was 30 days. So revenue received by the District between July 1, 2013 and July 30,
2013 counted as FY2013 revenue rather than FY2014 revenue even though it was technically
received after the start of FY2014. In order to generate additional revenue to use in FY2015 to
close its budget deficit, the District extended its revenue recognition period to a total of 60 days
in FY2015. This means that revenue received by CPS between July 1, 2015 and August 29, 2015
will count toward FY2015 instead of FY2016. According to CPS, due to the need to restate
FY2014 results when performing the FY2015 audit, the result of the FY2015 policy change was
a fund balance increase that created additional fund balance at the beginning of FY2014. This
flowed through to the end of FY2014 because it was not needed to close the FY2014 year-end
deficit. The additional fund balance generated by this 30-day extension of the revenue
recognition period was $648.0 million. Thus, total General Fund fund balance available at the
end of FY2014 was $915.6 million, or $648.0 million plus $267.6 million available for
appropriation.114
Other local governments and school districts have a 60-day revenue recognition policy and there
are some reasonable accounting reasons for CPS to change its policy. However, the
appropriation of significant portions of fund balance to maintain operating expenses is a serious
cause for concern. With the depletion of reserves, the use of fund balance will not be a viable
option for closing future budget gaps and indeed has contributed to the District’s FY2016 budget
113 CPS FY2013 Comprehensive Annual Financial Report, p. 38. 114 CPS FY2016 Proposed Budget, p. 172.

57
gap.115 Additionally, CPS cannot again extend its revenue recognition period to generate
significant amounts of one-time resources. This is because property tax bills are due August 1
and therefore little property tax revenue is received between August 30 and September 28.116
Use of Reserves to Balance CPS FY2015 Budget
To balance its FY2015 budget, CPS used a number of methods that relied heavily on a draw-
down of reserves:
First, CPS drew on $648.0 million in additional revenues available because of the change
in the revenue recognition period. Next, it drew on the General Fund unrestricted fund
balance at the end of FY2014 of $267.6 million. These two funding sources generated a
total of $915.6 million. Of that amount, $843.6 million was used to balance the FY2015
budget.
Also, approximately $22.8 million of reserve funds were used to increase reserves in the
workers’ compensation/tort fund, supplemental general state aid and other special
revenue funds.
In all, a total of $820.8 million in reserves was used to fund general operations.
General Operating Fund Budget to Actual Variances: FY2010-FY2014
A budget to actual variance report shows how closely a government’s actual revenues and
expenditures matched the originally appropriated amounts at year-end. There are two metrics
presented:
1) Variance: Final Appropriation to Actual - This indicates the difference between how
much was appropriated in revenues and expenditures in the final budget versus how
much was actually received in revenues and spent that year. It shows the extent to which
actual spending and revenues matched expectations.
2) Revenues in Excess of (Less Than) Expenditures – This indicates the difference
between (1) final appropriation revenues versus expenditures and (2) actual revenues
versus expenditures. A negative number indicates that revenues were insufficient to meet
expenditures and that expenditures were instead covered by other financing resources
115 CPS FY2015 Proposed Budget, p. 15. 116 Communication with CPS budget staff, July 16, 2014. Between August 30 and September 28, 2013, CPS
received $42,643,193 and $38,032,778.
Appropriated General Fund Reserves 843.6$
Workers' Comp/Tort Fund (9.4)$
Supplemental GSA (1.2)$
Other Special Revenue (12.2)$
Total 820.8$
Source: CPS FY2016 Budget, p. 172.
CPS FY2015 Use of Fund Balance

58
and/or fund balance. A positive number indicates that revenues were sufficient to meet
the fiscal year expenditures.
Pursuant to State statute,117 CPS must balance its budget annually, ensuring that expenditures are
paid for with available resources. The resources available to meet the District’s spending goals
include revenues from taxes, federal aid and state aid, as well as non-revenue sources such as
fund balance, short-term borrowing and transfers from other funds. If appropriated expenditures
exceed appropriated revenues, it indicates that the District expects to use fund balance or other
resources to cover the gap between revenues and expenditures. If the District does not use
resources such as fund balance to meet spending, it may close the gap by reducing its spending
from the original appropriated amount. While it may be possible for the District to annually
spend more than it receives in revenue for a few years, this is not a sustainable long-term practice
because it ultimately drains reserve funds and other resources.
The exhibit below shows the District’s General Operating Fund budget to actual variances
between FY2010 and FY2014. For each of the five years, the final appropriated expenditures
exceeded revenues, meaning that the District had budgeted some other resource such as fund
balance to make up the difference. In FY2011 and FY2012, the District was able to finish the
year with expenditures less than revenues—a positive outcome. Although the District spent less
than was originally appropriated, the FY2010, FY2013 and FY2014 revenue deficits were more
significant than cost savings, reflecting reductions in federal aid, reductions and slow payment of
State source revenues and the impact of slow economic growth on Personal Property
Replacement Tax receipts and investment returns.
In FY2010 actual revenues were $445.4 million, or 8.5%, less than appropriated. Despite
spending reductions, the District ended FY2010 having spent $106.4 million and $120.1 million
more, respectively, than it received in revenues. During those years, the District used non-
revenue resources, primarily fund balance, to meet expenditures. In effect, CPS drew down its
“savings account” or “rainy day” fund to pay for its current spending obligations. This strategy is
not sustainable in the long-term as fund balance is eventually depleted. In FY2011 a slight
increase in actual revenues and a significant cut in expenditures led to a positive variance of
$450.5 million. In FY2012 the District received revenue from property taxes and from the State
of Illinois earlier than anticipated, causing a bump in revenues recorded for the fiscal year such
that the District ended the year with $328.3 million more in revenue than expenditures. In
FY2013 a significant reduction of actual expenditures and some additional property tax revenues
becoming available during the revenue recognition period resulted in a decrease in the year-end
117 105 ILCS 5/34-43.

59
budget shortfall to $120.1 million from a projected $431.7 million. In FY2014, the change was
primarily the result of a $142.1 million reduction in actual expenditures.118
118 CPS FY2014 Comprehensive Annual Financial Report, pp. 30-32.
FY2010
Final
Appropriation
Year-end
Actual
Variance: Final
Appropriation to
Actual % Variance
Revenues 5,221,442$ 4,776,032$ (445,410)$ -8.5%
Expenditures 5,327,871$ 4,896,142$ (431,729)$ -8.1%
Revenues in Excess of or
(Less Than) Expenditures (106,429)$ (120,110)$ (13,681)$
FY2011
Final
Appropriation
Year-end
Actual
Variance: Final
Appropriation to
Actual % Variance
Revenues 5,038,085$ 5,115,887$ 77,802$ 1.5%
Expenditures 5,282,685$ 4,909,952$ (372,733)$ -7.1%
Revenues in Excess of or
(Less Than) Expenditures (244,600)$ 205,935$ 450,535$
FY2012
Final
Appropriation
Year-end
Actual
Variance: Final
Appropriation to
Actual % Variance
Revenues 4,869,110$ 5,216,640$ 347,530$ 7.1%
Expenditures 5,110,210$ 4,888,328$ (221,882)$ -4.3%
Revenues in Excess of or
(Less Than) Expenditures (241,100)$ 328,312$ 569,412$
FY2013
Final
Appropriation
Year-end
Actual
Variance: Final
Appropriation to
Actual % Variance
Revenues 4,800,480$ 4,826,320$ 25,840$ 0.5%
Expenditures 5,232,222$ 4,946,370$ (285,852)$ -5.5%
Revenues in Excess of or
(Less Than) Expenditures (431,742)$ (120,050)$ 311,692$
FY2014
Final
Appropriation
Year-end
Actual
Variance: Final
Appropriation to
Actual % Variance
Revenues 4,949,465$ 4,936,835$ (12,630)$ -0.3%
Expenditures 5,592,273$ 5,450,131$ (142,142)$ -2.5%
Revenues in Excess of or
(Less Than) Expenditures (642,808)$ (513,296)$ 129,512$
(in $ thousands)
Source: CPS Comprehensive Annual Financial Reports, Statements of Revenues, Expenditures by Object Other
Financing Sources and Net Changes in Fund Balances Final Appropriations vs. Actual - General Operating Fund, FY2010-
FY2014.
CPS Budget to Actual General Operating Fund Variances:
FY2010-FY2014
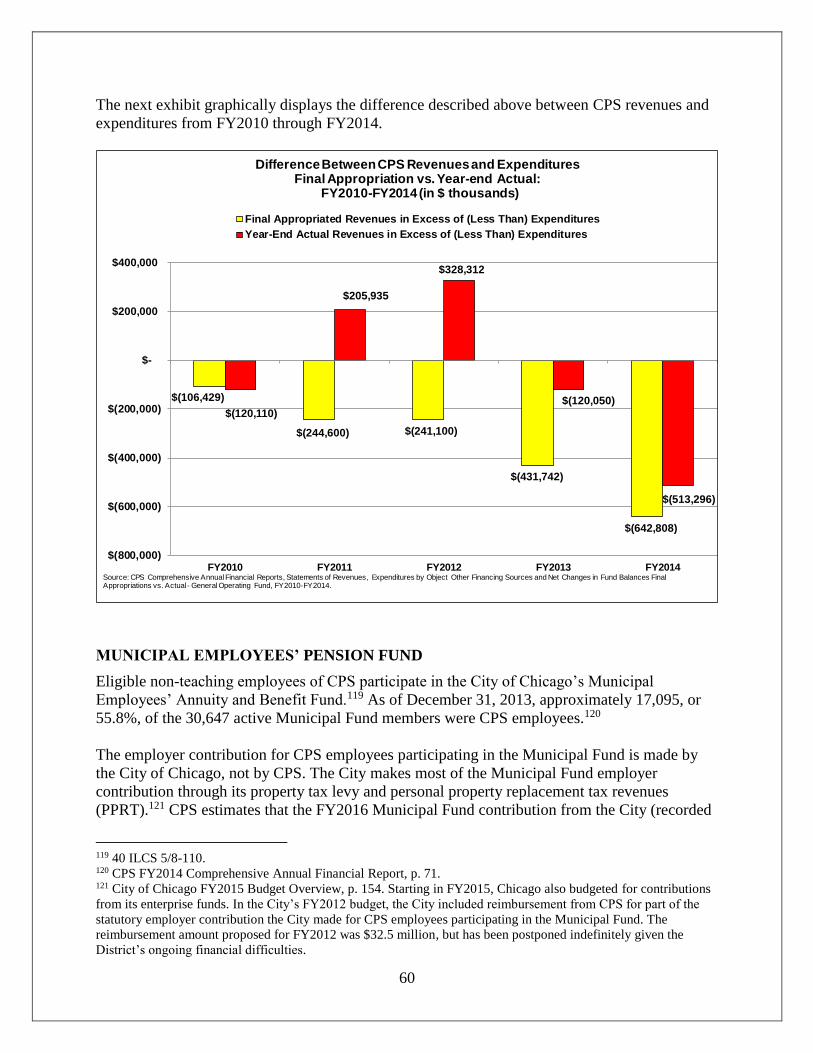
60
The next exhibit graphically displays the difference described above between CPS revenues and
expenditures from FY2010 through FY2014.
MUNICIPAL EMPLOYEES’ PENSION FUND
Eligible non-teaching employees of CPS participate in the City of Chicago’s Municipal
Employees’ Annuity and Benefit Fund.119 As of December 31, 2013, approximately 17,095, or
55.8%, of the 30,647 active Municipal Fund members were CPS employees.120
The employer contribution for CPS employees participating in the Municipal Fund is made by
the City of Chicago, not by CPS. The City makes most of the Municipal Fund employer
contribution through its property tax levy and personal property replacement tax revenues
(PPRT).121 CPS estimates that the FY2016 Municipal Fund contribution from the City (recorded
119 40 ILCS 5/8-110. 120 CPS FY2014 Comprehensive Annual Financial Report, p. 71. 121 City of Chicago FY2015 Budget Overview, p. 154. Starting in FY2015, Chicago also budgeted for contributions
from its enterprise funds. In the City’s FY2012 budget, the City included reimbursement from CPS for part of the
statutory employer contribution the City made for CPS employees participating in the Municipal Fund. The
reimbursement amount proposed for FY2012 was $32.5 million, but has been postponed indefinitely given the
District’s ongoing financial difficulties.
$(106,429)
$(244,600) $(241,100)
$(431,742)
$(642,808)
$(120,110)
$205,935
$328,312
$(120,050)
$(513,296)
$(800,000)
$(600,000)
$(400,000)
$(200,000)
$-
$200,000
$400,000
FY2010 FY2011 FY2012 FY2013 FY2014
Difference Between CPS Revenues and Expenditures Final Appropriation vs. Year-end Actual:
FY2010-FY2014 (in $ thousands)
Final Appropriated Revenues in Excess of (Less Than) Expenditures
Year-End Actual Revenues in Excess of (Less Than) Expenditures
Source: CPS Comprehensive Annual Financial Reports, Statements of Revenues, Expenditures by Object Other Financing Sources and Net Changes in Fund Balances Final Appropriations vs. Actual - General Operating Fund, FY2010-FY2014.

61
as revenue) will be approximately $55.0 million.122 CPS does make some contributions to the
Municipal Fund on behalf of its employees. CPS “picks up” 7 percentage points of the annual
non-teacher employee pension contribution of 9.0%. The District’s FY2016 cost for the 7.0%
employee pick-up is approximately $40.0 million and is part of the District’s budgeted pension
appropriation.123 The District additionally reimburses the City for the employer pick-up of
employees funded by federal grants; this reimbursement is budgeted at $4,663,175 in FY2016.124
The District announced in August 2015 that it would begin phasing out the “pickup” for non-
union employees starting in September 2015, requiring them to pay an additional 2.0% of their
salaries toward pensions, followed by another 2.0% and 3.0% in the following two years.125
On June 9, 2014, Governor Pat Quinn signed Public Act 98-0641, which made changes to
benefits and employer and employee contributions to the Chicago Municipal Fund. The
following table lists the major changes to benefits and employee contributions.
The provisions of Public Act 98-0641 impact non-teacher employees of CPS, increasing their
contributions toward the fund and affecting their automatic annual annuity increase once they
retire. This means that as of January 1, 2015, non-teachers’ contributions to the Municipal Fund
increased by 0.5% to 9.0% from the previous 8.5% level. Current non-teacher retirees were made
subject to the COLA “pause” and reductions to future annuity increases. However, since CPS
does not make the employer contribution to the Municipal Fund, it was not impacted by the
legislation’s employer funding provisions. These provisions instead increase the City of
Chicago’s contributions to the Municipal Fund over several years until the City is contributing at
a level that will increase the funding level to 90.0% over 40 years.
In December 2014, two lawsuits were filed in Cook County Circuit Court that challenge the
constitutionality of pension reforms for the Chicago Municipal and Laborers’ funds.126 On July
24, 2015, Circuit Court Judge Rita Novak issued her opinion striking down the reform legislation
122 CPS FY2016 Proposed Budget, p. 27. 123 CPS FY2016 Proposed Budget, p. 141. 124 CPS FY2016 Interactive Proposed Budget, Revenues and Expenditures, available at cps.edu/budget. 125 Juan Perez Jr., “CPS to cut nonunion pension pickups,” Chicago Tribune, August 13, 2015, p. 7. 126 Civic Federation, “Chicago Pension Reform Litigation on Hold Pending Illinois Supreme Court Ruling,”
February 25, 2015, https://www.civicfed.org/civic-federation/blog/chicago-pension-reform-litigation-hold-pending-
illinois-supreme-court-ruling.
Plan Components Current Funding Plan Reform Plan
COLA Rate (Tier 1) 3%
compounded3% compounded
3% or 50% of CPI (whichever is less);
simple interest
COLA pause years None 2017, 2019, 2025
COLA delaysVaries for Tier 1 & Tier 2 -
delayed until January 1 at least1 additional year delay for both Tiers
Retirement Age50-60 for Tier 1 depending on
years of service; 67 for Tier 2
No change for Tier 1; Reduced to 65 for
Tier 2
Employee Contributions 8.5% of payroll1/2% increases in 2015-2019 for total
increase of 2.5%; and total of 11%
Source: Public Act 98-0641
Summary of Chicago Municipal Fund Pension Benefit Changes Under Public Act 98-0641

62
as unconstitutional under the public pension protection clause of the Illinois Constitution.127 The
City of Chicago has announced its intention to appeal the case to the Illinois Supreme Court.128
The financial status of the Municipal Fund is examined in the Civic Federation’s annual analysis
of the City’s budget proposal and the Federation’s annual Status of Local Pension Funding
report.129 The next section focuses on the Chicago Teachers’ Pension Fund.
TEACHERS’ PENSION FUND
Certified CPS teachers are enrolled in the Public School Teachers’ Pension and Retirement Fund
of Chicago. The data presented below are for the Teachers’ Pension Fund only. The following
subsections include a plan description, membership data, benefits provided, employer and
employee contributions, future funding projections and pension fund indicators.
The fiscal year of the Teachers’ Pension Fund begins on July 1 and ends on June 30, as does the
fiscal year of CPS. The most recent data available are for FY2014, which ended on June 30,
2014.
Plan Description
The Public School Teachers’ Pension and Retirement Fund of Chicago is a cost-sharing
multiple-employer defined benefit pension plan created by the Illinois legislature in 1895 to
provide retirement, death and disability benefits for teachers and employees of the Fund.
Members include certified teachers at the Chicago Public Schools and charter schools.130 Plan
benefits and contributions can only be amended through state legislation.131
The fund is governed by a 12 member Board of Trustees. As prescribed in state statute, six
trustees are elected by the teacher members of the fund, three are elected by the annuitants, one
is elected by the principal and administrative members of the fund and two are appointed by the
Chicago Board of Education.
Members of the Chicago Teachers’ Pension Fund do not participate in the federal Social Security
system.132
127 Judge Novak’s opinion and order is available at http://chicagotonight.wttw.com/sites/default/files/article/file-
attachments/Chicago%20Pension%20Ruling.pdf. 128 Hal Dardick, “Judge finds city's changes to pension funds unconstitutional,” Chicago Tribune, July 24, 2015.
Available at http://www.chicagotribune.com/news/local/politics/ct-chicago-pension-ruling-met-20150724-
story.html. 129 All reports are available at civicfed.org. 130 Chicago Teachers’ Pension Fund, FY2014 Comprehensive Annual Financial Report, p. 27. 131 The Chicago Teachers’ Pension Fund statute is 40 ILCS 5/17, but the fund is also governed by other parts of the
pension code such as 40 ILCS 5/1-160, which defines the changes to benefits for new employees enacted in P.A. 96-
0889. 132 CPS did not participate in Medicare until 1986 but most CTPF members are now eligible for Medicare.
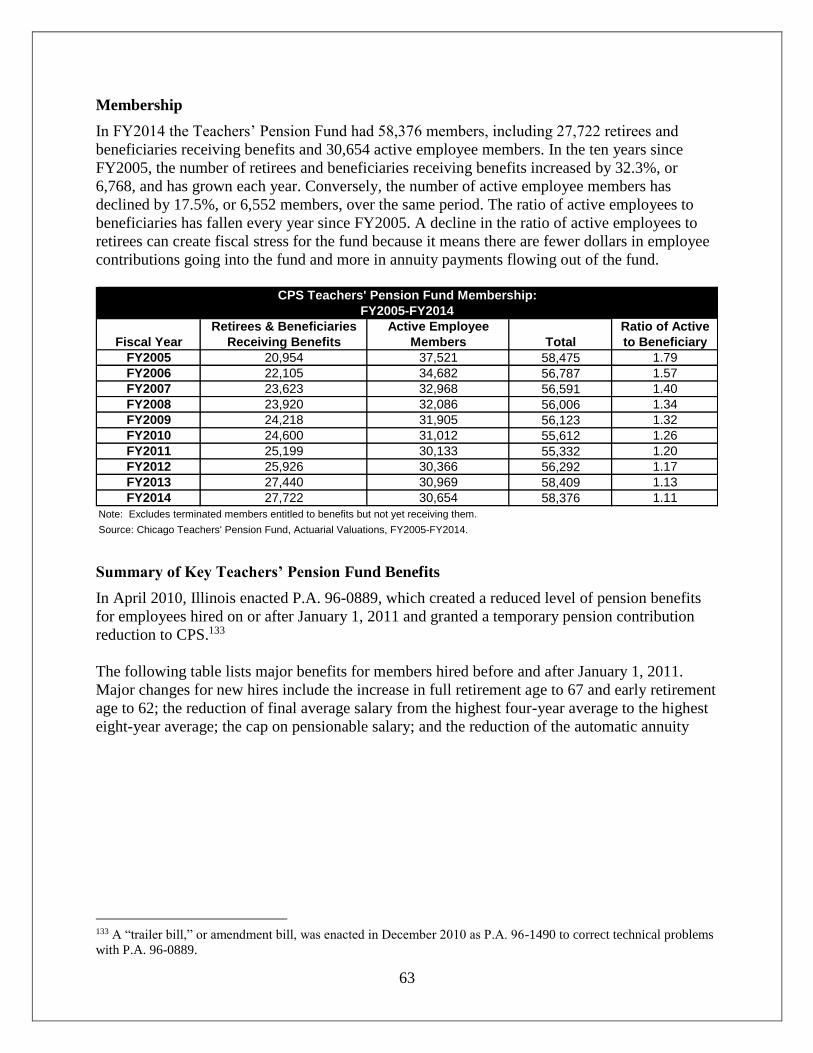
63
Membership
In FY2014 the Teachers’ Pension Fund had 58,376 members, including 27,722 retirees and
beneficiaries receiving benefits and 30,654 active employee members. In the ten years since
FY2005, the number of retirees and beneficiaries receiving benefits increased by 32.3%, or
6,768, and has grown each year. Conversely, the number of active employee members has
declined by 17.5%, or 6,552 members, over the same period. The ratio of active employees to
beneficiaries has fallen every year since FY2005. A decline in the ratio of active employees to
retirees can create fiscal stress for the fund because it means there are fewer dollars in employee
contributions going into the fund and more in annuity payments flowing out of the fund.
Summary of Key Teachers’ Pension Fund Benefits
In April 2010, Illinois enacted P.A. 96-0889, which created a reduced level of pension benefits
for employees hired on or after January 1, 2011 and granted a temporary pension contribution
reduction to CPS.133
The following table lists major benefits for members hired before and after January 1, 2011.
Major changes for new hires include the increase in full retirement age to 67 and early retirement
age to 62; the reduction of final average salary from the highest four-year average to the highest
eight-year average; the cap on pensionable salary; and the reduction of the automatic annuity
133 A “trailer bill,” or amendment bill, was enacted in December 2010 as P.A. 96-1490 to correct technical problems
with P.A. 96-0889.
Retirees & Beneficiaries Active Employee Ratio of Active
Receiving Benefits Members to Beneficiary
FY2005 20,954 37,521 58,475 1.79
FY2006 22,105 34,682 56,787 1.57
FY2007 23,623 32,968 56,591 1.40
FY2008 23,920 32,086 56,006 1.34
FY2009 24,218 31,905 56,123 1.32
FY2010 24,600 31,012 55,612 1.26
FY2011 25,199 30,133 55,332 1.20
FY2012 25,926 30,366 56,292 1.17
FY2013 27,440 30,969 58,409 1.13
FY2014 27,722 30,654 58,376 1.11
Note: Excludes terminated members entitled to benefits but not yet receiving them.
Source: Chicago Teachers' Pension Fund, Actuarial Valuations, FY2005-FY2014.
Fiscal Year Total
CPS Teachers' Pension Fund Membership:
FY2005-FY2014

64
increase from 3.0% compounded to the lesser of 3.0% or one half of the increase in Consumer
Price Index simple interest.
Pension Contributions
The Teachers’ Pension Fund is funded through a combination of State, CPS and employee
contributions as described below.
Employer Contributions
The State statutes governing the Chicago Teachers’ Pension Fund require employer contributions
when the fund falls below a 90.0% funded ratio. As described on the following pages, relatively
small amounts are required from the State and from CPS pursuant to benefit enhancements
enacted in P.A. 90-582. Much larger contributions are required by CPS pursuant to P.A. 89-0015
and P.A. 96-0889 in order to bring the fund up to a 90.0% funded ratio over a 50-year period.
State Employer Contribution: The State of Illinois had traditionally contributed roughly $65.0
million each year to the Teachers’ Fund pursuant to 40 ILCS 5/17-127, which declares the
General Assembly’s “goal and intention” to contribute an amount equivalent to 20.0% or 30.0%
of the contribution it makes to the downstate Teachers’ Retirement System.134 However, the
traditional $65.0 million contribution was actually much less than the 20.0% or 30.0% intention
stated in the statute. The State’s enacted FY2010 budget reduced the usual $65.0 million
134 The downstate Teachers’ Retirement System covers all public school teachers in Illinois except for those teaching
in Chicago Public Schools.
Employees Employees
hired before 1/1/2011 hired on or after 1/1/2011
Full Retirement Eligibility: Age
& Service
age 55 with 34 years of service; age 60
with 20 years of service; age 62 with 5
years of service
age 67 with 10 years of service
Early Retirement Eligibility:
Age & Serviceage 55 with 20 years of service age 62 with 10 years of service
Final Average Salary
highest average monthly salary for any 48
consecutive months within the last 10
years of service
highest average monthly salary for any 96
consecutive months within the last 10
years of service; pensionable salary
capped at $109,971*
Annuity Formula
Early Retirement Formula
Reduction0.5% per month under age 60 0.5% per month under age 67
Maximum Annuity
Annual Automatic COLA on
Retiree or Surviving Spouse
Annuity
3% compounded; begins at anniversary
date of retirement or 61st birthday,
whichever is later
lesser of 3% or one-half of the annual
increase in CPI-U, not compounded;
begins at the later of age 67 or the first
anniversary of retirement
Major Chicago Teachers' Pension Fund Benefit Provisions
*The maximum pensionable salary automatically increases by the lesser of 3% or one-half of the annual increase in the CPI-U. $110,631 is the 2014
limitation per the Illinois Department of Insurance.
Note: New hires are prohibited from simultaneously receiving a salary and a pension from any public employers covered by the State Pension Code
(i.e. "double-dipping").
Sources: Public School Teachers' Pension and Retirement Fund of Chicago, Statutorily Required Funding Valuation as of June 30, 2014, p. 30-33;
40 ILCS 5/9; Public Act 96-0889; and Public Act 96-1490.
2.2% of final average salary for each year of service**
** For service prior to 1998 there are different formulas for different amounts of service.
75% of final average salary

65
appropriation by 50.0% to $32.5 million.135 For FY2011 the State appropriated $32.5 million for
the Teachers’ Fund, but designated it specifically for retiree healthcare costs paid out of the fund,
so the amount is not considered part of the employer contribution in the calculation shown
below.136 There was no State contribution other than the statutory state contribution described
below in FY2012, FY2013, and FY2014.137 The State of Illinois’ FY2015 budget included a
$50.0 million contribution to the Chicago Teachers’ Pension Fund that is in addition to the
statutory contribution described below. This reduced the amount CPS must contribute to the fund
by $50.0 million.138 The FY2016 State of Illinois K-12 education budget, signed into law by
Governor Rauner on June 24, 2015, did not include any contribution to Chicago teachers’
pensions other than the statutory contribution.
Additional State Contribution: The State is required to make additional contributions in
FY2015 of 0.544% of teacher payroll to the Teachers’ Fund to offset a portion of the cost of
benefit increases enacted under Public Act 90-0582. No additional contributions are required if
the funded ratio is at least 90.0%. The required additional State contribution in FY2016 is
projected at $12.1 million, level with FY2015.139
Additional CPS Contribution: CPS must make additional contributions of 0.58% of teacher
payroll to offset a portion of the cost of benefit increases enacted under Public Act 90-0582. No
additional contributions are required if the funded ratio is at least 90.0%. The required additional
contribution in FY2016 is projected at $12.9 million, level with FY2015.140
CPS Required Contribution: Under the funding plan established by P.A. 89-15, the minimum
contribution to the Teachers’ Pension Fund was previously an amount needed to bring the total
assets of the fund up to 90.0% of the total actuarial liabilities by the end of FY2045. The required
CPS contribution was calculated as a level percentage of payroll over the years through FY2045.
The calculation for determining the CPS required contribution was the total amount of the
employer contribution less additional state appropriations, additional CPS appropriations and
other employer appropriations.141 The funding schedule established in P.A. 89-0015 was changed
by P.A. 96-0889, enacted in April 2010. The new law reduced CPS’s required employer pension
contribution for FY2011, FY2012 and FY2013 to an amount estimated to be equivalent to the
employer’s normal cost.142 It also delayed the year that the pension fund must reach a 90.0%
funded ratio from 2045 to the end of 2059.
Prior to the passage of P.A. 96-0889, the CPS required contribution for FY2011 was calculated
to be $586.9 million, or almost double the FY2010 amount. P.A. 96-0889 reduced CPS’s
required FY2011 contribution to $187.0 million, which was approximately $158.0 million, or
135 Illinois State FY2011 Budget, pp. 5-8. 136 Information provided by the CPS budget office, August 17, 2010. 137 Chicago Public Schools FY2015 Proposed Budget, p. 147. 138 Chicago Public Schools FY2015 Proposed Budget, p. 147. 139 Chicago Teachers’ Pension Fund Comprehensive Annual Financial Report, FY2014, p. 91 and FY2013, p. 84. 140 Chicago Teachers’ Pension Fund Comprehensive Annual Financial Report, FY2014, p. 91 and FY2013, p. 84. 141 This annual required contribution must be calculated by February 28 each year, per 40 ILCS 5/17-129. 142 “Normal cost” is an actuarially calculated amount representing that portion of the present value of the pension
plan benefits and administrative expenses which is allocated to a given valuation year.
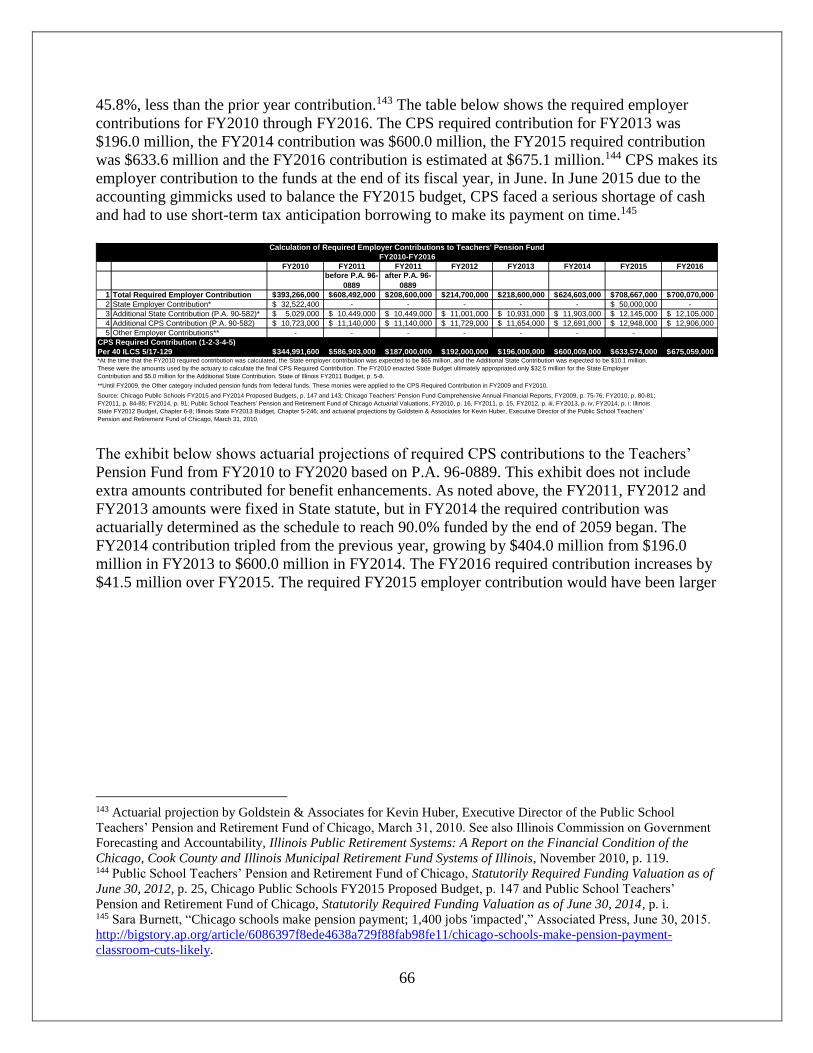
66
45.8%, less than the prior year contribution.143 The table below shows the required employer
contributions for FY2010 through FY2016. The CPS required contribution for FY2013 was
$196.0 million, the FY2014 contribution was $600.0 million, the FY2015 required contribution
was $633.6 million and the FY2016 contribution is estimated at $675.1 million.144 CPS makes its
employer contribution to the funds at the end of its fiscal year, in June. In June 2015 due to the
accounting gimmicks used to balance the FY2015 budget, CPS faced a serious shortage of cash
and had to use short-term tax anticipation borrowing to make its payment on time.145
The exhibit below shows actuarial projections of required CPS contributions to the Teachers’
Pension Fund from FY2010 to FY2020 based on P.A. 96-0889. This exhibit does not include
extra amounts contributed for benefit enhancements. As noted above, the FY2011, FY2012 and
FY2013 amounts were fixed in State statute, but in FY2014 the required contribution was
actuarially determined as the schedule to reach 90.0% funded by the end of 2059 began. The
FY2014 contribution tripled from the previous year, growing by $404.0 million from $196.0
million in FY2013 to $600.0 million in FY2014. The FY2016 required contribution increases by
$41.5 million over FY2015. The required FY2015 employer contribution would have been larger
143 Actuarial projection by Goldstein & Associates for Kevin Huber, Executive Director of the Public School
Teachers’ Pension and Retirement Fund of Chicago, March 31, 2010. See also Illinois Commission on Government
Forecasting and Accountability, Illinois Public Retirement Systems: A Report on the Financial Condition of the
Chicago, Cook County and Illinois Municipal Retirement Fund Systems of Illinois, November 2010, p. 119. 144 Public School Teachers’ Pension and Retirement Fund of Chicago, Statutorily Required Funding Valuation as of
June 30, 2012, p. 25, Chicago Public Schools FY2015 Proposed Budget, p. 147 and Public School Teachers’
Pension and Retirement Fund of Chicago, Statutorily Required Funding Valuation as of June 30, 2014, p. i. 145 Sara Burnett, “Chicago schools make pension payment; 1,400 jobs 'impacted',” Associated Press, June 30, 2015.
http://bigstory.ap.org/article/6086397f8ede4638a729f88fab98fe11/chicago-schools-make-pension-payment-
classroom-cuts-likely.
FY2010 FY2011 FY2011 FY2012 FY2013 FY2014 FY2015 FY2016
1 Total Required Employer Contribution 393,266,000$ 608,492,000$ 208,600,000$ 214,700,000$ 218,600,000$ 624,603,000$ 708,667,000$ 700,070,000$
2 State Employer Contribution* 32,522,400$ - - - - - 50,000,000$ -
3 Additional State Contribution (P.A. 90-582)* 5,029,000$ 10,449,000$ 10,449,000$ 11,001,000$ 10,931,000$ 11,903,000$ 12,145,000$ 12,105,000$
4 Additional CPS Contribution (P.A. 90-582) 10,723,000$ 11,140,000$ 11,140,000$ 11,729,000$ 11,654,000$ 12,691,000$ 12,948,000$ 12,906,000$
5 Other Employer Contributions** - - - - - - -
CPS Required Contribution (1-2-3-4-5)
Per 40 ILCS 5/17-129 344,991,600$ 586,903,000$ 187,000,000$ 192,000,000$ 196,000,000$ 600,009,000$ 633,574,000$ 675,059,000$ *At the time that the FY2010 required contribution was calculated, the State employer contribution was expected to be $65 million, and the Additional State Contribution was expected to be $10.1 million.
These were the amounts used by the actuary to calculate the final CPS Required Contribution. The FY2010 enacted State Budget ultimately appropriated only $32.5 million for the State Employer
Contribution and $5.0 million for the Additional State Contribution. State of Illinois FY2011 Budget, p. 5-8.
**Until FY2009, the Other category included pension funds from federal funds. These monies were applied to the CPS Required Contribution in FY2009 and FY2010.
Source: Chicago Public Schools FY2015 and FY2014 Proposed Budgets, p. 147 and 143; Chicago Teachers' Pension Fund Comprehensive Annual Financial Reports, FY2009, p. 75-76; FY2010, p. 80-81;
FY2011, p. 84-85; FY2014, p. 91; Public School Teachers' Pension and Retirement Fund of Chicago Actuarial Valuations, FY2010, p. 16, FY2011, p. 15, FY2012, p. iii, FY2013, p. iv, FY2014, p. i; Illinois
State FY2012 Budget, Chapter 6-8; Illinois State FY2013 Budget, Chapter 5-246; and actuarial projections by Goldstein & Associates for Kevin Huber, Executive Director of the Public School Teachers'
Pension and Retirement Fund of Chicago, March 31, 2010.
before P.A. 96-
0889
after P.A. 96-
0889
Calculation of Required Employer Contributions to Teachers' Pension Fund
FY2010-FY2016

67
if the State of Illinois had not appropriated $50.0 million in additional funding for the Chicago
Teachers’ Pension Fund. This extra funding was not appropriated for FY2016.
Employee Contributions
Employee contributions to the Teachers’ Pension Fund are statutorily set at 9.0% of the
employee’s salary. One percent of that 9% amount is for survivors’ and children’s pension
benefits.
CPS “picks up” 7.0% of the 9.0% annual employee pension contribution, meaning it pays seven
percentage points of the employee 9.0% contribution on behalf of teachers. Therefore, teachers
effectively pay 2.0% of their annual salary toward their pensions. The District’s FY2016 cost for
the 7.0% employee pick-up is approximately $131.0 million and is part of the District’s budgeted
pension appropriation.146 CPS administration has said that they would like to phase out the
pickup as part of a pending contract still being negotiated with the Chicago Teachers Union
(CTU). The CTU has called the end of the pickup a pay cut and a possible cause for a strike, but
has not completely ruled out phasing out the pickup.147
146 CPS FY2016 Proposed Budget, p. 141. CPS also “picks up” 7% of employee contributions to the Chicago
Municipal Fund for eligible non-teacher employees at a projected cost of $40 million in FY2016. 147 Lauren Fitzpatrick and Fran Spielman, “Emanuel to ask CTU to phase out 7 percent pension pickup,” Chicago
Sun-Times, August 13, 2015, p. 10.
$345.0
$187.0 $192.0 $196.0
$600.0
$633.6
$675.1 $694.9
$715.2 $736.2
$757.8
$0.0
$100.0
$200.0
$300.0
$400.0
$500.0
$600.0
$700.0
$800.0
FY2010 FY2011 FY2012 FY2013 FY2014 FY2015 FY2016 FY2017 FY2018 FY2019 FY2020
CPS Required Contributions to Teachers' Pension Fund Per P.A. 96-0889: FY2010-FY2020 (in $ millions)
Source: Chicago Public Schools FY2015 Proposed Budget, p. 147; Public School Teachers' Pension and Retirement Fund of Chicago, Statutorily Required Funding Valuation as of June 30, 2014, p. 24; Actuarial Valuation as of June 30, 2012, p. 25; Actuarial Valuation as of June 30, 2011, p. 16; Actuarial Valuation as of June 30, 2011, p. 15; and Public Act 96-
0889.

68
Pension Fund Indicators
The Civic Federation uses three measures to present a multi-year evaluation of the fiscal health
of the Teachers’ pension fund: funded ratios, unfunded actuarial accrued liabilities (UAAL) and
the investment rate of return.
Funded Ratios
This report uses two measurements of pension plan funded ratio: the actuarial value of assets
measurement and the market value of assets measurement. These ratios show the percentage of
pension liabilities covered by assets. The lower the percentage, the more difficulty a government
may have in meeting future obligations.
The actuarial value of assets measurement presents the ratio of assets to liabilities and accounts
for assets by recognizing unexpected gains and losses over a period of three to five years.148 The
market value of assets measurement presents the ratio of assets to liabilities by recognizing
investments only at current market value. Market value funded ratios are more volatile than
actuarial funded ratios due to the smoothing effect of actuarial value. However, market value
funded ratios represent how much money is actually available at the time of measurement to
cover actuarial accrued liabilities.
The following exhibit shows the actuarial and market value funded ratios for the Teachers’
Pension Fund over the last ten years. The fund was 79.0% funded on an actuarial value basis in
FY2005, and this funded ratio fell to 49.7% in FY2013 before rising in FY2014 to 51.7%. The
market value funded ratio fell from 81.7% in FY2005 to 53.7% in FY2009 and recovered to
61.1% in FY2011 before falling again to 51.0% in FY2013 and rising to 55.6% in FY2014. The
sizeable difference between the FY2009 and FY2010 market value and actuarial value funded
ratios is due to the fact that FY2009 investment returns were much lower than the returns
smoothed out over four years. In FY2014 the market value funded ratio is higher in part because
it fully incorporates high investment returns in FY2014, while the actuarial value smoothes
higher than expected returns over the four years.
The CTPF Board of Trustees voted to lower the Teachers’ fund expected rate of return for
FY2013 onward. There were additional changes made to the actuarial assumptions for the
FY2013 financial statements that also impacted the funded status of CTPF. 149 The actuarial
assumption changes increased the actuarial accrued liability (AAL) or the projected benefit
obligation due to past service by employees and retirees—the denominator of the funded ratio
calculation—and therefore decreased the funded ratio as compared to what the ratio would have
been if the actuarial changes had not been made. According to data provided by the fund’s
148 For more detail on the actuarial value of assets, see Civic Federation, Status of Local Pension Funding FY2012,
October 2, 2014, https://www.civicfed.org/sites/default/files/StatusOfLocalPensionFundingFY2012.pdf The
Chicago Teachers’ Pension Fund smoothes returns over four years. 149 The actuarial assumption changes also included a decrease in the inflation assumption, a decrease in the expected
payroll growth rate and some changes to mortality assumptions, in addition to the change to expected rate of return
on investments.
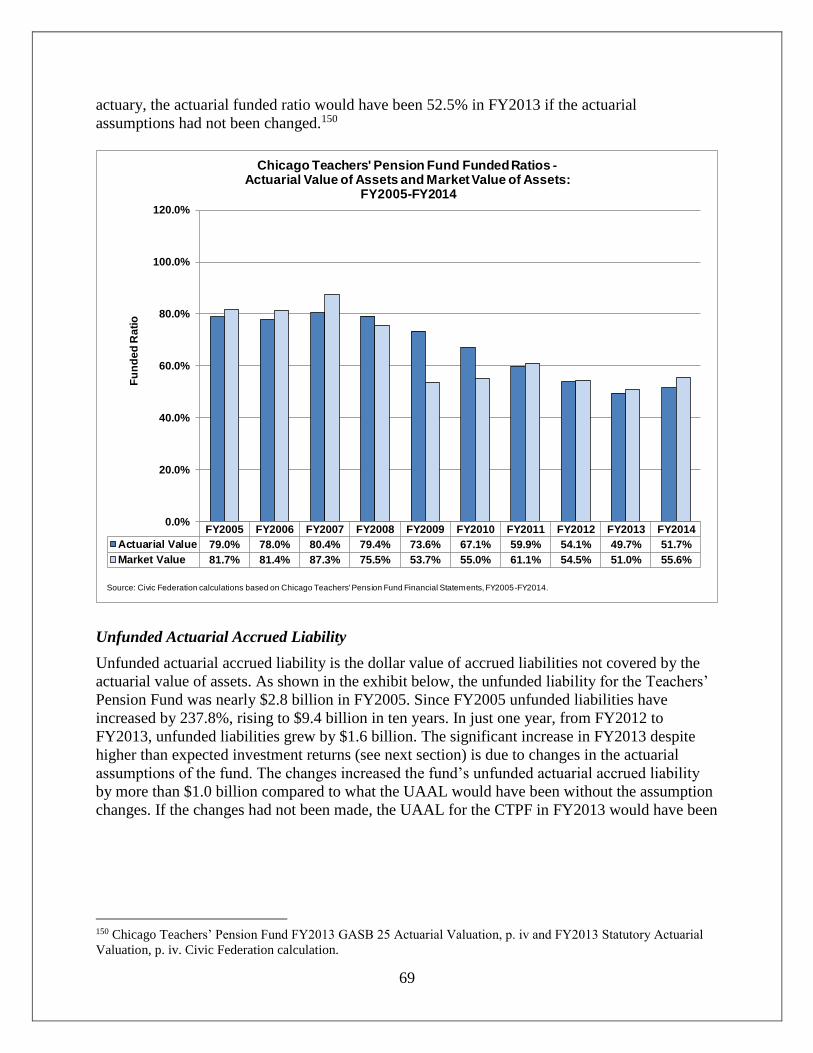
69
actuary, the actuarial funded ratio would have been 52.5% in FY2013 if the actuarial
assumptions had not been changed.150
Unfunded Actuarial Accrued Liability
Unfunded actuarial accrued liability is the dollar value of accrued liabilities not covered by the
actuarial value of assets. As shown in the exhibit below, the unfunded liability for the Teachers’
Pension Fund was nearly $2.8 billion in FY2005. Since FY2005 unfunded liabilities have
increased by 237.8%, rising to $9.4 billion in ten years. In just one year, from FY2012 to
FY2013, unfunded liabilities grew by $1.6 billion. The significant increase in FY2013 despite
higher than expected investment returns (see next section) is due to changes in the actuarial
assumptions of the fund. The changes increased the fund’s unfunded actuarial accrued liability
by more than $1.0 billion compared to what the UAAL would have been without the assumption
changes. If the changes had not been made, the UAAL for the CTPF in FY2013 would have been
150 Chicago Teachers’ Pension Fund FY2013 GASB 25 Actuarial Valuation, p. iv and FY2013 Statutory Actuarial
Valuation, p. iv. Civic Federation calculation.
FY2005 FY2006 FY2007 FY2008 FY2009 FY2010 FY2011 FY2012 FY2013 FY2014
Actuarial Value 79.0% 78.0% 80.4% 79.4% 73.6% 67.1% 59.9% 54.1% 49.7% 51.7%
Market Value 81.7% 81.4% 87.3% 75.5% 53.7% 55.0% 61.1% 54.5% 51.0% 55.6%
0.0%
20.0%
40.0%
60.0%
80.0%
100.0%
120.0%
Fu
nd
ed
Ra
tio
Chicago Teachers' Pension Fund Funded Ratios -Actuarial Value of Assets and Market Value of Assets:
FY2005-FY2014
Source: Civic Federation calculations based on Chicago Teachers' Pension Fund Financial Statements, FY2005-FY2014.

70
nearly $8.6 billion.151 The UAAL fell in FY2014 from FY2013, mostly due to high investment
returns.152
A breakdown of the causes of the change in unfunded liability each year is available in the
annual actuarial valuations of the fund. The table below summarizes the changes as calculated by
the fund actuary from FY2005 to FY2014. The single largest contributor to the increase in
unfunded liability is the consistent failure of the employer contribution to be sufficient to cover
the employer’s normal cost for service earned that year, as well as the interest accrued on the
existing unfunded liability.153 This deficiency in employer contributions added $3.1 billion to the
unfunded liability between FY2005 and FY2014.
The second largest contributor to the unfunded liability over the past 10 years is a shortfall in
investment returns compared to expectations. The fund’s annual actuarial valuation smoothes the
investment gains and losses over a period of four years, such that even if a single year’s market
rate of return exceeds the assumption, the four-year smoothed return may not. This was the case
151 Chicago Teachers’ Pension Fund FY2013 GASB 25 Actuarial Valuation, p. iv and FY2013 Statutory Actuarial
Valuation, p. iv. Civic Federation calculation. 152 Public School Teachers’ Pension and Retirement Fund of Chicago Statutorily Required Funding Valuation as of
June 30, 2014, p. 15. 153 Total increase in unfunded liability includes increase in FY2005 over FY2004, included in the first line of the
chart below.
$2,789.4 $3,087.6 $2,917.5
$3,134.1
$4,140.3
$5,367.5
$6,800.0
$7,977.5
$9,586.2 $9,422.4
$-
$2,000
$4,000
$6,000
$8,000
$10,000
$12,000
FY2005 FY2006 FY2007 FY2008 FY2009 FY2010 FY2011 FY2012 FY2013 FY2014
Millio
ns
Chicago Teachers' Pension Fund Unfunded Actuarial Accrued Liability:FY2005-FY2014(in $ millions)
Source: Chicago Teachers' Pension Fund Financial Statements, FY2005-FY2014.
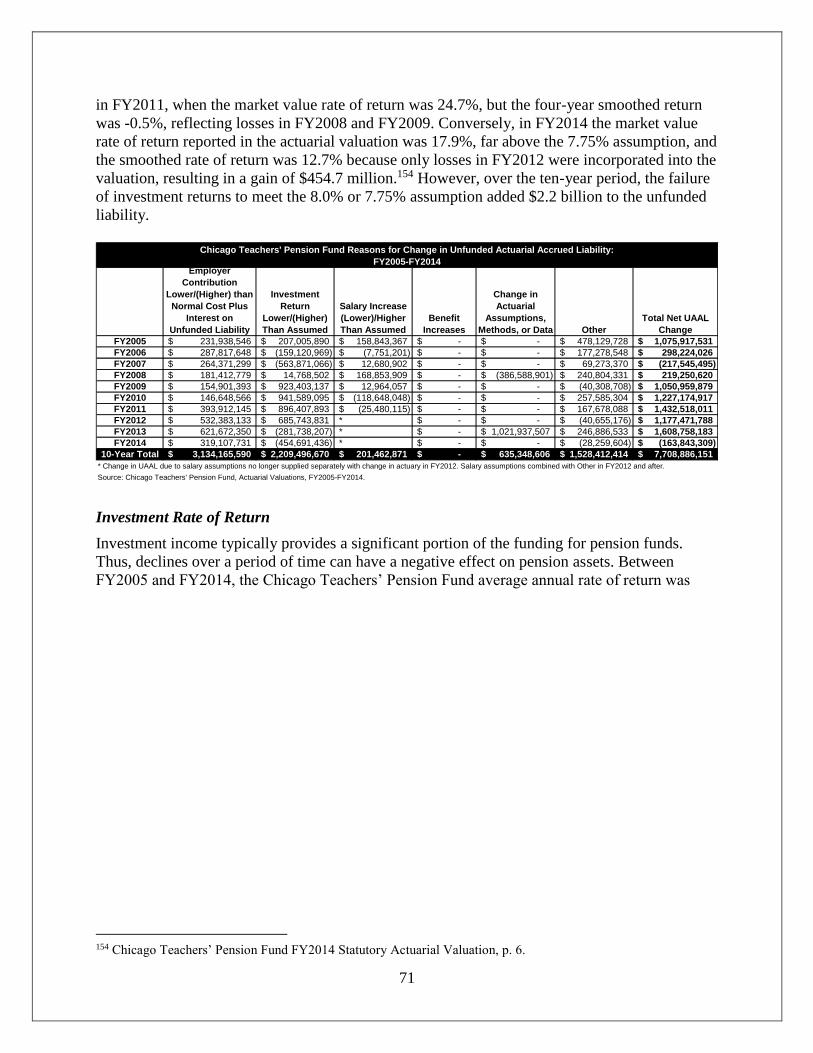
71
in FY2011, when the market value rate of return was 24.7%, but the four-year smoothed return
was -0.5%, reflecting losses in FY2008 and FY2009. Conversely, in FY2014 the market value
rate of return reported in the actuarial valuation was 17.9%, far above the 7.75% assumption, and
the smoothed rate of return was 12.7% because only losses in FY2012 were incorporated into the
valuation, resulting in a gain of $454.7 million.154 However, over the ten-year period, the failure
of investment returns to meet the 8.0% or 7.75% assumption added $2.2 billion to the unfunded
liability.
Investment Rate of Return
Investment income typically provides a significant portion of the funding for pension funds.
Thus, declines over a period of time can have a negative effect on pension assets. Between
FY2005 and FY2014, the Chicago Teachers’ Pension Fund average annual rate of return was
154 Chicago Teachers’ Pension Fund FY2014 Statutory Actuarial Valuation, p. 6.
Employer
Contribution
Lower/(Higher) than
Normal Cost Plus
Interest on
Unfunded Liability
Investment
Return
Lower/(Higher)
Than Assumed
Salary Increase
(Lower)/Higher
Than Assumed
Benefit
Increases
Change in
Actuarial
Assumptions,
Methods, or Data Other
Total Net UAAL
Change
FY2005 231,938,546$ 207,005,890$ 158,843,367$ -$ -$ 478,129,728$ 1,075,917,531$
FY2006 287,817,648$ (159,120,969)$ (7,751,201)$ -$ -$ 177,278,548$ 298,224,026$
FY2007 264,371,299$ (563,871,066)$ 12,680,902$ -$ -$ 69,273,370$ (217,545,495)$
FY2008 181,412,779$ 14,768,502$ 168,853,909$ -$ (386,588,901)$ 240,804,331$ 219,250,620$
FY2009 154,901,393$ 923,403,137$ 12,964,057$ -$ -$ (40,308,708)$ 1,050,959,879$
FY2010 146,648,566$ 941,589,095$ (118,648,048)$ -$ -$ 257,585,304$ 1,227,174,917$
FY2011 393,912,145$ 896,407,893$ (25,480,115)$ -$ -$ 167,678,088$ 1,432,518,011$
FY2012 532,383,133$ 685,743,831$ * -$ -$ (40,655,176)$ 1,177,471,788$
FY2013 621,672,350$ (281,738,207)$ * -$ 1,021,937,507$ 246,886,533$ 1,608,758,183$
FY2014 319,107,731$ (454,691,436)$ * -$ -$ (28,259,604)$ (163,843,309)$
10-Year Total 3,134,165,590$ 2,209,496,670$ 201,462,871$ -$ 635,348,606$ 1,528,412,414$ 7,708,886,151$
* Change in UAAL due to salary assumptions no longer supplied separately with change in actuary in FY2012. Salary assumptions combined with Other in FY2012 and after.
Chicago Teachers' Pension Fund Reasons for Change in Unfunded Actuarial Accrued Liability:
FY2005-FY2014
Source: Chicago Teachers' Pension Fund, Actuarial Valuations, FY2005-FY2014.

72
8.3%.155 This is above the fund’s assumed rate of return of 7.75%. Returns ranged from a high of
25.2% in FY2011 to a low of -21.7% in FY2009.
OTHER POST EMPLOYMENT BENEFITS (OPEB)
Non-pension benefits provided to employees after employment ends are referred to as Other Post
Employment Benefits (OPEB). OPEB includes health insurance coverage for retirees and their
families, dental insurance, life insurance and term care coverage. It does not include termination
benefits such as accrued sick leave and vacation. CPS has not established an irrevocable trust
fund to account for its OPEB plan. Rather, these obligations are financed on a pay-as-you-go
basis through the Chicago Teachers’ Pension Fund (CTPF). It is important to note that these
benefits are funded by the retirement system, not by CPS.
155 The Civic Federation calculates investment rate of return using the following formula: Current Year Rate of
Return = Current Year Gross Investment Income/ (0.5*(Previous Year Market Value of Assets + Current Year
Market Value of Assets – Current Year Gross Investment Income)). This is not necessarily the formula used by the
pension fund’s actuary and investment managers; thus investment rates of return reported here may differ from those
reported in a fund’s actuarial statements. However, this is a standard actuarial formula. Gross investment income
includes income from securities lending activities, net of borrower rebates. It does not subtract out related
investment and securities lending fees, which are treated as expenses.
10.6% 10.7%
17.9%
-5.5%
-21.7%
14.1%
25.2%
0.0%
13.5%
18.3%
-30.0%
-20.0%
-10.0%
0.0%
10.0%
20.0%
30.0%
FY2005 FY2006 FY2007 FY2008 FY2009 FY2010 FY2011 FY2012 FY2013 FY2014
Chicago Teachers' Pension Fund Investment Rate of Return:FY2005-FY2014
Source: Civic Federation calculations based on Chicago Teachers' Pension Fund Financial Statements, FY2054-FY2014.
10-Year Average = 8.3%

73
The CTPF provides a “rebate” for a significant portion of the monthly premiums owed by those
who enroll. The rebate only applies to the retired teacher’s portion of these insurance policies,
not to the additional cost of enrolling eligible dependents. However, the rebate does apply to
eligible dependents who are survivors of deceased retirees. The Fund had previously provided
reimbursement of 70.0% of the cost of pensioners’ health insurance coverage, but it was reduced
to 60.0% on January 1, 2011 and to 50.0% on January 1, 2015. According to Illinois statute, total
payments from the Teachers’ Pension Fund to reimburse retirees may not exceed 75.0% of total
retiree health insurance costs.156
In FY2014 a total of 18,171 retirees and beneficiaries received health insurance benefits. There
were also 4,818 terminated employees who may be entitled to OPEB benefits but are not yet
receiving them and 9,501 retirees and beneficiaries entitled to benefits but not currently receiving
them.157 The Illinois Pension Code limits total annual payments paid by the pension fund’s
Board of Trustees to $65.0 million per year plus amounts authorized in previous years but not
spent.158 In FY2014 the Teachers’ Pension Fund spent $72.9 million on OPEB.159
The following exhibit shows the extent to which the aggregate cost of the CTPF’s health
insurance subsidy has increased over the past decade. From FY2005 to FY2014, insurance
premium rebates paid to beneficiaries increased by 31.9%, or $17.4 million. The health insurance
rebate has increased year over year, with year-to-year increases ranging from 1.5% in FY2014 to
12.6% in FY2008. The exceptions were FY2011 and FY2012, when the subsidy decreased by
1.3% and 12.5%, respectively, due to the reduction to the reimbursement percent on January 1,
156 40 ILCS 17-142.1. 157 Public School Teachers’ Pension and Retirement Fund of Chicago, Actuarial Valuation and Review of Other Post
Employment Benefits (OPEB) as of June 30, 2014 in Accordance with GASB Statement No. 43, p. 3. 158 40 ILCS 17-142.1. 159 Chicago Teachers’ Pension Fund, FY2014 Comprehensive Annual Financial Report, p. 23.

74
2011. The health insurance rebate has represented approximately 5.4% to 7.7% of total pension
and OPEB benefit expenditures over the ten-year period.
The following exhibit shows the funded status of the teachers’ OPEB plan. The total actuarial
liability fluctuated over the five-year period from FY2010 to FY2014. The liability was nearly
$2.9 billion in FY2010, rising to $3.1 billion in FY2012, before falling over the next two years to
$1.9 billion in FY2014. Assets as a percentage of the actuarial liability were 1.2% in FY2009
and 1.9% in FY2014. The actuarial assumptions used included a 4.5% discount rate and an
FY2005 54,410,887$ --
FY2006 58,279,900$ 7.1%
FY2007 61,028,841$ 4.7%
FY2008 68,691,191$ 12.6%
FY2009 75,811,835$ 10.4%
FY2010 79,953,873$ 5.5%
FY2011 78,892,292$ -1.3%
FY2012 69,011,323$ -12.5%
FY2013 71,763,523$ 4.0%
FY2014 72,874,594$ 1.5%
Ten-Year Change 17,352,636$ 31.9%
Source: Chicago Teachers' Pension Fund, Comprehensive Annual Financial
Report FY2014, pp. 129 and 130.
Total Health Insurance Premium Rebates
Paid to Retired CPS Teachers:
Health Insurance
Rebate Paid
% Change over
Previous Year
FY2005-FY2014

75
annual healthcare cost trend rate that is projected to decline by 0.5% points a year from 8.0% to
5.0% gradually over the six years.160
LIABILITIES
This section of the analysis provides an overview of the short-term and long-term liabilities of
Chicago Public Schools.
Short-Term Liabilities
Short-term liabilities are financial obligations that must be satisfied within one year. They can
include short-term debt, accounts payable, accrued payroll, amounts held for student activities
and other current liabilities. The District currently reports no short-term debt. CPS includes the
following short-term liabilities in the Governmental Funds Balance Sheet in its annual
Comprehensive Annual Financial Report:
Accounts payable: monies owed to vendors or employees for goods and services;
Accrued payroll: employee pay carried over from previous years; and
Amounts held for student activities: deposits held in custody or funds that belong to
individual school accounts.
Short-term liabilities in the Governmental Funds decreased by approximately $431.9 million or
48.0%, from FY2010 to FY2014.
The largest portion of the decrease in this five-year period is for accrued payroll, which declined
by nearly $408.9 million, or 78.5%. Most of that decrease occurred between FY2013 and
FY2014, when accrued payroll fell by 76.4%, or from $473.2 million to $111.8 million. This was
because in FY2014 CPS discontinued the practice of deferring a portion of non-52 week
employee's payroll.161
160 Chicago Teachers’ Pension Fund, Actuarial Valuation and Review of Other Postemployment Benefits (OPEB) as
of June 30, 2014 in Accordance with GASB Statement No. 43, p. 5. 161 Information provided by the CPS Budget Office, August 21, 2015.
Total Actuarial
Liability
Actuarial Value of
Assets
Unfunded Actuarial
Accrued Liability
(UAAL)
Assets as a % of
Actuarial Liability
FY2010 $ 2,864,877,305 $ 34,857,732 $ 2,830,019,573 1.2%
FY2011 $ 3,071,516,739 $ 31,324,572 $ 3,040,192,167 1.0%
FY2012 $ 3,110,316,263 $ 34,124,958 $ 3,076,191,305 1.1%
FY2013 $ 2,386,105,927 $ 35,796,904 $ 2,350,309,023 1.5%
FY2014 $ 1,938,855,895 $ 35,977,444 $ 1,902,878,451 1.9%
Funded Status of the Chicago Public Schools Pension Fund
Other Post Employment Benefit (OPEB) Plan:
FY2010-FY2014
Source: Chicago Teachers' Pension Fund, Actuarial Valuation and Review of Other Postemployment Benefits (OPEB) as
of June 30, 2014 in Accordance with GASB Statement No. 43, p. 8.
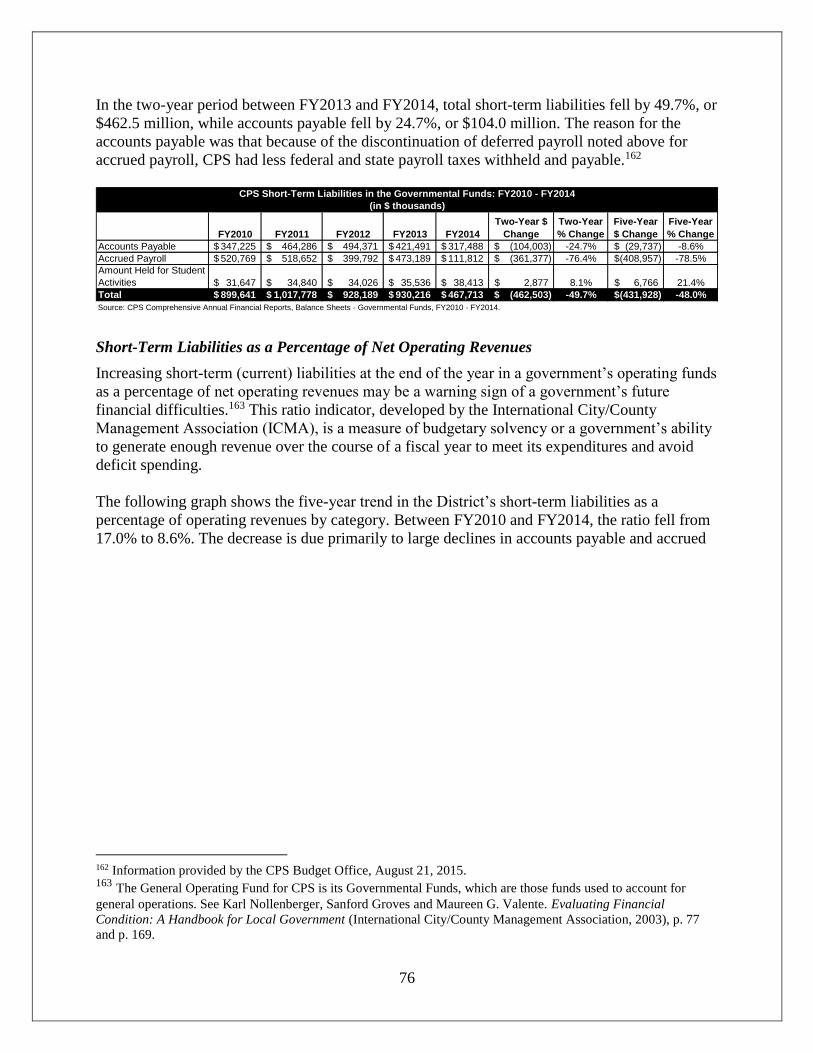
76
In the two-year period between FY2013 and FY2014, total short-term liabilities fell by 49.7%, or
$462.5 million, while accounts payable fell by 24.7%, or $104.0 million. The reason for the
accounts payable was that because of the discontinuation of deferred payroll noted above for
accrued payroll, CPS had less federal and state payroll taxes withheld and payable.162
Short-Term Liabilities as a Percentage of Net Operating Revenues
Increasing short-term (current) liabilities at the end of the year in a government’s operating funds
as a percentage of net operating revenues may be a warning sign of a government’s future
financial difficulties.163 This ratio indicator, developed by the International City/County
Management Association (ICMA), is a measure of budgetary solvency or a government’s ability
to generate enough revenue over the course of a fiscal year to meet its expenditures and avoid
deficit spending.
The following graph shows the five-year trend in the District’s short-term liabilities as a
percentage of operating revenues by category. Between FY2010 and FY2014, the ratio fell from
17.0% to 8.6%. The decrease is due primarily to large declines in accounts payable and accrued
162 Information provided by the CPS Budget Office, August 21, 2015. 163 The General Operating Fund for CPS is its Governmental Funds, which are those funds used to account for
general operations. See Karl Nollenberger, Sanford Groves and Maureen G. Valente. Evaluating Financial
Condition: A Handbook for Local Government (International City/County Management Association, 2003), p. 77
and p. 169.
FY2010 FY2011 FY2012 FY2013 FY2014
Two-Year $
Change
Two-Year
% Change
Five-Year
$ Change
Five-Year
% Change
Accounts Payable 347,225$ 464,286$ 494,371$ 421,491$ 317,488$ (104,003)$ -24.7% (29,737)$ -8.6%
Accrued Payroll 520,769$ 518,652$ 399,792$ 473,189$ 111,812$ (361,377)$ -76.4% (408,957)$ -78.5%
Amount Held for Student
Activities 31,647$ 34,840$ 34,026$ 35,536$ 38,413$ 2,877$ 8.1% 6,766$ 21.4%
Total 899,641$ 1,017,778$ 928,189$ 930,216$ 467,713$ (462,503)$ -49.7% (431,928)$ -48.0%
Source: CPS Comprehensive Annual Financial Reports, Balance Sheets - Governmental Funds, FY2010 - FY2014.
CPS Short-Term Liabilities in the Governmental Funds: FY2010 - FY2014
(in $ thousands)
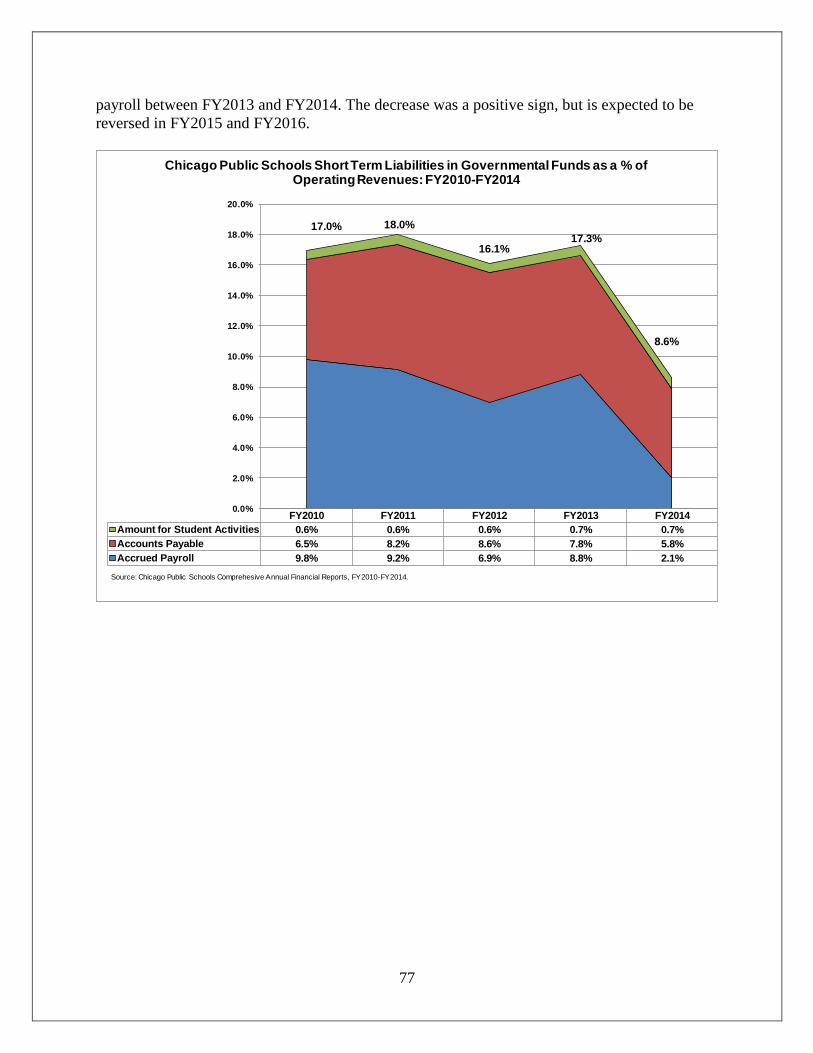
77
payroll between FY2013 and FY2014. The decrease was a positive sign, but is expected to be
reversed in FY2015 and FY2016.
FY2010 FY2011 FY2012 FY2013 FY2014
Amount for Student Activities 0.6% 0.6% 0.6% 0.7% 0.7%
Accounts Payable 6.5% 8.2% 8.6% 7.8% 5.8%
Accrued Payroll 9.8% 9.2% 6.9% 8.8% 2.1%
0.0%
2.0%
4.0%
6.0%
8.0%
10.0%
12.0%
14.0%
16.0%
18.0%
20.0%
Chicago Public Schools Short Term Liabilities in Governmental Funds as a % of Operating Revenues: FY2010-FY2014
Source: Chicago Public Schools Comprehesive Annual Financial Reports, FY2010-FY2014.
17.0% 18.0%
16.1%17.3%
8.6%
78
Short-Term Borrowing
Because CPS spent almost all of its budgetary reserves to balance its FY2015 budget, the District
will rely on an increased level of short-term borrowing in FY2016. The District will access
$900.0 million of short-term borrowing to bridge the gap between revenue collections and
expenses throughout the fiscal year.164 The funds will be secured through lines of credit and
commercial loans and payable with dedicated revenues including property tax collections.
In the past CPS has used its available reserve funds and smaller amounts of short-term borrowing
to smooth over the variance in its property tax collections and GSA payments from the State. As
noted above, the majority of its reserves have been used as one-time resources to help close its
deficits over the last several fiscal years and are no longer available for this purpose. Instead the
short-term bonds will increase debt service cost by approximately $24.0 million in FY2016.165
CPS receives property tax collections in August and March. However, it is required to make
large debt service payments in February and its pension payment in June. Without access to the
borrowed funds in FY2016, CPS would not be able to make these necessary payments on time.
Likewise at the end of FY2015, CPS reported it would not have enough cash on hand to make its
required $634.0 million pension payment. In order to make the payment, CPS cut $200.0 million
for the operating budget through layoffs and borrowed the remaining funding. Short-term
borrowing was used to provide the liquidity necessary to make the payment due to a negative
cash balance that fell below $600.0 million between June 2015 and August 2015.166
Accounts Payable Trends
Rising amounts of accounts payable over time may indicate a government’s difficulty in
controlling expenses or keeping up with spending pressures. CPS reported a decrease of 8.6% in
total accounts payable, or approximately $29.7 million, from FY2010 to FY2014. This was a
164 CPS FY2016 Budget, p. 13. 165 CPS FY2016 Budget, p. 13. 166 CPS FY2016 Budget, p. 14.

79
decrease from $347.2 million to $317.5 million. There was a decrease of $104.0 million or
24.7% between FY2013 and FY2014; this was a positive sign.
$347,225
$464,286
$494,371
$421,491
$317,488
$-
$100,000
$200,000
$300,000
$400,000
$500,000
$600,000
FY2010 FY2011 FY2012 FY2013 FY2014
Source: CPS Comprehensive Annual Financial Reports, FY2010- FY2014.
CPS Total Accounts Payable in Governmental Funds: FY2010-FY2014 (in $ thousands)

80
The District’s ratio of accounts payable in the Governmental Funds to operating revenues has
decreased slightly from 6.5% in FY2010 to 5.8% in FY2014. The ratio increased from 6.5% in
FY2010 to 8.6% in FY2012 before declining in subsequent years. Those changes primarily
reflected the $147.1 million, or 42.4%, increase in accounts payable between FY2010 and
FY2012.
Current Ratio
The current ratio is a measure of liquidity. It assesses whether a government has enough cash and
other liquid resources to meet its short-term obligations as they come due. The current ratio is
calculated by dividing short-term assets by short-term liabilities. A ratio of 1.0 means that
current assets are equal to current liabilities and are sufficient to cover obligations in the near
term. Generally, a government’s current ratio should be close to 2.0 or higher.167 In addition to
the short-term liabilities listed in the previous section, the current ratio formula uses the current
assets of the District:
Cash and investments are (1) assets that are cash or can be converted into cash immediately
including petty cash, demand deposits and certificates of deposit and/or (2) any investments
167 Steven A. Finkler. Financial Management for Public, Health and Not-for-Profit Organizations, Upper Saddle
River, NJ, 2001, p. 476.
6.5%
8.2%
8.6%
7.8%
5.8%
0.0%
1.0%
2.0%
3.0%
4.0%
5.0%
6.0%
7.0%
8.0%
9.0%
10.0%
FY2010 FY2011 FY2012 FY2013 FY2014
CPS Accounts Payable as a Percentage of Operating Revenue: FY2010 - FY2014
Source: CPS Comprehensive Annual Financial Reports, FY2010-FY2014.

81
that the District has made that will expire within one year including stocks and bonds that can
be liquidated quickly;
Cash and investments in escrow in the Debt Service Fund represent the amount available for
debt service payments on the Unlimited Tax General Obligation Bonds and Public Building
Commission Leases. The cash and investments in escrow in the Capital Projects Funds
represent the unspent proceeds from the Unlimited Tax General Obligation Bonds, Public
Building Commission Building Revenue Bonds, State Technology Revolving Loan Fund and
other revenues;168
Cash and investments held in school internal accounts represent the book balance for
checking and investments for individual schools;169
Receivables are monetary obligations owed to the government including property taxes,
replacement taxes and state or federal aid; and
Other assets include prepaid assets and deferred charges recorded as expenditures in the
governmental funds. Deferred charges are for bond issuance costs.170
The CPS current ratio was 6.0 in FY2014, the most recent year for which data are available. In
the past five years, the District’s current ratio averaged 4.6, which is greater than the benchmark
of 2.0, which is considered a healthy level of liquidity. Over the five-year period, current assets
fell by 25.8% while current liabilities declined by 48.0%.
Although the current ratio is above the healthy benchmark currently, CPS reported a cash flow
crisis at the end of FY2015. The crisis was primarily caused by a drawdown of reserve funds to
balance its FY2015 budget and reliance on revenues collected after the close of the fiscal year
through its extended revenue recognition period. These measure left the District with limited
resources on June 30, 2015, when it was required to make its FY2015 pension contribution
totaling $634.0 million.
168 Chicago Public Schools FY2014 Comprehensive Annual Financial Report, p. 58. 169 Chicago Public Schools FY2014 Comprehensive Annual Financial Report, p. 59. 170 Chicago Public Schools FY2014 Comprehensive Annual Financial Report, p. 45.
FY2010 FY2011 FY2012 FY2013 FY2014
Two-Year $
Change
Two-Year %
Change
Five-Year $
Change
Five-Year
% Change
Current Assets
Cash and Investments 857,002$ 1,157,460$ 1,470,892$ 1,259,273$ 254,551$ $ (1,004,722) -79.8% $ (602,451) -70.3%
Cash and Investments in Escrow 951,546$ 778,083$ 649,471$ 755,025$ 580,457$ $ (174,568) -23.1% $ (371,089) -39.0%
Cash and Investments Held in
School Internal Accounts 31,647$ 34,840$ 34,026$ 35,536$ 38,413$ $ 2,877 8.1% $ 6,766 21.4%
Receivables: Property Taxes, Net 906,944$ 1,022,827$ 996,968$ 1,061,198$ 1,064,710$ $ 3,512 0.3% $ 157,766 17.4%
Receivables: Replacement Taxes 22,829$ 24,342$ 33,182$ 35,870$ 31,920$ $ (3,950) -11.0% $ 9,091 39.8%
Receivables: State Aid, Net 807,665$ 775,970$ 613,199$ 514,760$ 516,147$ $ 1,387 0.3% $ (291,518) -36.1%
Receivables: Federal Aid 156,023$ 277,650$ 202,462$ 291,336$ 211,090$ $ (80,246) -27.5% $ 55,067 35.3%
Receivables: Other 40,209$ 146,247$ 40,533$ 159,492$ 106,791$ $ (52,701) -33.0% $ 66,582 165.6%
Other Assets 4,595$ 2,095$ 8,581$ 5,687$ 1$ $ (5,686) -100.0% $ (4,594) -100.0%
Total Current Assets 3,778,460$ 4,219,514$ 4,049,314$ 4,118,177$ 2,804,080$ $ (1,314,097) -31.9% $ (974,380) -25.8%
Current Liabilities
Accounts Payable 347,225$ 464,286$ 494,371$ 421,491$ 317,488$ $ (104,003) -24.7% (29,737)$ -8.6%
Accrued Payroll 520,769$ 518,652$ 399,792$ 473,189$ 111,812$ $ (361,377) -76.4% (408,957)$ -78.5%
Amount Held for Student Activities 31,647$ 34,840$ 34,026$ 35,536$ 38,413$ $ 2,877 8.1% 6,766$ 21.4%
Total Current Liabilities 899,641$ 1,017,778$ 928,189$ 930,216$ 467,713$ (462,503)$ -49.7% (431,928)$ -48.0%
Current Ratio 4.2 4.1 4.4 4.4 6.0
CPS Current Ratio in the Governmental Funds: FY2010-FY2014
(in $ thousands)
Source: CPS Comprehensive Annual Financial Reports, Balance Sheets - Governmental Funds, FY2010 - FY2014.

82
Although current data are not available to calculate the current ratio for FY2015 or project the
FY2016 ratio, it is expected that the ratio will fall in these years due to increased current
liabilities in the form of short-term borrowing and reduced current assets due to the reduction in
reserves.
Long-Term Liabilities
This section examines trends in CPS long-term liabilities. It includes a review of trends in the
District’s total long-term liabilities and a discussion of its tax supported long-term debt. Long-
term liabilities are all of the obligations owed by a government over time.171 Increases in long-
term liabilities over time may be a sign of fiscal stress. They include long-term debt as well as:
Accrued Sick Pay Benefits: CPS provides sick pay benefits for nearly all of its
employees. Eligible employees were able to accumulate a maximum of 325 sick days
granted before July 1, 2012. If an employee reached age 65, had a minimum of 20 years
of service at the time of resignation or retirement or death, the employee (or surviving
dependent in case of employee death) was entitled to receive, as additional cash
compensation, all or a portion of her or his accumulated sick leave days. After July 1,
2012, unused sick days at the end of a fiscal year will no longer be carried over to the
next fiscal year. Payout of the value of any unused sick days will no longer be paid out to
employees. CPS budgets an amount each year in the General Operating Fund for these
estimated payments to employees terminated in the current fiscal year.
Accrued Vacation Pay Benefits: For eligible employees, the maximum number of
accumulated unused vacation days permitted is 40 days for those employees with up to
ten years of service, 53 days for those with 11 to 20 years of service and 66 days for those
with more than 20 years of service. Eligible employees are entitled to receive 100.0% of
accumulated vacation days at their current salary rate. These amounts are paid from the
General Operating Fund.
Accrued Workers' Compensation Claims, Accrued General and Automobile Claims and
Tort Liabilities and Other Claims: CPS is substantially self-insured and assumes risk of
loss as follows:
CPS maintains commercial excess property insurance for “all risks” of physical
loss or damage with limits of $250,000,000 and Boiler and Machinery Insurance
with limits of $100,000,000 with the following deductibles:
o Data Processing Equipment & Media $50,000
o Mechanical Breakdown $50,000
o All Other Losses $500,000
Net Pension Obligations (NPO): NPO is the cumulative difference, since the effective
date of GASB Statement 27, between the annual pension cost and the employer’s
contributions to the plan. This includes the pension liability at transition (beginning
pension liability) and excludes short-term differences and unpaid contributions that have
been converted to pension-related debt.
171 Descriptions of accrued sick pay benefits, accrued vacation pay benefits, accrued workers' compensation claims,
and accrued general and automobile claims and tort liabilities and other claims are found in Note 11: Other Benefits
and Claims, CPS FY2013 Comprehensive Annual Financial Report, pp. 78-80.
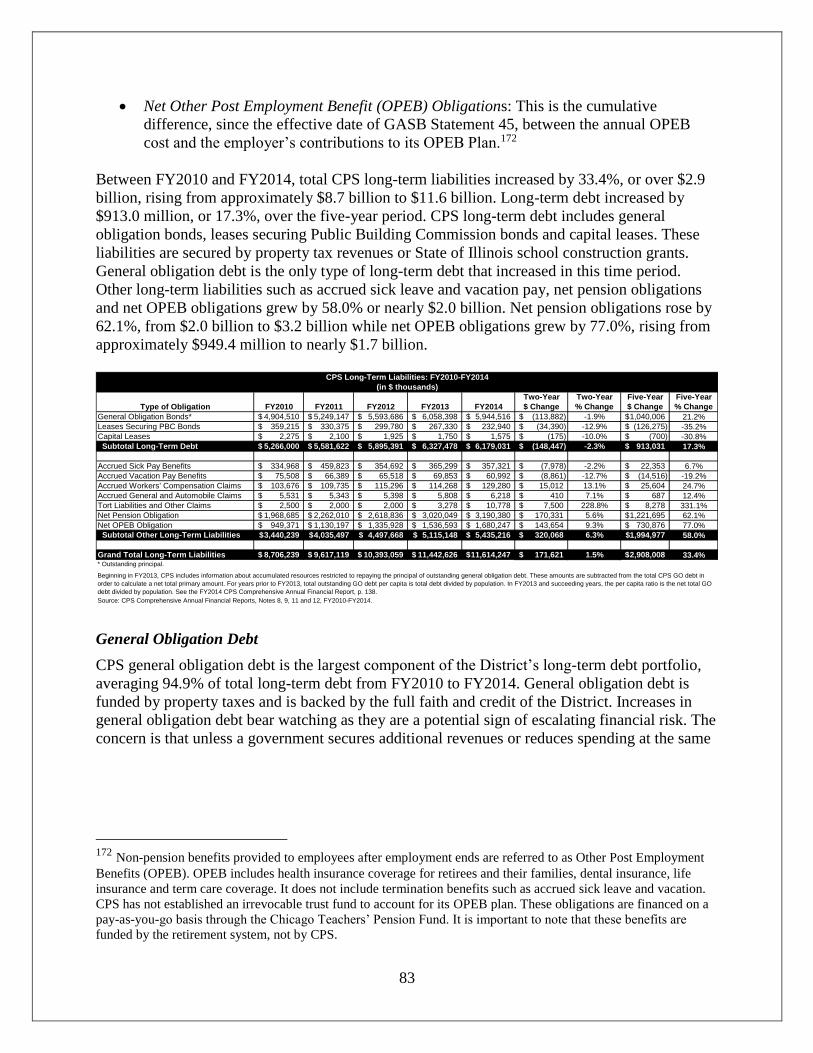
83
Net Other Post Employment Benefit (OPEB) Obligations: This is the cumulative
difference, since the effective date of GASB Statement 45, between the annual OPEB
cost and the employer’s contributions to its OPEB Plan.172
Between FY2010 and FY2014, total CPS long-term liabilities increased by 33.4%, or over $2.9
billion, rising from approximately $8.7 billion to $11.6 billion. Long-term debt increased by
$913.0 million, or 17.3%, over the five-year period. CPS long-term debt includes general
obligation bonds, leases securing Public Building Commission bonds and capital leases. These
liabilities are secured by property tax revenues or State of Illinois school construction grants.
General obligation debt is the only type of long-term debt that increased in this time period.
Other long-term liabilities such as accrued sick leave and vacation pay, net pension obligations
and net OPEB obligations grew by 58.0% or nearly $2.0 billion. Net pension obligations rose by
62.1%, from $2.0 billion to $3.2 billion while net OPEB obligations grew by 77.0%, rising from
approximately $949.4 million to nearly $1.7 billion.
General Obligation Debt
CPS general obligation debt is the largest component of the District’s long-term debt portfolio,
averaging 94.9% of total long-term debt from FY2010 to FY2014. General obligation debt is
funded by property taxes and is backed by the full faith and credit of the District. Increases in
general obligation debt bear watching as they are a potential sign of escalating financial risk. The
concern is that unless a government secures additional revenues or reduces spending at the same
172 Non-pension benefits provided to employees after employment ends are referred to as Other Post Employment
Benefits (OPEB). OPEB includes health insurance coverage for retirees and their families, dental insurance, life
insurance and term care coverage. It does not include termination benefits such as accrued sick leave and vacation.
CPS has not established an irrevocable trust fund to account for its OPEB plan. These obligations are financed on a
pay-as-you-go basis through the Chicago Teachers’ Pension Fund. It is important to note that these benefits are
funded by the retirement system, not by CPS.
Two-Year Two-Year Five-Year Five-Year
Type of Obligation FY2010 FY2011 FY2012 FY2013 FY2014 $ Change % Change $ Change % Change
General Obligation Bonds* 4,904,510$ 5,249,147$ 5,593,686$ 6,058,398$ 5,944,516$ (113,882)$ -1.9% 1,040,006$ 21.2%
Leases Securing PBC Bonds 359,215$ 330,375$ 299,780$ 267,330$ 232,940$ (34,390)$ -12.9% (126,275)$ -35.2%
Capital Leases 2,275$ 2,100$ 1,925$ 1,750$ 1,575$ (175)$ -10.0% (700)$ -30.8%
Subtotal Long-Term Debt 5,266,000$ 5,581,622$ 5,895,391$ 6,327,478$ 6,179,031$ (148,447)$ -2.3% 913,031$ 17.3%
Accrued Sick Pay Benefits 334,968$ 459,823$ 354,692$ 365,299$ 357,321$ (7,978)$ -2.2% 22,353$ 6.7%
Accrued Vacation Pay Benefits 75,508$ 66,389$ 65,518$ 69,853$ 60,992$ (8,861)$ -12.7% (14,516)$ -19.2%
Accrued Workers' Compensation Claims 103,676$ 109,735$ 115,296$ 114,268$ 129,280$ 15,012$ 13.1% 25,604$ 24.7%
Accrued General and Automobile Claims 5,531$ 5,343$ 5,398$ 5,808$ 6,218$ 410$ 7.1% 687$ 12.4%
Tort Liabilities and Other Claims 2,500$ 2,000$ 2,000$ 3,278$ 10,778$ 7,500$ 228.8% 8,278$ 331.1%
Net Pension Obligation 1,968,685$ 2,262,010$ 2,618,836$ 3,020,049$ 3,190,380$ 170,331$ 5.6% 1,221,695$ 62.1%
Net OPEB Obligation 949,371$ 1,130,197$ 1,335,928$ 1,536,593$ 1,680,247$ 143,654$ 9.3% 730,876$ 77.0%
Subtotal Other Long-Term Liabilities 3,440,239$ 4,035,497$ 4,497,668$ 5,115,148$ 5,435,216$ 320,068$ 6.3% 1,994,977$ 58.0%
Grand Total Long-Term Liabilities 8,706,239$ 9,617,119$ 10,393,059$ 11,442,626$ 11,614,247$ 171,621$ 1.5% 2,908,008$ 33.4%* Outstanding principal.
CPS Long-Term Liabilities: FY2010-FY2014
(in $ thousands)
Source: CPS Comprehensive Annual Financial Reports, Notes 8, 9, 11 and 12, FY2010-FY2014.
Beginning in FY2013, CPS includes information about accumulated resources restricted to repaying the principal of outstanding general obligation debt. These amounts are subtracted from the total CPS GO debt in
order to calculate a net total primary amount. For years prior to FY2013, total outstanding GO debt per capita is total debt divided by population. In FY2013 and succeeding years, the per capita ratio is the net total GO
debt divided by population. See the FY2014 CPS Comprehensive Annual Financial Report, p. 138.
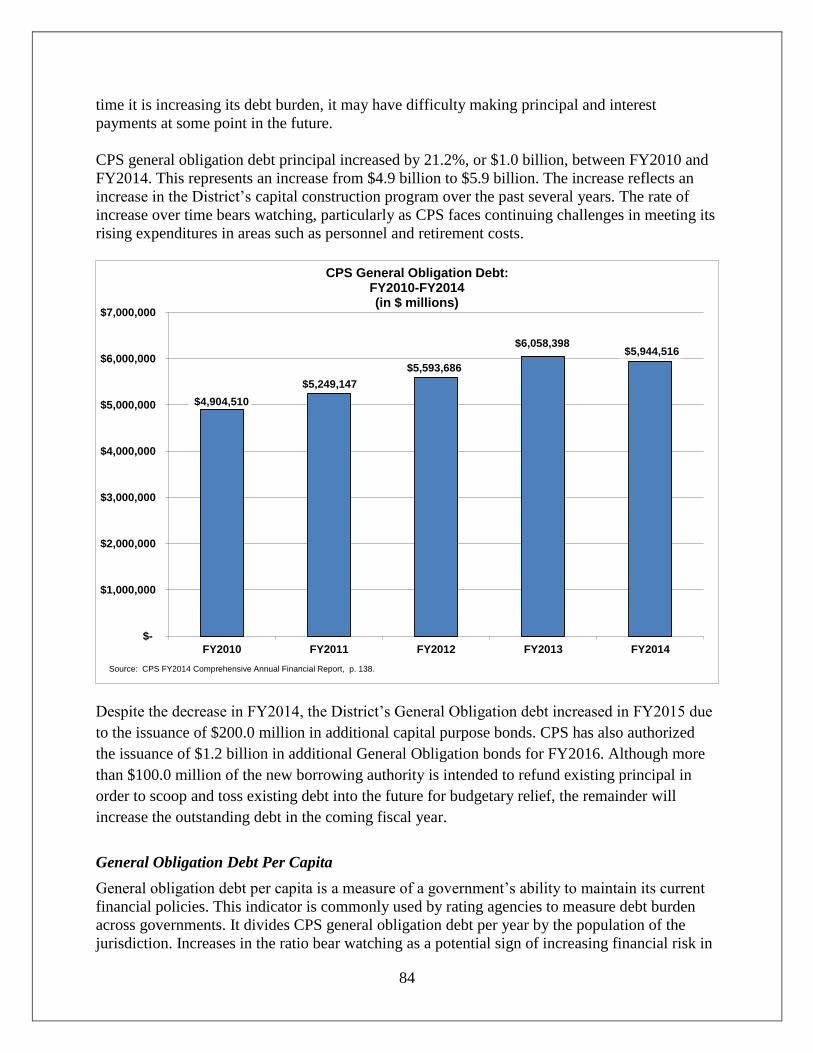
84
time it is increasing its debt burden, it may have difficulty making principal and interest
payments at some point in the future.
CPS general obligation debt principal increased by 21.2%, or $1.0 billion, between FY2010 and
FY2014. This represents an increase from $4.9 billion to $5.9 billion. The increase reflects an
increase in the District’s capital construction program over the past several years. The rate of
increase over time bears watching, particularly as CPS faces continuing challenges in meeting its
rising expenditures in areas such as personnel and retirement costs.
Despite the decrease in FY2014, the District’s General Obligation debt increased in FY2015 due
to the issuance of $200.0 million in additional capital purpose bonds. CPS has also authorized
the issuance of $1.2 billion in additional General Obligation bonds for FY2016. Although more
than $100.0 million of the new borrowing authority is intended to refund existing principal in
order to scoop and toss existing debt into the future for budgetary relief, the remainder will
increase the outstanding debt in the coming fiscal year.
General Obligation Debt Per Capita
General obligation debt per capita is a measure of a government’s ability to maintain its current
financial policies. This indicator is commonly used by rating agencies to measure debt burden
across governments. It divides CPS general obligation debt per year by the population of the
jurisdiction. Increases in the ratio bear watching as a potential sign of increasing financial risk in
$4,904,510
$5,249,147
$5,593,686
$6,058,398 $5,944,516
$-
$1,000,000
$2,000,000
$3,000,000
$4,000,000
$5,000,000
$6,000,000
$7,000,000
FY2010 FY2011 FY2012 FY2013 FY2014
CPS General Obligation Debt: FY2010-FY2014(in $ millions)
Source: CPS FY2014 Comprehensive Annual Financial Report, p. 138.

85
much the same manner as increases in total direct debt figures do. CPS general obligation debt
per capita increased by 30.2% between FY2010 and FY2014, rising from $1,694.0 to $2,205.0.
The increase reflects a significant increase in direct debt, but is not the same as the dollar
percentage increase over time for general obligation debt because the City’s population has
decreased by 6.9% over the time period, falling from 2,896,016 to 2,695,598.173 Between
FY2015 and FY2016, CPS general obligation debt per capita has declined slightly by 1.9% from
$2,248 to $2,205.
As mentioned above, due to the additional bonds sold in FY2015 and the authorized sale of $1.2
billion in additional bonds in FY2016, the debt service per capita trend is expected to rise in
subsequent years.
Debt Service Appropriations as a Percentage of Total Appropriations
The ratio of debt service expenditures as a percentage of total Governmental Fund expenditures
is frequently used by rating agencies to assess debt burden. The rating agencies consider a debt
burden high if this ratio is between 15.0% and 20.0%.174 Although the debt service ratio for CPS
173 CPS FY2014 Comprehensive Annual Financial Report, p. 139. 174 Standard & Poor’s, Public Finance Criteria 2007, p. 64. See also Moody’s, General Obligation Bonds Issued by
U.S. Local Governments, October 2009, p. 18.
$1,694
$1,947
$2,075
$2,248 $2,205
$-
$500
$1,000
$1,500
$2,000
$2,500
FY2010 FY2011 FY2012 FY2013 FY2014
CPS General Obligation Debt Per Capita: FY2010-FY2014(in $ millions)
Source: CPS FY2014 Comprehensive Annual Financial Report, p. 138

86
will increase significantly from 6.4% in FY2012 to 9.5% in FY2016, it is still below the 15%
threshold. Between FY2012 and FY2016, the debt service ratio averaged 8.4%.
Rather than pay the principal portion of the debt service owed in FY2016 using General State
Aid, the District has included a scoop and toss refunding as part of the proposed budget
balancing actions. The District plans to issue a refunding bond to repay the principal amounts
owed in FY2016, which will allow CPS to use $254.0 million in GSA that would have been
dedicated to the principal payments and additional debt service reserves for operations instead.
By pushing these principal payments due in FY2016 out into future years, the District will
greatly increase the cost of the original capital projects and services paid for with the bonds to
provide short-term budgetary relief.
CPS Bond Ratings
In 2015 the Chicago Public Schools continued on a path of steadily falling credit ratings as the
District struggled to finance its mounting debt and pension obligations and depleted its reserves.
As of August 2015 Standard & Poor’s, Moody’s Investors Services and Fitch Ratings rate CPS
debt as being below investment grade status, with ratings of BB, Ba3 and BB+ respectively.
Kroll still rates CPS debt as investment grade with a rating BBB+.
FY2012 FY2013
FY2014
Actual
FY2015
Estimated
FY2016
Proposed $ Change
%
Change
Debt Service Appropriations 374.5$ 390.4$ 467.9$ 603.8$ 538.6$ 164.10$ 43.8%
Total Appropriations 5,839.7$ 5,804.3$ 5,312.2$ 5,756.3$ 5,687.7$ (152.00)$ -2.6%
Debt Service as a % of Total
Appropriations 6.4% 6.7% 8.8% 10.5% 9.5%
Chicago Public Schools Budgeted Debt Service Appropriations as of % of Total Appropriations:
FY2012-FY2016
Sources: CPS FY2016 Budget, pp. 9 and 161; CPS FY2015 Proposed Budget at http://www.cps.edu/fy15budget/Pages/debtmanagement.aspx and
FY2014 Estimated Budget, p. 7; Previous budget data from www.cps.edu.
2009 2010 2011 2012 2013 2014 2015
Standard & Poor's Rating Services AA- AA- AA- A+ A+ A+ BB
Moody's Investor Services A1 Aa2 Aa3 A2 A3 Baa1 Ba3
Fitch Ratings A+ AA- A+ A A A- BB+
Kroll No rating No rating No rating No rating No rating No rating BBB+Source: Chicago Public Schools FY2016 Budget, p. 159 and Standard & Poor's , "Chicago Board of Education GO
Rating Lowered to 'BB' from 'BBB' on Structural Imbalance and Low Liquidity," August 14, 2015.
FY2009-FY2015

87
2015 Rating Downgrades
In August 2015, Standard & Poor’s (S&P) downgraded CPS credit to BB from a BBB rating
with a negative outlook. S&P cited the District’s structural budget deficit, its decision to rely on
$480.0 million in uncommitted state aid in its budget and its plan to borrow $200.0 million in
order to push off debt payments coming due.175
In July 2015, Fitch downgraded the Chicago Public Schools’ credit rating to BB+ from BBB-
with a negative outlook. Fitch cited the District’s structural budget gap, lack of reserves,
enormous pension liabilities, high debt levels and a record of contentious negotiations with
organized labor as the reasons for the downgrade. Fitch noted that CPS has limited options for
improving the situation. 176
In May 2015 Moody’s dropped CPS’ rating three notches to Ba3 from Baa3, with a continuing
negative outlook. 177
In March 2015 Fitch downgraded CPS’ credit rating three notches to BBB- with a negative
outlook. Moody’s cut its rating two notches to Baa3, one level above non-investment grade
status, and Standard & Poor’s cut it two notches to A-.178 The downgrades triggered penalties
under the terms of the District’s debt swap agreements with financial institutions of well over
$200.0 million.179
Previous Downgrades
On July 24, 2013, Moody’s Investors Service lowered the District’s rating on general obligation
debt from A2 to A3 with a negative outlook. Moody’s cited the significant debt and pension
obligations of the District and overlapping governmental units, including the City of Chicago. At
that time, Moody’s said that the rating downgrade reflected above-average debt burden and the
expected narrowing of reserves to bridge the FY2014 budget gap.180 On March 14, 2014,
Moody’s Investors Services further downgraded CPS’s credit rating for its general obligation
debt to Baa1 with a negative outlook, the same rating it gave to City of Chicago general
obligation debt on March 4 of that year. Moody’s issued the downgrade because of concerns
about the District drawing down its reserves in FY2014 to meet scheduled increases in pension
175 Standard & Poor’s, “Chicago Board of Education GO Rating Lowered To 'BB' From 'BBB' On Structural
Imbalance And Low Liquidity,” August 14, 2015. 176 Fitch Ratings. “Fitch Downgrades Chicago Board of Ed (IL) ULTGOs to BBB+; Negative Watch,” July 7, 2015. 177 Lauren Fitzpatrick and Tina Sfondeles, “Chicago public schools and park district’s debt downgraded to junk
status,” Chicago Sun-Times, May 13, 2015. 178 Reuters, “Update 2-Fitch Downgrades Chicago Board of Education rating to BBB-,” March 20, 2015. 179 Dan Mihalopoulos and Lauren Fitzpatrick, “CPS facing $200 million-plus penalties as bond ratings plunge,”
Chicago Sun-Times, March 20, 2015. 180 CPS FY2013 Proposed Budget, pp. 137-138.

88
payments and to balance its budget as well as the projected $900.0 million shortfall for
FY2015.181
Capital Budget
Information about CPS capital projects can be found in the capital budget section of the proposed
FY2016 budget and in the FY2016-FY2020 capital improvement plan on the District’s
website.182
In its FY2016 budget, CPS proposes spending $177.6 million for capital projects. The largest
single amount, or 78.6% of the total, will be $139.6 million for building repair and
modernization. This is followed by the “other” category, which will be 14.0% of total spending,
or $24.8 million. It includes funding for capital project support services as well as legal and
regulatory requirements. Next, funding for projects intended to provide relief from overcrowding
will be budgeted at $10.2 million or 5.7% of all spending. Finally, $2.9 million will be spent
181 Paul Merion, “Moody’s cuts rating for Chicago schools, park district,” Crain’s Chicago Business, March 15,
2014. 182
Located at http://cps.edu/fy16budget/Pages/capital.aspx and
http://cps.edu/CapitalPlanFY16/Pages/CapitalPlanFY16.aspx.
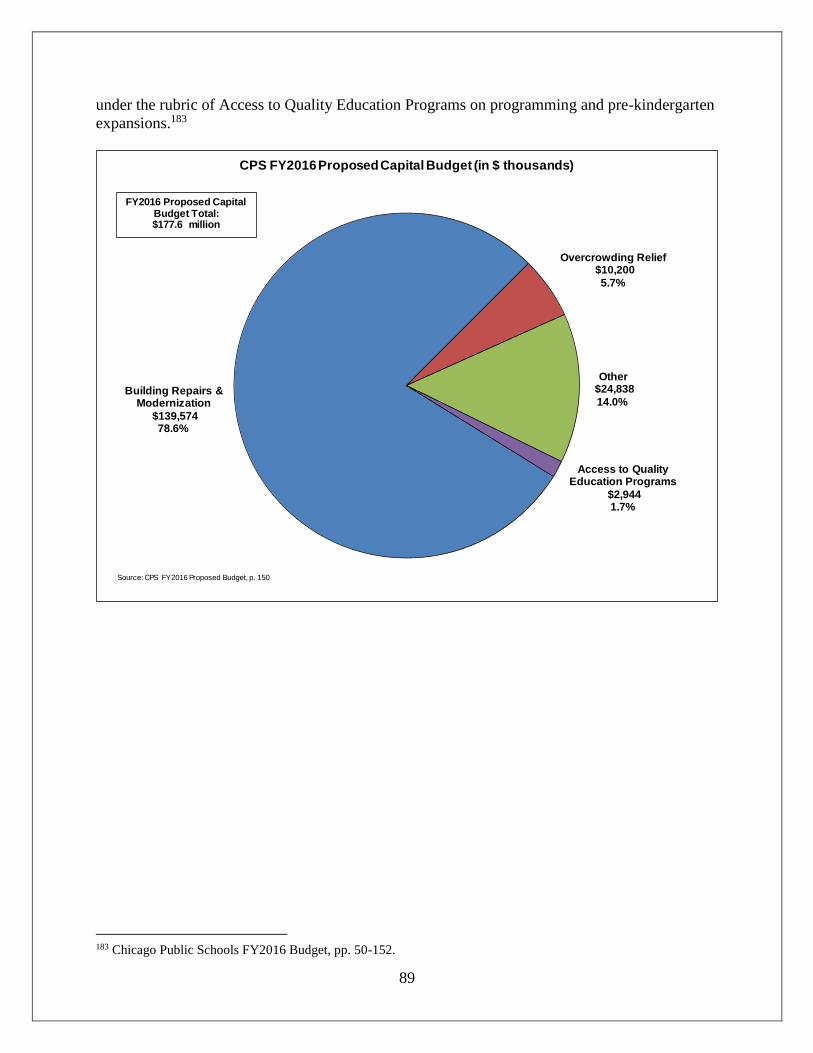
89
under the rubric of Access to Quality Education Programs on programming and pre-kindergarten
expansions.183
183 Chicago Public Schools FY2016 Budget, pp. 50-152.
Building Repairs & Modernization
$139,574 78.6%
Overcrowding Relief$10,200
5.7%
Other$24,838
14.0%
Access to Quality Education Programs
$2,944 1.7%
CPS FY2016 Proposed Capital Budget (in $ thousands)
Source: CPS FY2016 Proposed Budget, p. 150
FY2016 Proposed Capital Budget Total:$177.6 million
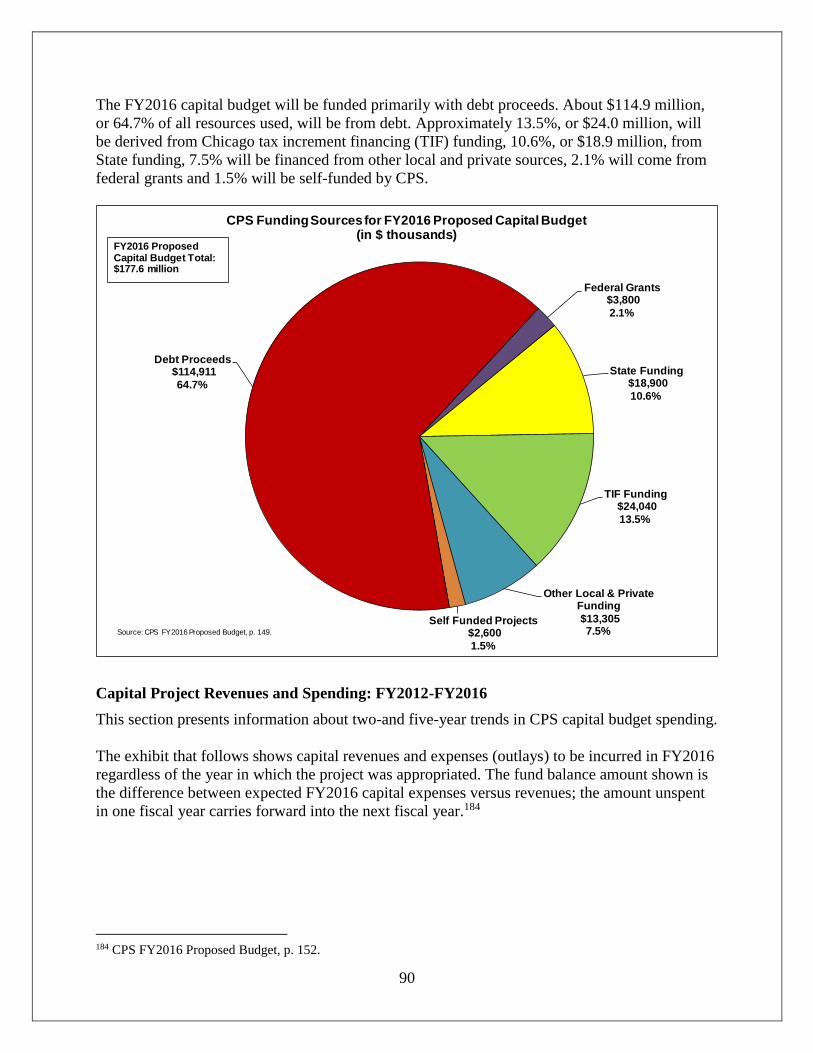
90
The FY2016 capital budget will be funded primarily with debt proceeds. About $114.9 million,
or 64.7% of all resources used, will be from debt. Approximately 13.5%, or $24.0 million, will
be derived from Chicago tax increment financing (TIF) funding, 10.6%, or $18.9 million, from
State funding, 7.5% will be financed from other local and private sources, 2.1% will come from
federal grants and 1.5% will be self-funded by CPS.
Capital Project Revenues and Spending: FY2012-FY2016
This section presents information about two-and five-year trends in CPS capital budget spending.
The exhibit that follows shows capital revenues and expenses (outlays) to be incurred in FY2016
regardless of the year in which the project was appropriated. The fund balance amount shown is
the difference between expected FY2016 capital expenses versus revenues; the amount unspent
in one fiscal year carries forward into the next fiscal year.184
184 CPS FY2016 Proposed Budget, p. 152.
Debt Proceeds$114,911
64.7%
Federal Grants$3,800
2.1%
State Funding$18,900
10.6%
TIF Funding$24,040
13.5%
Other Local & Private Funding
$13,305 7.5%
Self Funded Projects$2,600
1.5%
CPS Funding Sources for FY2016 Proposed Capital Budget (in $ thousands)
Source: CPS FY2016 Proposed Budget, p. 149.
FY2016 Proposed Capital Budget Total:$177.6 million
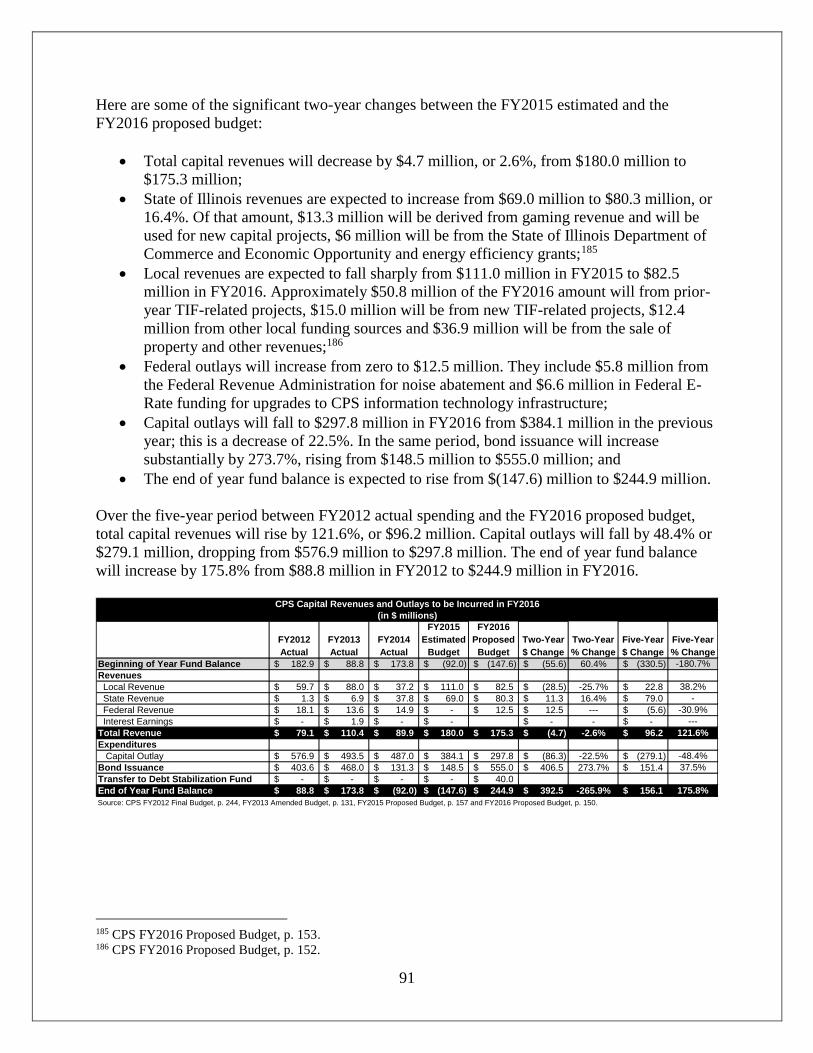
91
Here are some of the significant two-year changes between the FY2015 estimated and the
FY2016 proposed budget:
Total capital revenues will decrease by $4.7 million, or 2.6%, from $180.0 million to
$175.3 million;
State of Illinois revenues are expected to increase from $69.0 million to $80.3 million, or
16.4%. Of that amount, $13.3 million will be derived from gaming revenue and will be
used for new capital projects, $6 million will be from the State of Illinois Department of
Commerce and Economic Opportunity and energy efficiency grants;185
Local revenues are expected to fall sharply from $111.0 million in FY2015 to $82.5
million in FY2016. Approximately $50.8 million of the FY2016 amount will from prior-
year TIF-related projects, $15.0 million will be from new TIF-related projects, $12.4
million from other local funding sources and $36.9 million will be from the sale of
property and other revenues;186
Federal outlays will increase from zero to $12.5 million. They include $5.8 million from
the Federal Revenue Administration for noise abatement and $6.6 million in Federal E-
Rate funding for upgrades to CPS information technology infrastructure;
Capital outlays will fall to $297.8 million in FY2016 from $384.1 million in the previous
year; this is a decrease of 22.5%. In the same period, bond issuance will increase
substantially by 273.7%, rising from $148.5 million to $555.0 million; and
The end of year fund balance is expected to rise from $(147.6) million to $244.9 million.
Over the five-year period between FY2012 actual spending and the FY2016 proposed budget,
total capital revenues will rise by 121.6%, or $96.2 million. Capital outlays will fall by 48.4% or
$279.1 million, dropping from $576.9 million to $297.8 million. The end of year fund balance
will increase by 175.8% from $88.8 million in FY2012 to $244.9 million in FY2016.
185 CPS FY2016 Proposed Budget, p. 153. 186 CPS FY2016 Proposed Budget, p. 152.
FY2015 FY2016
FY2012 FY2013 FY2014 Estimated Proposed Two-Year Two-Year Five-Year Five-Year
Actual Actual Actual Budget Budget $ Change % Change $ Change % Change
Beginning of Year Fund Balance 182.9$ 88.8$ 173.8$ (92.0)$ (147.6)$ (55.6)$ 60.4% (330.5)$ -180.7%
Revenues
Local Revenue 59.7$ 88.0$ 37.2$ 111.0$ 82.5$ (28.5)$ -25.7% 22.8$ 38.2%
State Revenue 1.3$ 6.9$ 37.8$ 69.0$ 80.3$ 11.3$ 16.4% 79.0$ -
Federal Revenue 18.1$ 13.6$ 14.9$ -$ 12.5$ 12.5$ --- (5.6)$ -30.9%
Interest Earnings -$ 1.9$ -$ -$ -$ - -$ ---
Total Revenue 79.1$ 110.4$ 89.9$ 180.0$ 175.3$ (4.7)$ -2.6% 96.2$ 121.6%
Expenditures
Capital Outlay 576.9$ 493.5$ 487.0$ 384.1$ 297.8$ (86.3)$ -22.5% (279.1)$ -48.4%
Bond Issuance 403.6$ 468.0$ 131.3$ 148.5$ 555.0$ 406.5$ 273.7% 151.4$ 37.5%
Transfer to Debt Stabilization Fund -$ -$ -$ -$ 40.0$
End of Year Fund Balance 88.8$ 173.8$ (92.0)$ (147.6)$ 244.9$ 392.5$ -265.9% 156.1$ 175.8%
Source: CPS FY2012 Final Budget, p. 244, FY2013 Amended Budget, p. 131, FY2015 Proposed Budget, p. 157 and FY2016 Proposed Budget, p. 150.
CPS Capital Revenues and Outlays to be Incurred in FY2016
(in $ millions)
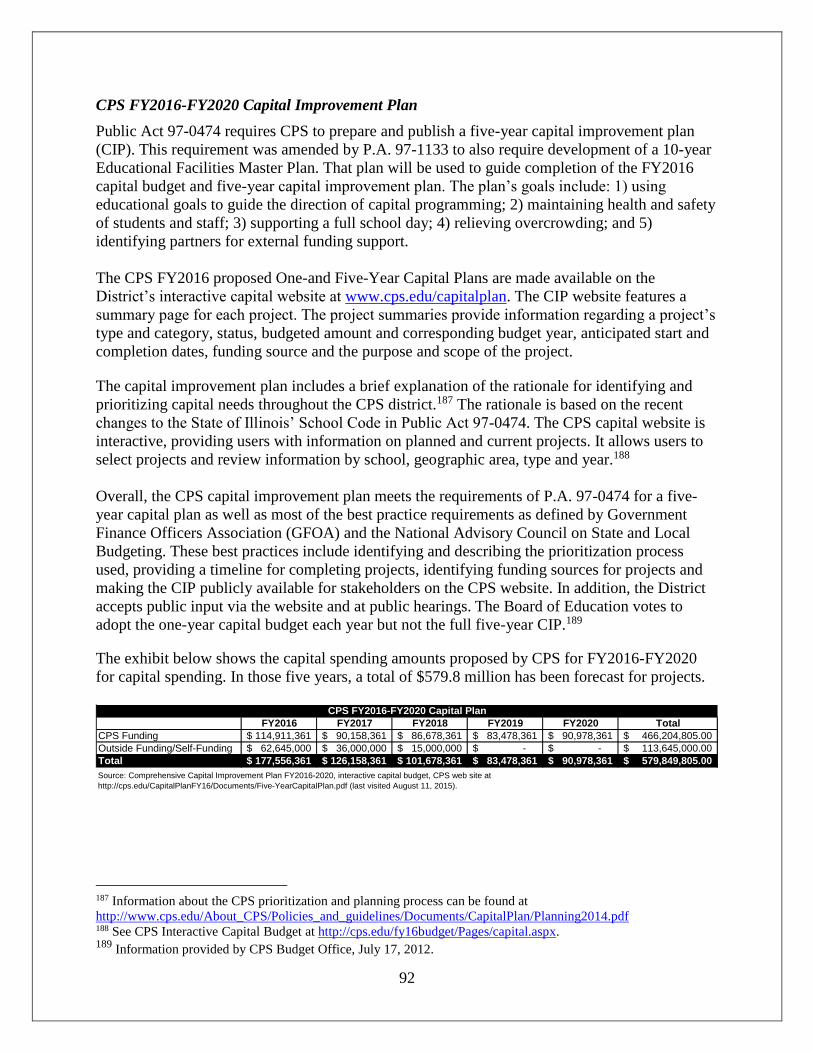
92
CPS FY2016-FY2020 Capital Improvement Plan
Public Act 97-0474 requires CPS to prepare and publish a five-year capital improvement plan
(CIP). This requirement was amended by P.A. 97-1133 to also require development of a 10-year
Educational Facilities Master Plan. That plan will be used to guide completion of the FY2016
capital budget and five-year capital improvement plan. The plan’s goals include: 1) using
educational goals to guide the direction of capital programming; 2) maintaining health and safety
of students and staff; 3) supporting a full school day; 4) relieving overcrowding; and 5)
identifying partners for external funding support.
The CPS FY2016 proposed One-and Five-Year Capital Plans are made available on the
District’s interactive capital website at www.cps.edu/capitalplan. The CIP website features a
summary page for each project. The project summaries provide information regarding a project’s
type and category, status, budgeted amount and corresponding budget year, anticipated start and
completion dates, funding source and the purpose and scope of the project.
The capital improvement plan includes a brief explanation of the rationale for identifying and
prioritizing capital needs throughout the CPS district.187 The rationale is based on the recent
changes to the State of Illinois’ School Code in Public Act 97-0474. The CPS capital website is
interactive, providing users with information on planned and current projects. It allows users to
select projects and review information by school, geographic area, type and year.188
Overall, the CPS capital improvement plan meets the requirements of P.A. 97-0474 for a five-
year capital plan as well as most of the best practice requirements as defined by Government
Finance Officers Association (GFOA) and the National Advisory Council on State and Local
Budgeting. These best practices include identifying and describing the prioritization process
used, providing a timeline for completing projects, identifying funding sources for projects and
making the CIP publicly available for stakeholders on the CPS website. In addition, the District
accepts public input via the website and at public hearings. The Board of Education votes to
adopt the one-year capital budget each year but not the full five-year CIP.189
The exhibit below shows the capital spending amounts proposed by CPS for FY2016-FY2020
for capital spending. In those five years, a total of $579.8 million has been forecast for projects.
187 Information about the CPS prioritization and planning process can be found at
http://www.cps.edu/About_CPS/Policies_and_guidelines/Documents/CapitalPlan/Planning2014.pdf 188 See CPS Interactive Capital Budget at http://cps.edu/fy16budget/Pages/capital.aspx. 189
Information provided by CPS Budget Office, July 17, 2012.
FY2016 FY2017 FY2018 FY2019 FY2020 Total
CPS Funding 114,911,361$ 90,158,361$ 86,678,361$ 83,478,361$ 90,978,361$ 466,204,805.00$
Outside Funding/Self-Funding 62,645,000$ 36,000,000$ 15,000,000$ -$ -$ 113,645,000.00$
Total 177,556,361$ 126,158,361$ 101,678,361$ 83,478,361$ 90,978,361$ 579,849,805.00$
Source: Comprehensive Capital Improvement Plan FY2016-2020, interactive capital budget, CPS web site at
http://cps.edu/CapitalPlanFY16/Documents/Five-YearCapitalPlan.pdf (last visited August 11, 2015).
CPS FY2016-FY2020 Capital Plan