Chemical, Physical, and Biological Factors …...Chemical, Physical, and Biological Factors...
229
Chemical, Physical, and Biological Factors Influencing Nutrient Availability and Plant Growth in a Pine Tree Substrate by Brian Eugene Jackson Dissertation submitted to the faculty of Virginia Polytechnic Institute and State University in partial fulfillment of the requirements for the degree of Doctor of Philosophy in Horticulture Dr. Robert Wright- Chairman (Department of Horticulture) Dr. John Seiler (Department of Forestry) Dr. Alex Niemiera (Department of Horticulture) Dr. Roger Harris (Department of Horticulture) Dr. Mark Alley (Department of Crop, Soil, and Environmental Sciences) October 24, 2008 Blacksburg, Virginia Keywords: container media, loblolly pine, Pinus taeda L., nitrogen immobilization, peat alternative, pine bark, pine chips, potting media, wood fiber, wood substrate, WoodGro™
Transcript of Chemical, Physical, and Biological Factors …...Chemical, Physical, and Biological Factors...

Chemical, Physical, and Biological Factors Influencing Nutrient
Availability and Plant Growth in a Pine Tree Substrate
by
Brian Eugene Jackson
Dissertation submitted to the faculty of Virginia Polytechnic Institute and State University in partial fulfillment of the requirements for the degree of
Doctor of Philosophy
in
Horticulture
Dr. Robert Wright- Chairman (Department of Horticulture)
Dr. John Seiler (Department of Forestry)
Dr. Alex Niemiera (Department of Horticulture)
Dr. Roger Harris (Department of Horticulture)
Dr. Mark Alley (Department of Crop, Soil, and Environmental Sciences)
October 24, 2008
Blacksburg, Virginia
Keywords: container media, loblolly pine, Pinus taeda L., nitrogen immobilization, peat alternative, pine bark, pine chips, potting media, wood fiber, wood substrate, WoodGro™
Chemical, Physical, and Biological Factors Influencing Nutrient
Availability and Plant Growth in a Pine Tree Substrate
by
Brian Eugene Jackson
(ABSTRACT)
Pine tree substrate (PTS) produced from freshly harvested loblolly pine (Pinus
taeda L.) trees has potential for replacing or reducing the use of aged pine bark (PB) and
peat moss as container substrates for horticulture crop production. The objective of this
work was to determine the factors influencing nutrient availability in PTS compared to
PB or peat substrates. Chapter two reports data on the response of japanese holly and
azalea to fertilizer rate when grown in PTS and PB. This study demonstrated that an
additional 2.4 kg·m-3 of Osmocote Plus (15N-3.9P-10K) controlled release fertilizer is
required for both species when grown in PTS compared to PB. Data are reported in
chapter three on the effects of fertilizer rate, substrate particle size, and peat amendment
on growth and floral quality, and on post-production time-to-wilting of poinsettias. Data
from this work show that PTS requires an additional 100 mg·L-1 N to grow poinsettias
comparable to plants grown in peat unless the particle size of PTS was decreased or 25%
peat was added, in which case no additional fertilizer was needed. Results also indicated
that PTS shrinkage was similar to that of peat, and that post-production time-to-wilting in
PTS plants was similar as plants grown in peat. Data in chapter four compares nitrogen
(N) immobilization rates, substrate carbon dioxide (CO2) efflux levels, and nutrient

iii
leaching in peat, PB, and PTS over time. Data from these studies indicated that more N
immobilization occurs in PTS than in PB or peat and that the substrate CO2 efflux levels
(estimate of microbial activity) corresponds to N immobilization in all substrates.
Nutrient availability, changes in physical and chemical properties, substrate shrinkage,
and microbial activity in PTS compared to PB during long-term nursery production are
reported in chapter five. Results showed that substrate nutrient levels remain lower in
PTS and that pH levels of PTS decrease considerably over two growing seasons
compared to PB. Results also indicate that PTS does decompose over time in containers,
but substrate shrinkage of PTS is similar to that of PL and PB during crop production.

iv
ACKNOWLEDGMENTS
Ten years ago I began my academic journey never knowing what the future would
hold or what direction my life would take. The only thing I had were high hopes and big
dreams of a bright and exciting future filled with all those great opportunities in life that
Dad always told me about. Little did I know then that over ten years later I would be
where I am today. As I reflect on my time here at Virginia Tech, I have several thoughts
that I will attempt to summarize in the paragraphs below as an overview of my exciting
and challenging graduate experience and a mention of those who helped make it possible.
As with most of life’s endeavors, successful completion of this degree would not
have been possible without the support, guidance, assistance, and encouragement of
many great people. First and foremost I owe my deepest and most heartfelt appreciation
to Dr. Robert Wright, my major advisor, who lifted me both personally and
professionally to new heights I never knew I could achieve at this stage of my life. He
challenged me to “think” and perform at the highest level, be mindful of others, ask the
right questions, and be proactive with everything I attempt to do in life. His support,
guidance, patience, and life examples have helped give direction to my life in such a
significant way that I can think of no way to appropriately thank him.
The guidance and friendship of Alex Niemiera will never be forgotten, nor will
our pre-lab walks that were always the highlight of my week! His love for teaching is
contagious and I look forward to many great years of interaction and collaboration with
him. Roger Harris is to be thanked for first introducing me to the possibility of coming to
Virginia Tech for my Ph.D. I will always remember our many conversations and light-
hearted chats in nearly every coffee shop in Blacksburg through the years. Roger is truly

v
a great scientist and friend. I was also lucky to have the opportunity to work with Drs.
John Seiler and Mark Alley as members of my graduate committee. They helped me
through some tough and challenging times during my program and always showed
patience, concern, and support for me when I needed it most. I am extremely grateful to
them both. To my dearest ladies of horticulture, Joyce Shelton, Maura Wood, Donna
Long, Connie Wallace, and Velva Groover I can never thank you all enough for all the
great times and memories that we shared through the years! A special thought goes to
Joyce for being there whenever I needed her. I will never eat at Taco Bell again and not
think of you! Lastly I offer many thanks to Jake Browder, John James, and Breanna Rau
for their assistance and most importantly their friendship.
On a personal note I would like to thank my parents, Eugene and Camelia Jackson
for giving me the support and encouragement to “spread my wings and fly” all those
years ago when they first dropped me off at the dorm at N.C. State. I never stopped
flying and never intend to. No one could ask for better parents whose love and guidance
will never be forgotten or matched. The support and love of my sister Stacey has also
meant a tremendous amount to me, more so in recent years than ever before.
Three and one-half years ago I embarked on a journey that would inevitably test
my confidence, determination, and willingness to succeed in every conceivable way.
Even with the tough challenges of graduate school, I dare say that no individual has
enjoyed their college experience more, meet more incredibly wonderful people, traveled
to more exciting and adventurous places, built more lasting and memorable friendships,
and been more excited about their career than I have, and for that I am extremely
fortunate. To say I would do it all over again is simply an understatement.

vi
TABLE OF CONTENTS Chapter I: Introduction and Literature Review Introduction……………………………….…………………………….…………………1 Literature Review……………….………………………………………….…...................2
Container Substrates in Horticulture…………………………..…… ……………..2 Physical and Chemical Properties of Container Substrates……………………….3 Bark Substrates…………………………………………………………………....4 Peat Moss………………………………………………………………………….5 Coconut Coir………………………………………………………………….…...6 Compost-based Materials……………………………………………………….…7 Wood-based Substrates and Substrate Components………………………...…...10 European Research with Wood-based Substrates………………………...……...11
Hortifibre®……………………………………………...………………..12 Fibralur®…………………………………………………...…………….12 Toresa®…………………………………………………...……………...13
Sawdusts as Container Substrates or Substrate Components…………...……….14 Other Research with Wood-based Materials………………………...…………..16
Pine Tree Substrates……………………………………………………..……....18 Nitrogen Immobilization in Wood-based Substrates……………………..……...21 Factors Influencing Nitrogen Immobilization and Wood Decomposition………25 Substrate CO2 Efflux and Microbial Activity…………………………..………..27 Shrinkage and Stability of Wood-based Substrates………………………..…….28 Summary…………………………………………………………………..……..30 Literature Cited…………………………………………………………..……....31
Chapter II: Effect of Fertilizer Rate on Growth of Azalea and Holly in Pine Bark and Pine Tree Substrates Abstract……………………………………………………………………...…………...79 Introduction……………………………………………………………...……………….80 Materials and Methods……………………………………………………....…………...83 Results and Discussion…………………………………………………………………..87 Conclusions……………………………………………………………………...……….94 Literature Cited………………………………………………………………...………...95 Chapter III: Pine Tree Substrate, Nitrogen Rate, Particle Size, and Peat Amendment Affects Poinsettia Growth and Substrate Physical Properties Abstract…………………………………………………………………………..……..109 Introduction……………………………………………………………...……...………110 Materials and Methods……………………………………………………….…..……..115 Results and Discussion……………………………………………………………...….119 Conclusions……………………………………………………………………...…...…125

vii
Literature Cited……………………………………………………….………………...126 Chapter IV: Comparison of Fertilizer Nitrogen Availability, Immobilization, and Leaching in Peat-Lite, Pine Bark, and Pine Tree Substrates Abstract………………………………………………………………..………………..140 Introduction…………………………………………………………..………………....141 Materials and Methods………………………………………………..………………...146 Results and Discussion………………………………………………..………………..152 Conclusions………………………………………………………….………………….157 Literature Cited…………………………………………………………….…………...158 Chapter V: Changes in Nutrient Availability, Chemical, and Physical Properties of Pine Tree Substrate, and Pine Bark during Long-term Nursery Crop Production Abstract…………………………………………………………………………...…….177 Introduction………………………………………………………………….……..…...178 Materials and Methods…………………………………………………………...……..184 Results and Discussion…………………………………………………………...…….188 Conclusions …………………………………………………………………..…….…..194 Literature Cited ……………………………………………………………….….…….196

viii
LIST OF TABLES
Chapter I: Introduction and Literature Review
Table 1.1 Organic materials researched as potential container substrate
alternatives……………………………………………………..………….9
Table 1.2 Several examples of tree species used in the production of wood- or
sawdust-based substrates that have been evaluated as container substrates
or substrate components…………………….. ………….…...….….……11
Table 1.3 Wood substrates developed and commercialized in Europe…….……….14
Chapter II: Effect of Fertilizer Rate on Growth of Azaleas and Holly in Pine
Bark and Pine Tree Substrates
Table 2.1 Average electrical conductivity (EC) levels and pH values of substrate
solution for japanese holly grown in pine bark or pine tree substrates for
three months when fertilized with four rates of Osmocote Plus15N-3.9P-
10K……….……………………………………………………………..101
Table 2.2 Substrate solution nutrient concentrations sampled on 7 Oct. 2005 and 20
Apr. 2007 for japanese holly grown in pine bark or pine tree substrate
fertilized with four rates of Osmocote Plus 15N-3.9P-10K….................102

ix
Table 2.3 Leaf tissue analysis taken on 22 Nov. 2005 and 25 May 2007 for japanese
holly grown in pine bark or pine tree substrate and fertilized with four
rates of Osmocote Plus 15N-3.9P-10K……………………………..…..103
Table 2.4 Physical and chemical properties of unamended pine bark and pine tree
substrates used in the production of japanese holly in 2005. Data were
collected from three samples per substrate on 13 Sept. 2005 and
represented as means…………..………………………………………..104
Table 2.5 Leaf tissue analysis taken on 25 May 2007, average electrical conductivity
(EC) levels and pH values over the experiment and substrate solution
nutrients sampled on 20 Apr. 2007 for azalea grown in pine bark or pine
tree substrate and fertilized with four rates of Osmocote Plus 15N-3.9P-
10K……...………………………………………………………..…..…105
Chapter III: Pine Tree Substrate, Nitrogen Rate, Particle Size, and Peat
Amendment Affects Poinsettia Growth and Substrate Physical Properties
Table 3.1 Particle size distribution of peat-lite (PL) and pine tree substrates (PTS)
produced with 2.36 and 4.76-mm hammer mill screens………………..134
Table 3.2 Initial and final (after 14 weeks in containers fertilized weekly with 300
mg·L-1 N) physical properties of peat-lite (PL) and pine tree substrates
x
(PTS). Peat-lite and the PTSs were used in the production of ‘Prestige’
poinsettias from16 Aug. 2007 to 15 Nov. 2007……………………..….135
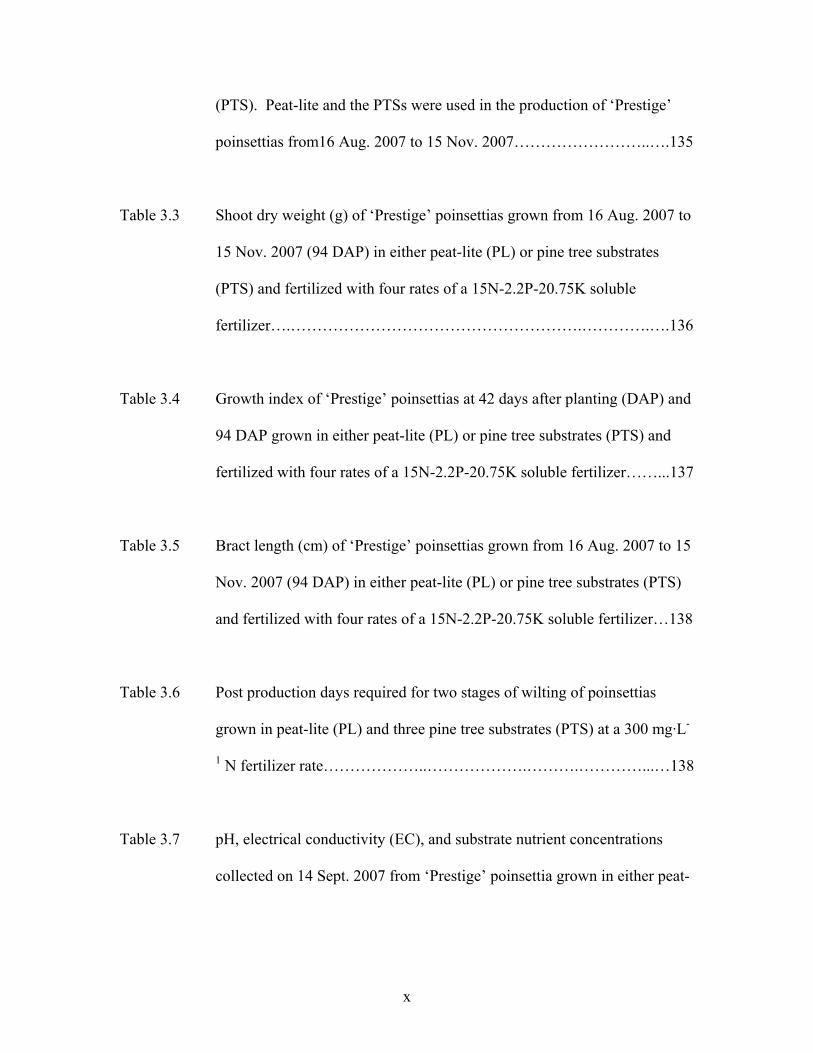
Table 3.3 Shoot dry weight (g) of ‘Prestige’ poinsettias grown from 16 Aug. 2007 to
15 Nov. 2007 (94 DAP) in either peat-lite (PL) or pine tree substrates
(PTS) and fertilized with four rates of a 15N-2.2P-20.75K soluble
fertilizer….……………………………………………….………….….136
Table 3.4 Growth index of ‘Prestige’ poinsettias at 42 days after planting (DAP) and
94 DAP grown in either peat-lite (PL) or pine tree substrates (PTS) and
fertilized with four rates of a 15N-2.2P-20.75K soluble fertilizer……...137
Table 3.5 Bract length (cm) of ‘Prestige’ poinsettias grown from 16 Aug. 2007 to 15
Nov. 2007 (94 DAP) in either peat-lite (PL) or pine tree substrates (PTS)
and fertilized with four rates of a 15N-2.2P-20.75K soluble fertilizer…138
Table 3.6 Post production days required for two stages of wilting of poinsettias
grown in peat-lite (PL) and three pine tree substrates (PTS) at a 300 mg·L-
1 N fertilizer rate………………..……………….……….…………...…138
Table 3.7 pH, electrical conductivity (EC), and substrate nutrient concentrations
collected on 14 Sept. 2007 from ‘Prestige’ poinsettia grown in either peat-

xi
lite (PL) or pine tree substrates (PTS) and fertilized with four rates of a
15N-2.2P-20.75K soluble fertilizer…………….……………………….139
Chapter IV: Comparison of Fertilizer Nitrogen Availability,
Immobilization, and Leaching in Peat-Lite, Pine Bark, and Pine Tree
Substrates
Table 4.1 Nitrate nitrogen (NO3-N) immobilized (mg) in peat-lite, pine bark, and
pine tree substrate at five sampling dates over 28 days (short-term
experiment) in containers fertilized with two rates of N from potassium
nitrate (KNO3)… ……………………………………………..…….…..168
Table 4.2 Substrate solution nitrate nitrogen (NO3-N mg·L-1) concentrations after 0
days incubation and after 4 days incubation in peat-lite (PL), pine bark
(PB), and pine tree substrate (PTS) over 28 days (short-term experiment)
when fertilized with two rates of N from potassium nitrate (KNO3)…...169
Table 4.3 Substrate CO2 efflux measured weekly in peat-lite, pine bark, and pine
tree substrate over 28 days (short-term experiment) in containers when
fertilized with three rates of nitrogen from potassium nitrate (KNO3)....170
Table 4.4 Nitrate nitrogen (NO3-N) immobilization (mg) in peat-lite, pine bark, and
pine tree substrate at five sampling dates when fertilized with four N rates
xii
from potassium nitrate (KNO3) over 10 weeks (medium-term
experiment)……………………………………………………………..171
Table 4.5 Substrate solution nitrate nitrogen (NO3-N mg·L-1) concentrations after 0
days incubation and after 4 days incubation in peat-lite (PL), pine bark
(PB), and pine tree substrate (PTS) over 10 weeks (medium-term
experiment) when fertilized with four rates of N from potassium nitrate
(KNO3)……………………………………………...…..…………...….172
Table 4.6 Substrate CO2 efflux measured every two weeks on peat-lite, pine bark,
and pine tree substrate when fertilized with four rates of nitrogen from
potassium nitrate (KNO3) for 10 weeks (medium-term experiment)…..173
Table 4.7 Nitrate nitrogen (NO3-N) leached (nutrient leaching experiment) from
peat-lite, pine bark, and pine tree substrates over 14 weeks when fertilized
with two rates of N from potassium nitrate (KNO3)………..………......174
Table 4.8 Phosphorus (P) leached (nutrient leaching experiment) from peat-lite, pine
bark, and pine tree substrates over 14 weeks when fertilized with two rates
of N from potassium nitrate (KNO3) and 45 mg·L-1 P from H3PO4....…175

xiii
Table 4.9 Potassium (K) leached (nutrient leaching experiment) from peat-lite, pine
bark, and pine tree substrates over 14 weeks when fertilized with two rates
of N from potassium nitrate (KNO3)……………………………...……176
Chapter V: Changes in Nutrient Availability, and Chemical and Physical
Properties of Pine Tree Substrate and Pine Bark during Long-term Nursery
Crop Production
Table 5.1 Particle size distribution of pine bark (PB) and pine tree substrates (PTS)
initially (at potting) and at 70 weeks after potting (WAP) in containers
with plants when fertilized with 4.2 (L) and 8.4 (H) kg·m-3 of Osmocote
Plus 15N-3.9P-10K) and maintained under outdoor nursery conditions.
Data are also reported for PTS in fallow containers after 70 WAP….....206
Table 5.2 Physical properties of pine bark (PB) and pine tree substrates (PTS)
initially (at potting) and at 70 weeks after potting (WAP) in containers
with plants when fertilized with 4.2 (L) and 8.4 (H) kg·m-3 of Osmocote
Plus 15N-3.9P-10K) and maintained under outdoor nursery conditions.
Data are also reported for PTS in fallow containers at 70 WAP…….…207
Table 5.3 Substrate solution pH and electrical conductivity (EC) sampled in 2006
and 2007 from pine bark (PB) or pine tree substrate (PTS) in containers

xiv
with plants when fertilized with two rates of Osmocote Plus 15N-3.9P-
10K……..….……………………………………………………………208
Table 5.4 Substrate solution concentrations of nitrate (NO3-N ), phosphorus (P), and
potassium (K) collected in 2006 from pine bark (PB) or pine tree substrate
(PTS) in containers with plants when fertilized with two rates of
Osmocote Plus 15N-3.9P-10K………………………………….…..…..209
Table 5.5 Substrate solution concentrations of nitrate (NO3-N ), phosphorus (P), and
potassium (K) collected in 2007 from pine bark (PB) or pine tree substrate
(PTS) in containers with plants when fertilized with two rates of
Osmocote Plus 15N-3.9P-10K………………………………………….210
Table 5.6 Substrate carbon dioxide (CO2) efflux measured in 2006 and 2007 from
containers filled with pine bark (PB) or pine tree substrate (PTS) with
plants when fertilized with two rates of Osmocote Plus 15N-3.9P-
10K….…………………………………………………………………..211
xv
LIST OF FIGURES Chapter I: Introduction and Literature Review Figure 1.1 Harvested loblolly pine trees being debarked at a processing facility
located in Warsaw, VA. The debarked logs are used for pulpwood or saw
timber and the removed bark is a by-product which can be used as a
container substrate…..…..………………………………………….……70
Figure 1.2 Aged pine bark stock piled on-site at a nursery ……………….…..…….70
Figure 1.3 Close-up view of unamended peatmoss. Peatmoss is most commonly used
as a container substrate for greenhouse crop production.……. …..……..71
Figure 1.4 Peatmoss is typically shipped from Canada in large compressed bales to
growers or substrate companies here in the United States…….…..……..71
Figure 1.5 Canadian peat bogs in their natural state before peat extraction.………..72
Figure 1.6 Once peat bogs are drained and cleared of vegetation, peat harvesting
requires large equipment which extracts the peat by several methods
including vacuuming……………………………………………….….…72

xvi
Figure 1.7 Close-up view two grades (particle sizes) of coconut coir which is
commonly used as a container substrate for greenhouse and nursery crop
production ...........................…………………….…………...…….….…73
Figure 1.8 Coconut coir is shipped in compressed bales to growers and substrate
companies here in the United States from several countries where
coconuts are produced including Sir Lanka, Indonesia, Mexico, and Costa
Rica ………..…………………………………………….…….….……..73
Figure 1.9 A managed plantation of loblolly pine (Pinus taeda) trees which are
currently grown for pulpwood (paper industry) or for the saw timber
industry, but can be grown specifically for producing pine tree substrate
for the horticulture industry……………………………………….…..…74
Figure 1.10 Harvested loblolly pine trees that have been delimbed and ready for
further processing (in a hammer-mill) into pine tree substrate......……...74
Figure 1.11 Industrial wood chipper used to chip pine logs into small wood chips that
are then small enough to be ground in a hammer-mill for substrate
production………………………………………………………………..75
Figure 1.12 Loblolly pine wood chips ready for processing (grinding) in a hammer-
mill to produce pine tree substrate…………………………….…………75
xvii
Figure 1.13 Loblolly pine wood chips (top) are ground in a hammer-mill (middle) to
reduce the size of the wood to a desired particle size (bottom) to produce
pine tree substrate ready for potting and planting…………………..……76
Figure 1.14 Pine tree substrate composed of 100% ground pine logs that is ready for
potting and planting……………………………………………………...77
Figure 1.15 Pine tree substrate produced with the addition of 25% aged pine bark
which improves the water and nutrient holding capacity of the
substrate……………………………………………………………..…...77
Figure 1.16 Native range of loblolly pine (Pinus taeda L.) trees in the United States,
showing the broad area where these trees naturally occur and could be
used for pine tree substrate production……………….………. …….......78
Figure 1.17 Loblolly pine trees can be grown in the shaded areas of the map which far
expands the native range (Fig 1.16) covering a much larger portion of the
United States where many nursery and greenhouse operations are located
(Gilman, 1994)……………………………………………..…………….78

xviii
Chapter II: Effect of Fertilizer Rate on Growth of Azaleas and Holly in Pine
Bark and Pine Tree Substrates
Figure 2.1 (A) (2005 study) Shoot dry weight; (B) root dry weight; (C) substrate CO2
efflux rates (µmols CO2.m-2.s-1) of japanese holly grown from 17 Aug.
2005 to 22 Nov. 2005 in pine bark (х) or pine tree substrate (○)
incorporated with four rates of Osmocote Plus 15N-3.9P-10K……...…106
Figure 2.2 (A) (2007 study) Shoot dry weight; (B) root dry weight; (C) substrate CO2
efflux rates (µmols CO2.m-2.s-1) of japanese holly grown from 1 Mar. 2007
to 25 May 2007 in pine bark (х) or pine tree substrate (○) incorporated
with four rates of Osmocote Plus 15N-3.9P-10K…………..…….…….107
Figure 2.3 (2007 study) Shoot dry weight of azalea grown from 1 Mar. 2007 to 25
May 2007 in pine bark (х) or pine tree substrate (○) incorporated with four
rates of Osmocote Plus 15N-3.9P-10K………………………..………..108
*Unless otherwise noted in the figure captions, all figures are property of the author.

1
CHAPTER I
INTRODUCTION
The nursery and greenhouse industries have experienced tremendous growth over
the last four decades. The USDA (Floriculture and Nursery Crops Yearbook, 2007)
reported that the nursery and greenhouse industries have increased economically by $52
million from 2005 to total $17 billion in gross receipts in 2006. The greenhouse and
nursery industries have undergone many changes and innovations during the last several
decades to more efficiently and properly manage irrigation, fertility, substrate use,
integrated pest management, etc (Bilderback, 2001; Yeager et al., 2007). Of these,
research and development of new substrates to replace conventionally used peat moss and
pine bark (PB) substrates has increased in recent years. In addition to developing and
utilizing new substrates, much work has focused on managing fertility and irrigation
programs of these substrates to maximize plant performance and minimize nutrient loss
due to environmental concerns (Gouin and Link, 1973; Warren and Bilderback, 2004).
Growing in containers offers many advantages to the grower such as year-round
marketing and the potential to produce many plants in a given area. However, container
production also requires daily attention and precise control of many critical production
factors (Bilderback, 1982). One of the most important factors is the medium or container
substrate in which the plants are grown, since the development and maintenance of an
extensive functional root system is essential to the growth of a healthy plant. A variety of
terms are applied to the materials in which the roots of crops grow. They include
growing media, soilless media, medium, potting or container mixes, potting composts
and substrates. Many of these terms are imprecise or can be confusing and will often be
2
used interchangeably. The term “substrate” avoids much of the confusion of other terms
and is descriptive of the entire composition.
Container-grown plants are subjected to the unique environment of growing in a
limited volume of root medium from which water and nutrients must be absorbed.
Uniformity in the substrate from one container to another or from one crop or season to
the next is essential if a grower is to standardize fertilizer or water application. The need
to develop new substrates and fertility management programs for the horticulture industry
is an issue that is being addressed by researchers around the world.
LITERATURE REVIEW
Container Substrates in Horticulture
A container substrate is the material or combination of materials used to grow
most greenhouse and nursery crops. The purpose of a container substrate is to physically
support plants and to supply adequate oxygen, water, and nutrients for proper plant
functions (Handreck and Black, 2005; Reinikainen, 1993). Several factors influence how
to choose substrates for horticultural crop production beginning with the type/species of
plants to be grown. Depending upon the production system substrates should be able to
sustain plant growth for short-term or long-term crops with minimal shrinkage or
degradation (Martin, et al., 1978; Reinikainen, 1993). Substrates should also be free from
undesirable components such as pathogens, weed seeds, and foreign materials such as
heavy metals, glass, and metal.
Soilless substrates began receiving notable attention in the 1970’s to replace the
use of field soil as a container substrate component (Aaron, 1982; DeWerth, 1971;

3
Gartner et al., 1971; Hoitink and Poole, 1979; Solbraa, 1974). In the last 35 years
container production of most all horticultural crops has depended essentially on quality
soilless substrates derived from both organic and inorganic constituents. Early reports of
materials that were used to replace field soil include peat moss, barks (hardwood and
softwood), wood shavings, wood chips, rice hulls, and numerous composted organic
residues (Bollen, 1969; Bollen and Lu, 1961; Bunt, 1988; Cappaert et al., 1973; Gartner
et al., 1973a; Hoitink and Poole, 1980; Molitor, 1983; Verdonck et al, 1983).
Physical and Chemical Properties of Container Substrates
The success of a horticultural substrate is mainly based on the behavior of the
plants grown in them; high quality substrates with the proper physical and chemical
properties can result in high yields and excellent plant quality (Chen et al., 1988;
Verdonck and Gabriels, 1988). When plants are grown in containers, their roots are
restricted to a small volume, consequently the demands made on the substrate for water,
air, nutrients, and support are much more intense than those made by field-grown plants
which have an infinitely greater volume of soil in which to facilitate root growth (Bunt,
1988). Interactions between individual substrate properties, irrigation water applied, the
environment the substrate is subjected to, and the cultural practices they undergo,
influence substrate structure (settling, decomposing, etc.) through time and in turn, plant
performance.
Recommendations for desirable physical properties have been determined for
horticultural substrates to give growers an idea of materials that could be used as
components for their substrate blends. In addition, the suggested physical and chemical
properties of substrates are outlined in The Best Management Practices (BMP) Guide for

4
Producing Container-Grown Plants (Yeager et al., 2007). This reference suggests the
following ranges for desired physical properties for container substrates after irrigation
and drainage (% volume basis): air space 10 to 30%, water holding capacity 45 to 65%,
total porosity 50 to 80%, and bulk density 0.19 to 0.70 g/cm3.
Numerous methods are used to determine physical properties of horticulture
substrates. A common procedure for determining substrate physical properties is the
North Carolina State University Porometer (Fonteno et al., 1995). Chemical properties
can be determined from leachate extracted from substrates by using one of several
popular methods including saturation extraction (Warncke, 1986), bulk solution
displacement (Nelson and Faber, 1986), and the pour-through nutrient extraction
procedure (Wright, 1986).
Bark Substrates
A by-product of the lumbermill and papermill industries, tree bark accumulated in
large quantities prior to the 1970’s and 1980’s. To avoid unsightly piles, sawmills often
incinerated the bark, or dumped it into rivers (Gartner et al., 1973b). Using treebark as a
container substrate provided a rational solution to the waste bark disposal problem
without polluting land, air, or water resources (Jervis and Regan, 1973; Svenson, 1986).
Since then growers in the western and southeastern regions of the United States have
found fir, redwood, or pine bark to be excellent sources of organic substrate components
for the production of ornamental plants in containers, while loblolly pine bark is the
favored component in the southeast U.S. (Pokorny, 1979). Hardwood tree bark has also

5
been shown to be a suitable substrate component for growers in the northern and
midwestern regions (Gartner et al., 1971; Hoitink, 1980; Hoitink and Poole, 1979).
Pine bark is removed from harvested trees (Fig. 1.1) and sent to bark suppliers or
private growers for aging/composting. Pine bark is aged in windrows for as little as 5
weeks or composted in windrows for up to 6 months. Aged PB (Fig. 1.2) is the preferred
substrate for growers even though research has shown that fresh PB can be used as a
substrate for successful crop production (Cobb and Keever, 1984; Harrelson et al., 2004).
Recently, supplies of PB in many southeastern states have been erratic and increasing in
price due to several factors. As the price of fuel and electricity increases, demand for PB
(and other wood by-products) for use as fuel has increased (Griffith, 2007; Lu et al, 2006;
Tilt et al., 1987), thereby reducing the amount of PB available for use as a growing
substrate. Secondly, the demand for PB as a packaged and bulk landscape mulch has
increased dramatically over the past decade. Since mulch commands a higher price to
home owners, and costs less to produce (less hammer milling, screening, no aging, etc.),
suppliers prefer to sell PB as mulch rather than as a less-profitable substrate to growers.
Finally, the amount of PB being produced by sawmills (timber industry) fluctuates
according to demand for lumber by the building industry and the need for pulpwood. As
the demand for lumber rises or falls, the number of trees being harvested and debarked
increases or decreases accordingly (Lu et al, 2006).
Peat moss
Sphagnum peat moss (Fig. 1.3) used in the U.S. comes from Canada and is
usually transported throughout the U.S. in large 64 ft3 bales (Fig. 1.4). Canadian

6
sphagnum peat moss is derived from the slow decomposition of sphagnum moss, which
accumulates in Canada’s bogs or peat lands (Fig. 1.5). To harvest peat, harvesters clear
bogs of vegetation and then dig shallow ditches to lower the water table. When the peat
dries, the equipment (Fig. 1.6) necessary to harvest the peat can operate on the field
(Keys, 2001). This process requires a lot of heavy equipment and labor, which in turn
means higher prices for the material.
The level of peatland exploitation is considered nonsustainable by wetland
ecologists (Robertson, 1993), but considered sustainable by the peat industry (Robertson,
1993), even though they recognize that alternatives to peat must be developed to meet
environmental and legal concerns pertaining to peatland exploitation (Pryce, 1991). The
mining of peat (destruction of non-renewable peat bogs) has raised concern among
environmental, scientific, private, and governmental agencies (Barkham, 1993; Carlile,
2004; Clark, 2008; Robertson, 1993) and have led to policy changes and governmental
regulations on peat use in several European countries. Peat supplies/production can also
be limited by wet weather conditions that restrict harvest (Hidalgo and Harkess, 2002)
during certain times of the year. These concerns, coupled with increasing fuel
(transportation) costs, have led to increased cost of peat substrates and therefore resulted
in a greater interest in less expensive and readily available substitutes.
Coconut Coir
Coir dust is the remaining waste product when long fibers are extracted from
coconut husk (Cocos nucifera L.). The coir constitutes the short fibers and mesocarp pith
of coconuts (Ma and Nichols, 2004; Fig. 1.7). Coir originates primarily from Sir Lanka,

7
India, Philippines, Indonesia, Mexico, Costa Rica, and Guyana (Evans and Stamps, 1996)
and is shipped to the U.S. in large bulk bales (Fig. 1.8). Coir dust has many desirable
substrate characteristics such as high water holding capacity; excellent drainage; absence
of weeds and pathogens; physically resilient; slow decomposition; acceptable pH, CEC,
and EC; easily wettable, and a renewable resource with no known ecological drawbacks
(Abad, et al., 2005; Cresswell, 1992; Lennartsson, 1997; Martinez et al., 1997; Pill and
Ridley, 1998; Verdonck et al., 1983). Due to these favorable characteristics, coir has
been extensively used as an environmentally safe substitute for natural peat in container
substrates.
Researchers have evaluated the potential use of coir as a container substrate (or
substrate component) with successful results growing annual bedding plants (Awang and
Ismail, 1997; Evans and Stamps, 1996; Handreck, 1993c), herbaceous perennials (Pill
and Ridley, 1998), foliage plants (Stamps and Evans, 1999), vegetables (Cresswell,
1992), and woody plants (Hernandez-Apaolaza et al., 2005). With the success and
stability of coir as an organic container substrate it has become a commercially popular
material that is now being used around the world as a peat substitute for container-grown
crops (Abad et al., 2005; Handreck, 1993c; Noguera et al., 1997). Coir remains a heavily
used alternative to peat moss as a substrate but due to the distances it has to be shipped,
transportation costs are also becoming a factor in its economical use as a substrate.
Compost-based Materials
Although composting has been practiced for thousands of years, it was not until
the 20th century that controlled scientific studies were published illustrating the benefits
of compost use in crop production. The two main horticultural uses of composts are as

8
soil amendments and as components in container substrates (Raviv, 2005). Raviv (2005)
lists three main reasons for the increased use of composts as a component in horticultural
container substrates: 1) in many cases, nonedible crops, such as ornamentals, forest and
garden trees, shrubs, etc., can serve as a safe outlet for composts that may be considered
as undesirable for use in food crop production; 2) various composts perform as well as
peat moss when used in container substrates and their cost is considerably lower; 3)
mature composts may suppress many soil borne diseases. Research has been conducted
through the years to confirm and further investigate the potential for marketing and
successfully incorporating these organic materials into current horticulture production
systems (Bugbee, 2002; Calkins et al., 1997; Chong et al., 2004; Hernandez-Apaolaza et
al., 2005; Jackson et al, 2005; Raviv, 1998).
However, some materials used for composting are proving to be unsuitable
because of their high degree of variability, limited availability, and their likelihood of
containing undesirable materials such as a glass, metal fragments, and heavy metals to
name a few. Other materials are not produced in volumes large enough to impact the
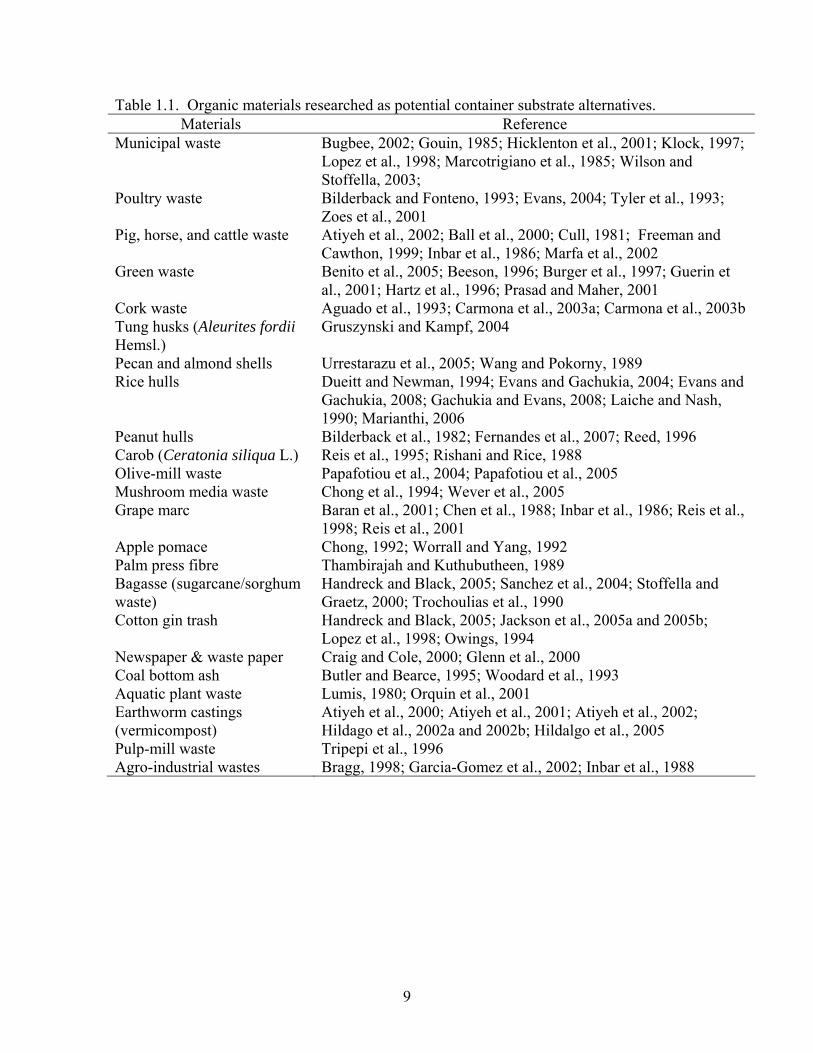
commercial market (Evans and Stamps, 1996). Several materials that have been
evaluated through the years for their potential for use as a container substrate are shown
in Table 1.1.
9
Table 1.1. Organic materials researched as potential container substrate alternatives. Materials Reference
Municipal waste Bugbee, 2002; Gouin, 1985; Hicklenton et al., 2001; Klock, 1997; Lopez et al., 1998; Marcotrigiano et al., 1985; Wilson and Stoffella, 2003;
Poultry waste Bilderback and Fonteno, 1993; Evans, 2004; Tyler et al., 1993; Zoes et al., 2001
Pig, horse, and cattle waste Atiyeh et al., 2002; Ball et al., 2000; Cull, 1981; Freeman and Cawthon, 1999; Inbar et al., 1986; Marfa et al., 2002
Green waste Benito et al., 2005; Beeson, 1996; Burger et al., 1997; Guerin et al., 2001; Hartz et al., 1996; Prasad and Maher, 2001
Cork waste Aguado et al., 1993; Carmona et al., 2003a; Carmona et al., 2003b Tung husks (Aleurites fordii Hemsl.)
Gruszynski and Kampf, 2004
Pecan and almond shells Urrestarazu et al., 2005; Wang and Pokorny, 1989 Rice hulls Dueitt and Newman, 1994; Evans and Gachukia, 2004; Evans and
Gachukia, 2008; Gachukia and Evans, 2008; Laiche and Nash, 1990; Marianthi, 2006
Peanut hulls Bilderback et al., 1982; Fernandes et al., 2007; Reed, 1996 Carob (Ceratonia siliqua L.) Reis et al., 1995; Rishani and Rice, 1988 Olive-mill waste Papafotiou et al., 2004; Papafotiou et al., 2005 Mushroom media waste Chong et al., 1994; Wever et al., 2005 Grape marc Baran et al., 2001; Chen et al., 1988; Inbar et al., 1986; Reis et al.,
1998; Reis et al., 2001 Apple pomace Chong, 1992; Worrall and Yang, 1992 Palm press fibre Thambirajah and Kuthubutheen, 1989 Bagasse (sugarcane/sorghum waste)
Handreck and Black, 2005; Sanchez et al., 2004; Stoffella and Graetz, 2000; Trochoulias et al., 1990
Cotton gin trash Handreck and Black, 2005; Jackson et al., 2005a and 2005b; Lopez et al., 1998; Owings, 1994
Newspaper & waste paper Craig and Cole, 2000; Glenn et al., 2000 Coal bottom ash Butler and Bearce, 1995; Woodard et al., 1993 Aquatic plant waste Lumis, 1980; Orquin et al., 2001 Earthworm castings (vermicompost)
Atiyeh et al., 2000; Atiyeh et al., 2001; Atiyeh et al., 2002; Hildago et al., 2002a and 2002b; Hildalgo et al., 2005
Pulp-mill waste Tripepi et al., 1996 Agro-industrial wastes Bragg, 1998; Garcia-Gomez et al., 2002; Inbar et al., 1988

10
Wood-based Substrates and Substrate Components
Wood residues constitute a significant source of soilless container substrates.
These materials are generally by-products of the lumber and sawmill industries but their
quantities depends on regional and sometimes seasonal availability. Nitrogen depletion
by soil microorganisms, and shrinkage during the decomposition process, is one of the
primary problems associated with these materials. However, supplemental applications
of N to the growing media can make most wood residues valuable amendments. The lack
of substrate consistency and insufficient quantities of these waste materials is a problem
for long-term and sustained use as a major substrate, especially for large production
operations. In response, researchers have begun testing wood-based substrates that are
specifically produced for use as container substrates instead of utilizing wood waste and
other by-product materials. Much work has been recently published on wood substrates
to demonstrate these substrates can be alternatives to current materials. Table 1.2 lists
some of the plant species used as sources of wood for substrate production.

11
Table 1.2. Several examples of tree species used in the production of wood- or sawdust-based substrates that have been evaluated as container substrates or substrate components.
Source Reference Hardwood species elm (Ulmus sp.) Kenna and Whitcomb, 1985; McCool, 1949 chinese tung tree (Aleurites fordii Hemsl.) Gruszynski and Kampf, 2004 eucalyptus sp. (Eucalyptus sp.) Beardsell et al., 1979; Worrall, 1978 gorse (Ulex sp.) Iglesias et al., 2008 locust (Robinia pseudoacacia L.) McCool, 1949 oak sp. (Quercus sp.) Kenna and Whitcomb, 1985; Rau et al., 2006 paper tree (Melaleuca quinquenervia Cav.) Ingram and Johnson, 1983; Poole and
Conover, 1985 red maple (Acer rubrum L.) Rau et al., 2006 sycamore (Platanus occidentalis L.) Rau et al., 2006 tree fern (Dicksonia sp.) Prasad and Fietje, 1989; Salvador, 2008 willow (Salix sp.) Gariglio et al., 2004 Softwood species balsam (Abies grandis D. Don) Newton, 1953 cedar (Thuja plicata D. Don) Newton, 1953 fir (Pseudotsuga sp.) Cotter, 1974; Newton, 1953; Kullmann, et al.,
2003 hemlock (Tsuga heterophylla Raf.) Newton, 1953 larch (Larix sp.) McCool, 1949 loblolly pine (Pinus taeda L.) Fain et al., 2008 ; Wright and Browder, 2005 longleaf pine (Pinus palustris Mill.) Fain et al., 2008 spruce (Picea sp.) Gumy, 2001; McCool, 1949; Kullmann et al.,
2003 scots pine (Pinus sylvestris L.) Kullmann et al., 2003 slash pine (Pinus elliottii Engelm.) Fain et al., 2008 white pine (Pinus strobes L.) Rau et al., 2006 white spruce (Picea glauca Moench.) Dorais et al., 2005 yellow pine (Pinus echinata Mill.) McCool, 1949
European Research with Wood-based Substrates
Research in Europe has been conducted for over two decades on the development
of horticultural substrates composed of wood (Gumy, 2001; Raviv and Lieth, 2008).
There are considerable quality differences between the various types of wood fibre
substrates available on the commercial market (Gumy, 2001). Substrate manufacturers
would ideally like to have products whose physical and chemical properties are as similar
12
as possible to those of peat. It is possible however, that even with different properties,
growers can use wood fiber substrates if they are willing to adapt their management and
cultural practices to accommodate the new substrate mixes. The only wood fibre
products that will be successful are those that are readily available, of consistent quality,
competitively priced, and for which an efficient production system has been developed.
Hortifibre®
Systematic development of wood fibre products in Europe for horticultural
purposes was initiated in France at the end of the 1980s by Elf Aquitaine, the inventor of
the first commercial wood substrate called Hortifibre® (Schilling, 1999). Hortifibre® is
produced from a patented process of wood fibre separation where mechanical and
thermal pressure are applied to wood chips, cutting it into shavings which are then treated
with steam to drive off (volatilize) toxins found in fresh wood (Lemaire et al., 1989).
The species of pine used to produce Hortifibre® are Pinus pinaster and Pinus sylvestris.
This process allows for the production of coarse or fine fibres so that the final product
can have the particle size desired.
Fibralur®
Researchers at the Public University of Navarre (Pamplona, Spain) who, jointly
with the Aralur company in Ziordia (Navarre, Spain), have developed a wood substrate
that is patented and currently marketed in Europe (mainly Spain). The product is called
"Fibralur®" and is made from pine wood shavings which have been defibered by means
of an industrial process. The resulting material has proved to be successful in growing

13
mushrooms and other hydroponic crops, nursery crops, and to a lesser extent, with
vegetable and forest nurseries (Aralur, 2008; Muro et al., 2005). The same machinery
used for defibering wood to make paper is used to make Fibralur®. Wood fibre for
papermaking goes through two or three defibering processes while Fibralur® substrate is
the result of a single defibration resulting in thicker and longer wood fibers. During this
defibration process the bark of the pine is subjected to a washing in water at a
temperature of 90-115 ºC, the resulting cellulose being practically pure, free of
phytotoxic products and ready to be used in the growing of agricultural crops (Aralur,
2008).
Toresa®
The most produced and available wood substrate currently in Europe is called
Toresa®. Toresa® was developed and patented (European Patent No. 91 905 064. 1-2313
/ 0 472 684) by Prof. Franz Penningsfeld and Gerhard Baumann in Germany (Gumy,
2001; Schilling, 1999). There are four different formulations/brands of Toresa® (Toresa
Spezial, Toresa Standard, Toresa Holzfaser, and Toresa Eco) that are produced and
marketed within Europe, with the main differences between the products being the
addition (impregnation) of fertilizers or differences in the source and type of wood used
to make the wood fibre. Toresa® is primarily produced in Germany, The Netherlands,
Austria, and Switzerland with 90 – 95% of the wood used for production coming from
spruce (Picea abies; Schilling, 1999). The remaining wood (5 – 10%) is derived from
other conifer species, hardwood species, and some wood waste (Fraxinus, Populus, Salix,
Fagus; Gumy, 2001). In 1999 it was estimated that 200,000 m3 of Toresa® would be

14
produced and distributed in the EU (Schilling, 1999). The untreated wood used to make
Toresa® is processed by two “thermo screw presses” that actually tear the wood chips,
creating a soft wood fiber (personal observation at a Toresa® processing facility in
Hamburg Germany at an Intertoresa AG, Inc. facility). The screws shred the wood chips
under fractional pressure, heat and steam, and simultaneously have the capability to
impregnate the wood fibre with additives (color, fertilizers, etc.; Gumy, 2001). It is
recommended that 20-40% (up to 70%) of a container substrate can be replaced with this
wood fibre with no negative impact on plant growth or without adjusting management
strategies (fertilization, irrigation, etc.) of the substrate (Schilling, 1999).
A more complete list of the commercial wood substrates that have been
developed and commercialized in Europe during the last two decades are in Table 1.3.
Table 1.3. Wood substrates developed and commercialized in Europe. Substrate Authors & Year Toresa® Gumy, 2001; Penningsfeld 1992 Culti-Fibre® Gumy, 2001; Sramek and Dubsky, 2002 Pietal® Gumy, 2001; Prasad and Maher, 2004 Torbo® Gumy, 2001; Schmilewski, 2008 Torbella® Gumy, 2001; Schmilewski, 2008 Bio-Culta® Gumy, 2001; Schmilewski, 2008 HortiFibre® Gumy, 2001; Beniot and Ceustermans, 1994 Fibralur® Muro et al., 2005 Fibrosana® Gruda et al., 2008 Ekofibre® Clark and Basham, 2002; Wever et al., 2004
Sawdusts as Container Substrates or Substrate Components
Plant production in substrates which contain large portions of sawdust has
required new strategies in N management as plants grown in such substrates have a
tendency to become N deficient due to N immobilization (Handreck, 1991; Hoitink and
15
Poole, 1980; Worral, 1985). Like hardwood bark, plant growth is severely restricted in
uncomposted sawdust (Allison and Murphy, 1962; Allison, 1965). This effect is mainly
one of a depletion of available N but walnut and incense cedar sawdust is known to have
direct phytotoxic effects (Allison and Murphy, 1962). Sawdust has characteristics that
make it desirable for use in a growing mix. It has a bulk density slightly less than
sphagnum peat moss, has similar water retention but greater air space after drainage than
pine bark (Bilderback, 1982). Large amounts of N must be added to compensate for N
depletion of sawdust. It is estimated that 2 to 3% N by weight is required to compost
sawdust, thus 100 pounds (45 kg) of sawdust would require 2 to 3 pounds (0.91 - 1.36 kg)
actual N. Great risk of very high soluble salt levels would occur if this much N was
added while growing a nursery crop. Also hardwood sawdusts decay more rapidly than
PB sawdust and require about 1% by weight more N to accomplish decomposition
(Worrall, 1985). Old sawdust has a lower N requirement than fresh sawdust but full
decomposition cannot occur without the addition of N.
Richards (1981) outlines the problems of growing plants in pure Pinus radiata
sawdust including the difficulty in providing sufficient N to overcome N immobilization
while avoiding osmotic stress from the salinity of the high concentration of nutrients
applied. Thomas et al. (1980) found that seedling plants grown in peat/sand media were
consistently superior to those grown in a similar mix but containing one third P. radiata
sawdust. A range of fertilizer types and N levels did not significantly improve growth in
the sawdust medium. Plants growing in the sawdust-based mix generally showed greater
leaf chlorosis indicative of N deficiency. Sharman and Bodman (1991) grew a range of
woody ornamentals in media containing 50% composted Eucalyptus sawdust, other

16
organic materials, and only 10 to 15% mineral materials. They applied controlled-release
fertilizers at a range of rates and reported satisfactory growth particularly where leafy
plants were grown at high N rates. Non-composted sawdust from douglas fir
(Pseudotsuga menziesii Mirb.) and western hemlock (Tsuga heterophylla Raf.) have also
been used to grow a wide range of herbaceous and woody container crops in Canada
where sawdust is plentiful (Maas and Adamson, 1972).
Other Research with Wood-based Materials
Ground melaleuca trees (Melaleuca quinquenervia Cav.) were shown to be an
acceptable substitute for bark or sedge peat when used to grow a number of woody and
herbaceous plants (Conover and Poole, 1983a; Conover and Poole, 1983b; Ingram and
Johnson, 1983; Poole and Conover, 1985). No phytotoxicity problems were evident in
these studies as long as the proportion of melaleuca did not exceed 50% of the substrate
volume.
Ground stem core of kenaf (Hibiscus cannabinus L.), a light weight biomass crop
grown in several Gulf Coast States including Louisiana, Mississippi, and Texas has been
used successfully as a replacement for pine bark in production media for greenhouse and
tropical nursery crops (Goyne and Arnold, 1996; Howell et al., 1993; Wang, 1994). Lang
(1997) and Webber et al. (1999) reported results with a substrate composed of
noncomposted ground kenaf (Hibiscus cannabinus L.) plants to produce poinsettia and
periwinkle (Vinca minor L.) with equal size and quality to plants grown in peat-based
substrates. Tsakonas et al. (2005) used processed whole-stem kenaf and sand as a
substrate to produce lettuce (Lactuca sativa L.) and pepper (Capsicum annum L.) plants.

17
Seeds were sown directly into the kenaf substrate and a peat-based substrate with
germination and total plant growth data recorded over 100 days. They found that plant
growth for both species was inhibited by kenaf even when used as only a 10% component
of a peat substrate. Growth differences in their study were eliminated by soaking the
kenaf substrate in an NH4NO3 solution prior to use, indicating that N was the limiting
factor to plant growth. Laiche and Newman (1994) evaluated composted and
noncomposted kenaf substrate in the production of holly (Ilex crenata Thunb.
‘Cherokee’) and found that composted kenaf produced larger and better quality plants.
They also concluded that plants grown in composted kenaf substrate had equal growth to
plants grown in the PB control. Composted kenaf produced larger plants than
noncomposted kenaf, and the recommendation was made that kenaf needs to be
composted prior to its use a substrate.
Kenna and Whitcomb (1985) demonstrated that Pyracantha x ‘Mojave’ and
Liquidambar formosana Hance. grew as well in a substrate of woodchips:peat:sand (3:1:1
v/v/v) as in a substrate composed of bark:peat:sand (3:1:1 v/v/v). Wood chips for their
study were produced by grinding entire trees including leaves, twigs, bark and wood of
post oak (Quercus stellata Wangh.) and Siberian elm (Ulmus pumila L.). Wood shavings
of fir (Pseudotsuga menziesii Mirb.) and redwood (Sequoia sempervirens D. Don) trees
(derived from hardwood and softwood tree species (Criley and Watanabe, 1974) have
been investigated for the production of carnations (Dianthus caryophyllus L.) (Stark and
Lukaszuk, 1991), chrysanthemums (Chrysanthemum morifolium Ramat.) (Scott and
Bearce, 1972; Still et al., 1972), and other potted foliage plants (Worrall, 1981) with
results compared to peat-based substrates.

18
Pine Tree Substrates
Laiche and Nash (1986) produced a pine tree substrate (PTS) derived from PB
with a considerable percentage of pine wood and a second PTS derived from whole pine
trees (needles, twigs, bark, and wood). They reported that plant growth (Rhododendron
indica L. ‘President Clay’, Ligustrum sinense Lour. ‘Variegata’, and Ilex crenata Thunb.
‘Compacta’) was highest in 100% PB compared to the two PTSs and that additional work
was needed before pine wood could be used as a container substrate.
Wright and Browder (2005) demonstrated that japanese holly (Ilex crenata
Thunb. ‘Chesapeake’), azalea (Rhododendron obtusum Planck. ‘Karen’), and marigold
(Tagetes erecta Big. ‘Inca Gold’) could be grown in a noncomposted PTS (100% wood)
produced from debarked loblolly pine trees. Nutrient analysis of the PTS substrate
solution indicated that nutrient levels and pH were acceptable for plant culture, although
extra fertilizer was added to PTS to maintain comparable electrical conductivity (EC)
levels between the two substrates. Wright et al., 2006 also evaluated the growth of
numerous woody nursery species (27 genera) in a PTS produced from ground pine logs
(including the bark; approximately 90% wood and 10% bark) compared to PB. Results
from this work concluded that plant dry weights were generally higher in PB than PTS,
but differences in growth between PB and PTS were less when plants were supplied with
higher fertilizer rates (21 g vs. 15 g Osmocote Plus 15N-3.9P-10K; O.M. Scott
Horticulture Products, Maryville, OH). Growth differences in these studies were
attributed to lower nutrient levels in the PTS due to either leaching or microbial
immobilization of applied nutrients.
19
Based on this work a U.S. patent (Chipped wood as a substrate for plant growth;
patent number 7165358) has been granted to Virginia Tech. Since then, PTS produced
from freshly harvested delimbed loblolly pine trees that are between 12 and 15-years-old
has also been used to successfully grow a wide variety of herbaceous annuals and
perennials and greenhouse crops including poinsettias and chrysanthemums (Jackson et
al., 2007; Jackson and Wright, 2008; Jackson et al., 2008b; Wright et al., 2008a; Wright
et al. 2008c). Pines of that age are normally harvested as part of a thinning/management
operation (Fig. 1.9) and the timber is often used for paper production or energy uses. The
logs with bark still intact (Fig. 1.10) were chipped in an industrial tree chipper (Fig. 1.11)
to produce pine chips (2.5 cm x 2.5 cm x 0.5 cm; Fig. 1.12). The pine chips are then
passed through a hammer mill to obtain a desired particle size (Fig. 1.13). Once
produced, PTS is a clean material free from foreign debris, soil, rocks, weed seeds or
pathogens and can be immediately used to fill containers for plant production (Fig. 1.14).
Conceivably, a tree can be harvested, chipped, ground, and filled in containers for use as
a substrate all in the same day. Pine tree substrate has also been produced (hammered)
with 25% PB to increase water retention and CEC (Fig. 1.15) which also gives the PTS a
more “soil-like” look that most growers and retail consumers are accustomed to seeing in
their potting substrates.
Fain et al. (2008b) manufactured a PTS (referred to as WholeTree) by chipping
and grinding freshly harvested 8- to 10-year-old pine trees (Pinus taeda, P. elliottii, and
P. palustris) including the wood, bark, limbs, and needles. They reported that vinca
(Catharanthus roseus L.) grown in PTS were smaller than plants grown in 100% PB, but
that growth index and visual quality of the plants were similar for both substrates.
20
Further work by Boyer et al. (2008) showed that growth of ageratum (Ageratum
houstonianum Mill. ‘Blue Hawaii’) and salvia (Salvia x superba Stapf. ‘Vista Purple’)
was comparable to 100% PB when grown in a substrate derived from a tree by-product
(limbs, needles, bark, cones, etc.) known as clean chip residual that remains after pine
trees are harvested for pulp wood. Clean chip residual has also been used as a successful
substrate component in the production of wood shrubs and perennials (Boyer et al., 2007;
Boyer, 2008).
In most studies additional fertilizer is required for PTS compared to commercial
peat or PB substrates. Research has concluded that it takes an additional 100 mg·L-1 N
from a 20N-4.4P-16.6K Peat-Lite Special water soluble fertilizer to produce comparable
growth of bedding plants and chrysanthemums in PTS compared to peat substrates
(Wright et al., 2008a and 2008c). However, the addition of peat moss or aged PB to PTS
has been shown to improve plant growth, especially at lower fertilizer rates (Fain et al.,
2008a, 2008c; Jackson et al., 2008a). This is likely because peat and PB increase the
retention of nutrients available for plant uptake by increasing the cation exchange
capacity (CEC) of the PTS. For woody plants it has been shown that an additional 4 lbs
per cu. yd (2.4 kg·m-3) of Osmocote Plus (15N-3.9P-10K) controlled release fertilizer is
required (depending on species, PTS particle size, irrigation regime, etc.) for optimal
plant growth in PTS compared to PB (Jackson et al., 2008a; Wright et al., 2006).
Research on PTS has also shown that no lime additions are required for the
variety of species tested due to the inherently high pH (around 6.0) of freshly harvested
and ground pine wood (Saunders et al., 2005; Wright et al., 2008a). However, when peat
moss and PB are added to PTS, lime is required in proportion to the ratio of peat and PB

21
added to PTS. For woody nursery plants a large number of genera have been grown
without lime additions with comparable growth to those grown in PB which requires lime
depending upon the species grown (Wright et al., 2006). Also, an addition of sulfur is
required for PTS compared to peat moss and PB for the growth of marigold. Sulfur can
be supplied as elemental sulfur, Micromax, FeSO4, MgSO4, or CaSO4 at the rate of 1.5
lbs per cu. yd. of any one of the above materials (Wright and Jackson, 2008).
Loblolly pine is native to the southeastern U.S. (Fig. 1.16) and can be grown in
areas far outside its native range putting it in close proximity to nursery and greenhouse
operations across the southern U.S. (Fig. 1.17). Pine tree substrate can be produced in
these areas, minimizing transportation costs to growers. It should also be mentioned that
the use of wood materials (including loblolly pine trees) are being developed as fuel
sources (i.e. wood pellets). Competition for loblolly pine trees for fuel wood should be
considered as it relates to the cost of pine chips and ultimately the production cost of PTS
as it is developed and utilized commercially in the future. One way to offset potential
competition for pine wood is to establish pine plantations specifically for PTS production
by individual growers or by a consortium of growers in areas throughout the southeast to
guarantee sufficient wood sources in the future.
Nitrogen Immobilization in Wood-based Substrates
In wood substrates, microorganism activity is higher than peat or PB substrates
due to the higher C/N ratio of wood (Gruda, 2005). The microorganisms need mineral N
for the synthesis of their protein components and will immobilize available N from the
soil/substrate solution, decreasing the amount of N that is available for plant uptake

22
(Gumy, 2001). Nitrogen immobilization in wood substrates can cause substantial
nutritional problems for cultivated plants and thus became one of the most important
factors causing possible yield losses (Gruda and Schnitzler, 1997; Gruda and Schnitzler
1999; Gruda et al., 2000). In addition to N, it has also been reported that phosphorus and
sulfur can be immobilized by microorganisms during the decomposition of wood
materials (Bodman and Sharman, 1993; Handreck, 1996; Sharman and Bodman, 1991).
Optimal plant growth is ensured only if the sufficient N is available for both,
microorganisms and plants (Handreck, 1992a; Handreck, 1992b). Several methods and
cultural strategies have been developed and utilized to reduce N immobilization in wood
substrates and improve fertilizer management strategies during crop production: 1)
Composting wood materials has been shown to eliminate or significantly reduce the
potential for N immobilization to occur during crop production by lowering the C:N ratio
and allowing the initial breakdown which requires high levels of N for microorganisms
(Aldin, 1989; Bollen and Glennie, 1961; Gutser et al., 1983; McKenzie, 1958; Prasad,
1997; Worrall, 1985); 2) or the use of a nutrient impregnation process such as the one
used in the production of Toresa®, a commercial wood fibre substrate in Europe, which
mechanically grinds wood chips together with an accurately specified quantity of nutrient
compounds in machines called retruders (Gumy, 2001; personal observation (Brian
Jackson and Robert Wright) at an Intertoresa AG manufacturing facility in Hamburg,
Germany, March 13, 2007). The nutrients are forced into the wood fibers by high
pressure and heat during the production of Toresa (Baumann and Penningsfeld, 1991;
Penningsfeld, 1992; Schilling, 1999). Gruda et al. (2000) concluded that N impregnation
in wood fibre substrates was sufficient to provide enough N for the initial microbial

23
immobilization occurring during the first days of crop production; 3) or a technique call
the Fersolin process impregnates wood material with sulfuric acid in the presence of hot
gases 2000 °F (933 °C) resulting in a decrease in decomposable cellulose which results in
lower microbial activity and need for N (Bollen and Glennie, 1961); 4) A process for
treating wood materials by pyrolysis (a form of incineration that chemically decomposes
organic materials by heat in the absence of oxygen) has been evaluated as a method to
breakdown unstable and toxic wood components into more stable and non-toxic
components that are resistant to microbial decay which retards microbial N demand
(Bollen and Glennie, 1961). The methods described above are often expensive, time
consuming, and non-practical for many substrate companies and growers, and 5) The
application of additional fertilizer during crop production is an easy method for supplying
the N concentrations needed to satisfy the microbial immobilization and the plant needs
and this is the most widely used and preferred method of countering N immobilization
(Gruda et al., 2000; Gruda, 2005; Jackson and Wright, 2008; Jackson et al., 2008a;
Wright et al., 2008a).
Gruda et al. (2000) studied N immobilization in peat and wood fiber substrates
(WFS) with and without N impregnation. Three levels of N fertilizer were tested and N
immobilization was calculated on the basis of N balance including N uptake by plants
and residual mineral N in the substrates. A strong net N immobilization appeared in non-
impregnated WFSs, particularly under the higher N fertilization rates. On average for all
three N levels, immobilization was calculated at more than 175 mg·L-1 N per L substrate
in an experiment without plants and 200 mg·L-1 N in an experiment with plants. The
quantity of immobilized N was over 6% higher in the experiment with plants than in the
24
experiment without plants. The calculated N immobilization varied between 102 - 282
mg·L-1 N in pots with non-impregnated wood fiber without plants. Similar results are
supported by other works (Grantzau, 1991; Meinken and Fischer, 1997; Penningsfeld,
1992).
The impregnated wood fiber substrates studied by Gruda et al. (2000) had a
similar C/N ratio to those for peat 54-63:1. The net N immobilization in impregnated
WFS was approximately equal for peat with a mean of approximately 100 mg. In these
experiments it was observed that the more N supplied, the higher the N immobilization
was in a substrate. Meinken and Fischer (1997) showed in their investigations with
marigold, that with an increase of N added to the substrate from 350 to 650 mg·L-1 N, N
immobilization increased from 65 to 127 mg·L-1 N, respectively. These results were
similar to those reported by Scharpf (2002) who also observed an increase in N
immobilization with increasing rates N application. Zagal and Persson (1994) proposed
that microorganisms in substrates will convert more N, if more N is applied, thus higher
microbial populations are present in substrates with higher levels of N application. Other
researchers reported the influence of plant root exudations, which can cause a fast
reproduction of microorganisms and thus a higher N immobilization (Meinken and
Fischer, 1997; Zagal et al., 1993).
The most frequently used and accepted method for determining N immobilization
in soilless substrates is the nitrogen drawdown index (NDI) procedure developed by
Handreck (1992a, 1992b). The NDI procedure involves saturating “charging” a substrate
with a KNO3 fertilizer solution containing 75 mg·L-1 N and then incubating the substrate
at 22 ˚C for 4 days. Substrate solution nitrate (NO3-N) levels are determined

25
immediately following saturation on day 0 and then again after day 4 (the incubation
period). Nitrogen drawdown index is then calculated by the following formula (NO3
measured on day 4 / NO3 measured on day 0 x 100). The resulting index is a value
between 1.0 and 0.0 with a value of 1.0 representing no N loss during the 4 day
incubation and an index value of 0.0 indicating complete N loss after 4 days. Substrates
composed of large amounts of wood materials (high C:N ratio) will immobilize all, or
nearly all, of the N during the 4 day incubation when using 75 mg·L-1 N, making it
impossible to determine the amount needed by the substrate. Handreck (1992b) has
recommended that the N concentration in the saturating solution be 150 mg N L-1 when
substrates with a high demand for N are being tested, or that the incubation time be
decreased in order to obtain measurable amounts of N remaining in the substrate after
incubation. Similarly, Sharman and Whitehouse (1993) suggest that saturating solutions
with concentrations of 150, 200, or 300 mg N L-1 can be used in N immobilization tests
on materials with high C:N ratios, such as PTS, that are expected to have high rates of
immobilization occurring.
Factors Influencing Nitrogen Immobilization and Wood Decomposition
pH. Liming substrates to increase pH is a common nursery and greenhouse
management practice that may influence N immobilization. Ogden and Mills (1988) and
Niemiera and Wright (1986) reported that liming pine bark to increase pH from 3.5 to 5.5
produced a significant decrease in NO3-N recovered in leachates. Increased microbial
activity (and nutrient immobilization) at higher pH was proposed to account for the
difference. McKenzie (1958) also reported that N immobilization in soil amended with
sawdust increased significantly with a pH rise from 6.9 to 7.9. Contrary to these
26
findings, Sharman (1993) reported no change in N immobilization with changes in pH of
a wood-based substrate. It is believed however that the range of pH levels (5.3 to 6.6)
were not broad enough to influence microbial populations, therefore no change in N
immobilization occurred.
Temperature. The influence of temperature on N availability is considered to
have a major influence on microbial activity (Bagstam, 1978; Bagstam, 1979; Niemiera
and Wright, 1987; Sharman, 1993; Walden and Wright, 1995). Increasing temperature
over the range of 20 to 50 °C is reported to encourage microbial activity and accelerate
cellulose decomposition (Cappaert et al., 1975). Sharman (1993) reported a significant
increase in N immobilization in response to increasing temperature from 10 to 30 °C.
Similar to these results, Bagstam (1978) reported higher microbial activity in spruce bark
when incubation temperatures rose from 20 °C to 45 °C. The influence of temperature
on N immobilization could explain the seasonal differences in N requirements of wood
substrates during crop production as discussed by Sharman (1993). It is recommended
that growers (users) of wood-based substrates incubate test samples at ambient
production temperatures when assessing potential N immobilization so that accurate N
requirements for the substrate can be determined under production conditions (Sharman,
1993).
Particle size. The rate of decomposition is positively correlated to the particle
size of organic materials in soil (Allison and Murphy, 1963; Matus et al., 1997; Neal et
al., 1965). Small particles result in greater overall surface area for a given volume of
substrate/material, increasing the possibilities for microbial attack and activity (Fog,
27
1988; Thomas et al., 1998). In contrast, a large particle size will further delay the
decomposition of recalcitrant plant components.
C:N ratio. Early texts on N immobilization tended to place a heavy emphasis on
the C:N ratio. Bunt (1988) reported how two PBs with the same C:N ratio (about 300:1)
and under similar conditions had very different C decomposition rates (i.e., 24% and
4%). However, Bunt (1988) also stated that N immobilization is more likely in materials
with a high C:N ratio as they are more deficient in N. There are limitations with the C:N
ratio as not all the C is available to microorganisms (Cheshire et al., 1999;
Mtanbanengwe and Kirchmann, 1995).
Substrate CO2 Efflux and Microbial Activity
The estimation of microbial populations in soils or soilless substrates may be
accomplished by several methods, for example by counting a sub sample of the
population (by either microscopy or plating on agar), by assaying some unique
component of biomass such as ATP, or by measuring the metabolic activity of the
population (Turner and Carlile, 1983). Measuring the metabolic activity of a microbial
population (respiratory activity) involves monitoring CO2 evolution or O2 consumption.
Techniques for monitoring CO2 evolution from soil were pioneered by Waksman (1932)
and are still widely used in studies of microbial activity in soils and soilless substrates
(Gough and Seiler, 2004; Jackson et al., 2008a; Pronk, 1997; Söderstrom et al., 1983;
Turner and Carlile, 1983). It has been shown that microbial activity (estimated by CO2
efflux from soils) increases in response to N fertilization in N limiting soils (Zhang and
Zak, 1988) and to P fertilization in P limiting soils (Gallardo and Schlesinger, 1994).
28
Microbial activity has also been reported to decrease in response to high rates of N
fertilization of forest soils (Smolander et al., 1994; Thirukkumaran and Parkinson, 2000).
Substrate respiration is influenced by a number of factors, including substrate quality
(Fog, 1988), temperature (Davet, 2004), soil moisture (Bowden et al., 2004; Davet,
2004), root biomass (Davet, 2004; Helal and Sauerbeck, 1985), and microbial activity
and biomass (Davet, 2004).
Laboratory incubation of root-free soil shows that heterotrophic respiration from
the microbial community in fertilized plots is reduced compared to non-fertilized plots
(Bowden et al., 2004). Compton et al. (2004) found that repeated N additions over time
decreased microbial biomass and diversity, and Frey et al. (2004) observed that active
fungal biomass was lower in fertilized plots than in control plots. Frey et al. (2004) also
detected a significant reduction in the activity of the enzyme phenol oxidase, a lignin-
degrading enzyme produced by white rot fungi with increased application of N to soils.
Shrinkage and Stability of Wood-based Substrates
The term shrinkage refers to decomposition and resulting loss of volume of a
substrate in a container. According to Whitcomb (2006), three complications arise from
media shrinkage. First, N is tied-up (immobilized) during decomposition. Second, the
particle size, drainage, and aeration characteristics of the substrate change quickly,
increasing the water holding capacity while decreasing the aeration. Third, reduced depth
of the substrate in the container will further enhance poor drainage.
Prasad and O’Shea (1999) conducted incubation tests on several peat materials
and on two commercial wood fibre substrates (Hortifibre® and Cultifibre®). Substrate
29
volume reduction was greatest (almost 50%) in the woodfibre materials compared to the
peat. These results are consistent with other published by Fischer et al., (1993) who
found reduction in a wood fibre substrate of 36-47% during a 15 month incubation
period. Meinken and Fischer (1997) reported a 50% wood fibre substrate volume loss
over a one year crop production experiment. The wood substrates used in these reports
were composed of a mixture of various tree species; primarily spruce (Picea abies L.).
Lemaire et al. (1989) conducted an experiment with Hortifibre® and found that
after 240 days of incubation without N there was 9% dry matter loss, and wood fibre
samples with the addition of N experiences 12.5% dry matter loss signifying increased
microbial breakdown with the addition of an N-source. Even with 12.5% dry matter loss,
the biostability of Hortifibre® is considered to be acceptable for horticultural crop
production (Lemaire et al., 1989; Lemaire, 1997).
Prasad and Maher (2004) evaluated the breakdown (shrinkage) of coconut coir
and three wood fiber substrates (Hortifibre®, Toresa®, and Pietal®) and reported that
breakdown (in the form of substrate shrinkage) was least in coir and higher in all the
wood fibre substrates tested. The authors also reported that the incorporation of peat
moss in the wood fibers significantly decreased the breakdown over 9 and 21 month
incubation periods because of the stability of the peat and its resistance to further
breakdown compared to the wood. It was also noted that the incorporation of lime
increased the rate of breakdown in all the wood fibre substrates due to the increased
substrate pH which apparently promoted increased microbial activity. These results were
similar to other reports of increased breakdown of wood substrates when lime is
incorporated (Aendekerk, 1997; Maher and Prasad, 2002).
30
The deterioration of peat-based substrates is low during storage or during plant
production because of the high percentage of lignin found in peat, which is resistant to
microbial attack. Thus, deterioration and/or absorption of added nutrients rarely occurs
in peat media, even though these may be limed to pH levels of 5.5-6.0, a range eminently
suitable for microbial development and activity (Carlile, 2004).
Summary
The use of wood-based materials as container substrates has been investigated for
many years as alternatives to traditional PB and peat mixes. Many of the issues related to
the use of wood as substrates have been discussed in this review with particular emphasis
on N immobilization and fertility management during crop production. With the
previous work as a reference, the work discussed in this dissertation is based on
investigations of PTS to further understand its fertility requirements over time during
crop production in containers. Issues of PTS that will be addressed in this work include
specific fertilizer requirements for greenhouse and nursery crops, the degree and timing
of N immobilization, the use of substrate CO2 efflux as an estimate for microbial activity
and N immobilization potential, the nutrient leaching potential, and changes in chemical
and physical properties during plant production.
31
Literature cited
Aaron, J.R. 1982. Conifer bark: its properties and uses. Forest Commun. Forest Rec. 110.
Abad, M, F. Fornes, C. Carrion, V. Noguera, P. Noguera, A. Maquieira, and R.
Puchades. 2005. Physical properties of various coconut coir dusts compared to peat.
HortScience 40:2138-2144.
Aendekerk, T.G.L. 1997. Decomposition of peat substrates in relation to physical
properties and growth of Chamaecyparis. Acta Hort. 450:191-198.
Afferden, van M., A,M, Hansen, C. Kaiser, and N. Chapelain. 2006. Laboratory test
system to measure microbial respiration rate. Int. J. Environment and Pollution 26:220-
233.
Aguado, M.T., M.C. Ortega, M.T. Moreno, and M.P. Suarez. 1993. Growth and nutrient
content of Pelargonium frown in cork oak bark substrate. Acta Hort. 342:293-296.
Aldin Ala, H. 1989: Eignung von Hobelspänen und Holzschnitzeln in Kultursubstraten
für Baumschulgehölze. Dissertation, Universität Hannover.
Allison, F.E. and R.M. Murphy. 1963. Comparative rates of decomposition in soil of
wood and bark particles of several species of pines. Soil Sci. Soc. Amer. Proc. 27:309-
312.
32
Allison, F.E. 1965. Decomposition of wood and bark sawdusts in soil, nitrogen
requirements, and effects on plants. US. Dept. Agr. Tech. Bull. No. 1332, 58 pp.
Aralur, S.L. Ziordia (Navarra). Innovation, research, and development. 24 July, 2008.
http://www.aralur.com/Default.htm
Atiyeh, R.M., S. Subler, C.A. Edwards, G. Bachman, J.D. Metzger, and W. Shuster.
2000. Effects of vermicomposts and composts on plant growth in horticultural container
media and soil. Pedo. Biologia 44:579-590.
Atiyeh, R.M., C.A. Edwards, S. Subler, and J.D. Metzger. 2001. Pig manure
vermicompost as a component of a horticultural bedding plant medium: effects on
physicochemical properties and plant growth. Biores. Technol. 78:11-20.
Atiyeh, R.M., N.Q. Arancon, C.A. Edwards, and J.D. Metzger. 2002. The influence of
earthworm-processed pig manure on the growth and productivity of marigolds. Biores.
Technol. 81:103-108.
Awang, Y., and M.R. Ismail. 1997. The growth and flowering of some annual
ornamentals on coconut dust. Acta Hort. 450:31-38.
33
Bagstam, G. 1978. Population changes in microorganisms during composting of spruce
bark: I. influence of temperature control. European J. Appl. Microbiol. Biotechnol.
5:315-330.
Bagstam, G. 1979. Population changes in microorganisms during composting of spruce
bark: II. Mesophilic and thermophilic microorganisms during controlled composting.
European J. Appl. Microbiol. Biotechnol. 6:279-288.
Ball, A.S., D. Shah, and C.F. Wheatley, 2000. Assessment of the potential of a novel
newspaper/horse manure-based compost. Biores. Technol. 73:163-167.
Baran, A., G. Cayci, C. Kutuk, and R. Hartman. 2001. Composted grape marc as a
growing medium for hypostases (Hypostases phyllostagya). Biores. Technol. 78:103-106.
Barkham, J.P. 1993. For peat’s sake: conservation or exploitation. Biodiv. Conserv.
2:556-566.
Baumann, G. and F. Penningsfeld 1991: Verfahren zur Herstellung von Torfersatz,
Anlage zur Durchführung dieses Verfahrens, Anwendung des Verfahrens und nach
diesem Ver fahren hergestellter Torfersatz. Europäische Patenschrift. Veröffentlichungs-
nummer (Process and installation for manufacturing substitute peat and the application of
the process).

34
Beardsell, D.V., D.G. Nichols, and D.L. Jones. 1979. Water relations of nursery potting
media. Scientia Hort. 11:9-17.
Beeson, Jr. R.C. 1996. Composted yard waste as a component of container substrates. J.
Environ. Hort. 14:115-121.
Benoit, F. and N. Ceustermans. 1994. Growing pepper on ecologically sound
substrates. Acta Hort. 361:167-178.
Benito, M., A. Masaguer, R. De Antonio, and A. Moliner. 2005. Use of pruning waste
compost as a component in soilless growing media. Biores. Technol. 96:597-603.
Bilderback, T.E. 1982. Container soils and soilless media. In: Nursery crops production
manual. North Carolina State University, Raleigh, NC.
Bilderback, T.E., W.C. Fonteno, and D.R. Johnson. 1982. Physical properties of media
composed of peanut hulls, pine bark, and peatmoss and their effects on azalea growth. J.
Amer. Soc. Hort. Sci. 107:522-525.
Bilderback, T.E. and W.C. Fonteno. 1993. Improving nutrient and moisture retention in
pine bark substrates with rockwool and compost combinations. Acta Hort. 342:265-272.
Bilderback, T.E. 2001. Environmentally compatible container plant production
35
practices. Acta Hort. 548:311-318.
Bilderback, T.E., Warren, S.L., Owen, Jr. J.S. and Albano, J.P. 2005. Healthy
substrates need physicals too! HortTechnology 15:747-751.
Bodman, K. and K.V. Sharman. 1993. Container media management. Queensland DPI,
Queensland Nursery Industry Association, Brisbane, Australia. 40 p.
Bollen, W.B. and K.C. Lu. 1961. Microbial decomposition and nitrogen availability of
reacted sawdust, bagasse, and coffee grounds. Agri. and Food Chem. 9:9-15.
Bollen, W.B. and D.W. Glennie. 1961. Sawdust, bark, and other wood wastes for soil
conditioning and mulching. Forest Prod. J. 11:38-46.
Bollen, W.B. 1969. Properties of tree barks in relation to their agricultural utilization.
USDA For. Serv. Pac. Northwest Forest Range Expt. Stn. Res. Pap PNW77 36 pp.
Bowden, R.D., E. Davidson, K. Savage, C. Arabia, and P. Steudler. 2004. Chronic
nitrogen additions reduce total soil respiration and microbial respiration in temperate
forest soils at the Harvard Forest. For. Ecol. Manage. 196:43-56.
36
Boyer, C.R., G.B. Fain, C.H. Gilliam, and J.L. Sibley. 2007. Performance of container-
grown loropetalum grown in clean chip residual substrate. Comb. Proc. Intl. Plant Prop.
Soc. 57:680-684.
Boyer, C.R. 2008. Evaluation of clean chip residual as an alternative substrate for
container-grown plants. Dissertation, Auburn University, Auburn, AL, 188p.
Boyer, C.R., G.B. Fain, C.H. Gilliam, T.V. Gallagher, H.A. Torbert, and J.L. Sibley.
2008. Clean chip residual: a substrate component for growing annuals. HortTechnology
18:423-432.
Bragg, N.C. 1998. The commercial development of a sustainable peat alternative
substrate from locally derived industrial by-products. Acta Hort. 469:61-67.
Buamscha, M.G., J.E. Atland, D.M. Sullivan, D.A. Horneck, and J.P.G. McQueen. 2008.
Nitrogen availability in fresh and aged Douglas fir bark. HortTechnology 18:619-623.
Bugbee, G.J. 2002. Growth of ornamental plants in container media amended with
biosolids compost. Compost Sci. 10: 92-98.
Bunt, A.C. 1988. Media and Mixes for Container Grown Plants. Second Ed. Unwin
Hyman, London.

37
Burger, D.W., T.K. Hartz, and G.W. Foster. 1997. Composted green waste as a container
medium amendment for the production of ornamental plants. HortScience 32:57-60.
Butler, S.H. and B.C. Bearce. 1995. Greenhouse rose production in media containing coal
bottom ash. J. Environ. Hort. 13:160-164.
Calkins, J.B. B.R. Jarvis, and B.T. Swanson. 1997. Compost and rubber tire chips as peat
substitutes in nursery container media: growth effects. J. Environ. Hort. 15:88-94.
Cappaert, I., O. Verdonck, and M. De Boodt. 1973. Barkwaste as a growing medium for
plants. Acta Hort. 37:2013-2022.
Cappaert, I., O. Verdonck, and M. De Boodt. 1975. Composting of hardwood bark.
Compost Sci.16:12-15.
Carlile, W.R. 2004. Growing media and the environmental lobby in the UK 1997-2001.
Acta. Hort 644:107-113.
Carmona, E., J. Ordovas, M.T. Moreno, M. Aviles, M.T. Aguado, and M.C. Ortega.
2003a. Hydrological properties of cork container media. HortScience 38:1235-1241.
38
Carmona, E., J. Ordovas, M.T. Moreno, M. Aviles, M.T. Aguado, and M.C. Ortega.
2003b. Granulometric characterization and alteration during composting of industrial
cork residue for use as a growing medium. HortScience 38:1242-1246.
Chen, Y., Y. Ingar, and Y. Hadar. 1988. Composted agricultural wastes as potting media
for ornamental plants. Soil Science 145: 298-303.
Cheshire, M.V., C.N. Bedrock, B.L. Williams, S.J. Chapman, I. Solntseva, and I.
Thomsen. 1999. The immobilization of nitrogen by straw decomposing in soil. Eur. J.
Soil Sci. 50:329-341.
Chong, C., G. Lumis, P. Purvis, and A. Dale. 2004. Growth and nutrient status of six
species of nursery stock grown in a compost-based medium with recycled nutrients.
HortScience 39:60-64.
Chong, C. 1992. Apple pomace as an amendment in container growing media.
HortScience 27:1138.
Chong, C., R.A. Cline, and D.L. Rinker. 1994. Bark- and Peat-amended spent mushroom
compost for containerized culture of shrubs. HortScience 29:781-784.
Clark, I. and J. Basham. 2002. EKOFibre: an alternative to mineral wool for tomato
production. HortiTech, Project Report, pp 1-8.

39
Clark, D. 2008. The wise use of peat in horticulture. Acta Hort. 779:161-164.
Cobb, G.S. and G.J. Keever. 1984. Effects of supplemental nitrogen on plant growth in
fresh and aged pine bark. HortScience 19:127-129.
Compton, J., L.S. Watrud, L.A. Porteus and S. DeGrood. 2004 Response of soil
microbial biomass and community composition to chronic nitrogen additions at Harvard
forest. For.Ecol. Mgmt. 196:143–158.
Conover, C.A. and R.T. Poole. 1983a. Utilization of Melaleuca quinquenervia as a
potting medium component for greenhouse production of foliage plants. HortScience
18:886-888.
Conover, C.A. and R.T. Poole. 1983b. Sedge moss peat, solite, and Melaleuca
quinquenervia as potting medium components for shade house production of foliage
plants. HortScience 18:888-890.
Cotter, D.J. 1974. Yields of successive cropping of tomato in sawdust and bark media.
HortScience 9:387-388.
Craig, P. and J.C. Cole. 2000. Recycled paper as a growth substrate for container Spirea
production. HortScience 35:1253-1257.

40
Cresswell, G.C. 1992. Coir dust – A viable alternative to peat? P. 1-5. In: Proc. Austral.
Potting Mix Manufacturers’ Conf., Syndey.
Criley, R.A. and R.T. Watanabe. 1974. Response of chrysanthemum in four soilless
media. HortScience 9:385-386.
Cull, D.C., 1981. Alternatives to peat as a container media: organic resources in the UK.
Acta Hort. 126:69-81.
Davet, P. 2004. Microbial ecology of the soil and plant growth. Scientific Publishing,
Enfield, NH.
DeWerth, A.F. 1971. The use of pine bark in the production of ornamental crops. Texas
Agri. Exp. Sta. Bull. MP-991. 12 pp.
Dorais, M., J.Caron, G. Begin, A. Gosselin, L. Gaudreau, and C. Menard. 2005.
Equipment performance for determining water needs of tomato plants frown in sawdust
based substrates and rockwool. Acta Hort. 691:293-304.
Dueitt, S.D. and S.E. Newman. 1994. Physical analysis of fresh and aged rice hulls used
as a peat moss substitute in greenhouse media. Proc. Southern Nursery Assn. Res. Conf.
39:81-85.

41
Evans, M.R. and R.H. Stamps. 1996. Growth of bedding plants in sphagnum peat and
coir dust-based substrates. J. Environ. Hort. 14:187-190.
Evans, M.R. 2004. Processed poultry feather fiber as an alternative to peat in greenhouse
crops substrates. HortTechnology 14:176-179.
Evans, M.R. and M. Gachukia. 2004. Fresh parboiled rice hulls serve as an alternative to
perlite in greenhouse crop substrates. HortScience 39:232-235.
Evans, M.R. and M.M. Gachukia. 2008. Secondary macro-and microelements in
sphagnum peat-based substrates amended with parboiled fresh rice hulls or perlite.
HortTechnology 18:650-655.
Fain, G.B., C.H. Gilliam, J.L. Sibley, and C.R. Boyer. 2008a. Establishment of
greenhouse-grown Tagetes patula and Petunia xhybrida in ‘WholeTree’ substrates. Acta
Hort. 782:387-393.
Fain, G.B., C.H. Gilliam, J.L. Sibley, and C.R. Boyer. 2008b. Wholetree substrates
derived from three species of pine in production of annual vinca. HortTechnology
18:13-17.

42
Fain, G.B., C.H. Gilliam, J.L. Sibley, and C.R. Boyer, A.L. Walker. 2008. Wholetree
substrate and fertilizer rate in production of greenhouse-grown petunia (Petunia xhybrida
Vilm.) and marigold (Tagetes patula L.). HortScience 43:700-705.
Fernandes, C, J.E.Cora, and L.T. Braz. 2007. Reuse of sand, crushed sugarcane and
peanut hull-based substrates for cherry tomato production. Sci. Agric. 64:1-7.
Fischer, P., E. Meinken, F. Kalthoff. 1993. Holzfaserstoffe im test. (Woodfibre in test)
Gärtnerbörse Gartenwelt 26:1220-1222.
Floriculture and Nursery Crops Yearbook - Sumary. 2007. Economic research service,
U.S. Dept. Agri., FLO-2007. 2 Sept. 2008.
http://www.ers.usda.gov/publications/flo/2007/09Sep/FLO2007.pdf
Fog, K. 1988. The effect of added nitrogen on the rate of decomposition or organic
matter. Biol. Rev. 63:433-462.
Fonteno, W.C., C.T. Hardin, and J.P. Brewster. 1995. Procedures for determining
physical properties of horticultural substrates using the NCSU Porometer. Horticultural
Substrates Laboratory. North Carolina State University, Raleigh, N.C.
Freeman, T.M. and D.L. Cawthon. 1999. Use of composted dairy cattle solid biomass,
poultry litter and municipal biosolids as greenhouse growth media. Compost Sci. 7:66-71.
43
Frey, S.D., M. Knorr, J.L. Parrent, and R.T. Simpson. 2004. Chronic nitrogen enrichment
affects the structure and function of the soil microbial community in temperate hardwood
and pine forests. For. Ecol. Manage. 196:159-171.
Gachukia, M.M. and M.R. Evans. 2008. Root substrate pH, electrical conductivity, and
macroelement concentration of sphagnum peat-based substrates amended with parboiled
fresh rice hulls or perlite. HortTechnology 18:644-649.
Gallardo, A. and W.H. Schlesinger. 1994. Factors limiting microbial biomass in the
mineral soil and forest floor of a warm-temperate forest. Soil Biol. Biochem. 26:1409-
1415.
Garcia-Gomez, A., M.P. Bernal, and A. Roig. 2002. Growth of ornamental plants in two
composts prepared from agroindustrial wastes. Biores. Technol. 83:81-87.
Gariglio, N.F., M.A. Buyatti, C.A. Bouzo, M.E. Weber, and R.A. Pilatti. 2004. Use of
(Salix sp.) sawdust as a potting medium for calendula (Calendula officinalis) and
marigold (Tagetes erecta) plant production. N. Zeal. J. Crop and Hort. Sci. 32:147-151.
Gartner, J.B., M.M. Meyer, Jr., and D.C. Saupe. 1971. Hardwood bark as a growing
media for container-grown ornamentals. Forest Prod. J. 21:25-29.

44
Gartner, J.B., S.M. Still, and J.E. Klett. 1973a. The use of bark waste as a substrate in
horticulture. Acta Hort. 37:2003-2012.
Gartner, J.B., S.M. Still, and J.E. Klett. 1973b. The use of hardwood bark as a growth
medium. Proc. Int. Plant Prop. Soc. 23:222-230.
Gilman, E.F. and D.G. Watson. 1994. Pinus taeda, Loblolly pine. Fact Sheet ST-478
Forest Ser. Dept. of Agric.
Glenn, J.S., C.H. Gilliam, J.H. Edwards, G.J. Keever, and P.R. Knight. 2000. Recycled
waste paper mulch reduces available container nitrogen. J. Environ. Hort. 18:188-191.
Gough, C.M. and J.R. Seiler. 2004. Belowground carbon dynamics in loblolly pine
(Pinus taeda) immediately following diammonium phosphate fertilization. Tree Physiol.
24:845-851.
Gouin, F.R. and C.B. Link. 1973. Growth response of container-grown woody
ornamentals to slow-release fertilizers. HortScience 8:208-209.
Gouin, F.R. 1985. Growth of hardy chrysanthemums in container of media amended with
composted municipal sewage sludge. J. Environ. Hort. 3:53-55.

45
Goyne, M.W. and M.A. Arnold. 1996. Container production of under-utilized small trees
using kenaf and coconut coir pith. Proc. Southern Nursery Assn. Res. Conf. 41:67-71.
Grantzau, E. 1991. Holzfasersubstrate im zierpflanzenbau − Eigenschaften und Qualitäts-
anforderungen. Gartenbau 38:44.
Griffith, L. 2007. Potting media’s new battles. GrowerTalks 71:58-60.
Gruda, N. and W.H. Schnitzler. 1997. The influence of organic substrates on growth and
physiological parameters of vegetable seedlings. Acta Hort. 450:487-494.
Gruda, N. and W.H. Schnitzler. 1999. Influence of wood fiber substrates and nitrogen
application rates on the growth of tomato transplants. Adv. Hort. Sci. 13:20-24.
Gruda, N., S.V. Tucher, and W.H. Schnitzler. 2000. N-immobilization of wood fiber
substrates in the production of tomato transplants (Lycopersicon lycopersicum (L.) Kerts.
Ex. Farw.). J. Appl. Bot. 74:32-37.
Gruda, N. 2005. Habilitationsschrift zur Erlangung der Lehrbefähigung für das
Fachgebiet Gemüsebau vorgelegt dem Rat der Landwirtschaftlich-Gärtnerischen Fakultät
der Humboldt-Universität zu Berlin (Disseration, Humboldt University, Berlin
Germany).
46
Gruda, N., M.J. Maher, and M. Prasad. 2008. The effect of microbial additives in organic
substrates on plant growth and some quality parameters. Acta Hort. 779:79-84.
Gruszynski, C. and A.N. Kampf. 2004. Residues of Aleurites fordii (Euphorbiacea) as a
component for plant substrates. Acta Hort. 644:171-176.
Guerin, V., F. Lamaire, O. Marfa, R. Caceres, and F. Giuffrida. 2001. Growth of
Viburnum tinus in peat-based and peat-substitute growing media. Scientia Hort. 89:129-
142.
Gumy, N. 2001. Toresa and other woodfiber products: Advantages and drawbacks when
used in growing media. P. 39-46. Proc. Intl. Peat Symp., Peat in horticulture: Peat and
its alternatives in growing media.
Gutser, R., K. Teicher, and P. Fischer. 1983. Nitrogen dynamics in bark compost as
dependent on production methods. Acta Hort. 150:175-184.
Handreck, K.A. 1991. Nitrogen drawdown key to optimum growth. Aust. Hort. 12:38-43.
Handreck, K.A. 1992a. Rapid assessment of the rate of nitrogen immobilization in
organic components of potting media. I. method development. Commun. Soil Sci. Plant
Anal. 23:201-215.
47
Handreck, K.A. 1992b. Rapid assessment of the rate of nitrogen immobilization in
organic components of potting media. II. nitrogen drawdown index and plant growth.
Commun. Soil Sci. Plant Anal. 23:217-230.
Handreck, K.A. 1993a. Immobilization of nitrogen in potting media. Acta Hort. 342:121-
126.
Handreck, K.A. 1993b. Use of the nitrogen drawdown index to predict fertilizer nitrogen
requirements in soilless potting media. Commun. Soil Sci. Plant Anal. 24:2137-2151
Handreck, K.A. 1993c. Properties of coir dust, and its use in the formulation of soilless
potting media. Commun. Soil Sci. Plant Anal. 24:349-363.
Handreck, K.A. 1996. Phosphorus immobilization in wood waste-based potting media.
Commun. Soil Sci. Plant Anal. 27:2295-2314.
Handreck, K. and N. Black. 2005. Growing media for ornamental plants. Third Ed.
UNSW Ltd. Sydney, AUS.
Harrelson, T., S.L. Warren, and T.E. Bilderback. 2004. How do you manage aged versus
fresh pine bark? Proc. Southern Nursery Assn. Research Conf. 51:63-65.

48
Hartz, T.K., F.J. Costa, and W.L. Schrader. 1996. Suitability of composted green waste
for horticultural uses. HortScience 31:961-964.
Helal, M. and D. Sauerbeck. 1985. Effect of plant roots on carbon metabolism of soil
microbial biomass. Z. Pflanzenernähr. Bodenkd. 149:181-188.
Hernandez-Apaolaza, L., A.M. Gasco, J.M. Gasco, and F. Guerrero. 2005. Reuse of
waste materials as growing media for ornamental plants. Biores. Technol. 96:125-131.
Hicklenton, P.R., V. Rodd, and P.R. Warman. 2001. The effectiveness and consistency of
source-separated municipal solid waste and bark composts as components of container
growing media. Scientia Hort. 91:365-378.
Hidalgo, P.R. and R.L. Harkess. 2002a. Earthworm castings as a substrate for poinsettia
production. HortScience 37:304-308.
Hidalgo, P.R., and R.L. Harkess. 2002b. Earthworm castings as a substrate amendment
for chrysanthemum production. HortScience 37:1035-1039.
Hidalgo, P.R., F.B. Matta, and R.L. Harkess. 2006. Physical and chemical properties of
substrates containing earthworm castings and effects on marigold growth. HortScience
41:1474-1476.
49
Hoitink, H.A. and H.A. Poole. 1979. Mass production of composted tree barks for
container media. Ohio Flor. Assn. Bull. No. 599:3-4.
Hoitink, H.A. and H.A.Poole. 1980. Bark compost use in container media. Compost Sci.
21:38-41.
Hoitink, H.A. 1980. Composted bark: A lightweight growth medium with fungicidal
properties. Plant Disease 64:142-147.
Howell, J., S. Dueitt, and S. E. Newman. 1993. Kenaf finer core as a vermiculite
substitute in peat-based media for growing greenhouse bedding plants. Proc. Southern
Nursery Assn. Res. Conf. 38:59-62.
Iglesias, M.I., C. Rodil, P. Bessa, and S. Lamosa. 2008. Gorse compost as a peat-
substitute in growing media for the production of Thuja plicata ‘Zebrina’. Acta Hort.
779:615-622.
Inbar, Y., Y. Chen, Y. Hader. 1986. The use of composted separated cattle manure and
grape marc as peat substitute in horticulture. Acta Hort. 178:147-153.
Inbar, Y., Y. Chen, Y. Hader. 1988. Composting of agricultural wastes for their use as
container media: simulation of the composting process. Biol. Wastes 26:247-259.
50
Ingram, D.I. and C.R. Johnson. 1983. Melaleuca: an alternative container media
component for woody ornamentals. Proc. Fla. State Hort. Soc. 96:254-256.
Jackson, B.E., A.N. Wright, D.M. Cole, and J.L. Sibley. 2005. Cotton gin compost as a
substrate component in container production of nursery crops. J. Environ. Hort.
23:118-122.
Jackson, B.E., A.N. Wright, J.L. Sibley, and J.M. Kemble. 2005. Root growth of three
horticultural crops grown in pine bark amended cotton gin compost. J. Environ. Hort.
23:133-137.
Jackson, B.E., J.F. Browder, and R.D. Wright. 2006. A comparison of nutrient
requirements between pine chip and pine bark substrates. Proc. Southern Nursery Assoc.
Research Conf. 51:30-32.
Jackson, B.E., R.D. Wright, and J.O. James. 2007. Pine tree substrate: current status.
Proc. Southern Nursery Assoc. Research Conf. 52:53-57.
Jackson, B.E., R.D. Wright, J.F. Browder, J.R. Harris, and A.X. Niemiera. 2008a. Effect
of fertilizer rate on growth of azalea and holly in pine bark and pine tree substrates.
HortScience 43:1561-1568.
51
Jackson, B.E., R.D. Wright, and M.C. Barnes. 2008b. Pine tree substrate, nitrogen rate,
particle size, and peat amendment affects poinsettia growth and substrate physical
properties. HortScience (In press).
Jackson, B.E. and R.D. Wright. 2008. Pine tree substrate: An alternative and renewable
growing media for horticulture crop production. Acta Hort. (In press)
Jervis, J.S. and R.W. Regan. 1973. Controlling environmental parameters for optimal
composting. Compost Sci. 14:10-15.
Kenna, S.W. and C.E. Whitcomb. 1985. Hardwood chips as an alternative medium for
container plant production. HortScience 20:867-869.
Keys, D. 2001 Canadian peat harvesting and the environment. North American Wetlands
Conservation Council (Canada). Issues Paper, No.1992-3.
Kirk, T.K., and E.B. Cowling. 1984. Biological decomposition of solid wood. In: Rowell,
M. Roger, ed. The chemistry of solid wood. Advances in chemistry series 207.
Washington, DC: American Chemical Society, Chapter 12.
Klett, J.E., J.B. Gartner, and T.D. Hughes. 1972. Utilization of hardwood bark in media
for growing woody ornamental plants in containers. J. Amer. Soc. Hort. Sci. 97:448-450.

52
Klock, K.A. 1997. Growth of Dianthus and Petunia in media amended with composted
urban waste. J. Environ. Hort. 15:135-137.
Kullman, F., M. Makas, H. Heuberger, W.H. Schnitzler, E. Windfelder, and G.
Wegener. 2003. Influence of wood fiber substrates from different wood species on plant
growth and the root colonizing capability of arbuscular mycorrhizal fungi. J. App. Bot.
77:90-94.
Laiche, Jr. A.J. and V.E. Nash. 1986. Evaluation of pine bark, pine bark with wood, and
pine tree chips as components of a container plant growing media. J. Environ. Hort.
4:22-25.
Laiche, Jr. A.J. and V.E. Nash. 1990. Evaluation of composted rice hulls and a
lightweight clay aggregate as components of container-plant growth media. J. Environ.
Hort. 8:14-18.
Laiche, Jr. A.J. and S.E. Newman. 1994. Evaluation of kenaf fiber core as a component
of container-grown media. Proc. Southern Nursery Assn. Res. Conf. 39:130-132.
Lang, H.J. 1997. Growth of poinsettia in potting media amended with ground kenaf stem
core. HortScience 32:427-558.

53
Lemaire, F., A. Dartigues, and L.M. Riviere. 1989. Physical and chemical characteristics
of ligno-cellulosic material. Acta Hort. 238:9-15.
Lemaire, F. 1997. The problem of the biostability in organic substrates. Acta Hort.
450:63-69.
Lennartsson, M. 1997. The peat conservation issue and the need for alternatives. In:
Proceedings of the IPS International Peat Conference on Peat in Horticulture.
Schmilewski, Amsterdam, pp. 112-121.
Lopez, R., C. Duran, J.M. Murillo, and F. Cabrera. 1998. Geraniums response to compost
based substrates. Acta Hort. 469: 255-262.
Lu, W., J.L. Sibley, C.H. Gilliam, J.S. Bannon, and Y. Zhang. 2006. Estimation of U.S.
bark generation and implications for horticultural industries. J. Environ. Hort. 24:29-34.
Lumis, G.P. 1980. Aquatic plant compost as a growing medium. Compost Sci. 21:33-35.
Ma, Y.B. and D.G. Nichols. 2004. Phytotoxicity and detoxification of fresh coir dust and
coconut shell. Commun. Soil Sci. Plant Anal. 35:205-218.
Maas, E.F. and R.M. Adamson. 1972. Resistance of sawdusts, peats, and bark to
decomposition in the presence of soil and nutrient solution. Soil Sci. Soc. Amer. Proc.

54
36:769-772.
Maher, M.J. and P. Prasad. 2002. The effect of addition of composted green waste to peat
on the physical stability of growing media. Proceedings of the International Symposium,
2002, Composting and Compost Utilization, Columbus, OH, May 6-8.
Marcotrigiano, M.. F.R. Gouin, and C.B. Link. 1985. Growth of foliage plants in
composted raw sewage sludge and perlite media. J. Environ. Hort. 3:98-101.
Marfa, O., F. Lamaire, R. Caceres, F. Giuffrida, and V. Guerin. 2002. Relationships
between growing media fertility percolate composition and fertigation strategy in peat-
substitute substrates used for growing ornamental shrubs. Scientia Hort. 94:309-321.
Marianthi, T. 2006. Kenaf (Hibiscus cannabinus L.) core and rice hulls as components of
container media for growing Pinus halepensis M. seedlings. Biores. Technol. 97:1631-
1639.
Martin, J.P., R.L. Branson, and W.M. Jarrell. 1978. Decomposition of organic materials
used in planting mixes and some effects on soil properties and plant growth. Agrochimica
22:248-260.
Martinez, F.X., N. Sepo, and J. Valero. 1997. Physical and physicochemical properties of
peat-coir mixes and effects of clay-material addition. Acta Hort. 450: 39-42.

55
Matus, F.J., J.B. Retamales, and P. Sanchez. 1997. Effect of particle size and quality of
pruning wood residues of Asian pear (Pyrus pyrifolia and Pyrus communis) on C-and-N
mineralization in soils of contrasting textures. Acta Hort. 475:327-337.
McCool, M.M. 1949. Studies on pH values of sawdusts and soil-sawdust mixtures. Soil
Sci. Soc. Amer. J.15:279-282.
McKenzie, W.M. 1958. The effect of nitrogen availability of adding fragmented wood to
soil. Aust. J. Agr. Res. 9:664-679.
Meinken, E., and P. Fischer. 1997. Sackungsverhalten von Holzfasern. Gärtnerbörse
9:494-496.
Mtambanengwe, F. and H. Kirchmann. 1995. Litter from a tropical savanna woodland:
chemical composition and C and N mineralization. Soil Biol. Biochem. 27:1639-1651.
Molitor, H.D. 1983. The use of barkcompost in floriculture in special consideration of
nitrogen nutrition. Acta Hort. 133:255-265.
Muro, J., I. Irigoyen, P. Samitier, P. Mazuela, M.C. Salas, and J. Soler. 2005. Wood fiber
as growing medium in hydroponic crop. Acta Hort. 697:179-185.
56
Neal, J.L., W.B. Bollen, and K.C. Lu. 1965. Influence of particle size on decomposition
of red alder and Douglas fir sawdust in soil. Nature 205:991-993.
Nelson, P.V. and W.R. Faber. 1986. Bulk solution displacement. HortScience 21:225-
227.
Newton, W. 1953. Seed germination and seedling growth as influenced by different
kinds of sawdust. Can. J. Agr. Sci. 33:593-596.
Niemiera, A.X. and R.D. Wright. 1986. Effect of liming rate on nitrification in a pine
bark medium. J. Amer. Soc. Hort. Sci. 111:713-715.
Niemiera, A.X. and R.D. Wright. 1987. Influence of temperature on nitrification in a pine
bark medium. HortScience 22:615-616.
Noguera, P., M. Abad, R. Puchades, V. Noguera, A. Maquieira and J. Martinez. 1997.
Physical and chemical properties of coir waste and their relation to plant growth. Acta
Hort. 450:365-373.
Ogden, R. and H. Mills. 1988. Availability of urea, ammonium, and nitrate applied to
pine bark. HortScience 23:175-177.
57
Orquin, R., M. Abad, P. Noguera, R. Puchades, A. Maquieira, V. Noguera, and F. de la
Iglesia. 2001. Composting of Mediterranean seagrass and seaweed residues with yard
waste for horticultural purposes. Acta Hort. 549:29-33.
Owings, A.D. 1994. Cotton gin trash as a medium component in production of ‘Golden
Bedder’ coleus. Proc. Southern Nursery Assn. Res. Conf. 38:65-66.
Papafotiou, M., M. Phsyalou, G. Kargas, I. Chatzipavlidis, and J. Chronopoulos. 2004.
Olive-mill wastes compost as growing medium component for the production of
poinsettia. Scientia Hort. 102:167-175.
Papafotiou, M., G. Kargas, and I. Lytra. 2005. Olive-mill waste compost as a growth
medium component for foliage potted plants. HortScience 40:1746-1750.
Penningsfeld, F. 1992. Toresa, a new substrate for soilless culture. Proc. Intl. Congress
on Soilless Culture 335-345.
Penningsfeld, F. 1992. Toresa, a new substrate for soilless culture. Proc. Intl. Congress
on Soilless Culture p. 335-345.
Pill, W.G., and K.T. Ridley. 1998. Growth of tomato and coreopsis in response to coir
dust in soilless media. HortTechnology 8:401-406.

58
Pokorny, F.A. 1979. Pine bark container media – An overview. Proc. Int. Plant Prop. Soc.
29:484-495.
Poole, R.T. and C.T. Conover. 1985. Growth of Ficus benjamina in combinations of peat,
sand, and Melaleuca. HortScience 20:383-385.
Prasad, M and G. Fietje. 1989. Evaluation of ground tree fern as a growing medium for
ornamental plants. Acta Hort. 238:157-164.
Prasad, M. 1997. Nitrogen fixation of various materials from a number of European
countries by three nitrogen fixation tests. Acta Hort. 450:353-362.
Prasad, M. and J. O’Shea. 1999. Relative breakdown of peat and non-peat growing
media. Acta Hort. 481:121-125.
Prasad, M. and M.J. Maher. 2001. The use of composted green waste (CGW) as a
growing medium component. Acta Hort. 549:107-112.
Prasad, M. and M.J. Maher. 2004. Stability of peat alternatives and use of moderately
decomposed peat as a structure builder in growing media. Acta Hort. 648:145-151.
Pronk, A.A. 1997. Laboratory investigations of nitrogen can carbon dioxide release of
peat and peat-compost media. Acta Hort. 450:245-252.
59
Pryce, S. 1991. The peat alternatives manual: a guide for the professional horticulturist
and landscaper. London: Friends of the Earth.
Rau, B., B.E. Jackson, J.F. Browder, and R.D. Wright. 2006. Wood substrates derived
from a variety of tree species affect plant growth. Proc. Southern Nursery Assoc.
Research Conf. 51:43-45.
Raviv, M. 1998. Horticultural uses of composted materials. Acta Hort. 469:225-234.
Raviv, M. 2005. Production of high quality composts for horticultural purposes: a mini-
review. HortTechnology 15:52-57.
Raviv, M. and J. H. Lieth. 2008. Soilless culture: theory and practice. Elsevier's
Publishing, San Diego, CA.
Reed, D.W. (Ed). 1996. Water, media, and nutrition for greenhouse crops. Ball
Publishing, Batavia, Illinois
Reinikainen, O. 1993. Choice of growing media for pot plants. Acta Hort. 342:357-360.
Reis, M., M. Soliva, and X. Martinez-Farre. 1995. Evaluation of composted pine bark
and carob pods as components for horticultural substrates. Acta Hort. 401:243-249.

60
Reis, M., F.X. Martinez, M. Soliva, and A.A. Monteiro. 1998. Composted organic
residuals as a substrate component for tomato transplant production. Acta Hort. 469:263-
274.
Reis, M., H. Inacio, A. Rosa, J. Caco, and A. Monteiro. 2001. Grape marc compost as an
alternative growing media for greenhouse tomato. Acta Hort. 554:75-81.
Richards, M. 1981. The use of sawdust as a growing medium. Common Wealth Hort.
(July):21, 23, 25.
Rishani, N. and R.P. Rice Jr. 1988. Use of carob as a potting medium component.
HortScience 23:334-336.
Riviere, L.M. and J. Caron. 2001. Research on substrates: state of the art and need for
the coming 10 years. Acta Hort. 548:29-41.
Robertson, R.A. 1993. Peat, horticulture, and environment. Biodiv. Cons. 2:541-547.
Salvador, E.D. 2008. Evaluation of alternative substrates to the xaxim dust for
‘Matogrossense’ Fern (Polypodium aureum) cultivation. Acta Hort. 779:547-553.
61
Sanchez-Monedero, M, A. Roig, J. Cegarra, M.P. Bernal, P. Noguera, M. Abad, and A.
Anton. 2004. Composts as media constituents for vegetable transplant production.
Compost Sci. 12:161-168.
Saunders, T.N., R.D. Wright, and J.F. Browder. 2005. Chipped pine logs: a potential
substrate for nursery and greenhouse crops. Proc. Southern Nursery Assn. Res. Conf.
50:112-114.
Scharpf, C. 2002: Chance für den Gartenbau Taspo – Magazin 2:4-6.
Scott, E.G. and B.C. Bearce. 1972. A hardwood-bark-sawdust compost for greenhouse
pot flower production. Forest Prod. J. 22:36-39.
Schilling, R. 1999. Toresa®. Comb. Proc. Intl. Plant Prop. Soc. 49:410-412.
Schmilewski, G. 2008. The role of peat in assuring the quality of growing media. Mires
and Peat 3:1-8.
Sharman, K.V. and K. Bodman. 1991. Wood wastes affect fertilizer performance. Aust.
Hort. 89:30-32.
Sharman, K.V. 1993. Effect of pH and incubation temperature on nitrogen drawdown
index of woodwaste potting media. Commun. Soil Sci. Plant Anal. 24:2171-2178.

62
Sharman, K.V. and M. Whitehouse. 2003. Nitrogen drawdown index as a predictor of
nitrogen requirements for Nephrolepis in sawdust media. Sci. Hort. 54:23-33.
Smolander, A., A. Kurka, V. Kitunen, and E. Mälkonen. 1994. Microbial biomass C and
N, and respiratory activity in soil of repeatedly limed and N- and P-fertilized Norway
spruce stands. Soil Biol. Biochem. 26:957-962.
Söderstrom, B., E. Bååth, and B. Lundgren. 1983. Decrease in soil microbial activity and
biomass owing to nitrogen amendments. Can. J. Microbiol. 29:1500-1506.
Solbraa, K. 1979. Composting of bark. IV. Potential growth reducing compounds and
elements in bark. Medd. Norsk. Inst. Skogforsk 34:443-50.
Sramek, F. and M. Dubsky. 2002. Influence of fertilization application and growing
substrate on container-grown ornamentals. ROSTLINNA VYROBA 48:448-457.
Stamps, R.H. and M.R. Evans. 1999. Growth of Dracaena marginata and Spathiphyllum
‘Petite’ in sphagnum peat and coconut coir dust-based growing media. J. Environ. Hort.
17:49-52.
Starck, J.R. and K. Lukaszuk. 1991. Effect of fertilizer nitrogen and potassium upon yield
and quality of carnations growth in peat and sawdust. Acta Hort. 294:289-296.

63
Still, S., J.B. Gartner, and T.D. Hughes. 1972. Effect of sawdust age and nitrogen
application on chrysanthemums grown in white oak sawdust media. Forest Prod. J.
22:111-114.
Stoffella, P.J. and D. A. Graetz. 2000. Utilization of sugarcane compost as a soil
amendment in a tomato production system. Compost Sci. 8:210-214.
Svenson, S.E. 1986. The influence of composting on blended pine and hardwood bark
growing media. Thesis, University of Tennessee, Knoxville, TN., 236 pp.
Thambirajah, J.J. and A.J. Kuthubutheen. 1989. Composting of palm press fibre. Biol.
Wastes 27:257-269.
Thirukkumaran, C.M. and D. Parkinson. 2000. Microbial respiration, biomass, metabolic
quotient and litter decomposition in a lodgepole pine forest amended with nitrogen and
phosphorus fertilizers. Soil Biol. Biochem. 32:59-66.
Thomas, M.B., M.R. Oates, and M.I. Spurway. 1980. Evaluation of low-cost potting
mixes for bedding plants and vegetable seedlings. N.Z. J. Expt. Agric. 8:281-286.

64
Thomas, M.B., M.I. Spurway, and D.P.C. Stewart. 1998. A review of factors influencing
organic matter decomposition and nitrogen immobilization in container media. Comp.
Proc. Intl. Plant Prop. Soc. 48:66-71.
Tilt, K.M., T.E. Bilderback, and W.C. Fonteno. 1987. Particle size and container size
effects on growth of three woody ornamental species. J. Amer. Soc. Hort. Sci. 112:981-
984.
Tripepi, R.R., M.W. George, A.G. Campbell, and B. Shafii. 1996. Evaluating pulp and
paper sludge as a substitute for peat moss in container media. J. Environ. Hort. 14:91-96.
Trochoulias, T., A.J. Burton, and E. White. 1990. The use of bagasse as a potting medium
for ornamentals. Scientia Hort. 42:161-167.
Tsakonas, A., V. Stergiou, M. Polissiou, K. Akoumianakis, and H.C. Passam. 2005.
Kenaf (Hibiscus cannabinus L.) based substrates for the production of compact plants.
Industrial Crops Prod. 21:223-227.
Turner, C.P., and W.R. Carlile. 1983. Microbial activity in blocking composts. 1.
measurement of CO2 evolution and O2 consumption. Acta Hort. 150: 75-81.

65
Tyler, H.H., S.L. Warren, T.E. Bilderback, and W.C. Fonteno. 1993. Composted turkey
litter: I. effect on chemical and physical properties of a pine bark substrate. J. Environ.
Hort. 11:131-136.
United States Department of Agriculture (USDA) Forest Service, Southern Forest
Experiment Station, New Orleans, LA. 2008. The native range of loblolly pine, Pinus
taeda L. www.na.fs.fed.us/pubs/silvics_manual/Volume_1/pinus/taeda.htm-86k.
Urrestarazu, M., G.A. Martinez, and M. del Carmen Salas. 2005. Almond shell waste:
possible local rockwool substitute in soilless crop culture. Scientia Hort. 103:453-460.
Verdonck, O., D. De Vleeschauwer, and R. Penninck. 1983. Cocofibre dust, a new
growing medium for plants in the tropics. Acta Hort. 133:215-220.
Verdonck, O. and R. Gabriels. 1988. Substrate requirements for plants. Acta Hort.
221:19-23.
Waksman, S.A. 1932. Principles of soil microbiology. Balliere, Tindall and Cox
Publishing. London.
Walden, R.F. and R.D. Wright. 1995. Interactions of high temperature and exposure time
influence nitrification in a pine bark medium. HortScience 30:1026-1028.

66
Wang, Y.T., and F.A. Pokorny. 1989. Pecan shells as an organic component of container
potting media. HortScience. 24:75-78.
Wang, Y.T. 1994. Using ground kenaf stem core as a major component of container
media. J. Amer. Soc. Hort. Sci. 119:931-935.
Warncke, D.D. 1986. Analyzing greenhouse growth media by the saturation extraction
method. HortScience 21:223-225.
Warren, S.L. and T.E. Bilderback. 2004. Irrigation timing: effect on plant growth,
photosynthesis, water-use efficiency and substrate temperature. Acta Hort. 644:29-37.
Webber III, C.L., J. Whitworth, and J. Dole. 1999. Kenaf (Hibiscus cannabinus L.) core
as a containerized growth medium component. Industrial Crops Prod. 10:97-105.
Wever, G., R.C. Kaarsemaker, A.A. van Leeuwen, and R. Baas. 2004. EKOFibre
research: testing of a growing medium based on wood fibre by means of a tomato
greenhouse trial. Praktijkonderzoek Plant & Omgeving, Wageningen, pp. 1-14.
Wever, G, A.M.M. van der Burg, and G. Straatsma. 2005. Potential of adapted mushroom
compost as a growing medium in horticulture. Acta Hort. 697:171-177.

67
Whitcomb, C.E. 2006. Plant production in containers II. Lacebark Publishing,
Cambridge, Mass.
Wilson, S.B. and P.J. Stoffella. 2001. Evaluation of compost as an amendment to
commercial mixes used for container-grown golden shrimp plant production.
HortTechnology 11:31-35.
Woodard, M.A., B.C. Bearce. S. Cluskey, and E.C. Townsend. 1993. Coal bottom ash
and pine wood peelings as root substrates in a circulating nutriculture system.
HortScience 28:636-638.
Worrall, R.J. 1978. The use of composted wood waste as a peat substitute. Acta Hort.
82:79-86.
Worrall, R.J. 1981. Comparison of composted hardwood and peat-based media for the
production of seedlings, foliage, and flowering plants. Scientia Hort. 15:311-319.
Worrall, R.J. 1985. Composting wood wastes for potting mixes. Aust. Hort. 83:34-37.
Worrall, J.J. and C.S. Yang. 1992. Shiitake and oyster mushroom production on apple
pomace and sawdust. HortScience 27:1131-1133.
Wright, R.D. 1986. The pour-through nutrient extraction procedure. HortScience

68
21:227-229.
Wright, R.D. and J.F. Browder. 2005. Chipped pine logs: A potential substrate for
greenhouse and nursery crops. HortScience 40:1513-1515.
Wright, R.D., J.F. Browder, and B.E. Jackson. 2006. Ground pine chips as a substrate for
container-grown woody nursery crops. J. Environ. Hort. 24:181-184.
Wright, R.D., B.E. Jackson, J.F. Browder, and J.G. Latimer. 2008a. Growth of
chrysanthemum in ground pine trees requires additional fertilizer. HortTechnology
18:111-115.
Wright, R.D., B.E. Jackson, and J.F. Browder. 2008b. The landscape performance of
annual bedding plants grown in a pine tree substrate. HortTechnology (In press)
Wright, R.D., B.E. Jackson, and M.C. Barnes. 2008c. Pine tree substrate construction for
optimal water holding capacity and air space. Proc. Southern Nursery Assoc. Research
Conf. 53:52-54.
Wright, R.D. and B.E. Jackson. 2008. Pine tree substrate: a promising alternative to peat
moss and pine bark. Amer. Nurserymen 208(3):26-32.

69
Yeager, T.H., D.C. Fare, J. Lea-Cox, J. Ruter, T.E. Bilderback, C.H. Gilliam, A.X.
Niemiera, S.L. Warren, T.E. Whitwell, R.D. Wright, and K.M. Tilt. 2007. 2nd Ed. Best
management practices: guide for producing container-grown plants. Southern
Nurserymen’s Assoc., Marietta, GA.
Zagal, E., Bjarnason, S. and Olsson, U., 1993. Carbon and nitrogen in the root zone of
barley (Hordeum vulgare L.) supplied with nitrogen fertilizer at two rates. Plant and Soil
157:51–63.
Zagal, E. and Persson, J., 1994. Immobilization and remineralization of nitrate during
glucose decomposition at four rates of nitrogen addition. Soil Biology & Biochemistry
26:1313–1321.
Zhang, Q. and J.C. Zak. 1998. Effects of water and nitrogen amendment on soil microbial
biomass and fine root production in a semi-arid environment in west Texas. Soil Biol.
Biochem. 30: 39-45.
Zoes, V., H. Dinel, T. Pare, and A. Jaouich. 2001. Growth substrates made from duck
excrete enriched wood shavings and source-separated municipal solid waste compost and
separates: physical and chemical characteristics. Biores. Technol. 78:21-30.

70
Figure 1.1. Harvested loblolly pine trees being debarked at a processing facility located in Warsaw, VA. The debarked logs are used for pulpwood or saw timber and the removed bark is a by-product which can be used as a container substrate. Figure 1.2. Aged pine bark stock piled on-site at a nursery.

71
Figure 1.3. Close-up view of unamended peatmoss. Peatmoss is most commonly used as a container substrate for greenhouse crop production. Figure 1.4. Peatmoss is typically shipped from Canada in large compressed bales to growers or substrate companies here in the United States.

72
Figure 1.5. Canadian peat bogs in their natural state before peat extraction. Figure 1.6. Once peat bogs are drained and cleared of vegetation, peat harvesting requires large equipment which extracts the peat by several methods including vacuuming.

73
Figure 1.7. Close-up view two grades (particle sizes) of coconut coir which is commonly used as a container substrate for greenhouse and nursery crop production. Figure 1.8. Coconut coir is shipped in compressed bales to growers and substrate companies here in the United States from several countries where coconuts are produced including Sir Lanka, Indonesia, Mexico, and Costa Rica.

74
Figure 1.9. A managed plantation of loblolly pine (Pinus taeda) trees which are currently grown for pulpwood (paper industry) or for the saw timber industry, but can be grown specifically for producing pine tree substrate for the horticulture industry. Figure 1.10. Harvested loblolly pine trees that have been delimbed and ready for further processing (in a hammer-mill) into pine tree substrate.

75
Figure 1.11. Industrial wood chipper used to chip pine logs into small wood chips that are then small enough to be ground in a hammer-mill for substrate production. Figure 1.12. Loblolly pine wood chips ready for processing (grinding) in a hammer-mill to produce pine tree substrate.
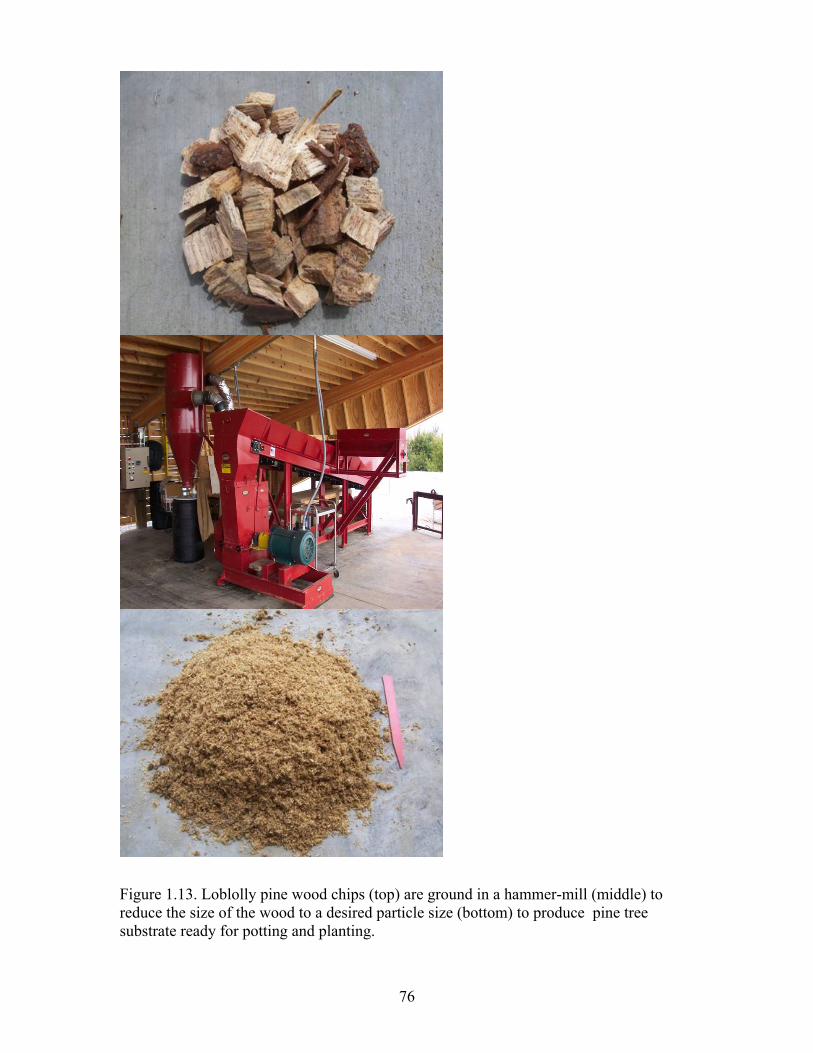
76
Figure 1.13. Loblolly pine wood chips (top) are ground in a hammer-mill (middle) to reduce the size of the wood to a desired particle size (bottom) to produce pine tree substrate ready for potting and planting.

77
Figure 1.14. Pine tree substrate composed of 100% ground pine logs that is ready for potting and planting.
Figure 1.15. Pine tree substrate produced with the addition of 25% aged pine bark which improves the water and nutrient holding capacity of the substrate.

78
Figure 1.16. Native range of loblolly pine (Pinus taeda L.) trees in the United States, showing the broad area where these trees naturally occur and could be used for pine tree substrate production (USDA, 2008).
Figure 1.17. Loblolly pine trees can be grown in the shaded areas of the map which far expands the native range (Fig 1.16) covering a much larger portion of the United States where many nursery and greenhouse operations are located (Gilman and Watson, 1994).

79
CHAPTER II
Effect of Fertilizer Rate on Growth of Azalea and Holly in Pine Bark and Pine Tree Substrates
Abstract: Recent interest in the use of wood substrates in horticulture crop production
has justified the need for determining fertilizer requirements in these substrates compared
to traditional pine bark (PB) and peat moss substrates. The objective was to determine
the response of japanese holly (Ilex crenata Thunb.‘Compacta’) and azalea
(Rhododendron obtusum Planck. ‘Delaware Valley’) grown in a pine tree substrate (PTS)
(trade name WoodGro™) or milled PB to fertilizer rate. Pine tree substrate is produced
from freshly harvested loblolly pine trees (Pinus taeda L.) that are delimbed, chipped,
and ground in a hammer mill to a desired particle size. Japanese holly plants were grown
in 2.8-L containers in the fall of 2005 and again in the spring of 2007 with the addition of
azalea. Plants grown in PTS or PB were fertilized by incorporating Osmocote Plus
fertilizer (15N-3.9P-10K) at rates of 3.5, 5.9, 8.3 or 10.6 kg·m-3 for japanese holly and
1.2, 3.5, 5.9, or 8.3 kg·m-3 for azalea. After three months, shoot dry weights were
determined for japanese holly and azalea. Japanese holly root dry weights were
determined for both experiments, and substrate CO2 efflux (μmol CO2. m-2·s-1) was
measured on the treatments at the end of the experiment using a LI-6400 soil CO2 flux
chamber. In 2005, japanese holly shoot dry weights of PTS-grown plants were
comparable to plants grown in PB at the 8.3 kg·m-3 fertility rate, and shoot dry weights of
PTS-grown plants were higher than PB at the 10.6 kg·m-3 rate. In 2007, japanese holly
and azalea shoot dry weights of PTS-grown plants were comparable to PB plants at the
5.9 kg·m-3 fertilizer rate. Both japanese holly and azalea achieved shoot growth in PTS

80
comparable to shoot growth in PB with approximately 2.4 kg·m-3 additional fertilizer for
PTS. Substrate CO2 efflux rates were higher in PTS compared to PB indicating higher
microbial activity, thereby increasing the potential for nutrient immobilization in PTS.
Introduction
The nursery and greenhouse industries have experienced tremendous growth over
the last four decades. Brooker et al. (2000) reported that the nursery and greenhouse
industries have increased economically from $661 million in 1960 to $12.11 billion in
1998. The nursery industry has undergone many changes and innovations during this
time to more efficiently and properly manage irrigation, fertility, substrate use, integrated
pest management, etc (Bilderback, 2001; Yeager et al., 2007). Of these, research and
development of new substrates to replace conventionally used peat moss and PB
substrates have increased in recent years. In addition to developing and utilizing new
substrates, much work has focused on managing fertility and irrigation programs of these
substrates to maximize plant performance and minimize nutrient loss due to
environmental concerns (Gouin and Link, 1973; Warren and Bilderback, 2004). The
need to develop new substrates and fertility management programs for the horticulture
industry is an issue that is being addressed by researchers around the world.
Research in Europe has been conducted for over two decades on the development
of alternative and renewable horticultural substrates composed of wood. The need for
alternative substrates is in response to decreased peat use due to environmental
regulations on the mining of peat bogs (Carlile, 2004; Riviere and Caron, 2001).
Researchers have had success using wood substrates, and have developed several

81
commercialized products currently available to growers (Gumy, 2001; Penningsfeld,
1992).
Serious consideration is also being given to the development of alternative,
organic container substrates here in the United States based on recent substrate shortages
and increased substrate costs (Griffith, 2007; Lu et al., 2006). Ground melaleuca trees
(Melaleuca quinquenervia Cav.) were shown to be an acceptable substitute for bark or
sedge peat when used to grow a number of woody and herbaceous plants (Conover and
Poole, 1983; Ingram and Johnson, 1983). No phytotoxicity problems were evident in
these studies as long as the proportion of melaleuca did not exceed 50% of the substrate
volume. Kenna and Whitcomb (1985) demonstrated that Pyracantha x ‘Mojave’ and
Liquidambar formosana Hance. grew as well in a substrate of woodchips:peat:sand (3:1:1
v/v/v) as in a substrate composed of bark:peat:sand (3:1:1 v/v/v). Wood chips for their
study were produced by grinding entire trees including leaves, twigs, bark and wood of
post oak (Quercus stellata Wangh.) and Siberian elm (Ulmus pumila L.). Non-
composted sawdust from douglas fir (Pseudotsuga menziesii Mirb.) and western hemlock
(Tsuga heterophylla Raf.) have also been used to grow a wide range of herbaceous and
woody container crops in Canada where sawdust is plentiful (Maas and Adamson, 1972).
Laiche and Nash (1986) produced a PTS derived from PB with a considerable
percentage of pine wood and a second PTS derived from whole pine trees (needles, twigs,
bark, and wood). They reported that plant growth (Rhododendron indica L. ‘President
Clay’, Ligustrum sinense Lour. ‘Variegata’, and Ilex crenata Thunb. ‘Compacta’) was
highest in 100% PB compared to the two PTS’s and that additional work was needed
before pine wood could be used as a container substrate. Two decades later, Wright and
82
Browder (2005) demonstrated that japanese holly (Ilex crenata Thunb. ‘Chesapeake’),
azalea (Rhododendron obtusum Planck. ‘Karen’), and marigold (Tagetes erecta Big.
‘Inca Gold’) could be grown in a noncomposted PTS (100% wood) produced from
debarked loblolly pine trees. Nutrient analysis of the PTS substrate solution indicated
that nutrient levels and pH were acceptable for plant culture, although extra fertilizer was
added to PTS to maintain comparable electrical conductivity (EC) levels between the two
substrates. Wright et al., 2006 also evaluated the growth of numerous woody nursery
species in a PTS produced from ground pine logs (including the bark) (approximately
90% wood and 10% bark) compared to PB. Results from this work concluded that plant
dry weights were generally higher in PB than PTS, but differences in growth between PB
and PTS were less when plants were supplied with higher fertilizer rates (21 g vs. 15 g
Osmocote Plus 15N-3.9P-10K; O.M. Scott Horticulture Products, Maryville, OH).
Growth differences in these studies were attributed to lower nutrient levels in the PTS
due to either leaching or microbial immobilization of applied nutrients.
Fain et al. (2008) manufactured a pine tree substrate (referred to as WholeTree) by
chipping and grinding freshly harvested 8 to 10 year-old pine trees including the wood,
bark, limbs, and needles. They reported that vinca (Catharanthus roseus L.) grown in
PTS were smaller than plants grown in 100% PB, but that growth index and visual
quality of the plants were similar for both substrates. Further work by Boyer et al. (2006)
showed that growth of ageratum (Ageratum houstonianum Mill. ‘Blue Hawaii’) and
salvia (Salvia x superba Stapf. ‘Vista Purple’) was comparable to 100% PB when grown
in a substrate derived from a tree by-product (limbs, needles, bark, cones, etc.) known as
clean chip residual (CCR) that remains after pine trees are harvested for pulpwood.
83
Gruda and Schnitzler (1999) reported that growth of tomatoes in a 100% wood
substrate was comparable to a peat substrate if the wood substrate was impregnated with
nitrogen (N) during manufacturing or when extra N was added during cultivation.
Wright et al. (2008) also showed that mums (Chrysanthemum x grandiflora Tzvelev.
‘Baton Rouge’) can be grown in PTS as well as in a commercial peat substrate when an
additional 100 ppm N was given to PTS-grown plants. Based on these observations,
additional fertilizer (primarily N) is needed for plant production when growing in a
wood-based substrate. The goal of a fertility program is to maintain an optimal level of
nutrients in the substrate throughout the growing season while limiting nutrient loss from
the container. Due to an increased awareness of and attention to environmental
contamination from nursery runoff sites, growers and researchers are working to
precisely manage fertility of container substrates during production to minimize nutrient
losses while continuing to maximize plant growth. Therefore, the purpose of this
research was to study the effect of fertilizer rate on growth of japanese holly and azalea in
PTS compared to PB to begin development of an efficient fertility management program
for growing plants in PTS. A fertility management program will allow plant growth in
PTS to be maximized at the lowest fertilizer rate possible while minimizing nutrient
waste and loss.
Materials and Methods
2005 Study: On 17 Aug. 2005, japanese holly liners (10-cm tall in 64 cm3
containers) were potted in 2.8-L plastic containers [17cm (h) x 17cm (d)] containing
either PB or PTS. Pine tree substrate was produced from loblolly pine trees

84
(approximately 30-cm basal diameter) that were harvested at ground level and delimbed
on 25 July 2005 in Warsaw VA. Trees were then chipped (including bark) with a
Morbark Chipper (Winn, MI) operated by Wood Preservers Inc., (Warsaw, VA) on 26
July 2005. Wood chips (2.5-cm x 2.5-cm x 0.5 cm) were further ground in a hammer
mill (Meadows Mills, Inc., North Wilkesboro, NC) on 27 July 2005 to pass through a
6.35 mm screen. Pine tree substrate was used fresh (uncomposted) and amended with 0.6
kg·m-3 calcium sulfate (CaSO4) based on previous work by Saunders et al. (2005) that
showed improved growth in herbaceous species when CaSO4 was incorporated in PTS.
No preplant amendments are required with PB for japanese holly production. Osmocote
Plus (15N-3.9P-10K; O.M. Scott Horticulture Products, Marysville, OH) was preplant
incorporated in PB and PTS at rates of 3.5, 5.9, 8.3, or 10.6 kg·m-3 (5.3, 8.9, 12.5, or 16
g·m-3 of N) respectively. Plants were grown on benches in a greenhouse in Blacksburg,
VA and irrigated as needed with beaker applied water to achieve an approximate 30 %
leaching fraction. Average day and night temperatures in the greenhouse were 26 o C and
22 o C, respectively. Substrate solution was extracted using the pour-through (PT)
method (Wright, 1986) every four weeks and analyzed for pH and EC using a Hanna HI
9811 instrument (Hanna Instruments, Woonsocket, RI). Nutrient analysis was conducted
on substrate solution taken on 7 Oct. 2005 and analyzed for nitrate (NO3-N) with an
Orion ion selective electrode (Thermo Electron, Beverly, MA) and phosphorus (P),
potassium (K), calcium (Ca), and magnesium (Mg) concentrations were determined with
a Spectro Ciros Vision ICP (Spectro Analytical Instrument, Muhwah, NJ). On 22 Nov.
shoots were severed at the substrate surface and roots were washed, dried at 65 º C for 4
days, and weighed. Samples of the most recently matured leaves from four plants per

85
treatment were harvested and analyzed for N, P, and K (Quality Analytical Laboratories,
Panama City, FL).
As a measure of microbial activity in PB and PTS, substrate CO2 efflux levels
were determined as an indicator of the potential for N immobilization to occur (Wang et
al., 2003). Substrate CO2 efflux (μmol CO2.m-2·s-1) was determined at the end of the
experiment (23 Nov. 2005) on three container replications of both substrates, at each
fertilizer rate using a LI-6400 (LI-COR, Lincoln, NE) fitted with a soil CO2 flux chamber
designed to take nondestructive CO2 measurements from the substrate filled containers.
A 10.2-cm diameter x 5.1-cm high plastic collar was inserted 0.5 cm into the container
substrate surface allowing the soil CO2 flux chamber to be inserted and positioned
securely above the substrate surface for CO2 efflux measurements.
Physical properties including air space (AS), container capacity (CC), total
porosity (TP), and bulk density (BD) were determined on three replicate samples of each
substrate at the beginning of the experiment using the North Carolina State University
(NCSU) Porometer method as described by Fonteno et al. (1995). Cation exchange
capacity (CEC) was determined by A & L Eastern Laboratories (Richmond, VA) using
the AOAC International Official Method (Thrope, 1973).
2007 Study: An experiment similar to the previous experiment was conducted
from 1 Mar. to 25 May 2007. Pine tree substrate was produced from 12 year-old loblolly
pine trees (approximately 25-cm in basal diameter) that were harvested at ground level
and delimbed on 19 Feb. 2007 in Blackstone VA, and chipped with bark intact on 20 Feb.
2007 with a Bandit Chipper (Model 200, Bandit Industries, Inc. Remus, MI). Wood
chips were then further ground in a hammer mill on 21 Feb. 2007 to pass through a 6.35

86
mm screen. Physical properties of both substrates were determined using the method
described in the 2005 study. Osmocote Plus (15N-3.9P-10K) was incorporated in PB and
PTS at rates of 3.5, 5.9, 8.3, or 10.6 kg·m-3 (5.3, 8.9, 12.5, or 16 g·m-3 of N), respectively.
In addition to japanese holly, this experiment also included azalea. Since azaleas require
lower fertilizer rates (compared to holly) for optimal growth (Yeager et al., 2007), this
species was included in this study to provide growth data on a woody species with a
relatively low nutrient requirement when grown in PB and PTS. Fertilizer rates for
azalea were 1.2, 3.5, 5.9, and 8.3 kg·m-3 (1.8, 5.3, 8.9, or 12 g·m-3 of N), respectively.
Both substrates were preplant amended similar to the 2005 study. Plants were grown on a
gravel ground bed in a greenhouse in Blacksburg, VA and overhead irrigated at a rate of
4.5 cm/hr with a Basic Grower boom sprayer (McConkey Co., Sumer, WA) as needed to
achieve an approximate 30 % leaching fraction. Species were grouped separately on the
ground bed and irrigated independently during the entire experiment. Substrate solution
was extracted using the PT method every two weeks and analyzed for pH and EC for
both species. Nutrient analysis was conducted on substrate solution taken from each
species on 30 Apr. 2007 in the same method as previously described for the 2005 study.
On 25 May 2007 shoots of both species were severed at the substrate surface and the
roots of japanese holly were washed, dried at 65 º C for 4 days, and weighed. Samples of
the most recently matured leaves from five plants, per treatment, per species were
harvested and analyzed for N, P, and K by Penn State Analytical Testing Laboratory,
University Park, PA. Substrate CO2 efflux was measured on three container replications
of each treatment for japanese holly.
87
The experimental design was completely randomized with six single container
replications per treatment in 2005 and five replications per treatment per species in 2007.
All data in both studies were analyzed with the analysis of variance procedure using SAS
(version 9.1 SAS Institute, Inc. Cary, NC) and subjected to regression analysis using
SigmaPlot (version 9.01 SPSS, Inc., Chicago, IL) with the exception that substrate
physical properties were subjected to analysis of variance within the GLM procedure,
with treatment means separated by least significant difference analysis. Standard error
bars are presented in Figures 2.1 through 2.3 with the linear and quadratic regression
responses presented.
Results and Discussion
2005 study: There was a significant substrate x fertilizer rate interaction (P ≤
0.001) for shoot dry weight: at fertilizer rates of 3.5 and 5.9 kg·m-3, shoot dry weight was
higher for PB than PTS; at 8.3 kg·m-3 dry weight was about equal for the two substrates;
at 10.6 kg·m-3 dry weight was higher for PTS than PB (Fig. 2.1A). Root dry weights
were not influenced by fertilizer rate (P ≤ 0.145) but were higher in PB than PTS at the
3.5 and 5.9 kg·m-3 rates and equal in both substrates at the 8.3 and 10.6 kg·m-3 rates (Fig.
2.1B). There was a significant substrate x fertilizer rate interaction (P ≤ 0.002) for
substrate CO2 efflux. Efflux levels were higher in PTS than in PB at each fertilizer rate
with the magnitude of difference decreasing as fertilizer rate increased (Fig. 2.1C). At
the lowest fertilizer rate (3.5 kg·m-3) substrate efflux levels in PTS were four times higher
than in PB, but were nearly the same at the highest fertilizer rate (10.6 kg·m-3). In

88
contrast to PTS, substrate efflux levels slightly increased in the PB substrate as fertilizer
rates increased, resulting in similar efflux levels at the highest fertilizer rate (Fig. 2.1C).
Substrate solution EC values increased with increasing fertilizer rate and at any
particular fertilizer rate levels were higher in PB than in PTS (Table 2.1), showing that
higher fertilizer rates were required for PTS compared to PB to achieve comparable
substrate EC levels. Substrate solution pH was higher in PTS at each fertilizer rate
compared to PB and decreased as fertilizer rate increased (Table 2.1). The pH of PB did
not change with increasing fertilizer rates. There was a significant substrate and fertilizer
rate response for all nutrient concentrations (except for K) in the substrate solution
sampled on 7 Oct. 2005 (Table 2.2). Similar to the EC levels previously discussed,
nitrate (NO3-N) concentrations were higher in PB at each fertilizer rate compared to PTS.
Solution concentrations of P, K, Ca, and Mg were also higher in PB compared to PTS
(Table 2.2).
Leaf tissue nutrient concentrations were generally higher in PB-grown plants
compared to PTS-grown plants at each fertilizer rate (Table 2.3). All nutrient levels
generally increased as fertilizer rate increased for PB up to the 10.6 kg·m-3 rate, and
nutrient levels increased in PTS plants up to the 8.3 kg·m-3 rate (Table 2.3). Tissue N
levels in PB-grown plants were above the recommended sufficiency range of 1.80 to 2.80
% (Mills and Jones, 1996) at all fertilizer rates, and tissue N levels in PTS-grown plants
were within the recommended range at the 5.9, 8.3, and 10.6 kg·m-3 fertilizer rates (Table
2.3).
Total porosity was similar for both PB and PTS and was within the recommended
range outlined in The Best Management Practices Guide for Producing Container-Grown
89
Plants (BMP) for physical properties of container substrates (Yeager et al., 2007) (Table
2.4). Air space was significantly higher in PTS (38.2 %) than in PB, and was above the
recommended BMP range. Container capacity was higher in PB (56.1 %) than in PTS
(45.2 %), but both were within the BMP range (45-65%) for both substrates. Bulk density
of PTS was similar to PB but was below minimum recommended value of 0.19 g·cm-3
(Table 2.4).
2007 study. As with the 2005 experiment, there was a significant substrate x
fertilizer rate interaction (P ≤ 0.025) for japanese holly shoot dry weight: at the fertilizer
rate of 3.5 kg·m-3 shoot dry weight was higher for PB than PTS; at rates 5.9, 8.3, and 10.6
kg·m-3 dry weight was similar for PB and PTS plants (Fig. 2.2A). The data also indicate
that maximum shoot dry weight for japanese holly in PB is at 3.5 kg·m-3 or less, and for
PTS is between the 3.5 and 5.9 kg·m-3 rates (Fig. 2.2A).
There was a substrate x rate interaction for japanese holly root dry weights (P ≤
0.017). Root growth in both PTS and PB decreased as fertilizer rate increased (Fig. 2.2B)
but in contrast to 2005, root growth was generally higher in PTS-grown plants than PB-
grown plants. There was a significant substrate x fertilizer rate interaction (P ≤ 0.001)
for substrate CO2 efflux. Similar to 2005 results, substrate CO2 efflux levels were higher
in PTS than in PB at each fertilizer rate with the magnitude of difference decreasing
slightly as fertilizer rate increased (Fig. 2.2C). At all fertilizer rates (3.5, 5.9, 8.3, and
10.6 kg·m-3) substrate CO2 efflux levels were twice as high in PTS as in PB (Fig. 2.2C).
As with the 2005 experiment, substrate solution EC levels increased with increasing
fertilizer rates in both substrates (Table 2.1). Also similar to 2005, substrate solution pH
was higher in PTS than PB regardless of fertilizer rate, and pH decreased with increasing
90
fertilizer rate in PB and PTS (Table 2.1). Similar to the 2005 data, nitrate concentrations
in the substrate solution were generally higher in PB compared to PTS and substrate
solution concentrations of P, K, Ca, and Mg were in most cases higher in PB compared to
PTS (Table 2.2). Similar to 2005, japanese holly leaf tissue nutrient levels generally
increased in response to increasing fertilizer rate for PB and PTS-grown plants (Table
2.3). In contrast to 2005 data, leaf nutrient levels at the 8.3 and 10.6 kg·m-3 fertilizer
rates for N and at the 5.9, 8.3, and 10.6 kg·m-3 rates for P (Table 2.3) were higher in PTS-
grown plants compared to PB-grown plants. Tissue N levels were above the
recommended sufficiency range (1.8 to 2.8 %) at all fertilizer rates for plants grown in
both substrates except for the 3.5 kg·m-3 rate in PTS. Potassium levels were higher in
PTS-grown plants at all fertilizer rates (Table 2.3). Physical property data of PTS and PB
in 2007 were similar to 2005 data and therefore are not reported.
There was a significant substrate x fertilizer rate interaction (P ≤ 0.013) for azalea
shoot dry weight: at the fertilizer rates of 1.2 and 3.5 kg·m-3 shoot dry weight was higher
for PB than PTS; at rates 5.9 and 8.3 kg·m-3 dry weights were similar for PB and PTS
plants (Fig. 2.3) with maximum shoot dry weight occurring at 3.5 kg·m-3 for PB and at
5.9 kg·m-3 for PTS. Substrate solution EC levels for azalea increased with increasing
fertilizer rate in both substrates, and were higher in PB than in PTS at all rates (Table
2.5). This once again shows that higher fertilizer rates are required in PTS compared to
PB to achieve similar substrate EC levels. Similar to japanese holly, substrate solution
pH was higher in PTS than PB regardless of fertilizer rate (Table 2.5). pH decreased in
PB as fertilizer rate increased, in contrast to pH values of PTS that did not change with
fertilizer rate (Table 2.5). Substrate solution nitrate concentrations increased with

91
increasing fertilizer rate in both substrates, and were lower in PTS compared to PB at
each fertilizer rate (Table 2.5). Substrate solution P and K concentrations were generally
higher in PB than PTS at each fertilizer rate (Table 2.5). Azalea N and K leaf tissue
nutrient concentrations increased in response to increasing fertilizer rate in both PB-
grown and PTS-grown plants (Table 2.5). Phosphorus concentrations were generally the
same at all fertilizer rates in PB-grown plants while in PTS-grown plants P
concentrations increased with fertilizer up to the 5.9 kg·m-3 rate. Tissue N concentrations
were higher in PB than in PTS at all fertilizer rates. Tissue N concentrations were within
the sufficiency range (2.0 to 3.0 %) (Mills and Jones, 1996) for PB plants at the 3.5, 5.9,
and 8.3 kg·m-3 fertilizer rates, but only at the 5.9, and 8.3 kg·m-3 rates for PTS plants.
This study demonstrates that a higher rate of fertilizer is required for japanese
holly and azalea to achieve shoot growth in PTS comparable to shoot growth in PB. Both
japanese holly and azalea achieved shoot growth in PTS comparable to shoot growth in
PB with approximately 2.4 kg·m-3 additional fertilizer for PTS. For example, shoot
growth of japanese holly was similar at 5.9 kg·m-3 in PB and 8.3 kg·m-3 in PTS in 2005
(Fig. 2.1A) and shoot growth was similar at 3.5 kg·m-3 in PB and 5.9 kg·m-3 in PTS in
2007 (Fig. 2.2A). The different growth response in japanese holly to fertilizer rate in
2005 versus 2007 may be due in some way to the seasonal effects (light and temperature
differences effecting irrigation need and frequency) between the fall (2005) and spring
(2007) experiments. In addition, the placement of the 2007 study on graveled ground
beds of the greenhouse instead of on bench tops (2005 study) may have resulted in less
air circulation and decreased drying of the containers resulting in a lesser need for water.
Lower irrigation rates and frequency in 2007 could have reduced the amount of nutrient

92
leaching from the substrates and resulted in higher substrate EC averages which occurred
in 2007 compared to 2005 (Table 2.1). Niemiera and Leda (1993) showed N (NO3-N and
NH4-N) leaching in a PB substrate increases with increasing leaching fraction (irrigation
volume) resulting in lower substrate solution EC levels and lower concentrations of
substrate solution N. In contrast, a lower leaching fraction (less irrigation volume) causes
less nutrient leaching and results in higher substrate solution EC levels and N
concentrations. Their results help to explain the higher EC levels reported in the 2007
study which received generally lower and less frequent irrigation applications. The
higher EC levels in 2007 than in 2005 are likely the reason for higher tissue N
concentrations at all fertilizer rates for plants grown in both PB and PTS in 2007 (Table
2.3). Higher tissue N concentrations at lower fertilizer rates in 2007 could explain the
increased growth response in japanese holly at lower fertilizer rates compared to plants
grown in 2005.
Maximum shoot growth of azalea occurred at the same fertilizer rates (3.5 kg·m-3
for PB and 5.9 kg·m-3 for PTS; Fig. 2.3) as japanese holly in 2007 which was unexpected
since azalea is considered a woody plant with lower nutrient requirements compared to
japanese holly. The substrate solution EC levels and nutrient concentrations for azalea
plants grown in PB and PTS were generally lower (Table 2.5) at the same fertilizer rates
(3.5, 5.9, and 8.3 kg·m-3) compared to levels seen in the substrate solution of japanese
holly plants (Table 2.2) also in the experiment. The lower EC and substrate solution
nutrient levels in azalea may be due to different growth rates between azalea and japanese
holly, with azalea having more shoot growth than japanese holly (approximately 18 g for
azalea and 11 g for japanese holly; Fig. 2.3) suggesting that azalea plants were utilizing
93
more nutrients from the substrate solution for growth (lowering the EC and nutrient
levels) and requiring more frequent irrigations than japanese holly, leading to potentially
more nutrient leaching. In contrast, the smaller holly plants required less irrigation and
therefore conceivably had less nutrient leaching during this experiment causing the
higher (and statistically similar) substrate solution EC levels between substrates (Table
2.1) and generally higher nutrient levels (Table 2.2) in both PB and PTS in 2007. Tissue
N concentrations in azalea were not within the sufficiency range (2.0 to 3.0 %) until the
3.5 kg·m-3 fertilizer rate for PB plants (2.4 % tissue N) and at the 5.9 kg·m-3 fertilizer rate
for PTS-grown plants (2.3 % tissue N) (Table 2.5). At these fertilizer rates maximum
shoot growth occurred in each substrate.
Lower substrate solution EC for PTS compared to PB has been reported
previously by Wright and Browder (2005) and Wright et al. (2006). The reason for this
difference may be two-fold. First, PTS is more porous and has a significantly lower CEC
compared to PB (Table 2.4) which could result in more nutrient leaching from PTS. The
second may relate to higher rates of microbial N immobilization demonstrated with PTS.
Substrate CO2 efflux for PTS (Fig. 2.1C and 2.2C) was higher than in PB and likely
related to the higher carbon: nitrogen ratio of PTS (550:1) compared to PB (50:1) (Bollen
and Lu, 1957; Tisdale et al., 1993). Similar to our results (Fig. 4A and B), previous work
has shown a reduction in substrate CO2 efflux as fertilizer rate increased (Maas and
Adamson, 1972) possibly due to the increased salt concentration which apparently either
modified the microflora in the substrate or reduced their activity (Allison, 1965). This
study provides preliminary evidence that N immobilization could be a viable reason for
the higher fertilizer requirement in PTS. Substrate solution pH was lower for PB than for
94
PTS reflective of inherently higher pH of PTS which may be due to the chemical nature
of freshly ground wood. The pH levels for both substrates in these studies are acceptable
for both japanese holly and azalea. There was no visual substrate shrinkage or
decomposition in PTS during the three month experiment which is consistent with
observations from other unpublished studies by these authors. Future studies to
investigate the rate and impact of decomposition of PTS in containers during long term
production will be reported. In addition to evaluating PTS decomposition in containers,
different methods of PTS storage and the effect of storage on PTS over time will be
investigated.
Conclusions
A higher fertilizer requirement for PTS compared to PB is of concern and must
be considered when using PTS as a substrate for woody nursery crops. Fertilizer
recommendations for growing woody crops in PTS will help growers maximize plant
growth and minimize fertilizer use which can reduce both fertilizer costs and the potential
for excess nutrient losses in to the nursery runoff system. Further work is needed to
determine the extent of nutrient leaching in PTS as well as establish irrigation
requirements during crop production with PTS. The addition of various proportions of
PB, as well as other organic materials and composts, to PTS may increase the CEC and
reduce nutrient leaching, as well as improving (decreasing) the carbon: nitrogen ratio of
PTS (currently at 550:1) potentially reducing N immobilization and reducing the need for
additional fertilizer for PTS. Manufacturing PTS to have more small particles (fines)
could result in higher container capacity and less porosity to reduce irrigation (and
95
nutrient) leaching. The reason for lower substrate solution nutrient levels in PTS needs
further investigation to more fully understand and manage fertility requirements when
growing plants in PTS during short and long term production. Future studies plan to
investigate the influence of a relatively high microbial activity in PTS (evident by
increased substrate CO2 levels) on substrate nutrient levels, the rate and significance of
nitrogen immobilization, and on substrate decay over longer plant production cycles and
in larger containers.
Literature Cited
Allison, F.E. 1965. Decomposition of wood and bark sawdusts in soil, nitrogen
requirements, and effects on plants. US. Dept. Agric. Tech. Bull. No. 1332.
Bilderback, T.E. 2001. Environmentally compatible container plant production
practices. Acta Hort. 548:311-318.
Bollen, W.B. and K.C. Lu. 1957. Effect of Douglas-fir sawdust mulches and
incorporations on soil microbial activities and plant growth. Soil Sci. Soc. Proc. 21:35
41.
Boyer, C.R., G.B. Fain, C.H. Gilliam, T.V. Gallagher, H.A. Torbert, and J.L. Sibley.
2006. Clean chip residual: a new substrate component for container-grown plants. Proc.
Southern Nursery Assn. Res. Conf. 47:274-277.

96
Brooker, J.R., R.A. Hinson, and S.C. Turner. 2000. Trade flows and marketing practices
within the united states nursery industry:1998. Southern Coop. Series Bulletin 397.
Carlile, W.R. 2004. Growing media and the environmental lobby in the UK 1997-2001.
Acta Hort 644:107-113.
Conover, C.A. and R.T. Poole. 1983. Utilization of Melaleuca quinquenervia as a
potting medium component for greenhouse production of foliage plants. HortScience
18:886-888.
Fain, G.B., C.H. Gilliam, J.L. Sibley, and C.R. Boyer. 2008. Wholetree substrates
derived from three species of pine in production of annual vinca. HortTechnology
18:13-17.
Fonteno, W.C., C.T. Hardin, and J.P. Brewster. 1995. Procedures for determining
physical properties of horticultural substrates using the NCSU Porometer. Horticultural
Substrates Laboratory. North Carolina State University.
Gouin, F.R. and C.B. Link. 1973. Growth response of container-grown woody
ornamentals to slow-release fertilizers. HortScience 8:208-209.
Griffith, L. 2007. Potting media’s new battles. GrowerTalks 71:58-60.

97
Gruda, N. and W.H. Schnitzler. 1999. Influence of wood fiber substrates and nitrogen
application rates on the growth of tomato transplants. Adv. Hort. Sci. 13:20-24.
Gumy, N. 2001. Toresa and other woodfiber products: Advantages and drawbacks when
used in growing media. P. 39-46. Proc. Intl. Peat Symp., Peat in horticulture: Peat and
its alternatives in growing media.
Ingram, D.I. and C.R. Johnson. 1983. Melaleuca: an alternative container media
component for woody ornamentals. Proc. Fla. State Hort. Soc. 96:254-256.
Laiche, Jr. A.J. and V.E. Nash. 1986. Evaluation of pine bark, pine bark with wood, and
pine tree chips as components of a container plant growing media. J. Environ. Hort.
4:22-25.
Lu, W., J.L. Sibley, C.H. Gilliam, J.S. Bannon, and Y. Zhang. 2006. Estimation of U.S.
bark generation and implications for horticultural industries. J. Environ. Hort. 24:29-34.
Kenna, S.W. and C.E. Whitcomb. 1985. Hardwood chips as an alternative medium for
container plant production. HortScience 20:867-869.
Maas, E.F. and R.M. Adamson. 1972. Resistance of sawdusts, peats, and bark to
decomposition in the presence of soil and nutrient solution. Soil Sci. Soc. Amer. Proc.
36:769-772.
98
Mills, H.A. and J.B. Jones. Jr. 1996. Plant Analysis Handbook ll. Micromacro
Publishing, Athens, GA.
Niemiera, A.X. and C.E. Leda. 1993. Nitrogen leaching from Osmocote-fertilized pine
bark at leaching fractions of 0 to 0.4. J. Environ. Hort. 11:75-77.
Penningsfeld, F. 1992. Toresa, a new substrate for soilless culture. Proc. Intl. Congress
on Soilless Culture. 335-345.
Riviere, L.M. and J. Caron. 2001. Research on substrates: state of the art and need for
the coming 10 years. Acta Hort. 548:29-41.
Saunders, T.N., R.D. Wright, and J.F. Browder. 2005 Chipped pine logs: a potential
substrate for nursery and greenhouse crops. Proc. Southern Nursery Assn. Res. Conf.
50:112-114.
Thrope, V.A. 1973. Collaborative study of the cation exchange capacity of peat
materials. J. AOAC 56:154-156.
Tisdale, S.L., W.L. Nelson, J.D. Beaton, and J.L. Havlin. 1993. Soil Fertility and
Fertilizers. Macmillan Publishing. New York.

99
Wang, W.J., R.C. Dalal, P.W. Moody, and C.J. Smith. 2003. Relationships of soil
respiration to microbial biomass, substrate availability and clay content. Soil Biol.
Biochem. 35:273-284.
Warren, S.L. and T.E. Bilderback. 2004. Irrigation timing: effect on plant growth,
photosynthesis, water-use efficiency and substrate temperature. Acta Hort. 644:29-37.
Wright, R.D. 1986. The pour-through nutrient extraction procedure. HortScience
21:227-229.
Wright, R.D., B.E. Jackson, J.F. Browder, and J.G. Latimer. 2008. Growth of
Chrysanthemum in ground pine trees requires additional fertilizer. HortTechnology
18:111-115.
Wright, R.D. and J.F. Browder. 2005. Chipped pine logs: A potential substrate for
greenhouse and nursery crops. HortScience 40:1513-1515.
Wright, R.D., J.F. Browder, and B.E. Jackson. 2006. Ground pine chips as a substrate for
container-grown woody nursery crops. J. Environ. Hort. 24:181-184.
Yeager, T.H., D.C. Fare, J. Lea-Cox, J. Ruter, T.E. Bilderback, C.H. Gilliam, A.X.
Niemiera, S.L. Warren, T.E. Whitwell, R.D. Wright, and K.M. Tilt. 2007. 2nd Ed. Best

100
management practices: guide for producing container-grown plants. Southern
Nurserymen’s Assoc., Marietta, GA.
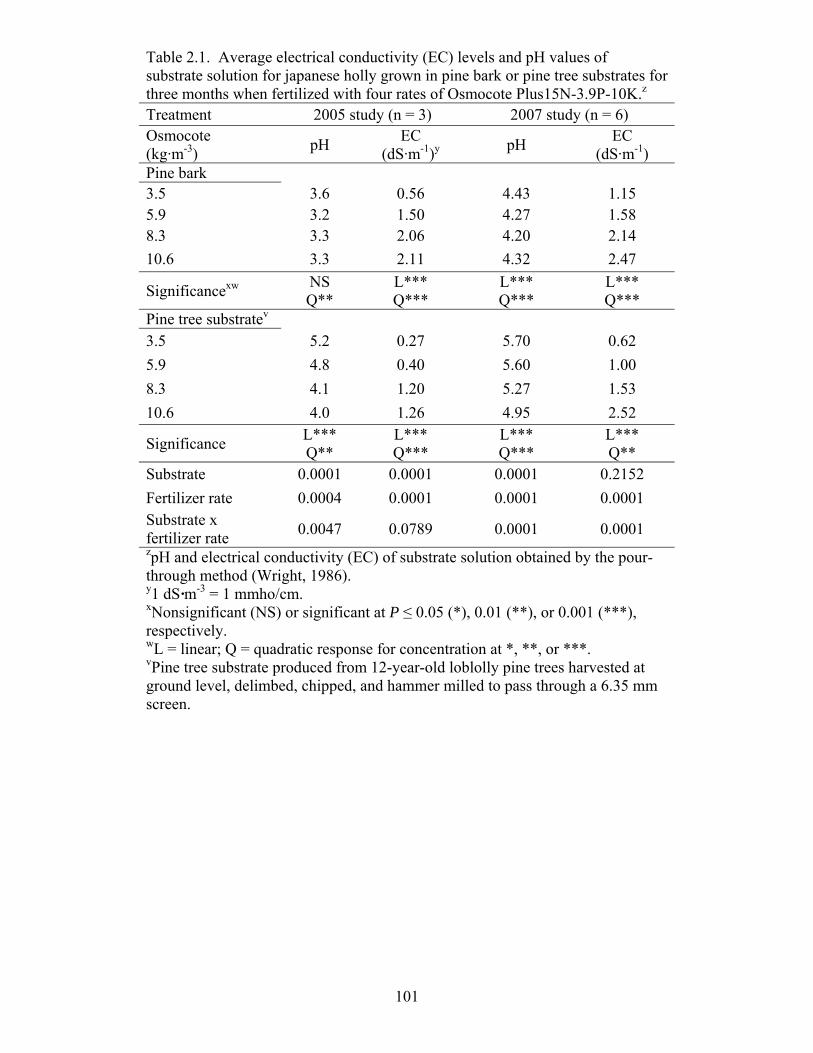
101
Table 2.1. Average electrical conductivity (EC) levels and pH values of substrate solution for japanese holly grown in pine bark or pine tree substrates for three months when fertilized with four rates of Osmocote Plus15N-3.9P-10K.z
Treatment 2005 study (n = 3) 2007 study (n = 6) Osmocote (kg·m-3) pH EC
(dS·m-1)y pH EC (dS·m-1)
Pine bark 3.5 3.6 0.56 4.43 1.15 5.9 3.2 1.50 4.27 1.58 8.3 3.3 2.06 4.20 2.14 10.6 3.3 2.11 4.32 2.47
Significancexw NS Q**
L*** Q***
L*** Q***
L*** Q***
Pine tree substratev 3.5 5.2 0.27 5.70 0.62 5.9 4.8 0.40 5.60 1.00 8.3 4.1 1.20 5.27 1.53 10.6 4.0 1.26 4.95 2.52
Significance L*** Q**
L*** Q***
L*** Q***
L*** Q**
Substrate 0.0001 0.0001 0.0001 0.2152 Fertilizer rate 0.0004 0.0001 0.0001 0.0001 Substrate x fertilizer rate 0.0047 0.0789 0.0001 0.0001 zpH and electrical conductivity (EC) of substrate solution obtained by the pour-through method (Wright, 1986). y1 dS·m-3 = 1 mmho/cm. xNonsignificant (NS) or significant at P ≤ 0.05 (*), 0.01 (**), or 0.001 (***), respectively. wL = linear; Q = quadratic response for concentration at *, **, or ***. vPine tree substrate produced from 12-year-old loblolly pine trees harvested at ground level, delimbed, chipped, and hammer milled to pass through a 6.35 mm screen.
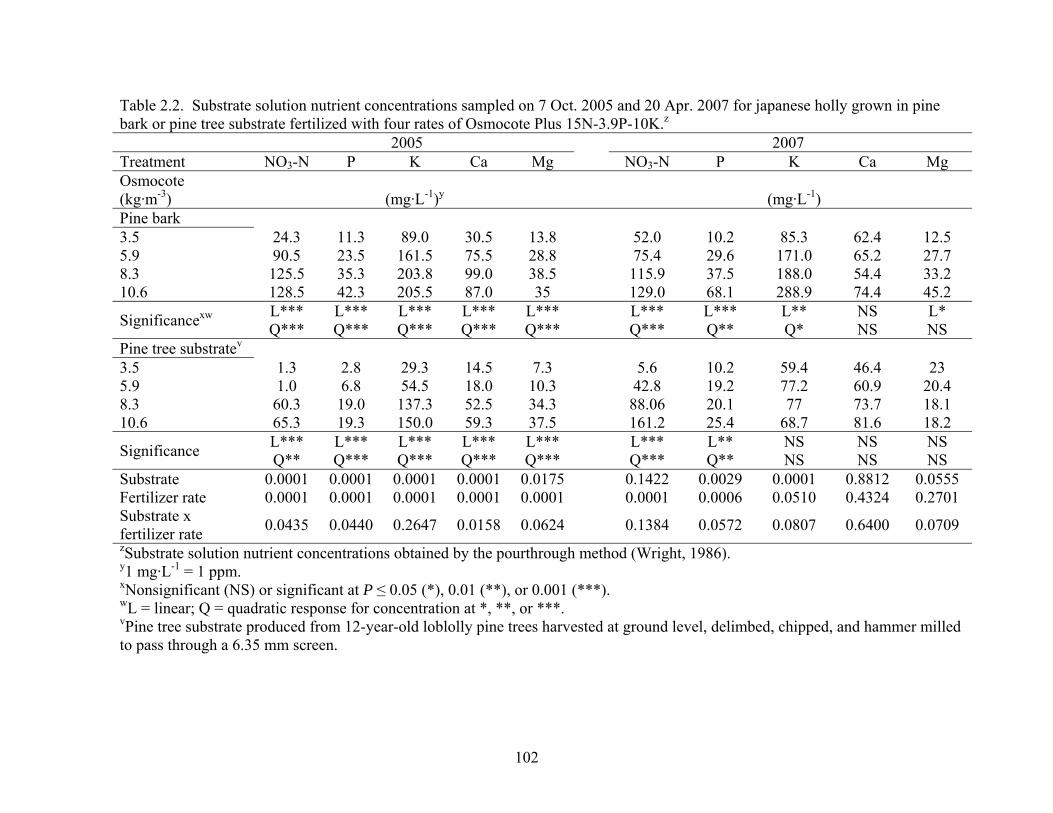
102
Table 2.2. Substrate solution nutrient concentrations sampled on 7 Oct. 2005 and 20 Apr. 2007 for japanese holly grown in pine bark or pine tree substrate fertilized with four rates of Osmocote Plus 15N-3.9P-10K.z
2005 2007 Treatment NO3-N P K Ca Mg NO3-N P K Ca Mg Osmocote (kg·m-3)
(mg·L-1)y (mg·L-1)
Pine bark 3.5 24.3 11.3 89.0 30.5 13.8 52.0 10.2 85.3 62.4 12.5 5.9 90.5 23.5 161.5 75.5 28.8 75.4 29.6 171.0 65.2 27.7 8.3 125.5 35.3 203.8 99.0 38.5 115.9 37.5 188.0 54.4 33.2 10.6 128.5 42.3 205.5 87.0 35 129.0 68.1 288.9 74.4 45.2
Significancexw L*** Q***
L*** Q***
L*** Q***
L*** Q***
L*** Q***
L*** Q***
L*** Q**
L** Q*
NS NS
L* NS
Pine tree substratev 3.5 1.3 2.8 29.3 14.5 7.3 5.6 10.2 59.4 46.4 23 5.9 1.0 6.8 54.5 18.0 10.3 42.8 19.2 77.2 60.9 20.4 8.3 60.3 19.0 137.3 52.5 34.3 88.06 20.1 77 73.7 18.1 10.6 65.3 19.3 150.0 59.3 37.5 161.2 25.4 68.7 81.6 18.2
Significance L*** Q**
L*** Q***
L*** Q***
L*** Q***
L*** Q***
L*** Q***
L** Q**
NS NS
NS NS
NS NS
Substrate 0.0001 0.0001 0.0001 0.0001 0.0175 0.1422 0.0029 0.0001 0.8812 0.0555 Fertilizer rate 0.0001 0.0001 0.0001 0.0001 0.0001 0.0001 0.0006 0.0510 0.4324 0.2701 Substrate x fertilizer rate 0.0435 0.0440 0.2647 0.0158 0.0624 0.1384 0.0572 0.0807 0.6400 0.0709 zSubstrate solution nutrient concentrations obtained by the pourthrough method (Wright, 1986). y1 mg·L-1 = 1 ppm. xNonsignificant (NS) or significant at P ≤ 0.05 (*), 0.01 (**), or 0.001 (***). wL = linear; Q = quadratic response for concentration at *, **, or ***. vPine tree substrate produced from 12-year-old loblolly pine trees harvested at ground level, delimbed, chipped, and hammer milled to pass through a 6.35 mm screen.

103
Table 2.3. Leaf tissue analysis taken on 22 Nov. 2005 and 25 May 2007 for japanese holly grown in pine bark or pine tree substrate and fertilized with four rates of Osmocote Plus 15N-3.9P-10K. 2005 2007 Treatment Nz Pz Kz N P K Osmocote (kg·m-3) (%) (%)
Pine bark 3.5 3.19 0.23 1.77 4.04 0.25 1.51 5.9 3.86 0.35 2.04 4.52 0.39 1.75 8.3 4.10 0.42 2.16 4.61 0.47 1.95 10.6 3.93 0.45 2.22 4.39 0.36 1.64
Significanceyx L* Q*
L*** Q***
L*** Q***
L*** Q***
L*** Q***
L*** Q***
Pine tree substratew 3.5 1.19 0.17 1.36 2.51 0.13 1.61 5.9 2.87 0.25 1.99 3.96 0.44 1.97 8.3 2.96 0.34 2.28 4.81 0.73 2.25 10.6 2.68 0.31 2.10 5.01 0.75 2.83
Significance NS Q*
L*** Q***
L** Q***
L* Q***
L* Q***
NS Q***
Substrate 0.0001 0.0001 0.0596 0.0002 0.0020 0.0001 Fertilizer rate 0.0022 0.0001 0.0001 0.0001 0.0001 0.0001 Substrate x fertilizer rate 0.3749 0.3213 0.0260 0.0001 0.0001 0.0001 zTissue analysis performed on the most recently matured leaves per plant. N, nitrogen; P, phosphorus; K, potassium. yNonsignificant (NS) or significant at P ≤ 0.05 (*), 0.01 (**), or 0.001 (***). xL = linear; Q = quadratic response for concentration at *, **, or ***. wPine tree substrate produced from 12-year-old loblolly pine trees harvested at ground level, delimbed, chipped, and hammer milled to pass through a 6.35 mm screen.
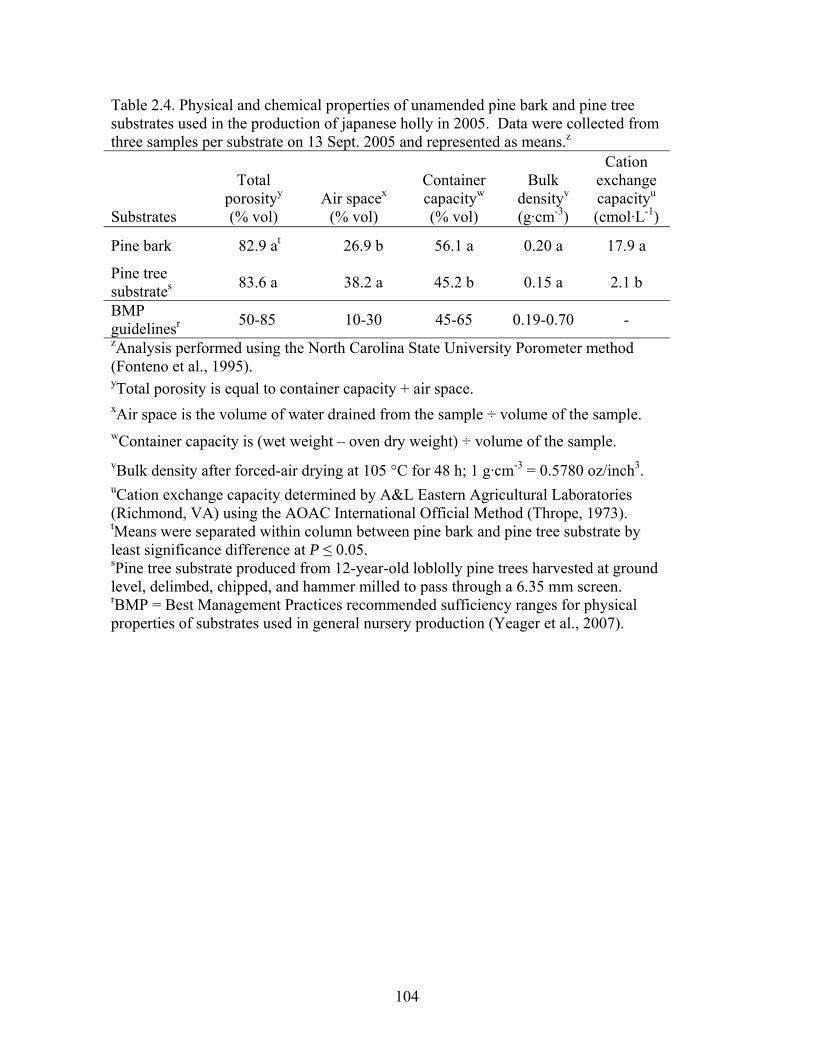
104
Table 2.4. Physical and chemical properties of unamended pine bark and pine tree substrates used in the production of japanese holly in 2005. Data were collected from three samples per substrate on 13 Sept. 2005 and represented as means.z
Substrates
Total
porosityy (% vol)
Air spacex (% vol)
Container capacityw
(% vol)
Bulk
densityv
(g·cm-3)
Cation exchange capacityu
(cmol·L-1)
Pine bark 82.9 at 26.9 b 56.1 a 0.20 a 17.9 a
Pine tree substrates 83.6 a 38.2 a 45.2 b 0.15 a 2.1 b
BMP
guidelinesr 50-85 10-30 45-65 0.19-0.70 - zAnalysis performed using the North Carolina State University Porometer method (Fonteno et al., 1995). yTotal porosity is equal to container capacity + air space. xAir space is the volume of water drained from the sample ÷ volume of the sample. wContainer capacity is (wet weight – oven dry weight) ÷ volume of the sample. vBulk density after forced-air drying at 105 °C for 48 h; 1 g·cm-3 = 0.5780 oz/inch3. uCation exchange capacity determined by A&L Eastern Agricultural Laboratories (Richmond, VA) using the AOAC International Official Method (Thrope, 1973). tMeans were separated within column between pine bark and pine tree substrate by least significance difference at P ≤ 0.05. sPine tree substrate produced from 12-year-old loblolly pine trees harvested at ground level, delimbed, chipped, and hammer milled to pass through a 6.35 mm screen. rBMP = Best Management Practices recommended sufficiency ranges for physical properties of substrates used in general nursery production (Yeager et al., 2007).

105
Table 2.5. Leaf tissue analysis taken on 25 May 2007, average electrical conductivity (EC) levels and pH values over the experiment and substrate solution nutrients sampled on 20 Apr. 2007 for azalea grown in pine bark or pine tree substrate and fertilized with four rates of Osmocote Plus 15N-3.9P-10K. Leaf tissuez Substrate solutiony Treatment N P K pH EC NO3-N P K Osmocote (kg·m-3) (%) (dS·m-1)x (mg·L-1)x
Pine bark 1.2 1.40 0.29 0.91 4.9 0.60 4.2 2.3 18.6 3.5 2.42 0.26 1.21 4.7 0.83 22.7 6.1 45.6 5.9 2.86 0.24 1.57 4.4 1.5 62.5 11.2 99.5 8.3 3.07 0.24 1.75 4.3 2.04 96.4 24.3 122.5
Significancewv L*** Q***
NS Q***
L*** Q***
L*** Q***
L*** Q***
L*** Q***
L** Q**
L*** Q***
Pine tree substrateu 1.2 0.95 0.21 0.63 5.5 0.41 3.2 1.0 18.7 3.5 1.52 0.54 1.49 5.5 0.60 10.4 4.7 24.5 5.9 2.33 0.55 1.89 5.6 0.71 43.5 17.2 44.8 8.3 2.95 0.37 2.07 5.4 1.6 75.6 20.7 57.2
Significance L*** Q***
L** Q**
L*** Q***
NS Q***
L*** Q***
L*** Q***
L** Q**
L*** Q***
Substrate 0.0001 0.0001 0.0009 0.0001 0.0001 0.4762 0.0980 0.0001 Fertilizer rate 0.0001 0.0001 0.0001 0.0001 0.0001 0.0001 0.0001 0.0001 Substrate x fertilizer rate 0.0001 0.0001 0.0001 0.0001 0.0029 0.0004 0.0885 0.0015 zTissue analysis performed on the most recently matured leaves per plant. N, nitrogen; P, phosphorus; K, potassium. ypH, electrical conductivity (EC), and substrate solution nutrient concentrations were obtained by the pour-through method x1 dS·m-3 = 1 mmho/cm, 1 mg·L-1 = 1 ppm. wNonsignificant (NS) or significant at P ≤ 0.05 (*), 0.01 (**), or 0.001 (***). vL = linear; Q = quadratic response for concentration at *, **, or ***. uPine tree substrate produced from 12-year-old loblolly pine trees harvested at ground level, delimbed, chipped, and hammer milled to pass through a 6.35 mm screen.

106
3
4
5
6
7
Pine bark LNS QNS
Pine tree substrate LNS QNS
3.5 5.9 8.3 10.6
2
4
6
8
10
12
Pine bark L*** Q***Pine tree substrate L*** Q***
C
6
8
10
12
14
16
18
Pine bark LNS QNS Pine tree substrate L*** Q***
A
B
Osmocote rate (kg·m-3) Figure 2.1. (A) (2005 study) Shoot dry weight (pine bark: y = 13.3930 (1 - 0.5364x), R2 = 0.16 and pine tree substrate: y = 3.3072 + 0.6071x – 0.0066x2, R2 = 0.67); (B) root dry weight (pine bark: y = 8.1313 – 0.4120x + 0.0146x2, R2 = 0.12 and pine tree substrate: y = 7.3761 – 0.3766x + 0.0112x2, R2 = 0.23); (C) substrate CO2 efflux rates (µmols CO2
.m-
2.s-1) (pine bark: y = 3.9333 + 0.0594x + 0.0108x2 , R2 = 0.54 and pine tree substrate: y = 9.3141 + 1.2809x – 0.1458x2, R2 = 0.87) of japanese holly grown from 17 Aug. 2005 to 22 Nov. 2005 in pine bark (х) or pine tree substrate (○) incorporated with four rates of Osmocote Plus 15N-3.9P-10K. Each point represents the means ± SE indicated by standard error bars (n = 5). L = linear; Q = quadratic responses, non-significant (NS) or significant at P ≤ 0.05 (*), 0.01 (**), or 0.001 (***) respectively.
Shoo
t dry
wt.
(g)
CO
2 flu
x (μ
ml·m
-2·s-1
) R
oot d
ry w
t. (g
)
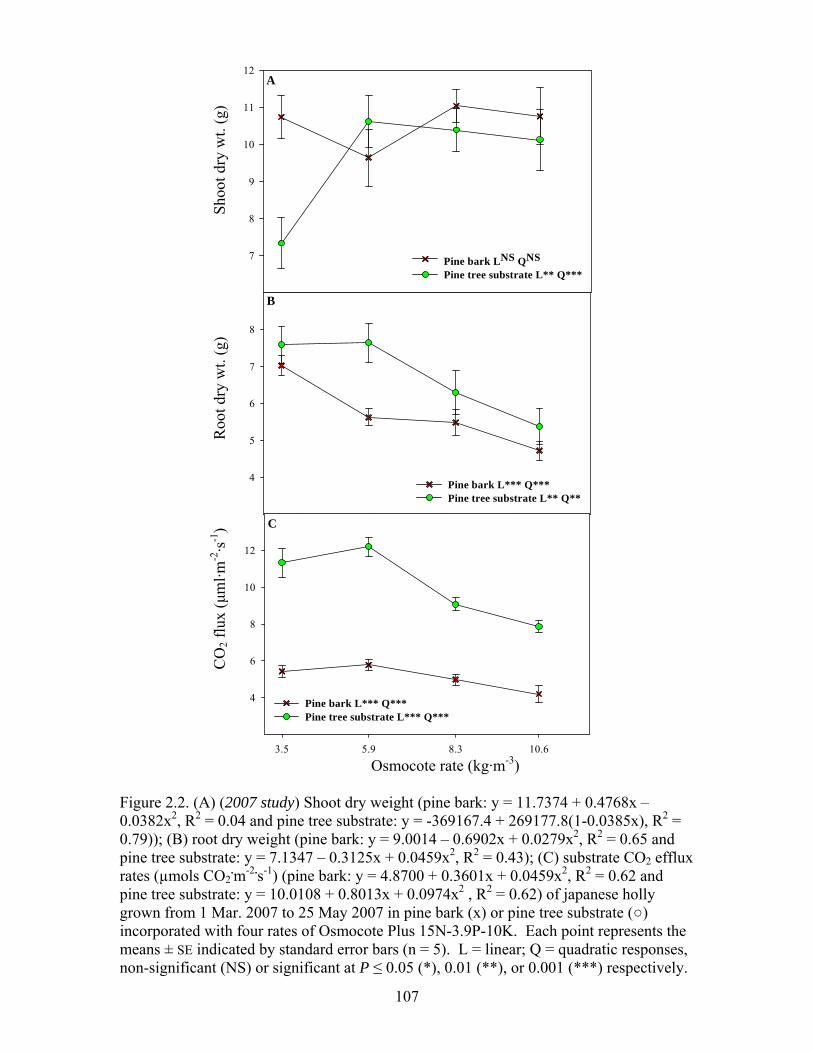
107
4
5
6
7
8
Pine bark L*** Q***Pine tree substrate L** Q**
3.5 5.9 8.3 10.6
4
6
8
10
12
Pine bark L*** Q***Pine tree substrate L*** Q***
C
B
7
8
9
10
11
12
Pine bark LNS QNSPine tree substrate L** Q***
A
Osmocote rate (kg·m-3)
Figure 2.2. (A) (2007 study) Shoot dry weight (pine bark: y = 11.7374 + 0.4768x – 0.0382x2, R2 = 0.04 and pine tree substrate: y = -369167.4 + 269177.8(1-0.0385x), R2 = 0.79)); (B) root dry weight (pine bark: y = 9.0014 – 0.6902x + 0.0279x2, R2 = 0.65 and pine tree substrate: y = 7.1347 – 0.3125x + 0.0459x2, R2 = 0.43); (C) substrate CO2 efflux rates (µmols CO2
.m-2.s-1) (pine bark: y = 4.8700 + 0.3601x + 0.0459x2, R2 = 0.62 and pine tree substrate: y = 10.0108 + 0.8013x + 0.0974x2 , R2 = 0.62) of japanese holly grown from 1 Mar. 2007 to 25 May 2007 in pine bark (х) or pine tree substrate (○) incorporated with four rates of Osmocote Plus 15N-3.9P-10K. Each point represents the means ± SE indicated by standard error bars (n = 5). L = linear; Q = quadratic responses, non-significant (NS) or significant at P ≤ 0.05 (*), 0.01 (**), or 0.001 (***) respectively.
CO
2 flu
x (μ
ml·m
-2·s-1
) R
oot d
ry w
t. (g
) Sh
oot d
ry w
t. (g
)

108
1.2 3.5 5.9 8.3
8
10
12
14
16
18
20
22
24
Pine bark LNS Q**Pine tree substrate L*** Q***
Osmocote rate (kg·m-3) Figure 2.3. (2007 study) Shoot dry weight (pine bark: y = 20.1497(1 – 0.5475x), R2 = 0.40 and pine tree substrate: y = 3.0218 + 2.7865x – 0.1184x2, R2 = 0.83) of azalea grown from 1 Mar. 2007 to 25 May 2007 in pine bark (х) or pine tree substrate (○) incorporated with four rates of Osmocote Plus 15N-3.9P-10K. Each point represents the means ± SE indicated by standard error bars (n = 5). L = linear; Q = quadratic responses, non-significant (NS) or significant at P ≤ 0.05 (*), 0.01 (**), or 0.001 (***).
Shoo
t dry
wt.
(g)

109
CHAPTER III
Pine Tree Substrate, Nitrogen Rate, Particle Size, and Peat Amendment Affects Poinsettia Growth and Substrate Physical Properties
Abstract: ‘Prestige’ poinsettias (Euphorbia pulcherrima Willd. Ex Klotzsch) were
grown at different fertilizer rates in three pine tree substrates (PTS) made from loblolly
pine trees (Pinus taeda L.) and a peat-based control. Pine tree substrates were produced
from pine trees that were chipped, and hammer-milled to a desired particle size.
Substrates used in this study included peat-lite (PL), PTS produced with a 2.38-mm
screen (PTS1), PTS produced with a 4.76-mm screen (PTS2), and PTS produced with a
4.76-mm screen and amended with 25% peatmoss (v/v) (PTS3). Initial and final
substrate physical properties and substrate shrinkage were determined to evaluate
changes over the production period. Poinsettias were grown in 1.7-L containers in the
fall of 2007 and fertilized at each irrigation with 100, 200, 300, or 400 mg·L-1 N. Shoot
dry weight and growth index were higher in PL at 100 mg·L-1 N, but similar for all
substrates at 300 mg·L-1 N. Bract length was generally the same or longer in all PTS-
grown plants compared to plants grown in PL at each fertilizer rate. Post-production
time-to-wilting was the same for poinsettias grown in PL, PTS1 and PTS3. Initial and
final air space (AS) was higher in all PTSs compared to PL and container capacity (CC)
of PTS1 was equal to PL initially and at the end of the experiment. The initial and final
CC of PTS2 was lower than PL. The incorporation of 25% peat (PTS3) increased shoot
dry weight and bract length at lower fertilizer rates compared to 4.76-mm PTS alone
(PTS2). Substrate shrinkage was not different between PL and PTS1, but greater than
shrinkage with the coarser PTS2. This study demonstrates that poinsettia can be
110
successfully grown in a PTS with small particles (2.38-mm screen) or a PTS with large
particles (4.76-mm screen) when amended with 25% peatmoss which results in physical
properties (CC and AS) similar to those of PL.
Introduction
Poinsettia is the number one selling potted plant produced and sold in the United
States and the preferred substrates for their production are peat-based (Hidalgo and
Harkess, 2002). Peat moss is also the preferred substrate for the production of most all
other greenhouse crops. The production of greenhouse crops has increased over the past
decade (2007 Floriculture and Nursery Crops Yearbook, 2007) thereby increasing the use
and demand of peat. Although world peat reserves are significant, the question of
limiting peat extraction to avoid the destruction of these fragile natural environments
(non-renewable peat bogs) is of increasing concern among environmental, scientific,
private, and governmental agencies in Europe (Carlile, 2004; Clark, 2008; Riviere et al.
2008; Robertson, 1993). In the United Kingdom for example, these concerns have
prompted governmental regulations on the use of peat, and set target deadlines of 90%
peat replacement by 2010 (Holmes, 2008). In response to the regulations, investigation
of numerous peat alternatives in Europe has been conducted, but the acceptance and use
of these materials has been gradual due to the continued low cost of peat (Schmilewski,
2008). There aren’t regulations or governmental mandates to decrease the use of peat
(mined and shipped from Canada) here in the U.S., but recent increases in fuel
(transportation) costs, have led to the increasing cost of peat substrates and therefore have
resulted in a greater interest in less expensive and locally available peat substitutes.
Researchers are addressing the increasing cost of peat by investigating renewable

111
alternative substrates from other organic materials that can offer equal growth
performance as that of peat but at a cheaper cost.
Wang and Blessington (1990) reported similar growth of poinsettia (number of
branches and bracts, days to flower, and overall plant grade) in a substrate derived from
composted cotton burrs compared to plants grown in a peat: pine bark substrate. Other
works demonstrating the use of composted organic materials (Ku et al., 1998; Papafotiou
et al., 2004) have been reported for poinsettia production.
Research has also been conducted on utilizing wood and plant-based substrates
for greenhouse crop production. Lang (1997) and Webber et al. (1999) reported results
with a substrate composed of noncomposted ground kenaf (Hibiscus cannabinus L.)
plants to produce poinsettia and periwinkle (Vinca minor L.) with equal size and quality
to plants grown in peat-based substrates. Wood shavings of fir (Pseudotsuga menziesii
Mirb.) and redwood (Sequoia sempervirens D. Don) trees (Criley and Watanabe, 1974)
and sawdust (derived from hardwood and softwood tree species) have been investigated
for the production of carnations (Dianthus caryophyllus L.; Stark and Lukaszuk, 1991),
chrysanthemums (Chrysanthemum morifolium Ramat.; Scott and Bearce, 1972; Still et
al., 1972), and other potted foliage plants (Worrall, 1981) with results compared to peat-
based substrates.
The problem with most of the aforementioned materials is the lack of uniformity
that often exists with composts and wood waste materials like sawdust and wood
shavings. The lack of substrate consistency and insufficient quantities of these waste
materials is a problem for long-term and sustained use as a major substrate, especially for
large production operations. In response, researchers have begun testing wood-based
112
substrates that are specifically produced for use as container substrates instead of utilizing
wood waste and by-product materials. Research in Europe has been conducted for over
two decades on the development of horticultural substrates composed of wood (Gumy,
2001; Nazim Gruda, pers. comm., 2007; Raviv and Lieth, 2008; Schilling, 1999). Gerber
et al. (1999) demonstrated that geranium (Pelargonium x hortorum L.H. Bailey) could be
grown in a 100% wood fiber substrate with similar growth to plants grown in peat if they
were irrigated and fertilized more often than the plants grown in peat.
More recently, a PTS derived from delimbed loblolly pine trees, and referred to as
WoodGro™ (WoodGro LLC., Blacksburg, VA) was developed. Successful production
has been reported on numerous woody (Wright and Browder, 2005, Wright et al., 2006,
Jackson et al., 2008) and herbaceous species (Wright et al., 2008). Fain et al. (2008) and
Boyer et al. (2008) reported successful bedding plant growth in PTSs derived from
loblolly pine trees (including limbs, bark, and needles) compared to plants grown in
100% pine bark (PB).
Nelson (2003) in describing the desirable properties of substrates for greenhouse
crops noted the importance of organic matter stability and carbon (C): nitrogen (N) ratio.
The high C:N ratio of wood substrates, resulting in the tie-up of N due to microbial
immobilization, and wood substrate stability (decomposition) over time have been major
concerns of researchers and growers. Researchers have shown, however, that reduced
plant growth in wood substrates is generally only a problem when fertility levels
(primarily N) are near the lower limits for optimal plant growth and development
(Hicklenton, 1983). Wright et al. (2008) have shown that chrysanthemums can be
successfully grown in a 100% PTS with an additional 100 ppm N compared to plants

113
grown in a commercial peat substrate. Other works by Still et al. (1972), Gruda and
Schnitzler (1999), Wright et al. (2006), and Jackson et al. (2008) have shown that growth
of plants produced in wood substrates is equal to plants produced in peat and PB
substrates when higher fertilizer rates are supplied. Stability of wood substrates over
time has been reported to range from 36% volume loss over 15 months (Fischer et al.,
1993) to 50% volume loss over 51 weeks (Meinken and Fischer, 1997) during crop
production. The wood substrates used in these reports were wood fiber (so named due to
their manufacturing process and physical properties) and were derived from a mixture of
various tree species; primarily spruce (Picea abies L.). Jackson and Wright (2008) and
Jackson et al. (2008) report no significant visual substrate shrinkage or decomposition of
PTS during greenhouse and nursery crop production and Fain et al. (2008) noted less
shrinkage of a PTS than a peat substrate during a five week greenhouse trial. Changes
brought about by shrinkage are undesirable because containers may need to be topped-off
with substrate before distribution (sell). Furthermore, substrate shrinkage usually
increases container capacity (CC) and decreases air space (AS) of substrates during
production (Aendekerk, 2001).
In addition to substrate stability and C:N ratio, the successful production of
poinsettia (and all greenhouse crops) requires having a substrate with other desirable
physical and chemical properties that can promote and sustain healthy plant growth.
Previous plant growth experiments with PTS have been conducted on various substrate
screen sizes (with a range of physical properties) including 4.76-mm (Wright et al. 2008),
and 6.35-mm (Fain et al., 2008; Jackson et al., 2008; Wright et al., 2006) with plant
growth being similar to plants grown in peat or PB. Researchers have shown that PTS

114
can be constructed to produce a wide range of physical properties such as air space (AS)
and water holding capacities (WHC) that are similar to commercial peat substrates
(Saunders et al., 2006). To achieve this, PTS is hammer milled for a longer period of
time to further reduce the particle size. The longer processing requires additional time,
energy and labor thereby increasing the cost of PTS production. Incorporation of peat,
PB, or other amendments may improve physical properties of larger PTS particle sizes to
create a desired substrate for greenhouse crop production at a cheaper cost (less grinding
time of PTS in a hammer mill). Browder et al. (2006) has shown that the incorporation
of peat in PTS improves plant growth at lower fertility rates compared to 100%
unamended PTS.
Research has not been reported on poinsettia production in PTS, or the evaluation
of plant growth in different particle sizes of PTS under different fertility regimes.
Results from a preliminary unpublished study in 2005 indicated that poinsettia can be
grown in PTS with comparable growth to plants grown in PL if the fertilizer solution N
concentration was increased from 200 mg·L-1 N to 300 mg·L-1 N. This experiment is a
follow-up to the study mentioned above with the incorporation of particle size and peat
amendment as additional parameters for evaluation. The affect of peat incorporation into
PTS needs to be further investigated as a way to improve physical and chemical
properties of PTS during crop production. Potential shrinkage of PTS during crop
production and how it may affect substrate physical properties has not been reported.
Determination of PTS stability over time under fertilized container conditions is critical
since the change in physical properties during crop production can directly affect
irrigation needs and plant growth. Based on these unanswered questions, the objectives
115
of this research were to determine the effect of 1) fertilizer rate; 2) substrate particle size
and 3) peat amendment on growth and floral quality, and on post-production time-to-
wilting of poinsettias.
Materials and Methods
The substrates used in this experiment were 1) PTS produced with a 2.38-mm
screen (PTS1); 2) PTS produced with a 4.76-mm screen (PTS2); 3) PTS produced with a
4.76-mm screen and amended with 25% (v/v) peat moss (PTS3; Premier Tech, Quebec,
Canada); and 4) a mix composed of 80% peat and 20% perlite (v/v; peat-lite – PL). The
PTSs selected for this experiment were chosen based on their range of physical properties
(Jackson and Wright, 2008). Pine tree substrate was produced from 12-year-old loblolly
pine trees (approximately 25-cm in basal diameter) that were harvested at ground level,
delimbed on 9 Apr. 2007 in Blackstone VA, and chipped with bark intact on 8 Aug. 2007
with a Bandit Chipper (Model 200, Bandit Industries, Inc. Remus, MI). Wood chips
were then hammer-milled on 8 Aug. 2007 to pass through either a 2.38- or 4.76-mm
screen. Peat-lite substrate was pre-plant amended with dolomitic lime at a rate of 3.6
kg·m-3 and calcium sulfate (CaSO4) at a rate of 0.6 kg·m-3. Only PTS3 was incorporated
with 1.8 kg·m-3 dolomitic lime due to the 25% peat moss amendment. Neither PTS1 or
PTS2 were amended with lime due to the relatively inherent high pH (~6.0) of freshly
ground pine wood (Wright et al., 2008), but all PTSs were amended with 0.6 kg·m-3
CaSO4 as Saunders et al. (2005) reported improved growth of herbaceous species when
CaSO4 was incorporated.
On 16 Aug. 2007 single rooted cuttings of ‘Prestige’ poinsettia (Ecke Ranch,
Yoder Brothers, Inc. Barberton, OH) were transplanted into 12-cm-tall x 15-cm-square

116
(1.7-L) plastic containers filled with the four substrates. To stimulate branching, the
apical growing point was removed on 30 Aug. 2007 to leave approximately 6 nodes.
Plants were fertilized at each irrigation with 250 mL (beaker applied) of 100, 200, 300, or
400 mg·L-1 N made from Peters 20N-4.4P-16.6K Peat-Lite Special (The Scotts Co.,
Marysville, OH) containing 12% nitrate (NO3-N) and 8% ammonium (NH4-N) until 2
Oct. 2007. From 2 Oct. until 10 Nov. 2007 plants were fertilized with the same N
concentrations derived from Peters 15N-2.2P-20.75K Poinsettia Peat-Lite Special (The
Scotts Co., Marysville, OH) containing 11% NO3-N and, 4% NH4-N respectively.
Fertilizers were switched to lower the amount of NH4-N and increase the amount of NO3-
N supplied to the crop as suggested by Ecke et al. (2004). Plants in all substrate
treatments were irrigated and fertilized similarly. Plants were grown without growth
regulators on raised benches in the Virginia Tech (Blacksburg, VA) Greenhouse Facility
(glass-covered) with average day and night temperatures of 24 oC and 19 oC,
respectively. Substrate solution was extracted using the pourthrough (PT) method
(Wright, 1986) one day after potting (DAP) and then once per week for the first four
weeks followed by every two weeks for the remainder of the experiment and analyzed for
pH and EC using a Hanna HI 9811 instrument (Hanna Instruments, Woonsocket, RI).
Substrate solution extracted on 14 Sept. 2007 (30 DAP) and 26 Oct. 2007 (72 DAP) were
frozen and later analyzed for NO3-N with an Orion ion selective electrode (Thermo
Electron, Beverly, MA) on 17 Jan. 2008, and phosphorus (P), and potassium (K)
concentrations on 31 Jan. 2008 with a Spectro Ciros Vision ICP (Spectro Analytical
Instrument, Muhwah, NJ). On 28 Sept. 2007 (42 DAP) growth index of each plant was
determined using the following formula: [(height + widest width + perpendicular width)

117
÷ 3]. On 15 Nov. 2007 (94 DAP) final growth measurements were taken including
growth index (GI) and bract length (BL) of the five largest bracts on each of the two
tallest stems (10 bracts total). On 15 Nov. 2007 plants (10 single plant replications) were
severed at the substrate surface, forced-air dried for 5 d at 65 °C, and dry weights were
recorded.
On 3 Dec. 2007 six uniform replications of poinsettias grown at the 300 mg·L-1 N
fertilizer rate in each of the substrates were selected to assess the post-production time-to-
wilting of poinsettia without irrigations in an indoor environment. Plants fertilized with
300 mg·L-1 N were chosen due to the similar plant growth across all substrates at that
fertilizer rate. Plants were irrigated with 250 mL applications of water three times over
eight hours to maintain moisture content near container capacity for all substrates. After
drainage, plants were moved from the greenhouse to a laboratory (to simulate interior
home conditions) and randomly spaced on tables. Plants were maintained at 16 µmol·m-
2·s-1 of irradiance from cool-white fluorescent lights for 10 h daily at 26 ± 1 °C. Plants
were observed daily and monitored for wilting. When the first leaf on a plant began to
droop, the day and time were recorded for that plant (Stage I). When all leaves on a plant
wilted the day and time were again recorded (Stage II).
For substrate physical properties determination, 25-L samples of all substrates
were collected on 14 Aug. 2007. These substrates were taken from the same batch used
to pot the poinsettias and therefore amended similarly. Substrate samples were air-dried
for two days then bagged and dry-stored for 14 weeks (the duration of the poinsettia
experiment). Plastic containers [12-cm-tall x 15-cm-wide (1.7-L)] were filled with PL,
PTS1, and PTS2 on 14 Aug. 2007 and placed fallow on a greenhouse bench. Six
118
replications of each substrate were fertilized with 300 mg·L-1 N made from Peters 20N-
4.4P-16.6K Peat-Lite Special (The Scotts Co., Marysville, OH) containing 12% nitrate
(NO3-N) and 8% ammonium (NH4-N) until 12 Nov. 2007 (96 DAP). Containers were
irrigated once weekly with 500 mL of fertilizer solution. Substrate shrinkage (cm) was
determined by measuring the difference in substrate height (from the top of the containers
to the substrate surface) at 1 DAP following the first irrigation, and again at 96 DAP. At
96 DAP, two containers of each substrate were combined and prepared for physical
property determination (n = 3).
Physical properties including AS, CC, total porosity (TP), and bulk density (BD)
were determined on 10 Dec. 2007 on three replicate samples of each substrate from the
initial dry-stored bagged samples and from the fallow samples fertilized in containers,
using the North Carolina State University (NCSU) Porometer Method (Fonteno et al.
1995). Particle size distribution of 150 g oven-dried samples of PL, PTS1 and PTS2
were determined with 14 sieves (ranging from > 6.3-mm to < 0.06-mm) plus a bottom
pan (Table 1). Sieves and pan were shaken for 10 min with a RX-29 Ro-Tap sieve shaker
(278 oscillations min-1, 150 taps min-1; W.S. Tyler, Mentor, OH) and the particle
fractions retained on each sieve and the amount that passed through the smallest sieve
and retained by the sieve pan were weighed.
The experimental design was completely randomized with four substrates, four
fertilizer rates, and eight replications per substrate for a total of 128 plants. Data were
tested using the analysis of variance procedures of SAS (version 9.1 SAS Institute, Inc.
Cary, NC). Data were also subjected to regression analysis using SigmaPlot (version
9.01 SPSS, Inc., Chicago, IL) with the exception that substrate physical properties were

119
subjected to analysis of variance within the GLM procedure, with treatment means
separated by least significant difference analysis.
Results and Discussion
Particle size distribution. Peat-lite had the highest percentage of coarse particles
(>2.0-mm; 23%) due primarily to the aggregates and clumps found in peat and also due
to the perlite particles present in this substrate (Table 3.1). The PTS2 had the next
highest percentage of coarse particles (1%), followed last by PTS1 (0.2%). Particle size
distribution between 2.0- and 0.5-mm was 46% in PL, 59% in PTS1, and 70% in PTS2.
Percentage of fine particles (<0.5-mm) was highest in PTS1 (41%) followed by PL with
31% and PTS2 with 29% (Table 3.1). By grinding wood with the 2.76-mm screen
(PTS1) there was a 24% increase in the amount of fines produced compared to grinding
with the 4.76-mm screen (PTS2; Table 3.1).
Physical properties: Initial. Total porosity was higher in all PTSs compared to
PL, and were within, or higher than, the upper limit of the recommended range of (50-
85%; Yeager et al., 2007; Table 3.2). Air space was high in all PTSs and within the
recommended range (10-30%; Table 3.2). Peat-lite had the lowest percentage AS (15%)
but was within the recommended range. Bulk density was equal for all PTSs and the PL
value was similar to the PTS2 value. Container capacity values for PTS1 and PTS3 were
equal to PL; PTS1 and PTS3 CC values were higher than the PTS2 value. This is likely
due to the higher percentage of fine particles in PTS1 (Table 3.1) which are known to
increase CC, and PTS3 is higher because of the water retention of the 25% peat
component.

120
Physical properties: Final. (Final data were not determined for PTS3 due to
sample contamination during storage). Total porosity increased in PL and PTS1 after 14
weeks but did not change in PTS2, and all substrate TP values were above the upper limit
of the recommended range (50-85%; Table 3.2). Higher than recommended TP values
(>85%) have been previously reported with several commercial wood substrates in
Europe, including Cultifiber® (94%), Fibralur® (96%), Hortifiber® (94%), Pietal®
(93%), and Toresa® (92-97%; Gumy, 2001; Raviv and Leith, 2008). Air space did not
change for PTS2, but decreased in PL and PTS1. Air space for all substrates was within
the recommended range (10-30%) after 14 weeks. Bulk density for all substrates was
below the suggested levels (0.19-0.70) after 14 weeks. Container capacity values were
equal in PL and PTS1 and were lowest in PTS2 (Table 3.2). All substrates increased CC
after 14 weeks and were at or above the suggested range at the end of the experiment.
Decreased AS and increased CC over time could be due to the settling “nesting” of the
particles in a substrate when the finer particles fit between larger particles as described by
Bilderback and Lorscheider (1995) or due to substrate decomposition. This increase in
CC and decrease in AS has been shown by Bohne and Gunter (1997) and Prasad and
Chualain (2005) in response to changes in particle sizes of a substrate. Over time for
PTSs, the changes in physical characteristics were minor and with the exception of TP
were substantially the same as those in PL showing that PTS can maintain desirable
physical properties throughout a short-term crop production period.
Shrinkage after 14 weeks was lowest in PTS2 (7%) followed by PL (12%), and
PTS1 (13%; Table 3.2). Less shrinkage with PTS2 is likely due to the larger particle size
compared to PTS1 which agrees with observations by Wang (1994) who reported less
121
shrinkage of a coarse particle substrate derived from kenaf wood compared to a smaller
particle kenaf substrate. Conversely, the increased shrinkage observed in PL and PTS1 is
likely due to their high percentage of small particles (Table 3.1). Shrinkage is due to
either breakdown (microbial decomposition) of the substrate or by substrate settling and
compression caused by gravity and water movement through the substrate during
irrigations (Fonteno et al, 1981; Meinken and Fischer, 1997). When particles of different
sizes are mixed, shrinkage of the final volume occurs, as small particles fill the pores
located between the large particles (Bures et al., 1993; Nash and Pokorny, 1990).
Effects on poinsettia growth, floral quality, and post-production time-to-wilting.
Shoot dry weight increased in response to increasing fertilizer rate in each of the
substrates (Table 3.3). There was a substrate x fertilizer rate response for shoot dry
weight across substrates (Table 3.3). At the 100 mg·L-1 N rate shoot dry weight was
higher in plants grown in PL than in all other substrates; shoot dry weight of plants grown
in PTS1 and PTS3 were not different; and dry weight of plants grown in PTS2 was
lowest (Table 3.3). At the 200 mg·L-1 N rate shoot dry weight was equal for PL, PTS1,
and PTS3, with PTS2 being lowest. The 25% peat in PTS3 is likely responsible for the
improved shoot dry weight at the 100 and 200 mg·L-1 N fertilizer rates compared to PTS2
due to improved physical (Table 3.2) and chemical properties of the coarser PTS. Shoot
dry weight at the 300 mg·L-1 N rate was equal in all substrates. These growth results are
the same as our preliminary study in 2005 and those reported by Wright et al. (2008),
who showed that chrysanthemums require an additional 100 mg·L-1 N when grown in
4.76-mm PTS (PTS2) to achieve comparable growth to plants grown in a peat substrate.
The 300 mg·L-1 N rate required for plants grown in PTS is within the recommended
122
fertilizer range (200-300 mg·L-1 N) suggested for poinsettia growth (Ecke et al., 2004).
Shoot dry weight at the 400 mg·L-1 N rate was less for the PL-grown plants than plants
grown in PTS1 and PTS3.
Decreased shoot dry weight of plants in PL at the 400 mg·L-1 N rate may be in
response to the low substrate pH level (4.8) or the high EC value (3.7 dS·m-3) that was
observed at that fertilizer rate (Table 3.7; to be discussed later) and lower shoot dry
weight for PTS2-grown plants is likely due to lower CC (Table 3.2). The increased
microbial activity in PTS, reported by Jackson et al. (2008) and the resulting N
immobilization in PTS (Jackson and Wright, 2007; Jackson and Wright 2008) is the
likely reason for the additional fertilizer requirement in PTS for optimal plant growth. It
is not believed that the absence of dolomitic lime in PTS1 and PTS2 (and therefore the
additional Ca supplied by the lime to PL and PTS3) had any effect on plant growth in this
experiment. Calcium concentrations in substrate solution were sufficient in all substrates
at all fertilizer rates (data not shown) and therefore are negligible in the growth results.
In addition, Saunders et al. (2005) and numerous unpublished studies by these authors
have shown that increased Ca application to PTS (above the 0.6 kg·m-3 applied) does not
increase plant growth in PTS.
Growth index at 42 DAP for PL-grown plants was not influenced by fertilizer rate
but GI did increase in response to fertilizer for plants in all PTSs (Table 3.4). Similar to
shoot dry weight, GI was higher in PL-grown plants than the PTSs at the 100 mg·L-1 N
rate at 42 and 94 DAP, but as fertilizer rate increased, GI differences between substrates
were few, with the possible exception of PTS3 at 94 DAP. It is not understood why GI of

123
PTS3-grown plants at 94 DAP did not equal the GI of PL-grown plants at the 200 and
300 mg·L-1 N rates like was shown at 42 DAP and for shoot dry weight.
Bract length increased as fertilizer rate increased for all substrates (Table 35).
Bract length was determined because bract size is an indicator of high quality, visually
appealing poinsettias. In general, with the exception of some minor discrepancies, BL
was lowest in PTS2-grown plants and highest for PL, PTS1, and PTS3-grown plants.
The reason for increased BL in PL, PTS1, and PTS3 is likely, (as with shoot dry weight),
due to higher CC, thus higher water and nutrient retention compared to PTS2 (Table 3.2).
Post-production time-to-wilting (Stage I and Stage II) occurred first in PTS2-
grown plants with no differences in the drying/wilting time among plants grown in PL,
PTS1, or PTS3 (Table 3.6). The earliness of the PTS2-grown plants to wilt is most likely
due to the lower CC of that substrate compared to the others (Table 3.2). The presence of
25% peat in the PTS3 substrate plus the smaller particle fines of PTS1 (Table 3.1)
improved the water holding capacity compared to PTS2 and made it equal to the CC of
PL (Table 3.2) and thereby lengthened the time to wilting for plants in that substrate.
Thus, PTS does not require greater post-production maintenance (irrigations) than
traditional PL substrates if CC is comparable.
Substrate chemical and nutrient status. Substrate solution EC, NO3-N, P, and K
increased and pH decreased as fertilizer rate increased (Table 3.7). Substrate solution
pH was higher in all PTSs at each fertilizer rate compared with PL and decreased as
fertilizer rate increased (Table 3.7). Substrate solution EC values increased with
increasing fertilizer rate and at any particular fertilizer rate levels were higher in PL than
the three PTSs (Table 3.7), showing that higher fertilizer rates were required for all PTSs

124
compared with PL to achieve comparable substrate EC levels. Lower substrate solution
EC and higher pH in PTS compared to PL has been reported previously by Wright et al.
(2008).
There was a substrate x fertilizer rate response for P and K in the substrate
solution, but not for NO3-N. Nitrate concentrations increased as fertilizer rates increased
in all substrates and were generally higher in PL at each fertilizer rate than in the PTSs.
Similar to the EC levels and NO3-N concentrations previously discussed, P
concentrations were higher in PL (except at the 100 mg·L-1 N rate) at each fertilizer rate
compared to the three PTSs (Table 3.7). Conversely, substrate solution K concentrations
were higher at each fertilizer rate in all PTSs than in PL which has been previously
reported by Wright et al. (2008) during the production of chrysanthemums. Substrate
solution sampled on 26 Oct. showed similar responses and trends to these reported for 14
Sept. and therefore are not shown.
Lower NO3-N concentrations in substrate solution of PTS is likely a result of
microbial immobilization of NO3-N as reported by Jackson and Wright (2008). The
reason for lower substrate solution P concentrations in all PTSs may be two-fold. First, it
has been shown that microbial immobilization of P occurs in wood-based substrates
(Handreck, 1996), reducing the amount of soluble P in solution. Secondly, it has been
reported that P retention is higher in wood-based substrates (resulting in less water
extractable P) compared to peat due to exchange sites on the internal surfaces of the
wood particles (Brown and Pokorny, 1977). Higher substrate solution K in all PTSs is
likely due to higher concentrations of K present in fresh (noncomposted) wood compared

125
to K concentrations found in peat which has been observed by these authors (unpublished
results) and also reported by Prasad (1980).
Conclusions
Results from this experiment indicate that 100% PTS can be a successful
greenhouse substrate with similar plant growth and shrinkage as a traditional peat
substrate if additional fertilizer is supplied or if substrate physical properties are adjusted
to be similar to those of peat. We also observed the apparent benefits that the addition of
peat moss can have to a coarse PTS to improve plant growth and post-production self life
due to improved physical properties.
Since PTS is produced from freshly harvested trees, it, unlike many compost
based substrates, is a clean material free from undesirable components such as glass,
metal, weed seeds, pathogens, and heavy metals. The ability to grind PTS to various
particle sizes to achieve desired physical properties (AS and CC) excludes the need for
additional amendments (perlite, vermiculite, PB, etc.) that are required for commercial
peat substrates. The low BD of PTS could be important for shipping considerations of
these substrates, since weight increases shipping costs.
Loblolly pine is native to the southeastern U.S. and can be found in close
proximity to nursery and greenhouse operations. Pine tree substrate can be produced in
these areas, minimizing transportation costs to growers. It should also be mentioned that
the use of wood materials (including loblolly pine trees) are being developed as fuel
sources (i.e. wood pellets) as alternative energy sources. Competition for loblolly pine
trees for fuel wood should be considered as it relates to the cost of pine chips and

126
ultimately the production cost of PTS as it is developed and utilized commercially in the
future. One way to offset potential competition for pine wood is to establish pine
plantations specifically for PTS production by individual growers or by a consortium of
growers in areas throughout the southeast to guarantee sufficient wood sources in the
future.
Literature Cited
Aendekerk, T.G.L. 2001. Decomposition of peat substrates in relation to physical
properties and growth of Skimmia. Acta Hort. 548:261-268.
Bilderback, T.E. and M.R. Lorscheider. 1995. Physical Properties of double-processed
pine bark: effects on rooting. Acta Hort. 401:77-83.
Bohne, H. and C. Gunther. 1997. Physical properties of peat determined with different
methods. Acta Hort. 450:271-276.
Browder, J.F., J. Smithson, B.E. Jackson, and R.D. Wright. 2006. Pine chips: peat
substrate ratios affect plant growth. Proc. Southern Nursery Assoc. Research Conf.
51:98-99.
Brown, E.F. and F.A. Pokorny. 1977. Potassium distribution and retention in pine bark
and sand media. HortScience 12:343-344.

127
Boyer, C.R., G.B. Fain, C.H. Gilliam, T.V. Gallagher, H.A. Torbert, and J.L. Sibley.
2008. Clean chip residual: a substrate component for growing annuals. HortTechnology
18:423-432.
Bures, S, F.A. Pokorny, D.P. Landau, M.A. Farmer, and A.M. Ferrenberg. 1993.
Shrinkage, porosity characterization, and computer simulation of horticultural substrates.
Acta Hort. 342:229-234.
Carlile, W.R. 2004. Growing media and the environmental lobby in the UK 1997-2001.
Acta Hort. 644:107-113.
Clark, D. 2008. The wise use of peat in horticulture. Acta Hort. 779:161-164.
Criley, R.A. and R.T. Watanabe. 1974. Response of chrysanthemum in four soilless
media. HortScience 9:385-386.
Ecke, P., Jr., J.E. Faust, J. Williams, and A. Higgins. 2004. The poinsettia manual. Paul
Ecke Poinsettias, Encinitas, CA.
Fain, G.B., C.H. Gilliam, J.L. Sibley, and C.R. Boyer. 2008. Wholetree substrate and
fertilizer rate in production of greenhouse-grown petunia (Petunia xhybrida Vilm.) and
marigold (Tagetes patula L.). HortScience 43:700-705.

128
Fischer, P., E. Meinken, and F. Kalthoff. 1993. Holzfaserstoffe im test. (Woodfibre in
test) Gärtnerbörse Gartenwelt 26:1220-1222.
Floriculture and Nursery Crops Yearbook. 2007. Economic research service, U.S. Dept.
Agri., FLO-2007. 1 July 2008.
http://www.ers.usda.gov/publications/flo/2007/09Sep/FLO2007.pdf
Fonteno, W.C., D.K. Cassel, and R.A. Larson. 1981. Physical properties of three
container media and their effect on poinsettia growth. J. Amer. Soc. Hort. Sci. 106:736-
741.
Fonteno, W.C., C.T. Hardin, and J.P. Brewster. 1995. Procedures for determining
physical properties of horticultural substrates using the NCSU Porometer. Horticultural
Substrates Laboratory. North Carolina State University, Raleigh, N.C.
Gerber, T., F. Steinbacher, and B. Hauser. 1999. Wood fiber substrate for cultivating
Pelargonium hortum L. – biophysical examinations and plant growth. J. App. Bot.
73:217-221.
Gruda, N. and W.H. Schnitzler. 1999. Influence of wood fiber substrates and nitrogen
application rates on the growth of tomato transplants. Adv. Hort. Sci. 13:20-24.
Gumy, N. 2001. Toresa® and other wood fiber products: Advantages and drawbacks

129
when used in growing media. P. 39-46. Proc. Intl. Peat Symp., Peat in horticulture: Peat
and its alternatives in growing media.
Handreck, K.A. 1996. Phosphorus immobilization in wood waste-based potting media.
Commun. Soil Sci. Plant Anal. 27:2295-2314.
Hicklenton, P.R. 1983. Flowering, vegetative growth and mineral nutrition of pot
chrysanthemums in sawdust and peat-lite media. Scientia Hort. 21:189-197.
Hidalgo, P.R. and R.L. Harkess. 2002. Earthworm castings as a substrate for poinsettia
production. HortScience 37:304-308.
Holmes, S. 2008. Growing media developments in the UK over the last twenty years.
Acta Hort. (In press).
Jackson, B.E. and R.D. Wright. 2007. Pine tree substrate: fertility requirements. Proc.
Southern Nursery Assoc. Research Conf. 52:58-61.
Jackson, B.E., R.D. Wright, J.F. Browder, J.R. Harris, and A.X. Niemiera. 2008. Effect
of fertilizer rate on growth of azalea and holly in pine bark and pine tree substrates.
HortScience 43:1561-1568.

130
Jackson, B.E. and R.D. Wright. 2008. Pine tree substrate: An alternative and renewable
growing media for horticulture crop production. Acta Hort. (In press)
Ku, C.S.M., J.C. Bouwkamp, and F.R. Gouin. 1998. Effects of compost source and
timing of fertigation initiation on growth of potted poinsettia. Compost Sci. 6:57-66.
Lang, H.J. 1997. Growth of poinsettia in potting media amended with ground kenaf stem
core. HortScience 32:483-484.
Meinken, E. and P. Fischer. 1997. Sackungsverhalten von Holzfasern. Gärtnerbörse
9:494-496.
Nash, M.A. and F.A. Pokorny. 1990. Shrinkage of selected two-component container
media. HortScience 25:930-931.
Nelson, P.V. 2003. Greenhouse operation and management. 6th ed. Prentice Hall,
Englewood Cliffs, N.J.
Papafotiou, M., M. Phsyalou, G. Kargas, I. Chatzipavlidis, and J. Chronopoulos. 2004.
Olive-mill wastes compost as growing medium component for the production of
poinsettia. Scientia Hort. 102:167-175.
131
Prasad, M. 1980. Retention of nutrients by peats and wood wastes. Scientia Hort. 12:203-
209.
Prasad, M. and D.N. Chualain. 2005. Relationship between particle size and air space of
growing media. Acta Hort. 648:161-166.
Raviv, M. and J. H. Lieth. 2008. Soilless culture: theory and practice. Elsevier's
Publishing, San Diego, CA.
Riviere, L.M., P. Morel, J.C. Michel, and S. Charpentier. 2008. Growing media in French
horticulture. Acta Hort. 779:33-38.
Robertson, R.A. 1993. Peat, horticulture and environment. Biodivers. Conserv. 2:541-
547.
Saunders, T.N., R.D. Wright, and J.F. Browder. 2005. Chipped pine logs: a potential
substrate for nursery and greenhouse crops. Proc. Southern Nursery Assn. Res. Conf.
50:112-114.
Saunders, T., J.F. Browder, B.E. Jackson, and R.D. Wright. 2006. Particle size of a pine
chips substrate affects plant growth. Proc. Southern Nursery Assoc. Research Conf.
51:46-48.
132
Schilling, R. 1999. Toresa®. Comb. Proc. Intl. Plant Prop. Soc. 49:410-412.
Schmilewski, G. 2008. The role of peat in assuring the quality of growing media. Mires
and Peat 3:1-8.
Scott, E.G. and B.C. Bearce. 1972. A hardwood-bark-sawdust compost for greenhouse
pot flower production. Forest Prod. J. 22:36-39.
Starck, J.R. and K. Lukaszuk. 1991. Effect of fertilizer nitrogen and potassium upon yield
and quality of carnations growth in peat and sawdust. Acta Hort. 294:289-296.
Still, S., J.B. Gartner, and T.D. Hughes. 1972. Effect of sawdust age and nitrogen
application on chrysanthemums grown in white oak sawdust media. Forest Prod. J.
22:111-114.
Wang, Y.T. and T.M. Blessington. 1990. Growth and interior performance of poinsettia
in media containing composted cotton burrs. HortScience 25:407-408.
Wang, Y.T. 1994. Using ground kenaf stem core as a major component of container
media. J. Amer. Soc. Hort. Sci. 119:931-935.
Webber III, C.L., J. Whitworth, and J. Dole. 1999. Kenaf (Hibiscus cannabinus L.) core
as a containerized growth medium component. Industrial Crops Prod. 10:97-105.

133
Worrall, R.J. 1981. Comparison of composted hardwood and peat-based media for the
production of seedlings, foliage, and flowering plants. Scientia Hort. 15:311-319.
Wright, R.D. 1986. The pourthrough nutrient extraction procedure. HortScience 21:227-
229.
Wright, R.D. and J.F. Browder. 2005. Chipped pine logs: A potential substrate for
greenhouse and nursery crops. HortScience 40:1513-1515.
Wright, R.D., J.F. Browder, and B.E. Jackson. 2006. Ground pine chips as a substrate for
container-grown woody nursery crops. J. Environ. Hort. 24:181-184.
Wright, R.D., B.E. Jackson, J.F. Browder, and J.G. Latimer. 2008. Growth of
chrysanthemum in ground pine trees requires additional fertilizer. HortTechnology
18:111-115.
Yeager, T.H., D.C. Fare, J. Lea-Cox, J. Ruter, T.E. Bilderback, C.H. Gilliam, A.X.
Niemiera, S.L. Warren, T.E. Whitwell, R.D. Wright, and K.M. Tilt. 2007. 2nd Ed. Best
management practices: guide for producing container-grown plants. Southern
Nurserymen’s Assoc., Marietta, GA.

134
Table 3.1. Particle size distribution of peat-lite (PL) and pine tree substrates (PTS) produced with 2.36 and 4.76-mm hammer mill screens.z Particle size distribution (% of dry wt) PLy PTS1x PTS2x Particle size (mm) Mean SDw Mean SD Mean SD
Particle Size Rangev >2.0 23.18 1.01 0.16 0.07 0.96 0.93 Coarse 1.0-2.0 20.89 0.10 15.29 2.53 36.98 2.11 0.5-1.0 25.29 0.85 43.47 1.79 33.09 1.97 Medium 0.25-0.5 17.38 0.34 25.89 1.08 19.16 1.60 0.125-0.25 10.29 0.54 12.64 0.84 8.69 0.68 0.63-0.125 2.69 0.50 1.76 0.25 0.96 0.04 Fine <0.063 0.36 0.08 0.80 0.13 0.22 0.10 zValues are means of three air-dried substrate samples. yPL composed of 80% peat moss / 20% perlite (v/v). xPTS produced from 12-year-old loblolly pine trees harvested at ground level, delimbed, chipped, and hammer-milled to pass through 2.38-mm screen (PTS1) or 4.76-mm screen (PTS2). wStandard deviation of means. vParticle size range: coarse ≥ 2.0-mm; medium < 2.0-mm to ≥ 0.5-mm; fine < 0.5-mm.
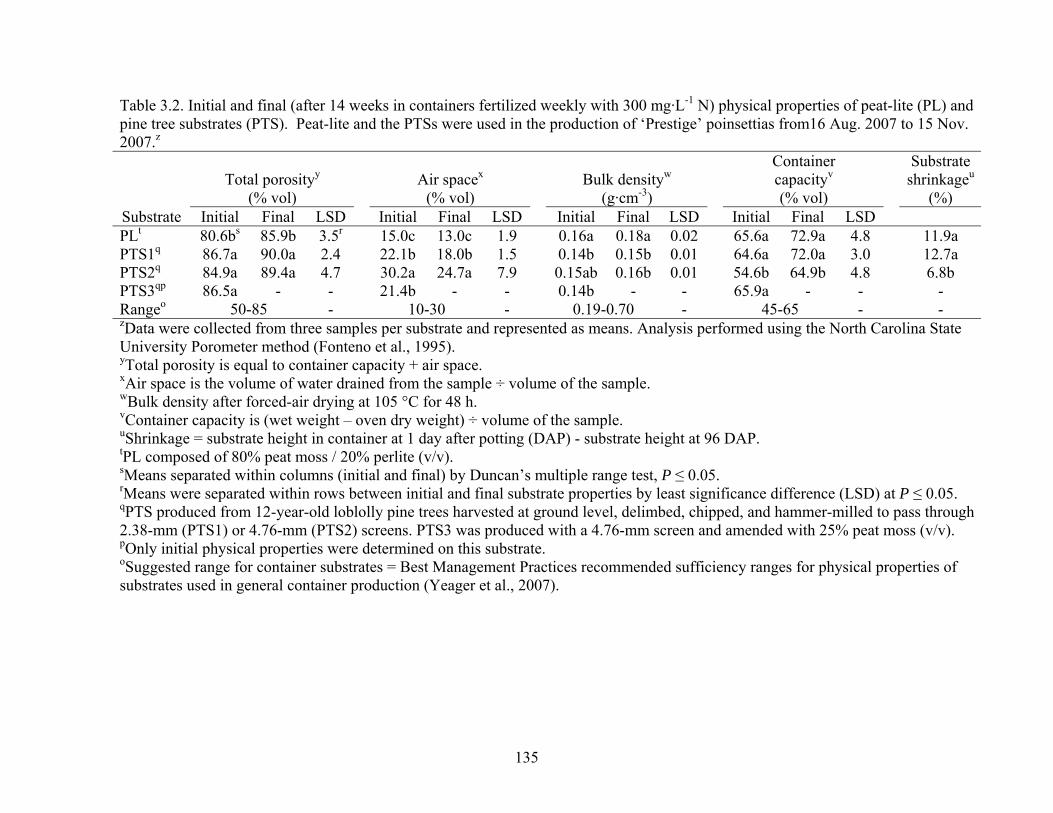
135
Table 3.2. Initial and final (after 14 weeks in containers fertilized weekly with 300 mg·L-1 N) physical properties of peat-lite (PL) and pine tree substrates (PTS). Peat-lite and the PTSs were used in the production of ‘Prestige’ poinsettias from16 Aug. 2007 to 15 Nov. 2007.z
Total porosityy
(% vol)
Air spacex
(% vol)
Bulk densityw
(g·cm-3)
Container capacityv
(% vol)
Substrate shrinkageu
(%) Substrate Initial Final LSD Initial Final LSD Initial Final LSD Initial Final LSD PLt 80.6bs 85.9b 3.5r 15.0c 13.0c 1.9 0.16a 0.18a 0.02 65.6a 72.9a 4.8 11.9a PTS1q 86.7a 90.0a 2.4 22.1b 18.0b 1.5 0.14b 0.15b 0.01 64.6a 72.0a 3.0 12.7a PTS2q 84.9a 89.4a 4.7 30.2a 24.7a 7.9 0.15ab 0.16b 0.01 54.6b 64.9b 4.8 6.8b PTS3qp 86.5a - - 21.4b - - 0.14b - - 65.9a - - - Rangeo 50-85 - 10-30 - 0.19-0.70 - 45-65 - - zData were collected from three samples per substrate and represented as means. Analysis performed using the North Carolina State University Porometer method (Fonteno et al., 1995). yTotal porosity is equal to container capacity + air space. xAir space is the volume of water drained from the sample ÷ volume of the sample. wBulk density after forced-air drying at 105 °C for 48 h. vContainer capacity is (wet weight – oven dry weight) ÷ volume of the sample. uShrinkage = substrate height in container at 1 day after potting (DAP) - substrate height at 96 DAP. tPL composed of 80% peat moss / 20% perlite (v/v). sMeans separated within columns (initial and final) by Duncan’s multiple range test, P ≤ 0.05. rMeans were separated within rows between initial and final substrate properties by least significance difference (LSD) at P ≤ 0.05. qPTS produced from 12-year-old loblolly pine trees harvested at ground level, delimbed, chipped, and hammer-milled to pass through 2.38-mm (PTS1) or 4.76-mm (PTS2) screens. PTS3 was produced with a 4.76-mm screen and amended with 25% peat moss (v/v). pOnly initial physical properties were determined on this substrate. oSuggested range for container substrates = Best Management Practices recommended sufficiency ranges for physical properties of substrates used in general container production (Yeager et al., 2007).

136
Table 3.3. Shoot dry weight (g) of ‘Prestige’ poinsettias grown from 16 Aug. 2007 to 15 Nov. 2007 (94 DAP) in either peat-lite (PL) or pine tree substrates (PTS) and fertilized with four rates of a 15N-2.2P-20.75K soluble fertilizer. Shoot dry wt (g)
Substrate Fertilizer rate (mg·L-1)z PLy PTS1x PTS2x PTS3x
100 20.6aw 15.9b 11.0c 14.1b 200 35.8a 36.6a 27.9b 32.2ab 300 48.2a 49.0a 43.3a 47.7a 400 37.3b 42.1ab 40.0b 49.1a Significancev L***
Q*** L*** Q***
L*** Q***
L*** Q***
P-vales:u Substrate (S) = 0.0065; Fertilizer (F) = ≤0.0001; S*F = 0.0453 z1mg·L-1 = 1 ppm. yPL composed of 80% peat moss / 20% perlite (v/v). xPTS produced from 12-year-old loblolly pine trees harvested at ground level, delimbed, chipped, and hammer-milled to pass through 2.38-mm (PTS1) or 4.76-mm (PTS2) screens. PTS3 was produced with a 4.76-mm screen and amended with 25% peat moss (v/v). wMeans separated within row by Duncan’s multiple range test, P ≤ 0.05. vL = linear; Q = quadratic response for concentration at *, **, or ***
uNonsignificant (NS) or significant at P ≤ 0.05 (*), 0.01 (**), or 0.001 (***).

137
Table 3.4. Growth indexz of ‘Prestige’ poinsettias at 42 days after planting (DAP) and 94 DAP grown in either peat-lite (PL) or pine tree substrates (PTS) and fertilized with four rates of a 15N-2.2P-20.75K soluble fertilizer. Growth index
Substrate Fertilizer rate (mg·L-1)w PLy PTS1x PTS2x PTS3x
42 DAP 100 28.5av 22.2b 17.7c 20.2b 200 27.9ab 28.4a 25.8b 27.4ab 300 29.3a 29.6a 28.9a 29.7a 400 26.3b 27.4ab 27.0ab 30.1a Significanceu LNS
QNS L**
Q*** L*** Q***
L*** Q***
P-vales:t Substrate (S) = 0.0432; Fertilizer (F) = <0.0001; S*F = 0.0022 Fertilizer rate
(mg·L-1) 94 DAP 100 41.2a 37.8b 33.5c 31.1c 200 49.0a 46.1b 44.0b 40.4c 300 50.7a 49.7a 48.0a 45.0b 400 46.8a 45.8a 47.2a 46.0a Significance L*
Q*** L*** Q***
L*** Q***
L*** Q***
P-vales: Substrate (S) = ≤0.0001 ; Fertilizer (F) = ≤0.0001; S*F = 0.0006 zGrowth index [(height + widest width + perpendicular width)÷3]. yPL composed of 80% peat moss / 20% perlite (v/v). xPTS produced from 12-year-old loblolly pine trees harvested at ground level, delimbed, chipped, and hammer-milled to pass through 2.38-mm (PTS1) or 4.76-mm (PTS2) screens. PTS3 was produced with a 4.76-mm screen and amended with 25% peat moss (v/v). w1 mg·L-1 = 1 ppm. vMeans separated within row by Duncan’s multiple range test, P ≤ 0.05. uL = linear; Q = quadratic response for concentration at *, **, or ***
tNonsignificant (NS) or significant at P ≤ 0.05 (*), 0.01 (**), or 0.001 (***).

138
Table 3.5. Bract length (cm) of ‘Prestige’ poinsettias grown from 16 Aug. 2007 to 15 Nov. 2007 (94 DAP) in either peat-lite (PL) or pine tree substrates (PTS) and fertilized with four rates of a 15N-2.2P-20.75K soluble fertilizer. Bract length (cm)
Substrate Fertilizer rate (mg·L-1)x PLz PTS1y PTS2y PTS3y
100 12.1aw 12.1a 11.1b 12.6a 200 13.7b 13.4b 13.3b 15.0a 300 14.9b 15.5a 14.3c 15.9a 400 14.0b 15.3a 13.9b 15.2a Significancev L***
Q*** L*** Q***
L*** Q***
L*** Q***
P-vales:u Substrate (S) = ≤0.0001; Fertilizer (F) = ≤0.0001; S*F = 0.0016 zPL composed of 80% peat moss / 20% perlite (v/v). yPTS produced from 12-year-old loblolly pine trees harvested at ground level, delimbed, chipped, and hammer-milled to pass through 2.38-mm (PTS1) or 4.76-mm (PTS2) screens. PTS3 was produced with a 4.76-mm screen and amended with 25% peat moss (v/v). x1 mg·L-1 = 1 ppm. wMeans separated within row by Duncan’s multiple range test, P ≤ 0.05. vL = linear; Q = quadratic response for concentration at *, **, or ***
uNonsignificant (NS) or significant at P ≤ 0.05 (*), 0.01 (**), or 0.001 (***).
Table 3.6. Post production days required for two stages of wilting of poinsettias grown in peat-lite (PL) and three pine tree substrates (PTS) at a 300 mg·L-1 N fertilizer rate.z Day to wilting Substrate Wilting stage PLy PTS1x PTS2x PTS3x
Stage Iv 7.9aw 7.9a 5.6b 8.5a Stage IIu 11.0a 10.5a 8.4b 10.8a zPlants were stored in an indoor environment (temperature of 26 °C, respectively). Data collected on 6 plants in each substrate. yPL composed of 80% peat moss / 20% perlite (v/v). xPTS produced from 12-year-old loblolly pine trees harvested at ground level, delimbed, chipped, and hammer-milled to pass through 2.38-mm (PTS1) or 4.76-mm (PTS2) screens. PTS3 was produced with a 4.76-mm screen and amended with 25% peat moss (v/v). wMeans separated within row by Duncan’s multiple range test, P ≤ 0.05. vStage I was recoded when wilting first began (leaf droop). uStage II was recorded when all leaves were completely wilted against the stem.
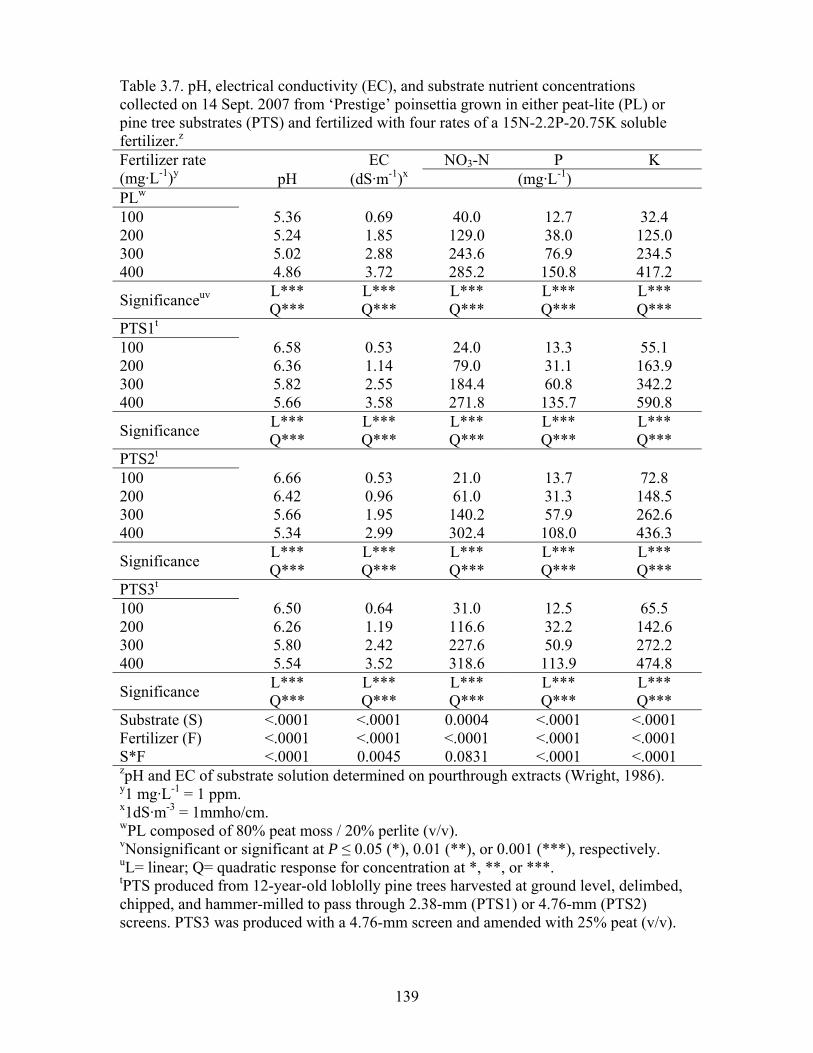
139
Table 3.7. pH, electrical conductivity (EC), and substrate nutrient concentrations collected on 14 Sept. 2007 from ‘Prestige’ poinsettia grown in either peat-lite (PL) or pine tree substrates (PTS) and fertilized with four rates of a 15N-2.2P-20.75K soluble fertilizer.z
EC NO3-N P K Fertilizer rate (mg·L-1)y pH (dS·m-1)x (mg·L-1) PLw 100 5.36 0.69 40.0 12.7 32.4 200 5.24 1.85 129.0 38.0 125.0 300 5.02 2.88 243.6 76.9 234.5 400 4.86 3.72 285.2 150.8 417.2
Significanceuv L*** Q***
L*** Q***
L*** Q***
L*** Q***
L*** Q***
PTS1t 100 6.58 0.53 24.0 13.3 55.1 200 6.36 1.14 79.0 31.1 163.9 300 5.82 2.55 184.4 60.8 342.2 400 5.66 3.58 271.8 135.7 590.8
Significance L*** Q***
L*** Q***
L*** Q***
L*** Q***
L*** Q***
PTS2t 100 6.66 0.53 21.0 13.7 72.8 200 6.42 0.96 61.0 31.3 148.5 300 5.66 1.95 140.2 57.9 262.6 400 5.34 2.99 302.4 108.0 436.3
Significance L*** Q***
L*** Q***
L*** Q***
L*** Q***
L*** Q***
PTS3t 100 6.50 0.64 31.0 12.5 65.5 200 6.26 1.19 116.6 32.2 142.6 300 5.80 2.42 227.6 50.9 272.2 400 5.54 3.52 318.6 113.9 474.8
Significance L*** Q***
L*** Q***
L*** Q***
L*** Q***
L*** Q***
Substrate (S) <.0001 <.0001 0.0004 <.0001 <.0001 Fertilizer (F) <.0001 <.0001 <.0001 <.0001 <.0001 S*F <.0001 0.0045 0.0831 <.0001 <.0001 zpH and EC of substrate solution determined on pourthrough extracts (Wright, 1986). y1 mg·L-1 = 1 ppm. x1dS·m-3 = 1mmho/cm. wPL composed of 80% peat moss / 20% perlite (v/v). vNonsignificant or significant at P ≤ 0.05 (*), 0.01 (**), or 0.001 (***), respectively. uL= linear; Q= quadratic response for concentration at *, **, or ***. tPTS produced from 12-year-old loblolly pine trees harvested at ground level, delimbed, chipped, and hammer-milled to pass through 2.38-mm (PTS1) or 4.76-mm (PTS2) screens. PTS3 was produced with a 4.76-mm screen and amended with 25% peat (v/v).

140
CHAPTER IV
Comparison of Fertilizer Nitrogen Availability, Immobilization, and
Leaching in Pine Tree Substrate, Peat-Lite, and Pine Bark Abstract: The objective of this study was to compare nitrogen (N) immobilization and
nutrient leaching rates in peat-lite (PL), aged pine bark (PB), and a pine tree substrate
(PTS) over time under greenhouse conditions. Pine tree substrate was produced from
loblolly pine logs (Pinus taeda L.) that were chipped, and hammer-milled to a desired
particle size. Substrates used in this study were PL, PB, and PTS ground through a 2.38-
mm hammer-mill screen. A short-term (28 days) N immobilization study was conducted
on substrates fertilized with 150 or 300 mg·L-1 NO3-N. Substrates were incubated for
four days after fertilizing and NO3-N levels were determined initially and at the end of
the incubation. A second medium-term study (10 week) was also conducted to evaluate
the amount of N immobilized in each substrate when fertilized with 100, 200, 300, or 400
mg·L-1 N. In addition to determining the amounts of N immobilized, substrate CO2
efflux (μmol CO2.m-2·s-1) was also measured as an assessment of microbial activity,
which can be an indication of N immobilization. A leaching study on all three substrates
was also conducted to determine the amount of N, phosphorus (P), and potassium (K)
leached over 14 weeks under greenhouse conditions. Nitrogen immobilization was
highest in PTS, followed by PB and PL. Nitrogen immobilization increased as fertilizer
rate increased to 200 mg·L-1 N in PL and 300 mg·L-1 N for PB and PTS, followed by a
reduction or no further increase in immobilization when fertilizer rates increased beyond
these rates. Nitrogen immobilization was generally highest in all substrates two weeks
after potting, after which immobilization tended to decrease over the course of several

141
weeks, with less of a decrease for PTS compared to PL and PB. Substrate CO2 efflux
levels were highest in PTS followed by PB and PL at each measurement in both the
short- and medium-term studies. Patterns of substrate CO2 efflux levels (estimate of
microbial populations) between substrates, at both fertilizer rates, and over time were
somewhat mirrored by N immobilization during the studies. Nitrate leaching was lower
in PTS than in PB or PL through 14 weeks, P leaching was generally similar across all
substrates with a few minor exceptions, and more K leached from PTS and PB than from
PL through 12 weeks, after which no differences in K leaching occurred.
Introduction
In recent years several peat and bark alternative substrates have been developed
and researched in the United States and throughout the world. The interest in new
substrates is in response to the increasing cost and environmental issues surrounding the
use of peat moss and the cost and availability of pine bark (PB) substrates. Many of the
substrates investigated are wood-based or plant debris-based materials that have been
processed for use as a container substrate and include Chinese tung tree (Aleurites fordi
Hemsl.; Gruszynski and Kämpf, 2004), paper bark tree (Melaleuca quinquenervia Cav.;
Poole and Conover, 1985), forest gorse (Ulex europaeus L.; Iglesias et al., 2008), tree
fern (Dicksonia squarosa Swartz.; Prasad and Fietje, 1989), and miscanthus (Miscanthus
sinensis Anderss.; Carthaigh et al., 1997) to name a few. Evaluation of these and other
wood/plant-based substrates has proven successful in the production of vegetables
(Pudelski and Pirog, 1984; Schnitzler et al., 2004), foliage plants (Roeber and Leinfelder,
1997), bedding plants (Boyer et al., 2008; Wright and Browder, 2005; Wright et al.,
2008b), poinsettias and mums (Jackson et al., 2008b; Wright et al., 2008a), and woody

142
shrubs and trees (Jackson et al., 2008a; Wright et al., 2006). Much attention is now
focused on pine tree substrates (PTS) that are produced by grinding loblolly pine trees to
a size acceptable for use a container substrate (Boyer, 2008; Fain et al, 2008a; Jackson et
al., 2007; Wright and Browder, 2005).
In contrast to peat and composted PB, plant production in substrates composed of
wood, or large portions of wood, have a tendency to become nitrogen (N) deficient as a
result of high rates of N immobilization (Handreck, 1991; Handreck, 1993b; McKenzie,
1958). Wood contains large amounts of useable/degradable carbon (C) compounds, but
only a small amount of nutrients to offer for decomposing microorganisms, resulting in a
draw upon nutrient sources (primarily N) from the surrounding environment (Gumy,
2001). The N extraction from the soil/substrate solution by microorganisms lowers
available nutrient supplies to plants, which in turn leads to plant nutrient deficiencies if
additional N is not added to correct the problem (Bodman and Sharman, 1993; Handreck,
1993b). Successfully producing crops in wood substrates will require new strategies in N
management so that the collective amounts of N required by microorganisms and the by
plants will be supplied in sufficient quantities (Lunt and Clark, 1959; Worrall, 1985).
Several methods and cultural strategies have been developed and utilized to
reduce N immobilization in wood substrates and improve fertilizer management
strategies during crop production: 1) Composting wood materials has been shown to
eliminate or significantly reduce the potential for N immobilization to occur during crop
production by lowering the C:N ratio and allowing the initial breakdown which requires
high levels of N by microorganisms (Gutser et al., 1983; Prasad, 1997); 2) A nutrient
impregnation process used in the production of Toresa®, a commercial wood fibre
substrate in Europe, mechanically grinds wood chips together with an accurately

143
specified quantity of nutrient compounds in machines called retruders [Gumy, 2001;
personal observation (Brian Jackson and Robert Wright) at an Intertoresa AG
manufacturing facility in Hamburg, Germany, March 13, 2007). The nutrients are forced
into the wood fibers by high mechanical pressure and heat generated during the
production of Toresa® (Schilling, 1999). Gruda et al. (2000) concluded that N
impregnation in wood fiber substrates was sufficient to provide enough N for the initial
microbial immobilization occurring during the first days of crop production; 3) A
technique call the Fersolin process impregnates wood material with sulfuric acid in the
presence of hot gases (933 °C) resulting in a decrease in decomposable cellulose which
results in lower microbial activity and need for N (Bollen and Glennie, 1961); and 4) A
process for treating wood materials by pyrolysis (a form of incineration that chemically
decomposes organic materials by heat in the absence of oxygen) has been evaluated as a
method to breakdown unstable and toxic wood components into more stable and non-
toxic components that are resistant to microbial decay which retards microbial N demand
(Bollen and Glennie, 1961). The methods described above (1-4) are often expensive, time
consuming, and non-practical for many substrate companies and growers. As a more
practical approach, a common method for supplying nutrients to counter-act microbial N
immobilization from a substrate is by the application of additional fertilizer during crop
production. This is the most commonly used and preferred method of countering the
effects of N immobilization on plant growth (Gruda et al., 2000; Gruda, 2005; Wright et
al., 2008a).
The most frequently used and accepted method for determining N immobilization
in soilless substrates is the nitrogen drawdown index (NDI) procedure developed by
Handreck (1992a, 1992b). The NDI procedure involves saturating or “charging” a

144
substrate with a KNO3 fertilizer solution containing 75 mg·L-1 N and then incubating the
substrate at 22 ˚C for 4 days. Substrate solution nitrate (NO3-N) levels are determined
immediately following saturation on day 0 and then again after day 4 (the incubation
period). Nitrogen drawdown index is then calculated by the following formula (NO3-N
measured on day 4 / NO3-N measured on day 0 x 100). The resulting index is a value
between 1.0 and 0.0 with a value of 1.0 representing no N loss during the 4 day
incubation and an index value of 0.0 indicating complete N loss after 4 days. Substrates
composed of large amounts of wood materials (high C:N ratio) will immobilize all, or
nearly all, of the N during the 4 day incubation when using 75 mg·L-1 N, making it
impossible to determine maximum amount used by microorganisms. Handreck (1992b)
has recommended that the N concentration in the saturating solution be 150 mg L-1 N
when substrates with a high demand for N are being tested, or that the incubation time be
decreased to obtain measurable amounts of N remaining in the substrate after incubation.
Similarly, Sharman and Whitehouse (1993) suggest that saturating solutions with
concentrations of 150, 200, or 300 mg L-1 N be used in N immobilization tests on
materials with high C:N ratios, such as PTS.
Nitrogen immobilization in soils and organic materials results from microbial
assimilation of ammonium nitrogen (NH4-N) and NO3-N into proteins, nucleic acids and
other organic complexes contained within microbial cells (Davet, 2004). Carbon dioxide
(CO2) release represents the final stage of oxidation of organic substrates and is the older
and still more commonly used method for estimation of microbial biomass (Wang et al.,
2003). Since root respiration is also a source of CO2 in the soil, it is important to take
into account the sources of CO2 evolution. Soil CO2 efflux is influenced by a number of
factors, including soil/substrate quality and organic matter content, temperature, soil

145
moisture, root biomass, and microbial activity and biomass (Davet, 2004; Fog, 1988;
Wang et al., 2003).
The estimation of microbial populations in soils or soilless substrates may be
accomplished by several methods, for example by counting the population (by either
microscopy or plating on agar), chloroform fumigation procedure for biomass
determination, or by assaying some unique component of biomass such as ATP,
extracellular dehydrogenase, or by measuring the metabolic activity of the population
(Carlile and Dickinson, 2004; Needelman et al., 2001; Turner and Carlile, 1983; Vance et
al., 1987). Measuring the metabolic activity of a microbial population (respiratory
activity) involves monitoring CO2 evolution or O2 consumption. Techniques for
monitoring CO2 evolution from soil were pioneered by Waksman (1932) and are still
widely used in studies of microbial activity in soils and soilless substrates (Gough and
Seiler, 2004; Jackson et al., 2008a; Pronk, 1997; Söderstrom et al., 1983; Turner and
Carlile, 1983). Microbial activity (estimated by CO2 efflux from soils) increases in
response to N fertilization in N limiting soils (Zhang and Zak, 1988) and to P fertilization
in P limiting soils (Gallardo and Schlesinger, 1994). Microbial activity has also been
reported to decrease in response to high rates of N fertilization of forest soils (Smolander
et al., 1994; Thirukkumaran and Parkinson, 2000). Less work has been completed on
soilless substrates compared to field or forest soils using CO2 efflux to monitor/estimate
microbial activity.
In addition to N immobilization, nutrient leaching in PTS has been proposed as a
possible reason for the lower EC and nutrient levels observed in PTS compared to PL or
PB during plant production (Wright and Browder, 2005; Wright et al., 2008a). Nutrient
leaching from horticulture crop production areas is a major concern for growers and
146
environmental agencies, particularly NO3-N and ortho-phosphate anions. Nitrate levels
>10 ppm in drinking water are considered unsafe for humans (Environmental Protection
Agency, 2006), and elevated P levels from container leaching/runoff are often associated
with increasing algal blooms and eutrophication of lakes and ponds (Hart et al., 2004).
Even though P is considered rather immobile in many soils, it is more readily leached
from soilless container media (Broschat, 1995; Yeager and Wright, 1982). Nitrate is
readily leached from both mineral soils and soilless container substrates (Bugbee and
Elliott, 1998). Limited information is available on nutrient leaching from wood
substrates, and no information is available on nutrient leaching in PTS during crop
production. This is an important issue in light of the higher fertilizer requirements
reported for PTS (Jackson et al, 2008a; Jackson and Wright, 2008; Wright et al, 2008a)
which increases the potential for nutrient leaching.
Most nursery and greenhouse producers base their fertility management on
previous growing experiences with PL and PB substrates. These fertility practices may
not be applicable when growing crops in PTS in light of the higher fertilizer
requirements, limited understanding of N immobilization timing and rate, and its
unknown leaching potential. Determining the extent and timing of N immobilization and
nutrient leaching in PTS therefore needs to be determined for more accurate nutrient
management (application timing and rates) strategies when producing plants in this
substrate. The objective of these studies was to compare N immobilization, substrate
CO2 efflux, and nutrient leaching rates in PL, PB, and PTS over time under greenhouse
conditions.
Materials and Methods

147
Short-term (4 week) N immobilization. Pine tree substrate used in this study was
produced from loblolly pine trees (approximately 25-cm basal diameter) that were
harvested at ground level and delimbed on 25 April 2006 in Warsaw VA. Trees were then
chipped (including bark) with a Morbark Chipper (Winn, MI) operated by Wood
Preservers Inc., (Warsaw, VA) on 26 April 2006. Wood chips (2.5-cm x 2.5-cm x 0.5-
cm) were further ground in a hammer-mill (Meadows Mills, Inc., North Wilkesboro, NC)
on 27 April 2006 to pass through a 2.38-mm screen. Pine tree substrate was used fresh
(uncomposted) and amended with 0.6 kg·m-3 calcium sulfate (CaSO4) as Saunders et al.
(2005) reported improved growth of herbaceous species when CaSO4 was incorporated.
Samples of PTS were tested for pH prior to potting and not amended with lime due to the
relatively high pH (~6.0) observed which has been previously reported in freshly ground
pine wood (Wright et al., 2008a). Other substrates used in this study were an aged PB
and a mix composed of 80% peat (Premier Tech, Quebec, Canada) and 20% perlite (v/v;
peat-lite – PL). Pine bark and PL were pre-plant amended with dolomitic lime at a rate of
3.6 kg·m-3 and CaSO4 at the rate of 0.6 kg·m-3. Substrates were prepared on 1 May 2006
and moistened to 50% moisture content (typical potting moisture content) to facilitate
lime reactions (in the peat and PB) and provide adequate moisture for microbial activity
in all substrates. Substrates were stored in closed containers for eight days (following
wetting) prior to the initiation of the experiment as suggested by Handreck (1992a).
On 8 May 2006 12-cm-tall x 15-cm-square (1.7-L) plastic containers were filled
with the three substrates and placed on raised benches in the Virginia Tech (Blacksburg,
VA) Greenhouse Facility (glass-covered) with average day and night temperatures of 24
oC and 19 oC, respectively. Containers were irrigated with 500-mL of nutrient solution
(beaker-applied) at the rates of 0, 150, or 300 mg·L-1 N as potassium nitrate (KNO3;

148
Handreck, 1992a) which consequently supplied 420 mg·L-1 K at the 150 mg·L-1 N rate
and 840 mg·L-1 K at the 300 mg·L-1 N rate. Phosphorus was also supplied at 45 mg·L-1 P
as phosphoric acid (H3PO4) in light of published studies reporting the requirement (and
immobilization) of P by microbial populations in soils and wood substrates (Gallardo and
Schlesinger, 1994; Handreck, 1996). The 0 mg·L-1 N rate was added as a control to
observe the effect of fertilizer on substrate CO2 efflux compared to a non-fertilized
treatment. Fertilizer treatments were applied to substrates on day 0 (day of potting) and
every seven days thereafter for 28 days for a total of five applications. Following
fertilizer applications (every seven days), three replications of each treatment were
removed from the greenhouse and analyzed for N immobilization using the NDI
incubation and extraction procedure as described above. Substrate solutions extracted
before and after incubation at each sampling date were frozen and later analyzed for NO3-
N with an Orion ion selective electrode (Thermo Electron, Beverly, MA) on 17 Aug
2006. Substrate solution N levels were determined on day 0 (initial) and on day 4 (final)
and the amount of N immobilized was calculated by determining the difference between
day 4 and day 0. Total N loss (mg N per L of substrate) was then calculated for the total
4 day incubation. Nitrogen immobilization data from the 0 mg·L-1 N rate in all substrates
was excluded from data analysis as a result of no N immobilization occurring at that rate.
Between fertilizer/irrigation applications, containers were kept uncovered on open
greenhouse benches and substrate moisture was determined by weighing representative
containers of each substrate and applying tap water to readjust substrate moisture to 70%
of their water holding capacities (determined prior to the initiation of this experiment).
Substrate CO2 efflux levels were determined on all substrates and at all fertilizer
rates as an estimate of microbial activity and potential N immobilization (Wang et al.,
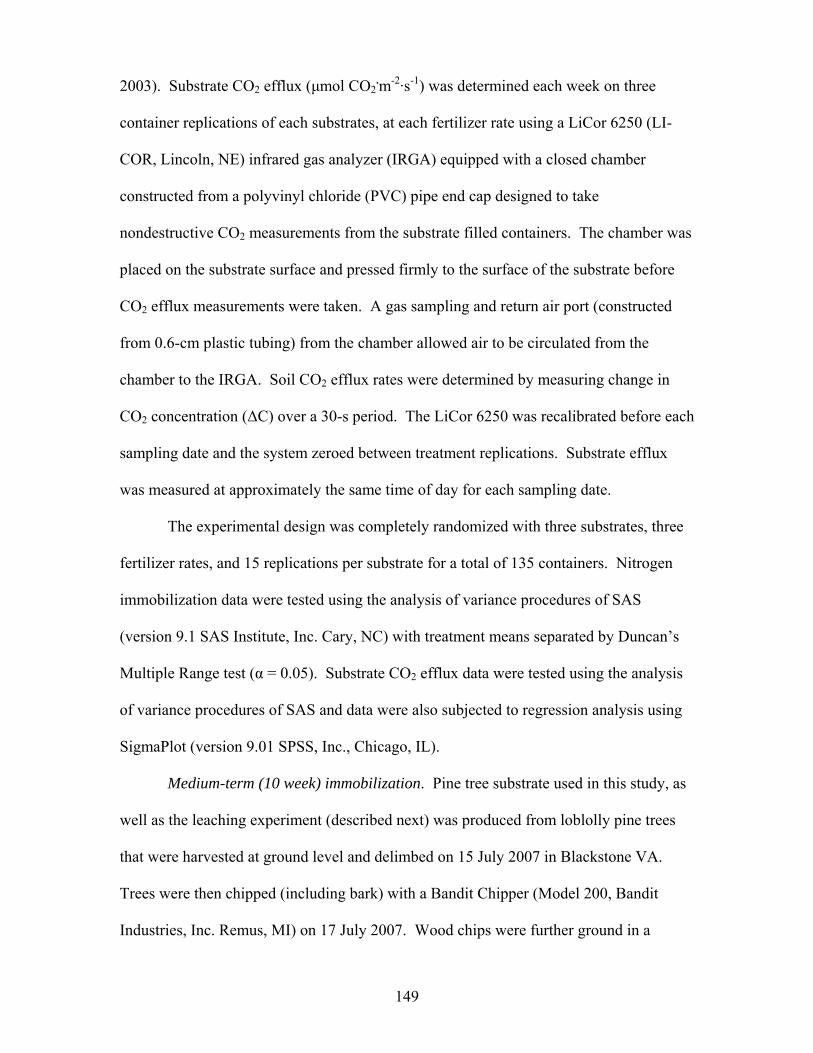
149
2003). Substrate CO2 efflux (μmol CO2.m-2·s-1) was determined each week on three
container replications of each substrates, at each fertilizer rate using a LiCor 6250 (LI-
COR, Lincoln, NE) infrared gas analyzer (IRGA) equipped with a closed chamber
constructed from a polyvinyl chloride (PVC) pipe end cap designed to take
nondestructive CO2 measurements from the substrate filled containers. The chamber was
placed on the substrate surface and pressed firmly to the surface of the substrate before
CO2 efflux measurements were taken. A gas sampling and return air port (constructed
from 0.6-cm plastic tubing) from the chamber allowed air to be circulated from the
chamber to the IRGA. Soil CO2 efflux rates were determined by measuring change in
CO2 concentration (ΔC) over a 30-s period. The LiCor 6250 was recalibrated before each
sampling date and the system zeroed between treatment replications. Substrate efflux
was measured at approximately the same time of day for each sampling date.
The experimental design was completely randomized with three substrates, three
fertilizer rates, and 15 replications per substrate for a total of 135 containers. Nitrogen
immobilization data were tested using the analysis of variance procedures of SAS
(version 9.1 SAS Institute, Inc. Cary, NC) with treatment means separated by Duncan’s
Multiple Range test (α = 0.05). Substrate CO2 efflux data were tested using the analysis
of variance procedures of SAS and data were also subjected to regression analysis using
SigmaPlot (version 9.01 SPSS, Inc., Chicago, IL).
Medium-term (10 week) immobilization. Pine tree substrate used in this study, as
well as the leaching experiment (described next) was produced from loblolly pine trees
that were harvested at ground level and delimbed on 15 July 2007 in Blackstone VA.
Trees were then chipped (including bark) with a Bandit Chipper (Model 200, Bandit
Industries, Inc. Remus, MI) on 17 July 2007. Wood chips were further ground in a

150
hammer-mill on 18 July 2007 to pass through a 2.38-mm screen. Other substrates used in
this study included aged PB and PL. All substrates were amended similarly as described
in the short-term experiment above.
On 21 Aug 2007 12-cm-tall x 15-cm-square (1.7-L) plastic containers were filled
with the three substrates and placed on raised benches in the Virginia Tech (Blacksburg,
VA) Greenhouse Facility (glass-covered) with average day and night temperatures of 24
oC and 19 oC, respectively. Fertilizer solutions were beaker-applied (500-mL) every two
weeks (14 d) to the substrates at the rates of 100, 200, 300, or 400 mg·L-1 N as KNO3
which consequently supplied 280 mg·L-1 K for each 100 mg·L-1 N rate increase.
Phosphorus was also supplied at 45 mg·L-1 as H3PO4. After fertilizer application and
drainage for 1 h, three single container replications of each treatment were removed from
the greenhouse and analyzed for N immobilization using the NDI incubation and
extraction procedure (as described in the short-term experiment) on week 0 (day of
potting) and again every 14 days for 10 weeks for a total of six sampling dates. Substrate
solutions extracted before and after incubation at each sampling date were frozen and
later analyzed for NO3-N with an Orion ion selective electrode on 22 Jan 2008. Nitrogen
immobilization data were calculated in this study as described above in the short-term
experiment. Between fertilizer/irrigation applications, containers were kept uncovered on
open greenhouse benches and substrate moisture was maintained at 70% in all substrates
as described above in the short-term experiment. Substrate CO2 efflux was determined
every two weeks (alternate weeks of fertilizer applications) on three container
replications of each substrates, at each fertilizer rate using a LiCor 6250 as previously
described above.

151
The experimental design was completely randomized with three substrates, four
fertilizer rates and 24 replications per substrate for a total of 288 containers. Data were
tested using the analysis of variance procedures of SAS (version 9.1 SAS Institute, Inc.
Cary, NC). Data were also subjected to regression analysis using SigmaPlot (version
9.01 SPSS, Inc., Chicago, IL).
Nutrient leaching. Pine tree substrate, PL, and PB used in this experiment were
prepared as described above in the medium-term experiment and amended similarly. On
21 Aug 2007 12-cm-tall x 15-cm-square (1.7-L) plastic containers were filled (by vol)
with the three substrates. Fertilizer solutions were beaker-applied (500-mL) every two
weeks (14 d) to the substrates at the rates of 100 or 300 mg·L-1 N prepared from KNO3
which consequently supplied 280 mg·L-1 K at the 100 mg·L-1 N rate and 560 mg·L-1 K at
the 300 mg·L-1 N rate. Phosphorus was supplied at 45 mg·L-1P as H3PO4. Fertilizer
applications were made to all substrates every other week through the conclusion of the
study (14 weeks).
Leaching of NO3-N, P, and K was monitored on six replicates of each treatment.
Leachate collection devices were made by cutting 15-cm circular holes in the lids of 4.5-
L plastic buckets. Lids were then securely fitted on buckets and fallow substrate filled
containers were inserted halfway through the lids into the buckets. Buckets (with
containers inserted) were then and placed on raised benches in the Virginia Tech
(Blacksburg, VA) Greenhouse Facility (glass-covered) with average day and night
temperatures of 24 oC and 19 oC, respectively. This system allowed only the leachate
passing through the fallow containers to be collected after irrigations. After applying
fertilizer solutions, containers were allowed to completely drain (1 h) before containers
were removed from buckets for leachate collection. Leachate volume was determined
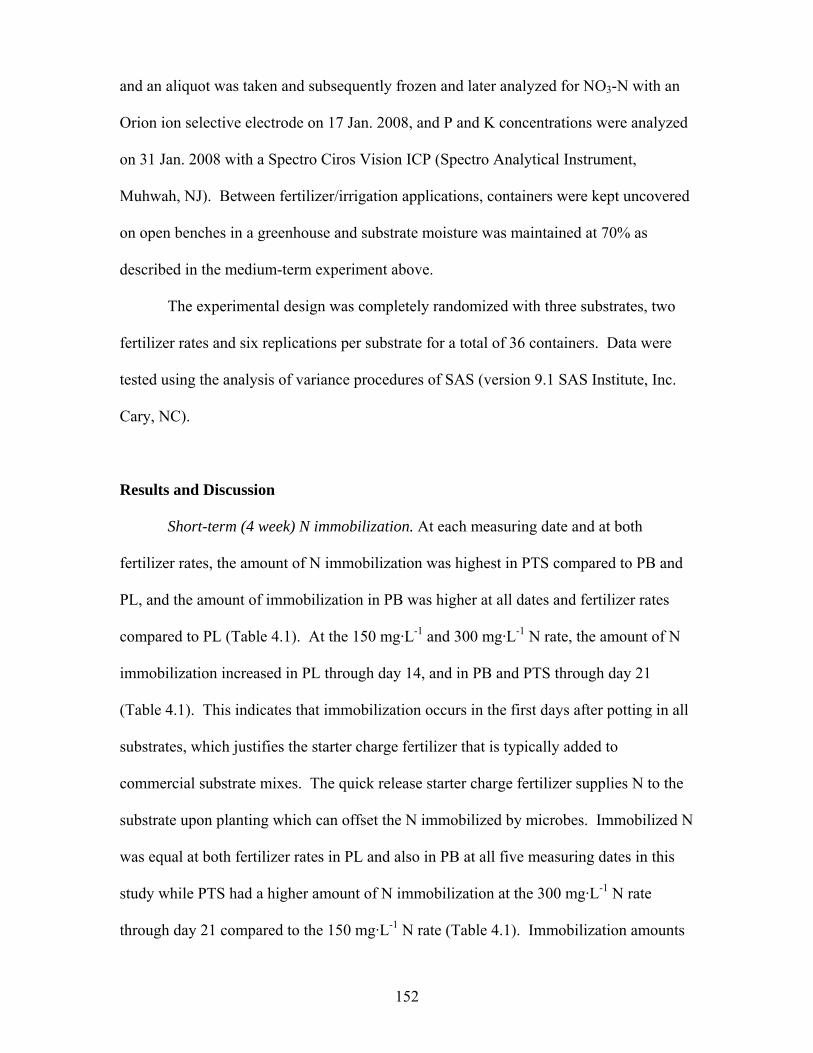
152
and an aliquot was taken and subsequently frozen and later analyzed for NO3-N with an
Orion ion selective electrode on 17 Jan. 2008, and P and K concentrations were analyzed
on 31 Jan. 2008 with a Spectro Ciros Vision ICP (Spectro Analytical Instrument,
Muhwah, NJ). Between fertilizer/irrigation applications, containers were kept uncovered
on open benches in a greenhouse and substrate moisture was maintained at 70% as
described in the medium-term experiment above.
The experimental design was completely randomized with three substrates, two
fertilizer rates and six replications per substrate for a total of 36 containers. Data were
tested using the analysis of variance procedures of SAS (version 9.1 SAS Institute, Inc.
Cary, NC).
Results and Discussion
Short-term (4 week) N immobilization. At each measuring date and at both
fertilizer rates, the amount of N immobilization was highest in PTS compared to PB and
PL, and the amount of immobilization in PB was higher at all dates and fertilizer rates
compared to PL (Table 4.1). At the 150 mg·L-1 and 300 mg·L-1 N rate, the amount of N
immobilization increased in PL through day 14, and in PB and PTS through day 21
(Table 4.1). This indicates that immobilization occurs in the first days after potting in all
substrates, which justifies the starter charge fertilizer that is typically added to
commercial substrate mixes. The quick release starter charge fertilizer supplies N to the
substrate upon planting which can offset the N immobilized by microbes. Immobilized N
was equal at both fertilizer rates in PL and also in PB at all five measuring dates in this
study while PTS had a higher amount of N immobilization at the 300 mg·L-1 N rate
through day 21 compared to the 150 mg·L-1 N rate (Table 4.1). Immobilization amounts

153
were higher at day 28 (end of experiment) at both fertilizer rates and in all substrates
compared to day 0 indicating continued N immobilization over the course of 28 days
during plant production (Table 4.1).
Substrate solution NO3-N levels in response to N immobilization were lower in
PB and PTS compared to PL after incubation for 4 days at both fertilizer rates at days 0
and 7, with levels in PTS being the lowest of all the substrates (Table 4.2). The levels of
NO3-N recovered in PTS at the low fertilizer rate were very low at the first two
measurements (<1.0 mg·L-1 N), but increased by the last measurement date (9.3 mg·L-1
N; Table 4.2). Through days 14, 21, and 28 the NO3-N levels after incubation in PTS
remain lower at both fertilizer rates than PB and PL (Table 4.2). The lower substrate
solution NO3-N levels in PTS (resulting from more N immobilization) compared to PB
have also been reported even when plant growth was similar (Jackson et al., 2008a) and
in PL (Jackson et al., 2008b; Wright et al., 2008a). The reason for higher initial (day 0)
substrate solution N levels at all measuring dates in PB and PL compared to PTS at the
300 mg·L-1 N rate can be explained by the already existing N in the substrates from
previous fertilizer applications that remained in the substrate as a result of the lower
amount of N immobilization occurring in those substrates each week (Table 4.1).
Short-term fast growing crops (e.g. bedding plants) grown in PL or PB are
commonly fertilized at rates between 100 and 200 mg·L-1 N which is unacceptable for
plants growing in PTS (Jackson and Wright, 2008). Based on the increased N
immobilization in PTS compared to PB and PL at both fertilizer rates (Table 4.1) and as a
result the higher NO3-N levels remaining in substrate solution in PB and PL after four
days compared to PTS (Table 4.2), it is clear why decreased plant growth is usually
observed in PTS at relatively low (100-200 mg·L-1 N) fertilizer rates. Similar to these
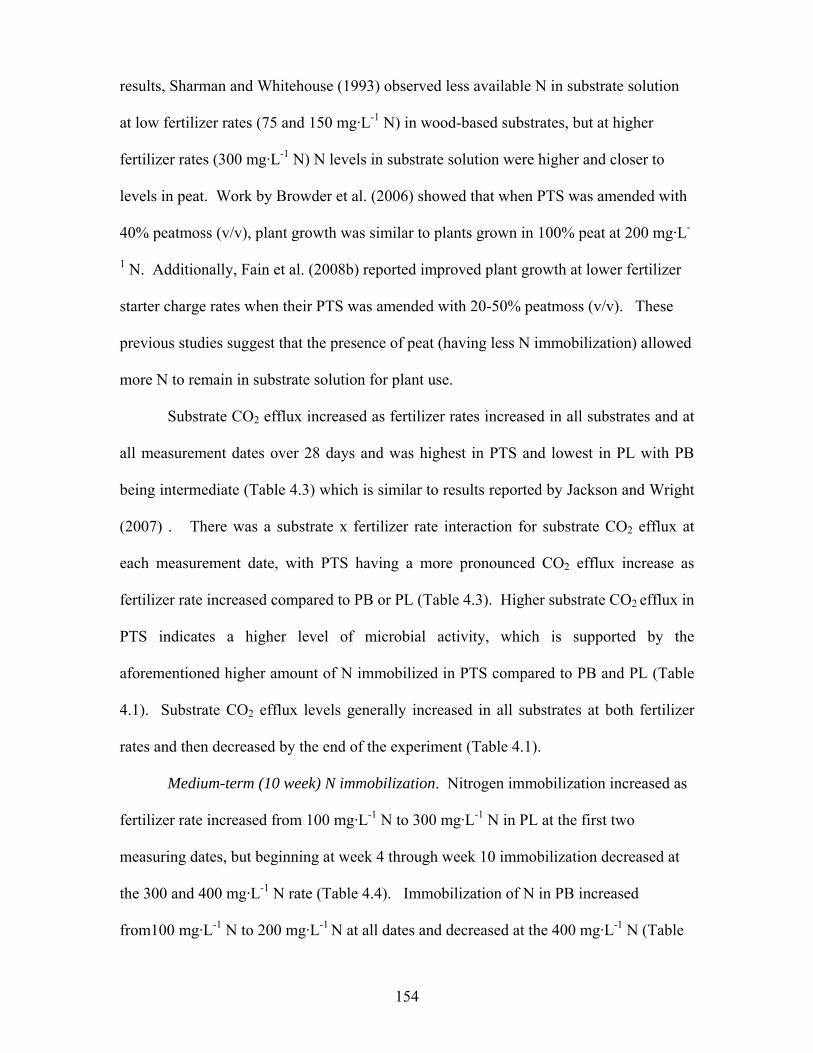
154
results, Sharman and Whitehouse (1993) observed less available N in substrate solution
at low fertilizer rates (75 and 150 mg·L-1 N) in wood-based substrates, but at higher
fertilizer rates (300 mg·L-1 N) N levels in substrate solution were higher and closer to
levels in peat. Work by Browder et al. (2006) showed that when PTS was amended with
40% peatmoss (v/v), plant growth was similar to plants grown in 100% peat at 200 mg·L-
1 N. Additionally, Fain et al. (2008b) reported improved plant growth at lower fertilizer
starter charge rates when their PTS was amended with 20-50% peatmoss (v/v). These
previous studies suggest that the presence of peat (having less N immobilization) allowed
more N to remain in substrate solution for plant use.
Substrate CO2 efflux increased as fertilizer rates increased in all substrates and at
all measurement dates over 28 days and was highest in PTS and lowest in PL with PB
being intermediate (Table 4.3) which is similar to results reported by Jackson and Wright
(2007) . There was a substrate x fertilizer rate interaction for substrate CO2 efflux at
each measurement date, with PTS having a more pronounced CO2 efflux increase as
fertilizer rate increased compared to PB or PL (Table 4.3). Higher substrate CO2 efflux in
PTS indicates a higher level of microbial activity, which is supported by the
aforementioned higher amount of N immobilized in PTS compared to PB and PL (Table
4.1). Substrate CO2 efflux levels generally increased in all substrates at both fertilizer
rates and then decreased by the end of the experiment (Table 4.1).
Medium-term (10 week) N immobilization. Nitrogen immobilization increased as
fertilizer rate increased from 100 mg·L-1 N to 300 mg·L-1 N in PL at the first two
measuring dates, but beginning at week 4 through week 10 immobilization decreased at
the 300 and 400 mg·L-1 N rate (Table 4.4). Immobilization of N in PB increased
from100 mg·L-1 N to 200 mg·L-1 N at all dates and decreased at the 400 mg·L-1 N (Table

155
4.4). Immobilization of N in PTS increased as fertilizer rate increased from 100 mg·L-1 N
to 300 mg·L-1 N at all dates, and was less at the 400 mg·L-1 N at all dates. Pine tree
substrate had higher amounts of N immobilization at each fertilizer rate and at each week
followed by PB and PL (Table 4.4). There was a substrate x fertilizer rate interaction for
each measuring date with higher increases in N immobilization for PTS in response to
fertilizer rate at each date compared to PB and PL (Table 4.4).
Nitrogen immobilization at low fertilizer rates observed in this study as well as in
commercial substrates during early crop production, is associated with the undecomposed
carbonaceous materials (wood fragments, bark, etc) found in substrates that are being
broken down by microbes (Bunt, 1988). The decrease in immobilization at the high
fertilizer rates (300 and 400 mg·L-1 N depending on the substrate) may be in response to
high salt levels which may be toxic to microbes (Maas and Adamson, 1972) thereby
limiting or decreasing their populations.
Substrate solution NO3-N levels after incubation were lowest in PTS compared to
PB or PL at each measuring date (Table 4.5). Nitrate levels generally increased over time
with each measuring date in all substrates at all fertilizer rates (Table 4.5). Similar to the
data discussed in the short-term study (Table 4.2) the NO3-N levels in PTS after
incubation remain low (<25 mg·L-1 N) compared to PB and PL, through week 4 at the
100 and 200 mg·L-1 N fertilizer rates, but NO3-N levels in solution were above 90 mg·L-1
at the 300 mg·L-1 N fertilizer rate at week 4 (28 days). Solution NO3-N levels in PTS at
the 300 mg·L-1 N were closer to the levels reported for PB and PL at the 200 mg·L-1 N
during several of the dates (weeks 0, 2, 4, 6; Table 4.5) which supports the reason for an
additional 100 mg·L-1 N required for comparable plant growth in PTS compared to PB or
PL (Wright et al., 2008a, 2008b).
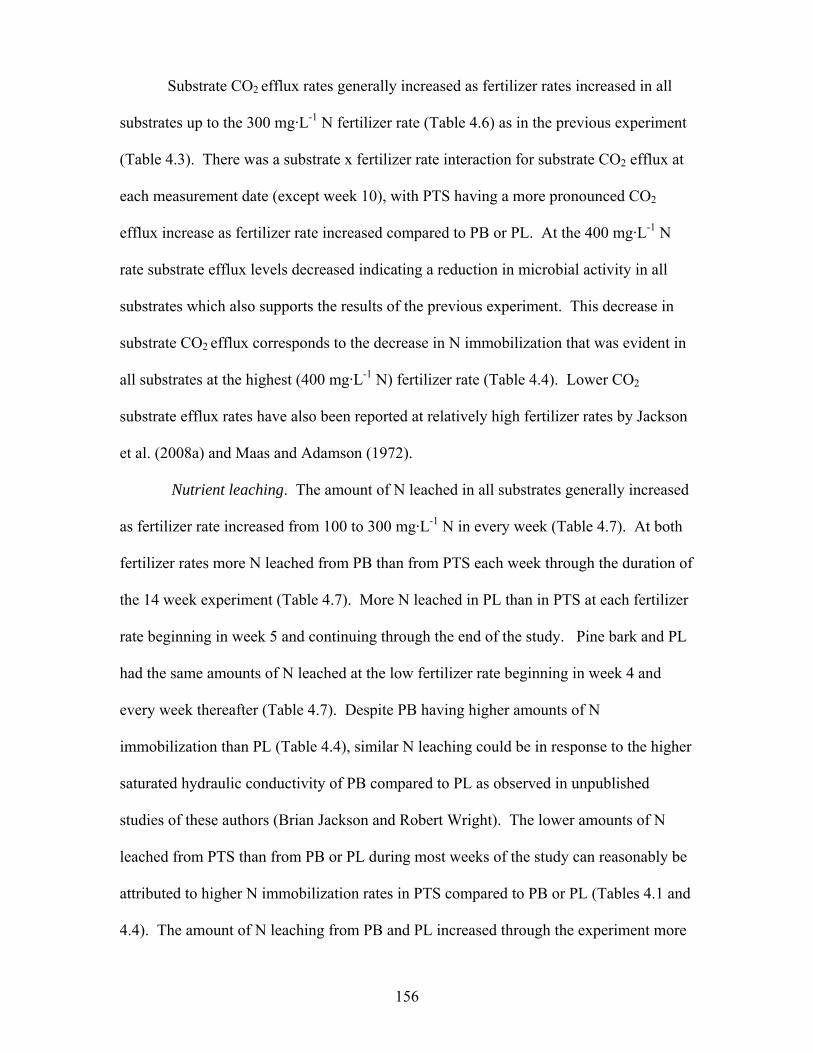
156
Substrate CO2 efflux rates generally increased as fertilizer rates increased in all
substrates up to the 300 mg·L-1 N fertilizer rate (Table 4.6) as in the previous experiment
(Table 4.3). There was a substrate x fertilizer rate interaction for substrate CO2 efflux at
each measurement date (except week 10), with PTS having a more pronounced CO2
efflux increase as fertilizer rate increased compared to PB or PL. At the 400 mg·L-1 N
rate substrate efflux levels decreased indicating a reduction in microbial activity in all
substrates which also supports the results of the previous experiment. This decrease in
substrate CO2 efflux corresponds to the decrease in N immobilization that was evident in
all substrates at the highest (400 mg·L-1 N) fertilizer rate (Table 4.4). Lower CO2
substrate efflux rates have also been reported at relatively high fertilizer rates by Jackson
et al. (2008a) and Maas and Adamson (1972).
Nutrient leaching. The amount of N leached in all substrates generally increased
as fertilizer rate increased from 100 to 300 mg·L-1 N in every week (Table 4.7). At both
fertilizer rates more N leached from PB than from PTS each week through the duration of
the 14 week experiment (Table 4.7). More N leached in PL than in PTS at each fertilizer
rate beginning in week 5 and continuing through the end of the study. Pine bark and PL
had the same amounts of N leached at the low fertilizer rate beginning in week 4 and
every week thereafter (Table 4.7). Despite PB having higher amounts of N
immobilization than PL (Table 4.4), similar N leaching could be in response to the higher
saturated hydraulic conductivity of PB compared to PL as observed in unpublished
studies of these authors (Brian Jackson and Robert Wright). The lower amounts of N
leached from PTS than from PB or PL during most weeks of the study can reasonably be
attributed to higher N immobilization rates in PTS compared to PB or PL (Tables 4.1 and
4.4). The amount of N leaching from PB and PL increased through the experiment more
157
so than from PTS likely as a result of accumulated N in those substrates from previous
fertilizations (a result of less N immobilization).
The amount of P leached in all substrates increased as fertilizer concentration
applied increased from 100 to 300 mg·L-1 N in all 14 weeks of this study (Table 4.8). All
substrates generally leached equal amounts of P at the low fertilizer rate throughout the
study with only two exceptions (Table 4.8). At the higher fertilizer rate PB leached more
P than PL or PTS through week 2, equal amounts to PL and PTS through week 8, and
then less than PL and PTS from week 10 through 14 (Table 4.8).
In general, higher amounts of K were leached from PB and PTS than from PL in
the first 6 weeks at the low fertilizer rate, and by week 14 there were no differences in mg
of K leached in all substrates (Table 4.9). At the high fertilizer rate higher amounts of K
were leached from PB and PTS than from PL through week 10. Higher amounts of K
leaching is expected in PB and PTS based on the numerous reports of higher K
concentrations in substrate solution of PB and PTS, and other wood substrates compared
to PL (Jackson et al., 2008a; Prasad, 1980; Wright et al., 2008).
Conclusions
These studies demonstrate that there are higher amounts of N immobilized in PTS
compared to PB or PL up to10 weeks. Pine bark also was shown to immobilize more N
than PL over the course of all studies. Results also suggest that immobilization amounts
are highest 2 weeks after potting (under production conditions) and then generally
decrease (but remain rather high) through the next several weeks. Substrate solution
NO3-N levels increase over time in PTS similar to PB and PL which could be important
during longer-term crop (e.g. chrysanthemum or poinsettias) production since more NO3-

158
N would be in substrate solution when the plants are larger and have higher nutrient
requirements. The lower levels of N leaching in PTS compared to PB or PL is important
in face of environmental pressures to reduce nutrient (particularly NO3) leaching from
agricultural/horticultural operations. The most important point is that higher levels of N
applications to PTS doesn’t result in higher N pollution through leaching as a result of the
high amounts of N immobilization that retains the N in the substrate. The substrate CO2
efflux data showed a similar trend with the N immobilization amounts (increased or
decreased as N immobilization amounts increased or decreased) which supports the use
of this method as an indicator of microbial activity in substrates and the potential for N
immobilization.
Literature Cited
Bodman, K. and K.V. Sharman. 1993. Container media management. Queensland DPI,
Queensland Nursery Industry Association, Brisbane, Australia. 40 p.
Bollen, W.B. and D.W. Glennie. 1961. Sawdust, bark, and other wood wastes for soil
conditioning and mulching. Forest Prod. J. 11:38-46.
Boyer, C.R. 2008. Evaluation of clean chip residual as an alternative substrate for
container-grown plants. Dissertation, Auburn University, Auburn, AL, 188p.
Boyer, C.R., G.B. Fain, C.H. Gilliam, T.V. Gallagher, H.A. Torbert, and J.L. Sibley.
2008. Clean chip residual: a substrate component for growing annuals. HortTechnology
18:423-432.

159
Broschat, T.K. 1995. Nitrate, phosphate, and potassium leaching from container-grown
plants fertilized by several methods. HortScience 30:74-77.
Browder, J.F., J. Smithson, B.E. Jackson, and R.D. Wright. 2006. Pine chips: peat
substrate ratios affect plant growth. Proc. Southern Nursery Assoc. Research Conf.
51:98-99.
Bugbee, G.J. and G.C. Elliott. 1998. Leaching of nitrogen and phosphorus from potting
media containing biosolids compost as affected by organic and clay amendments. Bull.
Environ. Contam. Toxicol. 60:716-723.
Bunt, A.C. 1988. Media and Mixes for Container Grown Plants. Second Ed. Unwin
Hyman, London.
Carlile, W.R. and K. Dickinson. 2004. Dehydrogenase as an indicator of microbial
activity in growing media. Acta Hort. 644:517-523.
Carthaigh, D.M., A. Sturm, and A. Schmugler. 1997. The use of Miscanthus as a
growing medium additive. Acta Hort. 450:57-61.
Davet, P. 2004. Microbial ecology of the soil and plant growth. Scientific Publishing,
Enfield, NH.
160
Environmental Protection Agency, 2006. National Primary Drinking Water Regulations.
http://www.epa.gov/safewater/dwh/c-ioc/nitrates.html Washington, D.C.
Fain, G.B., C.H. Gilliam, J.L. Sibley, and C.R. Boyer. 2008a. Wholetree substrates
derived from three species of pine in production of annual vinca. HortTechnology
18:13-17.
Fain, G.B., C.H. Gilliam, J.L. Sibley, and C.R. Boyer, A.L. Walker. 2008b. Wholetree
substrate and fertilizer rate in production of greenhouse-grown petunia (Petunia xhybrida
Vilm.) and marigold (Tagetes patula L.). HortScience 43:700-705.
Fog, K. 1988. The effect of added nitrogen on the rate of decomposition or organic
matter. Biol. Rev. 63:433-462.
Gallardo, A. and W.H. Schlesinger. 1994. Factors limiting microbial biomass in the
mineral soil and forest floor of a warm-temperate forest. Soil Biol. Biochem. 26:1409-
1415.
Gough, C.M. and J.R. Seiler. 2004. Belowground carbon dynamics in loblolly pine
(Pinus taeda) immediately following diammonium phosphate fertilization. Tree Physiol.
24:845-851.

161
Gruda, N., S.V. Tucher, and W.H. Schnitzler. 2000. N-immobilization of wood fiber
substrates in the production of tomato transplants (Lycopersicon lycopersicum (L.) Kerts.
Ex. Farw.). J. Appl. Bot. 74:32-37.
Gruda, N. 2005. Habilitationsschrift zur Erlangung der Lehrbefähigung für das
Fachgebiet Gemüsebau vorgelegt dem Rat der Landwirtschaftlich-Gärtnerischen Fakultät
der Humboldt-Universität zu Berlin (Growth and quality of vegetables in peat substitute
growing media, Dissertation, Humboldt University, Berlin Germany).
Gruszynski, C. and A.N. Kämpf. 2004. Residues of Aleurites fordii (Euphorbiacea) as a
component for plant substrates. Acta Hort. 644:171-176.
Gumy, N. 2001. Toresa and other woodfiber products: Advantages and drawbacks when
used in growing media. P. 39-46. Proc. Intl. Peat Symp., Peat in horticulture: Peat and
its alternatives in growing media.
Gutser, R., K. Teicher, and P. Fischer. 1983. Nitrogen dynamics in bark compost as
dependent on production methods. Acta Hort. 150:175-184.
Handreck, K.A. 1991. Nitrogen drawdown key to optimum growth. Aust. Hort. 12:38-43.
Handreck, K.A. 1992a. Rapid assessment of the rate of nitrogen immobilization in
organic components of potting media. I. method development. Commun. Soil Sci. Plant
Anal. 23:201-215.
162
Handreck, K.A. 1992b. Rapid assessment of the rate of nitrogen immobilization in
organic components of potting media. II. nitrogen drawdown index and plant growth.
Commun. Soil Sci. Plant Anal. 23:217-230.
Handreck, K.A. 1993b. Use of the nitrogen drawdown index to predict fertilizer nitrogen
requirements in soilless potting media. Commun. Soil Sci. Plant Anal. 24:2137-2151.
Handreck, K.A. 1996. Phosphorus immobilization in wood waste-based potting media.
Commun. Soil Sci. Plant Anal. 27:2295-2314.
Hart, M.R., B.F. Quin, and M. L. Nguyen. 2004. Phosphorus runoff from agricultural
land and direct fertilizer effects: a review. J. Environ. Qual. 33:1954-1972.
Iglesias, M.I., C. Rodil, P. Bessa, and S. Lamosa. 2008. Gorse compost as a peat-
substitute in growing media for the production of Thuja plicata ‘Zebrina’. Acta Hort.
779:615-622.
Jackson, B.E. and R.D. Wright. 2007. Pine tree substrate: fertility requirements for
nursery and greenhouse crops. Comb. Proc. Intl. Plant Prop. Soc. 57:680-684.
Jackson, B.E., R.D. Wright, and J.O. James. 2007. Pine tree substrate: current status.
Proc. Southern Nursery Assoc. Research Conf. 52:53-57.

163
Jackson, B.E. 2008. Chemical, physical, and biological factors influencing nutrient
availability and plant growth in a pine tree substrate. Virginia Polytechnic Institute &
State Univ., Blacksburg, VA. PhD Diss.
Jackson, B.E., R.D. Wright, J.F. Browder, J.R. Harris, and A.X. Niemiera. 2008a. Effect
of fertilizer rate on growth of azalea and holly in pine bark and pine tree substrates.
HortScience 43:1561-1568.
Jackson, B.E., R.D. Wright, and M.C. Barnes. 2008b. Pine tree substrate, nitrogen rate,
particle size, and peat amendment affects poinsettia growth and substrate physical
properties. HortScience (In press).
Jackson, B.E. and R.D. Wright. 2008. Pine tree substrate: An alternative and renewable
growing media for horticulture crop production. Acta Hort. (In press)
Lunt, O.R. and B. Clark. 1959. Horticultural applications for bark and wood fragments.
Forest Prod. J. 9:39-42.
Maas, E.F. and R.M. Adamson. 1972. Resistance of sawdusts, peats, and bark to
decomposition in the presence of soil and nutrient solution. Soil Sci. Soc. Amer. Proc.
36:769-772.
McKenzie, W.M. 1958. The effect of nitrogen availability of adding fragmented wood to
soil. Aust. J. Agr. Res. 9:664-679.
164
Needelman, B.A., M.M. Wander, and G.S. Shi. 2001. Organic carbon extraction
efficiency in chloroform fumigated and non-fumigated soils. Soil Sci. Soc. Amer. J.
65:1731-1733.
Poole, R.T. and C.T. Conover. 1985. Growth of Ficus benjamina in combinations of peat,
sand, and Melaleuca. HortScience 20:383-385.
Prasad, M. 1980. Retention of nutrients by peats and wood wastes. Scientia Hort.
12:203-209.
Prasad, M and G. Fietje. 1989. Evaluation of ground tree fern as a growing medium for
ornamental plants. Acta Hort. 238:157-164.
Prasad, M. 1997. Nitrogen fixation of various materials from a number of European
countries by three nitrogen fixation tests. Acta Hort. 450:353-362.
Pronk, A.A. 1997. Laboratory investigations of nitrogen can carbon dioxide release of
peat and peat-compost media. Acta Hort. 450:245-252.
Pudelski, T. and J. Pirog. 1984. Effect of four growing methods in wood waste substrates
on the yield of glasshouse cucumbers. Acta Hort 156:35-42.

165
Roeber, R. and J. Leinfelder. 1997. Influence of a wood fiber substrate and water quality
on plant quality and growth of Saintpaulia x ionantha and Sinningia x hybrida. Acta
Hort. 450:97-103.
Saunders, T.N., R.D. Wright, and J.F. Browder. 2005 Chipped pine logs: a potential
substrate for nursery and greenhouse crops. Proc. Southern Nursery Assn. Res. Conf.
50:112-114.
Schilling, R. 1999. Toresa®. Comb. Proc. Intl. Plant Prop. Soc. 49:410-412.
Schnitzler, W.H., A.K. Sharma, N. Gruda, and H.T. Heuberger. 2004. A low-tech
hydroponic system for bell pepper (Capsicum annuum L.) production. Acta Hort. 644:47-
53.
Sharman, K.V. and M. Whitehouse. 1993. Nitrogen drawdown index as a predictor of
nitrogen requirements for Nephrolepis in sawdust media. Scientia Hort. 54:23-33.
Smolander, A., A. Kurka, V. Kitunen, and E. Mälkonen. 1994. Microbial biomass C and
N, and respiratory activity in soil of repeatedly limed and N- and P-fertilized Norway
spruce stands. Soil Biol. Biochem. 26:957-962.
Söderstrom, B., E. Bååth, and B. Lundgren. 1983. Decrease in soil microbial activity and
biomass owing to nitrogen amendments. Can. J. Microbiol. 29:1500-1506.

166
Thirukkumaran, C.M. and D. Parkinson. 2000. Microbial respiration, biomass, metabolic
quotient and litter decomposition in a lodgepole pine forest amended with nitrogen and
phosphorus fertilizers. Soil Biol. Biochem. 32:59-66.
Turner, C.P., and W.R. Carlile. 1983. Microbial activity in blocking composts. 1.
measurement of CO2 evolution and O2 consumption. Acta Hort. 150: 75-81.
Vance, E.D., P.C. Brookes, and D.S. Jenkinson. 1987. An extraction method for
measuring soil microbial biomass. Soil Biol Biochem. 19:703-707.
Waksman, S.A. 1932. Principles of soil microbiology. Balliere, Tindall and Cox
Publishing. London.
Wang, W.J., R.C. Dalal, P.W. Moody, and C.J. Smith. 2003. Relationships of soil
respiration to microbial biomass, substrate availability and clay content. Soil Biol.
Biochem. 35:273-284.
Worrall, R.J. 1985. Composting wood wastes for potting mixes. Aust. Hort. 83:34-37.
Wright, R.D. and J.F. Browder. 2005. Chipped pine logs: A potential substrate for
greenhouse and nursery crops. HortScience 40:1513-1515.
Wright, R.D., J.F. Browder, and B.E. Jackson. 2006. Ground pine chips as a substrate for
container-grown woody nursery crops. J. Environ. Hort. 24:181-184.

167
Wright, R.D., B.E. Jackson, J.F. Browder, and J.G. Latimer. 2008a. Growth of
Chrysanthemum in ground pine trees requires additional fertilizer. HortTechnology
18:111-115.
Wright, R.D., B.E. Jackson, and J.F. Browder. 2008b. The landscape performance of
annual bedding plants grown in a pine tree substrate. HortTechnology (In press).
Yates, N.L. and M.N. Rogers. 1981. Effects of time, temperature, and nitrogen source on
the composting of hardwood bark for use as a plant growing medium. J. Amer. Soc. Hort.
Sci. 106:589-593.
Yeager, T.H. and R.D. Wright. 1982. Phosphorus requirement of Ilex crenata Thumb.
Cv. Helleri grown in a pine bark medium. J. Amer. Soc. Hort. Sci. 107-558-562.
Zhang, Q., and J.C. Zak. 1998. Effects of water and nitrogen amendment on soil
microbial biomass and fine root production in a semi-arid environment in west Texas.
Soil Biol. Biochem. 30: 39-45.

168
Table 4.1. Nitrate nitrogen (NO3-N) immobilized (mg) in peat-lite, pine bark, and pine tree substrate at five sampling dates over 28 days (short-term experiment) in containers fertilized with two rates of N from potassium nitrate (KNO3).
Substrates
NO3-N immobilizedz
Nitrogen rate (mg·L-1)y Day 0 Day 7 Day 14 Day 21 Day 28
Peat-litex
150 2.4 dw 3.0 d 3.2 d 3.0 d 2.9 c 300 2.2 d 2.5 d 2.8 d 2.8 d 2.4 c Pine bark
150 6.1 c 7.3 c 7.5 c 9.3 c 6.2 b 300 5.6 c 7.0 c 7.9 c 8.6 c 6.4 b Pine tree substratev
150 9.8 b 11.3 b 13.2 b 14.4 b 15.0 a 300 11.4 a 16.2 a 18.1 a 20.0 a 16.1 a Substrate (S) 0.0001 0.0001 0.0061 0.0052 0.0010 Fertilizer (F) 0.0002 0.0012 0.0001 0.0007 0.0021 S*F 0.0031 0.0001 0.0043 0.0214 0.1021 zNO3-N immobilized = mg of NO3-N immobilized per L substrate during a four day incubation. y1 mg·L-1 = 1 ppm. xPeat-lite composed of 80% peat moss / 20% perlite (v/v). wMeans separated within columns using Duncan’s multiple range test, P ≤ 0.05 (n = 3). vPine tree substrate was produced from12-year-old loblolly pine trees harvested at ground level, delimbed, chipped, and hammer-milled to pass through a 2.38-mm screen.

169
Table 4.2. Substrate solution nitrate nitrogen (NO3-N mg·L-1) concentrations after 0 days incubation and after 4 days incubation in peat-lite (PL), pine bark (PB), and pine tree substrate (PTS) over 28 days (short-term experiment) when fertilized with two rates of N from potassium nitrate (KNO3)z. NO3-N (mg·L-1) Substrates Day 0 Day 7 Day 14 Day 21 Day 28 Nitrogen rate (mg·L-1)y
0
4
0
4
0
4
0
4
0
4
PLx 150 31.9 cw 23.0 c 39.3 c 29.0 c 41.7 c 31.0 b 54.0 d 44.2 b 65.0 cd 55.3 d 300 68.0 a 60.7 a 80.1 a 71.7 a 103.3 a 94.0 a 118.7 a 109.0 a 171.0 a 163.0 a PB 150 31.0 c 11.1 d 34.7 c 10.3 d 48.7 c 23.7 b 63.0 c 32.0 c 74.0 c 53.0 d 300 69.6 a 51.0 b 84.7 a 61.7 b 115.0 a 88.6 a 127.0 a 98.6 a 167.0 a 146.3 b PTSv 150 33.3 c 0.7 e 38.0 c 0.4 e 45.3 c 1.4 c 53.0 d 5.3 d 58.6 d 9.3 e 300 59.8 b 21.7 c 70.1 b 16.0 d 87.3 b 27.0 b 102.6 b 36.3 bc 147.0 b 94.0 c Substrate (S) 0.0701 0.0011 0.2071 0.0001 0.0031 0.0001 0.0027 0.0001 0.0330 0.0041 Fertilizer (F) 0.0001 0.0003 0.0020 0.0001 0.0001 0.0001 0.0001 0.0001 0.0001 0.0001 S*F 0.0601 0.0001 0.0041 0.0001 0.0034 0.0001 0.0401 0.0001 0.0501 0.0001 zSubstrate solution extracted using a nitrogen drawdown procedure for determining nitrogen immobilization in substrates (Handreck, 1992a). y1 mg·L-1 = 1 ppm. xPeat-lite composed of 80% peat moss / 20% perlite (v/v). wMeans separated within columns using Duncan’s multiple range test, P ≤ 0.05 (n = 3). vPine tree substrate was produced from12-year-old loblolly pine trees harvested at ground level, delimbed, chipped, and hammer-milled to pass through a 2.38-mm screen.
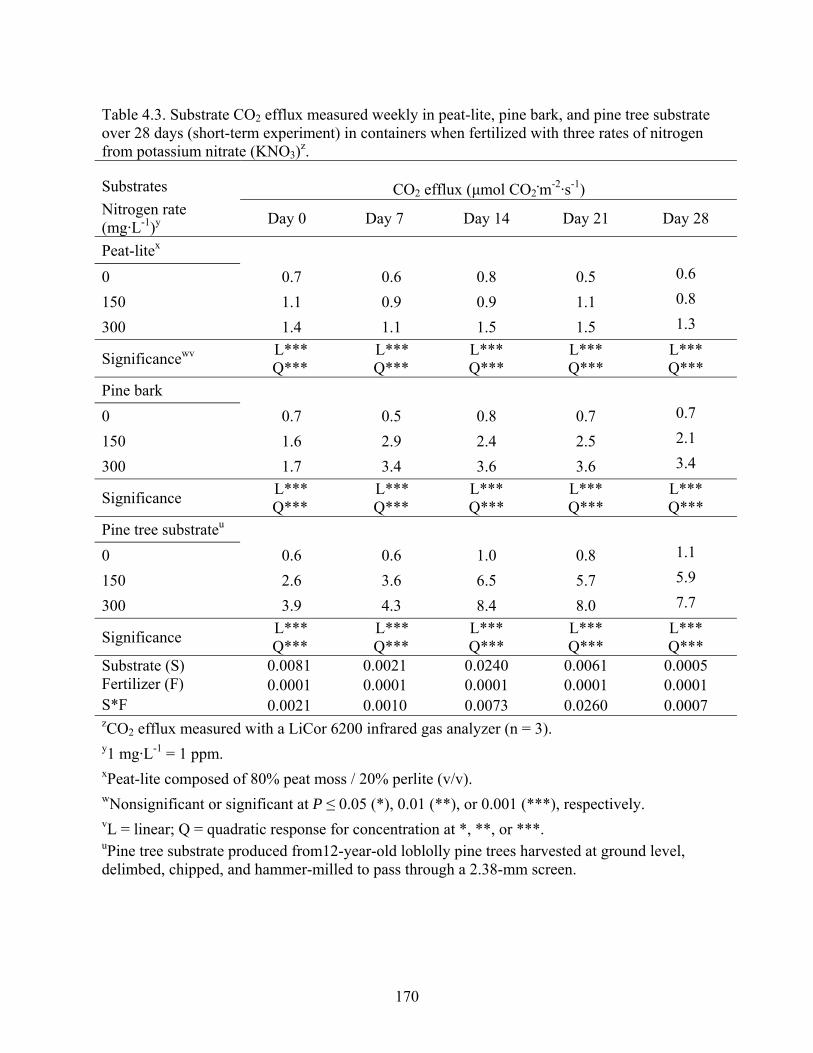
170
Table 4.3. Substrate CO2 efflux measured weekly in peat-lite, pine bark, and pine tree substrate over 28 days (short-term experiment) in containers when fertilized with three rates of nitrogen from potassium nitrate (KNO3)z.
Substrates
CO2 efflux (μmol CO2.m-2·s-1)
Nitrogen rate (mg·L-1)y Day 0 Day 7 Day 14 Day 21 Day 28
Peat-litex
0 0.7 0.6 0.8 0.5 0.6
150 1.1 0.9 0.9 1.1 0.8
300 1.4 1.1 1.5 1.5 1.3
Significancewv L*** Q***
L*** Q***
L*** Q***
L*** Q***
L*** Q***
Pine bark
0 0.7 0.5 0.8 0.7 0.7
150 1.6 2.9 2.4 2.5 2.1
300 1.7 3.4 3.6 3.6 3.4
Significance L*** Q***
L*** Q***
L*** Q***
L*** Q***
L*** Q***
Pine tree substrateu
0 0.6 0.6 1.0 0.8 1.1
150 2.6 3.6 6.5 5.7 5.9
300 3.9 4.3 8.4 8.0 7.7
Significance L*** Q***
L*** Q***
L*** Q***
L*** Q***
L*** Q***
Substrate (S) 0.0081 0.0021 0.0240 0.0061 0.0005 Fertilizer (F) 0.0001 0.0001 0.0001 0.0001 0.0001 S*F 0.0021 0.0010 0.0073 0.0260 0.0007 zCO2 efflux measured with a LiCor 6200 infrared gas analyzer (n = 3). y1 mg·L-1 = 1 ppm. xPeat-lite composed of 80% peat moss / 20% perlite (v/v). wNonsignificant or significant at P ≤ 0.05 (*), 0.01 (**), or 0.001 (***), respectively. vL = linear; Q = quadratic response for concentration at *, **, or ***. uPine tree substrate produced from12-year-old loblolly pine trees harvested at ground level, delimbed, chipped, and hammer-milled to pass through a 2.38-mm screen.

171
Table 4.4. Nitrate nitrogen (NO3-N) immobilization (mg) in peat-lite, pine bark, and pine tree substrate at five sampling dates when fertilized with four N rates from potassium nitrate (KNO3) over 10 weeks (medium-term experiment)z. Substrates NO3-N immobilized Nitrogen rate (mg·L-1)y
Week 0
Week 2
Week 4
Week 6
Week 8
Week 10
Peat-litex
100 2.4 3.4 2.6 1.3 2.1 1.5
200 3.1 4.2 3.9 3.6 3.2 3.7
300 4.0 4.3 2.9 3.6 2.8 3.1 400 1.8 4.0 3.2 3.2 2.0 2.9
Significancewv L** Q**
L** Q***
L*** Q**
L* Q**
L* Q**
L*** Q**
Pine bark
100 4.1 7.0 5.5 6.7 2.4 3.0
200 5.7 8.8 5.9 8.6 7.5 6.6
300 7.0 7.4 6.7 11.2 6.5 6.1
400 4.9 7.3 5.9 6.8 5.3 5.3
Significance L*** Q***
L*** Q***
L** Q**
L* Q*
L*** Q**
L** Q***
Pine tree substrateu
100 8.7 9.3 10.2 10.4 7.4 8.2
200 12.4 15.9 12.5 12.0 10.4 10.2
300 14.1 19.1 19.1 17.4 15.6 11.3
400 12.6 16.1 12.6 15.0 11.3 10.2
Significance L*** Q***
L*** Q***
L*** Q***
L*** Q***
L*** Q***
L** Q***
Substrate (S) 0.0001 0.0121 0.0029 0.0401 0.0001 0.0055 Fertilizer rate (F) 0.0001 0.0001 0.0001 0.0001 0.0432 0.0001
S x F 0.0171 0.0210 0.0158 0.0107 0.0024 0.0241 zNO3-N immobilization = mg of NO3-N immobilized per L substrate during a four day incubation. y1 mg·L-1 = 1 ppm. xPeat-lite composed of 80% peat moss / 20% perlite (v/v). wNonsignificant or significant at P ≤ 0.05 (*), 0.01 (**), or 0.001 (***), respectively. vL = linear; Q = quadratic response for concentration at *, **, or ***. uPine tree substrate produced from12-year-old loblolly pine trees harvested at ground level, delimbed, chipped, and hammer-milled to pass through a 2.38-mm screen.

172
Table 4.5. Substrate solution nitrate nitrogen (NO3-N mg·L-1) concentrations after 0 days incubation and after 4 days incubation in peat-lite (PL), pine bark (PB), and pine tree substrate (PTS) over 10 weeks (medium-term experiment) when fertilized with four rates of N from potassium nitrate (KNO3)z. NO3-N (mg·L-1) Substrates Week 0 Week 2 Week 4 Week 6 Week 8 Week 10 Nitrogen rate (mg·L-1)y
0 4 0 4 0 4 0 4 0 4 0 4
PLx 100 23.3 15.3 32.7 21.7 36.0 27.3 36.3 32.0 53.0 46.0 28.3 23.3 200 44.3 34.0 59.0 45.7 90.0 77.3 74.7 62.7 89.7 79.0 73.7 61.3 300 78.0 64.7 126.0 111.0 166.0 157.0 131.0 119.0 221.0 212.0 108.0 97.7 400 75.0 69.0 147.0 134.0 210.0 199.0 172.0 162.0 210.0 204.0 223.0 213.0
Significancewv L*** Q***
L*** Q***
L*** Q***
L*** Q***
L*** Q***
L*** Q***
L*** Q***
L*** Q***
L** Q***
L*** Q**
L*** Q***
L*** Q***
PB 100 18.3 4.7 34.3 11.1 32.0 14.0 35.7 13.3 59.0 51.0 34.7 24.7 200 33.3 14.7 71.0 41.7 83.0 64.0 99.7 71.3 168.0 143.0 159.0 137.0 300 58.7 35.7 136.0 111.0 151.0 129.0 205.0 167.0 237.0 215.0 255.0 234.0 400 57.0 40.7 159.0 135.0 195.0 175.0 174.0 152.0 244.0 226.0 247.0 229.0
Significance L** Q***
L*** Q***
L*** Q***
L*** Q***
L*** Q***
L*** Q***
L* Q**
L*** Q***
L*** Q***
L*** Q***
L*** Q***
L*** Q**
PTSu 100 29.3 0.3 32.3 1.3 36.7 2.67 38.7 4.17 37.3 12.8 35.3 8.1 200 42.7 1.3 55.0 2.0 67.3 22.7 87.0 47.0 71.0 36.7 61.0 27.0 300 72.3 25.3 115.0 51.0 158.0 94.7 115.0 57.0 166.0 114.0 93.0 55.7 400 72.7 30.7 159.0 105.0 174.0 132.0 175.0 125.0 172.0 134.0 161.0 127.0
Significance L*** Q**
L*** Q***
L*** Q***
L*** Q***
L*** Q***
L*** Q***
L*** Q***
L*** Q***
L*** Q**
L*** Q***
L*** Q***
L*** Q***
Substrate (S) 0.0471 0.0021 0.0502 0.0017 0.0720 0.0002 0.1320 0.0001 0.0209 0.0061 0.0001 0.0001Fertilizer (F) 0.0051 0.0004 0.0001 0.0001 0.0001 0.0001 0.0031 0.0001 0.0001 0.0023 0.0001 0.0001S*F 0.0621 0.0371 0.1601 0.0131 0.0369 0.0071 0.0201 0.0081 0.0008 0.0101 0.0151 0.0001zSubstrate solution extracted using a nitrogen (N) drawdown procedure for determining N immobilization (Handreck, 1992a; n = 3). y1 mg·L-1 = 1 ppm. xPL composed of 80% peat moss / 20% perlite (v/v). wNonsignificant or significant at P ≤ 0.05 (*), 0.01 (**), or 0.001 (***), respectively. vL = linear; Q = quadratic response for concentration at *, **, or ***. uPTS produced from12-year-old loblolly pine trees harvested, delimbed, chipped, and hammer-milled to pass through a 2.38-mm screen.
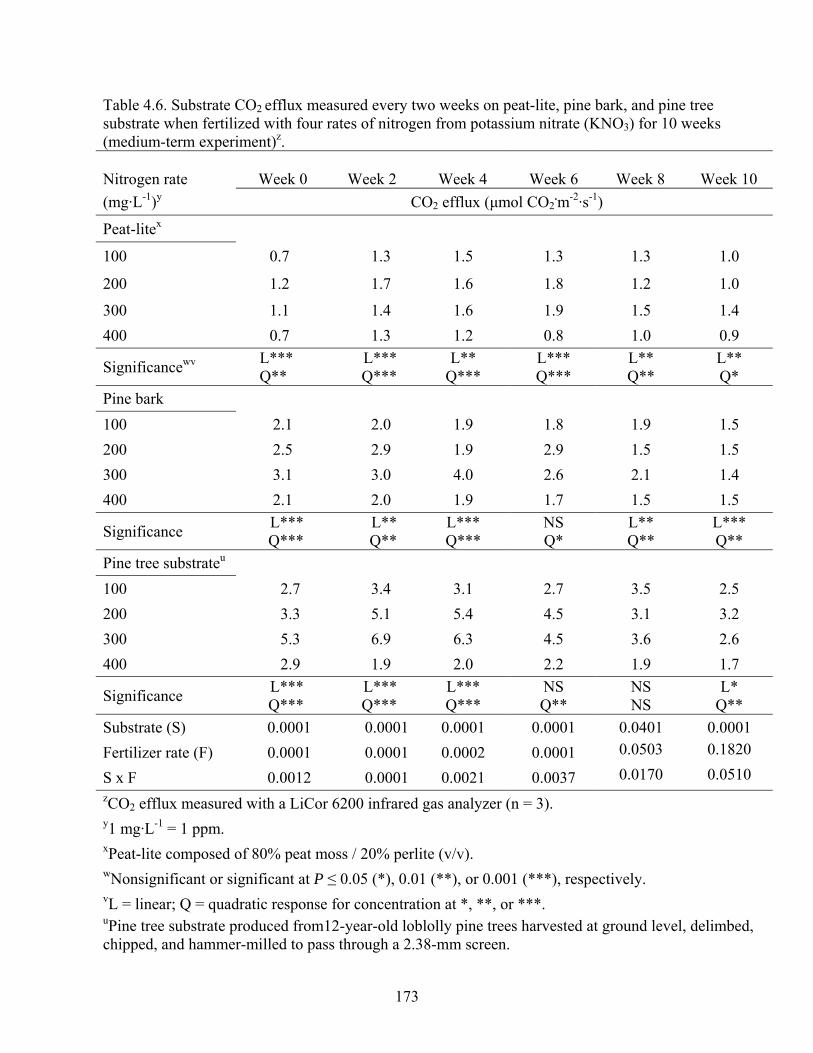
173
Table 4.6. Substrate CO2 efflux measured every two weeks on peat-lite, pine bark, and pine tree substrate when fertilized with four rates of nitrogen from potassium nitrate (KNO3) for 10 weeks (medium-term experiment)z. Nitrogen rate
Week 0
Week 2
Week 4
Week 6
Week 8
Week 10
(mg·L-1)y CO2 efflux (μmol CO2.m-2·s-1)
Peat-litex
100 0.7 1.3 1.5 1.3 1.3 1.0
200 1.2 1.7 1.6 1.8 1.2 1.0
300 1.1 1.4 1.6 1.9 1.5 1.4 400 0.7 1.3 1.2 0.8 1.0 0.9
Significancewv L*** Q**
L*** Q***
L** Q***
L*** Q***
L** Q**
L** Q*
Pine bark
100 2.1 2.0 1.9 1.8 1.9 1.5 200 2.5 2.9 1.9 2.9 1.5 1.5 300 3.1 3.0 4.0 2.6 2.1 1.4 400 2.1 2.0 1.9 1.7 1.5 1.5
Significance L*** Q***
L** Q**
L*** Q***
NS Q*
L** Q**
L*** Q**
Pine tree substrateu
100 2.7 3.4 3.1 2.7 3.5 2.5 200 3.3 5.1 5.4 4.5 3.1 3.2 300 5.3 6.9 6.3 4.5 3.6 2.6 400 2.9 1.9 2.0 2.2 1.9 1.7
Significance L*** Q***
L*** Q***
L*** Q***
NS Q**
NS NS
L* Q**
Substrate (S) 0.0001 0.0001 0.0001 0.0001 0.0401 0.0001 Fertilizer rate (F) 0.0001 0.0001 0.0002 0.0001 0.0503 0.1820
S x F 0.0012 0.0001 0.0021 0.0037 0.0170 0.0510 zCO2 efflux measured with a LiCor 6200 infrared gas analyzer (n = 3). y1 mg·L-1 = 1 ppm. xPeat-lite composed of 80% peat moss / 20% perlite (v/v). wNonsignificant or significant at P ≤ 0.05 (*), 0.01 (**), or 0.001 (***), respectively. vL = linear; Q = quadratic response for concentration at *, **, or ***. uPine tree substrate produced from12-year-old loblolly pine trees harvested at ground level, delimbed, chipped, and hammer-milled to pass through a 2.38-mm screen.
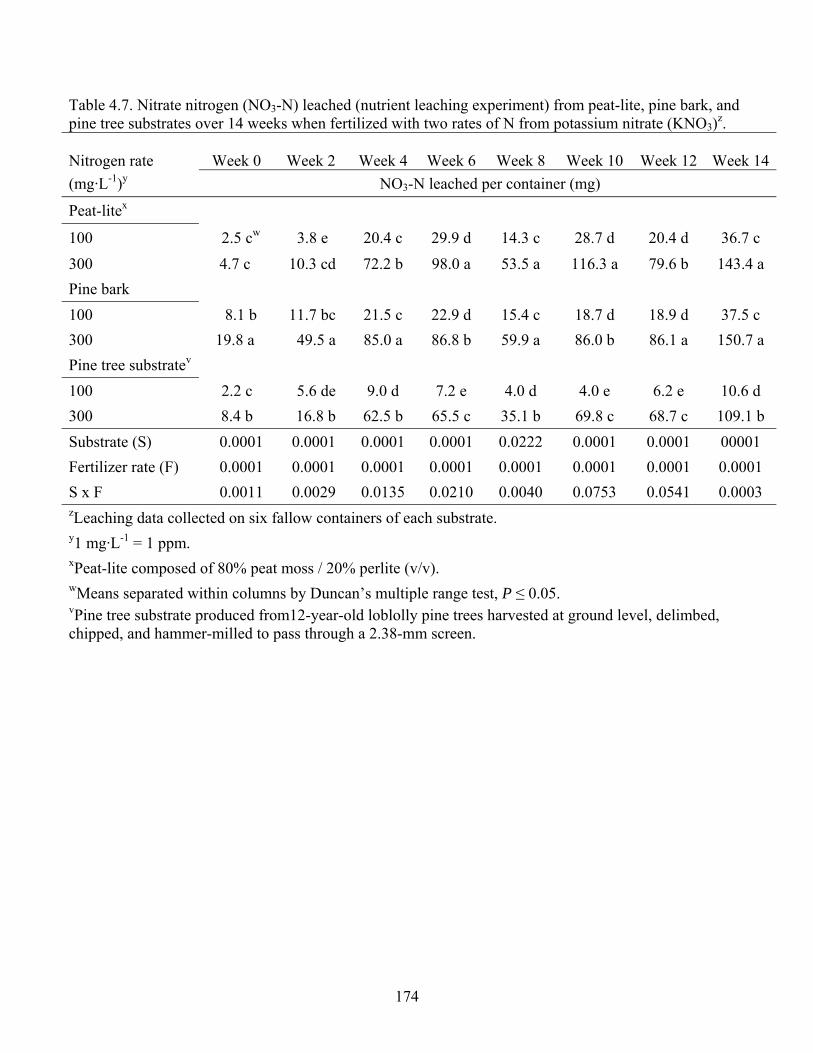
174
Table 4.7. Nitrate nitrogen (NO3-N) leached (nutrient leaching experiment) from peat-lite, pine bark, and pine tree substrates over 14 weeks when fertilized with two rates of N from potassium nitrate (KNO3)z. Nitrogen rate
Week 0
Week 2
Week 4
Week 6
Week 8
Week 10
Week 12
Week 14
(mg·L-1)y NO3-N leached per container (mg)
Peat-litex
100 2.5 cw 3.8 e 20.4 c 29.9 d 14.3 c 28.7 d 20.4 d 36.7 c 300 4.7 c 10.3 cd 72.2 b 98.0 a 53.5 a 116.3 a 79.6 b 143.4 a Pine bark 100 8.1 b 11.7 bc 21.5 c 22.9 d 15.4 c 18.7 d 18.9 d 37.5 c 300 19.8 a 49.5 a 85.0 a 86.8 b 59.9 a 86.0 b 86.1 a 150.7 a Pine tree substratev 100 2.2 c 5.6 de 9.0 d 7.2 e 4.0 d 4.0 e 6.2 e 10.6 d 300 8.4 b 16.8 b 62.5 b 65.5 c 35.1 b 69.8 c 68.7 c 109.1 b Substrate (S) 0.0001 0.0001 0.0001 0.0001 0.0222 0.0001 0.0001 00001 Fertilizer rate (F) 0.0001 0.0001 0.0001 0.0001 0.0001 0.0001 0.0001 0.0001 S x F 0.0011 0.0029 0.0135 0.0210 0.0040 0.0753 0.0541 0.0003 zLeaching data collected on six fallow containers of each substrate. y1 mg·L-1 = 1 ppm. xPeat-lite composed of 80% peat moss / 20% perlite (v/v). wMeans separated within columns by Duncan’s multiple range test, P ≤ 0.05. vPine tree substrate produced from12-year-old loblolly pine trees harvested at ground level, delimbed, chipped, and hammer-milled to pass through a 2.38-mm screen.
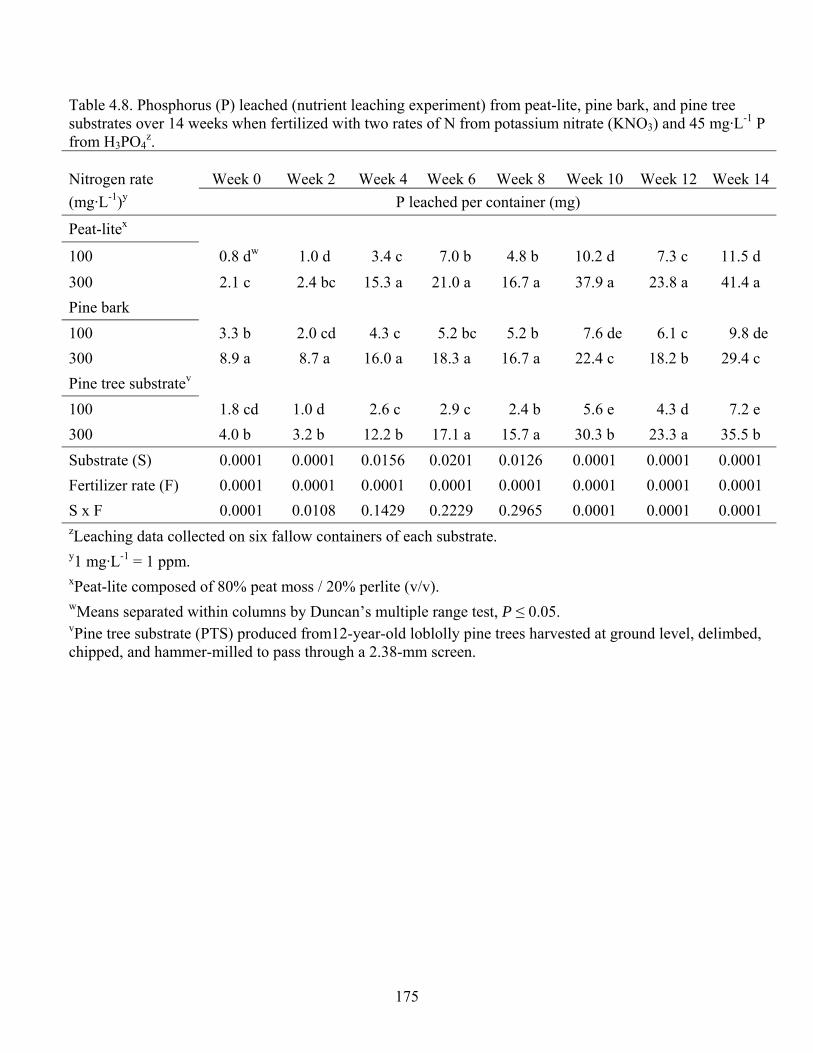
175
Table 4.8. Phosphorus (P) leached (nutrient leaching experiment) from peat-lite, pine bark, and pine tree substrates over 14 weeks when fertilized with two rates of N from potassium nitrate (KNO3) and 45 mg·L-1 P from H3PO4
z. Nitrogen rate
Week 0
Week 2
Week 4
Week 6
Week 8
Week 10
Week 12
Week 14
(mg·L-1)y P leached per container (mg)
Peat-litex
100 0.8 dw 1.0 d 3.4 c 7.0 b 4.8 b 10.2 d 7.3 c 11.5 d 300 2.1 c 2.4 bc 15.3 a 21.0 a 16.7 a 37.9 a 23.8 a 41.4 a Pine bark 100 3.3 b 2.0 cd 4.3 c 5.2 bc 5.2 b 7.6 de 6.1 c 9.8 de 300 8.9 a 8.7 a 16.0 a 18.3 a 16.7 a 22.4 c 18.2 b 29.4 c Pine tree substratev 100 1.8 cd 1.0 d 2.6 c 2.9 c 2.4 b 5.6 e 4.3 d 7.2 e 300 4.0 b 3.2 b 12.2 b 17.1 a 15.7 a 30.3 b 23.3 a 35.5 b Substrate (S) 0.0001 0.0001 0.0156 0.0201 0.0126 0.0001 0.0001 0.0001 Fertilizer rate (F) 0.0001 0.0001 0.0001 0.0001 0.0001 0.0001 0.0001 0.0001 S x F 0.0001 0.0108 0.1429 0.2229 0.2965 0.0001 0.0001 0.0001 zLeaching data collected on six fallow containers of each substrate. y1 mg·L-1 = 1 ppm. xPeat-lite composed of 80% peat moss / 20% perlite (v/v). wMeans separated within columns by Duncan’s multiple range test, P ≤ 0.05. vPine tree substrate (PTS) produced from12-year-old loblolly pine trees harvested at ground level, delimbed, chipped, and hammer-milled to pass through a 2.38-mm screen.

176
Table 4.9. Potassium (K) leached (nutrient leaching experiment) from peat-lite, pine bark, and pine tree substrates over 14 weeks when fertilized with two rates of N from potassium nitrate (KNO3)z. Nitrogen rate
Week 0
Week 2
Week 4
Week 6
Week 8
Week 10
Week 12
Week 14
(mg·L-1)y K leached per container (mg)
Peat-litex
100 5.1 dw 1.9 e 9.4 d 16.1 e 12.4 d 23.5 c 20.5 d 33.4 b 300 5.0 d 4.5 de 30.3 b 48.2 c 40.3 c 94.5 b 98.0 b 126.0 a Pine bark 100 23.0 c 10.6 c 20.4 c 22.4 d 18.8 d 27.0 c 21.6 d 40.1 b 300 33.7 a 35.5 a 57.4 a 68.3 b 57.2 b 84.6 b 74.8 c 128.3 a Pine tree substratev 100 25.0 c 7.0 cd 18.2 c 19.2 de 13.3 d 31.3 c 21.5 d 35.0 b 300 30.0 b 15.9 b 58.5 a 77.9 a 74.4 a 132.0 a 107.3 a 130.8 a Substrate (S) 0.0001 0.0001 0.0001 0.0001 0.0001 0.0001 0.0001 0.0218 Fertilizer rate (F) 0.0001 0.0001 0.0001 0.0001 0.0001 0.0001 0.0001 0.0001
S x F 0.0002 0.0037 0.0001 0.0001 0.0001 0.0001 0.0001 0.1688 zLeaching data collected on six fallow containers of each substrate. y1 mg·L-1 = 1 ppm. xPeat-lite composed of 80% peat moss / 20% perlite (v/v). wMeans separated within columns by Duncan’s multiple range test, P ≤ 0.05. vPine tree substrate (PTS) produced from12-year-old loblolly pine trees harvested at ground level, delimbed, chipped, and hammer-milled to pass through a 2.38-mm screen.

177
CHAPTER V
Changes in Nutrient Availability, and Chemical and Physical Properties of Pine Tree Substrate and Pine Bark during Long-term Nursery Crop
Production
Abstract: The objective of this study was to evaluate a pine tree substrate (PTS) for
nutrient availability, decomposition and change in physical properties, and substrate CO2
efflux (microbial activity) during a long-term production cycle under outdoor nursery
conditions. Pine tree substrate was produced from loblolly pine trees (Pinus taeda L.)
that were chipped, and hammer-milled to a desired particle size. Substrates used in this
study were PTS constructed from a 4.76-mm screen and aged pine bark (PB). Plastic
nursery containers (15-L) were filled with each substrate and amended with either 4.2 or
8.4 kg·m-3 Osmocote Plus fertilizer (15N-3.9P-10K) and planted with Cotoneaster
horizontalis Decne. var. perpusillus C. K. Schneid. liners. Fallow containers were also
incorporated in this study to compare changes in substrate shrinkage and physical
properties without the influence of plants. Substrate solution chemical properties and
nutrient concentrations were determined each month during the summers of 2006 and
2007 in addition to measuring substrate CO2 efflux (μmol CO2.m-2·s-1) as an assessment
of microbial activity. Substrate breakdown (decomposition) was determined with particle
size analysis and physical property determination on substrates at the conclusion of the
study (70 weeks). Substrate solution pH was higher in PTS than in PB at both fertilizer
rates in 2006 but pH levels decreased over time and were lower in PTS at both fertilizer
rates in 2007. Substrate solution electrical conductivity (EC) levels, nitrate (NO3-N),
phosphorus (P) and potassium (K) concentrations were all generally higher in PB than in
PTS at both fertilizer rates through both years. Pine tree substrate decomposition was

178
higher when plants were present in the containers [evident by an increase in fine substrate
particles (<0.5 mm) after 70 weeks], but breakdown was equal at both fertilizer rates.
Shrinkage of PTS in the presence of plants was equal to the shrinkage observed in PB
with plants, but shrinkage was higher in fallow PTS containers than PTS with plants.
Substrate air apace (AS) was highest in PTS and container capacity (CC) was equal in PB
and PTS at potting. Substrate AS decreased and CC increased in both substrates after 70
weeks but remained in acceptable ranges for container substrates. Substrate CO2 efflux
rates were higher in PTS compared to PB at both fertilizer rates indicating higher
microbial activity, thereby increasing the potential for nutrient immobilization and
substrate breakdown.
Introduction
Beginning in the early 1970’s, the search for organic soilless substrates for
container production has been an important horticultural research topic with the
introduction of hardwood and softwood barks as the primary component in container
substrates (Aaron, 1982; Hoitink and Poole, 1979). Recently, supplies of pine bark in
many areas across the southeastern states have been erratic. Growers who find a suitable
pine bark supply often find the purchase price and cost of transportation prohibitive.
Reduced availability and higher costs have been driven by the reduced supply resulting
from decreased harvesting for the paper and timber industry and also by the use of PB as
a fuel source, in retail potting media, and as landscape mulches.
Wood-based substrates have been some of the more heavily researched and
successful alternative materials evaluated. Successful growth of woody nursery crops in

179
wood substrates have been reported using several wood materials including cedar chips
(Brown and Emino, 1981), pruning and forest residue wastes (Riviere and Milhau, 1983),
commercial wood fibre (Cultifibre®, Hortifibre®, and Toresa®; Bohne, 2004; Lemaire et
al., 1989), and hardwood chips from ground whole oak and elm trees (Kenna and
Whitcomb, 1985). Laiche and Nash (1986) were the first in the United States to produce
a pine tree substrate (PTS) derived from PB with a considerable percentage of loblolly
pine wood and a second PTS derived from whole pine trees (needles, twigs, bark, and
wood). They reported that plant growth of several woody plants to be highest in 100%
PB compared to the two PTSs and that additional work was needed before pine wood
could be used as a container substrate. Two decades later, Wright and Browder (2005)
demonstrated that woody and herbaceous plants could be grown in a 100% PTS referred
to as WoodGro® (WoodGro LLC., Blacksburg, VA) produced from debarked loblolly
pine logs. Wright et al. (2006), also evaluated the growth of numerous woody nursery
species in a PTS produced from ground pine logs (including the bark) (approximately
90% wood and 10% bark) compared to PB. Fain et al. (2008a and 2008b) manufactured
a PTS (referred to as WholeTree) by chipping and grinding freshly harvested 8- to 10-
year-old pine trees including the wood, bark, limbs, and needles. They reported that
herbaceous plants grown in their PTS were smaller than plants grown in 100% PB, but
that growth index and visual quality of the plants were similar for both substrates.
Further work by Boyer et al. (2008) showed that growth of annual bedding plants was
comparable to 100% PB when grown in a substrate derived from a tree by-product
(limbs, needles, bark, cones, etc.) known as clean chip residual that remains after pine
trees are harvested for pulp wood.
180
Container substrates should maintain a balance between air space (AS) and
container capacity (CC – total water holding capacity of substrate) during crop
production so that growing conditions remain favorable for plant growth. Physical
properties of substrates considered appropriate for plant growth at planting may change
over time in containers as a result of several processes (Allaire-Lueng et al., 1999;
Lemaire, 1995). Changes include AS reduction as a result of setting and segregation of
particles of variable sizes (Bilderback and Lorscheider, 1995), shrinkage of the substrate
(Bruckner, 1997), and organic matter decomposition and physical breakdown of particles
(Bollen and Glennie, 1961; Nash and Laiche, 1981). Most research on the physical
properties of substrates has used peat moss or pine bark, the two most commonly used
substrates. Current guidelines for container substrates suggest that after irrigation and
drainage, substrates should have between 10% and 30% air space (AS), 45% to 65%
container capacity (CC), 25% to 35% available water, 25% to 35% unavailable water,
50% to 85% total porosity (TP), and 0.19 to 0.70 g·cm-3 bulk density (BD; Yeager et al.,
2007). As the use of wood substrates increases, further evaluation of their management
requirements and physical property characteristics during crop production is needed.
Researchers have shown that initial physical properties of PTS can be engineered for
optimal characteristics (Saunders et al., 2006; Wright et al., 2008b) for nursery and
greenhouse crop production. The acceptable or optimal physical properties were based
on initial physical characteristics determined at the time of planting/potting of plant
growth trials, and provide no indication as to how long PTS retains satisfactory physical
properties under long-term production conditions. However, work by Jackson et al.
181
(2008b) reports that PTS has similar (and within the suggested range) physical properties
to PL after 14 weeks under fertilized greenhouse conditions.
Shrinkage of wood substrates in containers has been reported to range from 36%
volume loss over 15 months (Fischer et al., 1993) to 50% volume loss over 51 weeks
(Meinken and Fischer, 1997) during crop production. The wood substrates used in these
reports were wood fiber (so named due to their manufacturing process and physical
properties) and were derived from a mixture of various tree species; primarily spruce
(Picea abies L.). Jackson and Wright (2008) and Jackson et al. (2008a) report no
significant visual substrate shrinkage or decomposition of PTS during four month
greenhouse and one year nursery crop production, and Fain et al. (2008b) reported less
shrinkage of a PTS than a peat substrate during a five week greenhouse trial. Jackson et
al. (2008b) reported similar shrinkage and change in physical properties of PTS under
fertilized greenhouse conditions compared to a traditional peat substrate during a 14 week
study. The change in physical properties [total porosity (TP), AS, and CC] of PTS during
long-term nursery crop production have not been reported, and need to be addressed
before large scale production and use of this substrate begins. Determination of the
changes in substrate physical properties in undisturbed containers over time (during or at
the end of crop production) is difficult to measure and rarely reported in the literature as a
result of the absence of a generally accepted and official measurement procedure
(Bilderback et al., 2005). Determining the physical properties of a substrate (removed
from containers following crop production) with the same laboratory method [e.g. North
Carolina State University (NCSU) Porometer] used to determine the initial properties (at

182
potting) is used as a comparison of the breakdown and change in properties of substrates
over time under production conditions.
Substrate particle size analysis is often determined to make inferences on the
physical properties (AS, CC, pore space, etc.) expected for that substrate (Bilderback et
al., 2005). Substrate particle sizes are commonly grouped into three categories/classes;
coarse (>2.0 mm), medium (0.5 to 2.0 mm), and fine (<0.5 mm) for discussion (Drzal et
al., 1999; Richards et al., 1986). Determination of substrate particle analysis before and
after crop production could be an estimate of substrate breakdown by evidence of a
reduction in large particles and an increase in fine particles which is known to occur in
organic substrates (Bilderback et al., 2005).
The environmental impact of fertilizer applications, especially N and P, has been
of concern to growers and scientists over the years. Environmental contamination from
nitrate and phosphorus has become an important concern of nursery operators in many
areas. Nitrate (NO3-N) levels >10 ppm in drinking water are considered unsafe for
humans (Environmental Protection Agency, 2006), and PO4-P often is associated with
algal blooms and eutrophication of lakes and ponds (Hart et al., 2004) even though P is
considered rather immobile in many mineral soils, it is more readily leached from soilless
container substrates (Broschat, 1995; Yeager and Wright, 1982). Nitrate is readily
leached from both mineral soils and soilless container substrates (Bugbee and Elliott,
1998; Yeager et al., 1993). Nutrient loss and availability from PTS during crop
production (nursery or greenhouse) has not been reported in previous literature and
remains an important issue in light of the higher fertilizer requirements for 100% PTS
(Jackson et al., 2008a; Jackson and Wright, 2008; Wright et al., 2008a) that are required
183
for optimal plant growth. It has since been shown that PTS can be produced with a
smaller hammer-mill screen [2.38-mm; resulting in a PTS with higher percentages of fine
particles (<0.5 mm)] or amended with 25% peat moss to increase its WHC and nutrient
retention, thereby increasing plant growth at lower fertilizer rates similar to those used
with a peat substrate (Fain et al., 2008b; Jackson et al., 2008b).
In PTS the need for additional fertilizer is a result of higher microbial activity
resulting in increased N immobilization in wood-based substrates compared to peat or
PB. Numerous authors have reported N immobilization in wood substrates ranging from
10 to 300 mg N per L of substrate per week during crop production (Bodman and
Sharman, 1993; Handreck, 1992b; Sharman and Bodman, 1991). Nitrogen
immobilization in soils and organic materials results from microbial assimilation of
ammonium nitrogen (NH4-N) and NO3-N into proteins, nucleic acids and other organic
complexes contained within microbial cells (Davet, 2004). Carbon dioxide (CO2) release
represents the final stage of oxidation of organic substrates and is the older and still more
commonly used method for estimation of microbial activity in soils (Wang et al., 2003).
Since root respiration is also a source of CO2 in the soil, it is important to take into
account the sources of CO2 evolution. Soil respiration/efflux is influenced by a number
of factors, including soil/substrate quality and organic matter content, temperature, soil
moisture, root biomass, and microbial activity and biomass (Davet, 2004; Ding et al.,
2007; Fog, 1988; Wang et al., 2003).
The estimation of microbial activity could represent a possible strategy to
improve the usefulness and fertilizer efficiency of substrates (Gagnon and Simard, 1999;
Handreck, 1992a). Previous data on measuring microbial activity in container substrates

184
was reported by Pronk (1997) who used three methods to determine the microbial activity
of peat and several compost mixes. The methods used were the Dewar self-heating test, a
CO2 release test, and a N release test. Pronk concluded that the Dewar self-heating test
was unable to detect any changes in microbial activity while the CO2 and N release tests
were successful in determining changes in microbial activity in the substrates. However,
data from these tests could not be positively correlated with one another and he suggested
that more testing be done on each method independently for monitoring microbial
activity. The objective of this study was to evaluate nutrient availability, changes in
physical and chemical properties, substrate shrinkage, and biological (microbial) activity
in PTS compared to PB during long-term nursery production.
Materials and Methods
The substrates used in this experiment were PTS and PB. Pine tree substrate was
produced from loblolly pine trees (approximately 30-cm basal diameter) that were
harvested at ground level and delimbed on 14 April 2006 in Warsaw VA. Trees were then
chipped (including bark) with a Morbark Chipper (Winn, MI) operated by Wood
Preservers Inc., (Warsaw, VA) on 15 April 2006. Wood chips (2.5-cm x 2.5-cm x 0.5-
cm) were further ground in a hammer mill (Meadows Mills, Inc., North Wilkesboro, NC)
on 17 May 2006 to pass through a 4.76-mm screen. Pine tree substrate was used fresh
(uncomposted) and amended with 0.6 kg·m-3 calcium sulfate (CaSO4) based on previous
work by Saunders et al. (2005) that showed improved plant growth when CaSO4 was
incorporated in PTS. Samples of PTS were tested for pH prior to potting and not
amended with lime due to the relatively high pH (~5.8) observed which has been shown
185
previously in freshly ground pine wood (Wright et al., 2008a). Pine bark was pre-plant
amended with dolomitic lime at a rate of 3.6 kg·m-3 and CaSO4 at a rate of 0.6 kg·m-3.
Osmocote Plus (15N-3.9P-10K; O.M. Scott Horticulture Products, Marysville, OH) was
preplant incorporated in PB and PTS at rates of 4.2, or 8.4 kg·m-3.
On 5 June 2006, cotoneaster (Cotoneaster horizontalis Decne. var. perpusillus C.
K. Schneid.) liners (10-cm tall in 64 cm3 containers) were potted in 15-L plastic
containers [28-cm (h) x 30-cm (d)] containing either PTS or PB. Three liners were
evenly spaced and planted along the container edges, leaving the center of the container
open. Additional containers were also filled separately with each of the two substrates
and left fallow to compare changes in substrate shrinkage and physical properties with
and without plants. A 10.2-cm diameter x 5.1-cm high thin-walled polyvinyl chloride
(PVC) collar was inserted 0.5 cm into the center of all containers which served as a
cradle for a soil CO2 flux chamber to be inserted and positioned securely above the
substrate surface for CO2 efflux measurements. These collars minimize soil surface
disturbance during CO2 measurements and reduce the sudden flux of CO2 associated with
soil disturbance (Wang et al., 2005). Collars remained in the containers for the duration
of the experiment without disturbance. Cotoneaster was used because of its weeping
growth habit which assured growth over the sides of the containers with minimal
obstruction of the PVC collars. Plants in all containers were equally pruned throughout
the study and plant growth was not recorded or analyzed. Containers were placed on a
gravel nursery pad at the Urban Horticulture Center, Blacksburg, VA and over-head
irrigated daily to supply 1.3-cm water. Substrate solution was extracted using the
pourthrough (PT) method (Wright, 1986) one week after potting (WAP) and then once

186
per month through October 2006 and analyzed for pH and EC using a Hanna HI 9811
instrument (Hanna Instruments, Woonsocket, RI). Substrate solutions were frozen and
later analyzed for NO3-N with an Orion ion selective electrode (Thermo Electron,
Beverly, MA) on 17 Nov. 2007, and phosphorus (P), and potassium (K) concentrations
on 28 Nov. 2007 with a Spectro Ciros Vision ICP (Spectro Analytical Instrument,
Muhwah, NJ). On 25 April 2007 containers were fertilized (top-dressed) with the same
fertilizer rates mentioned above. Pourthrough’s were conducted each month beginning in
May and ending in September in 2007. Substrate shrinkage (cm) was determined by
measuring the difference in substrate height (from the top of the containers to the
substrate surface) at 1 WAP, and again at 70 WAP. Final measurements (70 WAP) for
shrinkage determination were not made on fallow PB containers at either of the fertilizer
rates and therefore will not be reported in the results.
As a measure of microbial activity in PB and PTS, substrate CO2 efflux levels
were determined as an indicator of the potential for N immobilization to occur (Wang et
al., 2003). Substrate CO2 efflux (μmol CO2.m-2·s-1) was determined 1 WAP followed by
every four weeks through October on six container replications of both substrates, at each
fertilizer rate using a LiCor 6400 infrared gas analyzer (LI-COR, Lincoln, NE) fitted with
a LiCor 6400-09 soil CO2 flux chamber. The soil chamber was designed to take
nondestructive CO2 measurements from the substrate filled containers. The LiCor was
recalibrated before each sampling date and the system was zeroed between treatment
replications. The LiCor target value was set close to the ambient CO2 concentration
(~380 μmol mol-1), and ΔCO2 value was set as the factory default value (10 μmol mol-1;

187
LiCor, 1997). Substrate efflux rates were measured on the same containers and at
approximately the same time of day for each sampling date.
For substrate physical properties and particle size determination, 20-L samples of
all substrates were collected on 5 June 2006 when plants were potted. These substrates
were taken from the same source used to pot this experiment and therefore amended
similarly. Substrate samples were air-dried for two days then bagged and dry-stored for
the duration of the experiment (70 weeks). At 70 WAP, samples from 1) storage, 2)
containers with plants and from 3) fallow containers were prepared for physical property
and particle size determination.
Physical properties including AS, CC, TP, and BD were determined on three
replicate samples of each substrate using the NCSU Porometer method as described by
Fonteno et al. (1995). Particle size distribution of 150 g oven-dried substrate samples
were determined with 14 sieves (ranging from > 6.3-mm to < 0.06-mm) plus a bottom
pan (Table 1). Sieves and pan were shaken for 10 min with a RX-29 Ro-Tap sieve shaker
(278 oscillations min-1, 150 taps min-1; W.S. Tyler, Mentor, OH) and the particle
fractions retained on each sieve and the amount that passed through the smallest sieve
and retained by the sieve pan were weighed.
The experimental design was completely randomized with two substrates, two
planting methods (with and without plants), two fertilizer rates, and six replications per
treatment for a total of 48 containers. Multiple comparison of means at α = 0.05 were
made with Duncan’s Multiple Range Test the analysis of variance (ANOVA) procedures
of SAS (version 9.1 SAS Institute, Inc. Cary, NC). Effect of substrate and fertilizer rate
on substrate efflux were examined by a PROC GLM repeated measures ANOVA in SAS.

188
Results and Discussion
Particle size distribution: initial. Particle sizes were placed into texture groups of
coarse (≥2.0 mm), medium (<2.0 mm to ≥0.5 mm), and fine (<0.5 mm). Pine bark had
the highest percentage of coarse particles (49%) at the beginning of the study (initial)
while PTS had only 5% coarse particles (Table 5.1). Pine tree substrate had higher
percentages of medium (76%) and fine particles (20%) compared to PB (36 and 15%
respectively) initially (Table 5.1).
Particle size distribution: final (data not available on PB in fallow containers so
all 70 WAP data represents PB in containers with plants present). Coarse PB particle
percentage decreased during 70 WAP equally at both high and low fertilizer rates with
plants (Table 5.1). The percentage of medium PB particles did not change during 70
weeks regardless of fertilizer rate (39 and 39%) compared to the initial PB (36%). The
percentages of fine particles in PB with plants were higher than the initial PB (15%) and
equal (20 and 21% respectively) at both fertilizer rates (Table 5.1). The decrease in the
amount of coarse particles and increase in the amount of fine particles is evidence of the
decomposition in PB over the 70 week experiment.
Coarse PTS particle percentage decreased after 70 WAP to the same values at
both high and low fertilizer rates and with or without (fallow) plants (Table 5.1). The
percentage of medium PTS particles did not change from the initial PTS (76%) in fallow
containers regardless of fertilizer rate, but percentages decreased when plants were
present for both fertilizer rates (Table 5.1). The percentage of fine PTS particles did not
change from the initial (20%) in fallow containers regardless of fertilizer rate, but
percentages were higher when plants were present for both fertilizer rates (31 and 32%;
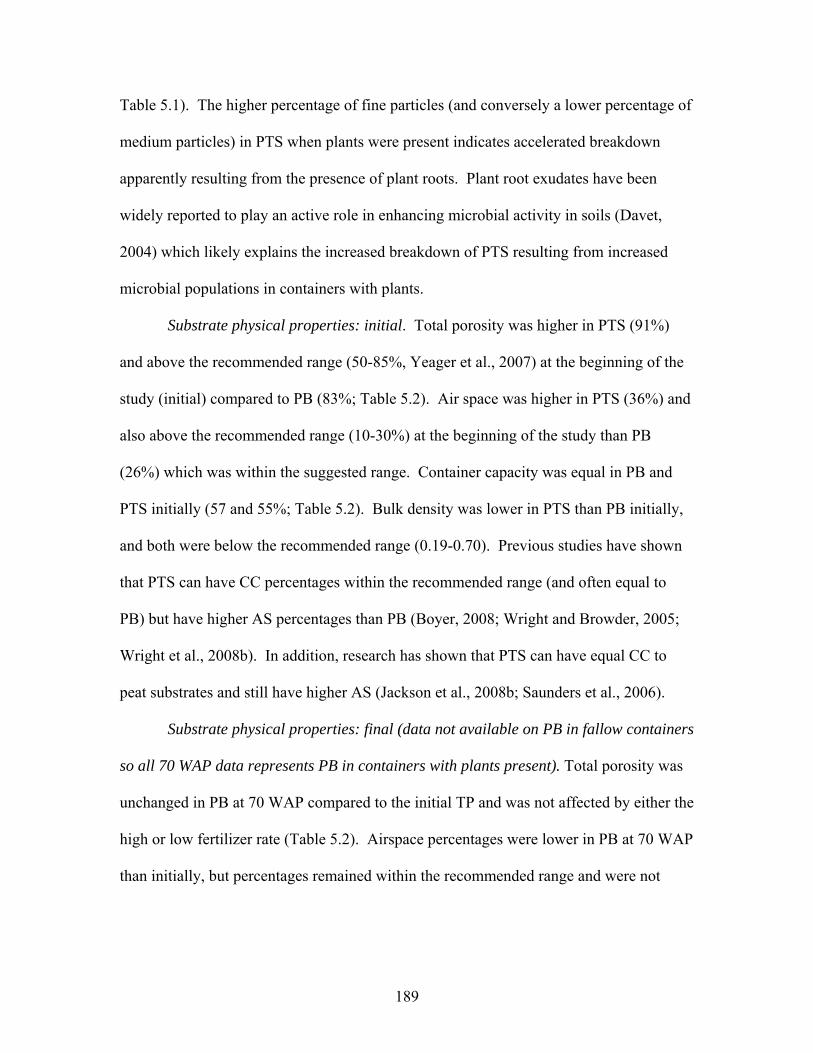
189
Table 5.1). The higher percentage of fine particles (and conversely a lower percentage of
medium particles) in PTS when plants were present indicates accelerated breakdown
apparently resulting from the presence of plant roots. Plant root exudates have been
widely reported to play an active role in enhancing microbial activity in soils (Davet,
2004) which likely explains the increased breakdown of PTS resulting from increased
microbial populations in containers with plants.
Substrate physical properties: initial. Total porosity was higher in PTS (91%)
and above the recommended range (50-85%, Yeager et al., 2007) at the beginning of the
study (initial) compared to PB (83%; Table 5.2). Air space was higher in PTS (36%) and
also above the recommended range (10-30%) at the beginning of the study than PB
(26%) which was within the suggested range. Container capacity was equal in PB and
PTS initially (57 and 55%; Table 5.2). Bulk density was lower in PTS than PB initially,
and both were below the recommended range (0.19-0.70). Previous studies have shown
that PTS can have CC percentages within the recommended range (and often equal to
PB) but have higher AS percentages than PB (Boyer, 2008; Wright and Browder, 2005;
Wright et al., 2008b). In addition, research has shown that PTS can have equal CC to
peat substrates and still have higher AS (Jackson et al., 2008b; Saunders et al., 2006).
Substrate physical properties: final (data not available on PB in fallow containers
so all 70 WAP data represents PB in containers with plants present). Total porosity was
unchanged in PB at 70 WAP compared to the initial TP and was not affected by either the
high or low fertilizer rate (Table 5.2). Airspace percentages were lower in PB at 70 WAP
than initially, but percentages remained within the recommended range and were not
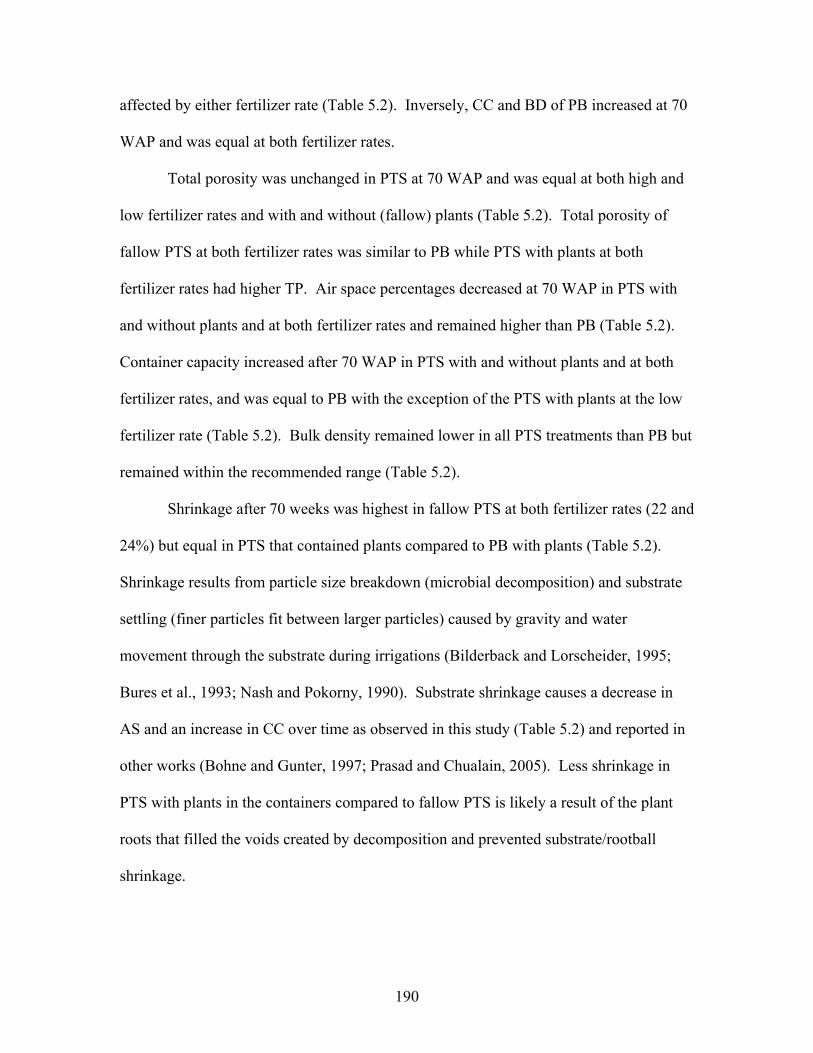
190
affected by either fertilizer rate (Table 5.2). Inversely, CC and BD of PB increased at 70
WAP and was equal at both fertilizer rates.
Total porosity was unchanged in PTS at 70 WAP and was equal at both high and
low fertilizer rates and with and without (fallow) plants (Table 5.2). Total porosity of
fallow PTS at both fertilizer rates was similar to PB while PTS with plants at both
fertilizer rates had higher TP. Air space percentages decreased at 70 WAP in PTS with
and without plants and at both fertilizer rates and remained higher than PB (Table 5.2).
Container capacity increased after 70 WAP in PTS with and without plants and at both
fertilizer rates, and was equal to PB with the exception of the PTS with plants at the low
fertilizer rate (Table 5.2). Bulk density remained lower in all PTS treatments than PB but
remained within the recommended range (Table 5.2).
Shrinkage after 70 weeks was highest in fallow PTS at both fertilizer rates (22 and
24%) but equal in PTS that contained plants compared to PB with plants (Table 5.2).
Shrinkage results from particle size breakdown (microbial decomposition) and substrate
settling (finer particles fit between larger particles) caused by gravity and water
movement through the substrate during irrigations (Bilderback and Lorscheider, 1995;
Bures et al., 1993; Nash and Pokorny, 1990). Substrate shrinkage causes a decrease in
AS and an increase in CC over time as observed in this study (Table 5.2) and reported in
other works (Bohne and Gunter, 1997; Prasad and Chualain, 2005). Less shrinkage in
PTS with plants in the containers compared to fallow PTS is likely a result of the plant
roots that filled the voids created by decomposition and prevented substrate/rootball
shrinkage.
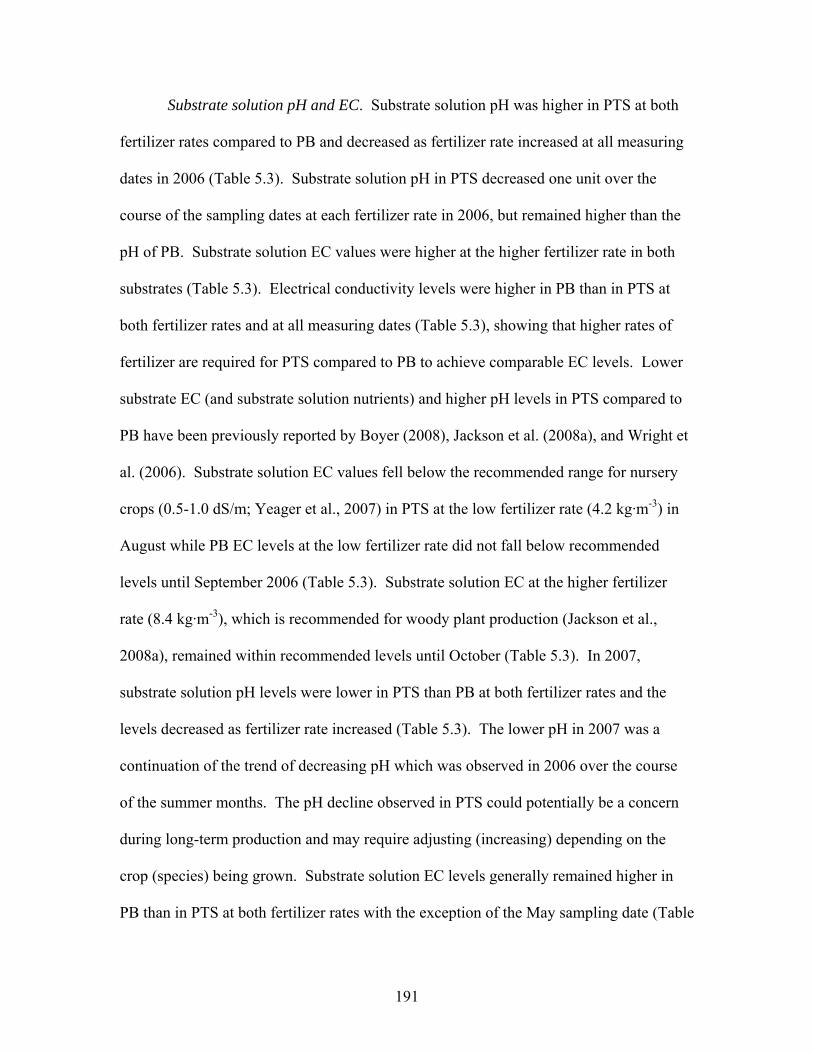
191
Substrate solution pH and EC. Substrate solution pH was higher in PTS at both
fertilizer rates compared to PB and decreased as fertilizer rate increased at all measuring
dates in 2006 (Table 5.3). Substrate solution pH in PTS decreased one unit over the
course of the sampling dates at each fertilizer rate in 2006, but remained higher than the
pH of PB. Substrate solution EC values were higher at the higher fertilizer rate in both
substrates (Table 5.3). Electrical conductivity levels were higher in PB than in PTS at
both fertilizer rates and at all measuring dates (Table 5.3), showing that higher rates of
fertilizer are required for PTS compared to PB to achieve comparable EC levels. Lower
substrate EC (and substrate solution nutrients) and higher pH levels in PTS compared to
PB have been previously reported by Boyer (2008), Jackson et al. (2008a), and Wright et
al. (2006). Substrate solution EC values fell below the recommended range for nursery
crops (0.5-1.0 dS/m; Yeager et al., 2007) in PTS at the low fertilizer rate (4.2 kg·m-3) in
August while PB EC levels at the low fertilizer rate did not fall below recommended
levels until September 2006 (Table 5.3). Substrate solution EC at the higher fertilizer
rate (8.4 kg·m-3), which is recommended for woody plant production (Jackson et al.,
2008a), remained within recommended levels until October (Table 5.3). In 2007,
substrate solution pH levels were lower in PTS than PB at both fertilizer rates and the
levels decreased as fertilizer rate increased (Table 5.3). The lower pH in 2007 was a
continuation of the trend of decreasing pH which was observed in 2006 over the course
of the summer months. The pH decline observed in PTS could potentially be a concern
during long-term production and may require adjusting (increasing) depending on the
crop (species) being grown. Substrate solution EC levels generally remained higher in
PB than in PTS at both fertilizer rates with the exception of the May sampling date (Table
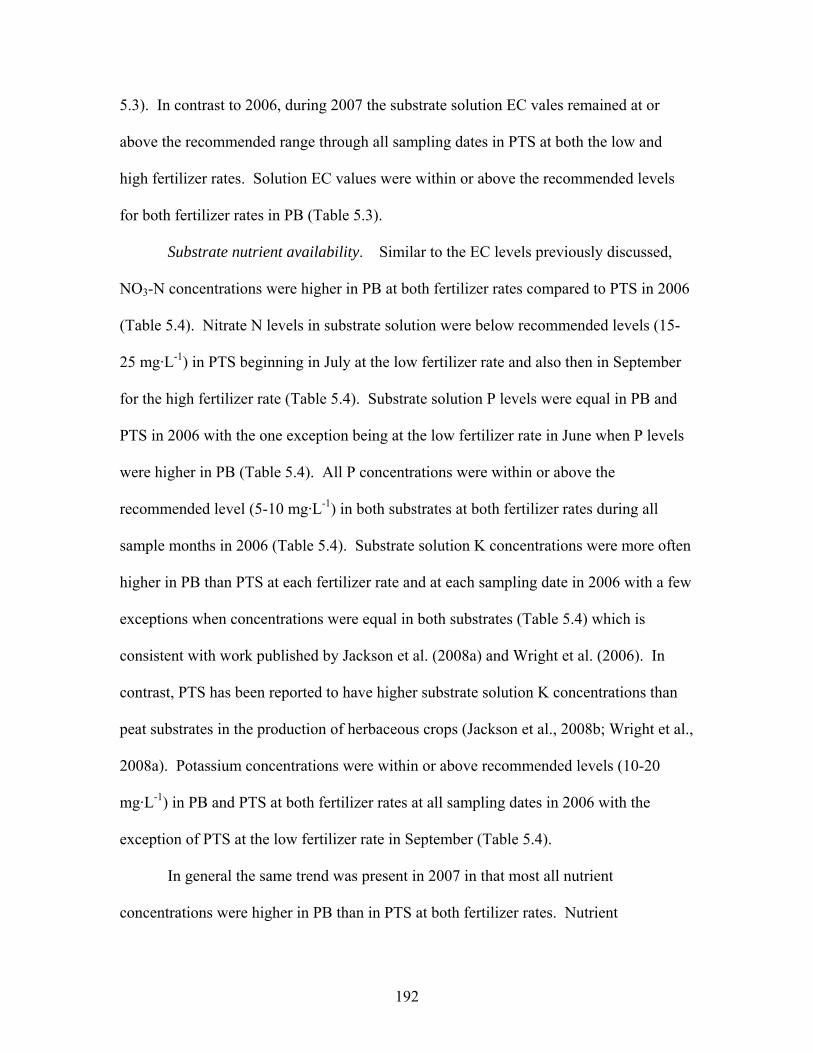
192
5.3). In contrast to 2006, during 2007 the substrate solution EC vales remained at or
above the recommended range through all sampling dates in PTS at both the low and
high fertilizer rates. Solution EC values were within or above the recommended levels
for both fertilizer rates in PB (Table 5.3).
Substrate nutrient availability. Similar to the EC levels previously discussed,
NO3-N concentrations were higher in PB at both fertilizer rates compared to PTS in 2006
(Table 5.4). Nitrate N levels in substrate solution were below recommended levels (15-
25 mg·L-1) in PTS beginning in July at the low fertilizer rate and also then in September
for the high fertilizer rate (Table 5.4). Substrate solution P levels were equal in PB and
PTS in 2006 with the one exception being at the low fertilizer rate in June when P levels
were higher in PB (Table 5.4). All P concentrations were within or above the
recommended level (5-10 mg·L-1) in both substrates at both fertilizer rates during all
sample months in 2006 (Table 5.4). Substrate solution K concentrations were more often
higher in PB than PTS at each fertilizer rate and at each sampling date in 2006 with a few
exceptions when concentrations were equal in both substrates (Table 5.4) which is
consistent with work published by Jackson et al. (2008a) and Wright et al. (2006). In
contrast, PTS has been reported to have higher substrate solution K concentrations than
peat substrates in the production of herbaceous crops (Jackson et al., 2008b; Wright et al.,
2008a). Potassium concentrations were within or above recommended levels (10-20
mg·L-1) in PB and PTS at both fertilizer rates at all sampling dates in 2006 with the
exception of PTS at the low fertilizer rate in September (Table 5.4).
In general the same trend was present in 2007 in that most all nutrient
concentrations were higher in PB than in PTS at both fertilizer rates. Nutrient

193
concentrations in both substrates at both fertilizer rates were within or above
recommended ranges (as shown above) in 2007 with the exception of the low fertilizer
rate for both PB and PTS which both fell below the range in August and September
which was also observed in 2006 (Table 5.5).
Lower substrate solution NO3-N concentrations in PTS compared to PB over two
growing seasons indicates that NO3-N is likely being immobilized in the container
substrate and not excessively leaching (in irrigation runoff) as once hypothesized by these
authors (Brian Jackson and Robert Wright) as a reason for lower substrate solution EC
levels in PTS even when applying high rates of fertilizer. Jackson and Wright (2007 and
2008) have reported increased microbial activity and higher rates of N immobilization in
PTS compared to PB and peat. The reason for generally lower substrate solution P
concentrations in PTS could likely be a result of microbial immobilization of P which
occurs in wood-based substrates (Handreck, 1996) thus reducing the amount of soluble P
in substrate solution.
Substrate CO2 efflux. Substrate CO2 efflux was higher in PTS than in PB at both
fertilizer rates and at each measurement date in 2006 (Table 5.6). Similar to this data,
higher substrate CO2 efflux has been previously reported in PTS compared to PB during
crop production (Jackson and Wright, 2007; Jackson et al., 2008a). Substrate CO2 efflux
was lower at the higher fertilizer rate in both substrates at each measuring date (Table
5.6) which has been previously reported in PTS by Jackson et al. (2008a). Substrate CO2
efflux levels decreased through the summer measuring dates but remained higher in PTS
than in PB even though the magnitude of difference was less by October (Table 5.6).
Results were similar in 2007 with substrate CO2 efflux remaining higher in PTS than in
194
PB at both fertilizer rates, but the CO2 efflux levels were noticeably lower in 2007 than in
2006 (Table 5.6) indicating lower microbial activity possibly a result of less
decomposition of the more stable year old substrates. The reduction in microbial
respiration rates that we observed in response to increasing fertilizer rate is supported by
several previous reports showing both long-term and short-term reductions in microbial
activity following fertilization (Gough and Seiler, 2004; Thirukkumaran and Parkinson,
2000). One possible explanation for this response could be that increased salt
concentration in the substrate may modify the microflora populations or reduce their
activity (Allison, 1965).
Conclusions
This study demonstrates that PTS does decompose in containers under fertilized
outdoor nursery conditions as indicated by a reduction in substrate particle size and
greater substrate shrinkage in fallow PTS containers over time. The reduction in particle
size changed the physical properties (AS and CC) of PTS based on analysis conducted
after 70 weeks, but like PB, the structure (physical properties) of PTS remained desirable
for plant growth. Substrate shrinkage in PTS is significant and would be a major concern
if not for the plant roots that apparently filled the voids caused by decomposition
allowing the rootball to stay intact just as rootballs of plants grown in PB. Despite the
decomposition, this study illustrates that the stability of PTS for two growing seasons (70
weeks) is sufficient for desirable plant growth. For longer-term production (more than 70
weeks), production in larger containers, or production in warmer and wetter climates that
may facilitate quicker decomposition of PTS, it may be possible to extend the stability

195
(and minimize decomposition) by utilizing a coarser PTS (i.e., 16.0-mm up to 2.5-cm
particles) produced with larger hammer-mill screens which can then be amended with
PB, sand, or other fine particle material to achieve the desired AS and WHC (Wright et
al., 2008b).
The decrease in pH of PTS that was observed in this study may warrant pH
adjustments, depending on the crop being grown. Currently the pH of PTS produced
from fresh (recently harvested) pine wood is not adjusted (i.e., dolomitic lime additions)
as a result of the desirable pH levels observed in short-term crop production, but based on
results from this study, recommendations to increase the pH of PTS for long-term crop
production may be needed. The lower substrate solution EC levels reported in PTS at the
end of the summer (2006) also deserve close attention when using PTS, so that
supplemental fertilizer applications (often supplied as a liquid fertilizer drench) can be
made in the late summer or fall to ensure adequate nutrient levels during that time.
Further work is needed to assess the actual in-container physical properties of
PTS during crop production. Determining substrate physical properties without
altering/disturbing the density or geometry of the substrate in containers will be more
informative of the conditions experienced by plants during production. In this present
work the substrate was removed from containers and evaluated for physical properties.
As briefly mentioned above, future work should evaluate PTS in other regions of the
country with various temperatures, growing season length, rainfall, etc. that are different
from Blacksburg VA, to determine an appropriate management strategy for utilizing PTS
for nursery crop production in other areas.

196
Literature Cited
Aaron, J.R. 1982. Conifer bark: its properties and uses. Forest Commun. Forest Rec. 110.
Allaire-Leung, S.E., J. Caron, and L.E. Parent. 1999. Changes in physical properties of
peat substrates during plant growth. Can. J. Soil Sci.79:137-139.
Allison, F.E. 1965. Decomposition of wood and bark sawdusts in soil, nitrogen
requirements, and effects on plants. US. Dept. Agr. Tech. Bull. No. 1332, 58 pp.
Bilderback, T.E. and M.R. Lorscheider. 1995. Physical Properties of double-processed
pine bark: effects on rooting. Acta Hort. 401:77-83.
Bilderback, T.E., Warren, S.L., Owen, Jr. J.S. and Albano, J.P. 2005. Healthy
substrates need physicals too! HortTechnology 15:747-751.
Bodman, K. and K.V. Sharman. 1993. Container media management. Queensland DPI,
Queensland Nursery Industry Association, Brisbane, Australia. 40 p.
Bohne, H. and C. Gunther. 1997. Physical properties of peat determined with different
methods. Acta Hort. 450:271-276.
Bohne, H. 2004. Growth of nursery crops in peat-reduced and in peat-free substrates.
Acta Hort. 644:103-106.
197
Bollen, W.B. and D.W. Glennie. 1961. Sawdust, bark, and other wood wastes for soil
conditioning and mulching. Forest Prod. J. 11:38-46.
Boyer, C.R. 2008. Evaluation of clean chip residual as an alternative substrate for
container-grown plants. Dissertation, Auburn University, Auburn, AL, 188p.
Boyer, C.R., G.B. Fain, C.H. Gilliam, T.V. Gallagher, H.A. Torbert, and J.L. Sibley.
2008. Clean chip residual: a substrate component for growing annuals. HortTechnology
18:423-432.
Broschat, T.K. 1995. Nitrate, phosphate, and potassium leaching from container-grown
plants fertilized by several methods. HortScience 30:74-77.
Brown, O.D.R. and E.R. Emino. 1981. Response of container-grown plants to six
consumer growing media. HortScience 16:78-80.
Bruckner, U. 1997. Physical properties of different potting media and substrate mixtures-
especially air-and water capacity. Acta Hort. 450:263-270.
Bugbee, G.J. and G.C. Elliott. 1998. Leaching of nitrogen and phosphorus from potting
media containing biosolids compost as affected by organic and clay amendments. Bull.
Environ. Contam. Toxicol. 60:716-723.

198
Bures, S, F.A. Pokorny, D.P. Landau, M.A. Farmer, and A.M. Ferrenberg. 1993.
Shrinkage, porosity characterization, and computer simulation of horticultural substrates.
Acta Hort. 342:229-234.
Davet, P. 2004. Microbial ecology of the soil and plant growth. Scientific Publishing,
Enfield, NH.
Ding, W., Y. Cai, Z. Cai, K. Yagi, and X. Zheng. 2007. Soil respiration under maize
crops: effect of water, temperature, and nitrogen fertilization. Soil Sci. Soc. Amer. J.
71:944-951.
Drzal, M.S., W.C. Fonteno, and K.D. Cassel. 1999. Pore fraction analysis: a new tool for
substrate testing. Acta Hort. 481:43-54.
Environmental Protection Agency, 2006. National Primary Drinking Water Regulations.
http://www.epa.gov/safewater/dwh/c-ioc/nitrates.html Washington, D.C.
Fain, G.B., C.H. Gilliam, J.L. Sibley, and C.R. Boyer. 2008a. Wholetree substrates
derived from three species of pine in production of annual vinca. HortTechnology
18:13-17.

199
Fain, G.B., C.H. Gilliam, J.L. Sibley, and C.R. Boyer, A.L. Walker. 2008b. Wholetree
substrate and fertilizer rate in production of greenhouse-grown petunia (Petunia xhybrida
Vilm.) and marigold (Tagetes patula L.). HortScience 43:700-705.
Fischer, P., E. Meinken, and F. Kalthoff. 1993. Holzfaserstoffe im test. (Woodfibre in
test) Gärtnerbörse Gartenwelt 26:1220-1222.
Fog, K. 1988. The effect of added nitrogen on the rate of decomposition or organic
matter. Biol. Rev. 63:433-462.
Fonteno, W.C., C.T. Hardin, and J.P. Brewster. 1995. Procedures for determining
physical properties of horticultural substrates using the NCSU Porometer. Horticultural
Substrates Laboratory. North Carolina State University.
Gagnon, B. and R.R. Simard. 1999. Nitrogen and phosphorus release from on-farm and
industrial composts. Canadian J. Soil Sci. 79:481-489.
Gough, C.M. and J.R. Seiler. 2004. Belowground carbon dynamics in loblolly pine
(Pinus taeda) immediately following diammonium phosphate fertilization. Tree Physiol.
24:845-851.

200
Handreck, K.A. 1992a. Rapid assessment of the rate of nitrogen immobilization in
organic components of potting media. I. method development. Commun. Soil Sci. Plant
Anal. 23:201-215.
Handreck, K.A. 1992b. Rapid assessment of the rate of nitrogen immobilization in
organic components of potting media. II. nitrogen drawdown index and plant growth.
Commun. Soil Sci. Plant Anal. 23:217-230.
Handreck, K.A. 1996. Phosphorus immobilization in wood waste-based potting media.
Commun. Soil Sci. Plant Anal. 27:2295-2314.
Hart, M.R., B.F. Quin, and M. L. Nguyen. 2004. Phosphorus runoff from agricultural
land and direct fertilizer effects: a review. J. Environ. Qual. 33:1954-1972.
Hoitink, H.A. and H.A. Poole. 1979. Mass production of composted tree barks for
container media. Ohio Flor. Assn. Bull. No. 599:3-4.
Jackson, B.E. and R.D. Wright. 2007. Pine tree substrate: fertility requirements. Proc.
Southern Nursery Assoc. Research Conf. 52:58-61.
Jackson, B.E. 2008. Chemical, physical, and biological factors influencing nutrient
availability and plant growth in a pine tree substrate. Virginia Polytechnic Institute &
State Univ., Blacksburg, VA. PhD Diss.
201
Jackson, B.E. and R.D. Wright. 2008. Pine tree substrate: An alternative and renewable
growing media for horticulture crop production. Acta Hort. (In press).
Jackson, B.E., R.D. Wright, J.F. Browder, J.R. Harris, and A.X. Niemiera. 2008a. Effect
of fertilizer rate on growth of azalea and holly in pine bark and pine tree substrates.
HortScience 43:1561-1568.
Jackson, B.E., R.D. Wright, and M.C. Barnes. 2008b. Pine tree substrate, nitrogen rate,
particle size, and peat amendment affects poinsettia growth and substrate physical
properties. HortScience (In press).
Kenna, S.W. and C.E. Whitcomb. 1985. Hardwood chips as an alternative medium for
container plant production. HortScience 20:867-869.
Laiche, Jr. A.J. and V.E. Nash. 1986. Evaluation of pine bark, pine bark with wood, and
pine tree chips as components of a container plant growing media. J. Environ. Hort.
4:22-25.
Lemaire, F., A. Dartigues, and L.M. Riviere. 1989. Physical and chemical characteristics
of ligno-cellulosic material. Acta Hort. 238:9-15.

202
Lemaire, F. 1995. Physical, chemical, and biological properties of growing medium. Acta
Hort. 396:273-284.
LiCor. 1997. 6400-09 Soil CO2 flux chamber instruction manual. LiCor, Lincoln, NE,
U.S.A.
Maas, E.F. and R.M. Adamson. 1972. Resistance of sawdusts, peats, and bark to
decomposition in the presence of soil and nutrient solution. Soil Sci. Soc. Amer. Proc.
36:769-772.
Meinken, E. and P. Fischer. 1997. Sackungsverhalten von Holzfasern. Gärtnerbörse
9:494-496.
Nash, V.E. and A.J. Laiche. 1981. Changes in the characteristics of potting media with
time. Commun. Soil Sci. Plant Anal. 12:1011-1020.
Nash, M.A. and F.A. Pokorny. 1990. Shrinkage of selected two-component container
media. HortScience 25:930-931.
Prasad, M. and D.N. Chualain. 2005. Relationship between particle size and air space of
growing media. Acta Hort. 648:161-166.
203
Pronk, A.A. 1997. Laboratory investigations of nitrogen can carbon dioxide release of
peat and peat-compost media. Acta Hort. 450:245-252.
Richards, D., M. Lane, and D.V. Beardsell. 1986. The influence of particle-size
distribution in pinebark:sand:brown coal potting mixes on water supply, aeration, and
plant growth. Scientia Hort. 29:1-14.
Riviere, L.M. and C. Milhau. 1983. The use of wood waste composts in the making of
substrates for container crops. Acta Hort. 150:475-489.
Saunders, T., J.F. Browder, B.E. Jackson, and R.D. Wright. 2006. Particle size of a pine
chips substrate affects plant growth. Proc. Southern Nursery Assoc. Research Conf.
51:46-48.
Saunders, T.N., R.D. Wright, and J.F. Browder. 2005. Chipped pine logs: a potential
substrate for nursery and greenhouse crops. Proc. Southern Nursery Assn. Res. Conf.
50:112-114.
Sharman, K.V. and K. Bodman. 1991. Wood wastes affect fertilizer performance. Aust.
Hort. 89:30-32.

204
Thirukkumaran, C.M. and D. Parkinson. 2000. Microbial respiration, biomass, metabolic
quotient and litter decomposition in a lodgepole pine forest amended with nitrogen and
phosphorus fertilizers. Soil Biol. Biochem. 32:59-66.
Wang, W.J., R.C. Dalal, P.W. Moody, and C.J. Smith. 2003. Relationships of soil
respiration to microbial biomass, substrate availability and clay content. Soil Biol.
Biochem. 35:273-284.
Wang, W.J., Y.G. Zu, H.M. Wang, T. Hirano, K. Takagi, K. Sasa, and T. Koike. 2005.
Effect of collar insertion on soil respiration in a larch forest measured with a LI-6400 soil
CO2 flux system. J. For. Res. 10:57-60.
Wright, R.D. 1986. The pour-through nutrient extraction method procedure. HortScience
21:227-229.
Wright, R.D. and J.F. Browder. 2005. Chipped pine logs: A potential substrate for
greenhouse and nursery crops. HortScience 40:1513-1515.
Wright, R.D., J.F. Browder, and B.E. Jackson. 2006. Ground pine chips as a substrate for
container-grown woody nursery crops. J. Environ. Hort. 24:181-184.

205
Wright, R.D., B.E. Jackson, J.F. Browder, and J.G. Latimer. 2008a. Growth of
chrysanthemum in ground pine trees requires additional fertilizer. HortTechnology
18:111-115.
Wright, R.D., B.E. Jackson, and M.C. Barnes. 2008b. Pine tree substrate construction for
optimal water holding capacity and air space. Proc. Southern Nursery Assoc. Research
Conf. 53:52-54.
Yeager, T.H. and R.D. Wright. 1982. Phosphorus requirement of Ilex crenata Thumb.
Cv. Helleri grown in a pine bark medium. J. Amer. Soc. Hort. Sci. 107-558-562.
Yeager, T.H., R.D. Wright, D. Fare, C.H. Gilliam, J.R. Johnson, T.E. Bilderback, and R.
Zondag. 1993. Six state survey of container nursery nitrate nitrogen runoff. J. Environ.
Hort. 11:206-208.
Yeager, T.H., D.C. Fare, J. Lea-Cox, J.Ruter, T.E. Bilderback, C.H. Gilliam, A.X.
Niemiera, S.L. Warren, T.E. Whitwell, R.D. Wright, and K.M. Tilt. 2007. 2nd Ed. Best
management practices: guide for producing container-grown plants. Southern
Nurserymen’s Assoc., Marietta, GA.

206
Table 5.1. Particle size distribution of pine bark (PB) and pine tree substrates (PTS) initially (at potting) and at 70 weeks after potting (WAP) in containers with plants when fertilized with 4.2 (L) or 8.4 (H) kg·m-3 of Osmocote Plus 15N-3.9P-10K) and maintained under outdoor nursery conditionsz. Data are also reported for PTS in fallow containers at 70 WAP. Particle size distribution (%)z
0 WAP 70 WAP Initial Fallow Containers with plants Sieve (mm)y PB PTSx PTS-L PTS-H PB-L PB-H PTS-L PTS-H >6.3 10.5 0.1 0.0 0.2 5.6 6.7 0.0 0.0 6.3-4.8 8.3 1.0 0.0 0.0 6.4 8.0 0.0 0.0 4.8-2.4 25.5 1.4 0.7 1.5 23.9 20.4 1.0 1.7 2.4-2.0 4.9 2.6 1.4 0.7 5.6 5.5 1.6 0.6 2.0-1.4 10.9 10.4 16.1 16.2 12.3 8.7 12.3 22.3 1.4-1.0 8.8 24.4 23.3 28.0 8.2 10.3 22.0 25.6 1.0-0.71 8.4 25.0 23.2 19.8 9.2 10.4 20.0 13.2 0.71-0.5 7.7 15.8 10.1 7.1 8.8 9.5 12.0 6.7 0.5-0.36 3.3 6.3 9.6 11.0 4.8 4.6 14.6 11.3 0.36-0.25 3.5 4.4 4.5 4.4 2.8 4.5 6.2 4.9 0.25-0.18 3.6 3.3 4.5 5.9 2.4 2.3 4.5 6.9 0.18-0.13 1.6 3.3 2.7 2.7 4.7 3.8 2.8 2.7 0.13-0.09 1.3 1.4 2.4 1.3 3.2 2.0 1.4 1.7 0.09-0.063 0.7 0.7 1.3 1.3 1.2 2.6 1.2 1.9 <0.063 1.2 0.1 0.5 0.2 1.0 0.9 0.3 0.5 Texturew Coarse 49.2 av 5.0 c 2.2 d 2.4 d 41.6 b 40.6 b 2.6 d 2.3 d Medium 35.7 c 75.5 a 72.4 a 71.0 a 38.5 c 38.8 c 66.3 b 65.8 b Fine 15.2 d 19.5 c 25.4 b 26.7 b 20.5 c 20.6 c 31.1 a 31.9 a zDry weight basis; Values are means of three air-dried samples. y1 mm = 0.0394 inch. xPTS produced from 12-year-old loblolly pine trees harvested at ground level, delimbed, chipped, and hammer-milled to pass through 4.76-mm screen. wTexture grouping: coarse = >2.0 mm; medium = >0.5 - <2.0 mm; fine = <0.5 mm. vMeans within a row followed by the same letter are not significantly different based on Duncan’s multiple range test (P ≤ 0.05, n = 3).

207
Table 5.2. Physical properties of pine bark (PB) and pine tree substrates (PTS) initially (at potting) and at 70 weeks after potting (WAP) in containers with plants when fertilized with 4.2 (L) and 8.4 (H) kg·m-3 of Osmocote Plus 15N-3.9P-10K) and maintained under outdoor nursery conditionsz. Data are also reported for PTS in fallow containers at 70 WAP. Substrates
Total porosityy
(% vol)
Air spacex
(% vol)
Container capacityw
(% vol)
Bulk densityv (g·cm-3)
Substrate shrinkageu
(%) Initial PB initial 83.2 bt 26.4 c 56.8 c 0.18 b - PTS initials 91.2 a 35.9 a 55.3 c 0.14 d - 70 WAP PB-L w/ plant 83.3 b 19.7 d 63.6 a 0.21 a 16.3 b PB-H w/ plant 83.8 b 20.9 d 62.9 a 0.22 a 16.7 b PTS-L w/ plant 89.2 a 29.3 b 59.9 b 0.16 c 17.4 b PTS-H w/ plant 90.9 a 27.4 bc 63.5 a 0.16 c 16.8 b PTS-L fallow 87.5 ab 26.0 c 61.5 a 0.17 bc 22.3 a PTS-H fallow 86.1 ab 25.1 c 61.0 ab 0.18 b 24.4 a Ranger 50-85 10-30 45-65 0.19-0.70 - zData were collected from three samples per substrate and represented as means. Analysis performed using the North Carolina State University Porometer method (Fonteno et al., 1995). yTotal porosity is equal to container capacity + air space. xAir space is the volume of water drained from the sample ÷ volume of the sample. wContainer capacity is (wet weight – oven dry weight) ÷ volume of the sample. vBulk density after forced-air drying at 105 °C for 48 h. uShrinkage = substrate height in container at 1 week after potting (WAP) - substrate height at 70 WAP. tMeans separated within columns using Duncan’s multiple range test, P ≤ 0.05 (n = 3). sPTS produced from 12-year-old loblolly pine trees harvested at ground level, delimbed, chipped, and hammer-milled to pass through a 4.76-mm screen. rSuggested range for container substrates = Best Management Practices recommended sufficiency ranges for physical properties of substrates used in general container production (Yeager et al., 2007).
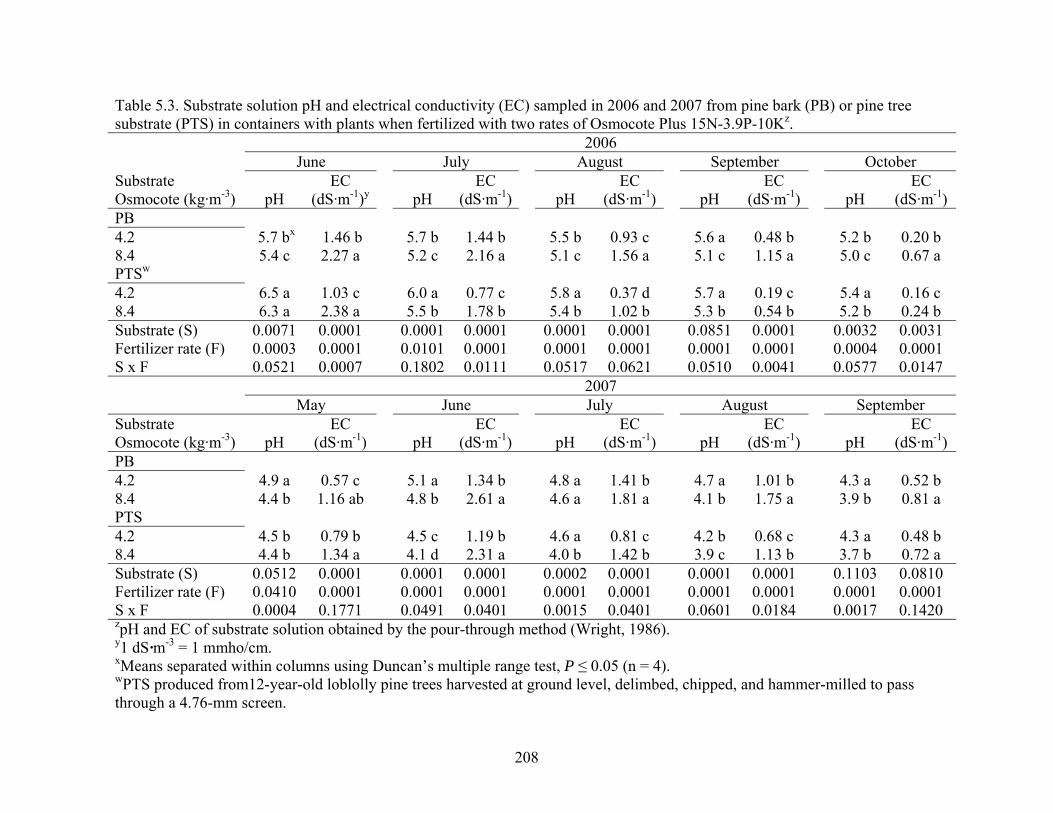
208
Table 5.3. Substrate solution pH and electrical conductivity (EC) sampled in 2006 and 2007 from pine bark (PB) or pine tree substrate (PTS) in containers with plants when fertilized with two rates of Osmocote Plus 15N-3.9P-10Kz. 2006 June July August September October Substrate Osmocote (kg·m-3)
pH
EC (dS·m-1)y
pH
EC (dS·m-1)
pH
EC (dS·m-1)
pH
EC (dS·m-1)
pH
EC (dS·m-1)
PB 4.2 5.7 bx 1.46 b 5.7 b 1.44 b 5.5 b 0.93 c 5.6 a 0.48 b 5.2 b 0.20 b 8.4 5.4 c 2.27 a 5.2 c 2.16 a 5.1 c 1.56 a 5.1 c 1.15 a 5.0 c 0.67 a PTSw 4.2 6.5 a 1.03 c 6.0 a 0.77 c 5.8 a 0.37 d 5.7 a 0.19 c 5.4 a 0.16 c 8.4 6.3 a 2.38 a 5.5 b 1.78 b 5.4 b 1.02 b 5.3 b 0.54 b 5.2 b 0.24 b Substrate (S) 0.0071 0.0001 0.0001 0.0001 0.0001 0.0001 0.0851 0.0001 0.0032 0.0031 Fertilizer rate (F) 0.0003 0.0001 0.0101 0.0001 0.0001 0.0001 0.0001 0.0001 0.0004 0.0001 S x F 0.0521 0.0007 0.1802 0.0111 0.0517 0.0621 0.0510 0.0041 0.0577 0.0147 2007 May June July August September Substrate Osmocote (kg·m-3)
pH
EC (dS·m-1)
pH
EC (dS·m-1)
pH
EC (dS·m-1)
pH
EC (dS·m-1)
pH
EC (dS·m-1)
PB 4.2 4.9 a 0.57 c 5.1 a 1.34 b 4.8 a 1.41 b 4.7 a 1.01 b 4.3 a 0.52 b 8.4 4.4 b 1.16 ab 4.8 b 2.61 a 4.6 a 1.81 a 4.1 b 1.75 a 3.9 b 0.81 a PTS 4.2 4.5 b 0.79 b 4.5 c 1.19 b 4.6 a 0.81 c 4.2 b 0.68 c 4.3 a 0.48 b 8.4 4.4 b 1.34 a 4.1 d 2.31 a 4.0 b 1.42 b 3.9 c 1.13 b 3.7 b 0.72 a Substrate (S) 0.0512 0.0001 0.0001 0.0001 0.0002 0.0001 0.0001 0.0001 0.1103 0.0810 Fertilizer rate (F) 0.0410 0.0001 0.0001 0.0001 0.0001 0.0001 0.0001 0.0001 0.0001 0.0001 S x F 0.0004 0.1771 0.0491 0.0401 0.0015 0.0401 0.0601 0.0184 0.0017 0.1420 zpH and EC of substrate solution obtained by the pour-through method (Wright, 1986). y1 dS·m-3 = 1 mmho/cm. xMeans separated within columns using Duncan’s multiple range test, P ≤ 0.05 (n = 4). wPTS produced from12-year-old loblolly pine trees harvested at ground level, delimbed, chipped, and hammer-milled to pass through a 4.76-mm screen.

209
Table 5.4. Substrate solution concentrations of nitrate nitrogen (NO3-N ), phosphorus (P), and potassium (K) collected in 2006 from pine bark (PB) or pine tree substrate (PTS) in containers with plants when fertilized with two rates of Osmocote Plus 15N-3.9P-10Kz. Substrate NO3-N (mg·L-1)y Osmocote (kg·m-3) June July August September October PB 4.2 46.3 bx 26.3 c 15.2 b 2.2 c 2.1 b 8.4 93.3 a 81.8 a 28.1 a 22.8 a 9.0 a PTSw 4.2 18.3 c 8.3 d 3.4 c 0.9 c 1.0 b 8.4 63.8 b 41.3 b 15.4 b 12.8 b 1.2 b Substrate (S) 0.0001 0.0001 0.0001 0.0041 0.4122 Fertilizer rate (F) 0.0001 0.0001 0.0001 0.0001 0.0010 S x F 0.0810 0.0261 0.1602 0.0120 0.0081 Substrate P (mg·L-1) Osmocote (kg·m-3) June July August September October PB 4.2 35.6 b 34.7 b 6.9 b 5.8 b 5.0 ab 8.4 68.5 a 88.1 a 18.2 a 17.5 a 7.1 a PTS 4.2 18.3 c 21.7 b 5.6 b 8.9 b 5.2 a 8.4 52.6 a 62.8 a 13.2 a 17.9 a 6.4 a Substrate (S) 0.0001 0.0001 0.0811 0.0400 0.0551 Fertilizer rate (F) 0.0001 0.0021 0.0001 0.0000 0.0120 S x F 0.1945 0.0371 0.0521 0.0254 0.1200 Substrate K (mg·L-1) Osmocote (kg·m-3) June July August September October PB 4.2 106.8 c 107.0 c 61.4 b 20.8 b 15.5 b 8.4 203.9 a 244.8 a 108.1 a 48.3 a 31.7 a PTS 4.2 95.5 c 78.9 d 18.3 c 9.2 c 11.4 b 8.4 166.3 b 153.2 b 49.5 b 37.3 a 26.4 a Substrate (S) 0.0001 0.0003 0.0011 0.0001 0.0020 Fertilizer rate (F) 0.0001 0.0001 0.0001 0.0001 0.0001 S x F 0.0011 0.0071 0.0212 0.1901 0.2501 zpH and EC of substrate solution obtained by the pour-through method (Wright, 1986). y1 mg·L-1 = 1 ppm. xMeans separated within columns by nutrient using Duncan’s multiple range test, P ≤ 0.05 (n = 4). wPTS produced from12-year-old loblolly pine trees harvested at ground level, delimbed, chipped, and hammer-milled to pass through a 4.76-mm screen.
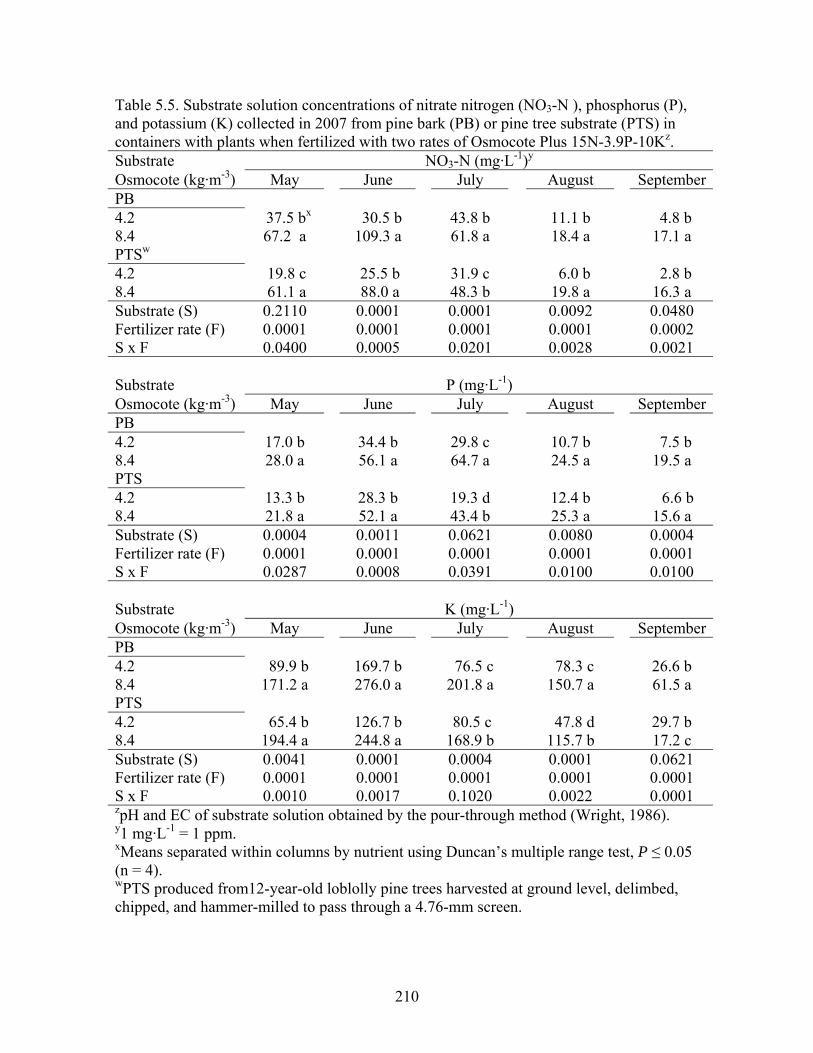
210
Table 5.5. Substrate solution concentrations of nitrate nitrogen (NO3-N ), phosphorus (P), and potassium (K) collected in 2007 from pine bark (PB) or pine tree substrate (PTS) in containers with plants when fertilized with two rates of Osmocote Plus 15N-3.9P-10Kz. Substrate NO3-N (mg·L-1)y Osmocote (kg·m-3) May June July August SeptemberPB 4.2 37.5 bx 30.5 b 43.8 b 11.1 b 4.8 b 8.4 67.2 a 109.3 a 61.8 a 18.4 a 17.1 a PTSw 4.2 19.8 c 25.5 b 31.9 c 6.0 b 2.8 b 8.4 61.1 a 88.0 a 48.3 b 19.8 a 16.3 a Substrate (S) 0.2110 0.0001 0.0001 0.0092 0.0480 Fertilizer rate (F) 0.0001 0.0001 0.0001 0.0001 0.0002 S x F 0.0400 0.0005 0.0201 0.0028 0.0021 Substrate P (mg·L-1) Osmocote (kg·m-3) May June July August SeptemberPB 4.2 17.0 b 34.4 b 29.8 c 10.7 b 7.5 b 8.4 28.0 a 56.1 a 64.7 a 24.5 a 19.5 a PTS 4.2 13.3 b 28.3 b 19.3 d 12.4 b 6.6 b 8.4 21.8 a 52.1 a 43.4 b 25.3 a 15.6 a Substrate (S) 0.0004 0.0011 0.0621 0.0080 0.0004 Fertilizer rate (F) 0.0001 0.0001 0.0001 0.0001 0.0001 S x F 0.0287 0.0008 0.0391 0.0100 0.0100 Substrate K (mg·L-1) Osmocote (kg·m-3) May June July August SeptemberPB 4.2 89.9 b 169.7 b 76.5 c 78.3 c 26.6 b 8.4 171.2 a 276.0 a 201.8 a 150.7 a 61.5 a PTS 4.2 65.4 b 126.7 b 80.5 c 47.8 d 29.7 b 8.4 194.4 a 244.8 a 168.9 b 115.7 b 17.2 c Substrate (S) 0.0041 0.0001 0.0004 0.0001 0.0621 Fertilizer rate (F) 0.0001 0.0001 0.0001 0.0001 0.0001 S x F 0.0010 0.0017 0.1020 0.0022 0.0001 zpH and EC of substrate solution obtained by the pour-through method (Wright, 1986). y1 mg·L-1 = 1 ppm. xMeans separated within columns by nutrient using Duncan’s multiple range test, P ≤ 0.05 (n = 4). wPTS produced from12-year-old loblolly pine trees harvested at ground level, delimbed, chipped, and hammer-milled to pass through a 4.76-mm screen.

211
Table 5.6. Substrate carbon dioxide (CO2) efflux measured in 2006 and 2007 from containers filled with pine bark (PB) or pine tree substrate (PTS) with plants when fertilized with two rates of Osmocote Plus 15N-3.9P-10Kz. 2006 Substrate CO2 efflux ( μmol CO2
.m-2·s-1) Osmocote (kg·m-3) June July August September October PB 4.2 15.8 cy 10.9 c 5.7 c 7.0 c 3.5 b 8.4 12.5 d 8.8 d 5.5 c 5.8 d 3.3 b PTSx 4.2 31.3 a 22.1 a 19.9 a 20.3 a 11.1 a 8.4 25.4 b 18.3 b 15.9 b 16.8 b 12.3 a Substrate (S) 0.0001 0.0031 0.0001 0.0007 0.0061 Fertilizer rate (F) 0.0120 0.0002 0.0814 0.0130 0.0370 S x F 0.0230 0.0014 0.0120 0.0017 0.0002 2007 Substrate CO2 efflux ( μmol CO2
.m-2·s-1) Osmocote (kg·m-3) May June July August SeptemberPB 4.2 3.2 c 8.7 c 7.2 b 6.5 b 5.5 c 8.4 2.1 d 5.2 d 6.6 b 5.7 c 2.8 d PTS 4.2 9.5 a 17.2 a 14.0 a 11.8 a 12.1 a 8.4 7.1 b 14.3 b 15.6 a 11.7 a 9.0 b Substrate (S) 0.0071 0.0030 0.0025 0.0082 0.0081 Fertilizer rate (F) 0.1038 0.0190 0.0672 0.2310 0.0120 S x F 0.0204 0.0320 0.0082 0.0505 0.0841 zCO2 efflux measured with a LiCor 6400 infrared gas analyzer fitted with a LiCor 6400-09 soil CO2 flux chamber (n = 6). yMeans separated within columns using Duncan’s multiple range test, P ≤ 0.05 (n = 4). xPTS produced from12-year-old loblolly pine trees harvested at ground level, delimbed, chipped, and hammer-milled to pass through a 4.76-mm screen.