Chem Soc Rev model of the micelle.20 Reproduced from ref. 20 with permission from the American...
12
This journal is © The Royal Society of Chemistry 2018 Chem. Soc. Rev., 2018, 47, 3849--3860 | 3849 Cite this: Chem. Soc. Rev., 2018, 47, 3849 Computational studies of micellar and nanoparticle nanomedicines Soumyo Sen, a Yanxiao Han, a Pavel Rehak, a Lela Vukovic ´ * b and Petr Kra ´ l * acd Nanomedicines are typically formed by nanocarriers which can deliver in a targeted manner drugs poorly soluble in blood, increase their therapeutic activities, and reduce their side effects. Many tested nanomedicines are formed by lipids, polymers, and other amphiphilic molecules isolated or self-assembled into various complexes and micelles, functionalized nanoparticles, and other bio-compatible composite materials. Here, we show how atomistic molecular dynamics simulations can be used to characterize and optimize the structure, stability, and activity of selected nanomedicines. We discuss modeling of nanomedicines based on micelles, which can deliver selected therapeutic agents, and nanoparticles designed to act like large drugs. We show how to model nanomedicines interacting with lipid membranes, viruses, and amyloid fibrils. Key learning points 1. Modeling of micellar nanomedicines: design and optimization, drug solvation, role of branched monomers, interactions with membranes and receptors, protein corona. 2. Modeling of nanoparticle nanomedicines: protein adsorption, enzymatic complexes, multivalent blocking of active sites, virus disassembly. 1 Introduction Numerous modern drugs are poorly soluble in blood. 1 Therefore, many types of nanocarriers have been designed to encapsulate such drugs in their hydrophobic interior, 2 protect them from degradation, 3 selectively deliver them to diseased sites while reducing their negative side-effects through passive or active targeting, 4 and greatly improve the efficacy of treatment. 5 Micelles are an excellent example of a highly successful nanocarrier platform which can be used to deliver drugs. 6 Micelles can be formed by amphiphilic copolymers of different architectures and chemistries, which tend to self-assemble above a critical micelle concentration (CMC) into complexes of an aggregation number N agg . Typically, hydrophobic blocks of these copolymers are present in the micelle core, while the hydrophilic blocks are exposed to the aqueous solvent. 7 Hydro- phobic drugs could be solvated in the micelle core, while the copolymer blocks exposed to the solvent can be functionalized to actively target preferred biomolecules at disease sites, where the carried drugs can be released. 8 However, the exact structure and activity of these nanomedicines are often unclear from the experi- ments. Precise modeling could clarify where in the micelles, how, and how many drugs are attached, carried, and delivered. Nanomedicines can also be based on bio-active polymers, molecular complexes, clusters, and nanoparticles (NPs), which can either carry drugs or be designed to act like drugs. In drug- less nanomedicines, it might be difficult to understand from the experiments the concerted activity of different NPs groups during their active binding to selective molecular targets. For all these reasons, precise modeling methods would be useful in designing and optimizing of nanomedicines. Although many experimental methods have been used to characterize physical and pharmaceutical properties of the prepared nanomedicines, 9 they have been precisely modeled only in a very limited way, 10,11 except DNA-delivery systems. 12 Yet, the large computational power currently available provides many possibilities for precise modeling of biomedical systems. 13 Atomistic molecular dynamics (MD) simulations, today routinely performed for very large biological systems, could be used to better understand nanomedicines and guide their optimal design. In this tutorial review, we discuss atomistic MD simulations of nanomedicines based on micellar drug nanocarriers and bio- active nanoparticles. First, modeling of micellar nanomedicines a Department of Chemistry, University of Illinois at Chicago, Chicago, IL, USA. E-mail: [email protected] b Department of Chemistry and Biochemistry, University of Texas at El Paso, El Paso, TX, USA. E-mail: [email protected] c Department of Physics, University of Illinois at Chicago, Chicago, IL, USA d Department of Pharmaceutical Sciences, University of Illinois at Chicago, Chicago, IL, USA Received 9th January 2018 DOI: 10.1039/c8cs00022k rsc.li/chem-soc-rev Chem Soc Rev TUTORIAL REVIEW Published on 12 April 2018. Downloaded by University of Illinois at Chicago on 8/23/2018 9:50:25 PM. View Article Online View Journal | View Issue
Transcript of Chem Soc Rev model of the micelle.20 Reproduced from ref. 20 with permission from the American...

This journal is©The Royal Society of Chemistry 2018 Chem. Soc. Rev., 2018, 47, 3849--3860 | 3849
Cite this: Chem. Soc. Rev., 2018,
47, 3849
Computational studies of micellar andnanoparticle nanomedicines
Soumyo Sen,a Yanxiao Han,a Pavel Rehak,a Lela Vukovic *b and Petr Kral *acd
Nanomedicines are typically formed by nanocarriers which can deliver in a targeted manner drugs poorly
soluble in blood, increase their therapeutic activities, and reduce their side effects. Many tested nanomedicines
are formed by lipids, polymers, and other amphiphilic molecules isolated or self-assembled into various
complexes and micelles, functionalized nanoparticles, and other bio-compatible composite materials. Here,
we show how atomistic molecular dynamics simulations can be used to characterize and optimize the
structure, stability, and activity of selected nanomedicines. We discuss modeling of nanomedicines based on
micelles, which can deliver selected therapeutic agents, and nanoparticles designed to act like large drugs. We
show how to model nanomedicines interacting with lipid membranes, viruses, and amyloid fibrils.
Key learning points1. Modeling of micellar nanomedicines: design and optimization, drug solvation, role of branched monomers, interactions with membranes and receptors,protein corona.2. Modeling of nanoparticle nanomedicines: protein adsorption, enzymatic complexes, multivalent blocking of active sites, virus disassembly.
1 Introduction
Numerous modern drugs are poorly soluble in blood.1 Therefore,many types of nanocarriers have been designed to encapsulatesuch drugs in their hydrophobic interior,2 protect them fromdegradation,3 selectively deliver them to diseased sites whilereducing their negative side-effects through passive or activetargeting,4 and greatly improve the efficacy of treatment.5
Micelles are an excellent example of a highly successfulnanocarrier platform which can be used to deliver drugs.6
Micelles can be formed by amphiphilic copolymers of differentarchitectures and chemistries, which tend to self-assembleabove a critical micelle concentration (CMC) into complexesof an aggregation number Nagg. Typically, hydrophobic blocksof these copolymers are present in the micelle core, while thehydrophilic blocks are exposed to the aqueous solvent.7 Hydro-phobic drugs could be solvated in the micelle core, while thecopolymer blocks exposed to the solvent can be functionalized
to actively target preferred biomolecules at disease sites, wherethe carried drugs can be released.8 However, the exact structure andactivity of these nanomedicines are often unclear from the experi-ments. Precise modeling could clarify where in the micelles, how,and how many drugs are attached, carried, and delivered.
Nanomedicines can also be based on bio-active polymers,molecular complexes, clusters, and nanoparticles (NPs), whichcan either carry drugs or be designed to act like drugs. In drug-less nanomedicines, it might be difficult to understand fromthe experiments the concerted activity of different NPs groupsduring their active binding to selective molecular targets. Forall these reasons, precise modeling methods would be useful indesigning and optimizing of nanomedicines.
Although many experimental methods have been used tocharacterize physical and pharmaceutical properties of theprepared nanomedicines,9 they have been precisely modeledonly in a very limited way,10,11 except DNA-delivery systems.12
Yet, the large computational power currently available providesmany possibilities for precise modeling of biomedical systems.13
Atomistic molecular dynamics (MD) simulations, today routinelyperformed for very large biological systems, could be used to betterunderstand nanomedicines and guide their optimal design.
In this tutorial review, we discuss atomistic MD simulationsof nanomedicines based on micellar drug nanocarriers and bio-active nanoparticles. First, modeling of micellar nanomedicines
a Department of Chemistry, University of Illinois at Chicago, Chicago, IL, USA.
E-mail: [email protected] Department of Chemistry and Biochemistry, University of Texas at El Paso,
El Paso, TX, USA. E-mail: [email protected] Department of Physics, University of Illinois at Chicago, Chicago, IL, USAd Department of Pharmaceutical Sciences, University of Illinois at Chicago,
Chicago, IL, USA
Received 9th January 2018
DOI: 10.1039/c8cs00022k
rsc.li/chem-soc-rev
Chem Soc Rev
TUTORIAL REVIEW
Publ
ishe
d on
12
Apr
il 20
18. D
ownl
oade
d by
Uni
vers
ity o
f Il
linoi
s at
Chi
cago
on
8/23
/201
8 9:
50:2
5 PM
.
View Article OnlineView Journal | View Issue

3850 | Chem. Soc. Rev., 2018, 47, 3849--3860 This journal is©The Royal Society of Chemistry 2018
is discussed, with a focus on their design and optimization,drug solvation, role of branched monomers, interactions withmembranes and receptors, and protein corona. Second, modelingof NPs nanomedicines is discussed, with a focus on their proteinadsorption, enzymatic activity, multivalent blocking of active sites,and destabilization of viruses and fibrils.
2 Simulation methods
All the systems discussed in this review were studied byclassical atomistic MD simulations. The initial structures ofmicellar and nanoparticle nanomedicines were prepared withGaussView (small molecules), VMD14 (biomolecules), custom-ized codes (micelles and NPs), and CHARMM-GUI interface(lipids). The initial structures of small molecules, lipids, poly-mers and NPs were built based on chemical intuition, sincethey were able to relax into their energy minimum structures on
the simulation timescales (10–100s of nanoseconds). The initialstructures of proteins and nucleic acids were prepared based ontheir crystal structures, obtained from the PDB database. Whennecessary, the Modeller program was used to add unresolved(missing) protein residues in the crystal structures. The com-plete systems were solvated and ionized by VMD,14 in order tomimic the experimental conditions.
Atomistic MD simulations of the prepared systems werecarried out with the NAMD2 software.15 All the systems weredescribed with the appropriate CHARMM forcefield (proteins,nucleic acids, lipids) or a general force field;16 a straight-forward automated procedure can be employed for the additionof parameters for new molecules into CHARMM forcefield,which is often required for modeling of nanomedicines andnanoparticles with diverse chemistries.17 After a quick initialenergy minimization and warming to the desired temperature(o10 000 steps), water and ions were equilibrated around therestrained systems for E2 ns. Then, production run simulations
Soumyo Sen
Soumyo Sen received his BSc inchemistry from the Jadavpur Univer-sity, Kolkata, India in 2009 and hisMSc degree in 2011 from the IndianInstitute of Technology, Madras(IITM), India. Then, he worked fora year as a research assistant inProf. Sanjib Senapati’s group in theBiotechnology Department of IITM,where he studied electronicstructures of silver nanoclusters. In2012, he started his PhD studies inthe Prof. Petr Kral’s group at theUniversity of Illinois at Chicago. In
2018, he should defend his PhD thesis devoted to multiscale modeling ofnanoparticles growth, self-assembly and applications in nanomedicines.
Yanxiao Han
Yanxiao Han received her BS fromLudong University in China in2012. She then joined the Chuan-Lu Yang research group at LudongUniversity and obtained herMaster’s degree in atomic andmolecular physics in 2015. In2015, she started her PhD studiesin the Prof. Petr Kral’s group at theUniversity of Illinois at Chicago.Her research is focused onmolecular dynamic simulations ofbio-related systems and self-assembly of nanoscale systems.
Pavel Rehak
Pavel L. Rehak received his BScdegree in chemistry and mathe-matics at the State University ofNew York at Stony Brook in 2010.He received his MSc in chemicalphysics at the University ofMinnesota Twin Cities in 2012.Then, he continued in developinghybrid QM–MM methods usingionic liquids. In 2015, he startedhis PhD studies in the Prof. PetrKral’s group at the University ofIllinois at Chicago. His researchinvolves nanoscale simulations withapplications in biochemistry, phar-maceutics, and material sciences.
Lela Vukovic
Prof. Lela Vukovic received herBSc (2005) and PhD (2012)degrees from the University ofIllinois at Chicago, last in thegroup of Prof. Petr Kral. In2011–2012, she was a visitingresearcher in the Max PlanckInstitute for Biophysical Chemis-try. In 2012–2015, she was apostdoctoral fellow of the NSFCenter for Living Cells at theUniversity of Illinois at Urbana-Champaign, working with Prof.Klaus Schulten. In 2016, she
joined the faculty of the University of Texas at El Paso, as anAssistant Professor. Her current research interests includecomputational modeling of materials and biomolecular complexes.
Tutorial Review Chem Soc Rev
Publ
ishe
d on
12
Apr
il 20
18. D
ownl
oade
d by
Uni
vers
ity o
f Il
linoi
s at
Chi
cago
on
8/23
/201
8 9:
50:2
5 PM
. View Article Online

This journal is©The Royal Society of Chemistry 2018 Chem. Soc. Rev., 2018, 47, 3849--3860 | 3851
were carried out, in which the whole systems were equilibratedon the timescales of 10–100s nanoseconds. These simulationswere typically performed in the NPT ensemble (P = 1 bar andT = 300 K) with periodic boundary conditions, where pressureand temperature were maintained using a modified Nose–Hoovermethod with Langevin dynamics. The timestep was set to 2 fs, andlong-range interactions were evaluated every 1 (van der Waals) and2 timesteps (Coulombic); the particle-mesh Ewald method wasused for the evaluation of long-range Coulomb interactions.
Several studies discussed below evaluated also the freeenergies of binding. Methods based on a potential of meanforce, including an adaptive biasing force method and anumbrella sampling method, were used to determine free energyprofiles with respect to intermolecular distances.
3 Linear copolymer micelles
In the early studies, only rather small systems were modeled,such as the self-assembly of small dodecylphosphocholinesurfactant micelles.18 Recently, atomistic MD simulations wereemployed to characterize micelles assembled from charged DSPE-PEG2000 (1,2-distearoyl-sn-glycero-3-phosphatidylethanolamine-N-[methoxy(polyethyleneglycol) 2000]) copolymers, as shown inFig. 1(A). These FDA-approved PEG-ylated nanocarriers, calledsterically stabilized micelles (SSM), can serve as platforms forassociation of both hydrophobic and amphiphilic drugs andpeptides.19
Dynamic light scattering studies revealed that the sizes ofexperimentally prepared DSPE-PEG2000 assemblies depend onthe ionic strength of the aqueous solution. The average DSPE-PEG2000 micelle diameters (at 5 mM monomer concentration)were E5 nm in pure water and E15 nm in saline solution(0.16 M NaCl, representative of physiological conditions), asseen in Fig. 1(B). The sizes of nanocarriers can affect theirtoxicity and tissue-permeability, while their stability is key to
regulating their residence time in the bloodstream and the drugrelease kinetics.
The observed micelle size differences were clarified inatomistic MD simulations.20 First, the formation of smallDSPE-PEG2000 micelles in water was simulated. Initially, randomlydistributed monomers at a concentration of c = 40 mM weresolvated at T = 300 K in water. Within 30 ns, small micelles, withNagg o 11, developed in the system, as shown in Fig. 1(C). Thesemicelles had hydrophobic cores, ionic interfaces (charged mono-mers), and a semi-polar palisade PEG layers. Neighboring micelles
Fig. 1 Simulated self-assembly of DSPE-PEG2000 copolymers in water.(A) Atomistic structure of a relaxed DSPE-PEG2000 copolymer. (B) Experi-mental distribution of the observed sizes of DSPE-PEG2000 micelles self-assembled (left) in water and (right) in a 5 mM HEPES-buffered saline.Histograms of data from NICOMP (lines) and Brookhaven (shadow)dynamic light scattering instruments obtained at a 901 angle. (C) Snapshotsof initial (0 ns) and final (30 ns) systems of DSPE-PEG2000 monomers inwater. Hydrophobic and hydrophilic blocks are shown in purple and green.Simulated micelles in (D) water and (E) 0.16 m NaCl solution. (F) Thehydrophobic core of the 90-monomer micelle in NaCl became ellipsoidalover the course of the 7 ns simulation. The size of a 90-monomer micelleshown in (E) and the shape of the core in (F) were used to validate thecomputational model of the micelle.20 Reproduced from ref. 20 withpermission from the American Chemical Society, copyright 2011.
Petr Kral
Prof. Petr Kral received in 1986 aMSc degree at the Czech TechnicalUniversity. In 1995, he received aPhD degree in theoreticalcondensed matter physics withProf. Bedrich Velicky at CzechAcademy of Sciences (CAS). In1996–2004, he held postdoctoraland visiting scientist positions atthe Universities of Nottinghamand Toronto, and the WeizmannInstitute of Science, last one withProf. Moshe Shapiro. In 2004, hejoined the faculty of the Depart-
ment of Chemistry at the University of Illinois at Chicago, where hebecame a full Professor in 2015. His current research is focused onsimulations of nanomedicines, self-assembly of nanoparticles,nanofluidics, electronic structures and transport in nanostructures.
Chem Soc Rev Tutorial Review
Publ
ishe
d on
12
Apr
il 20
18. D
ownl
oade
d by
Uni
vers
ity o
f Il
linoi
s at
Chi
cago
on
8/23
/201
8 9:
50:2
5 PM
. View Article Online

3852 | Chem. Soc. Rev., 2018, 47, 3849--3860 This journal is©The Royal Society of Chemistry 2018
often came in contact through their extended PEG coronas, butthey did not grow further, despite the relatively large DSPE-PEG2000
concentration. The micelles sizes matched the experiments(in water), revealing that the experimental micelles were formedby Nagg r 8 monomers,20 as shown in Fig. 1(D).
In the saline solution, due to time limits, only one micelle withNagg = 90 monomers was prepared and equilibrated, matching thedata from small-angle neutron scattering measurements.21
Fig. 1(E) shows the relaxed micelle, which had a diameter ofd E 14 nm, in close agreement with dynamic light scatteringexperiments. Fig. 1(F) reveals that the micelle core departedfrom a spherical shape, giving an aspect ratio of E1.7. Experi-mentally, large micelles with Nagg = 93 present in saline solu-tions were observed to have oblate shapes.21
The simulations clearly revealed why micelles had differentsizes in different solutions.20 In these micelles, charged phos-phate groups (–PO4
�) form an interfacial region separatingtheir hydrophobic core and PEG corona. The simulationsrevealed that the probability of finding Na+ ions close to the–PO4
� groups is much larger in saline solutions than in purewater. At low ionic concentrations, the assembled –PO4
� groupsare less screened and thus effectively larger (more repelling),making the monomers more ‘‘triangular’’ in shape, so that onlysmaller micelles can be formed. At higher ionic concentrations,the screened –PO4
� groups allow a more compact assembly,leading to larger micelles.
Further structural details of micelles can also be examinedby modeling. Fig. 2 shows the distributions of hydrophobic andhydrophilic (PEG) groups of self-assembled DSPE-PEG2000, aswell as water, with a radial distance from the micelle centers.Small micelles assembled from 10 DSPE-PEG2000 (SSM-10) in
water have small hydrophobic cores and a sharp distribution ofPEG, surrounded by water at nearly bulk density. Largermicelles assembled from 90 DSPE-PEG2000 (SSM-90) in salinesolution have larger hydrophobic cores, extended PEG layersand a gradually increasing water/ion concentration. Moreover,small micelles have a very uneven PEG corona, so that E30% ofthe core is always fully exposed to water.20 In the largermicelles, the PEG corona is relatively dense and several nano-meters thick, with only o10% of hydrophobic cores beingexposed to water.
4 Solvation of drugs in micelles
Atomistic simulations can clarify the number, the location andthe binding strength of drugs that can be accommodatedwithin the nanocarriers.22–24 A reasonable agreement withexperiments was also obtained by coarse-grained simulationsof drug loading in micelles.25 Such simulations could help tooptimize accommodation, transport, and delivery of therapeuticagents in nanomedicines.
4.1 Solvation of small drugs in micelles
MD simulations were used to model solvation of drugs inmicelles described above in Section 3.26 In experiments, E11bexarotene molecules were observed to solvate on average inmicelles with 90 monomers (SSM-90) (Fig. 1(E)). Fig. 3(A) showsthe Gibbs free energy profiles, DG(r), calculated for the amphi-philic bexarotene molecule along the radial coordinate r inSSM-10 (Fig. 1(D)) and SSM-90 (Fig. 1(E)).20 In SSM-10, DG(r)has a single global minimum around r = 1 nm, while in SSM-90two separated minima of different depths are observed aroundr = 0.5 nm (local) and r = 2 nm (global). Within the hydro-phobic/hydrophilic interfacial minima, located between thealkane cores and the ionic interfaces at r E 0.8–1.2 nm (SSM-10)and r E 1.7–2.5 nm (SSM-90), bexarotene has its polar –COOHgroup oriented towards the aqueous region, while its body is
Fig. 2 Simulated density distributions of hydrophobic core groups, PEGgroups and water for micelles in (A) water (SSM-10) and in (B) 0.16 M NaClsolution (SSM-90). Density of core and PEG corona of the micelle anddensity of water with a radial distance from the center of the micelle.20
Reproduced from ref. 20 with permission from the American ChemicalSociety, copyright 2011.
Fig. 3 (A) Free energy profiles of bexarotene in SSM-10 (water) and SSM-90(0.16 M NaCl); SSM-10 and SSM-90 refer to micelles assembled from 10 and90 monomers, respectively. Arrows show the positions of ionic interfaces inthe two SSMs. (inset) The structure of bexarotene; the molecule containscarbon (green), oxygen (red) and hydrogen (white) atoms. (B) A snapshot of a5 bexarotene molecules cluster formed inside the SSM-90 core after 11 ns ofequilibration. A hydrogen bond network between –COOH groups ishighlighted.26 Reproduced from ref. 26 with permission from the AmericanChemical Society, copyright 2013.
Tutorial Review Chem Soc Rev
Publ
ishe
d on
12
Apr
il 20
18. D
ownl
oade
d by
Uni
vers
ity o
f Il
linoi
s at
Chi
cago
on
8/23
/201
8 9:
50:2
5 PM
. View Article Online

This journal is©The Royal Society of Chemistry 2018 Chem. Soc. Rev., 2018, 47, 3849--3860 | 3853
immersed in the alkane region. In both micelles, the barriers fortransfer of bexarotene from these minima into the alkane coresare DDG(r) E 4 kcal mol�1, whereas the barriers for its transferinto the aqueous PEG regions are DDG(r) E 10 kcal mol�1.26
It is rather surprising that bexarotene doesn’t have a globalfree energy minimum in the hydrophobic SSMs cores, consideredto be the dominant residing region for poorly water-soluble drugmolecules.27 Fig. 3(A) shows that a single bexarotene has only ashallow local minimum in the SSM-90 collapsed core (Fig. 1(F)),where the energy necessary to form a cavity is decreased, due to alower density of alkane tails.
To understand better how 11 bexarotene molecules might bestored in SSM-90, as observed in experiments, 3 and 5 drugswere also accommodated in the SSM-90 core. Fig. 3(B) showsthat after t E 11 ns of equilibration 5 bexarotene molecules forma hydrogen bond network within the alkyl core. The drugsreorient into a configuration with inwards pointing –COOHgroups, thus forming a molecular cluster held together by ahydrogen bond network (an analogue of a small inverse micelle).The observed clustering decreases the Gibbs free energy permolecule in the core, as shown in Fig. 3(A). The DG(r) depthincreases with the number of drugs present in the core and for5 drugs it surpasses the local minimum at the ionic interface,which can explain the large drug loading capacity of SSM-90.
4.2 Complexation of therapeutic peptides with micelles
Large therapeutic agents can also be carried by micelles.28 Inthe next example, binding of a vasoactive intestinal peptide(VIP) to a micelle assembled from 20 monomers (SSM-20) inwater is modeled.26 The modeled VIP has a net charge of +3. Itcontains two clusters of positively charged residues (Arg-Leu-Arg-Lys and Lys-Lys), two well separated negatively chargedresidues (two Asp), and charged C and N termini.
Initially, two VIP molecules were placed on the oppositesides of SSM-20, within 0.7 nm of its core edge, and the wholesystem was equilibrated for t E 30 ns. After the first E10 ns, bothVIP molecules became closely coordinated to the PO4
� groupspositioned at the surface of the alkane core, as shown in Fig. 4.The PO4
� groups migrated primarily towards the two clusters ofpositively charged residues, and redistributed more homogeneouslyon the alkane core surface. The coordination of PO4
� groups withthe positive residues of VIP occurs due to strong Coulombiccoupling, which is poorly screened in water (Debye length in1 mM PB solution is ld E 9.7 nm). The above modeling revealshow more complex molecules can be bound to micelles.
5 Dendron copolymer micelles
So far, micelles formed by linear block copolymers were dis-cussed. An ideal copolymer should have a low critical micelleconcentration, to remain assembled as a micelle upon dilutionin a bloodstream, and a high hydrophilic–lipophilic balances,to have increased in vivo circulation times and reduced non-specific biological interactions. Micelles based on PEGylateddendron based copolymers (PDCs) have an improved stability,drug retention time, specificity, and other properties.
5.1 Structure and properties of dendron micelles
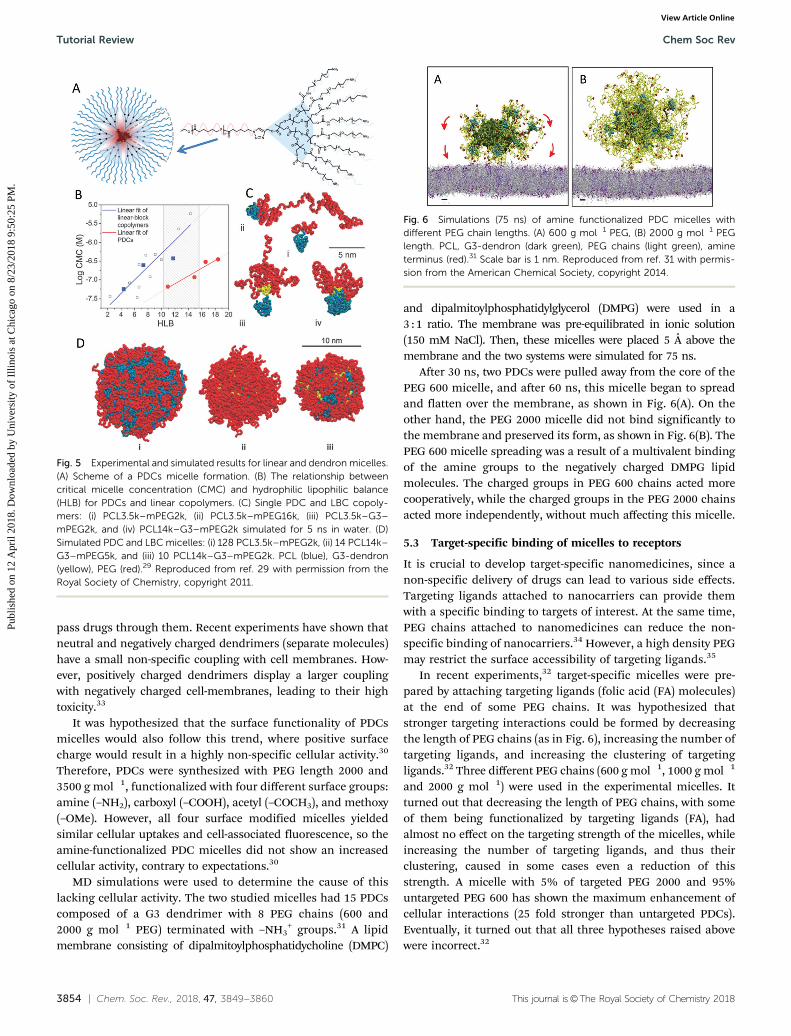
Recently, PDCs micelles were experimentally and computation-ally studied.29–32 Fig. 5(A) shows the three components of PDCs:a poly-e-caprolactone (PCL) hydrophobic core-forming block, a2,2-bis(hydroxyl-methyl)propionic acid generation 3 (G3) dendronwith an acetylene core, and PEG forming the hydrophiliccoronna.29 PDCs were synthesized and modeled with varyingmolecular weights for PCL and mPEG (3.5 and 14 kDa for PCL; 2and 5 kDa for mPEG). The structures of individual PDCs andtheir micelles were compared to their linear block copolymer(LBC) counterparts having a similar hydrophilic–lipophilic balance.Fig. 5(B) illustrates that the experimental PDCs had significantlylower critical micelle concentrations compared to LBCs with similarhydrophilic lipophilic balance.
Fig. 5(C) illustrates the simulated structures of individualcopolymers after 5 ns of equilibration in water at T = 300 K.PDCs (iii) maintained a more conical shape than LBCs (ii) withidentical hydrophilic–lipophilic balances, due to the presenceof G3-dendron keeping the PEG block closer to the PCL core.This pre-organization of multiple PEG blocks in PDCs (entropiccost) resulted in a more favorable micelle self-assembly (lowerCMC). Fig. 5(D) shows three simulated micelles formed by128 LBCs, 14 PDCs, and 10 PDCs. These simulations clearlyillustrate that due to their more compact conical shapes, PDCsself-assemble into micelles with denser PEG layers and morecomplete surface coverage of the hydrophobic PCL core ascompared to LBC micelles.
5.2 Multivalent coupling of micelles to cell membranes
In order to be able to deliver drugs, micellar nanocarriers needto specifically or non-specifically bind to cell membranes and
Fig. 4 (A) MD snapshots of VIP complexed in two distinct configurations(VIP-1, VIP-2) on the opposite sides of SSM-20. The alkyl core (yellowsurface), is surrounded by PO4
� groups (black, orange), which coordinatewith two positively charged regions on each VIP. Whole VIP molecules areshown as green ribbons, and all the atoms of the positively charged residuesare shown as spheres. (B) The amino acid sequence of VIP: neutral (lightgreen), negative (red) and positive (blue).26 Reproduced from ref. 26 withpermission from the American Chemical Society, copyright 2013.
Chem Soc Rev Tutorial Review
Publ
ishe
d on
12
Apr
il 20
18. D
ownl
oade
d by
Uni
vers
ity o
f Il
linoi
s at
Chi
cago
on
8/23
/201
8 9:
50:2
5 PM
. View Article Online
3854 | Chem. Soc. Rev., 2018, 47, 3849--3860 This journal is©The Royal Society of Chemistry 2018
pass drugs through them. Recent experiments have shown thatneutral and negatively charged dendrimers (separate molecules)have a small non-specific coupling with cell membranes. How-ever, positively charged dendrimers display a larger couplingwith negatively charged cell-membranes, leading to their hightoxicity.33
It was hypothesized that the surface functionality of PDCsmicelles would also follow this trend, where positive surfacecharge would result in a highly non-specific cellular activity.30
Therefore, PDCs were synthesized with PEG length 2000 and3500 g mol�1, functionalized with four different surface groups:amine (–NH2), carboxyl (–COOH), acetyl (–COCH3), and methoxy(–OMe). However, all four surface modified micelles yieldedsimilar cellular uptakes and cell-associated fluorescence, so theamine-functionalized PDC micelles did not show an increasedcellular activity, contrary to expectations.30
MD simulations were used to determine the cause of thislacking cellular activity. The two studied micelles had 15 PDCscomposed of a G3 dendrimer with 8 PEG chains (600 and2000 g mol�1 PEG) terminated with –NH3
+ groups.31 A lipidmembrane consisting of dipalmitoylphosphatidycholine (DMPC)
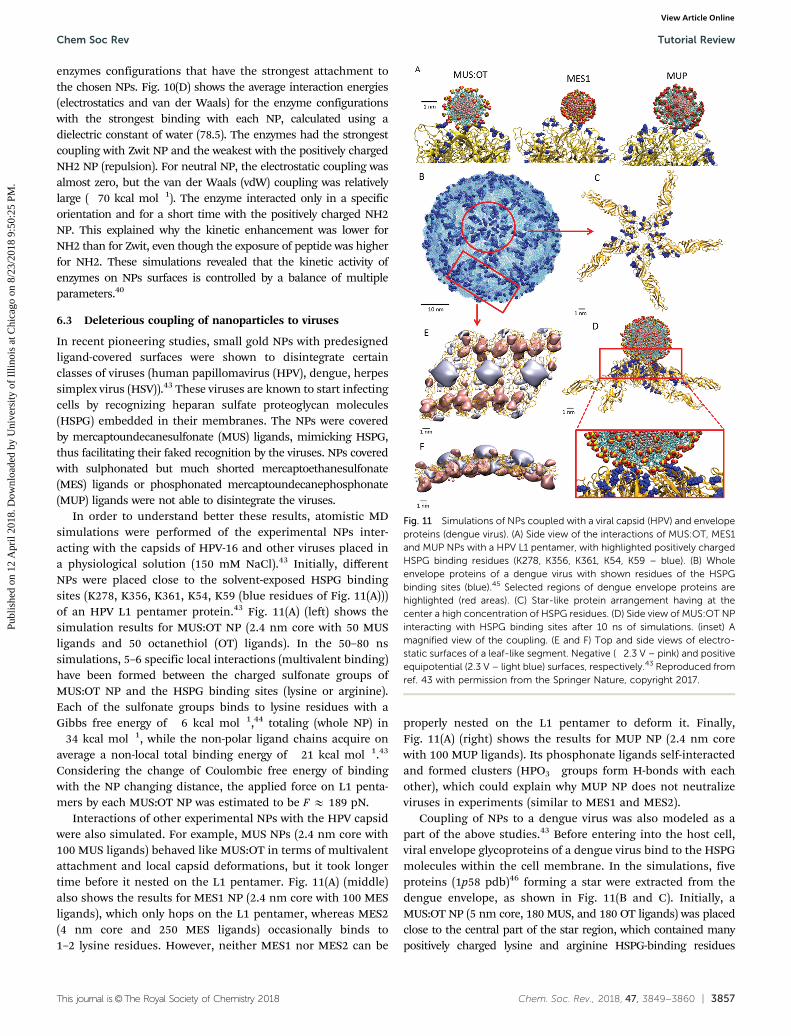
and dipalmitoylphosphatidylglycerol (DMPG) were used in a3 : 1 ratio. The membrane was pre-equilibrated in ionic solution(150 mM NaCl). Then, these micelles were placed 5 Å above themembrane and the two systems were simulated for 75 ns.
After 30 ns, two PDCs were pulled away from the core of thePEG 600 micelle, and after 60 ns, this micelle began to spreadand flatten over the membrane, as shown in Fig. 6(A). On theother hand, the PEG 2000 micelle did not bind significantly tothe membrane and preserved its form, as shown in Fig. 6(B). ThePEG 600 micelle spreading was a result of a multivalent bindingof the amine groups to the negatively charged DMPG lipidmolecules. The charged groups in PEG 600 chains acted morecooperatively, while the charged groups in the PEG 2000 chainsacted more independently, without much affecting this micelle.
5.3 Target-specific binding of micelles to receptors
It is crucial to develop target-specific nanomedicines, since anon-specific delivery of drugs can lead to various side effects.Targeting ligands attached to nanocarriers can provide themwith a specific binding to targets of interest. At the same time,PEG chains attached to nanomedicines can reduce the non-specific binding of nanocarriers.34 However, a high density PEGmay restrict the surface accessibility of targeting ligands.35
In recent experiments,32 target-specific micelles were pre-pared by attaching targeting ligands (folic acid (FA) molecules)at the end of some PEG chains. It was hypothesized thatstronger targeting interactions could be formed by decreasingthe length of PEG chains (as in Fig. 6), increasing the number oftargeting ligands, and increasing the clustering of targetingligands.32 Three different PEG chains (600 g mol�1, 1000 g mol�1
and 2000 g mol�1) were used in the experimental micelles. Itturned out that decreasing the length of PEG chains, with someof them being functionalized by targeting ligands (FA), hadalmost no effect on the targeting strength of the micelles, whileincreasing the number of targeting ligands, and thus theirclustering, caused in some cases even a reduction of thisstrength. A micelle with 5% of targeted PEG 2000 and 95%untargeted PEG 600 has shown the maximum enhancement ofcellular interactions (25 fold stronger than untargeted PDCs).Eventually, it turned out that all three hypotheses raised abovewere incorrect.32
Fig. 5 Experimental and simulated results for linear and dendron micelles.(A) Scheme of a PDCs micelle formation. (B) The relationship betweencritical micelle concentration (CMC) and hydrophilic lipophilic balance(HLB) for PDCs and linear copolymers. (C) Single PDC and LBC copoly-mers: (i) PCL3.5k–mPEG2k, (ii) PCL3.5k–mPEG16k, (iii) PCL3.5k–G3–mPEG2k, and (iv) PCL14k–G3–mPEG2k simulated for 5 ns in water. (D)Simulated PDC and LBC micelles: (i) 128 PCL3.5k–mPEG2k, (ii) 14 PCL14k–G3–mPEG5k, and (iii) 10 PCL14k–G3–mPEG2k. PCL (blue), G3-dendron(yellow), PEG (red).29 Reproduced from ref. 29 with permission from theRoyal Society of Chemistry, copyright 2011.
Fig. 6 Simulations (75 ns) of amine functionalized PDC micelles withdifferent PEG chain lengths. (A) 600 g mol�1 PEG, (B) 2000 g mol�1 PEGlength. PCL, G3-dendron (dark green), PEG chains (light green), amineterminus (red).31 Scale bar is 1 nm. Reproduced from ref. 31 with permis-sion from the American Chemical Society, copyright 2014.
Tutorial Review Chem Soc Rev
Publ
ishe
d on
12
Apr
il 20
18. D
ownl
oade
d by
Uni
vers
ity o
f Il
linoi
s at
Chi
cago
on
8/23
/201
8 9:
50:2
5 PM
. View Article Online

This journal is©The Royal Society of Chemistry 2018 Chem. Soc. Rev., 2018, 47, 3849--3860 | 3855
In order to clarify why certain mixed micelles show strongertargeted interactions, micelles containing 5% targeted PDCswere modeled by atomistic MD simulations: (DMS2) PEG 600and PEG 600 with FA; (DMS3) PEG 600 and PEG 2000 with FA;(DMS7) PEG 1000 and PEG 2000 with FA; (DMS10) PEG 2000and with PEG 2000 FA. Individual PDCs were assembled intomicelles (aggregation number of 60) and equilibrated. Fig. 7(A)shows the strongest targeting micelle, DMS3, after 50 ns ofsimulations in a 150 mM NaCl solution.
The simulated systems were analyzed to determine thesolvent accessible surface area (SASA) of their FA, the local PEGdensity near FA, and the distribution of FA positions with respect tothe micelle center. The results have shown that all four systems hadFA SASA within 400� 50 Å2. The strongest targeting micelle (DMS3)had the lowest PEG density within 2 Å from FA, but no clearcorrelation was found between the local PEG density around FAand the micelle targeting strength. In most micelles, the calculateddistributions have shown that FA was largely localized within thePEG corona, which was the likely reason for their reduced activity.However, in DMS3, the PEG surface was positioned 8.0� 0.5 Å fromthe micelle center, while the PEG chain containing FA could extendup to 12 Å, under proper binding conditions, as shown in Fig. 7(B).This was certainly not possible in DMS2 or DMS10, where thetargeted PEG chains had the same length as the non-targeted PEGchains. The FA molecules also had the tendency to couple with eachother at high FA concentrations, which could reduce their potentialcoupling with the receptors. Overall, the simulations have shownthat in the DMS3 micelle, with the strongest binding to the target,FA had the largest conformational freedom.
5.4 Deleterious role of protein corona on micelles
One of the most important challenges affecting the performance ofnanocarriers is their residual interaction with serum proteins.Despite the fact that PEG-ylated systems tend to interact very littlewith the serum, they can still be affected and even destabilizedby these residual interactions.36 Therefore, a poly(2-oxazoline)spolymer has been developed,37 which can potentially make morerobust drug nanocarriers than PEG.
It was also hypothesized that PDCs micelles can be morestable in the serum (longer life times) than LBCs micelles, due
to their high surface densities of protecting chains and lowerCMCs.38 A drug release study with PEG-ylated PDCs and LBCsmicelles indeed demonstrated a greater serum stability of thePDCs micelles. The average half lives of PCL3.5k–G3–8PEG600and PCL3.5k–PEG5k micelles in 50% fetal bovine serum were5.51 and 11.35 hours, respectively.
Atomistic MD simulations were performed to compare inter-actions of PEG-ylated PDCs and LBCs micelles with serumproteins.38 The PDCs and LBCs micelles were formed byPCL3.5k–G3–8PEG600 and PCL3.5k–PEG5k polymer buildingblocks, respectively. Both micelles had the same terminal group(–CH3) and the same number of monomers (60). BSA (bovineserum albumin), a main component of the blood serum, waschosen to separately interact with the PDCs and LBCs micelles.Six BSA proteins with different orientations were placed aroundeach micelle in a 150 mM NaCl solution.
Fig. 8 displays the two micelle systems simulated for 20 ns.In the PDCs micelle (Fig. 8(A)), the relaxed PEG chains gen-erate a smooth surface, providing a little room for strong BSAscoupling. On the other hand, in the LBCs micelle (Fig. 8(B)),the relaxed PEG chain form a highly diffuse PEG corona,which nests the BSA proteins. The LBCs micelle core is alsoless protected than that of a PDCs micelle, which allows itsstronger binding to the serum proteins. The LBCs micelles canbe destabilized for all the above reasons. In order to quantifythis possibility, the BSA-micelle coupling energies were calcu-lated and averaged over the six BSAs. The average (moleculeand time) interaction energies of one BSA protein with PDCsand LBCs were �60.2 kcal mol�1 and �178.6 kcal mol�1,respectively. Therefore, the average coupling energy of BSAswith the LBCs micelle was about 3 times larger. This canexplain why LBCs micelles tend to be destabilized more inthe serum.
6 Nanoparticles nanomedicines
Nanomedicines can not only act like suitable nanocarriers ofdrugs, but they can be designed to act alone like a large drugwith a specific binding to relevant receptors. Here, few examples ofmodeling of such systems are discussed, starting with examplesshowing a general coupling of proteins to nanoparticles.
Fig. 7 (A) A simulated PEG600/PEG2000–FA (DMS3) micelle; PCL core(yellow), PEG (blue), PDC–FA (pink), FA (green). (B) Radial density distributionof the core and corona in DMS3 and a probability distribution of FA positionwith respect to the DMS3 micelle center.32 Reproduced from ref. 32 withpermission from the American Chemical Society, copyright 2016.
Fig. 8 Simulated (A) PDCs and (B) LBCs micelles interacting with six BSAproteins. Proteins (orange ribbons), PCL cores of the micelles (yellowsurface), dendrimer of dendron micelle (cyan surface), PEG chains (blue)blue and terminal methyl groups (red).38 Reproduced from ref. 38 withpermission from the American Chemical Society, copyright 2014.
Chem Soc Rev Tutorial Review
Publ
ishe
d on
12
Apr
il 20
18. D
ownl
oade
d by
Uni
vers
ity o
f Il
linoi
s at
Chi
cago
on
8/23
/201
8 9:
50:2
5 PM
. View Article Online

3856 | Chem. Soc. Rev., 2018, 47, 3849--3860 This journal is©The Royal Society of Chemistry 2018
6.1 Controlling proteins on nanoparticles
Recent experiments have shown that the conformations of proteinsadsorbed on NPs surfaces can be controlled by the NPs chargedligands.39 In order to explain these observations, the experi-mental systems were modeled by MD simulations. The model AuNPs (12 nm diameter) had either citrate or (16-mercapto-hexadecyl)trimethylammonium bromide (MTAB) ligands, whereonly a fraction of ligands of the NPs were charged (shown in redand blue in Fig. 9). An a-synuclein protein was adsorbed on theligated NPs. The systems were simulated for 50 ns in 20 mMNaCl aqueous solvent.
Fig. 9 shows typical conformations of a-synuclein adsorbedon both NPs, where the anionic citrate NP is Coulombicallyattracting the positive N-terminus (amino acid label 0) andrepelling the negative C-terminus (amino acid label 140) ofa-synuclein. Opposite interactions/conformations were foundfor the cationic MTAB NP. The average distances of all theamino acids from the closest NP ligands are shown on thesimulation plots (Fig. 9). They agree with the NMR data shownon the experimental plots (Fig. 9). In both systems, interactionsof charged ligands and adjacent oppositely charged aminoacids effectively reduce the NMR signal strength.39
6.2 Super-enzymatic activity on nanoparticles surfaces
NPs might act like nanomedicines when certain biochemicalreactions take part on their surfaces. For example, it was shownthat proteolytic activities of enzymes can be significantlyenhanced on surfaces of NPs.40 In the experiments, ZnS NPs
(diameter of 5 nm) with the following (200) ligands wereprepared: neutral PEGylated (OMe), positive PEGylated (NH2),negative PEGylated zwitterionic (zwit) and short negative zwitter-ionic (CL4) ligands. The cleaved peptide (N-*CSTRIDEANQAATSLP7SH6-COOH where Cy3 is attached to the cysteine thiol*)contains four modules within its sequence, (a) N-terminalcysteine thiol used for dye labeling, (b) the STRIDEANQAATwhich contains trypsin recognizable arginine residue, trypsincleaves its C-terminal side,41 (c) the SLP7S forms a type IIpolyprolyl helix used as spacer to keep the peptide away fromthe QD surface,42 (d) H6, used to attach the peptide with QDsurface. The enzymatic efficiency was studied via the specificityconstant kcat/km, where kcat is a turnover rate and km is theMichaelis constant. The efficiency was decreasing in this order:CL4 (35 times larger than freely diffusing peptide), Zwit (18 timeslarger), NH2 (12 times larger) and OMe (3.5 times larger).
It was hypothesized that mainly two parameters are respon-sible for the enhanced enzymatic activity: (a) the peptideexposure above the NPs ligand corona and (b) the strength ofenzyme coupling to the NPs corona. Separate MD simulationswere performed to test both hypothesizes. To evaluate the firstparameter, four different NPs (OMe, NH2, Zwit and CL4) wereprepared. Each NP (5 nm diameter core) had 200 homo-geneously distributed ligands and 4 peptides attached throughterminal hexahistidine residues to its core. The simulations wereperformed for 90–100 ns in 150 mM NaCl solution. Fig. 10(A)shows CL4 and OMe NPs with the 4 attached peptides. Thesolvent accessible surface area (SASA) of the peptides wascalculated for each NP. Fig. 10(B) shows that peptides had thehighest exposure in CL4 NP and the lowest exposure in OMe NP,which is fitting the experimental enzymatic activities.
The same NPs and simulation conditions were used inevaluation of the second parameter, except that only four trypsinenzymes were placed close to these NPs. Fig. 10(C) displays the
Fig. 9 Simulated gold NPs with (A) citrate and (B) MTAB ligands interact-ing with an a-synuclein protein; 10% of ligands were charged (red andblue) and other ligands were neutral (yellow and grey). Plots labeled‘‘simulation’’ show the distance of amino acids from closest NP ligands.Plots labeled ‘‘experiment’’ show the normalized intensity of the aminoacids in HSQC NMR experiment. The experiments and simulations are wellcorrelated.39 Reproduced from ref. 39 with permission from the AmericanChemical Society, copyright 2015.
Fig. 10 Different NPs with attached peptides or adsorbed enzymes,simulated for 90 ns in a physiological salt concentration (150 mM).(A) Peptides attached to CL4 and OMe NPs; zwitterionic groups of CL4(orange) and methoxy groups of OMe (yellow). (B) Exposed surface area ofthe peptides in nm2 for CL4, Zwit, OMe and NH2 NPs. (C) CL4 and OMeNPs with an adsorbed trypsin enzyme. (D) The average interaction energy(electrostatics, vdW and total) between a trypsin enzyme and differentNPs.40 All the scale bars are 1 nm. Reproduced from ref. 40 with permis-sion from the American Chemical Society, copyright 2017.
Tutorial Review Chem Soc Rev
Publ
ishe
d on
12
Apr
il 20
18. D
ownl
oade
d by
Uni
vers
ity o
f Il
linoi
s at
Chi
cago
on
8/23
/201
8 9:
50:2
5 PM
. View Article Online
This journal is©The Royal Society of Chemistry 2018 Chem. Soc. Rev., 2018, 47, 3849--3860 | 3857
enzymes configurations that have the strongest attachment tothe chosen NPs. Fig. 10(D) shows the average interaction energies(electrostatics and van der Waals) for the enzyme configurationswith the strongest binding with each NP, calculated using adielectric constant of water (78.5). The enzymes had the strongestcoupling with Zwit NP and the weakest with the positively chargedNH2 NP (repulsion). For neutral NP, the electrostatic coupling wasalmost zero, but the van der Waals (vdW) coupling was relativelylarge (�70 kcal mol�1). The enzyme interacted only in a specificorientation and for a short time with the positively charged NH2NP. This explained why the kinetic enhancement was lower forNH2 than for Zwit, even though the exposure of peptide was higherfor NH2. These simulations revealed that the kinetic activity ofenzymes on NPs surfaces is controlled by a balance of multipleparameters.40
6.3 Deleterious coupling of nanoparticles to viruses
In recent pioneering studies, small gold NPs with predesignedligand-covered surfaces were shown to disintegrate certainclasses of viruses (human papillomavirus (HPV), dengue, herpessimplex virus (HSV)).43 These viruses are known to start infectingcells by recognizing heparan sulfate proteoglycan molecules(HSPG) embedded in their membranes. The NPs were coveredby mercaptoundecanesulfonate (MUS) ligands, mimicking HSPG,thus facilitating their faked recognition by the viruses. NPs coveredwith sulphonated but much shorted mercaptoethanesulfonate(MES) ligands or phosphonated mercaptoundecanephosphonate(MUP) ligands were not able to disintegrate the viruses.
In order to understand better these results, atomistic MDsimulations were performed of the experimental NPs inter-acting with the capsids of HPV-16 and other viruses placed ina physiological solution (150 mM NaCl).43 Initially, differentNPs were placed close to the solvent-exposed HSPG bindingsites (K278, K356, K361, K54, K59 (blue residues of Fig. 11(A)))of an HPV L1 pentamer protein.43 Fig. 11(A) (left) shows thesimulation results for MUS:OT NP (2.4 nm core with 50 MUSligands and 50 octanethiol (OT) ligands). In the 50–80 nssimulations, 5–6 specific local interactions (multivalent binding)have been formed between the charged sulfonate groups ofMUS:OT NP and the HSPG binding sites (lysine or arginine).Each of the sulfonate groups binds to lysine residues with aGibbs free energy of �6 kcal mol�1,44 totaling (whole NP) in�34 kcal mol�1, while the non-polar ligand chains acquire onaverage a non-local total binding energy of �21 kcal mol�1.43
Considering the change of Coulombic free energy of bindingwith the NP changing distance, the applied force on L1 penta-mers by each MUS:OT NP was estimated to be F E 189 pN.
Interactions of other experimental NPs with the HPV capsidwere also simulated. For example, MUS NPs (2.4 nm core with100 MUS ligands) behaved like MUS:OT in terms of multivalentattachment and local capsid deformations, but it took longertime before it nested on the L1 pentamer. Fig. 11(A) (middle)also shows the results for MES1 NP (2.4 nm core with 100 MESligands), which only hops on the L1 pentamer, whereas MES2(4 nm core and 250 MES ligands) occasionally binds to1–2 lysine residues. However, neither MES1 nor MES2 can be
properly nested on the L1 pentamer to deform it. Finally,Fig. 11(A) (right) shows the results for MUP NP (2.4 nm corewith 100 MUP ligands). Its phosphonate ligands self-interactedand formed clusters (HPO3
� groups form H-bonds with eachother), which could explain why MUP NP does not neutralizeviruses in experiments (similar to MES1 and MES2).
Coupling of NPs to a dengue virus was also modeled as apart of the above studies.43 Before entering into the host cell,viral envelope glycoproteins of a dengue virus bind to the HSPGmolecules within the cell membrane. In the simulations, fiveproteins (1p58 pdb)46 forming a star were extracted from thedengue envelope, as shown in Fig. 11(B and C). Initially, aMUS:OT NP (5 nm core, 180 MUS, and 180 OT ligands) was placedclose to the central part of the star region, which contained manypositively charged lysine and arginine HSPG-binding residues
Fig. 11 Simulations of NPs coupled with a viral capsid (HPV) and envelopeproteins (dengue virus). (A) Side view of the interactions of MUS:OT, MES1and MUP NPs with a HPV L1 pentamer, with highlighted positively chargedHSPG binding residues (K278, K356, K361, K54, K59 – blue). (B) Wholeenvelope proteins of a dengue virus with shown residues of the HSPGbinding sites (blue).45 Selected regions of dengue envelope proteins arehighlighted (red areas). (C) Star-like protein arrangement having at thecenter a high concentration of HSPG residues. (D) Side view of MUS:OT NPinteracting with HSPG binding sites after 10 ns of simulations. (inset) Amagnified view of the coupling. (E and F) Top and side views of electro-static surfaces of a leaf-like segment. Negative (�2.3 V – pink) and positiveequipotential (2.3 V – light blue) surfaces, respectively.43 Reproduced fromref. 43 with permission from the Springer Nature, copyright 2017.
Chem Soc Rev Tutorial Review
Publ
ishe
d on
12
Apr
il 20
18. D
ownl
oade
d by
Uni
vers
ity o
f Il
linoi
s at
Chi
cago
on
8/23
/201
8 9:
50:2
5 PM
. View Article Online

3858 | Chem. Soc. Rev., 2018, 47, 3849--3860 This journal is©The Royal Society of Chemistry 2018
(K305, K307, K310, K295, K291, R288, R286, R188, K388, K393and K394).45 Within 20 ns, the number of selective Coulombiccontact points between the NP and the protein complex wasgradually increasing (Fig. 11(D)), in a full analogy to the HPVcase (Fig. 11(A) (left)). Fig. 11(E and F) show that the elongatedregion between the star pentamers is also highly positive at itsexterior and negatively charged at its interior. Over the time,these positive regions might be wrapped on the negativelycharged MUS:OT NPs, thus helping to destabilize the virus.Therefore, the experimentally observed NP-destabilization ofdengue and HPV viruses might be caused by similar mechanisms,except that the viral envelope is destabilized in a dengue virusrather than its capsid (HPV).
6.4 Coupling of nanoparticles to amyloid fibrils
Predesigned NPs might be able to affect other bio-molecularcomplexes, such as amyloid fibrils. Many experimental studieshave investigated the inhibition of Ab40 peptides self-assemblyusing polyphenol, quinone–tryptophan hybrid (NQTrp), andeven NPs coated with histidine-based polymers.47
Here, MD simulations are presented of predesigned NPsinteracting with self-assembled amyloid peptide fibrils, with togoal to destabilize them or block their further growth.48 Theused ligands were: positive (NH3
+ terminal group), negative(SO3
� terminal group), neutral (NQTrp terminal group) – allattached to PEG chains, and positive Cys-Glu-Leu-Val-Phe-Phe-Ala-Lys-Lys peptides (complementary sequence to that found inpeptides forming the exposed part of a b-sheet surface (Ab40)).Five different NPs (2.2 nm core) were simulated with theseligands: Pos (90 positive), PosNQ (80 positive and 10 neutral),NegNQ (80 negative and 10 neutral), Janus (45 positive and45 negative) and Pep (90 peptide). Initially, these five NPs wereseparately placed 5–10 Å above the b sheet surface or at thefibril end, and the systems were simulated for E100 ns in a150 mM NaCl solution.
Fig. 12(A) shows these NPs stabilized on the surface and tipof b sheet fibrils (Ab40) after 90–95 ns of simulations. Theobtained results show that Pos, PosNQ, Pep and Janus bind tothe fibril sheet, but they do not bind to its end, while NegNQdoes exactly the opposite: Pos interacts mainly with thenegatively charged Glu22 amino acids, which gives a largecontribution to its binding energy (Fig. 12(B)). In PosNQ, thepositive ligands act like in Pos, but the neutral ligands are incontact with Hse14, Gln15, Lys16, Leu17, Val18, Phe20, Val24,Gly25, Ser26 and Asn27, which significantly increases the vdWcontribution to the binding energy. Pep is mainly nested onGlu22, since it is positively charged, but the Coulombic andvdW contributions to its binding energy are similar. Thecoupling energy of Janus is small, since both ligands interactwith oppositely charged amino acids; negatively and positivelycharged ligands mainly interact with Lys16 and Glu22, respec-tively. The attached NPs increase the average twist angle of theadjacent peptides in the fibril layer. The negatively chargedNegNQ binds to the fibril tip and thus potentially block thefibril growth.
6.5 Biologically active organomimetic nanoclusters
Since gold NPs with ligands attached by thiolated groups arenot particularly stable, organomimetic nanoclusters (OCNs)were developed by attaching selected ligands through a covalentperfluoroaryl linkage to small B12
2� clusters.49 In principle,OCNs could be designed to form highly specific and stablenanomedicines. In order to better understand the structuresand activities of selected experimentally studied OCNs, MDsimulations were used as before. Fig. 13(A and B) show selectedOCNs with 12 ligands based on 16 PEG units, simulated in waterfor 30 ns. Their radius of gyration of Rg E 3 nm in both waterand 80 mM PBS buffer solution at pH 7.4 was in a reasonableagreement with experiments.
To perform realistic experimental studies of a selectivecoupling of OCNs to chosen biological complexes, OCNs werecoated with b-D-glucose ligands (Fig. 13(E) (left)) and such‘‘sugar particles’’ (SPs) were let to couple with a natural con-canavalin A (ConA). These SPs have shown a 6500 largerbinding affinity to ConA as compared to free saccharides.Fig. 13(C) shows a simulation snapshot of this system, whichrevealed that SPs developed in 25 ns a highly stable multivalent
Fig. 12 (A) Simulations of NPs adsorbed on a Ab40 fibril after 90–95 ns ofequilibration. Positive amino acids (blue), negative amino acid (red), polaramino acid (green) and nonpolar amino acid (white). PEG chain (yellow),NH3
+ (blue), SO3� (red) and NQTrp (green). (B) Binding energies of NPs to
Ab40 fibril.48
Tutorial Review Chem Soc Rev
Publ
ishe
d on
12
Apr
il 20
18. D
ownl
oade
d by
Uni
vers
ity o
f Il
linoi
s at
Chi
cago
on
8/23
/201
8 9:
50:2
5 PM
. View Article Online

This journal is©The Royal Society of Chemistry 2018 Chem. Soc. Rev., 2018, 47, 3849--3860 | 3859
coupling to ConA tetramer (150 mM NaCl solution). At anymoment, some SPs ligands interacted with ConA monosaccharidebinding sites, formed by Asn14, Leu99, Tyr100, Asp208 and Arg228residues. This multivalent binding of SPs was maintained by aneffectively increased concentration of its b-D-glucose ligands on theSPs surfaces. In contrast, binding of a free b-D-glucose to the ConAtetramer is short and separated by long non-binding periods.
Another example of OCNs potential usage is based on DC-SIGN membrane proteins, which play an important role in acellular internalization of HIV viruses.50 The coupling of SPswith DC-SIGN was modeled to find out if SPs can inhibit DC-SIGN and HIV binding by blocking relevant carbohydratebinding sites in the protein. It was found that SPs with ashorter ligand (Fig. 13(E) (left)) can only interact with one
carbohydrate binding site, while SPs with longer ligands (right)can be bound with two sites at the same time (Fig. 13(D)). Thismultivalent binding increases the binding affinity of SPs to DC-SIGN, which might inhibit its binding with HIV.
7 Conclusion
We have presented numerous examples of a precise modelingof nanomedicines performed by classical atomistic moleculardynamics simulations. By discussing nanomedicines based onnanocarriers and individual bio-active nanoparticles, we have clearlyillustrated that precise modeling could be highly beneficial for theunderstanding of phenomena taking part in these importantsystems, which are currently being rapidly developed. Atomisticsimulations can describe in great details the structures, variouscharacteristics and activities of nanomedicines. They can reveallocations where drugs are carried, show how stable they are intheir binding sites, and evaluate how nanomedicines interactwith lipid membranes, receptors and other biological molecules,which can affect their stability. In the case of individual nano-particles, precise simulations can capture the detailed nature of theircoupling with biological components, such as peptides, proteins,their complexes (fibrils, viruses), and reveal how nanoparticles canmodify the activity of such biological systems. The discussed exam-ples show that precise modeling can be of large help during thedevelopment and optimization of novel nanomedicines when it isclosely correlated with ongoing experimental studies.
Conflicts of interest
There are no conflicts to declare.
Acknowledgements
P. K. was supported by the NSF DMR-1506886 grant. L. V. wassupported by startup funding from UTEP.
References
1 B. A. Chabner, Cancer Chemotherapy: Principles and Practice,Humana Press, Philadelphia, 1990.
2 N. Wiradharma, Y. Zhang, S. Venkataraman, J. L. Hedrickand Y. Y. Yang, Nano Today, 2009, 4, 302–317.
3 L. E. van Vlerken, T. K. Vyas and M. M. Amiji, Pharm. Res.,2007, 24, 1405–1414.
4 S. Mura, J. Nicolas and P. Couvreur, Nat. Mater., 2013, 12,991–1003.
5 M. Shao, Z. Hussain, H. E. Thu, S. Khan, H. Katas, T. A.Ahmed, M. Tripathy, J. Leng, H.-L. Qin and S. N. A. Bukhari,Colloids Surf., B, 2016, 147, 475–491.
6 N. Nishiyama and K. Kataoka, Pharmacol. Ther., 2006, 112,630–648.
7 J. N. Israelachvili, Intermolecular and Surface Forces: WithApplications to Colloidal and Biological Systems (ColloidScience), 1992.
Fig. 13 (A) MD simulations of OCNs in water. Each OCN contains B122�
units. The core is attached with perfluoroaryl groups with ethereal linkage.The aryl groups are connected with PEG chains (16 ethylene glycol units).(B) The ligands of this OCN contains an extra benzyl group in betweenether and perfluoroaryl group. (C) Simulated systems of tetramer proteinconcanavalin A and sugar-coated OCNs. (inset) Detail of a carbohydratebinding site (Asp (orange), Arg (blue), Leu (cyan), Tyr (green) and Thr (red)).(D) Simulation of another sugar-coated OCN with DC-SIGN protein whichhas a role in HIV infection. (inset) Detail like in (C). (E) Left and right ligandsare used in (C) and (D) sugar coated OCNs respectively (carbon (gray),oxygen (red), sulfur (yellow), fluorine (purple)).49 Reproduced from ref. 49with permission from the Springer Nature, copyright 2016.
Chem Soc Rev Tutorial Review
Publ
ishe
d on
12
Apr
il 20
18. D
ownl
oade
d by
Uni
vers
ity o
f Il
linoi
s at
Chi
cago
on
8/23
/201
8 9:
50:2
5 PM
. View Article Online

3860 | Chem. Soc. Rev., 2018, 47, 3849--3860 This journal is©The Royal Society of Chemistry 2018
8 R. M. Sawant, J. P. Hurley, S. Salmaso, A. Kale, E. Tolcheva,T. S. Levchenko and V. P. Torchilin, Bioconjugate Chem.,2006, 17, 943–949.
9 V. P. Torchilin, Pharm. Res., 2006, 24, 1.10 S.-G. Kang, G. Zhou, P. Yang, Y. Liu, B. Sun, T. Huynh,
H. Meng, L. Zhao, G. Xing, C. Chen, Y. Zhao and R. Zhou,Proc. Natl. Acad. Sci. U. S. A., 2012, 109, 15431–15436.
11 S. Abel, F.-Y. Dupradeau and M. Marchi, J. Chem. TheoryComput., 2012, 8, 4610–4623.
12 J. A. Nash, A. L. Kwansa, J. S. Peerless, H. S. Kim andY. G. Yingling, Bioconjugate Chem., 2017, 28, 3–10.
13 M. Kang, D. Lam, D. E. Discher and S. M. Loverde, MolecularModeling for Micellar Drug Delivery, in Computational Pharma-ceutics: Application of Molecular Modeling in Drug Delivery, ed.D. Ouyang and S. C. Smith, John Wiley & Sons, 2015, p. 53.
14 W. Humphrey, A. Dalke and K. Schulten, J. Mol. Graphics,1996, 14, 33–38.
15 J. C. Phillips, R. Braun, W. Wang, J. Gumbart, E. Tajkhorshid,E. Villa, C. Chipot, R. D. Skeel, L. Kale and K. Schulten,J. Comput. Chem., 2005, 26, 1781–1802.
16 K. Vanommeslaeghe, E. Hatcher, C. Acharya, S. Kundu, S. Zhong,J. Shim, E. Darian, O. Guvench, P. Lopes, I. Vorobyov andA. D. Mackerell, J. Comput. Chem., 2010, 31, 671–690.
17 C. G. Mayne, J. Saam, K. Schulten, E. Tajkhorshid andJ. C. Gumbart, J. Comput. Chem., 2013, 34, 2757–2770.
18 S. J. Marrink, D. P. Tieleman and A. E. Mark, J. Phys. Chem.B, 2000, 104, 12165–12173.
19 H. Cesur, I. Rubinstein, A. Pai and H. Onyuksel, J. Nanomed.Nanotechnol., 2009, 5, 178–183.
20 L. Vukovic, F. A. Khatib, S. P. Drake, A. Madriaga, K. S.Brandenburg, P. Kral and H. Onyuksel, J. Am. Chem. Soc.,2011, 133, 13481–13488.
21 L. Arleth, B. Ashok, H. Onyuksel, P. Thiyagarajan, J. Jacoband R. P. Hjelm, Langmuir, 2005, 21, 3279–3290.
22 D. Sutton, S. Wang, N. Nasongkla, J. Gao and E. E.Dormidontova, Exp. Biol. Med., 2007, 232, 1090–1099.
23 X.-Y. Wang, L. Zhang, X.-H. Wei and Q. Wang, Biomaterials,2013, 34, 1843–1851.
24 J. Lim, S.-T. Lo, S. Hill, G. M. Pavan, X. Sun andE. E. Simanek, Mol. Pharmaceutics, 2012, 9, 404–412.
25 J. Hao, Y. Cheng, R. J. K. U. Ranatunga, S. Senevirathne,M. C. Biewer, S. O. Nielsen, Q. Wang and M. C. Stefan,Macromolecules, 2013, 46, 4829–4838.
26 L. Vukovic, A. Madriaga, A. Kuzmis, A. Banerjee, A. Tang,K. Tao, N. Shah, P. Kral and H. Onyuksel, Langmuir, 2013,29, 15747–15754.
27 S. B. Lim, A. Banerjee and H. Onyuksel, J. Controlled Release,2012, 163, 34–45.
28 A. Dagar, A. Kuzmis, I. Rubinstein, M. Sekosan andH. Onyuksel, Drug Delivery Transl. Res., 2012, 2, 454–462.
29 J. W. Bae, R. M. Pearson, N. Patra, S. Sunoqrot, L. Vukovic,P. Kral and S. Hong, Chem. Commun., 2011, 47, 10302–10304.
30 R. M. Pearson, N. Patra, H.-J. Hsu, S. Uddin, P. Kral andS. Hong, ACS Macro Lett., 2012, 2, 77–81.
31 H.-J. Hsu, S. Sen, R. M. Pearson, S. Uddin, P. Kral andS. Hong, Macromolecules, 2014, 47, 6911–6918.
32 R. M. Pearson, S. Sen, H.-J. Hsu, M. Pasko, M. Gaske, P. Kraland S. Hong, ACS Nano, 2016, 10, 6905–6914.
33 P. R. Leroueil, S. A. Berry, K. Duthie, G. Han, V. M. Rotello,D. Q. McNerny, J. R. Baker, B. G. Orr and M. M. BanaszakHoll, Nano Lett., 2008, 8, 420–424.
34 J. L. Perry, K. G. Reuter, M. P. Kai, K. P. Herlihy, S. W. Jones,J. C. Luft, M. Napier, J. E. Bear and J. M. DeSimone, NanoLett., 2012, 12, 5304–5310.
35 S. Hak, E. Helgesen, H. H. Hektoen, E. M. Huuse, P. A.Jarzyna, W. J. Mulder, O. Haraldseth and C. d. L. Davies,ACS Nano, 2012, 6, 5648–5658.
36 J. Wu, Z. Wang, W. Lin and S. Chen, Acta Biomater., 2013, 9,6414–6420.
37 O. Sedlacek, B. D. Monnery, S. K. Filippov, R. Hoogenboom andM. Hruby, Macromol. Rapid Commun., 2012, 33, 1648–1662.
38 H.-J. Hsu, Y. Han, M. Cheong, P. Kral and S. Hong,unpublished.
39 W. Lin, T. Insley, M. D. Tuttle, L. Zhu, D. A. Berthold,P. Kral, C. M. Rienstra and C. J. Murphy, J. Phys. Chem. C,2015, 119, 21035–21043.
40 S. A. Diaz, S. Sen, K. Boeneman Gemmill, C. W. Brown,E. Oh, K. Susumu, M. H. Stewart, J. C. Breger, G. LasarteAragones, L. D. Field, J. R. Deschamps, P. Kral andI. L. Medintz, ACS Nano, 2017, 11, 5884–5896.
41 W. R. Algar, A. Malonoski, J. R. Deschamps, J. B. Blanco-Canosa,K. Susumu, M. H. Stewart, B. J. Johnson, P. E. Dawson andI. L. Medintz, Nano Lett., 2012, 12, 3793–3802.
42 K. B. Gemmill, S. A. Diaz, J. B. Blanco-Canosa, J. R. Deschamps,T. Pons, H.-W. Liu, A. Deniz, J. Melinger, E. Oh, K. Susumu,M. H. Stewart, D. A. Hastman, S. H. North, J. B. Delehanty,P. E. Dawson and I. L. Medintz, Chem. Mater., 2015, 27,6222–6237.
43 V. Cagno, P. Andreozzi, M. D’Alicarnasso, P. J. Silva,M. Mueller, M. Galloux, R. Le Goffic, S. T. Jones,M. Vallino, J. Hodek, J. Weber, S. Sen, E.-R. Janecek,A. Bekdemir, B. Sanavio, C. Martinelli, M. Donalisio,M.-A. Rameix Welti, J.-F. Eleouet, Y. Han, L. Kaiser, L. Vukovic,C. Tapparel, P. Kral, S. Krol, D. Lembo and F. Stellacci, Nat.Mater., 2018, 17, 195–203.
44 D. Matulis and R. Lovrien, Biophys. J., 1998, 74, 422–429.45 Y. Chen, T. Maguire, R. E. Hileman, J. R. Fromm, J. D. Esko,
R. J. Linhardt and R. M. Marks, Nat. Med., 1997, 3, 866–871.46 W. Zhang, P. R. Chipman, J. Corver, P. R. Johnson, Y. Zhang,
S. Mukhopadhyay, T. S. Baker, J. H. Strauss, M. G.Rossmann and R. J. Kuhn, Nat. Struct. Biol., 2003, 10,907–912.
47 Y. Porat, A. Abramowitz and E. Gazit, Chem. Biol. Drug Des.,2006, 67, 27–37.
48 S. Sen, L. Vukovic and P. Kral, unpublished.49 E. A. Qian, A. I. Wixtrom, J. C. Axtell, A. Saebi, D. Jung,
P. Rehak, Y. Han, E. H. Moully, D. Mosallaei, S. Chow,M. S. Messina, J. Y. Wang, A. T. Royappa, A. L. Rheingold,H. D. Maynard, P. Kral and A. M. Spokoyny, Nat. Chem.,2016, 9, 333–340.
50 C. M. Coleman, C. St. Gelais and L. Wu, Adv. Exp. Med. Biol.,2013, 762, 109–130.
Tutorial Review Chem Soc Rev
Publ
ishe
d on
12
Apr
il 20
18. D
ownl
oade
d by
Uni
vers
ity o
f Il
linoi
s at
Chi
cago
on
8/23
/201
8 9:
50:2
5 PM
. View Article Online