CheeYen Lau-thesis PDF
80
EFFECTS OF MANGIFERIN IN IMPROVING METABOLIC SYNDROME RISK FACTORS IN MICE FED HIGH FAT DIET By CHEE YEN LAU Bachelor of Science in Medical Bioscience Monash University Sunway City, Malaysia 2009 Submitted to the Faculty of the Graduate College of the Oklahoma State University in partial fulfillment of the requirements for the Degree of MASTER OF SCIENCE May, 2012
-
Upload
cheeyen-lau -
Category
Documents
-
view
140 -
download
0
Transcript of CheeYen Lau-thesis PDF

EFFECTS OF MANGIFERIN IN IMPROVING
METABOLIC SYNDROME RISK FACTORS IN MICE
FED HIGH FAT DIET
By
CHEE YEN LAU
Bachelor of Science in Medical Bioscience
Monash University
Sunway City, Malaysia
2009
Submitted to the Faculty of the
Graduate College of the
Oklahoma State University
in partial fulfillment of
the requirements for
the Degree of
MASTER OF SCIENCE
May, 2012
ii
EFFECTS OF MANGIFERIN IN IMPROVING
METABOLIC SYNDROME RISK FACTORS IN MICE
FED HIGH FAT DIET
Thesis Approved:
Dr. Edralin A. Lucas
Thesis Adviser
Dr. Brenda J. Smith
Dr. Barbara J. Stoecker
Dr. Sheryl Tucker
Dean of the Graduate College

iii
TABLE OF CONTENTS
Chapter Page
I. INTRODUCTION ......................................................................................................1
Introduction ..............................................................................................................1
Hypothesis................................................................................................................4
Objectives ................................................................................................................4
II. REVIEW OF LITERATURE
Metabolic syndrome prevalence ..............................................................................5
Pathophysiology of obesity ......................................................................................6
Insulin resistance ......................................................................................................8
Atherosclerosis .......................................................................................................10
Hypertension ..........................................................................................................11
Peroxisome proliferator activated receptor agonists……………... .......................13
PPAR, insulin sensitivity, and dyslipidemia ..........................................................14
Adverse effects of Thiazolidinediones (TZDs) ..................................................... 15
Weight gain…………………………………………………………………. 15
Edema ..................................................................................................……..16
Bone loss ........................................................................................................16
Increased risk and death from CVD...............................................................17
Composition of mango ............................................................................................18
Polyphenolic compounds ........................................................................................20
Mangiferin...............................................................................................................21
Factors affecting the contents of antioxidant compounds in mango.......................22
Anti-diabetic and hypolipidemic effects of mangiferin ..........................................24
Antioxidant property of mangiferin ........................................................................27
Anti-inflammatory effect of mangiferin .................................................................30

iv
Chapter Page
III. METHODOLOGY
Animal care ............................................................................................................32
Dietary treatments ..................................................................................................32
Glucose tolerance test ............................................................................................33
Necropsy and tissue processing .............................................................................33
Clinical analyses ....................................................................................................34
Plasma insulin ........................................................................................................36
Liver and fecal total lipids……………………………………………………... ..36
Liver and adipose tissue histology .........................................................................37
Statistical analyses .................................................................................................37
IV. FINDINGS
Food intake, body and tissue weights ....................................................................41
Whole body composition .......................................................................................42
Clinical chemistry ..................................................................................................43
Glucose tolerance test ............................................................................................44
Histology ................................................................................................................45
V. DISCUSSION .........................................................................................................53
VI. REFERENCES………………………………………………………………….. 60

v
LIST OF TABLES
Table Page
1. Typical nutrient composition of mango pulp ........................................................19
2. Total phenolic and individual phenolic compound in mango pulp, peel, kernel and
stem bark. ..............................................................................................................20
3. Total phenolics, total carotenoids, β-carotene, and total ascorbic acid in the pulp of
four mango cultivars .............................................................................................22
4. Nutrient composition of freeze-dried Tommy Atkins mango used in the study…...
...............................................................................................................................38
5. Composition of the experimental diets .................................................................39
6. Effects of mango, rosiglitazone,and mangiferin on food intake and body and tissue
weights of mice fed high fed diets for two months ...............................................46
7. Effects of mango, rosiglitazone,and mangiferin on body composition, bone mineral
area (BMA), content (BMC), and density (BMD) of mice fed high fat diet for two
months ..................................................................................................................47
8. Effects of mango, rosiglitazone, and mangiferin on clinical chemistry parameters,
and liver and fecal total lipid of mice fed high fat diet for two months ...............48
vi
LIST OF FIGURES
Figure Page
1. Mangiferin structure………………………………………………………….21
2. Effects of mango, rosiglitazone, and mangiferin on weekly body weights of mice
fed with high fed diets for two months…………………………………….. ..49
3. Effects of mango, rosiglitazone, and mangiferin on glucose tolerance
(a) after 30 days of treatment…………………………………………………50
(b) after 60 days of treatment…………………………………………………50
(c) total glucose area under the curve…………………………………………51
4. Effects of mango, rosiglitazone and mangiferin on liver and adipose tissue
histology of mice fed high fat diets for two months…………………………..52

1
CHAPTER I
INTRODUCTION
Metabolic syndrome (MetS) is a complex disease which interlinks the risk factors for
cardiovascular disease (CVD) and diabetes [1]. According to the International Diabetes
Foundation (IDF) and the American Heart Association/National Heart, Lung, and Blood Institute
(AHA/NHLBI) [2], there are five characteristics for the clinical diagnosis of metabolic
syndrome: 1) waist circumference >102 cm and 88 cm, for men and women, respectively; 2)
triglycerides >150 mg/dL (1.7mmol/L); 3) high density lipoprotein-cholesterol (HDL-C) <
40mg/dL (1.0mmol/L) and 50mg/dL (1.3mmol/L) for men and women, respectively; 4) systolic
or diastolic blood pressure >130 mmHg or 85 mmHg, respectively; and 5) glucose >100mg/dL.
The presence of any three out of the five risk factors is considered diagnosis of MS [2]. Metabolic
syndrome is strongly associated with prothrombotic and proinflammatory states [1].
According to the Centers for Disease Control and Prevention (CDC), the prevalence of
obesity in the United States for the past 25 years (1985-2010) has increased dramatically, with
obesity rate of 25% or more in 36 states [3]. Diabetes, on the other hand, affects 25.8 million
people (approximately 8.3% of the American population) in the year 2010 [4]. An estimated of
81 million American adults were affected with one or more types of CVD in the year 2010. If this
trend continues, the health status of the US population is in jeopardy. Therefore, determination of
the underlying causes and treatments for factors associated with MetS are of utmost importance.

2
Some of the factors involved in the development of MetS are modifiable and some are not. Age
and gene inheritance are uncontrollable risk factors. However, dietary fat intake and physical
inactivity are modifiable MetS risk factors. Long-term consumption of high fat diet and sedentary
lifestyle are strongly associated with excessive accumulation of abdominal fat, which is
associated with elevated levels of circulating free fatty acids (FFAs) due to the expansion of
adipose tissues [5-7]. Obesity is accompanied with enlarged adipose tissues, leading to the
activation of certain protein kinases and inflammatory mediators which inhibit the insulin actions.
Impaired insulin actions will lead to elevated levels of FFAs and over time, increased
concentration of circulating FFAs lead to the accumulation of lipids or plaque formation in the
blood vessel and hence formation of CVD. Hypertension is another MetS risk factor and a
contributor to the development of CVD. Artery stiffness reduces the arterial elasticity through the
recruitment of inelastic collagen fibers and causes hypertension [8]. Consequently, the heart
needs to work harder in order to pump blood to meet the demands of the body and thus,
increasing the chances of developing coronary events.
Pharmacological interventions are available to manage MetS risk factors such as
modulating blood lipids and lowering blood glucose. Pharmacological agents like atorvastatin
(e.g. Lipitor) and fenofibrate (e.g. Lipofen) are common medications for lowering blood lipids.
Atorvastatin reduces blood cholesterol by combinations of two major mechanisms 1) inhibiting 3-
hydroxy-3-methylglutaryl coenzyme A (HMG-CoA) reductase activity by up regulating the
apoB/E receptor which reduces synthesis of low density lipoprotein (LDL) and increases
removal of LDL from the plasma [9, 10]; and 2) reducing production of very low density
lipoprotein (VLDL) particles with less cholesterol ester but more triacylglycerol [11, 12].
Fenofibrate, decreases triglyceride levels while increasing HDL-cholesterol in plasma [13].
Thiazolidinediones (TZDs) (e.g. rosiglitazone), conversely, are used to restore insulin sensitivity
in type 2 diabetes patients by promoting free fatty acid ( FFA) uptake and triglyceride synthesis in

3
the subcutaneous tissue. TZDs also increases glucose uptake in the liver and skeletal muscle by
elevating the gene expression and translocation of glucose transporters GLUT1 and GLUT4 to
the cell surface [14]. Unfortunately, the use of these pharmacological agents, even for short term,
is associated with side effects [15]. Study shows that short-term use of rosiglitazone is associated
with an increased risk of myocardial infarction and death rate from cardiovascular disease [15],
increased stress on left ventricular wall and hence greater oxygen demand for myocardial cells
[16] , edema [16], and bone loss [17].
Because of the undesirable side effects associated with the use of pharmacological agents
to manage blood lipids and glucose, alternative treatments are being explored. Eating a well-
balanced diet is strongly encouraged as means of improving clinical parameters or maintaining
health. Fruits and vegetables are great sources of fiber, antioxidants and other bioactive
compounds that can lower glucose levels, modulate blood lipids, lower blood pressure, and
positively influence other MetS risk factors [18, 19]. The viscosity of the fibers found in fruits
and vegetables contributes to the cholesterol-lowering property. Fruits and vegetables have high
insoluble fiber content and are low in energy, fat and simple sugar, which contribute to reducing
the risk of obesity and hypertriglyceridemia [20]. Antioxidant, that are abundant in fruits and
vegetables have been shown to prevent the initiation or propagation of the oxidation process,
which protects against coronary heart disease and cancer [21]. Furthermore, bioactive
compounds such as vitamins and flavonoids in fruits and vegetables possess antioxidant and anti-
inflammatory properties, which helps in alleviating MetS risk factors such as obesity and insulin
resistance as well as prevent or delay other development of many chronic diseases [22].
One fruit that is rich in anti-oxidants, vitamins, and other bioactive compounds such as
flavonoids (e.g. quercetin and glucosylated xanthone) is mango. There has been increasing
interests in mango for many years in terms of health benefits [23]. Antioxidant vitamins
including vitamins A, C, E, are critical for prevention of oxidative damage to cell membranes and

4
thus degenerative diseases. Mango peel and pulp also contain carotenoids (provitamin A and
beta-carotene) and polyphenols such as quercetin, gallic acid, catechins which counteract free
radicals that are associated with various diseases. A bioactive compound mangiferin found in
mango bark, fruits, roots and leaves, has been used in India for the treatment of arteriosclerosis,
coronary heart disease and diabetes [24]. Studies have shown that mangiferin exhibits anti-
diabetic [25-27] , hypolipidemic and anti-atherogenic properties [26, 28, 29] by reducing plasma
total cholesterol, triglycerides, low density lipoprotein-cholesterol (LDL-C) and increasing levels
of high density lipoprotein (HDL-C) [26]. In addition, mangiferin has been shown to reduce the
production of reactive oxygen species and hence the risk of insulin resistance by restoring
mitochondrial redox homeostasis [30, 31] and also exhibit anti-inflammatory properties [32, 33].
However, to our knowledge, limited studies have been done comparing the effect of mango pulp
to mangiferin and rosiglitazone on clinical parameters associated with MS. How much mangiferin
contributes to the positive effect of mango pulp is not known. The specific aim of the study is to
compare the effects of freeze-dried mango pulp to that of mangiferin and rosiglitazone, a known
peroxisome proliferator activated receptor-ϒ (PPAR-ϒ) agonists, on reducing factors associated
with MetS.
Our null hypothesis is that there will be no difference between mangiferin, freeze-dried
mango, and rosiglitazone in
a) modulating body composition,
b) decreasing blood glucose and lipid concentration, and
c) modulating other clinical parameters in mice fed with high fat diet.
5
CHAPTER II
REVIEW OF LITERATURE
Metabolic syndrome prevalence
Metabolic syndrome (MetS) is a constellation of health issues including abdominal
obesity, hypertension, insulin insensitivity, dyslipidemia, resulting to an elevated risk for diabetes
and coronary heart disease. The presence of three of these five risk factors is considered
diagnosis of MS: 1) waist circumference >102 cm and 88 cm, for men and women, respectively
2) triglycerides >150 mg/dL (1.7mmol/L); 3) high density lipoprotein-cholesterol (HDL-C) <
40mg/dL (1.0mmol/L) and 50mg/dL (1.3mmol/L) for men and women, respectively; 4) systolic
or diastolic blood pressure >130 mmHg or 85 mmHg; respectively; and 5) glucose >100mg/dL.
Individuals with metabolic syndrome is strongly associated with prothrombotic and
proinflammatory states [1]. Obesity is the starting point for the development of metabolic
syndrome and obesity induced insulin resistance is a critical contributor to other chronic diseases
associated with MetS [34]. Therefore, the increasing prevalence and associated medical expenses
for both obesity and diabetes are of crucial concerns in the US and worldwide.
According to the National Health and Nutrition Examination Survey (NHANES) in 2007-
2008 [35], the percentage of obesity were 32.2 and 35.5 for adult men and women, respectively.
An estimated $147 billion were spent for medical bills associated with obesity in 2008 [36]. The
National Diabetes Fact Sheet 2011 released by Centers for Disease Control and Prevention

6
(CDC) [37] showed approximately 10.9 million or 26.9% of US citizens aged 65 years or older
were diagnosed with diabetes. Furthermore, diabetes affects approximately 215,000 children
younger than 20 years old. The total expenditure for diabetes was approximately $174 billion, in
which $116 billion was attributed to the direct medical costs of diabetes in the year 2010. On the
other hand, the indirect costs such as work loss, disability and premature mortality were
approximately $58 billion. Consequently, all the costs associated with obesity-related chronic
conditions imposed enormous negative impact on the nation’s productivity.
Pathophysiology of obesity
Obesity is a condition of excessive adipose tissues. Adipose tissue is a specialized type of
connective tissue composed of fat cells embedded in a collagenous structure in order to provide
support to the fat cells, capillaries and nerve fibers that penetrate the adipose tissues. The fat-
storing adipocytes are influenced by dietary intake and hormonal responses [38].
The amount of fat in adipose tissue normally stays constant even though continuous turn
over occurs. A healthy individual exhibits homeostatic control in terms of fat synthesis and
storage by regulating the balance between lipid breakdown and mobilization [39] . Obesity, on
the other hand, demonstrates abnormality in terms of lipid storage regulation in fat tissues. The
accumulation of fat in adipose tissues arises due to the transfer of plasma lipid to fat cells [39].
The lipoprotein bound in triglyceride like chylomicrons or VLDL are acted upon by the enzyme,
lipoprotein lipase, to release glycerol and fatty acids where the fatty acids will then enter into the
fat cells and are converted to triglyceride for storage [39]. Triglyceride (TG) storage is formed
from both fatty acids and α-glycerophosphate, in which glucose uptake and metabolism are
necessary in order to provide sources of α-glycerophosphate from glucose. [39].
When a person is energy deprived, the free fatty acids (FFA) are released from the TG
stores in the adipose tissues and bind to the albumin in circulation [39]. The release of the fatty

7
acids is activated by lipolytic hormones such as catecholamines (epinephrine and
norepinephrine), glucagon, and secretin [39]. When the hormones bind to the receptors on the
adipocytes surface, the enzyme adenyl cyclase is activated. The stimulation of the enzyme adenyl
cyclase increases the levels of cyclic-3’,5’-AMP (cAMP), which activates lipolytic lipase [39].
Furthermore, the presence of insulin exhibits anti-lipolytic properties through general
mechanisms including the inhibition of the enzyme adenyl cyclase, the activation of the cAMP
phosphodiesterase which leads to cAMP degradation, and the promotion of glucose uptake and
lipid storage [39]. When food intake exceeds energy expenditure, accumulation of fat happens by
expanding the existing fat cells (i.e. hypertrophy) or forming new fat cells (i.e. hyperplasia),
hence, obesity occurs if this situation persists [40].
Obesity is also strongly associated with inflammation, which was well demonstrated by
Hotamisligil and colleagues [41]. This group of researchers showed excessive expression of the
pro-inflammatory cytokine, tumor necrosis factor- alpha (TNF-α) in adipose tissue of obese
individuals. The connection between obesity and inflammation is further reinforced when
elevated plasma concentration of proinflammatory mediators such as TNF-α, interleukin-6 (IL-6),
C - reactive protein (CRP), and migration inhibitory factor (MIF), were found in obese people
[42-46]. Ghanim and colleagues [47] demonstrated that increased levels of proinflammatory
cytokines were found in adipose tissues of the obese individuals. Moreover, a significant increase
of the binding of nuclear factor-κB (NF- κB) and declined levels of the inhibitor of NF-- κB-
kappaB kinase beta (IĸBβ) were observed. Therefore, inflammatory processes take place in
obesity.
8
Insulin resistance
Since obese individuals have excess TG storage in adipose tissues, the risk of developing
insulin resistance increases. It has been demonstrated that obese individuals exhibit high rates of
breakdown and uptake of fatty acids [48]. FFAs taken up by the skeletal muscle and liver undergo
β-oxidation in the mitochondria or are stored as triglycerides [49]. When the skeletal muscle or
liver cells are saturated with products of β-oxidation, increased triglyceride synthesis occurs.
Metabolites of FA synthesis, diacylglycerol (DAG) and ceramide start to accumulate [50] . DAG
and ceramide up- regulate protein kinases like JUN N-terminal kinase 1 (JNK1) and the inhibitor
of nuclear factor-κB (NF- κB) kinase-β (IKKβ), which inhibit insulin action by increasing the
inhibitory serine phosphorylation of insulin receptor substrates (IRS) [51-53]. Phosphorylation of
IRS inhibits insulin signaling resulting to insulin resistance [54].
The expansion of adipose tissue in obese individuals leads to inadequate supply of
oxygen to the adipose tissues [6, 7, 55] , which activate JNK1, IKKβ and other genes involved in
endoplasmic reticulum (ER) stress and inflammation. Up-regulation of JNK and IKKβ activates
expressions of inflammatory pathway and genes, which is crucial for the activation, adhesion and
migration of macrophages to the adipose tissues [56]. The release of chemokine from adipose
tissue recruits macrophages in the adipose tissue [55, 57, 58]. Majority of the content in obese
adipose tissue macrophages (ATM) are pro-inflammatory macrophages which secrete TNF- α and
IL-6. Increased production of TNF- α and IL-6 stimulate serine phosphorylation of IRS-1and
prohibits the binding of IRS-1 with the insulin receptor, thus, inhibiting insulin signaling [59, 60].
Obesity is also associated with an accumulation of unfolded proteins in the endothelium
reticulum (ER). A protective response known as unfolded-protein response (UPR) functions as a
homeostatic restoration of ER [61, 62]. Inositol-requiring kinase 1(IRE1) is one of the stress
sensing mediator transmembrane proteins located in ER [61, 63, 64]. An elevated level of plasma

9
glucose often associated with obesity, induces the autophosphorylation of IRE1 and leads to
degradation of IĸB. Hence, NFĸB is secreted and an activation of pro-inflammatory response
occurs due to ER stress [65, 66]. Chronic elevation of circulating glucose activates both the JNK
and IKK-NFĸB signaling pathways, which up-regulates the pro-inflammatory genes and causes
impairment of insulin [62] .
Another consequence of obesity is ectopic accumulation of fat in muscle, which
contributes to mitochondrial dysfunction [67] . Mitochondrial dysfunction causes a decline in the
expressions of nuclear encoded genes which modulate the mitochondrial homeostasis like PPAR-
ϒ [68]. The elevated levels of intracellular FA metabolites like DAG and ceramide, increase
oxidative stress due to increased incidence of mitochondrial uncoupling, which leads to the
production of reactive oxygen species (ROS) [69]. ROS and oxidative stress, in return, activate
the protein kinases signaling cascades, serine phosphorylation of IRS-1 and thus, impairs insulin
sensitivity [30, 31].
Hyperinsulinemia, a condition in which excessive circulating insulin in plasma relative to
the plasma glucose contributes to insulin resistance. It has been shown that the presence of
insulin triggers the expressions of the main hepatic lipogenic transcription factor, SREBP-1c and
increased expressions of liver SREBP-1c was observed in obese rodents [70]. Consequently, the
rodents exhibited reduced insulin sensitivity due to the down regulation of mRNA for IRS-2,
which is a critical component insulin signaling [71]. Therefore, hyperinsulinemia causes hepatic
lipogenesis-steatosis as well as debilitating the ability of insulin to suppress hepatic glucose
output [71].

10
Atherosclerosis
A chronic high fat dietary intake increases the permeability of the endothelium. The
increased permeability is due to the accumulation of lipids and lipoproteins beneath the
endothelium. Peripheral monocytes and T-lymphocytes attach and adhere to the endothelial cells
through adhesive cell-surface glycoproteins while leukocytes attach to endothelium through
ligand-receptor mechanism, leading to inflammatory response [72]. Chemokine produced during
the inflammatory response bind to endothelial surface which attracts the leukocytes into the
subendothelial space. In addition to leukocytes, monocytes are converted to activated
macrophages and take up the oxidized low-density lipoprotein through the scavenger receptors
which can develop into foam cells. The accumulation of foam cells in the intima lead to
formation of fatty streak and atherosclerosis lesions. The persistence of inflammatory actions
adversely affects the artery wall [73]. Remodeling of the atherosclerostic lesions to a formation of
fibrous plaque may occur if inflammatory response continues. Consequently, the integrity of the
artery wall is disrupted, and atherosclerosis arises [73].
An increased level of circulating FFAs due to high fat diets is also a predominant
contributor the production of highly atherogenic, easily oxidized and less readily cleared, small
and dense low-density lipoproteins (LDL) [74]. In the liver, high fat diet leads to increase
synthesis of very-low-density lipoproteins (VLDL) and decrease triglyceride clearance [75]. The
declined triglyceride clearance is due to decreased activity of lipoprotein lipase and cholesterol
ester transfer protein (CETP), which mediates the transfer of triglyceride from VLDL to HDL in
exchange of cholesteryl esters. Reduced activity of hepatic lipoprotein lipase and CETP results to
an increase in small and dense LDL, hence increasing the likelihood of atherosclerosis [75].
Other factors such as elevated glucose can also contribute to an increase in
atherosclerotic lesion formation. A high concentration of circulating blood glucose which
determines the amount of the formation of advanced glycosylation end products (AGEs) among
11
long-lived proteins such as collagen in insulin-independent tissues [76] also contributes to
atherogenesis. As a result, the irreversible AGE-linked collagen leads to alteration of the
mechanical properties of the interstitial tissues of the arterial wall and thus arterial stiffness [77].
The endothelial cell function deteriorates because AGEs diminishes the generation of nitric oxide
but increases the production of oxidant species like peroxynitrate [78] . In addition, AGEs trigger
inflammatory responses and stress signaling, which increase the production of NF-κB, free
radicals, proinflammatory cytokines and vascular adhesion molecules [79, 80] . The elevated
concentration of proinflammatory and stress mediators weaken the integrity and the elasticity of
the endothelial cells through matrix metalloproteases (MMPs) [81], leading to arterial stiffness.
Moreover, MMPs also causes smooth muscle tone elevation, suppress endothelial flow-mediated
dilation, deteriorate vascular injury responses and functions of angiogenesis and enhance the
formation of atherosclerotic plaque, which are all contributors to coronary disease [82-84].
Hypertension
Blood pressure elevation is common among obese individuals. The increased production
of pro-inflammatory molecules like TNF-α and IL-6 in obese individuals are associated with
increased blood pressure [54]. As TNF α and IL-6 trigger serine phosphorylation of IRS-1, the
binding of IRS-1 with the insulin receptor is prevented, leading to inhibition of insulin signaling
[61, 62]. Consequently, the plasma concentration of insulin remains elevated which can promote
renal sodium reabsorption as insulin possess anti-natriuretic effects [85-87]. The renal sodium
retention increases salt sensitivity and intravascular fluid, leading to increased cardiac output and
peripheral resistance. Blood pressure increases accordingly and therefore, hypertension develops
[88] .
Insulin resistant individuals also possess high levels of plasma endothelin-1 [89], which
functions as a vasoconstrictor. Endothelin-1 activation results in the formation of inositol 1,4,5-
12
trisphosphate (IP3) which mobilizes calcium ions from sarcoplasmic reticulum (SR) , leading to
skeletal muscle vasoconstriction, increased blood pressure and thus hypertension [89].
The secretion of IL-6 by adipose tissues also triggers the activation of sympathetic
nervous system, followed by a rise in plasma angiotensionogen and angiotensin II, resulting to
hypertension development [90]. It has been shown that muscle sympathetic nervous activities
(MSNA) in obese patients are significantly higher than normal individuals [91]. As a result, the
elevation of resting heart rates in conjunction with baroreflex dysfunction contributes to
hypertension [92, 93] . Renin-angiotensin system (RAS) regulates blood pressure through
modulation of vascular tone and renal sodium reabsorption [94] and is influenced by food intake.
As a result, calorie overload causes increased expressions of gene for angiotensinogen
(angiotensin converting enzyme) and type I angiotensin in adipose tissue leading to increased
angiotensin II formation in adipocytes [94]. Subsequently, angiotensin II imposes inhibitory
effects to insulin action via increased concentration and activity of RhoA and reactive oxygen
species generation, leading to a decline in production of NO in endothelial cells and elevated
vasoconstriction [95] and therefore, resulting to hypertension.

13
Peroxisome proliferator activated receptor agonists
Thiazolidinedione (TZD) drugs are generally used to modulate plasma glucose levels
among type 2 diabetics. The common TZDs used in the United States are rosiglitazone (Avandia,
GlaxoSmithKline) and pioglitazone (Actos, Takeda) and the anti-diabetic actions are mediated
through the activation of peroxisome proliferator activated receptor-ϒ (PPAR-ϒ). There are three
isoforms for peroxisome proliferator activated receptor (PPAR)—PPAR-α, - γ and –δ. All the
PPAR isoforms are nuclear receptors and are activated by fatty acids and fatty acid-derived
eicosanoids [96].
The expressions of PPAR-α is mostly in tissues which are involved in fatty acid
catabolism like liver, skeletal muscle, heart, and kidney [97]. PPAR- γ is expressed
predominantly in adipose tissue, it is also found in vascular endothelium, pancreatic beta cells and
macrophages [98, 99]. PPAR- δ, on the other hand, is highly expressed in the brain, adipose
tissue and skin [100].
When TZDs bind to PPAR-ϒ, activation of PPAR-ϒ occurs and heterodimers of PPAR-
RXR (retinoid-X-receptors) are formed. The binding of the heterodimers to DNA-specific
sequences (peroxisome proliferator-response elements) promotes or deactivates the transcription
of target genes regulating glucose and lipid metabolism. Since PPAR isoforms exhibit sensitivity
and selectivity to ligands and the coactivator proteins, diverse sets of genes [101] involved in
fatty acid uptake and oxidation, inflammation, and vascular functions are modulated. The
regulation of the process in the uptake and storage of the fatty acid, glucose homeostasis and
inflammation are controlled by the genes encoding PPAR- γ. The activation of PPAR-α induces
oxidation of free fatty acids, promotes anti-inflammatory responses, and regulates genes that
modulate lipoprotein concentrations [102-104]. Whereas gene encoding for PPAR- δ is
responsible for the metabolism of fatty acid, inflammation and macrophage lipid homeostasis
[101]. Since rosiglitazone is an agonist for PPAR- γ, the mechanisms of actions of PPAR- γ in

14
promoting glucose and lipid metabolism will be the focus of discussion.
PPAR- γ, insulin sensitivity and dyslipidemia
The synthetic ligands for PPAR- γ have been demonstrated to be effective for treating
diabetes mellitus due to its ability to restore insulin sensitivity. The cellular actions of PPAR- γ
agonists include stimulation of adipocyte differentiation from the uptake of the FFA and hence fat
storage in subcutaneous rather than visceral adipose tissue, leading to a reduction of FFA levels
and FFA- induced insulin resistance. Moreover, when the expression of PPAR- γ increases,
translocation of the glucose transporters GLUT1 and GLUT4 to the cell surface increases.
Therefore, the plasma glucose concentration is reduced as increased rate of glucose uptake to the
liver and skeletal muscle cells occur [14]. Another mechanism of action of PPAR- γ agonists to
improve insulin sensitivity is by increasing the secretion of adiponectin [105] while reducing the
secretion of TNF- α [106]. The presence of adiponectin increases FA oxidation in the liver [107]
and muscle cells [108-110]. When circulating FFA declines, the number of macrophages
surrounding the adipose tissue decreases. Therefore, the inflammatory response triggered by
TNF- α from the macrophages is attenuated, which improves insulin resistance [59, 60].
In addition to increasing insulin sensitivity, the activation of PPAR- γ regulates lipid
homeostasis by promoting FA uptake and storage in adipose tissue, leading to adipose tissue mass
expansion. Gene expression of several receptors and proteins are also up-regulated by activation
of PPAR- γ. These proteins include 1) CD36, receptor important for increased uptake of oxidized
LDL [111]; 2) acyl-CoA synthetase, for triglyceride synthesis; 3) lipoprotein lipase, enzyme for
hydrolyzing triglyceride in chylomicron and VLDL and providing NEFA and monoacylglycerols
for utilization of tissues [112, 113]; 4) glycerol kinase (GyK), enzyme important for the
conversion of glycerol to glycerol- phosphate, compound involved in TG synthesis [114]; 5)
ABCA1, which is a membrane transporter responsible for excess cholesterol from extrahepatic
cells to be transported to the liver for bile acid synthesis or cholesterol recycling [115-118].
Additionally, activation of PPAR-ϒ reduces secretion of leptin [119, 120] leading to decreased
15
caloric intake [121-123] and TNF-α, which can improve insulin signaling pathway by increasing
the binding of IRS-1 to the insulin receptor [59, 60].
Adverse effects of Thiazolidinediones (TZDs)
The most common side effects of the use of TZDs include weight gain, edema, bone loss
and increased risks of death from cardiovascular disease. The next section will discuss studies
that demonstrate the side effects of TZDs particularly rosiglitazone.
Weight gain
Weight gain is the most common side effects of rosiglitazone use [124]. A mean
increased in weight of 1.9 kg and 2.9 kg was observed with the daily use of rosiglitazone (4 mg
and 8 mg, respectively) for 52 weeks [124] . In a 26-week study, the co-administration of
rosiglitazone (4-mg daily dose) with sulfonylurea or metformin both showed increased weight of
1.8 kg as compared to monotherapy of sulfonylurea or metformin [125]. The weight gain effect
was more prominent when rosiglitazone was co-administered with insulin. The increased weights
of 4.1kg and 5.4kg were observed when daily doses of rosiglitazone at 4- mg and 8- mg were
added to the insulin, respectively.
Administration of TZD alone or co-administration with metformin, sulfonylurea, or
insulin lead to weight gain as a result of fluid retention [124]. Plasma volume was shown to
significantly increase by 1.8 mL of water per kg body weight among the healthy individuals
receiving 8mg of rosiglitazone once daily when compared to placebo [124]. Consequently,
subjects receiving rosiglitazone had hemoglobin levels decreased by 0.8 -1.1 g/dL relative to
whether the drug was used as monotherapy or combination of both rosiglitazone with
sulfonylurea, metformin, or insulin [124].
16
Edema
With increased fluid retention, edema is also a common side effect of rosiglitazone.
Compared to placebo, edema occurred in 4.8 % vs. 1.3 % of the 9,900 type 2 diabetic patients
under Avandia medications [124]. Additionally, 3- 4 % of patients receiving the combination
therapy of rosiglitazone with metformin or sulfonylurea, also experienced edema compared to
only 1.1-2.2 % of the patients under metformin or sulfonylurea alone [124]. These findings
demonstrated that edema is an associated side effect with TZD drugs, irrespective of mono or
combined therapy with other anti-diabetic agents.
The pathogenesis of fluid retention leading to edema with the use of TZD is not fully
understood. Since the reciprocal relationship between plasma volume and renal sodium excretion
is well established, it is believed that edema is caused by the increased rates of sodium and water
retention [126]. The synergistic interaction between TZD and insulin induces arterial
vasodilatation, activates sodium reabsorption and increases extracellular volume, leading to pedal
edema [126]. Other possible contributors to edema include increased sympathetic nervous system
actions [127], alterations in transport of interstitial ion [128] and endothelial permeability [129],
as well PPAR-ϒ-induced regulation of vascular permeability growth factor [130].
Bone Loss
Animal and human studies have shown that rosiglitazone use can lead to bone loss
[17, 131, 132]. Rzonca and colleagues found that 6-month old, non-diabetic C57BL/6 mice
showed significant total bone mineral density reduction with the administration of rosiglitazone
of 20 µg/g body weight per day for 7 weeks. Bone volume, trabecular number and width were
reduced while trabecular spacing was increased. The researchers also found decreased gene
expressions of the osteoblasts transcription factor, runt-related transcription factor-2 (Runx2)
[132]. Similarly, in a study conducted by Afshan et.al.found that the administration of

17
rosiglitazone (25 µg/g body weight) daily for 28 days in 5-month old Swiss-Webster mice,
showed signs of bone loss. The signs of bone loss include increased marrow adipocytes, and
decreased in the ratio of osteoblasts to osteoclasts, rate of bone formation and the width of bone
wall. Furthermore, the gene expressions for osteoblasts transcription factors Runx2 and Osterix
also decreased in the cell cultures of marrow-derived mesenchymal progenitors [17].
One mechanism to explain bone loss associated with rosiglitazone is the modification
of common mesenchymal progenitors from osteoblast to adipocyte lineage, which leads to
increase formation of adipocytes, but a decline in osteoblasts [133, 134]. This reciprocal
relationship of marrow adipocytes and osteoblasts is due to their derivation from a common
mesenchymal progenitor [135-138]. The suppression of the osteoblast lineage causes reduced
expressions of Runx2 and Osterix genes, crucial transcription factors for osteoblastogenesis.
Consequently, the expressions for bone matrix proteins such as collagen, bone sialoprotein,
osteocalcin will be arrested, leading to bone loss [139, 140].
Increased risks and death from CVD
A meta-analysis of 42 clinical trials (24 to 52 weeks in duration) comparing the
effects of rosiglitazone with placebo or comparable oral anti-diabetic agents on cardiovascular
outcomes was conducted by Nissen and Wolski [15]. The odds ratio for risks of myocardial
infarction and death from cardiovascular causes in the rosiglitazone group, when compared to the
control group, were 1.43 (95% confidence interval [CI], 1.03 to 1.98; P=0.03) and 1.64 (95% CI,
0.98 to 2.74; P=0.06), respectively. This indicated that rosiglitazone was associated with
approximately 1.5 times risk of developing myocardial infarction and death from cardiovascular
diseases [15].
Rosiglitazone was also shown to affect the lipid profile. A mean increase of 18.6% in
LDL cholesterol among individuals on rosiglitazone (8-mg daily dosage for 26 weeks) as

18
compared to placebo was demonstrated by Khan et.al. [125]. This increase in LDL cholesterol
was a contributor to negative cardiovascular outcomes with rosiglitazone use [16]. Furthermore,
rosiglitazone and other TZD could cause congestive heart failure among vulnerable patients [16].
Congestive heart failure is strongly associated with increase in intravascular volume. The stress
level on the left ventricular heart elevates when the intravascular volume increases, leading to
increased oxygen demand for myocardial cells. Therefore, the chances of triggering ischemic
events are generally higher among susceptible patients [16].
Considering the use of rosiglitazone is associated with negative side effects, the
incorporation of fruits and vegetables which are rich sources of nutrients and bioactive
compounds is one alternative in preventing chronic conditions. A fruit such as mango, a rich
source of vitamins and polyphenolic compounds which have antioxidant properties, may help
prevent MetS risk factors.
Composition of mango
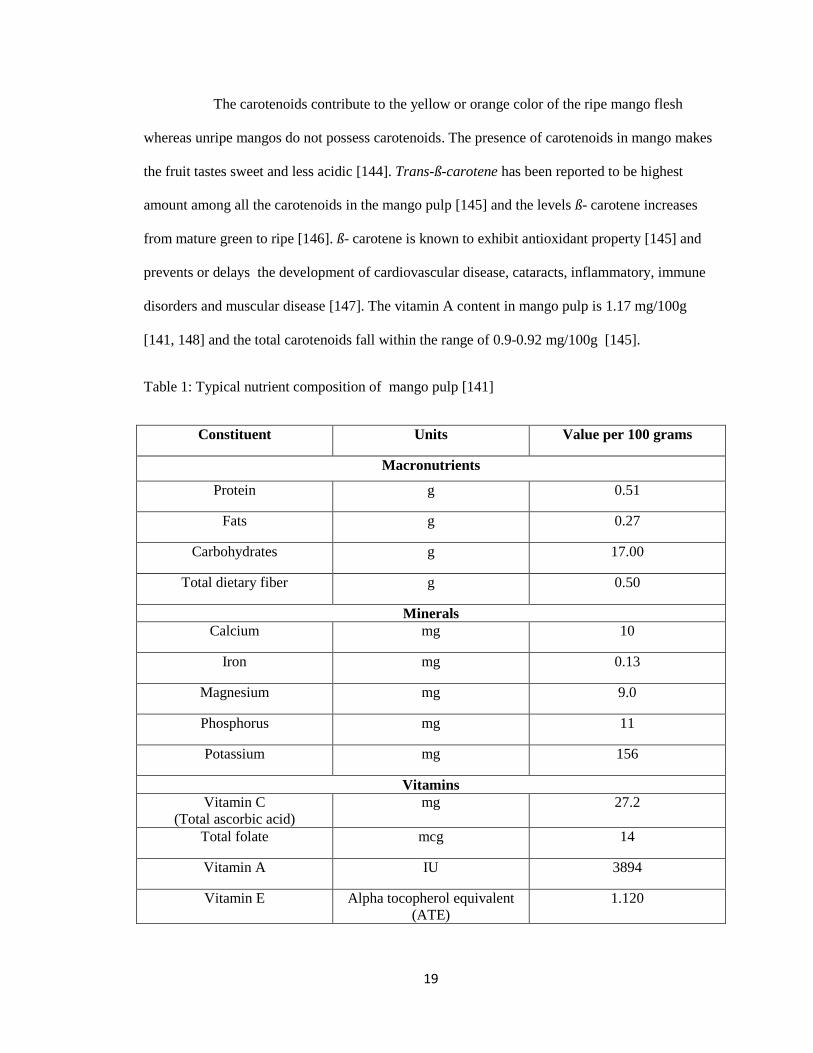
Typical composition of mango pulp is shown in Table 1. Mango flesh is rich in
various nutrients particularly vitamin C and carotenoids. Vitamin C is the predominant vitamin in
mangos and the amount declines with maturity or ripening process [141] . The quantity of vitamin
C present in the mango peel is about 1.5 times higher than in the mango pulp [141] . Vitamin C
has been well-documented to have antioxidant characteristics which helps in ROS elimination,
the maintenance of α-tocopherol and cofactor in the reduced state and preserving the enzymatic
activities , act as a substrate for the biosynthesis of oxalate and tartrate in resisting stress [142,
143], and the production of hormones, neurotrasmitters as well as collagen. Therefore,
degenerative diseases like cardiovascular disease, inflammation, cancer, arthritis, and the
weakening of the immune systems can be minimized by sufficient intakes of antioxidants such as
vitamin C.
19
The carotenoids contribute to the yellow or orange color of the ripe mango flesh
whereas unripe mangos do not possess carotenoids. The presence of carotenoids in mango makes
the fruit tastes sweet and less acidic [144]. Trans-ß-carotene has been reported to be highest
amount among all the carotenoids in the mango pulp [145] and the levels ß- carotene increases
from mature green to ripe [146]. ß- carotene is known to exhibit antioxidant property [145] and
prevents or delays the development of cardiovascular disease, cataracts, inflammatory, immune
disorders and muscular disease [147]. The vitamin A content in mango pulp is 1.17 mg/100g
[141, 148] and the total carotenoids fall within the range of 0.9-0.92 mg/100g [145].
Table 1: Typical nutrient composition of mango pulp [141]
Constituent Units Value per 100 grams
Macronutrients
Protein g 0.51
Fats g 0.27
Carbohydrates g 17.00
Total dietary fiber g 0.50
Minerals
Calcium mg 10
Iron mg 0.13
Magnesium mg 9.0
Phosphorus mg 11
Potassium mg 156
Vitamins
Vitamin C
(Total ascorbic acid)
mg 27.2
Total folate mcg 14
Vitamin A IU 3894
Vitamin E Alpha tocopherol equivalent
(ATE)
1.120
20
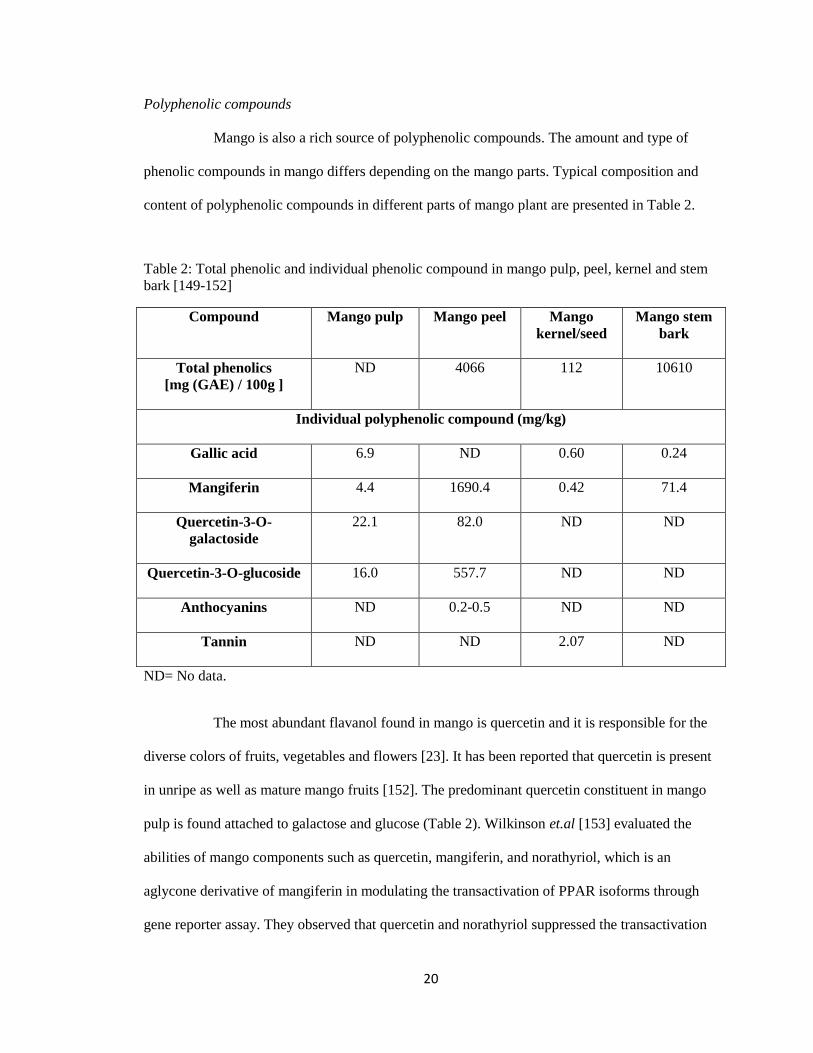
Polyphenolic compounds
Mango is also a rich source of polyphenolic compounds. The amount and type of
phenolic compounds in mango differs depending on the mango parts. Typical composition and
content of polyphenolic compounds in different parts of mango plant are presented in Table 2.
Table 2: Total phenolic and individual phenolic compound in mango pulp, peel, kernel and stem
bark [149-152]
Compound Mango pulp Mango peel Mango
kernel/seed
Mango stem
bark
Total phenolics
[mg (GAE) / 100g ]
ND 4066 112 10610
Individual polyphenolic compound (mg/kg)
Gallic acid
6.9 ND 0.60 0.24
Mangiferin
4.4 1690.4 0.42 71.4
Quercetin-3-O-
galactoside
22.1 82.0 ND ND
Quercetin-3-O-glucoside
16.0 557.7 ND ND
Anthocyanins
ND 0.2-0.5 ND ND
Tannin
ND ND 2.07 ND
ND= No data.
The most abundant flavanol found in mango is quercetin and it is responsible for the
diverse colors of fruits, vegetables and flowers [23]. It has been reported that quercetin is present
in unripe as well as mature mango fruits [152]. The predominant quercetin constituent in mango
pulp is found attached to galactose and glucose (Table 2). Wilkinson et.al [153] evaluated the
abilities of mango components such as quercetin, mangiferin, and norathyriol, which is an
aglycone derivative of mangiferin in modulating the transactivation of PPAR isoforms through
gene reporter assay. They observed that quercetin and norathyriol suppressed the transactivation

21
of all PPAR isoforms. PPAR nuclear receptors play crucial roles in diverse cellular and metabolic
processes. The modulation effects shown by quercetin and norathyriol suggested that these
compounds are able to modulate metabolic homeostasis and inflammatory processes, which
contribute greatly in improving metabolic syndrome risk factors.
Apart from flavonoids, phenolic acids such as gallic acid are also one of the major
constituents in mango pulp [154]. Gallic acid and ellagic acid, exist in free form or bound as
gallotannins or ellagitannins [23]. Gallic acid and ellagic acid contribute greatly to health as it has
been reported to exhibit antioxidant and anti-inflammatory [155, 156] It has been shown that the
content of gallic acid decreased significantly from mature green to advanced stage of fruit
maturity [157] . However, Kim and colleagues [157] observed the gallo-tannins increased in
Tommy Atkins mango cultivar during ripening, suggesting different cultivars, harvest locations
and climate might contribute to the different contents of polyphenolic compounds in mango.
Mangiferin
Figure 1: Mangiferin structure [23]
Mangiferin (Figure 1) is a C-glucosyl xanthone which is found in various parts of the
mango part. The content of mangiferin in mango stem bark is 71.4 g/kg, and it has become the
focus of researchers due to its abundance [158]. The standard aqueous extract of stem bark of
mango in pharmaceutical formulations in Cuba is under a brand named Vimang®. Vimang® has
a wide variety of polyphenolic compounds including the predominant xanthone constituent of
mangiferin, phenolic acids, phenolic esters and flavon-3-ols [158]. The amounts of mangiferin in
22
mango pulp, seed kernel and peel are reported to be 4.4 mg/kg [159], 42 mg/kg [160] , and 1690
mg/kg [149] , respectively. Studies on the health benefits of mangiferin as well as the stem bark
extract, Vimang® are discussed in the later section.
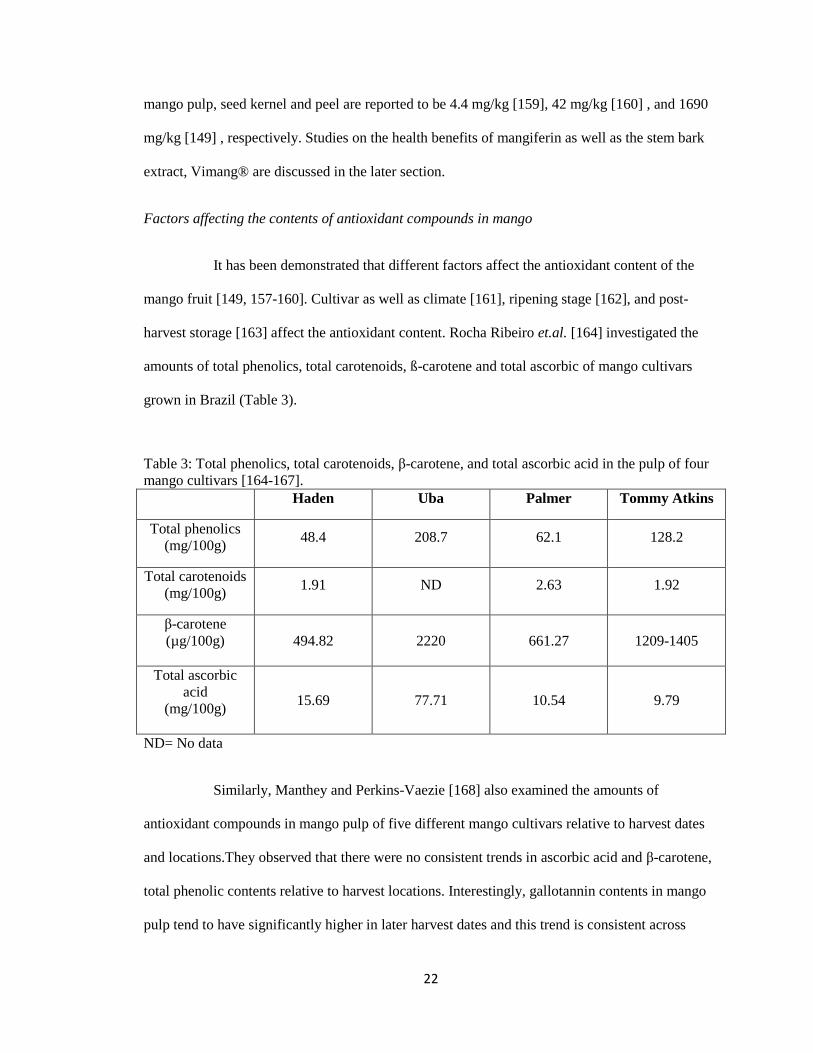
Factors affecting the contents of antioxidant compounds in mango
It has been demonstrated that different factors affect the antioxidant content of the
mango fruit [149, 157-160]. Cultivar as well as climate [161], ripening stage [162], and post-
harvest storage [163] affect the antioxidant content. Rocha Ribeiro et.al. [164] investigated the
amounts of total phenolics, total carotenoids, ß-carotene and total ascorbic of mango cultivars
grown in Brazil (Table 3).
Table 3: Total phenolics, total carotenoids, β-carotene, and total ascorbic acid in the pulp of four
mango cultivars [164-167].
Haden Uba Palmer Tommy Atkins
Total phenolics
(mg/100g) 48.4 208.7 62.1 128.2
Total carotenoids
(mg/100g) 1.91 ND 2.63 1.92
β-carotene
(µg/100g)
494.82 2220 661.27 1209-1405
Total ascorbic
acid
(mg/100g)
15.69 77.71 10.54 9.79
ND= No data
Similarly, Manthey and Perkins-Vaezie [168] also examined the amounts of
antioxidant compounds in mango pulp of five different mango cultivars relative to harvest dates
and locations.They observed that there were no consistent trends in ascorbic acid and β-carotene,
total phenolic contents relative to harvest locations. Interestingly, gallotannin contents in mango
pulp tend to have significantly higher in later harvest dates and this trend is consistent across

23
different harvest locations.
Mercadante and Rodriguez-Amaya [146] found that mango of the same cultivar have
different carotenoid compositions if the mango are grown in different climate regions. For
example, Tommy Atkins mango grown in hot area such as Mato Grosso, Brazil had higher
content of carotenoid compared to Tommy Atkins mango grown in moderate area like Sao Paulo.
Similarly, Keitt mango grown in hot area like Bahia, Brazil had twice as much as β-carotene
content compared to Keitt mango grown in moderate area like Sao Paulo, Brazil.
Ripening involves changes in cellular constituents and accelerates catabolic
processes, leading to changes in terms of color and firmness of the fruit [169]. Palafox-Carlos
et.al [162] examined the relationship between the total phenolic content and antioxidant
properties in ‘Ataulfo’ mango and the ripening stages. The ripening stage of mango is determined
by the yellow surface area in mango and it is categorized to 4 stages (RS1 to RS4) with the
percentage of yellow surface ranged from RS1, 0-10%; RS2, 11-40%; RS3, 41-70%; and RS4,
71-100%. They found that mangos from RS2 and RS3 possessed the highest phenolic
composition and antioxidant activities. Mercadante and Rodriguez-Amaya [146] assessed the
correlation between carotenoid contents and ripening stage in Keitt and Tommy Atkins cultivar.
Results showed total carotenoid increased from 12.3 to 38.0 µg/g and 17.0 to 51.2 µg/g in Keitt
and Tommy Atkins cultivar, respectively from mature-green to ripe stage.
Moreover, Gil et.al. [170] studied the changes in antioxidant compounds in mango
pulp during ripening by nuclear magnetic resonance spectroscopy (NMRS). They found that
peaks were observed for isoleucine, valine and leucine aliphatic in NMR spectra, suggesting a
common biosynthetic pathway for β-carotene. The content of β-carotene in mango pulp increases
with ripening (increased from 2.0 µg/g to 5.8 µg/g during ripening in Tommy Atkins mango
pulp). Conversely, in the aromatic region of the mango pulps’ spectra, it was found that shikimic

24
acid diminished gradually with fruit maturity with concomitant gradual increase of other
metabolites such as niacin and phenylalanine in the early ripening stage. The formation of
polyphenolic compounds was observed at the final stage of ripening.
One possible reason for explaining the changes of phenolic compounds and
associated antioxidant capacity during the ripening process is the increased cellular activity when
the fruit is maturing. The high cellular activity is accompanied with metabolism of biomolecules,
leading to increased demand for energy in fruits to support physiological cellular activities.
Hence, free radicals and ROS might be generated from the respiratory system, and activation of
the antioxidant mechanisms occurs to counteract the oxidative stress [162].
Hymavathi and Khader [163] studied the effects of storage duration and packaging of
the mango powders on the total carotene, β-carotene, ascorbic acid, and sugar content. They
found that the loss of total carotene, β-carotene and ascorbic acid is strongly associated with the
increased storage duration. In addition, packaging if permeable to moisture and air could
contribute to loss of ascorbic acid content in the mango powder. The total sugar content in the
mango powder increased with storage duration due to the conversion of non-reducing sugars to
reducing sugars.
Anti-diabetic and hypolipidemic effect of mangiferin
A few studies have demonstrated hypoglycemic and hypolipidemic effects of
mangiferin. Ichiki, et.al. [27] investigated the effects of oral administration of mangiferin (10
mg/kg, 30 mg/kg and 90 mg/kg) in animal model of non-insulin dependent diabetes mellitus
(NIDDM), KK-Ay mice. The treatment groups in this study were: KK-Ay mice as control group;
mice received 3 doses of mangiferin (10 mg/kg, 30 mg/kg and 90 mg/kg) respectively; mice
received mangiferin glucoside--mangiferin-7-O-β-glucoside (10 mg/kg, 30 mg/kg and 90 mg/kg),
respectively; and mice received tolbutamine (50 mg/kg), an anti-diabetic drug. They found that
25
mangiferin (30 mg/kg and 90 mg/kg) reduced blood glucose compared to mice with tolbutamide
treatment. Mangiferin at 90mg/kg showed more pronounced blood lowering property 7 hours
after the administration compared to tolbutamide.
Muruganandan and colleagues [26] examined the effects of intraperitoneal
administration of mangiferin (10 and 20 mg/kg) once daily for 28 days on diabetics and
atherogenesis in streptozotocin (STZ) - induced diabetic Wistar male rats. The five treatment
groups in this study were: normal rats received neither STZ nor drug; negative control was STZ-
induced diabetic rats; positive control rats with daily intraperitoneal administration of insulin
(6U/kg, i.p.) and rats given mangiferin 10 and 20 mg/kg, respectively. Blood was collected from
the fasted rats an hour later after the last dose of mangiferin and insulin administration to examine
blood glucose, plasma total cholesterol, HDL-cholesterol and triglycerides. Both doses of
mangiferin significantly reduced plasma glucose concentrations compared to the negative control.
Mangiferin also improved lipid profile by reducing plasma total cholesterol, triglycerides and
LDL-C with a concomitant increase in HDL-C in diabetic rats [26]. They suggested that the
positive effect of mangiferin on glucose can be attributed to the decrease in triglyceride, which
can be explained by Randle’s glucose fatty acid cycle. Randle’s glucose fatty acid cycle [171]
states that the elevation of plasma triglycerides increases availability of FFA for oxidation, which
then causes an impairment in insulin secretion that affect glucose metabolism and utilization,
resulting in hyperglycemia. Therefore, mangiferin is believed to ameliorate hyperglycemia by
promoting oxidation and glucose utilization [171]. The second objective of this study was to
assess the effects of mangiferin (10 and 20 mg/kg, i.p.) on oral glucose tolerance tests (OGTT) in
glucose-loaded normal mice compared to control normal mice with saline (1ml/kg i.p.) for 14
days. The last dose of mangiferin and saline were given 30 minutes prior the glucose injection to
the fasted mice. They found that the mice treated with mangiferin showed improved glucose
tolerance compared to the control group, hence mangiferin exhibited antihyperglycemic property

26
[26].
Miura et.al. [172] studied the effects of 2 weeks oral administration of mangiferin (30
mg/kg) combined with exercise on lipid parameters in KK-Ay mice, an animal model of type 2
diabetes. Mice were given food and deionized water ad libitum and the four treatment groups in
this study were: control, mangiferin (30 mg/kg), daily exercise on motorized treadmill for 120
minutes, and mangiferin combined with exercise. Mice given mangiferin 30 minutes before
subjected to exercise showed significant decrease in blood cholesterol and triglyceride levels
compared to the control diabetic mice. In addition, Guo and colleagues [29] also examined the
effects of mangiferin ( 50 mg/kg and 150 mg/kg ) in hamsters fed high fat diet for 8 weeks. The
four treatment groups in this study were: control diet (13.9% fat), high fat (HF) diet, and HF + 50
mg/kg mangiferin and HF + 150 mg/kg of mangiferin respectively. Hamsters that received
mangiferin showed significantly lower plasma triglyceride and FFA compared to the HF group.
Furthermore, mangiferin treatment up-regulated liver mRNA expression of proteins involved in
FA oxidation such as peroxisome PPAR-α, fatty acid translocase (CD36) and carnitine
palmitoyltransferase 1 (CPT-1). Down-regulation of hepatic mRNA expression of proteins
involved in FA synthesis such as acetyl coA carboxylase (ACC) and acyl-coA:diacylglycerol
acyltransferase 2 (DGAT-2) were also observed in mangiferin groups but not the HF group.
Sellamuthu and colleagues [173] examined the effects of daily oral administration of
mangiferin (40 mg/kg) for 30 days on STZ-induced diabetic rats. The four treatment groups in
this study were normal rats (control); diabetic rats (negative control); diabetic rats that received
daily oral administration of mangiferin (40 mg/kg) and diabetic rats given oral administration of
gilbenclamide (600 µg/kg), an anti-diabetic drug. The oral administration of glucose solution
during glucose tolerance test showed diabetic rats that received mangiferin and gilbenclamide
exhibited significantly lower plasma glucose, glycosylated hemoglobin and demonstrated
improved glucose tolerance test similar to normal glucose-loaded rats. Additionally, mangiferin
27
stimulated glucose utilization by increasing the enzymatic activities of hexokinase, an enzyme
involved in glycogen synthesis. The gluconeogenic pathway was also inhibited by mangiferin
through the suppression of enzymatic activities of glucose-6-phosphate (G6P) and fructose-1,6-
bisphosphate (F-1,6-BP). Mangiferin also restored glycogen levels similar to control normal rats
by activating glycogen synthase. Therefore, mangiferin showed anti-diabetic activity and restored
glucose homeostasis comparable to normal glucose loaded rats.
Antioxidant property of mangiferin
Mangiferin and its antioxidant property have been shown in scientific literature. It has
been well-documented that diabetes mellitus leads to ROS generation and subsequent oxidative
damage to the heart and kidney [174]. The increased plasma glucose produces free radicals which
induces cell death [175]. Muruganandan and colleagues [28] investigated the daily intraperitoneal
administration of mangiferin (10 mg/kg and 20 mg/kg) for 28 days on oxidative stress in STZ-
induced diabetic Wistar rats. The five treatment groups in this study were normal rats (control),
STZ-induced diabetic rats, STZ-induced diabetic rats given insulin (6 U/kg, i.p.), STZ-induced
diabetic rats given 10 mg/kg mangiferin and STZ-induced diabetic rats given 20 mg/kg
mangiferin . Blood samples were collected to determine glycosylated hemoglobin and serum
creatine phosphokinase (CPK) while the heart and kidney samples were used to examine the
antioxidant enzymes and histology. Compared to diabetic rats given insulin, mice that received
both doses of mangiferin had lower % glycosylated hemoglobin and serum CPK, a biomarker for
myocardial infarction. Moreover, mangiferin treatment also showed improvement in cardiac and
renal antioxidant enzymes such as superoxide dismutase (SOD) and catalase (CAT), reduced
cardiac and tubular degenerative signs in histological evidence when compared to diabetic rats
given the insulin treatment. Hence, mangiferin demonstrated anti-diabetic and attenuation of
oxidative stress in cardiac and kidney cells.

28
Prabu et.al. [176] studied the antioxidant potential of intraperitoneal administration
of mangiferin (100mg/kg b.w. suspended in 2ml of dimethyl sulphoxide (DMSO) for 28 days in
isoproterenol (ISPH)-induced myocardial infarctions (MI) in Wistar rats. The four experimental
groups in this study were; control rats given DMSO, ISPH-induced myocardial infarction rats,
normal rats given mangiferin, and normal rats pretreated with mangiferin for 28 days followed by
ISPH-induced MI. Serum was collected to examine the levels of enzyme associated with
myocardial infarction, antioxidant enzymes and non-enzyme antioxidants. Myocardial infarction
causes increased concentrations of lactate dehydrogenase (LDH), creatine phosphokinase
isoenzymes (CK-MB), uric acid and decreased plasma iron binding capacity. Rats pre-treated
with mangiferin (100 mg/kg) showed significant decrease in LDH, CK-MB and uric acid.
Significant increases in plasma iron binding activity, cardiac antioxidant enzymes such as
glutathione peroxidase (GPX) and glutathione transferase (GST), extracellular antioxidant such as
ceruloplasmin, vitamin C and E in rats pre-treated with mangiferin compared to ISPH-induced MI
rats were observed. On the other hand, rats treated with mangiferin alone showed comparable
results to control rats in LDH, CK-MB, uric acid, iron binding capacity, GPX, GST,
ceruloplasmin, vitamin C and E. Therefore, mangiferin exhibited cardiac protection by reducing
biomarkers of myocardial infarction while scavenging free radicals by increasing the antioxidant
enzymes.
Moreover, antioxidants are also important to prevent the development of
atherosclerosis as ROS has been shown to oxidize LDL, which can lead to atherosclerosis [177,
178]. Gilberto et.al [179] examined the effects of oral administration of Vimang® (250mg/kg)
and mangiferin (40mg/kg) for 7 days in LDL receptor knockout (LDLr-/-
) mice. The four
experimental groups in this study were; LDLr-/-
mice given distilled water as negative control,
C57BL/6 mice given distilled water as positive control, LDLr-/-
mice given Vimang®, and LDLr-/-
mice given mangiferin respectively. LDLr-/-
mice are susceptible to oxidative stress associated
29
mitochondrial dysfunction. Hence, substantial amount of ROS accumulate in the mitochondria of
LDLr-/-
mice, causing calcium-induced membrane permeability transition (MPT), a condition that
can lead to cell death. The mitochondria of mice that received Vimang® and mangiferin
treatment showed decreased amount of ROS production, efflux of calcium ions and MPT
incidences when compared to negative control. Additionally, LDLr-/-
mice also possessed high
cholesterol levels, leading to high consumption of NADPH reducing equivalents, which are
mitochondrial antioxidant defense compounds. Mice receiving Vimang® and mangiferin
treatment reduced the dissipation of NADPH, leading to increased antioxidant defense ability
when compared to negative control. Thus, Vimang® and mangiferin protected mitonchondria
from oxidative stress.
In addition to the mitochondria, ROS also affect macrophages [180]. Sanchez et.al.
[151] compared the antioxidant properties of oral administration of Vimang® (50 mg/kg, 110
mg/kg, 250 mg/kg) , mangiferin (50 mg/kg), vitamin C (100mg/kg), vitamin E (100mg/kg) and β-
carotene (50 mg/kg) against 12-O-tetradecanoylphorbol-13-accetate (TPA)-induced oxidative
deterioration in serum and over production of ROS in peritoneal macrophages in mice.
Vimang® at 250 mg/kg protected plasma antioxidant enzymes such as SOD and GPX from
depletion while mangiferin did not show effects in preserving serum antioxidant enzymes. TPA-
induced oxidative damaged mice that received Vimang® (any of the doses used) or mangiferin
had approximately 70% or 44%, respectively, lower ROS in peritoneal macrophages compared to
negative control mice. The concentration of H2O2 is a measurement of production of ROS by
peritoneal macrophages. Vimang® showed dose-dependent effect on decreasing the production
of H2O2 while mangiferin also reduced the production of H2O2 by 40% compared to the negative
control. Hence, both Vimang® and mangiferin showed potent antioxidant properties. However,
Vimang® has more pronounced effect compared to mangiferin, suggesting synergistic effects of
the polyphenolic compounds.
30
Anti-inflammatory effect of mangiferin
Nitric oxide (NO) and prostanoids are the main chemical mediators in inflammatory
processes. The synthesis of these molecules is catalyzed by inducible isoforms of NO and
cyclooxygenase (cycloocygenase-2). The development of hypertension has been well reported to
associate with the alterations of the expressions and functions of isoforms of NO and
cycloocygenase-2. Beltran et.al [33] investigated the effects of incubation of Vimang® (0.1
mg/ml, 0.2 mg/ml and 0.5 mg/ml) and mangiferin (0.025mg/ml) with interleukin-1β (IL-β) on the
expressions of pro-inflammatory enzymes such as cyclooxygenase and nitric oxide synthase
(iNOS) in rats’ vascular smooth muscle cell cultures. All doses of Vimang® and mangiferin
inhibited the expressions of iNOS; with Vimang® showing dose dependent decrease compared to
cell culture incubated with IL-β (negative control). Vimang® (0.2 mg/ml and 0.5 mg/ml) and
mangiferin suppressed the expressions of cycloocygenase-2 compared to negative control, which
was the cell culture of rats’ vascular smooth muscle incubated with IL-β. The inhibition of the
expressions of cyclooxygenase-2 and iNOS showed both Vimang® and mangiferin help in
preventing inflammatory conditions [181, 182].
Garrido and colleagues also examined [183] the effects of oral administration of
Vimang® (50 mg/kg, 100 mg/kg and 200 mg/kg) before topical application of arachdonic acid
(AA)-induced inflammation on the ears of mice. All doses of Vimang® ameliorated the AA-
induced inflammation of ear edema. Long lasting inflammatory response could be induced by
phorbol esters such as phorbol myristate acetate (PMA), leading to increased production of
prostanoid and influx of cellular cells like neutrophils [184] . The induction of neutrophil
biomarkers such as enzyme myeloperoxidase (MPO) was suppressed by all doses of Vimang®.
Additionally, Vimang® also showed dose-dependent inhibitory effects on production of serum
TNF-α. The addition of lipopolysaccharide-interferon-ϒ (LPS-IFN-ϒ) to macrophage cell lines
leads to activation of two diverge arachidonic acid metabolic pathways (i.e. cyclooxygenase and

31
lipooxygenase pathways). The effects on these pathways can be determined by measuring
prostaglandin (PGE2) and leukoterines (LTB4) respectively. Vimang® also showed inhibitory
effects on PGE2, LTB4 and human recombinant synovial PLA2, a proinflammatory protein [185].
Taken together, Vimang® exhibits anti-inflammatory effects and could be classifired as a dual-
inhibitor considering its suppression effects on two distinct arachidonic acid pathways.
Therefore mangiferin, being the predominant constituent in Vimang®, demonstrated anti-
inflammatory property by suppressing the inflammatory mediators, inflammatory cells as well as
inflammatory pathways.
32
CHAPTER III
METHODOLOGY
Animal care
Forty two-month old C57BL/6 male mice were purchased from Charles River
Laboratories (Wilmington, MA). Animal handling and procedures were approved by the
Institutional Animal Care and Use Committee at Oklahoma State University. Mice were
acclimated for three days and were fed with standardized powdered rodent diet (AIN93M) [186].
After acclimation, mice were weighed and randomly divided into five dietary treatment groups
(n=8/group) balanced by initial body weight. Mice were maintained in a 12:12 hour light dark
cycle in a temperature controlled room.
Dietary treatments
Mice were randomly divided into five dietary treatment groups (n=8 mice/ group): (1)
control (AIN-93M), 10 % calories from fat ; (2) high fat ( HF) diet, 60 % calories from fat; (3)
HF with rosiglitazone (50 mg/kg diet) ; (4) HF diet with 1% (w/w) freeze dried mango pulp ; and
(5) HF diet with mangiferin (0.044 mg/kg diet) . The AIN-93M diet was purchased from Harlan
Teklad (Indianapolis, IN) and contained 75.8 % carbohydrate, 9.5 % fat, and 14.7 % protein by
calories [186]. The high fat diet was based on the formulation of Molnar et al. [187] and
contained 27.7 % carbohydrate, 58.9 % fat, and 13.4 % protein by calories. Ripe Tommy Atkins
33
variety mangos were purchased from a local grocery store, freeze dried, grounded and analyzed
for its nutrient composition (Table 4) and incorporated at 1% (w/w) dose to the HF diets. The
dose of mangiferin (42.4 mg/ 100 g) is equivalent to the approximate mangiferin content of the
1% freeze-dried mango [188]. All high fat diets were adjusted to have the same macronutrient
composition, as well as calcium and phosphorus. The composition of the experimental diets is
shown in Table 5.
Glucose tolerance test
Glucose tolerance tests were performed after 30 and 60 days of dietary treatment (n=8 mice/
group). Mice were fasted overnight but had access to deionized water. A drop of blood from the
tail was used to determine baseline blood glucose concentrations using AlphaTrak™ glucometer
(Abbott Laboratories, North Chicago, IL). Blood glucose concentrations were measured at 0, 5,
15, 30, 60 and 120 minutes after intraperitoneal injection with 20% glucose solution (2 g/kg body
weight). The trapezoidal rule was used to calculate area under the curve [189].
Necropsy and tissue processing
After two months of dietary treatment, mice were weighed and fasted for 12 hours before
the necropsy. Mice were weighed and injected with ketamine/xylazine (10:1) cocktail (0.15 ml/10
g of body weight) at necropsy. Body composition was determined using a GE Lunar Piximus
whole body dual-energy X-ray absorptiometer (Fitchburg, WI). Blood was collected from the
carotid artery into ethylenediaminetetraacetic acid (EDTA) coated tubes. Plasma was obtained by
centrifugation of whole blood for 20 minutes at 1300 g and was stored at -80 °C until further
analyses. Liver, spleen and kidney were weighed, snap-frozen in liquid nitrogen and stored at -
80°C. Portion of liver and white adipose tissues were fixed in 10% neutral buffer formalin until
further analyses.

34
Clinical analyses
The BioLis24i chemical analyzer (Carolina Liquid Chemistries Corporation™, Brea,
CA) was used to determine plasma concentrations of glucose, frustosamine, whole blood
glycosylated hemoglobin (HbA1c), total cholesterol, HDL-C, triglycerides and non-esterified
fatty acids (NEFA). All reagent kits were purchased from Carolina Liquid Chemistries
Corporation™ (Brea, CA) except for NEFA (Wako Diagnostics, Richmond, VA).
The determination of plasma glucose concentrations is based on the reaction of glucose
with adenosine triphosphate (ATP) in the presence of hexokinase and magnesium where glucose-
6 phosphate and adenosine diphosphate (ADP) are produced. Glucose-6-phosphate
dehydrogenase oxidizes glucose-6-phosphate and NAD+ to form 6-phosphogluconate and NADH.
The amount of NADH produced absorbs efficiently at 340 nm, which is directly proportional to
the amount of glucose in the plasma (Carolina Liquid Chemistries Corporation™, Brea, CA).
The measurement of fructosamine utilizes a colorimetric method using nitroblue
tetrazolium (NBT). Fructosamine are reductants under alkaline conditions. This property forms
the basis for the NBT procedure in which the dye NBT is reduced to formazane which is then
measured spectrophotometrically at 505 nm wavelength. The rate of formation of formazane is
directly proportional to the fructosamine concentration (Carolina Liquid Chemistries
Corporation™, Brea, CA).
The measurement of whole blood glycosylated hemoglobin (HbA1c) utilizes the
interaction of antigen and antibody. Total hemoglobin and HbA1c have the same unspecific
absorption rate to latex particles, latex-HbA1c-mouse anti human HbA1c antibody complex is
formed after addition of mouse anti human HbA1c monoclonal antibody. Agglutination is formed
when monoclonal antibody interacts with goat anti-mouse IgG polyclonal antibody. The amount
of agglutination is proportional to the amount of HbA1c absorbed onto the surface of the latex
35
and the absorbance is measured at 660 nm. The HbA1c value is determined from a curve of
calibration (Carolina Liquid Chemistries Corporation™, Brea, CA).
In determining the total cholesterol, esterified cholesterol is hydrolyzed by cholesterol
esterase to free cholesterol and free fatty acids. The total cholesterol is oxidized by cholesterol
esterase producing hydrogen peroxide (H2O2). Peroxidase catalyzed the reaction among H2O2,p-
hydroxybenzoic acid and 4-aminoantipyrine to form the red colored complex —quinoneimine ,
which absorbs strongly at 500 nm wavelength. The amount of chromogen released is directly
proportional to the total cholesterol concentration (Carolina Liquid Chemistries Corporation™,
Brea, CA).
The measurement of HDL- cholesterol assay utilizes a unique reagent which solubilizes
HDL- lipoproteins. HDL cholesterol reacts with cholesterol esterase and oxidase to form colored
chromogen, which is directly proportional to the HDL cholesterol concentration, which absorbs
bichromatically at 600 nm (Carolina Liquid Chemistries Corporation™, Brea, CA).
Plasma triglyceride was hydrolyzed by lipase to release glycerol and free fatty acids.
Glycerol is phosphorylated to glycerol-1-phosphate while ATP is converted to ADP in the
presence of ATP and glycerol kinase. Glycerol-1-phosphate is oxidized by glycerol phosphate
oxidase and H2O2 produce. Red colored quinoneimine was formed in the reaction of H2O2, with
p-chlorophenol and 4-aminoantipyrine, catalyzed by peroxidase. The complex absorbed
bichromatically at 505/692 nm, representing the triglyceride concentration (Carolina Liquid
Chemistries Corporation™, Brea, CA).
The conversion of NEFA (non-esterified fatty acid) to thiol esters of CoA happens in the
presence of ATP and CoA and is catalyzed by acyl-CoA synthetase. Acyl-CoA is oxidized to
produce H2O2 in the presence of acyl-CoA oxidase and peroxidase, allowing the condensation of
3-methyl-N-ethyl-N-(β-hydroxyethyl)-aniline with 4-aminoantipyrine and the formation of purple
colored complex which absorbs strongly at 550 nm (Wako Diagnostics, Richmond, VA).

36
Plasma insulin
The determination of plasma concentration of insulin was carried out by the enzyme
linked immunosorbent assay (ELISA) kits from Millipore ™ Corporation (Billerica, MA) using
microtiter plates that were pre-coated with anti-mouse insulin monoclonal antibodies. A second
biotinylated anti-mouse polyclonal antibody was added to the wells to capture the analytes in the
samples. Unbound materials from samples were then washed off and horseradish peroxidase was
added on to the immobilized biotinylated antibodies. Enzymatic activity of horseradish
peroxidase was monitored using 3, 3’, 5, 5’-tetramethylbenzidine as a substrate and the
measurement is done using a microplate reader at 450nm (Biotek Synergy HT, Winooski, VT).
The captured mouse insulin in the plasma is directly proportional to the increase in absorbance at
450nm/590nm. The concentration of insulin was calculated from a standard curve (Millipore ™
Corporation, Billerica, MA).
Liver and fecal total lipids
Approximately 0.2 gram of the liver powder sample was weighed, transferred into a 50
mL centrifuge tube, and extracted overnight with 25 mL of methanol:chloroform (1:2) solution.
Fecal samples were dried, ground, and approximately 1 gram of fecal powder was weighed, and
extracted with 10 mL methanol:chloroform (1:2) solution. Liver and fecal total lipid was
determined based on procedure of Folch et al.[190]. Sulfuric acid (0.05%) was added to the
methanol:chloroform solution, vortexed, and allowed to be separated into two phases. The
aqueous layer was aspirated off after the two phases were separated. The organic solution was
poured into pre-weighed aluminum pan and evaporated to dryness under the fume hood. After all
the organic solvent has evaporated, pans were again dried in the oven at 100ºC, cooled, and
weighed. The amount of liver lipid was expressed as lipid weight (in milligram) per gram of liver
sample while fecal lipid is expressed as milligram lipid per gram of fecal samples.
37
Liver and adipose tissue histology
Liver and adipose tissues were fixed in 10% neutral buffered formalin. Tissues were
trimmed and processed in Thermo Scientific Shandon-Citadel 1000 tissue processor (Austin,
TX). Tissues were then embedded in Leica EG1160 paraffin embedding machine (Buffalo Grove,
IL). 7µm thicknesses of the paraffin-embedded tissue block were sectioned using the high
performance Leica RM 2165 microtomes (Buffalo Grove, IL) and mounted onto glass
microscopic slides. Slides were air-dried and stained with hematoxylin and eosin (H&E). The
slides were ready to view under Nikon Eclipse TE 2000-U Inverted Microscope (Melville, NY) at
10x magnification. The effects of different dietary treatments on white adipose cell sizes and the
degree of steatosis in liver tissues were evaluated.
Statistical Analyses
Statistical analyses involved the computation of least square means and standard
deviation (SD) for each of the treatment group using SAS software version 9.2 (SAS Institute,
Cary, NC). Analysis of variance and least square means were calculated using the general linear
model procedure and the means were compared using Fisher’s least significant difference for
groups’ comparisons. Significant differences were considered when P < 0.05.
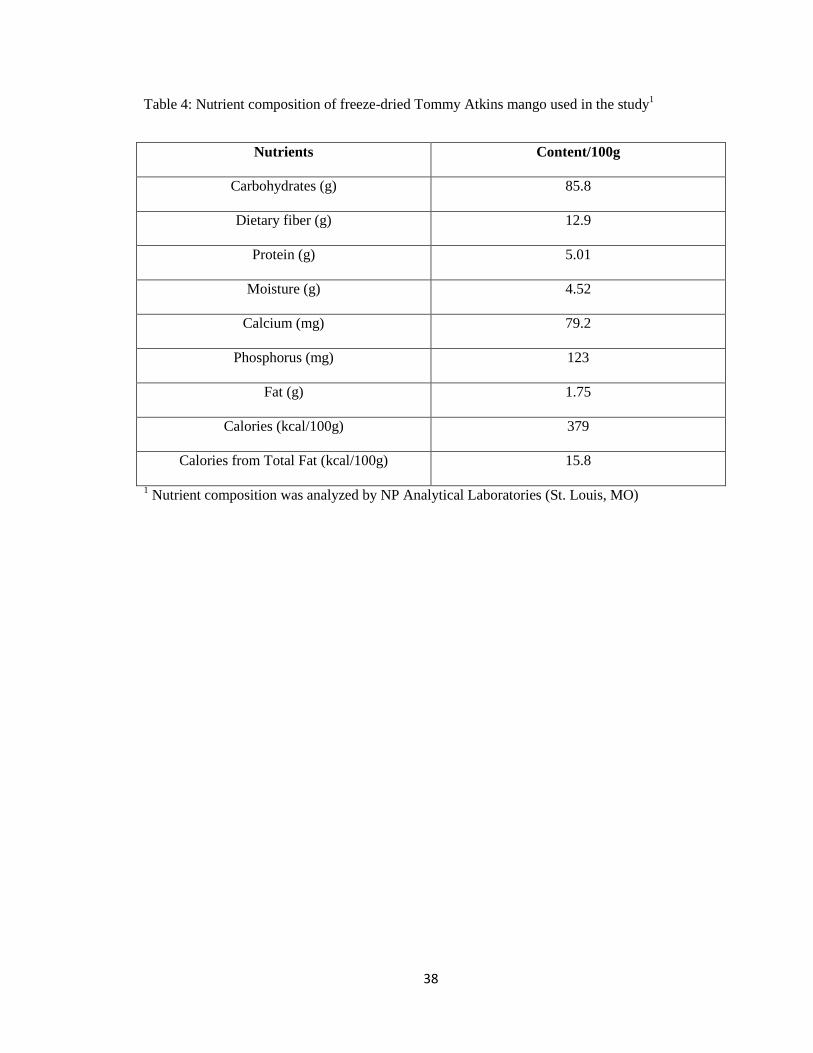
38
Table 4: Nutrient composition of freeze-dried Tommy Atkins mango used in the study1
Nutrients Content/100g
Carbohydrates (g) 85.8
Dietary fiber (g) 12.9
Protein (g) 5.01
Moisture (g) 4.52
Calcium (mg) 79.2
Phosphorus (mg) 123
Fat (g) 1.75
Calories (kcal/100g) 379
Calories from Total Fat (kcal/100g) 15.8
1 Nutrient composition was analyzed by NP Analytical Laboratories (St. Louis, MO)

39
Table 5: Composition of the experimental diets
Ingredient Normal diet
(AIN-93M)2
High fat
diet3,4,5
High fat diet +
1% mango
amount (g/kg diet)
Mango pulp1
Carbohydrate
Total
Cornstarch
Sucrose
Dextrinized Cornstarch
Mango (85.8%)
Protein
Total
Casein
Mango (5.01%)
Fat
Total
Soybean Oil
Lard
Mango (1.75%)
Fiber
Total
Cellulose
Mango (12.9%)
Vitamin Mix (AIN-93VX)
Mineral Mix
Total
Mineral Mix (Ca-P-Def)
Calcium Carbonate
Calcium from mango (0.0792%)
Sodium phosphate, dibasic (NaHPO4)
Potassium phosphate, monobasic
Phosphorus from mango (0.123%)
Sucrose
Choline Bitartrate
L-cysteine
Tert-butylhydroquinone
Kcal/100g
0
721
465.69
100
155
140
140
0
40
40
0
50
50
0
10
35
13.4
12.5
0
5.6
2.4
1.1
2.5
1.8
0.008
367
0
370
0
270
100
180
180
0
350
40
310
50
50
0
10
35
13.4
12.5
0
4.8
2.0
2.3
2.5
1.8
0.008
559
10
370
0
270
91.42
8.58
180
179.5
0.5
350
39.82
310
0.18
50
48.71
1.29
10
35
13.4
12.48
0.0079
4.734
2.036
0.0123
2.35
2.5
1.8
0.008
547

40
1
Tommy Atkins variety; purchased from local grocery store, peeled, and pulp was freeze-dried. 2
AIN-93M contained 75.8 %carbohydrate, 9.5 %fat, and 14.7 %protein by calories [186]. 3
High fat diet formulation containing 27.7 %carbohydrate, 58.9 %fat, and 13.4 %protein by
calories [187]. 4
Rosiglitazone was from Cayman Chemical Company (Ann Arbor, MI) and added to the HF diets
at a dose of 50 mg/kg diet. 5 Mangiferin was from Sigma-Aldrich Co., LLC (St. Louis, MO) and added to the HF diets at a
dose of 0.044 mg/kg diet. 6
Analyzed by NP Analytical Laboratories (St. Louis, MO)
41
.CHAPTER IV
FINDINGS
Food intake, body and tissue weights
Body weights were similar at the initiation of treatment (Table 6 and Figure 2). However,
significant differences in body weights were observed starting at week one of dietary treatment
(Figure 2). All HF diet groups had similar body weight and were significantly higher than the
control group during the first two weeks of treatment. Starting at week 3, HF + rosiglitazone and
HF + 1% mango groups had slower weight gain than HF and HF + mangiferin which was
sustained until the end of the eight week treatment period.
HF-fed mice were fed ad libitum for the entire study duration. Mice receiving the control
diet were also fed ad libitum during the first four weeks of the dietary treatment but the amount of
food given to them for the last four weeks was controlled to be similar to the average intake of the
HF-fed groups. This allowed us to make sure the change in body weights in the control group was
not due to the amount of food eaten. The average food intake per day for the entire eight week
treatment period was highest in the control group followed by the HF + rosiglitazone group. HF,
HF + mangiferin, and HF + 1% mango groups had statistically similar food intake. Caloric intake
was highest in the HF + rosiglitazone group and lowest in the control group (Table 6). Despite the
high caloric intake of the HF + rosiglitazone group, it had the lowest feed efficiency among the
42
HF-fed groups. The HF + 1% mango had statistically similar feed efficiency to the HF +
rosiglitazone and HF groups (Table 6). The control group had the lowest feed efficiency hence,
the lowest body weight gain. Among the HF fed groups, HF + rosiglitazone had the lowest
weight gain and lowest final body weight followed by HF + 1% mango group. Mice in the HF +
mangiferin had the highest feed efficiency and final body weight which was statistically similar to
HF. In terms of tissue weights, rosiglitazone was able to minimize the expansion of white adipose
tissues and perirenal white adipose tissues due to high fat diet. Adipose tissue weight of mice in
the HF + rosiglitazone group was statistically similar to the control group (Table 6). Mice in the
HF + mangiferin group had the highest adipose tissue weights and were statistically similar to
HF. Mice in the HF+1% mango group had lower adipose tissue weights than the HF+mangiferin
group; however, it is also statistically similar to the HF group. There were no significant
differences in liver, spleen and kidney weights (Table 6).
Whole body composition
There were significant differences in body composition among the treatment groups
(Table 7). Mice receiving any of the HF diets have similar lean mass which was higher than the
control mice. Fat mass was also higher in the HF-fed groups compared to the control; however,
fat mass of the HF + rosiglitazone group was statistically similar to the control group. HF +
mangiferin had higher fat mass compared to HF+1% mango and HF + rosiglitazone groups
although statistically similar to the HF group. Mice in the HF+1% mango group had significantly
lower fat mass than the HF + mangiferin group but it was statistically similar to the HF group. All
HF-fed mice had higher total mass than the control. However, the HF + rosiglitazone and HF +
1% mango groups had significantly lower total mass than HF + mangiferin and HF groups.
Expressed as % of total mass, HF + rosiglitazone group had similar % body fat as the
control group. HF + mangiferin group had the highest % body fat and statistically similar to HF

43
group. HF + 1% mango group was statistically similar to HF group had approximately 10% lower
body fat in comparison to the HF group. The % lean mass for the control group was the highest
and it was statistically similar to the HF + rosiglitazone group. This was followed by HF + 1%
mango group and HF + mangiferin group had the lowest % lean mass (Table 7).
All HF-fed groups had lower bone mineral area and content compared to the control
group and there were no differences in any of the HF groups. There was no significant difference
in bone mineral density among the treatment groups (Table 7).
Clinical chemistry
Results of clinical chemistry parameters and liver and fecal lipids are shown in Table 8.
HF + mangiferin showed the highest plasma triglyceride concentration and statistically similar to
the HF group. Plasma triglycerides of HF + 1% mango and HF + rosiglitazone groups were
statistically similar to the control and HF groups. HF + 1% mango, HF + mangiferin, and HF
groups had similar plasma total cholesterol concentration. Only HF + rosiglitazone group had
similar plasma total cholesterol concentration to the control group. All the HF-fed groups had
higher HDL levels compared to control group, with HF + mangiferin group being the highest,
followed by HF, HF + 1% mango and HF + rosiglitazone groups. HF + rosiglitazone group had
the lowest level of non-esterified fatty acid (NEFA) and statistically different from all the other
treatment groups. Plasma NEFA in HF + 1% mango group was statistically similar to both the
control and HF groups while HF + mangiferin group had the highest plasma NEFA and also
statistically similar to the HF group.
There were no significant differences in fructosamine and glycated hemoglobin among
the treatment groups. However, there was significant difference in insulin among the treatment
groups. HF + mangiferin group had insulin level statistically similar to HF + 1% mango group.

44
Mice in the control, HF, HF + 1% mango, HF + rosiglitazone groups had statistically similar
plasma insulin concentration.
There was no significant difference in liver total lipid among the groups. However, fat
excretion was different with all HF groups having higher fecal total lipid than the control. The
control group had the lowest fecal total lipid and statistically different from all HF-fed groups.
Fecal total lipids of all the HF-fed mice were statistically the same.
Glucose tolerance test (GTT)
An intraperitoneal glucose tolerance test was performed after 30 and 60 days of dietary
treatments. Baseline blood glucose concentration after 30 days of treatment was similar for all
treatment groups (Figure 3a). Blood glucose concentrations were the same among the five
treatment groups five minutes post-glucose injection. Significant differences in blood glucose
were observed 15, 30 and 60 minutes post-injection. At 15 and 30 minutes, all HF fed groups had
similar blood glucose and were statistically higher than control group. However, there was
significant difference among the HF groups after 60 minutes of glucose injection. At this time
point, HF + mangiferin had the highest blood glucose and HF + rosiglitazone group was
statistically similar to the control group. HF + mango group had slightly lower blood glucose
concentration; statistically similar to HF + rosiglitazone group but was also not different from the
HF group. There were no significant differences in blood glucose concentrations among the
treatment groups two hours post-glucose injection. The total glucose area under curve after 30
days of dietary treatment was higher in all the HF-fed groups compared to the control and there
was no difference among the HF groups (Figure 3c).
Unlike the results of the 30 days glucose tolerance test, the glucose tolerance test after 60
days of dietary treatment showed significant differences among the treatment groups from
baseline to 120 minutes after the glucose injection (Figure 3b). The control group had the lowest

45
blood glucose concentration from baseline to 120 minutes. HF + rosiglitazone group consistently
reduced blood glucose and was statistically similar to the control group from baseline through
120 minutes. Mangiferin and mango were not effective in reducing blood glucose concentration
at all-time points post-glucose injection. The glucose AUC at 60 days of treatment were similar
for the control and HF + rosiglitazone groups and lower compared to the other HF groups. Unlike
rosiglitazone, mangiferin and mango was not able to improve glucose response in mice fed high
diet.
Histology
Figure 4 shows the results of liver and adipose tissue histology. HF group had larger
adipocytes compared to the control. HF +1% mango and HF+ mangiferin groups had slightly
smaller adipocytes compared to the HF group but not as small as HF + rosiglitazone group. HF +
rosiglitazone showed comparable adipocytes size to control group.
Liver histology shows diffuse cytoplasmic vacuolization, lipid droplets and steatosis in
the HF group compared to the control. Hepatocytes in the HF + 1% mango and HF+ rosiglitazone
groups appeared comparable to the control group, with no signs of steatosis or presence of lipid
droplets. HF + mangiferin group showed intermediate effects between the control group and HF
group as slight cytoplasmic vacuolization was observed.

46
Table 6: Effects of mango, rosiglitazone and mangiferin on food intake and body and tissue weights of mice fed high fed diets for two months.
Parameters AIN-93 High Fat High Fat + 1%
Mango
High Fat +
Mangiferin
High Fat +
Rosiglitazone
P value
Body weight (g)
Initial 21.17±1.92 21.18±1.85 21.25±1.88 21.29±1.46 21.69±1.09 0.9810
Final 25.85±2.52d 35.47±3.70
ab 32.24±4.02
bc 36.24±3.64
a 30.83±2.20
c <.0001
Weight gain (g) 4.68±2.66d 14.29±3.62
ab 10.99±4.31
bc 14.95±4.08
a 9.14±1.82
c <.0001
Caloric intake
(kcal/d)
11.36±0.75c 14.77±0.69
b 14.51±1.08
b 14.40±0.92
b 15.85±1.18
a <.0001
Food intake
(g/d)
3.09±0.20a 2.64±0.12
c 2.65±0.20
c 2.58±0.16
c 2.84±0.21
b <.0001
Feed efficiency
(g/g diet )
1.51±0.86d 5.41±1.37
ab 4.14±1.62
bc 5.80±1.58
a 3.22±0.64
c <.0001
Feed efficiency
(g/kal diet )
0.41±0.23d 1.26±0.32
ab 0.97±0.38
bc 1.32±0.36
a 0.80±0.16c <.0001
Tissue weights (mg)
White adipose
tissue
461.4±143.6c
1631.2±521.4ab
1275.7±622.2b 2000.0±486.7
a 515.0±251.1
c <.0001
Perirenal white
adipose tissue
113.3±80.8b 676.0±313.8
a 557.5±339.8
ab 872.5±342.3
a 140.0±62.5
b 0.012
Liver 911.4±169.9 1095.0±264.5 1057.1±85.0 1061.3±130.4 963.3±137.9 0.2475
Spleen 108.6±56.7 87.5±19.8 125.0±75.0 81.3±18.9 105.0±22.6 0.3520
Kidneys 310.0±43.4 350.0±36.6 318.0±28.6 332.5±29.2 320.0±23.7 0.1948
Values are mean ± SD, n=8/group; within a row, values that do not share the same letters are significantly (P<0.05) different from each other.

47
Table 7: Effects of mango, rosiglitazone and mangiferin on whole body composition, bone mineral area
(BMA), content (BMC) and density (BMD) of mice fed high fat diet for two months.
Parameters AIN-93M High Fat High Fat +
1% Mango
High Fat +
Mangiferin
High Fat +
Rosiglitazone
P value
Lean mass
(g)
17.4±1.7b 22.0±1.5
a 20.5±1.8
a 21.6±1.6
a 21.0±0.7
a <0.0001
Fat mass(g) 5.3±1.1c 11.5±2.4
ab 9.5±2.8
b 12.8±2.3
a 6.6±1.7
c <0.0001
Total
mass(g)
22.7±2.5c 33.5±3.6
a 30.0±3.9
b 34.4±3.5
a 27.5±2.2
b <0.0001
% fat 23.2±3.2c 34.2±3.9
ab 31.0±6.4
b 37.0±3.4
a 23.7±4.1
c <0.0001
% lean 76.8±3.2a 65.8±4.0
bc 69.0±6.5
b 63.0±3.4
c 76.4±4.0
a <0.0001
BMA(cm2) 11.5±0.5
a 10.1±0.5
b 10.4±0.9
b 9.7±0.6
b 10.3±0.8
b 0.0001
BMC (mg) 583.4±57.4a 505.4±26.4
b 516.6±58.9
b 481.6±52.3
b 493.8±414.7
b 0.0025
BMD
(mg/cm2)
50.8±3.3 50.3±1.0 49.8±2.0
49.6±2.3 47.7±1.3 0.1219
Values are mean ± SD, n=8/group; within a row, values that do not share the same letters are
significantly (P<0.05) different from each other
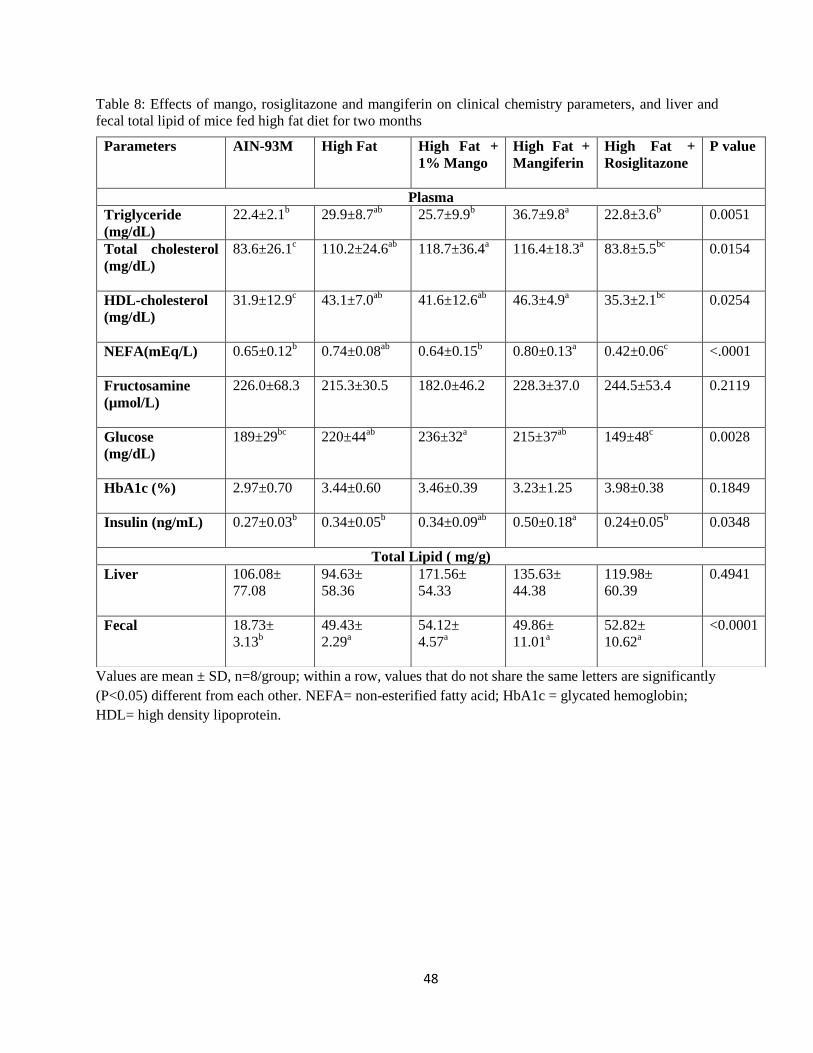
48
Table 8: Effects of mango, rosiglitazone and mangiferin on clinical chemistry parameters, and liver and
fecal total lipid of mice fed high fat diet for two months
Values are mean ± SD, n=8/group; within a row, values that do not share the same letters are significantly
(P<0.05) different from each other. NEFA= non-esterified fatty acid; HbA1c = glycated hemoglobin;
HDL= high density lipoprotein.
Parameters AIN-93M High Fat High Fat +
1% Mango
High Fat +
Mangiferin
High Fat +
Rosiglitazone
P value
Plasma
Triglyceride
(mg/dL)
22.4±2.1b 29.9±8.7
ab 25.7±9.9
b 36.7±9.8
a 22.8±3.6
b 0.0051
Total cholesterol
(mg/dL)
83.6±26.1c 110.2±24.6
ab 118.7±36.4
a 116.4±18.3
a 83.8±5.5
bc 0.0154
HDL-cholesterol
(mg/dL)
31.9±12.9c 43.1±7.0
ab 41.6±12.6
ab 46.3±4.9
a 35.3±2.1
bc 0.0254
NEFA(mEq/L) 0.65±0.12b 0.74±0.08
ab 0.64±0.15
b 0.80±0.13
a 0.42±0.06
c <.0001
Fructosamine
(µmol/L)
226.0±68.3 215.3±30.5 182.0±46.2 228.3±37.0 244.5±53.4 0.2119
Glucose
(mg/dL)
189±29bc
220±44ab
236±32a 215±37
ab 149±48
c 0.0028
HbA1c (%) 2.97±0.70 3.44±0.60 3.46±0.39 3.23±1.25 3.98±0.38 0.1849
Insulin (ng/mL) 0.27±0.03b 0.34±0.05
b 0.34±0.09
ab 0.50±0.18
a 0.24±0.05
b 0.0348
Total Lipid ( mg/g)
Liver 106.08±
77.08
94.63±
58.36
171.56±
54.33
135.63±
44.38
119.98±
60.39
0.4941
Fecal 18.73±
3.13b
49.43±
2.29a
54.12±
4.57a
49.86±
11.01a
52.82±
10.62a
<0.0001
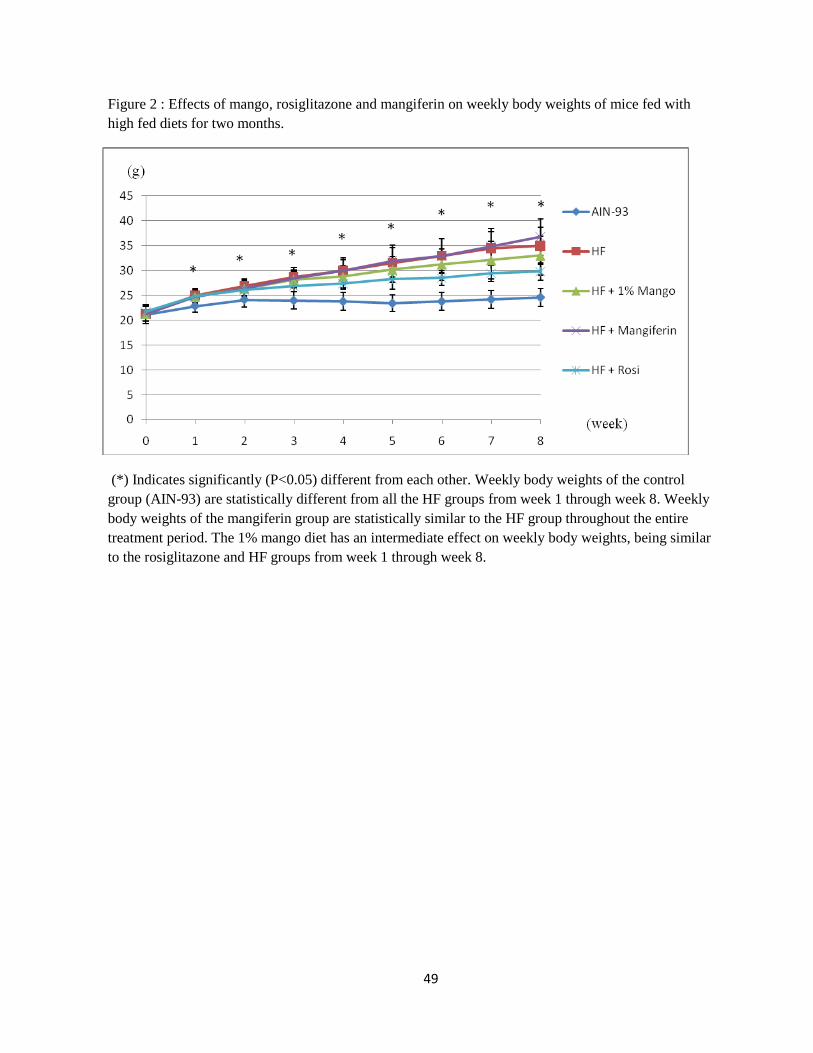
49
Figure 2 : Effects of mango, rosiglitazone and mangiferin on weekly body weights of mice fed with
high fed diets for two months.
(*) Indicates significantly (P<0.05) different from each other. Weekly body weights of the control
group (AIN-93) are statistically different from all the HF groups from week 1 through week 8. Weekly
body weights of the mangiferin group are statistically similar to the HF group throughout the entire
treatment period. The 1% mango diet has an intermediate effect on weekly body weights, being similar
to the rosiglitazone and HF groups from week 1 through week 8.

50
Figure 3: Effects of mango, rosiglitazone and mangiferin on glucose tolerance (a) after 30 days of
treatment (b) after 60 days of treatment and (c) total glucose area under the curve
(*) Indicates significantly (P<0.05) different from each other.
(mg/dL)
(min)

51
Bars are mean ±SD, n=8/group; bars that do not share the same letters are significantly (P<0.05) different
from each other. All comparison among groups at 30 d uses small letters and 60 d comparison are shown
with capital letters.

52
Figure 4: Effects of mango, rosiglitazone and mangiferin on liver and adipose tissue histology of
mice fed with high fed diets for two months.
Dietary
treatment group
Liver histology White adipose tissue histology
AIN-93
High Fat
HF+ 1% Mango
HF + Mangiferin
HF+
Rosiglitazone

53
CHAPTER V
DISCUSSION
The leaves and stem bark extracts of mango have been well-documented for its anti-
diabetic [26, 191-195] and hypolipidemic [26, 29, 196] properties. As mangiferin is the major
polyphenolic constituent in the mango leaves and stem bark, this bioactive compound has become
the focus for many researchers. To our knowledge, no studies have compared the effect of mango
pulp to mangiferin and rosiglitazone in improving clinical parameters associated with metabolic
syndrome. How much mangiferin contributes to the positive health effect of mango pulp is still
unknown. We have previously reported blood glucose lowering properties and body fat
modulation by 1% freeze-dried mango pulp in mice fed high fat diet [197]. However, whether
mangiferin is a major contributor to these positive effects of mango pulp warrants further
investigation. Hence, the present study compared the effects of mangiferin and freeze-dried
mango pulp on body composition, blood glucose and plasma lipid in mice fed high fat diet.
Additionally, the effects of freeze-dried mango and mangiferin were compared to rosiglitazone on
mitigating MetS risk factors.
In this study, all HF-fed groups had higher body weights compared to the control group
due to higher caloric intake and feed efficiency, which was consistent with previous studies on
mice [198-201]. Increased feed efficiency has been shown to associate with adipocyte hyperplasia
[200], which was consistent with the findings of this study . Mangiferin had higher feed

54
efficiency than mango group and rosiglitazone. Hence, mangiferin had highest adipose tissue
weights, number of expanded adipocytes and percentage of fat compared to 1% mango and
rosiglitazone groups. Therefore, mangiferin combined with high fat diet (60% calories from fat)
seemed to not confer any benefit in preventing fat accumulation. Lucas and colleagues [197]
showed that 1% freeze-dried mango pulp modulated body composition in mice fed high fat diet.
In contrast, a slight reduction in % body fat (approximately 10%) was observed in the present
study with the same dose of freeze-dried mango; however, the % body fat was not statistically
different from the HF group. The feed efficiency for the mango group was statistically similar to
the rosiglitazone group but was also similar to the HF group. This data shows that mango pulp
was more effective than mangiferin in modulating body composition. This indicates that other
components of mango, aside from mangiferin, maybe responsible for the positive effect of mango
pulp on body composition.
This study also compared the effects of mangiferin and mango to rosiglitazone on
glucose homeostasis. Earlier findings by Ichiki et.al [27] showed mangiferin (30 mg/kg and 90
mg/kg) decreased blood glucose in KKAy mice, an animal model of non-insulin dependent
diabetes mellitus (NIDDM). They also found that the glucose-lowering property of mangiferin at
90 mg/kg was more pronounced when compared to tolbutamide, a synthetic antidiabetic drug.
Unlike the findings of Ichiki, our findings do not support glucose lowering property of
mangiferin. Mangiferin was not able to lower fasting blood glucose or improve glucose tolerance
in mice fed high fat diet. The blood glucose and glucose AUC of mice in the mangiferin group
was statistically similar to mango and HF and significantly higher compared to rosiglitazone. In
addition to mangiferin, we also did not observe a glucose-modulating property of mango pulp.
This finding is not in agreement with the findings of Lucas et.al [197] that demonstrated 1%
freeze-dried mango pulp was able to reduce blood glucose during glucose tolerance test in mice
fed high fat diet. They also observed that mice that received the 1% freeze-dried mango pulp had
55
lower blood glucose lowering property than those that received the rosiglitazone treatment. This
discrepancy might be due to the instability of the active component in mango that possesses
glucose lowering property. The mango pulp used in the present study has been frozen for almost a
year compared to a fresh batch used in the study by Lucas et. al..
In this study, we also compared the effects of mangiferin, mango and rosiglitazone on
lipid profile. Previous studies [26, 29, 172] have shown that mangiferin was able to lower plasma
triglycerides in chemically-induced diabetes or diet- induced hyperlipidemia in rodents. However,
our study found that mangiferin was not able to modulate plasma triglycerides as it had the
highest plasma trglyceride concentrations among the HF-fed mice and was statistically similar to
the HF group. Although mangiferin was not able to modulate plasma triglycerides, mice in the
mango group had slightly lower plasma triglycerides. They had plasma triglyceride
concentrations similar to rosiglitazone albeit not statistically different from the HF group.
Muruganandan and colleagues [26] and Miura et.al [172] also found that mangiferin decreased
plasma total cholesterol in streptozotocin-induced diabetic rats and animal models of type 2
diabetes mellitus. Inconsistent with their findings, we found that both mangiferin and mango had
no hypocholesterolemic effect.
The study by Guo et.al [29] was very similar to our methodology as they studied effects
of mangiferin on lipid profiles in hamsters fed high fat diet. The hypolipidemic property of
mangiferin in this animal model might be attributed to the mangiferin doses that was used (50
mg/kg and 150 mg/kg body weight) compared to 0.003 mg/kg body weight in our study. This
mangiferin dose was equivalent to the mangiferin content in the 1% mango pulp and it was
derived using food intake divided by final body weight in the mangiferin group and times with a
dose of 0.044 mg/kg diet. Additionally, Miura et.al [172] also demonstrated that mangiferin (30
mg/kg body weight) was able to decrease blood cholesterol and triglyceride levels in KK-Ay

56
mice. Therefore, pharmacological doses of mangiferin might be necessary to produce these
positive effects on lipid profile and other MetS risk factors.
Another possible explanation for the lack of effect of mangiferin on the assessed clinical
parameters may be due to low biological activity or antioxidative capacity of isolated phenolic
compounds compared to the synergistic effects of the combination of the polyphenolic
compounds found in mango pulp [149, 158, 202]. Bohm and colleagues [203] examined the
antioxidant capacity of the individual and combination of ß-carotene, vitamin E and vitamin C on
the integrity of human lymphoid cells when the cells were excited with pulse radiolysis to
generate nitrogen dioxide free radicals. They observed that the combination treatment of ß-
carotene, vitamin E and vitamin C showed less membrane destruction compared to individual
components, suggesting synergistic interaction among components is crucial for exhibiting
antioxidant properties. In our study, the body composition, glucose and lipid profile in mangiferin
consistently showed similar effects to HF, further suggesting the importance of the synergistic
properties in mitigating MetS risk factors.
Considering that the present study used similar methodology as Lucas et.al [197], the
weak effect of the 1% mango in blood glucose and lipid modulation in the present study suggest
that factors other than methodology could explain the different outcomes. One explanation is the
stability of the active compounds in the mango powder. In this study, the mango used was a
combination of different batches of freeze-dried mango powder from previous years. This might
have attributed to the decreased activity of the antioxidant compounds in mango, leading to
insignificant findings. Antioxidant compounds like ascorbic acid, β-carotene and other phenolic
compounds found in mango have been well-documented to exhibit health-promoting properties
including anti-inflammatory and antiatherosclerosis in improving the risk factors of developing
metabolic syndrome [146, 188]. Longer storage may have reduced the activity of these
antioxidant compounds.

57
Hymavathi and Khader [163] studied the effects of storage duration and packaging
materials on the changes in phenolic compounds and other bioactive compounds in mango
powder. They found positive correlation between the degradation of total carotene and ascorbic
acid with storage duration. Furthermore, dehydrated products like freeze-dried mango powder
were more susceptible to deterioration or oxidation due to increased porosity and surface area
[204]. Additionally, the stability of bioactive compound such as ascorbic acid in freeze-dried
mango powder was negatively correlated with moisture content and oxygen [205]. Packaging
materials that are completely impermeable to the air or water are crucial in minimizing the loss of
antioxidant compounds in the mango powder. [205].
Although the mango powder from the present study and that of Lucas et.al was from the
same Tommy Atkins cultivar, the carotenoid contents may have differed due to different harvest
locations [146, 161]; this factor could not be neglected considering mango powder in the present
study was from combination of different batches of mango powder. It has been shown that hot
and moderate climate affected the carotenoid content in the mango [146]. Godoy and Rodriguez-
Amaya [206] demonstrated that Tommy Atkins mango grown in hot areas like Mato Grosso,
Brazil had more β-carotene content compared to moderate areas like Sao Paulo, Brazil.
Furthermore, a diverse range of amounts of gallotannin in Tommy Atkins mango pulp was
reported even though the mangos were harvested from subtropical countries [188]. The
inconsistencies in the quantity of phenolic compounds in mangos occurred although they were
from the same cultivar, leading to inevitable variability in different batches of mango.
The ripeness of the mango is also critical in interpreting our results. It has been
documented that the ripening stage of mango caused prominent quantitative changes of total
carotenoid content [146]. Gil et.al [170] examined the compositional changes in the ripening
stage of mango pulp using nuclear magnetic resonance spectroscopy (NMRS). The researchers
observed that shikimic acid was the major constituent in unripe mangos, and gradually

58
diminished with ripening. During the early ripening stage, small metabolites like niacin and
phenylalanine were shown and when mango reached final ripening stage, formation of
polyphenolic compounds was detected.
In summary, mangiferin had lesser beneficial effect than mango but both mangiferin and
mango showed less beneficial effects in modulating body composition, triglyceride levels and
total cholesterol when compared to rosiglitazone. Rosiglitazone is known to increase insulin
sensitivity by up-regulating adiponectin secretion by adipocytes [105], leading to increased FA
oxidation and declined influx of FFA in liver and muscle cells [108-110]. Therefore, less fat
deposition reduced the adipose tissue weights and hyperplasia, leading to body composition
modulation in mice with rosiglitazone treatment.
Our findings also suggest that mangiferin (0.003 mg/kg) is not a key contributor to the
beneficial effects of 1% mango. Mangiferin, an isolated phenolic compound, showed weaker
bioactivity compared to the synergistic interactions among all phenolic or antioxidant compounds
found in mango pulp. Our data further demonstrated the importance of the interactions among
antioxidant and polyphenolic compounds in exhibiting health- promoting properties.
The main limitation of this study as discussed above is the use of a mixture of different
batches of freeze-dried mango which can come from different harvest locations and the different
stages of fruit maturity. Moreover, extended storage and mango packaging may have contributed
to changes in the bioactive components of mango, leading to decreased antioxidant potential in
ameliorating MS risk factors. Another limitation is the qualitative assessment of the liver and
adipose tissue histology. The quantification of cytoplasmic vacuolization, lipid droplets and
steatosis in liver histology was not assessed in this study. Moreover, the quantitation of adipose
tissue hypertrophy and hyperplasia was not performed. Hence, interpretation of this data is
subject to investigator bias.

59
In conclusion, we reject the null hypothesis that there is no difference between
mangiferin, mango and rosiglitazone in (1) modulating body composition; (2) lowering glucose
concentration and glucose homeostasis, (3) modulating other clinical parameters in mice fed high
fat diet.

60
REFERENCES
1. Alberti, K.G.M.M., et al., Harmonizing the Metabolic Syndrome. Circulation,
2009. 120(16): p. 1640-1645.
2. Grundy, S.M., et al., Diagnosis and Management of the Metabolic Syndrome.
Circulation, 2005. 112(17): p. 2735-2752.
3. CDC. U.S. Obesity Trends- Trends by State 1985-2010. 2011 1/10/12]; Available
from: http://www.cdc.gov/obesity/data/trends.html.
4. CDC. Diagnosed and undiagnosed diabetes in the United States, all ages, 2010
2011 1/10/12; Available from:http://www.cdc.gov/diabetes/pubs/estimates11.htm.
5. Björntorp, P., H. Bergman, and E. Varnauskas, Plasma Free Fatty Acid Turnover
Rate in Obesity. Acta Medica Scandinavica, 1969. 185(1-6): p. 351-356.
6. Hosogai, N., et al., Adipose Tissue Hypoxia in Obesity and Its Impact on
Adipocytokine Dysregulation. Diabetes, 2007. 56(4): p. 901-911.
7. Wang, B., I. Wood, and P. Trayhurn, Dysregulation of the expression and
secretion of inflammation-related adipokines by hypoxia in human adipocytes.
Pflügers Archiv European Journal of Physiology, 2007. 455(3): p. 479-492.
8. Franklin, S.S., Arterial Stiffness and Hypertension. Hypertension, 2005. 45(3): p.
349-351.
9. Couture, P., et al., 1.P.178 Effect of atorvastatin on serum levels of lipoproteins in
French Canadians with homozygous or compound heterozygous familial
hypercholesterolemia. Atherosclerosis, 1997. 134(1-2): p. 54-54.
10. Gagne, C., et al., Efficacy and Safety of Ezetimibe Coadministered With
Atorvastatin or Simvastatin in Patients With Homozygous Familial
Hypercholesterolemia. Circulation, 2002. 105(21): p. 2469-2475.
11. Khan, B., H.G. Wilcox, and M. Heimberg, Cholesterol Is Required for Secretion
of Very-Low-Density Lipoprotein By Rat Liver. Biochemical Journal, 1989.
258(3): p. 807-816.
12. Vance, J. and D. Vance, Specific pools of phospholipids are used for lipoprotein
secretion by cultured rat hepatocytes. J. Biol. Chem., 1986. 261(10): p. 4486-
4491.
13. Staels, B., et al., Mechanism of Action of Fibrates on Lipid and Lipoprotein
Metabolism. Circulation, 1998. 98(19): p. 2088-2093.
14. Kramer, D., et al., Insulin-sensitizing effect of rosiglitazone (BRL-49653) by
regulation of glucose transporters in muscle and fat of Zucker rats. Metabolism,
2001. 50(11): p. 1294-1300.
15. Nissen, S.E. and K. Wolski, Effect of Rosiglitazone on the Risk of Myocardial

61
Infarction and Death from Cardiovascular Causes. New England Journal of
Medicine, 2007. 356(24): p. 2457-2471.
16. Nesto, R.W., et al., Thiazolidinedione Use, Fluid Retention, and Congestive Heart
Failure. Circulation, 2003. 108(23): p. 2941-2948.
17. Ali, A.A., et al., Rosiglitazone Causes Bone Loss in Mice by Suppressing
Osteoblast Differentiation and Bone Formation. Endocrinology, 2005. 146(3): p.
1226-1235.
18. Block, G., B. Patterson, and A. Subar, Fruit, Vegetables, and Cancer Prevention-
A Review of the Epidemiologic Evidence. Nutrition and Cancer-an International
Journal, 1992. 18(1): p. 1-29.
19. Steinmetz, K.A. and J.D. Potter, Vegetables, Fruit, and Cancer. II. Mechanisms.
Cancer Causes & Control, 1991. 2(6): p. 427-442.
20. Marlett, J.A., M.I. McBurney, and J.L. Slavin, Position of the American Dietetic
Association: Health Implications of Dietary Fiber. Journal of the American
Dietetic Association, 2002. 102(7): p. 993-1000.
21. Kaur, C. and H.C. Kapoor, Antioxidants in fruits and vegetables – the
millennium’s health. International Journal of Food Science & Technology, 2001.
36(7): p. 703-725.
22. Kris-Etherton, P.M., et al., Bioactive compounds in foods: their role in the
prevention of cardiovascular disease and cancer. The American Journal of
Medicine, 2002. 113(9, Supplement 2): p. 71-88.
23. Masibo, M. and Q. He, Major Mango Polyphenols and Their Potential
Significance to Human Health. Comprehensive Reviews in Food Science and
Food Safety, 2008. 7(4): p. 309-319.
24. Cader, A., et al., Mechanisms of enhanced macrophage apoE secretion by
oxidized LDL. J. Lipid Res., 1997. 38(5): p. 981-991.
25. Yoshikawa, M., et al., Polyphenol Constituents from Salacia Species:
Quantitative Analysis of Mangiferin with α-Glucosidase and Aldose
Reductase Inhibitory Activities. Yakugaku Zasshi, 2001. 121(5): p. 371-378.
26. Muruganandan, S., et al., Effect of mangiferin on hyperglycemia and
atherogenicity in streptozotocin diabetic rats. Journal of Ethnopharmacology,
2005. 97(3): p. 497-501.
27. Ichiki, H., et.al, New Antidiabetic Compounds, Mangiferin and Its Glucoside.
Biological & Pharmaceutical Bulletin 1998. 21(12): p. 1389-1390.
28. Muruganandan, S., et al., Mangiferin protects the streptozotocin-induced
oxidative damage to cardiac and renal tissues in rats. Toxicology, 2002. 176(3):
p. 165-173.
29. Guo, F., et al., Beneficial effects of mangiferin on hyperlipidemia in high-fat-fed
hamsters. Molecular Nutrition & Food Research, 2011. 55(12): p. 1809-1818.
30. Birnbaum, M.J., Turning down insulin signaling. The Journal of Clinical
Investigation, 2001. 108(5): p. 655-659.
31. Evans, J.L., et al., Oxidative Stress and Stress-Activated Signaling Pathways: A
Unifying Hypothesis of Type 2 Diabetes. Endocrine Reviews, 2002. 23(5): p. 599-
622.
32. Garrido, G., et al., In vivo and in vitro anti-inflammatory activity of Mangifera
indica L. extract (VIMANG®). Pharmacological Research, 2004. 50(2): p. 143-

62
149.
33. Beltrán, A.E., et al., Vascular effects of the Mangifera indica L. extract (Vimang).
European Journal of Pharmacology, 2004. 499(3): p. 297-305.
34. Moller, D.E. and K.D. Kaufman, Metabolic Syndrome: A Clinical and Molecular
Perspective. Annual Review of Medicine, 2005. 56(1): p. 45-C-1.
35. Flegal, K.M., et al., Prevalence and Trends in Obesity Among US Adults, 1999-
2008. JAMA: The Journal of the American Medical Association, 2010. 303(3): p.
235-241.
36. Finkelstein, E.A., et al., Annual Medical Spending Attributable To Obesity:
Payer-And Service-Specific Estimates. Health Affairs, 2009. 28(5): p. w822-
w831.
37. National diabetes fact sheet: national estimates and general information on
diabetes and prediabetes in the United States, 2011. 2011 [cited 2012 February
2nd]; Available from:http://www.cdc.gov/diabetes/pubs/factsheet11.htm#citation.
38. Hollenberg CH, V.A., Patten RL, Regulation of adipose mass: control of fat cell
development and lipid content. Recent Prog Horm Res, 1970(26): p. 463.
39. A. Angel, m.d., Toronto, Pathophysiology of obesity. Can Med Assoc J., 1974.
110(5): p. 540, 545-548.
40. Hirsch, J. and E. Gallian, Methods for the determination of adipose cell size in
man and animals. Journal of Lipid Research, 1968. 9(1): p. 110-119.
41. Hotamisligil, G.S., N.S. Shargill, and B.M. Spiegelman, Adipose Expression of
Tumor Necrosis Factor-α: Direct Role in Obesity-Linked Insulin Resistance.
Science, 1993. 259(5091): p. 87-91.
42. Dandona, P., et al., Increased Plasma Concentration of Macrophage Migration
Inhibitory Factor (MIF) and MIF mRNA in Mononuclear Cells in the Obese and
the Suppressive Action of Metformin. Journal of Clinical Endocrinology &
Metabolism, 2004. 89(10): p. 5043-5047.
43. Kern, P.A., et al., Adipose tissue tumor necrosis factor and interleukin-6
expression in human obesity and insulin resistance. American Journal of
Physiology - Endocrinology And Metabolism, 2001. 280(5): p. E745-E751.
44. Dandona, P., et al., Tumor Necrosis Factor-α in Sera of Obese Patients: Fall with
Weight Loss. Journal of Clinical Endocrinology & Metabolism, 1998. 83(8): p.
2907-2910.
45. Vozarova, B., et al., Circulating Interleukin-6 in Relation to Adiposity, Insulin
Action, and Insulin Secretion. Obesity, 2001. 9(7): p. 414-417.
46. Pradhan, A.D., et al., C-Reactive Protein, Interleukin 6, and Risk of Developing
Type 2 Diabetes Mellitus. JAMA: The Journal of the American Medical
Association, 2001. 286(3): p. 327-334.
47. Ghanim, H., et al., Circulating Mononuclear Cells in the Obese Are in a
Proinflammatory State. Circulation, 2004. 110(12): p. 1564-1571.
48. Horowitz, J.F. and S. Klein, Whole body and abdominal lipolytic sensitivity to
epinephrine is suppressed in upper body obese women. American Journal of
Physiology - Endocrinology And Metabolism, 2000. 278(6): p. E1144-E1152.
49. Coleman, R.A. and D.P. Lee, Enzymes of triacylglycerol synthesis and their
regulation. Progress in Lipid Research, 2004. 43(2): p. 134-176.
50. Scott A, S., Ceramides in insulin resistance and lipotoxicity. Progress in Lipid

63
Research, 2006. 45(1): p. 42-72.
51. Morino, K., K.F. Petersen, and G.I. Shulman, Molecular Mechanisms of Insulin
Resistance in Humans and Their Potential Links With Mitochondrial Dysfunction.
Diabetes, 2006. 55(Supplement 2): p. S9-S15.
52. Schenk, S. and J.F. Horowitz, Acute exercise increases triglyceride synthesis in
skeletal muscle and prevents fatty acid–induced insulin resistance. Journal of
Clinical Investigation, 2007. 117(6): p. 1690-1698.
53. Liu, L., et al., Upregulation of myocellular DGAT1 augments triglyceride
synthesis in skeletal muscle and protects against fat-induced insulin resistance.
The Journal of Clinical Investigation, 2007. 117(6): p. 1679-1689.
54. Minsheng, Y., et al., Reversal of Obesity- and Diet-Induced Insulin Resistance
with Salicylates or Targeted Disruption. Science, 2001. 293(5535): p. 1673.
55. Ye, J., et al., Hypoxia is a potential risk factor for chronic inflammation and
adiponectin reduction in adipose tissue of ob/ob and dietary obese mice.
American Journal of Physiology - Endocrinology And Metabolism, 2007. 293(4):
p. E1118-E1128.
56. Lumeng, C.N., J.L. Bodzin, and A.R. Saltiel, Obesity induces a phenotypic switch
in adipose tissue macrophage polarization. The Journal of Clinical Investigation,
2007. 117(1): p. 175-184.
57. Cinti, S., et al., Adipocyte death defines macrophage localization and function in
adipose tissue of obese mice and humans. Journal of Lipid Research, 2005.
46(11): p. 2347-2355.
58. Strissel, K.J., et al., Adipocyte Death, Adipose Tissue Remodeling, and Obesity
Complications. Diabetes, 2007. 56(12): p. 2910-2918.
59. Gual, P., Y. Le Marchand-Brustel, and J.-F. Tanti, Positive and negative
regulation of insulin signaling through IRS-1 phosphorylation. Biochimie, 2005.
87(1): p. 99-109.
60. Aguirre, V., et al., Phosphorylation of Ser307 in Insulin Receptor Substrate-1
Blocks Interactions with the Insulin Receptor and Inhibits Insulin Action. Journal
of Biological Chemistry, 2002. 277(2): p. 1531-1537.
61. Todd, D.J., A.-H. Lee, and L.H. Glimcher, The endoplasmic reticulum stress
response in immunity and autoimmunity. Nat Rev Immunol, 2008. 8(9): p. 663-
674.
62. Ron, D. and P. Walter, Signal integration in the endoplasmic reticulum unfolded
protein response. Nat Rev Mol Cell Biol, 2007. 8(7): p. 519-529.
63. Hotamisligil, G.S., Inflammation and metabolic disorders. Nature, 2006.
444(7121): p. 860-867.
64. Schröder, M. and R.J. Kaufman, The Mammalian Unfolded Protein Response.
Annual Review of Biochemistry, 2005. 74(1): p. 739-789.
65. Deng, J., et al., Translational Repression Mediates Activation of Nuclear Factor
Kappa B by Phosphorylated Translation Initiation Factor 2. Molecular and
Cellular Biology, 2004. 24(23): p. 10161-10168.
66. Hu, P., et al., Autocrine Tumor Necrosis Factor Alpha Links Endoplasmic
Reticulum Stress to the Membrane Death Receptor Pathway through IRE1α-
Mediated NF-κB Activation and Down-Regulation of TRAF2 Expression.
Molecular and Cellular Biology, 2006. 26(8): p. 3071-3084.

64
67. Petersen, K.F. and G.I. Shulman, Etiology of Insulin Resistance. The American
Journal of Medicine, 2006. 119(5, Supplement 1): p. S10-S16.
68. St-Pierre, J., et al., Bioenergetic Analysis of Peroxisome Proliferator-activated
Receptor γ Coactivators 1α and 1β (PGC-1α and PGC-1β) in Muscle Cells.
Journal of Biological Chemistry, 2003. 278(29): p. 26597-26603.
69. Reaven, G.M. and Y.-D.I. Chen, Insulin Resistance, Its Consequences, and
Coronary Heart Disease : Must We Choose One Culprit? Circulation, 1996.
93(10): p. 1780-1783.
70. McGarry, J.D., What If Minkowski Had Been Ageusic? An Alternative Angle on
Diabetes. Science, 1992. 258(5083): p. 766-770.
71. Shimomura, I., et al., Decreased IRS-2 and Increased SREBP-1c Lead to Mixed
Insulin Resistance and Sensitivity in Livers of Lipodystrophic and ob/ob Mice.
Molecular Cell, 2000. 6(1): p. 77-86.
72. Ross, R., Atherosclerosis — An Inflammatory Disease. New England Journal of
Medicine, 1999. 340(2): p. 115-126.
73. Ross, R., The Pathogenesis of Atherosclerosis — An Update. New England
Journal of Medicine, 1986. 314(8): p. 488-500.
74. Howard, B.V. and W.J. Howard, Dyslipidemia in Non-Insulin-Dependent
Diabetes Mellitus. Endocrine Reviews, 1994. 15(3): p. 263-274.
75. Ginsberg, H.N., Insulin resistance and cardiovascular disease. J Clin Invest.,
2000. 106(4): p. 453-458.
76. Lee, A.T. and A. Cerami, Role of Glycation in Aging. Annals of the New York
Academy of Sciences, 1992. 663(1): p. 63-70.
77. Brownlee, M., A. Cerami, and H. Vlassara, Advanced products of nonenzymatic
glycosylation and the pathogenesis of diabetic vascular disease.
Diabetes/Metabolism Reviews, 1988. 4(5): p. 437-451.
78. Rojas, A., et al., Regulation of Endothelial Nitric Oxide Synthase Expression by
Albumin-Derived Advanced Glycosylation End Products. Circulation Research,
2000. 86(3): p. e50-e54.
79. Yan, S.D., et al., Enhanced cellular oxidant stress by the interaction of advanced
glycation end products with their receptors/binding proteins. Journal of
Biological Chemistry, 1994. 269(13): p. 9889-97.
80. Throckmorton, D., PDGF and TGF-β mediate collagen production by mesangial
cells exposed to advanced glycosylation end products. Kidney international, 1995.
48(1): p. 111.
81. Kuzuya, M., et al., Glycation cross-links inhibit matrix metalloproteinase-2
activation in vascular smooth muscle cells cultured on collagen lattice.
Diabetologia, 2001. 44(4): p. 433-436.
82. Wendt, T., et al., Receptor for advanced glycation endproducts (RAGE) and
vascular inflammation: Insights into the pathogenesis of macrovascular
complications in diabetes. Current Atherosclerosis Reports, 2002. 4(3): p. 228-
237.
83. Stern, D., et al., Receptor for advanced glycation endproducts: a multiligand
receptor magnifying cell stress in diverse pathologic settings. Advanced Drug
Delivery Reviews, 2002. 54(12): p. 1615-1625.
84. Schmidt, A. and D. Stern, Atherosclerosis and diabetes: The rage connection.

65
Current Atherosclerosis Reports, 2000. 2(5): p. 430-436.
85. Miller, J.H. and M.D. Bogdonoff, Antidiuresis Associated With Administration of
Insulin. Journal of Applied Physiology, 1954. 6(8): p. 509-512.
86. Nizet, A., P. Lefebvre, and J. Crabbé, Control by insulin of sodium potassium and
water excretion by the isolated dog kidney. Pflügers Archiv European Journal of
Physiology, 1971. 323(1): p. 11-20.
87. R A DeFronzo, C.R.C., R Andres, G R Faloona, P J Davis, The effects of insulin
on renal handling of sodium, potassium, calcium, and phosphate in man. J Clin
Invest., 1975. 55(4): p. 845-855.
88. Strazzullo, P., et al., Abnormalities of renal sodium handling in the metabolic
syndrome. Results of the Olivetti Heart Study. Journal of Hypertension, 2006.
24(8): p. 1633-1639 10.1097/01.hjh.0000239300.48130.07.
89. Sarafidis, P.A. and G.L. Bakris, Insulin and Endothelin: An Interplay
Contributing to Hypertension Development? Journal of Clinical Endocrinology &
Metabolism, 2007. 92(2): p. 379-385.
90. Masaoki, T., et al., Interleukin-6 as a mediator responsible for inflammation-
induced increase in plasma angiotensinogen. Biochemical Pharmacology, 1993.
45(1): p. 201-206.
91. Grassi, G., et al., Effect of central and peripheral body fat distribution on
sympathetic and baroreflex function in obese normotensives. Journal of
Hypertension, 2004. 22(12): p. 2363-2369.
92. Julius, S., et al., Hyperkinetic borderline hypertension in Tecumseh, Michigan.
Journal of Hypertension, 1991. 9(1): p. 77-84.
93. Julius, S. and K. Jamerson, Sympathetics, insulin resistance and coronary risk in
hypertension: the 'chicken-and-egg' question. Journal of Hypertension, 1994.
12(5): p. 495-502.
94. Engeli, S., et al., The adipose-tissue renin–angiotensin–aldosterone system: role
in the metabolic syndrome? The International Journal of Biochemistry &
Cell Biology, 2003. 35(6): p. 807-825.
95. Sowers, J.R., Insulin resistance and hypertension. American Journal of
Physiology - Heart and Circulatory Physiology, 2004. 286(5): p. H1597-H1602.
96. Vamecq, J. and N. Latruffe, Medical significance of peroxisome proliferator-
activated receptors. The Lancet, 1999. 354(9173): p. 141-148.
97. Barbier, O., et al., Pleiotropic Actions of Peroxisome Proliferator–Activated
Receptors in Lipid Metabolism and Atherosclerosis. Arteriosclerosis, Thrombosis,
and Vascular Biology, 2002. 22(5): p. 717-726.
98. Willson, T.M., M.H. Lambert, and S.A. Kliewer, Peroxisome Proliferator-
Activated Receptor ϒ and Metabolic Syndrome. Annual Review of Biochemistry,
2001. 70(1): p. 341-367.
99. Dubois M, P.F., Kerr-Conte J, Gmyr V, Vandewalle B, Desreumaux P, Auwerx J,
Schoonjans K, Lefebvre J, Expression of peroxisome proliferator-activated
receptor gamma (PPARgamma) in normal human pancreatic islet cells.
Diabetologia, 2000. 43(9): p. 1165-1169.
100. Michalik, L., B. Desvergne, and W. Wahli, Peroxisome proliferator-activated
receptors [beta]/[delta]: emerging roles for a previously neglected third family
member. Current Opinion in Lipidology, 2003. 14(2): p. 129-135.

66
101. Kersten, S., B. Desvergne, and W. Wahli, Roles of PPARs in health and disease.
Nature, 2000. 405(6785): p. 421-424.
102. Duez, H., et al., Reduction of Atherosclerosis by the Peroxisome Proliferator-
activated Receptor α Agonist Fenofibrate in Mice. Journal of Biological
Chemistry, 2002. 277(50): p. 48051-48057.
103. Rubins, H.B., et al., Gemfibrozil for the Secondary Prevention of Coronary Heart
Disease in Men with Low Levels of High-Density Lipoprotein Cholesterol. New
England Journal of Medicine, 1999. 341(6): p. 410-418.
104. Effect of fenofibrate on progression of coronary-artery disease in type 2 diabetes:
the Diabetes Atherosclerosis Intervention Study, a randomised study. The Lancet,
2001. 357(9260): p. 905-910.
105. Maeda, N., et al., PPARγ Ligands Increase Expression and Plasma
Concentrations of Adiponectin, an Adipose-Derived Protein. Diabetes, 2001.
50(9): p. 2094-2099.
106. Cabrero, A., J.C. Laguna, and M. Vazquez, Peroxisome Proliferator-Activated
Receptors and the Control of Inflammation. Current Drug Targets - Inflammation
& Allergy, 2002. 1(3): p. 243-248.
107. Combs, T.P., et al., A Transgenic Mouse with a Deletion in the Collagenous
Domain of Adiponectin Displays Elevated Circulating Adiponectin and Improved
Insulin Sensitivity. Endocrinology, 2004. 145(1): p. 367-383.
108. Fruebis, J., et al., Proteolytic cleavage product of 30-kDa adipocyte complement-
related protein increases fatty acid oxidation in muscle and causes weight loss in
mice. Proceedings of the National Academy of Sciences, 2001. 98(4): p. 2005-
2010.
109. Tomas, E., et al., Enhanced muscle fat oxidation and glucose transport by
ACRP30 globular domain: Acetyl–CoA carboxylase inhibition and AMP-
activated protein kinase activation. Proceedings of the National Academy of
Sciences, 2002. 99(25): p. 16309-16313.
110. Yamauchi, T., et al., Adiponectin stimulates glucose utilization and fatty-acid
oxidation by activating AMP-activated protein kinase. Nat Med, 2002. 8(11): p.
1288-1295.
111. Endemann, G., et al., CD36 is a receptor for oxidized low density lipoprotein.
Journal of Biological Chemistry, 1993. 268(16): p. 11811-11816.
112. Braun, J.E.A. and D.L. Severson, Regulation of the Synthesis, Processing and
Translocation of Lipoprotein-Lipase. Biochemical Journal, 1992. 287: p. 337-347.
113. Enerbäck, S. and J.M. Gimble, Lipoprotein lipase gene expression: Physiological
regulators at the transcriptional and post-transcriptional level. Biochimica et
Biophysica Acta (BBA) - Lipids and Lipid Metabolism, 1993. 1169(2): p. 107-
125.
114. Way, J.M., et al., Comprehensive Messenger Ribonucleic Acid Profiling Reveals
That Peroxisome Proliferator-Activated Receptor γ Activation Has Coordinate
Effects on Gene Expression in Multiple Insulin-Sensitive Tissues. Endocrinology,
2001. 142(3): p. 1269-1277.
115. Chawla, A., et al., A PPARγ-LXR-ABCA1 Pathway in Macrophages Is Involved in
Cholesterol Efflux and Atherogenesis. Molecular Cell, 2001. 7(1): p. 161-171.
116. Repa, J.J., et al., Regulation of Absorption and ABC1-Mediated Efflux of

67
Cholesterol by RXR Heterodimers. Science, 2000. 289(5484): p. 1524.
117. Venkateswaran, A., et al., Control of cellular cholesterol efflux by the nuclear
oxysterol receptor LXRα. Proceedings of the National Academy of Sciences,
2000. 97(22): p. 12097-12102.
118. Costet, P., et al., Sterol-dependent Transactivation of theABC1 Promoter by the
Liver X Receptor/Retinoid X Receptor. Journal of Biological Chemistry, 2000.
275(36): p. 28240-28245.
119. P De Vos, A.M.L., S G Miller, M Guerre-Millo, K Wong, R Saladin, L G
Hamann, B Staels, M R Briggs, J Auwerx, Thiazolidinediones repress
ob gene expression in rodents via activation of peroxisome proliferator-activated
receptor. J Clin Invest., 1996. 98(4): p. 1004-1009.
120. Kallen, C.B. and M.A. Lazar, Antidiabetic thiazolidinediones inhibit leptin (ob)
gene expression in 3T3-L1 adipocytes. Proceedings of the National Academy of
Sciences, 1996. 93(12): p. 5793-5796.
121. Caro, J.F., et al., Leptin: the tale of an obesity gene. Diabetes, 1996. 45(11): p.
1455-1462.
122. Igel, M., et al., Hyperleptinemia, Leptin Resistance, and Polymorphic Leptin
Receptor in the New Zealand Obese Mouse. Endocrinology, 1997. 138(10): p.
4234-4239.
123. Marsh, D.J., et al., Response of melanocortin-4 receptor-deficient mice to
anorectic and orexigenic peptides. Nat Genet, 1999. 21(1): p. 119-122.
124. Avandia ( rosiglitazone maleate), 2000, GlaxoSmithKline Pharmaceuticals:
Philadelphia, Pa.
125. Kahn, S.E., et al., Glycemic Durability of Rosiglitazone, Metformin, or Glyburide
Monotherapy. New England Journal of Medicine, 2006. 355(23): p. 2427-2443.
126. Bando Y, U.Y., Okafuji K, Toya D, Tanaka N, Fujisawa M, Troglitazone
combination therapy in obese type 2 diabetic patients poorly controlled with
alpha-glucosidase inhibitors. J Int Med Res, 1999. 27(2): p. 53-64.
127. Yoshimoto, T., et al., Antihypertensive and vasculo- and renoprotective effects of
pioglitazone in genetically obese diabetic rats. American Journal of Physiology -
Endocrinology And Metabolism, 1997. 272(6): p. E989-E996.
128. Hosokawa, M., et al., Troglitazone Inhibits Bicarbonate Secretion in Rat and
Human Duodenum. Journal of Pharmacology and Experimental Therapeutics,
1999. 290(3): p. 1080-1084.
129. Walker, A.B., et al., Differential vasoactive effects of the insulin sensitizers
rosiglitazone (BRL 49653) and troglitazone on human small arteries in vitro.
Diabetes, 1998. 47(5): p. 810-814.
130. Baba, T., et al., The Oral Insulin Sensitizer, Thiazolidinedione, Increases Plasma
Vascular Endothelial Growth Factor in Type 2 Diabetic Patients. Diabetes Care,
2001. 24(5): p. 953-954.
131. Grey, A., et al., The Peroxisome Proliferator-Activated Receptor-γ Agonist
Rosiglitazone Decreases Bone Formation and Bone Mineral Density in Healthy
Postmenopausal Women: A Randomized, Controlled Trial. Journal of Clinical
Endocrinology & Metabolism, 2007. 92(4): p. 1305-1310.
132. Rzonca, S.O., et al., Bone Is a Target for the Antidiabetic Compound
Rosiglitazone. Endocrinology, 2004. 145(1): p. 401-406.
68
133. Lecka-Czernik, B., et al., Divergent Effects of Selective Peroxisome Proliferator-
Activated Receptor-γ2 Ligands on Adipocyte Versus Osteoblast Differentiation.
Endocrinology, 2002. 143(6): p. 2376-2384.
134. Lecka-Czernik, B., et al., Inhibition of Osf2/Cbfa1 expression and terminal
osteoblast differentiation by PPARγ2. Journal of Cellular Biochemistry, 1999.
74(3): p. 357-371.
135. Jiang, Y., et al., Pluripotency of mesenchymal stem cells derived from adult
marrow. Nature, 2007. 447(7146): p. 880-881.
136. Bianco, P., et al., Bone Marrow Stromal Stem Cells: Nature, Biology, and
Potential Applications. STEM CELLS, 2001. 19(3): p. 180-192.
137. Beresford, J.N., et al., Evidence for an inverse relationship between the
differentiation of adipocytic and osteogenic cells in rat marrow stromal cell
cultures. Journal of Cell Science, 1992. 102(2): p. 341-351.
138. Nuttall, M.E. and J.M. Gimble, Is there a therapeutic opportunity to either
prevent or treat osteopenic disorders by inhibiting marrow adipogenesis? Bone,
2000. 27(2): p. 177-184.
139. Ducy, P., et al., A Cbfa1-dependent genetic pathway controls bone formation
beyond embryonic development. Genes & Development, 1999. 13(8): p. 1025-
1036.
140. Nakashima, K., et al., The Novel Zinc Finger-Containing Transcription Factor
Osterix Is Required for Osteoblast Differentiation and Bone Formation. Cell,
2002. 108(1): p. 17-29.
141. USDA. USDA Nutritional Data Base for Standard Reference. 2006; Available
from: http://www.nal.usda.gov/Fnic/USDA/Foodcomp/Data/Volume Release 19.
142. Davey, M.W., et al., Plant L-ascorbic acid: chemistry, function, metabolism,
bioavailability and effects of processing. Journal of the Science of Food and
Agriculture, 2000. 80(7): p. 825-860.
143. Arrigoni, O. and M.C. De Tullio, Ascorbic acid: much more than just an
antioxidant. Biochimica et Biophysica Acta (BBA) - General Subjects, 2002.
1569(1–3): p. 1-9.
144. Modi, V. and D. Patwa, Enzymatic synthesis and destruction of carotenoids in
mango extracts. Cellular and Molecular Life Sciences, 1960. 16(8): p. 352-352.
145. Chen, J.P., C.Y. Tai, and B.H. Chen, Improved liquid chromatographic method
for determination of carotenoids in Taiwanese mango (Mangifera indica L.).
Journal of Chromatography A, 2004. 1054(1–2): p. 261-268.
146. Mercadante, A.Z. and D.B. Rodriguez-Amaya, Effects of Ripening, Cultivar
Differences, and Processing on the Carotenoid Composition of Mango. Journal of
Agricultural and Food Chemistry, 1998. 46(1): p. 128-130.
147. Bendich, A., Biological Functions of Dietary Carotenoids. Annals of the New
York Academy of Sciences, 1993. 691(1): p. 61-67.
148. Ajila, C.M., S.G. Bhat, and U.J.S. Prasada Rao, Valuable components of raw and
ripe peels from two Indian mango varieties. Food Chemistry, 2007. 102(4): p.
1006-1011.
149. Berardini, N., 7-O-Methylcyanidin 3-O-beta-D-Galactopyranoside, a Novel
Anthocyanin from Mango (Mangifera indica L. cv.Tommy Atkins') Peels.
Zeitschrift für Naturforschung C. A journal of biosciences, 2005. 60(7).

69
150. Saleh, N.A.M. and M.A.I. El-Ansari, Polyphenolics of Twenty local variaties of
Mangifera Indica. Planta Med, 1975. 28(06): p. 124,130.
151. Sánchez, G.M., et al., Protective effects of Mangifera indica L. extract,
mangiferin and selected antioxidants against TPA-induced biomolecules
oxidation and peritoneal macrophage activation in mice. Pharmacological
Research, 2000. 42(6): p. 565-573.
152. El Ansari, M.A., et al., Polyphenols of Mangifera indica. Phytochemistry, 1971.
10(9): p. 2239-2241.
153. Wilkinson, A.S., et al., Effects of the Mango Components Mangiferin and
Quercetin and the Putative Mangiferin Metabolite Norathyriol on the
Transactivation of Peroxisome Proliferator-Activated Receptor Isoforms. Journal
of Agricultural and Food Chemistry, 2008. 56(9): p. 3037-3042.
154. Scalbert, A. and G. Williamson, Dietary Intake and Bioavailability of
Polyphenols. The Journal of Nutrition, 2000. 130(8): p. 2073S-2085S.
155. Lindberg Madsen, H. and G. Bertelsen, Spices as antioxidants. Trends in Food
Science & Technology, 1995. 6(8): p. 271-277.
156. Whitley, A.C., et al., Intestinal epithelial cell accumulation of the cancer
preventive polyphenol ellagic acid—extensive binding to protein and DNA.
Biochemical Pharmacology, 2003. 66(6): p. 907-915.
157. Kim, Y., A.J. Lounds-Singleton, and S.T. Talcott, Antioxidant phytochemical and
quality changes associated with hot water immersion treatment of mangoes
(Mangifera indica L.). Food Chemistry, 2009. 115(3): p. 989-993.
158. Núñez Sellés, A.J., et al., Isolation and Quantitative Analysis of Phenolic
Antioxidants, Free Sugars, and Polyols from Mango (Mangifera indica L.) Stem
Bark Aqueous Decoction Used in Cuba as a Nutritional Supplement. Journal of
Agricultural and Food Chemistry, 2002. 50(4): p. 762-766.
159. Schieber, A., W. Ullrich, and R. Carle, Characterization of polyphenols in mango
puree concentrate by HPLC with diode array and mass spectrometric detection.
Innovative Food Science & Emerging Technologies, 2000. 1(2): p. 161-166.
160. Abdalla, A.E.M., et al., Egyptian mango by-product 1. Compositional quality of
mango seed kernel. Food Chemistry, 2007. 103(4): p. 1134-1140.
161. Mercadante, A.Z., D.B. Rodriguez-Amaya, and G. Britton, HPLC and Mass
Spectrometric Analysis of Carotenoids from Mango. Journal of Agricultural and
Food Chemistry, 1997. 45(1): p. 120-123.
162. Palafox-Carlos, H., et al., Effect of ripeness stage of mango fruit (Mangifera
indica L., cv. Ataulfo) on physiological parameters and antioxidant activity.
Scientia Horticulturae, 2012. 135(0): p. 7-13.
163. Hymavathi, T.V. and V. Khader, Carotene, ascorbic acid and sugar content of
vacuum dehydrated ripe mango powders stored in flexible packaging material.
Journal of Food Composition and Analysis, 2005. 18(2–3): p. 181-192.
164. Rocha Ribeiro, S., et al., Antioxidant in Mango (<i>Mangifera indica L.)
Pulp. Plant Foods for Human Nutrition (Formerly Qualitas Plantarum), 2007.
62(1): p. 13-17.
165. Rocha Ribeiro, S.M., Characterization and evaluation of antioxidant potential of
mango (Mangifera indica L.) growing in Minas Gerais, 2006, Universidade
Federal de Viçosa: Brazil.

70
166. Pott, I., et al., Quantitative Determination of β-Carotene Stereoisomers in Fresh,
Dried, and Solar-Dried Mangoes (Mangifera indica L.). Journal of Agricultural
and Food Chemistry, 2003. 51(16): p. 4527-4531.
167. Perkins-Veazie, P., Carotenoids in Watermelon and Mango. Acta Horticulture,
2007: p. 259-264.
168. Manthey, J.A., Perkins-Veazie, P., Levels of B-Carotene, Ascorbic Acid, and
Total Phenols in the Pulp of Five Commercial Varieties of Mango (Man gifera
indica L.). Proc. Fla. State Hon. Soc, 2009(122 ): p. 303-307.
169. Masia, A., Superoxide dismutase and catalase activities in apple fruit during
ripening and post-harvest and with special reference to ethylene. Physiologia
Plantarum, 1998. 104(4): p. 668-672.
170. Gil, A.M., et al., Study of the Compositional Changes of Mango during Ripening
by Use of Nuclear Magnetic Resonance Spectroscopy. Journal of Agricultural and
Food Chemistry, 2000. 48(5): p. 1524-1536.
171. Randle, P.J., et al., The Glucose Fatty-Acid Cycle its Role in Insulin Sensitivity
and the Metabolic Disturbances of Diabetes Mellitus. The Lancet, 1963.
281(7285): p. 785-789.
172. Miura, T., et.al, The Suppressive Effect of Mangiferin with Exercise on Blood
Lipids in Type 2 Diabetes. Biological & pharmaceutical bulletin, 2001. 24(9): p.
1091.
173. Sellamuthu, P.S., et al., Antihyperglycemic Effect of Mangiferin in Streptozotocin
Induced Diabetic Rats. Journal of Health Science, 2009. 55(2): p. 206-214.
174. Mohamed, A.K. and A. Bierhaus, The role of oxidative stress and NF-...B
activation in late diabetic complications. Biofactors, 1999. 10(2/3): p. 157.
175. Donnini, D., et al., Glucose May Induce Cell Death through a Free Radical-
Mediated Mechanism. Biochemical and Biophysical Research Communications,
1996. 219(2): p. 412-417.
176. Prabhu, S., et al., Role of mangiferin on biochemical alterations and antioxidant
status in isoproterenol-induced myocardial infarction in rats. Journal of
Ethnopharmacology, 2006. 107(1): p. 126-133.
177. Brown, M.S. and J.L. Goldstein, A Receptor-Mediated Pathway for Cholesterol
Homeostasis. Science, 1986. 232(4746): p. 34-47.
178. Ishibashi, S., et al., Hypercholesterolemia in low density lipoprotein receptor
knockout mice and its reversal by adenovirus-mediated gene delivery. The Journal
of Clinical Investigation, 1993. 92(2): p. 883-893.
179. Pardo-Andreu, G.L., et al., Mangifera indica L. extract (Vimang®) and its main
polyphenol mangiferin prevent mitochondrial oxidative stress in atherosclerosis-
prone hypercholesterolemic mouse. Pharmacological Research, 2008. 57(5): p.
332-338.
180. McCall, M.R. and B. Frei, Can antioxidant vitamins materially reduce oxidative
damage in humans? Free Radical Biology and Medicine, 1999. 26(7–8): p. 1034-
1053.
181. Kroncke, et al., Inducible nitric oxide synthase in human diseases. Clinical &
Experimental Immunology, 1998. 113(2): p. 147-156.
182. Dubois, R.N., et al., Cyclooxygenase in biology and disease. The FASEB Journal,
1998. 12(12): p. 1063-1073.

71
183. Garrido, G., et al., Analgesic and anti-inflammatory effects of Mangifera indica L.
extract (Vimang). Phytotherapy Research, 2001. 15(1): p. 18-21.
184. Müller-Decker, K., et al., Differential expression of prostaglandin h synthase
isozymes during multistage carcinogenesis in mouse epidermis. Molecular
Carcinogenesis, 1995. 12(1): p. 31-41.
185. Cholbi, R., et.al, Inhibition of phospholipase A2 activities and some inflammatory
responses by the marine product ircinin. Naunyn-Schmiedeberg's archives of
pharmacology, 1996. 354(5): p. 677.
186. Reeves, P.G., Components of the AIN-93 Diets as Improvements in the AIN-76A
Diet. The Journal of Nutrition, 1997. 127(5): p. 838S-841S.
187. Molnar, J., et al., Diabetes Induces Endothelial Dysfunction but Does Not
Increase Neointimal Formation in High-Fat Diet Fed C57BL/6J Mice. Circulation
Research, 2005. 96(11): p. 1178-1184.
188. Manthey, J.A. and P. Perkins-Veazie, Influences of Harvest Date and Location on
the Levels of β-Carotene, Ascorbic Acid, Total Phenols, the in Vitro Antioxidant
Capacity, and Phenolic Profiles of Five Commercial Varieties of Mango
(Mangifera indica L.). Journal of Agricultural and Food Chemistry, 2009. 57(22):
p. 10825-10830.
189. Yavuz, D.G., et al., Angiotension converting enzyme inhibition and calcium
channel blockage improves cyclosporine induced glucose intolerance in rats.
Transplantation Proceedings, 2004. 36(1): p. 171-174.
190. Folch, J., M. Lees, and G.H.S. Stanley, A Simple Method for the Isolation and
Purification of Total Lipids from Animal Tissues. Journal of Biological
Chemistry, 1957. 226(1): p. 497-509.
191. Sharma, S.R., S.K. Dwivedi, and D. Swarup, Hypoglycaemic Potential of
Mangifera indica Leaves in Rats. Pharmaceutical Biology, 1997. 35(2): p. 130-
133.
192. Aderibigbe, A.O., T.S. Emudianughe, and B.A.S. Lawal, Evaluation of the
antidiabetic action of Mangifera indica in mice. Phytotherapy Research, 2001.
15(5): p. 456-458.
193. Aderibigbe, A.O., T.S. Emudianughe, and B.A.S. Lawal, Antihyperglycaemic
effect of Mangifera indica in rat. Phytotherapy Research, 1999. 13(6): p. 504-507.
194. Perpétuo, G.F. and J.M. Salgado, Effect of mango (<i>Mangifera indica ,
L.) ingestion on blood glucose levels of normal and diabetic rats. Plant Foods for
Human Nutrition (Formerly Qualitas Plantarum), 2003. 58(3): p. 1-12.
195. Ojewole, J.e.a., Anti-inflammatory, analgesic and hypoglycaemic effects of
Mangifera indica Linn. (Anacardiaceae) stem-bark aqueous extract. Methods and
findings in experimental and clinical pharmacology, 2005. 27(8): p. 547.
196. Yoshikawa, M., et al., Salacia reticulata and Its Polyphenolic Constituents with
Lipase Inhibitory and Lipolytic Activities Have Mild Antiobesity Effects in Rats.
The Journal of Nutrition, 2002. 132(7): p. 1819-1824.
197. Lucas, E.A., et.al, Mango modulates body fat and plasma glucose and lipids in
mice fed a high-fat diet. British journal of nutrition, 2011. 106(10): p. 1495.
198. Surwit, R.S., et.al, Low plasma leptin in response to dietary fat in diabetes- and
obesity-prone mice. Diabetes (New York, N.Y.), 1997. 46(9): p. 1516.
199. Surwit, R.S., et al., Diet-induced type II diabetes in C57BL/6J mice. Diabetes,
72
1988. 37(9): p. 1163-1167.
200. Black, B.L., et al., Differential effects of fat and sucrose on body composition in
AJ and C57BL/6 mice. Metabolism, 1998. 47(11): p. 1354-1359.
201. Murase, T., et al., Dietary diacylglycerol suppresses high fat and high sucrose
diet-induced body fat accumulation in C57BL/6J mice. Journal of Lipid Research,
2001. 42(3): p. 372-378.
202. Hernandez, P., et al., Protective effect of Mangifera indica L. polyphenols on
human T lymphocytes against activation-induced cell death. Pharmacological
Research, 2007. 55(2): p. 167-173.
203. Böhm, F., et al., β-Carotene with vitamins E and C offers synergistic cell
protection against NOx. FEBS Letters, 1998. 436(3): p. 387-389.
204. Stefanovich, A.F. and M. Karel, Kinetics of Beta-Carotene Degradation at
Temperatures Typical of Air Drying of Foods. Journal of Food Processing and
Preservation, 1982. 6(4): p. 227-242.
205. Kirk, J., et al., Degradation of Ascorbic Acid in a Dehydrated Food System.
Journal of Food Science, 1977. 42(5): p. 1274-1279.
206. Godoy, H.T., Rodriguez-Amaya, D.B., Carotenoid composition of commercial
mangoes from Brazil. Food science & technology, 1989. 22(3): p. 100.
VITA
CHEEYEN LAU
Candidate for the Degree of
Master of Science
Thesis: EFFECTS OF MANGIFERIN IN IMPROVING METABOLIC SYNDROME
RISK FACTORS IN MICE FED HIGH FAT DIET
Major Field: Nutritional Science
Biographical:
Education:
Completed the requirements for the Master of Science in nutritional science at
Oklahoma State University, Stillwater, Oklahoma in May, 2012.
Completed the requirements for the Bachelor of Science in Medical Bioscience
at Monash University, Sunway City, Malaysia in 2009.
Experience:
Graduate assistant, Oklahoma State University, Division of Engineering
Technology, 2010-2012.
Graduate research assistant, Oklahoma State University, Nutritional Sciences
Department, 2010-2012.

ADVISER’S APPROVAL: Dr. Edralin A. Lucas
Name: CHEEYEN LAU Date of Degree: May, 2012
Institution: Oklahoma State University Location: Stillwater, Oklahoma
Title of Study: EFFECTS OF MANGIFERIN IN IMPROVING METABOLIC
SYNDROME RISK FACTORS IN MICE FED HIGH FAT DIET
Pages in Study: 72 Candidate for the Degree of Master of Science
Major Field: Nutritional Science
Scope and Method of Study: This study compared the effects of freeze-dried mango pulp,
mangiferin, and rosiglitazone (a glucose-lowering drug) on ameliorating risk
factors associated with metabolic syndrome (MetS) in mice fed high fat (HF) diet.
Two-month old male C57BL/6 mice were randomly assigned to one of the dietary
treatment groups (n=8/group) for 60 days: AIN-control (10 % fat calories), HF
(60 % fat calories), HF+1 % (w/w) freeze dried mango, HF + mangiferin (0.044
mg/kg diet), and HF + rosiglitazone (50 mg/kg diet). Whole body composition,
glucose tolerance test (GTT), clinical chemistry, and liver and adipose tissue
histology were assessed.
Findings and Conclusions: Mangiferin did not modulate body composition, glucose and
lipid parameters compared to mango and rosiglitazone in mice fed HF diet.
Mango pulp showed more positive effects compared to mangiferin in modulating
body composition and blood lipids. Our findings suggest that mangiferin is not a
key contributor to the beneficial effects of mango pulp in modulating MetS risk
factors. Furthermore, our findings demonstrate the importance of synergistic
interactions of the bioactive compounds in mango pulp.