Chase Corporation Annual Report 2013 · (the last business day of the registrant’s second quarter...
78
Chase Corporation Annual Report 2013
Transcript of Chase Corporation Annual Report 2013 · (the last business day of the registrant’s second quarter...

Chase Corporation Annual Report 2 0 1 3

Peter R. Chase Chairman and Chief Executive Officer
Adam P. Chase President and Chief Operating Officer
FY 2013 was a year of positive activity on many fronts including
revenue and profit, new products, R&D, consolidation, and integration
of facilities and IT systems. The management organization continues to
gain momentum as we expand our presence domestically and abroad.
On the financial front we had a substantial boost in revenues and
income primarily from the NEPTCO acquisition. Revenues increased
45% to $216 million and net income rose 84% to over $17 million.
On December 4th we were pleased to pay a cash dividend of $0.45
per share, up from $0.40 in 2012.
Confidence in Chase Corporation was also reflected in an increased share price and market capitalization as we are experiencing
improved visibility and stock activity. Overall trading volume of Chase stock has been modest by market standards, but at the
same time indicates shareholder confidence for the long term.
Our progress this year and success over many years can be traced to the quality of our people. It is our human resources that
make everything else happen. We are proud to be associated with this team and grateful for their support.
HIGHLIGHTS
An improving global economy and stabilization of commodity markets contributed to solid results from both reporting segments.
Industrial materials results were driven primarily by electronic coatings’ performance complementing the first full fiscal year of
NEPTCO contribution. Recovery in project-related demand led to improvement in the construction materials segment.
On the business development front we are very pleased that advances are resulting not only from an increased commitment
to R&D, but also through its lock-step partnership with marketing and sales. A key driver for all of this is ongoing operational
consolidation, which is generating many of the efficiencies that support new initiatives.
HumiSeal® is introducing its next generation platform of UV conformal coatings. This long-term R&D investment is producing high
reliability products that are more environmentally friendly and process faster for global industries such as automotive that value
high overall performance and application efficiency.
HumiSeal continued its investment in manufacturing operations in the UK and US and as part of its global expansion has
launched new packaging to bring further brand consistency around the world.
Paper Tyger®, our advanced laminated papers that are water and tear resistant continue to gain market awareness and market
share among major users.
The integration of NEPTCO is proceeding very smoothly and our company-wide deployment of enterprise resource planning
(ERP) should be completed by the end of calendar 2014.
While we did not complete any acquisitions in the fiscal year, serious discussions were held with a number of prospects. As we
continue to refine our overall strategic objectives, it is important to keep our acquisition target criteria in alignment. This means
a sharper focus and increased selectivity in a competitive environment. We plan to work hard to make this program successful.
LOOKING AHEAD
We expect continued improvement in our key markets in fiscal 2014 but are always prepared for the exigencies of a global economy.
As we move into a new fiscal year we do so with excitement and a momentum that is built upon a long-standing strategic focus
and the support of you our shareholders.
President &Chief Operating Officer
Adam P. Chase
Peter R. ChaseChairman &
Chief Executive Officer
UNITED STATESSECURITIES AND EXCHANGE COMMISSION
Washington, D.C. 20549
FORM 10-KANNUAL REPORT PURSUANT TO SECTION 13 OR 15 (d)
OF THE SECURITIES EXCHANGE ACT OF 1934For the fiscal year ended August 31, 2013
Commission File Number: 1-9852
CHASE CORPORATION(Exact name of registrant as specified in its charter)
Massachusetts 11-1797126(State or other jurisdiction of incorporation of organization) (I.R.S. Employer Identification No.)
26 Summer Street, Bridgewater, Massachusetts 02324(Address of Principal Executive Offices, Including Zip Code)
(508) 819-4200(Registrant’s Telephone Number, Including Area Code)
Securities registered pursuant to section 12(b) of the Act:Title of Each Class: Name of Each Exchange on Which Registered
Common Stock NYSE MKT($0.10 Par Value)
Securities registered pursuant to section 12(g) of the Act: None
Indicate by check mark if the registrant is a well-known seasoned issuer (as defined in Rule 405 of the SecuritiesAct). YES � NO �
Indicate by check mark if the registrant is not required to file reports pursuant to Section 13 or Section 15(d) of theExchange Act. YES � NO �
Indicate by check mark whether the registrant (1) has filed all reports required to be filed by Section 13 or 15(d) ofthe Securities Exchange Act of 1934 during the preceding 12 months, and (2) has been subject to such filingrequirements for the past 90 days. YES � NO �
Indicate by check mark whether the registrant has submitted electronically and posted on its corporate Web site, ifany, every Interactive Data File required to be submitted and posted pursuant to Rule 405 of Regulation S-T (§232.405 ofthis chapter) during the preceding 12 months (or for such shorter period that the registrant was required to submit andpost such files). YES � NO �
Indicate by check mark if disclosure of delinquent filers pursuant to Item 405 of Regulation S-K is not containedherein, and will not be contained, to the best of registrant’s knowledge, in definitive proxy or information statementsincorporated by reference in Part III of this Form 10-K or any amendment to this Form 10-K. �
Indicate by checkmark whether the registrant is a large accelerated filer, an accelerated filer, a non-accelerated fileror a smaller reporting company. See the definitions of ‘‘large accelerated filer’’, ‘‘accelerated filer’’ and ‘‘smaller reportingcompany’’ in Rule 12b-2 of the Exchange Act.
Large accelerated filer � Accelerated filer � Non-accelerated filer � Smaller reporting company �(Do not check if a smaller
reporting company)
Indicate by checkmark whether the registrant is a shell company (as defined in Rule 12b-2 of the ExchangeAct). YES � NO �
The aggregate market value of the common stock held by non-affiliates of the registrant, as of February 28, 2013(the last business day of the registrant’s second quarter of fiscal 2013), was approximately $124,936,000.
As of October 31, 2013, the Company had outstanding 9,083,007 shares of common stock, $.10 par value, whichis its only class of common stock.
Documents Incorporated By Reference:
Portions of the registrant’s definitive proxy statement for the Annual Meeting of Shareholders, which is expected to befiled within 120 days after the registrant’s fiscal year ended August 31, 2013, are incorporated by reference into Part IIIhereof.

CHASE CORPORATION
INDEX TO ANNUAL REPORT ON FORM 10-K
For the Year Ended August 31, 2013
PageNo.
PART IItem 1 Business . . . . . . . . . . . . . . . . . . . . . . . . . . . . . . . . . . . . . . . . . . . . . . . . . . . . . . . . . . . 2Item 1A Risk Factors . . . . . . . . . . . . . . . . . . . . . . . . . . . . . . . . . . . . . . . . . . . . . . . . . . . . . . . . . 7Item 1B Unresolved Staff Comments . . . . . . . . . . . . . . . . . . . . . . . . . . . . . . . . . . . . . . . . . . . . . . 10Item 2 Properties . . . . . . . . . . . . . . . . . . . . . . . . . . . . . . . . . . . . . . . . . . . . . . . . . . . . . . . . . . 11Item 3 Legal Proceedings . . . . . . . . . . . . . . . . . . . . . . . . . . . . . . . . . . . . . . . . . . . . . . . . . . . . . 12Item 4 Mine Safety Disclosures . . . . . . . . . . . . . . . . . . . . . . . . . . . . . . . . . . . . . . . . . . . . . . . . . 12Item 4A Executive Officers of the Registrant . . . . . . . . . . . . . . . . . . . . . . . . . . . . . . . . . . . . . . . . . 12
PART IIItem 5 Market for the Registrant’s Common Equity, Related Stockholder Matters and Issuer Purchases
of Equity Securities . . . . . . . . . . . . . . . . . . . . . . . . . . . . . . . . . . . . . . . . . . . . . . . . . . 13Item 6 Selected Financial Data . . . . . . . . . . . . . . . . . . . . . . . . . . . . . . . . . . . . . . . . . . . . . . . . . 14Item 7 Management’s Discussion and Analysis of Financial Condition and Results of Operations . . . . . . 15Item 7A Quantitative and Qualitative Disclosures About Market Risk . . . . . . . . . . . . . . . . . . . . . . . . . . 27Item 8 Financial Statements and Supplementary Data . . . . . . . . . . . . . . . . . . . . . . . . . . . . . . . . . . 28Item 9 Changes in and Disagreements with Accountants on Accounting and Financial Disclosure . . . . . . 67Item 9A Controls and Procedures . . . . . . . . . . . . . . . . . . . . . . . . . . . . . . . . . . . . . . . . . . . . . . . . 67Item 9B Other Information . . . . . . . . . . . . . . . . . . . . . . . . . . . . . . . . . . . . . . . . . . . . . . . . . . . . . 67
PART IIIItem 10 Directors, Executive Officers and Corporate Governance . . . . . . . . . . . . . . . . . . . . . . . . . . . . 68Item 11 Executive Compensation . . . . . . . . . . . . . . . . . . . . . . . . . . . . . . . . . . . . . . . . . . . . . . . . . 68Item 12 Security Ownership of Certain Beneficial Owners and Management and Related Stockholder
Matters . . . . . . . . . . . . . . . . . . . . . . . . . . . . . . . . . . . . . . . . . . . . . . . . . . . . . . . . . . 68Item 13 Certain Relationships and Related Transactions, and Director Independence . . . . . . . . . . . . . . . 68Item 14 Principal Accountant Fees and Services . . . . . . . . . . . . . . . . . . . . . . . . . . . . . . . . . . . . . . . 68
PART IVItem 15 Exhibits and Financial Statement Schedules . . . . . . . . . . . . . . . . . . . . . . . . . . . . . . . . . . . . 69
SIGNATURES . . . . . . . . . . . . . . . . . . . . . . . . . . . . . . . . . . . . . . . . . . . . . . . . . . . . . . . . . . . . . . . . 72
1
PART I
ITEM 1—BUSINESS
Primary Operating Divisions and Facilities and Industry Segment
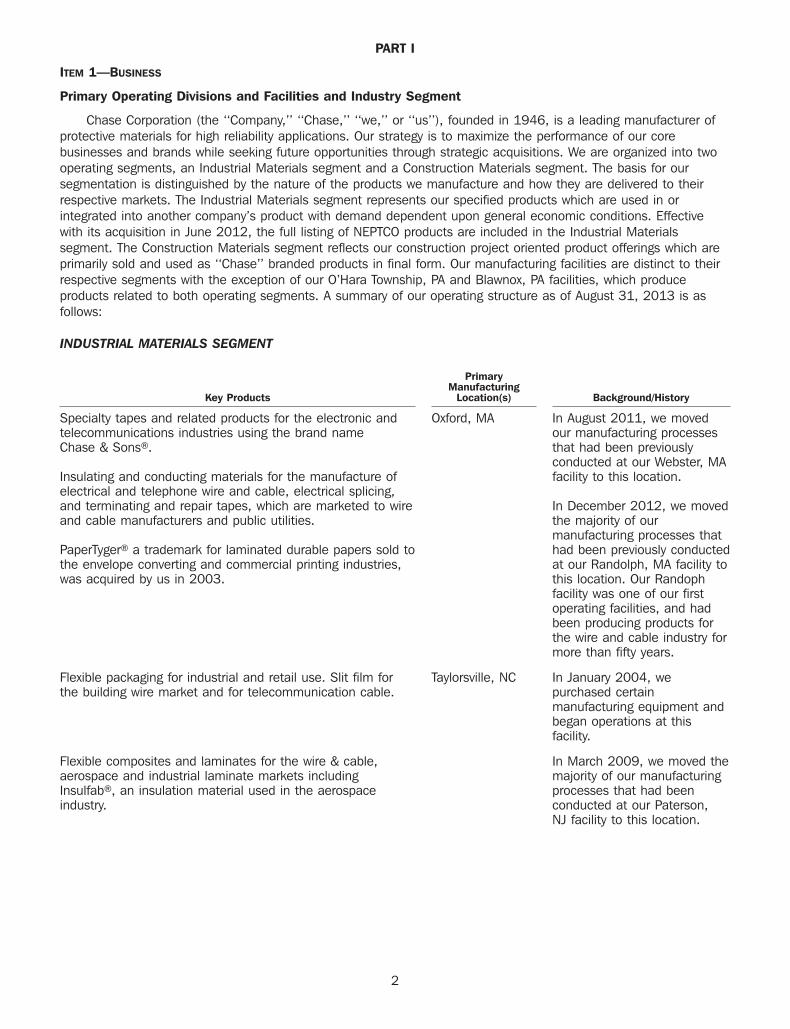
Chase Corporation (the ‘‘Company,’’ ‘‘Chase,’’ ‘‘we,’’ or ‘‘us’’), founded in 1946, is a leading manufacturer ofprotective materials for high reliability applications. Our strategy is to maximize the performance of our corebusinesses and brands while seeking future opportunities through strategic acquisitions. We are organized into twooperating segments, an Industrial Materials segment and a Construction Materials segment. The basis for oursegmentation is distinguished by the nature of the products we manufacture and how they are delivered to theirrespective markets. The Industrial Materials segment represents our specified products which are used in orintegrated into another company’s product with demand dependent upon general economic conditions. Effectivewith its acquisition in June 2012, the full listing of NEPTCO products are included in the Industrial Materialssegment. The Construction Materials segment reflects our construction project oriented product offerings which areprimarily sold and used as ‘‘Chase’’ branded products in final form. Our manufacturing facilities are distinct to theirrespective segments with the exception of our O’Hara Township, PA and Blawnox, PA facilities, which produceproducts related to both operating segments. A summary of our operating structure as of August 31, 2013 is asfollows:
INDUSTRIAL MATERIALS SEGMENT
PrimaryManufacturing
Key Products Location(s) Background/History
Specialty tapes and related products for the electronic and Oxford, MA In August 2011, we movedtelecommunications industries using the brand name our manufacturing processesChase & Sons�. that had been previously
conducted at our Webster, MAInsulating and conducting materials for the manufacture of facility to this location.electrical and telephone wire and cable, electrical splicing,and terminating and repair tapes, which are marketed to wire In December 2012, we movedand cable manufacturers and public utilities. the majority of our
manufacturing processes thatPaperTyger� a trademark for laminated durable papers sold to had been previously conductedthe envelope converting and commercial printing industries, at our Randolph, MA facility towas acquired by us in 2003. this location. Our Randoph
facility was one of our firstoperating facilities, and hadbeen producing products forthe wire and cable industry formore than fifty years.
Flexible packaging for industrial and retail use. Slit film for Taylorsville, NC In January 2004, wethe building wire market and for telecommunication cable. purchased certain
manufacturing equipment andbegan operations at thisfacility.
Flexible composites and laminates for the wire & cable, In March 2009, we moved theaerospace and industrial laminate markets including majority of our manufacturingInsulfab�, an insulation material used in the aerospace processes that had beenindustry. conducted at our Paterson,
NJ facility to this location.
2

PrimaryManufacturing
Key Products Location(s) Background/History
Chase BLH2OCK�, a water blocking compound sold to the Blawnox, PA In September 2012, wewire and cable industry. moved our manufacturing
processes of ChaseBLH2OCK� that had beenpreviously conducted at ourRandolph, MA facility to thislocation.
Protective conformal coatings under the brand name O’Hara Township, The HumiSeal business andHumiSeal�, moisture protective electronic coatings sold to PA product lines were acquired inthe electronics industry. the early 1970’s.
Laminated film foils for the electronics and cable industries Pawtucket, RI & In June 2012, we acquired alland cover tapes essential to delivering semiconductor Lenoir, NC of the capital stock of NEPTCOcomponents via tape and reel packaging. Incorporated.
Pulling and detection tapes used in the installation, Granite Falls, NCmeasurement and location of fiber optic cables, water andnatural gas lines.
Flexible, rigid and semi-rigid fiber optic strength elementsdesigned to allow fiber optic cables to withstand mechanicaland environmental strain and stress, produced by NEPTCO’sjoint venture.
Cover tapes essential to delivering semiconductor Suzhou, Chinacomponents via tape and reel packaging.
Protective conformal coatings under the brand name Winnersh, In October 2005, we acquiredHumiSeal�, moisture protective electronic coatings sold to Wokingham, all of the capital stock ofthe electronics industry. England Concoat Holdings Ltd. and its
subsidiaries. In 2006 Concoatwas renamed HumiSealEurope.
HumiSeal Europe SARL operates a sales/technical service In March 2007, we expandedoffice and warehouse near Paris. This business works closely our international presence withwith the HumiSeal operation in Winnersh, Wokingham, the formation of HumiSealEngland allowing direct sales and service to the French Europe SARL in France. Inmarket. conjunction with establishing
the new company, certainassets were acquired fromMetronelec SARL, a formerdistributor of HumiSealproducts.
3
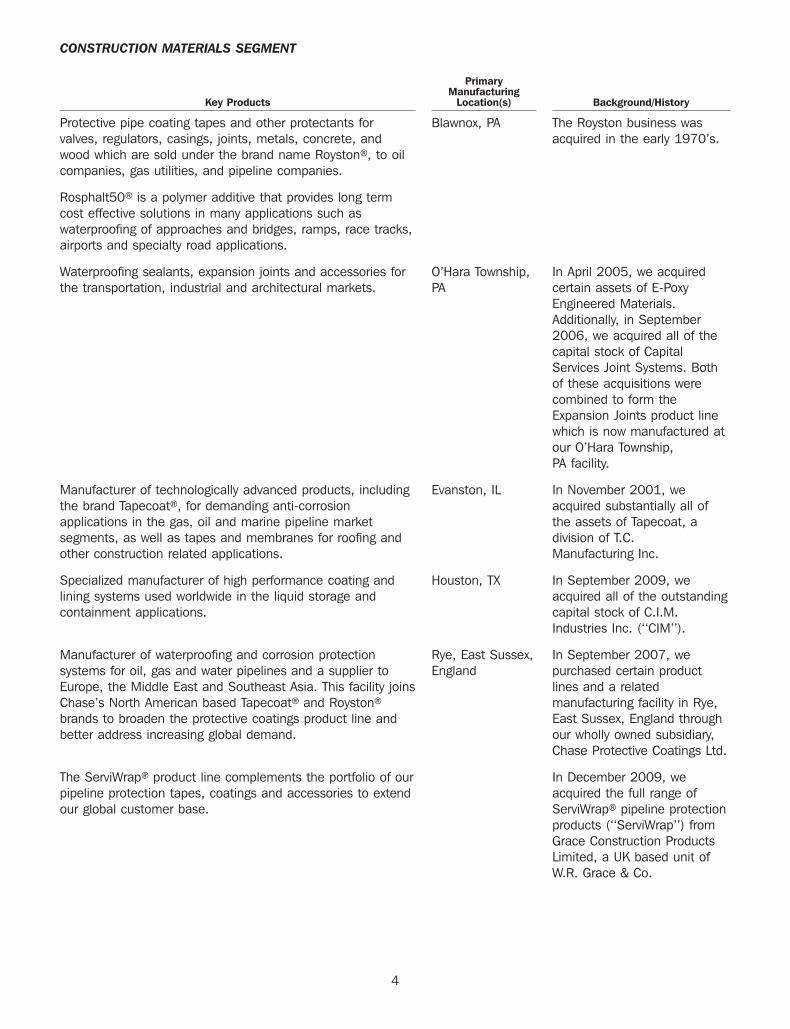
CONSTRUCTION MATERIALS SEGMENT
PrimaryManufacturing
Key Products Location(s) Background/History
Protective pipe coating tapes and other protectants for Blawnox, PA The Royston business wasvalves, regulators, casings, joints, metals, concrete, and acquired in the early 1970’s.wood which are sold under the brand name Royston�, to oilcompanies, gas utilities, and pipeline companies.
Rosphalt50� is a polymer additive that provides long termcost effective solutions in many applications such aswaterproofing of approaches and bridges, ramps, race tracks,airports and specialty road applications.
Waterproofing sealants, expansion joints and accessories for O’Hara Township, In April 2005, we acquiredthe transportation, industrial and architectural markets. PA certain assets of E-Poxy
Engineered Materials.Additionally, in September2006, we acquired all of thecapital stock of CapitalServices Joint Systems. Bothof these acquisitions werecombined to form theExpansion Joints product linewhich is now manufactured atour O’Hara Township,PA facility.
Manufacturer of technologically advanced products, including Evanston, IL In November 2001, wethe brand Tapecoat�, for demanding anti-corrosion acquired substantially all ofapplications in the gas, oil and marine pipeline market the assets of Tapecoat, asegments, as well as tapes and membranes for roofing and division of T.C.other construction related applications. Manufacturing Inc.
Specialized manufacturer of high performance coating and Houston, TX In September 2009, welining systems used worldwide in the liquid storage and acquired all of the outstandingcontainment applications. capital stock of C.I.M.
Industries Inc. (‘‘CIM’’).
Manufacturer of waterproofing and corrosion protection Rye, East Sussex, In September 2007, wesystems for oil, gas and water pipelines and a supplier to England purchased certain productEurope, the Middle East and Southeast Asia. This facility joins lines and a relatedChase’s North American based Tapecoat� and Royston� manufacturing facility in Rye,brands to broaden the protective coatings product line and East Sussex, England throughbetter address increasing global demand. our wholly owned subsidiary,
Chase Protective Coatings Ltd.
The ServiWrap� product line complements the portfolio of our In December 2009, wepipeline protection tapes, coatings and accessories to extend acquired the full range ofour global customer base. ServiWrap� pipeline protection
products (‘‘ServiWrap’’) fromGrace Construction ProductsLimited, a UK based unit ofW.R. Grace & Co.
4

Other Business Developments
In October 2013, we sold all of our property and assets comprising the Insulfab� product line to an unrelatedthird party for $7,394,000, subject to certain closing adjustments including any change in the final closing net bookvalue compared to the bid date net book value. The assets sold include inventory, equipment and all intellectualproperty used in this product line. The Insulfab product line includes the manufacturing of high quality, engineeredbarrier laminates used in various aerospace applications. This product line was originally acquired by ChaseCorporation in February 2003 as part of the Company’s acquisition of certain assets of Facile, Inc. and was part ofour Industrial Materials segment. We determined it was the right time for us to divest the assets of the Insulfabproduct line and allow us to remain focused on other primary markets.
Products and Markets
Our principal products are specialty tapes, laminates, sealants and coatings that are sold by our salespeople,manufacturers’ representatives and distributors. In our Industrial Materials segment, these products consist of:
(i) insulating and conducting materials for the manufacture of electrical and telephone wire and cable,electrical splicing, and terminating and repair tapes, which are marketed to wire and cable manufacturers;
(ii) laminated film foils, composite strength elements, anti-static packaging tape and pulling tapes for theelectronics and cable industries;
(iii) moisture protective coatings, which are sold to the electronics industry including circuitry used inautomobiles and home appliances;
(iv) laminated durable papers, including laminated paper with an inner security barrier used in personal andmail-stream privacy protection, which are sold primarily to the envelope converting and commercial printingindustries;
(v) pulling and detection tapes used in the installation, measurement and location of fiber optic cables, waterand natural gas lines, and power, data, and video cables for commercial buildings;
(vi) cover tapes with reliable adhesive and anti-static properties essential to delivering semiconductorcomponents via tape and reel packaging; and
(vii) flexible, rigid and semi-rigid fiber optic strength elements designed to allow fiber optic cables to withstandmechanical and environmental strain and stress, produced by NEPTCO’s joint venture.
In our Construction Materials segment, these products consist of:
(i) protective pipe coating tapes and other protectants for valves, regulators, casings, joints, metals, concreteand wood, which are sold to oil companies, gas utilities and pipeline companies;
(ii) protectants for highway bridge deck metal supported surfaces, which are sold to municipal transportationauthorities;
(iii) fluid applied coating and lining systems for use in the water and wastewater industry; and
(iv) expansion and control joint systems designed for roads, bridges, stadiums and airport runways.
There is some seasonality in selling products into the construction market as higher demand is oftenexperienced when temperatures are warmer in most of North America (April through October) with less demandoccurring when temperatures are colder (typically our second fiscal quarter). We did not introduce any new productsrequiring an investment of a material amount of our assets during fiscal year 2013.
Employees
As of October 31, 2013, we employed approximately 666 people (including union employees). We consider ouremployee relations to be good. In the U.S., we offer our employees a wide array of company-paid benefits, whichwe believe are competitive relative to others in our industry. In our operations outside the U.S., we offer benefitsthat may vary from those offered to our U.S. employees due to customary local practices and statutoryrequirements.
5
Backlog, Customers and Competition
As of October 31, 2013, the backlog of customer orders believed to be firm was approximately $16,546,000.This compared with a backlog of $13,722,000 as of October 31, 2012. The increase in backlog over the prior yearamount is primarily due to certain infrastructure project work in the Middle East which is driving increased demandfor our pipeline products produced in the UK. The backlog of orders has some seasonality due to the constructionseason. During fiscal 2013, 2012 and 2011, no customer accounted for more than 10% of sales. No materialportion of our business is subject to renegotiation or termination of profits or contracts at the election of the UnitedStates Federal Government.
There are other companies that manufacture or sell products and services similar to those made and sold byus. Many of those companies are larger and have greater financial resources than we have. We compete principallyon the basis of technical performance, service reliability, quality and price.
Raw Materials
We obtain raw materials from a wide variety of suppliers with alternative sources of most essential materialsavailable within reasonable lead times.
Patents, Trademarks, Licenses, Franchises and Concessions
We own the following trademarks that we believe are of material importance to our business: ChaseCorporation�, C-Spray (Logo), a trademark used in conjunction with most of the Company’s business segment andproduct line marketing material and communications; HumiSeal�, a trademark for moisture protective coatings soldto the electronics industry; Chase & Sons�, a trademark for barrier and insulating tapes sold to the wire and cableindustry; Chase BLH2OCK�, a trademark for a water blocking compound sold to the wire and cable industry;Rosphalt50�, a trademark for an asphalt additive used predominantly on bridge decks for waterproofing protection;PaperTyger�, a trademark for laminated durable papers sold to the envelope converting and commercial printingindustries; Tapecoat�, a trademark for corrosion preventative surface coatings and primers; Maflowrap�, a trademarkfor anti-corrosive tapes incorporating self-adhesive mastic or rubber backed strips, made of plastic materials;Royston�, a trademark for corrosion inhibiting coating composition for use on pipes; Eva-Pox� and Ceva�,trademarks for epoxy pastes/gels/mortars and elastomeric concrete used in the construction industry; CIM�trademarks for fluid applied coating and lining systems used in the water and wastewater industry; ServiWrap�trademarks for pipeline protection tapes, coatings and accessories; NEPTCO�, a trademark used in conjunction withmost of NEPTCO’s business and product line marketing material and communications; NEPTAPE�, a trademark forcoated shielding and insulation materials used in the wire and cable industry; Muletape�, a trademark for pullingand installation tapes sold to the telecommunications industry; and Tracesafe�, a trademark for detection tapes soldto the water and gas industry. Additionally, Insulfab�, a trademark for insulation material used in the aerospaceindustry, was included as part of the sale of the Company’s Insulfab product line that was completed in October2013. We do not have any other material trademarks, licenses, franchises, or concessions. While we do holdvarious patents, at this time, we do not believe that they are material to the success of our business.
Working Capital
We fund our business operations through a combination of available cash and cash equivalents, short-terminvestments and cash flows generated from operations. In addition, our revolving credit facility is available foradditional working capital needs or investment opportunities. We have historically funded acquisitions throughadditional borrowings and term loans from our bank lenders.
Research and Development
Approximately $3,395,000, $2,958,000 and $2,452,000 was spent for Company-sponsored research anddevelopment during fiscal 2013, 2012 and 2011, respectively. Research and development increased in both fiscal2013 and 2012 primarily due to our continued product development efforts that are directed towards seizing newbusiness opportunities for our established product lines.
6
Available Information
Chase maintains a website at http://www.chasecorp.com. Our annual reports on Form 10-K, quarterly reportson Form 10-Q, current reports on Form 8-K and amendments to such reports filed or furnished pursuant tosection 13(a) or 15(d) of the Securities Exchange Act of 1934, as well as section 16 reports on Form 3, 4, or 5,are available free of charge on this site as soon as is reasonably practicable after they are filed or furnished with theSEC. Our Code of Conduct and Ethics and the charters for the Audit Committee, the Nominating and GovernanceCommittee and the Compensation and Management Development Committee of our Board of Directors are alsoavailable on our Internet site. The Code of Conduct and Ethics and charters are also available in print to anyshareholder upon request. Requests for such documents should be directed to Paula Myers, Shareholder andInvestor Relations Department, at 26 Summer Street, Bridgewater, Massachusetts 02324. Our Internet site and theinformation contained on it or connected to it are not part of or incorporated by reference into this Form 10-K. Ourfilings with the SEC are also available on the SEC’s website at http://www.sec.gov.
Financial Information About Segment and Geographic Areas
Please see Notes 11 and 12 to the Company’s Consolidated Financial Statements for financial informationabout the Company’s operating segments and domestic and foreign operations for each of the last three fiscalyears.
ITEM 1A—RISK FACTORS
The following risk factors should be read carefully in connection with evaluating our business and the forward-looking information contained in this Annual Report on Form 10-K. We feel that any of the following risks couldmaterially adversely affect our business, operations, industry, financial position or our future financial performance.While we believe that we have identified and discussed below the key risk factors affecting our business, there maybe additional risks and uncertainties that are not presently known or that are not currently believed to be significantthat may adversely affect our business, operations, industry, financial position and financial performance in thefuture.
We currently operate in mature markets where increases or decreases in market share could besignificant.
Our sales and net income are largely dependent on sales from a consistent and well established customerbase. Organic growth opportunities are minimal; however, we have used and will continue to use strategicacquisitions as a means to build and grow the business. In this business environment, increases or decreases inmarket share could have a material effect on our business condition or results of operation. We face intensecompetition from a diverse range of competitors, including operating divisions of companies much larger and withfar greater resources than we have. If we are unable to maintain our market share, our business could suffer.
Our business strategy includes the pursuit of strategic acquisitions, which may not be successful if theyhappen at all.
From time to time, we engage in discussions with potential target companies concerning potential acquisitions.In executing our acquisition strategy, we may be unable to identify suitable acquisition candidates. In addition, wemay face competition from other companies for acquisition candidates, making it more difficult to acquire suitablecompanies on favorable terms.
Even if we do identify a suitable acquisition target and are able to negotiate and close a transaction, theintegration of an acquired business into our operations involves numerous risks, including potential difficulties inintegrating an acquired company’s product line with ours; the diversion of our resources and management’sattention from other business concerns; the potential loss of key employees; limitations imposed by antitrust ormerger control laws in the United States or other jurisdictions; risks associated with entering a new geographical orproduct market; and the day-to-day management of a larger and more diverse combined company. In June 2012,for example, we completed the acquisition of NEPTCO Incorporated, which represented approximately 39% of ourconsolidated total assets as of the end of fiscal 2012, making it the largest acquisition in the Company’s history.
7
We may not realize the synergies, operating efficiencies, market position or revenue growth we anticipate fromacquisitions and our failure to effectively manage the above risks could have a material adverse effect on ourbusiness, growth prospects and financial performance.
Our results of operations could be adversely affected by uncertain economic and political conditions andthe effects of these conditions on our customers’ businesses and levels of business activity.
Global economic and political conditions can affect the businesses of our customers and the markets theyserve. A severe or prolonged economic downturn or a negative or uncertain political climate could adversely affectthe levels of business activity of our customers and the industries they serve, including the automotive, housing,construction, pipeline, energy, transportation infrastructure and electronics industries. This may reduce demand forour products or depress pricing of those products, either of which may have a material adverse effect on our resultsof operations. Changes in global economic conditions could also shift demand to products for which we do not havecompetitive advantages, and this could negatively affect the amount of business that we are able to obtain. Inaddition, if we are unable to successfully anticipate changing economic and political conditions, we may be unableto effectively plan for and respond to those changes and our business could be negatively affected.
General economic factors, domestically and internationally, may also adversely affect our financialperformance through increased raw material costs or other expenses and by making access to capitalmore difficult.
The cumulative effect of higher interest rates, energy costs, inflation, levels of unemployment, healthcare costs,unsettled financial markets, and other economic factors could adversely affect our financial condition by increasingour manufacturing costs and other expenses at the same time that our customers may be scaling back demand forour products. Prices of certain commodity products, including oil and petroleum-based products, are historicallyvolatile and are subject to fluctuations arising from changes in domestic and international supply and demand, laborcosts, competition, weather events, market speculation, government regulations and periodic delays in delivery.Rapid and significant changes in commodity prices may affect our sales and profit margins. These factors canincrease our merchandise costs and/or selling, general and administrative expenses, and otherwise adversely affectour operating results. Recent turmoil in the credit markets may limit our ability to access debt capital for use inacquisitions or other purposes on advantageous terms or at all. If we are unable to manage our expenses inresponse to general economic conditions and margin pressures, or if we are unable to obtain capital for strategicacquisitions or other needs, then our results of operations would be negatively affected.
Fluctuations in the supply and prices of raw materials may negatively impact our financial results.
We obtain raw materials needed to manufacture our products from a number of suppliers. Many of these rawmaterials are petroleum-based derivatives. Under normal market conditions, these materials are generally availableon the open market and from a variety of producers. From time to time, however, the prices and availability of theseraw materials fluctuate, which could impair our ability to procure necessary materials, or increase the cost ofmanufacturing our products. If the prices of raw materials increase, and we are unable to pass these increases onto our customers, we could experience reduced profit margins.
If our products fail to perform as expected, or if we experience product recalls, we could incur significantand unexpected costs and lose existing and future business.
Our products are complex and could have defects or errors presently unknown to us, which may give rise toclaims against us, diminish our brands or divert our resources from other purposes. Despite testing, new andexisting products could contain defects and errors and may in the future contain manufacturing or design defects,errors or performance problems when first introduced, or even after these products have been used by ourcustomers for a period of time. These problems could result in expensive and time-consuming design modificationsor warranty charges, changes to our manufacturing processes, product recalls, significant increases in ourmaintenance costs, or exposure to liability for damages, any of which may result in substantial and unexpectedexpenditures, require significant management attention, damage our reputation and customer relationships, andadversely affect our business, our operating results and our cash flow.
8
We are dependent on key personnel.
We depend significantly on our executive officers including our Chairman and Chief Executive Officer, Peter R.Chase, and our President and Chief Operating Officer, Adam P. Chase, and on other key employees. The loss of theservices of any of these key employees could have a material impact on our business and results of operations. Inaddition, our acquisition strategy will require that we attract, motivate and retain additional skilled and experiencedpersonnel. The inability to satisfy such requirements could have a negative impact on our ability to remaincompetitive in the future.
If we cannot successfully manage the unique challenges presented by international markets, we may notbe successful in expanding our international operations.
Our strategy includes expansion of our operations in existing and new international markets by selectiveacquisitions and strategic alliances. Our ability to successfully execute our strategy in international markets isaffected by many of the same operational risks we face in expanding our U.S. operations. In addition, ourinternational expansion may be adversely affected by our ability to identify and gain access to local suppliers as wellas by local laws and customs, legal and regulatory constraints, political and economic conditions and currencyregulations of the countries or regions in which we currently operate or intend to operate in the future. Risksinherent in our international operations also include, among others, the costs and difficulties of managinginternational operations, adverse tax consequences and greater difficulty in enforcing intellectual property rights.Additionally, foreign currency exchange rates and fluctuations may have an impact on future costs or on future cashflows from our international operations.
We may experience difficulties in the redesign and consolidation of our manufacturing facilities whichcould impact shipments to customers, product quality, and our ability to realize cost savings.
We currently have several ongoing projects to streamline our manufacturing operations, which include theredesign and consolidation of certain manufacturing facilities. We anticipate a reduction of overhead costs as aresult of these projects, to the extent that we can effectively leverage assets, personnel, and business processes inthe transition of production among manufacturing facilities. However, uncertainty is inherent within the facilityredesign and consolidation process, and unforeseen circumstances could offset the anticipated benefits, disruptservice to customers, and impact product quality.
Financial market performance may have a material adverse effect on our pension plan assets and requireadditional funding requirements.
Significant and sustained declines in the financial markets may have a material adverse effect on the fairmarket value of the assets of our pension plans. While these pension plan assets are considered non-financialassets since they are not carried on our balance sheet, the fair market valuation of these assets could impact ourfunding requirements, funded status or net periodic pension cost. Any significant and sustained declines in the fairmarket value of these pension assets could require us to increase our funding requirements, which would have animpact on our cash flow, and could also lead to additional pension expense.
New regulations related to conflict minerals could adversely impact our business.
The Dodd-Frank Wall Street Reform and Consumer Protection Act contains provisions to improve transparencyand accountability concerning the supply of certain minerals, known as ‘‘conflict minerals’’ (tin, tungsten, tantalum,or gold). As a result, the SEC has adopted annual disclosure and reporting requirements concerning the supplychain for those public companies that use conflict minerals that are necessary to the functionality or production oftheir products. These new requirements will require companies to perform certain reasonable country of origin anddue diligence exercises to determine if any of their sourced conflict minerals originated from the DemocraticRepublic of Congo (DRC) and adjoining countries. The first report under these rules is due in May 2014, to covercalendar year 2013.
Our efforts to comply with this provision are currently underway. There are costs associated with complying withthese disclosure requirements, including due diligence to determine the sources of conflict minerals used in ourproducts and other potential changes to products, processes or sources of supply as a consequence of suchverification activities. The implementation of these rules could adversely affect the sourcing, supply and pricing ofmaterials used in our products. As there may be only a limited number of suppliers offering conflict free ‘‘conflict
9
minerals’’, we cannot be sure that we will be able to obtain necessary conflict minerals from such suppliers insufficient quantities or at competitive prices. Also, we may face reputational challenges if we determine that certainof our products contain minerals not determined to be conflict free or if we are unable to sufficiently verify theorigins for all conflict minerals used in our products through the procedures we may implement. In addition, some ofour customers may choose to disqualify us as a supplier if we are unable to verify that any conflict minerals used inour products are not sourced from the covered countries.
Failure or compromise of security with respect to an operating or information system or portableelectronic device could adversely affect our results of operations and financial condition or theeffectiveness of our internal controls over operations and financial reporting.
We are highly dependent on automated systems to record and process our daily transactions and certain othercomponents of our financial statements. We could experience either a failure of one or more of these systems, or acompromise of our security due to technical system flaws, data input or record-keeping errors, or tampering ormanipulation of our systems by employees or unauthorized third parties. Information security risks also exist withrespect to the use of portable electronic devices, such as laptops and smartphones, which are particularlyvulnerable to loss and theft. We may also be subject to disruptions of any of these systems arising from events thatare wholly or partially beyond our control (for example, natural disasters, acts of terrorism, epidemics, computerviruses, and electrical/telecommunications outages). All of these risks are also applicable wherever we rely onoutside vendors to provide services. Operating system failures, disruptions, or the compromise of security withrespect to operating systems or portable electronic devices could subject us to liability claims, harm our reputation,interrupt our operations, or adversely affect our internal control over financial reporting, business, results fromoperations, financial condition or cash flow.
ITEM 1B—UNRESOLVED STAFF COMMENTS
Not applicable
10

ITEM 2—PROPERTIES
We own and lease office and manufacturing properties as outlined in the table below.
Square Owned /Location Feet Leased Principal Use
Bridgewater, MA 5,200 Owned Corporate headquarters and executive office
Westwood, MA 20,200 Leased Global Operations Center including research and development, salesand administrative services
Randolph, MA 77,500 Owned We ceased manufacturing of products at this location effectiveDecember 2012, and this facility is currently being used for storage ofinventory and fixed assets.
Oxford, MA 73,600 Owned Manufacture of tape and related products for the electronic andtelecommunications industries, as well as laminated durable papers
Paterson, NJ 40,000 Owned/ We own the building and lease the land from the landowner. Currently,Leased the building is being leased to a tenant and the land is being
sub-leased.
Taylorsville, NC (a) 50,000 Leased Manufacture of flexible packaging for industrial and retail use, as well astape and related products for the electronic and telecommunicationsindustries
Blawnox, PA 44,000 Owned Manufacture and sale of protective coatings and tape products
O’Hara Township, PA 109,000 Owned Manufacture and sale of protective electronic coatings, expansion jointsand accessories
Evanston, IL 100,000 Owned Manufacture and sale of protective coatings and tape products
Houston, TX 45,000 Owned Manufacture of coating and lining systems for use in liquid storage andcontainment applications
Pawtucket, RI 70,400 Owned Manufacture and sale of laminated film foils for the electronics andcable industries, and offices for sales and administrative services
Granite Falls, NC 108,000 Owned Manufacture and sale of pulling and detection tapes, and fiber opticstrength elements, as well as research and development services
Lenoir, NC 110,000 Owned Manufacture and sale of laminated film foils and cover tapes
Winnersh, Berkshire, England 18,800 Leased Manufacture and sale of protective electronic coatings
Rye, East Sussex, England 36,600 Owned Manufacture and sale of protective coatings and tape products
Paris, France 1,350 Leased Sales/technical service office and warehouse allowing direct sales andservice to the French market
Mississauga, Canada 2,500 Leased Distribution center for Canadian market supply chain demands
Rotterdam, Netherlands 2,500 Leased Distribution center for European market supply chain demands
Suzhou, China 48,000 Leased Manufacture of packaging tape products for the electronics industries
(a) In October 2013, the Insulfab� business that is manufactured at our Taylorsville, NC facility was sold to an unrelated thirdparty. Along with the sale of the business, the third party assumed the lease of this facility.
The above facilities range in age from new to about 100 years, are generally in good condition and, in theopinion of management, adequate and suitable for present operations. We also own equipment and machinery thatis in good repair and, in the opinion of management, adequate and suitable for present operations. We couldsignificantly add to our capacity by increasing shift operations. Availability of machine hours through additional shiftswould provide expansion of current product volume without significant additional capital investment.
11

ITEM 3—LEGAL PROCEEDINGS
We are involved from time to time in litigation incidental to the conduct of our business. Although we do notexpect that the outcome in any of these matters, individually or collectively, will have a material adverse effect onour financial condition, results of operations or cashflows, litigation is inherently unpredictable. Therefore, judgmentscould be rendered or settlements entered, that could adversely affect our operating results or cash flows in aparticular period. We routinely assess all of our litigation and threatened litigation as to the probability of ultimatelyincurring a liability, and record our best estimate of the ultimate loss in situations where we assess the likelihood ofloss as probable.
ITEM 4—MINE SAFETY DISCLOSURES
Not applicable.
ITEM 4A—EXECUTIVE OFFICERS OF THE REGISTRANT
The following table sets forth information concerning our Executive Officers as of August 31, 2013. Each of ourExecutive Officers is selected by our Board of Directors and holds office until his successor is elected and qualified.
Name Age Offices Held and Business Experience during the Past Five Years
Peter R. Chase . . . . . . . . 65 Chairman of the Board of the Company since February 2007, and ChiefExecutive Officer of the Company since September 1993.
Adam P. Chase . . . . . . . . 41 President of the Company since January 2008, Chief Operating Officer of theCompany since February 2007. Adam Chase is the son of Peter Chase.
Kenneth L. Dumas . . . . . . 42 Chief Financial Officer and Treasurer of the Company since February 2007.
12
13NOV201306300336
PART II
ITEM 5—MARKET FOR THE REGISTRANT’S COMMON EQUITY, RELATED STOCKHOLDER MATTERS AND ISSUER PURCHASES OF
EQUITY SECURITIES
Our common stock is traded on the NYSE MKT under the symbol CCF. As of October 31, 2013, there were405 shareholders of record of our Common Stock and we believe that there were approximately 3,092 beneficialshareholders who held shares in nominee name. On that date, the closing price of our common stock was $30.26per share as reported by the NYSE MKT.
The following table sets forth the high and low daily sales prices for our common stock as reported by the NYSEMKT for each quarter in the fiscal years ended August 31, 2013 and 2012:
Fiscal 2013 Fiscal 2012High Low High Low
First Quarter . . . . . . . . . . . . . . . . . . . . . . . . . . . . $19.00 $15.51 $15.20 $ 9.83Second Quarter . . . . . . . . . . . . . . . . . . . . . . . . . . 19.68 17.02 16.94 12.25Third Quarter . . . . . . . . . . . . . . . . . . . . . . . . . . . . 19.94 16.98 16.46 11.49Fourth Quarter . . . . . . . . . . . . . . . . . . . . . . . . . . . 30.75 19.52 17.07 10.80
Single annual cash dividend payments were declared and paid subsequent to year end in the amounts of$0.45, $0.40, and $0.35 per common share, for the years ended August 31, 2013, 2012 and 2011, respectively.Certain of our borrowing facilities contain financial covenants which may have the effect of limiting the amount ofdividends that we can pay.
Comparative Stock Performance
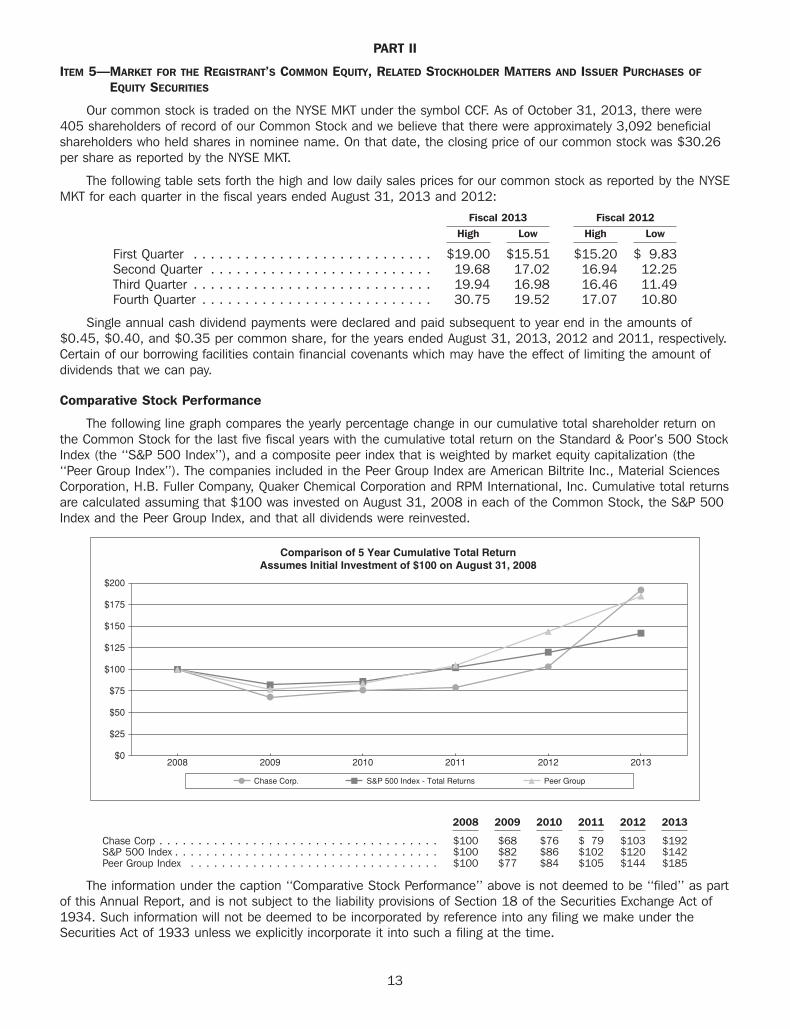
The following line graph compares the yearly percentage change in our cumulative total shareholder return onthe Common Stock for the last five fiscal years with the cumulative total return on the Standard & Poor’s 500 StockIndex (the ‘‘S&P 500 Index’’), and a composite peer index that is weighted by market equity capitalization (the‘‘Peer Group Index’’). The companies included in the Peer Group Index are American Biltrite Inc., Material SciencesCorporation, H.B. Fuller Company, Quaker Chemical Corporation and RPM International, Inc. Cumulative total returnsare calculated assuming that $100 was invested on August 31, 2008 in each of the Common Stock, the S&P 500Index and the Peer Group Index, and that all dividends were reinvested.
$0
$25
$50
$75
$100
$125
$150
$175
$200
2008 2009 2010 2011 2012 2013
Chase Corp. S&P 500 Index - Total Returns Peer Group
Comparison of 5 Year Cumulative Total ReturnAssumes Initial Investment of $100 on August 31, 2008
2008 2009 2010 2011 2012 2013
Chase Corp . . . . . . . . . . . . . . . . . . . . . . . . . . . . . . . . . . . . $100 $68 $76 $ 79 $103 $192S&P 500 Index . . . . . . . . . . . . . . . . . . . . . . . . . . . . . . . . . . $100 $82 $86 $102 $120 $142Peer Group Index . . . . . . . . . . . . . . . . . . . . . . . . . . . . . . . . $100 $77 $84 $105 $144 $185
The information under the caption ‘‘Comparative Stock Performance’’ above is not deemed to be ‘‘filed’’ as partof this Annual Report, and is not subject to the liability provisions of Section 18 of the Securities Exchange Act of1934. Such information will not be deemed to be incorporated by reference into any filing we make under theSecurities Act of 1933 unless we explicitly incorporate it into such a filing at the time.
13
ITEM 6—SELECTED FINANCIAL DATA
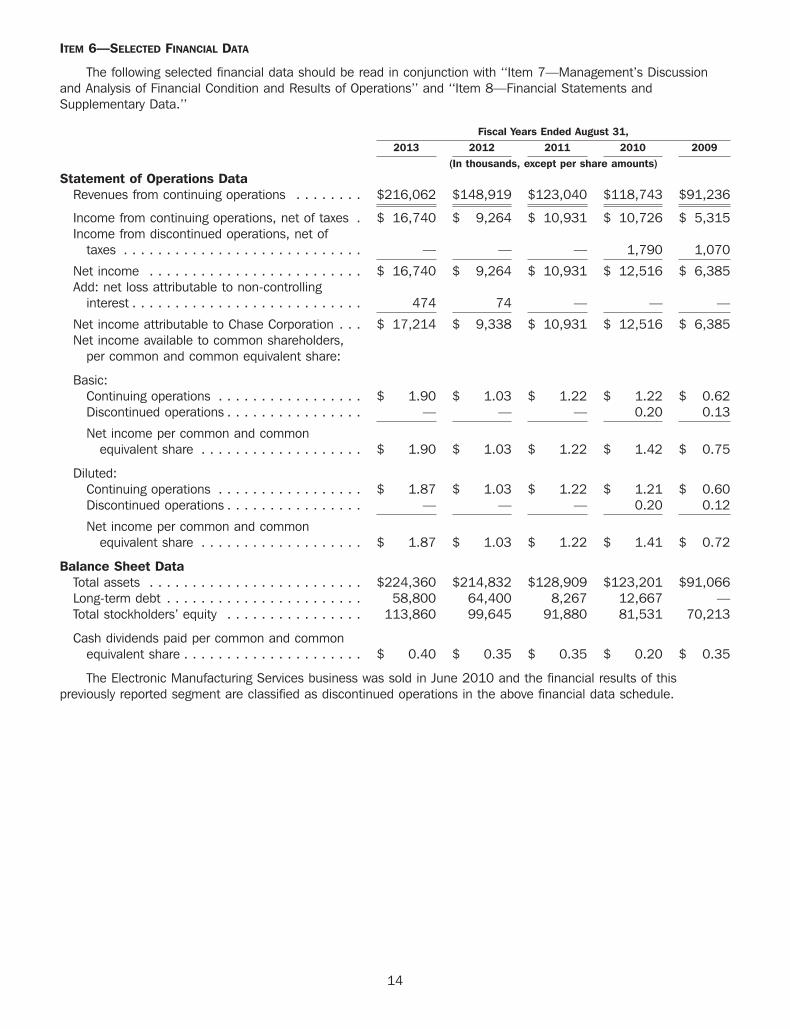
The following selected financial data should be read in conjunction with ‘‘Item 7—Management’s Discussionand Analysis of Financial Condition and Results of Operations’’ and ‘‘Item 8—Financial Statements andSupplementary Data.’’
Fiscal Years Ended August 31,2013 2012 2011 2010 2009
(In thousands, except per share amounts)Statement of Operations Data
Revenues from continuing operations . . . . . . . . $216,062 $148,919 $123,040 $118,743 $91,236
Income from continuing operations, net of taxes . $ 16,740 $ 9,264 $ 10,931 $ 10,726 $ 5,315Income from discontinued operations, net of
taxes . . . . . . . . . . . . . . . . . . . . . . . . . . . . — — — 1,790 1,070
Net income . . . . . . . . . . . . . . . . . . . . . . . . . $ 16,740 $ 9,264 $ 10,931 $ 12,516 $ 6,385Add: net loss attributable to non-controlling
interest . . . . . . . . . . . . . . . . . . . . . . . . . . . 474 74 — — —
Net income attributable to Chase Corporation . . . $ 17,214 $ 9,338 $ 10,931 $ 12,516 $ 6,385Net income available to common shareholders,
per common and common equivalent share:
Basic:Continuing operations . . . . . . . . . . . . . . . . . $ 1.90 $ 1.03 $ 1.22 $ 1.22 $ 0.62Discontinued operations . . . . . . . . . . . . . . . . — — — 0.20 0.13
Net income per common and commonequivalent share . . . . . . . . . . . . . . . . . . . $ 1.90 $ 1.03 $ 1.22 $ 1.42 $ 0.75
Diluted:Continuing operations . . . . . . . . . . . . . . . . . $ 1.87 $ 1.03 $ 1.22 $ 1.21 $ 0.60Discontinued operations . . . . . . . . . . . . . . . . — — — 0.20 0.12
Net income per common and commonequivalent share . . . . . . . . . . . . . . . . . . . $ 1.87 $ 1.03 $ 1.22 $ 1.41 $ 0.72
Balance Sheet DataTotal assets . . . . . . . . . . . . . . . . . . . . . . . . . $224,360 $214,832 $128,909 $123,201 $91,066Long-term debt . . . . . . . . . . . . . . . . . . . . . . . 58,800 64,400 8,267 12,667 —Total stockholders’ equity . . . . . . . . . . . . . . . . 113,860 99,645 91,880 81,531 70,213
Cash dividends paid per common and commonequivalent share . . . . . . . . . . . . . . . . . . . . . $ 0.40 $ 0.35 $ 0.35 $ 0.20 $ 0.35
The Electronic Manufacturing Services business was sold in June 2010 and the financial results of thispreviously reported segment are classified as discontinued operations in the above financial data schedule.
14

ITEM 7—MANAGEMENT’S DISCUSSION AND ANALYSIS OF FINANCIAL CONDITION AND RESULTS OF OPERATIONS
The following discussion provides an analysis of our financial condition and results of operations and should beread in conjunction with the Consolidated Financial Statements and notes thereto included in Item 8 of this AnnualReport on Form 10-K.
Selected Relationships within the Consolidated Statements of Operations
Years Ended August 31,2013 2012 2011
(Dollars in thousands)Revenues . . . . . . . . . . . . . . . . . . . . . . . . . . . . . . . . . . . . . . . . . . . . . $216,062 $148,919 $123,040
Net income . . . . . . . . . . . . . . . . . . . . . . . . . . . . . . . . . . . . . . . . . . . . $ 16,740 $ 9,264 $ 10,931Add: net loss attributable to non-controlling interest . . . . . . . . . . . . . . . . . 474 74 —
Net income attributable to Chase Corporation . . . . . . . . . . . . . . . . . . . . . $ 17,214 $ 9,338 $ 10,931
Increase in revenues from prior yearAmount . . . . . . . . . . . . . . . . . . . . . . . . . . . . . . . . . . . . . . . . . . . . . $ 67,143 $ 25,879 $ 4,297Percentage . . . . . . . . . . . . . . . . . . . . . . . . . . . . . . . . . . . . . . . . . . 45% 21% 4%
Increase/(Decrease) in net income, net of taxes from prior yearAmount . . . . . . . . . . . . . . . . . . . . . . . . . . . . . . . . . . . . . . . . . . . . . $ 7,476 $ (1,667) $ 205Percentage . . . . . . . . . . . . . . . . . . . . . . . . . . . . . . . . . . . . . . . . . . 80% (15)% 2%
Percentage of revenues:Revenues . . . . . . . . . . . . . . . . . . . . . . . . . . . . . . . . . . . . . . . . . . . 100% 100% 100%Expenses:
Cost of products and services sold . . . . . . . . . . . . . . . . . . . . . . . . . 68% 68% 65%Selling, general and administrative expenses . . . . . . . . . . . . . . . . . . . 20 21 22Acquisition related costs . . . . . . . . . . . . . . . . . . . . . . . . . . . . . . . . — 2 —
Income before income taxes . . . . . . . . . . . . . . . . . . . . . . . . . . . . . . . 12 9 13Income taxes . . . . . . . . . . . . . . . . . . . . . . . . . . . . . . . . . . . . . . . . . 4 3 4
Net income . . . . . . . . . . . . . . . . . . . . . . . . . . . . . . . . . . . . . . . . . . 8% 6% 9%
Overview
Benefitting from having the operating results of NEPTCO, which was acquired in June 2012, included for the fullfiscal year, the Company set record highs in fiscal 2013 for both revenues and net income. Additionally, favorableproduct mix and our continued efforts to consolidate production facilities, streamline operations and reduceoverhead costs have improved our profitability. Revenues from the Industrial Materials segment exceeded prior yearresults primarily due to the inclusion of sales from NEPTCO as well as increased sales from our electronic coatings,laminated durable paper, and wire and cable products. These favorable sales were partially offset by a reduction inour product sales to our aerospace and transportation markets compared to those realized in the prior year.
Revenues from our Construction Materials segment were slightly down from the prior year primarily due todecreased project demand earlier in the fiscal year from our pipeline coatings products produced at our UK facility.These decreases were partially offset by increased sales of our pipeline products and coating and lining systems, aswell as increased demand for our private label products, which are all manufactured domestically. Additionally, in thefourth quarter of fiscal 2013, we started to see increased order activity for certain Middle East infrastructure projectwork that was previously delayed.
In the upcoming fiscal year, we will continue with our integration of NEPTCO operations, as well as our globalERP system implementation which was initiated in fiscal 2013 and will continue through December 2014.Additionally, consolidation efforts will remain a priority and other key strategies will include targeted marketinginitiatives supported by new product development, as well as continued emphasis on identifying potential acquisitiontargets. Our balance sheet continues to remain strong, with cash on hand of $30.0 million and a current ratio of3.1. Our $15.0 million line of credit is fully available, while the balance of our term debt is $64.4 million.
15
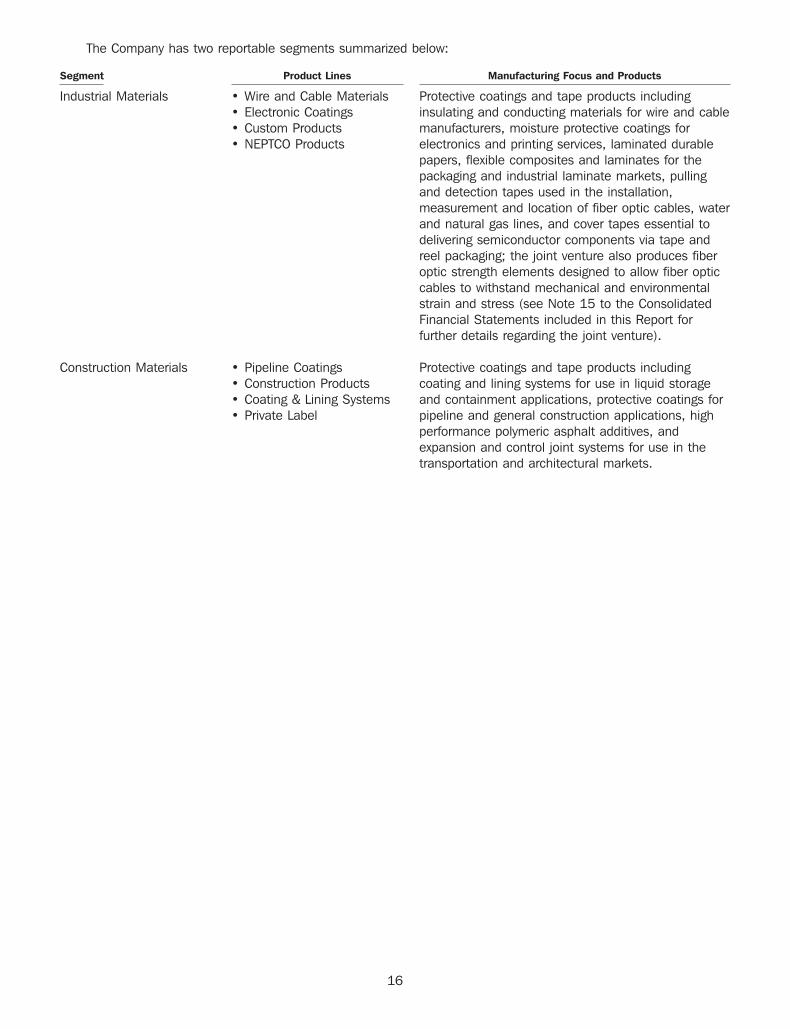
The Company has two reportable segments summarized below:
Segment Product Lines Manufacturing Focus and Products
Industrial Materials • Wire and Cable Materials Protective coatings and tape products including• Electronic Coatings insulating and conducting materials for wire and cable• Custom Products manufacturers, moisture protective coatings for• NEPTCO Products electronics and printing services, laminated durable
papers, flexible composites and laminates for thepackaging and industrial laminate markets, pullingand detection tapes used in the installation,measurement and location of fiber optic cables, waterand natural gas lines, and cover tapes essential todelivering semiconductor components via tape andreel packaging; the joint venture also produces fiberoptic strength elements designed to allow fiber opticcables to withstand mechanical and environmentalstrain and stress (see Note 15 to the ConsolidatedFinancial Statements included in this Report forfurther details regarding the joint venture).
Construction Materials • Pipeline Coatings Protective coatings and tape products including• Construction Products coating and lining systems for use in liquid storage• Coating & Lining Systems and containment applications, protective coatings for• Private Label pipeline and general construction applications, high
performance polymeric asphalt additives, andexpansion and control joint systems for use in thetransportation and architectural markets.
16
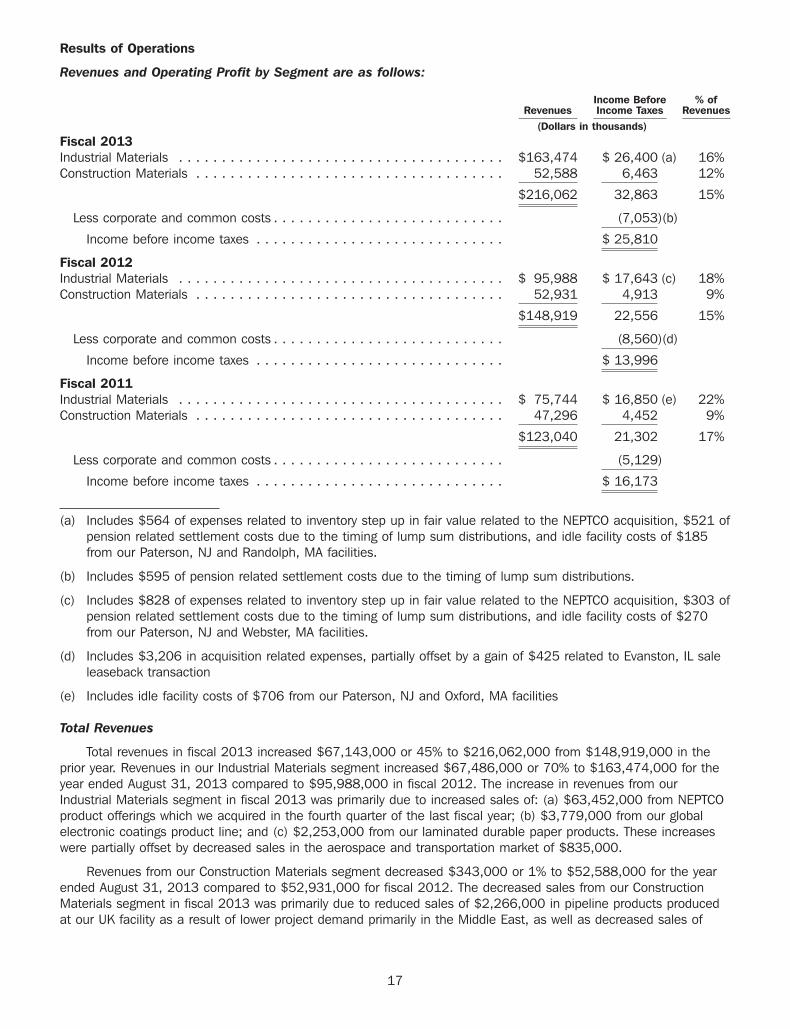
Results of Operations
Revenues and Operating Profit by Segment are as follows:
Income Before % ofRevenues Income Taxes Revenues
(Dollars in thousands)Fiscal 2013Industrial Materials . . . . . . . . . . . . . . . . . . . . . . . . . . . . . . . . . . . . . . $163,474 $ 26,400 (a) 16%Construction Materials . . . . . . . . . . . . . . . . . . . . . . . . . . . . . . . . . . . . 52,588 6,463 12%
$216,062 32,863 15%
Less corporate and common costs . . . . . . . . . . . . . . . . . . . . . . . . . . . (7,053)(b)
Income before income taxes . . . . . . . . . . . . . . . . . . . . . . . . . . . . . $ 25,810
Fiscal 2012Industrial Materials . . . . . . . . . . . . . . . . . . . . . . . . . . . . . . . . . . . . . . $ 95,988 $ 17,643 (c) 18%Construction Materials . . . . . . . . . . . . . . . . . . . . . . . . . . . . . . . . . . . . 52,931 4,913 9%
$148,919 22,556 15%
Less corporate and common costs . . . . . . . . . . . . . . . . . . . . . . . . . . . (8,560)(d)
Income before income taxes . . . . . . . . . . . . . . . . . . . . . . . . . . . . . $ 13,996
Fiscal 2011Industrial Materials . . . . . . . . . . . . . . . . . . . . . . . . . . . . . . . . . . . . . . $ 75,744 $ 16,850 (e) 22%Construction Materials . . . . . . . . . . . . . . . . . . . . . . . . . . . . . . . . . . . . 47,296 4,452 9%
$123,040 21,302 17%
Less corporate and common costs . . . . . . . . . . . . . . . . . . . . . . . . . . . (5,129)
Income before income taxes . . . . . . . . . . . . . . . . . . . . . . . . . . . . . $ 16,173
(a) Includes $564 of expenses related to inventory step up in fair value related to the NEPTCO acquisition, $521 ofpension related settlement costs due to the timing of lump sum distributions, and idle facility costs of $185from our Paterson, NJ and Randolph, MA facilities.
(b) Includes $595 of pension related settlement costs due to the timing of lump sum distributions.
(c) Includes $828 of expenses related to inventory step up in fair value related to the NEPTCO acquisition, $303 ofpension related settlement costs due to the timing of lump sum distributions, and idle facility costs of $270from our Paterson, NJ and Webster, MA facilities.
(d) Includes $3,206 in acquisition related expenses, partially offset by a gain of $425 related to Evanston, IL saleleaseback transaction
(e) Includes idle facility costs of $706 from our Paterson, NJ and Oxford, MA facilities
Total Revenues
Total revenues in fiscal 2013 increased $67,143,000 or 45% to $216,062,000 from $148,919,000 in theprior year. Revenues in our Industrial Materials segment increased $67,486,000 or 70% to $163,474,000 for theyear ended August 31, 2013 compared to $95,988,000 in fiscal 2012. The increase in revenues from ourIndustrial Materials segment in fiscal 2013 was primarily due to increased sales of: (a) $63,452,000 from NEPTCOproduct offerings which we acquired in the fourth quarter of the last fiscal year; (b) $3,779,000 from our globalelectronic coatings product line; and (c) $2,253,000 from our laminated durable paper products. These increaseswere partially offset by decreased sales in the aerospace and transportation market of $835,000.
Revenues from our Construction Materials segment decreased $343,000 or 1% to $52,588,000 for the yearended August 31, 2013 compared to $52,931,000 for fiscal 2012. The decreased sales from our ConstructionMaterials segment in fiscal 2013 was primarily due to reduced sales of $2,266,000 in pipeline products producedat our UK facility as a result of lower project demand primarily in the Middle East, as well as decreased sales of
17
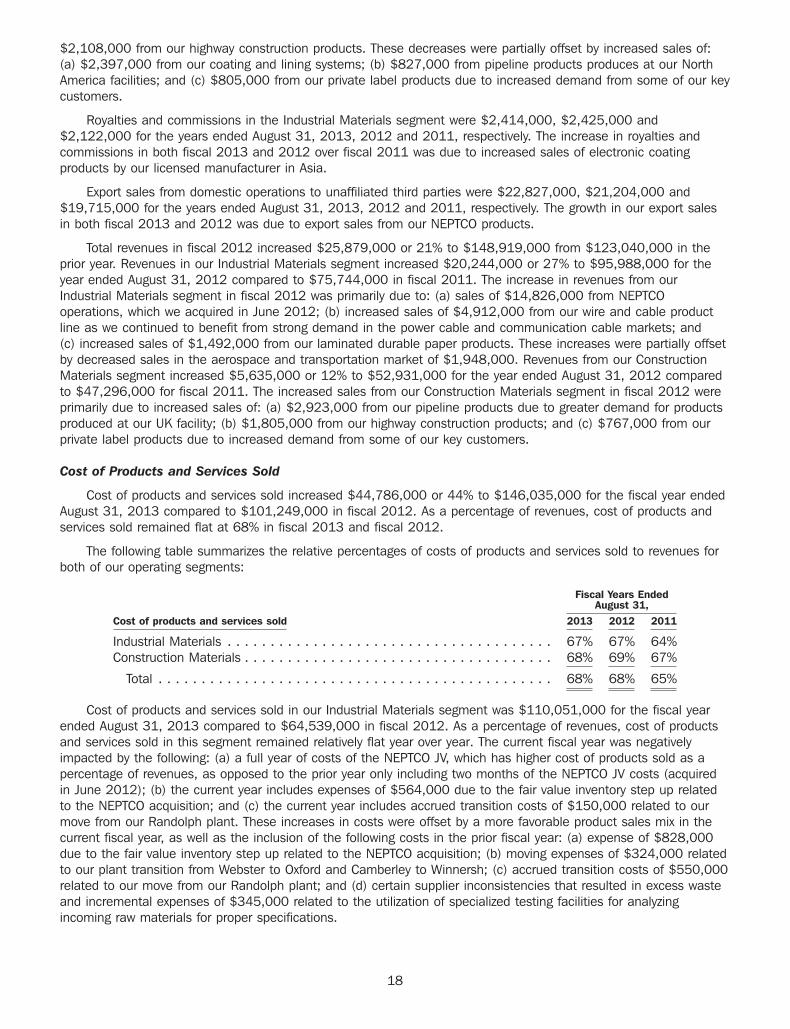
$2,108,000 from our highway construction products. These decreases were partially offset by increased sales of:(a) $2,397,000 from our coating and lining systems; (b) $827,000 from pipeline products produces at our NorthAmerica facilities; and (c) $805,000 from our private label products due to increased demand from some of our keycustomers.
Royalties and commissions in the Industrial Materials segment were $2,414,000, $2,425,000 and$2,122,000 for the years ended August 31, 2013, 2012 and 2011, respectively. The increase in royalties andcommissions in both fiscal 2013 and 2012 over fiscal 2011 was due to increased sales of electronic coatingproducts by our licensed manufacturer in Asia.
Export sales from domestic operations to unaffiliated third parties were $22,827,000, $21,204,000 and$19,715,000 for the years ended August 31, 2013, 2012 and 2011, respectively. The growth in our export salesin both fiscal 2013 and 2012 was due to export sales from our NEPTCO products.
Total revenues in fiscal 2012 increased $25,879,000 or 21% to $148,919,000 from $123,040,000 in theprior year. Revenues in our Industrial Materials segment increased $20,244,000 or 27% to $95,988,000 for theyear ended August 31, 2012 compared to $75,744,000 in fiscal 2011. The increase in revenues from ourIndustrial Materials segment in fiscal 2012 was primarily due to: (a) sales of $14,826,000 from NEPTCOoperations, which we acquired in June 2012; (b) increased sales of $4,912,000 from our wire and cable productline as we continued to benefit from strong demand in the power cable and communication cable markets; and(c) increased sales of $1,492,000 from our laminated durable paper products. These increases were partially offsetby decreased sales in the aerospace and transportation market of $1,948,000. Revenues from our ConstructionMaterials segment increased $5,635,000 or 12% to $52,931,000 for the year ended August 31, 2012 comparedto $47,296,000 for fiscal 2011. The increased sales from our Construction Materials segment in fiscal 2012 wereprimarily due to increased sales of: (a) $2,923,000 from our pipeline products due to greater demand for productsproduced at our UK facility; (b) $1,805,000 from our highway construction products; and (c) $767,000 from ourprivate label products due to increased demand from some of our key customers.
Cost of Products and Services Sold
Cost of products and services sold increased $44,786,000 or 44% to $146,035,000 for the fiscal year endedAugust 31, 2013 compared to $101,249,000 in fiscal 2012. As a percentage of revenues, cost of products andservices sold remained flat at 68% in fiscal 2013 and fiscal 2012.
The following table summarizes the relative percentages of costs of products and services sold to revenues forboth of our operating segments:
Fiscal Years EndedAugust 31,
Cost of products and services sold 2013 2012 2011
Industrial Materials . . . . . . . . . . . . . . . . . . . . . . . . . . . . . . . . . . . . . . 67% 67% 64%Construction Materials . . . . . . . . . . . . . . . . . . . . . . . . . . . . . . . . . . . . 68% 69% 67%
Total . . . . . . . . . . . . . . . . . . . . . . . . . . . . . . . . . . . . . . . . . . . . . . 68% 68% 65%
Cost of products and services sold in our Industrial Materials segment was $110,051,000 for the fiscal yearended August 31, 2013 compared to $64,539,000 in fiscal 2012. As a percentage of revenues, cost of productsand services sold in this segment remained relatively flat year over year. The current fiscal year was negativelyimpacted by the following: (a) a full year of costs of the NEPTCO JV, which has higher cost of products sold as apercentage of revenues, as opposed to the prior year only including two months of the NEPTCO JV costs (acquiredin June 2012); (b) the current year includes expenses of $564,000 due to the fair value inventory step up relatedto the NEPTCO acquisition; and (c) the current year includes accrued transition costs of $150,000 related to ourmove from our Randolph plant. These increases in costs were offset by a more favorable product sales mix in thecurrent fiscal year, as well as the inclusion of the following costs in the prior fiscal year: (a) expense of $828,000due to the fair value inventory step up related to the NEPTCO acquisition; (b) moving expenses of $324,000 relatedto our plant transition from Webster to Oxford and Camberley to Winnersh; (c) accrued transition costs of $550,000related to our move from our Randolph plant; and (d) certain supplier inconsistencies that resulted in excess wasteand incremental expenses of $345,000 related to the utilization of specialized testing facilities for analyzingincoming raw materials for proper specifications.
18

Cost of products and services sold in our Construction Materials segment was $35,984,000 for the fiscal yearended August 31, 2013 compared to $36,710,000 in fiscal 2012. As a percentage of revenues, cost of productsand services sold in the Construction Materials segment decreased slightly due to a positive sales mix earlier in thefiscal year as we had increased sales of higher margin products coupled with decreased sales of lower marginproducts.
In fiscal 2012, cost of products and services sold increased $20,932,000 or 26% to $101,249,000 for thefiscal year ended August 31, 2012 compared to $80,317,000 in fiscal 2011. As a percentage of revenues, cost ofproducts and services sold increased to 68% in fiscal 2012 compared to 65% for fiscal 2011. Cost of products andservices sold in our Industrial Materials segment was $64,539,000 for the fiscal year ended August 31, 2012compared to $48,474,000 in fiscal 2011. As a percentage of revenues, cost of products and services sold in thissegment increased due to the fair value inventory step up related to the NEPTCO acquisition, the moving expensesrelated to our plant transitions to Oxford and Winnersh, the accrued transition costs related to our Randolph plant,and supplier inconsistencies, each of which is noted above. Cost of products and services sold in our ConstructionMaterials segment was $36,710,000 for the fiscal year ended August 31, 2012 compared to $31,843,000 infiscal 2011. As a percentage of revenues, cost of products and services sold in the Construction Materials segmentincreased primarily due to higher raw material costs, increased sales of lower margin products, and decreased salesof higher margin products.
Selling, General and Administrative Expenses
Selling, general and administrative expenses increased $13,064,000 or 43% to $43,236,000 during fiscal2013 compared to $30,172,000 in fiscal 2012. The dollar increase in fiscal 2013 was primarily attributable toincreased sales as well as incremental expenses from NEPTCO, which was acquired in June 2012, and includedamortization of additional intangible assets of $2,209,000. Additionally, the current year includes $595,000 ofpension related settlement costs due to the timing of lump sum distributions, as well as $1,700,000 of increasedincentive compensation expense due to the fiscal 2013 financial results, increased incentive compensation forNEPTCO employees, and overall plan design. As a percentage of revenues, however, selling, general andadministrative expenses decreased to 20% of total revenues in fiscal 2013 compared to 21% for fiscal 2012. Thepercentage decrease is attributable to management’s continued emphasis on controlling costs, including reducedtravel, advertising, and other selling related expenses.
During fiscal 2012, selling, general and administrative expenses increased $3,392,000 to $30,172,000,compared to $26,780,000 in fiscal 2011. As a percentage of revenues, selling, general and administrativeexpenses decreased to 21% in fiscal 2012 compared to 22% for fiscal 2011. This decrease was primarily due toour continued emphasis on controlling costs and leveraging fixed overhead.
In fiscal 2013, we had recoveries of previously identified bad debt that exceeded additions to bad debt expensefor the year, resulting in a net gain of $114,000. The gain of $114,000 in fiscal 2013 compared to bad debtexpense, net of recoveries, of $155,000 and $127,000 in fiscal 2012 and 2011, respectively. The increase in baddebt expense in fiscal 2012 was primarily due to financial difficulties for some of our international customers as wellas overall increased receivable balances due to higher sales. We continue with our strict adherence to ourestablished credit policies and continue to closely monitor the accounts receivable function while taking a proactiveapproach to the collections process.
Acquisition related costs
In fiscal 2012, we incurred $3,206,000 of acquisition costs related to our acquisition of NEPTCO. Thisacquisition was accounted for as a business combination in accordance with the accounting standards, and as suchall related professional service fees (i.e., banking, legal, accounting, actuarial, etc.) were expensed as incurredduring the year ended August 31, 2012.
Interest Expense
Interest expense increased $896,000 to $1,294,000 in fiscal 2013 compared to $398,000 in fiscal 2012.The increase in interest expense in fiscal 2013 as compared to fiscal 2012 is a direct result of incurring a full yearof interest expense on the term note related to the June 2012 acquisition of NEPTCO. Interest expense increased$202,000 to $398,000 in fiscal 2012 compared to $196,000 in fiscal 2011 primarily due to the NEPTCOacquisition financing.
19
Other Income
Other income increased $211,000 to $313,000 in fiscal 2013 compared to $102,000 in fiscal 2012. Otherincome primarily includes interest income and foreign exchange gains and losses caused by changes in exchangerates on transactions or balances denominated in currencies other than the functional currency of our subsidiaries.The increase in other income in fiscal 2013 as compared to the prior year is primarily due to foreign exchange gainsdriven by the strengthening of the pound sterling during the current fiscal year.
Other income decreased $324,000 to $102,000 in fiscal 2012 compared to $426,000 in fiscal 2011. Infiscal 2012, other income includes a gain of $425,000 recognized on deposit payments previously received on thesale of our Evanston, IL property. We took back control and ownership of this leased asset which was previously soldby us under a seller financing arrangement. The increase in other income is partially offset by the foreign exchangelosses caused by the continued weakening of both the pound sterling and the euro.
Income Taxes
The effective tax rate for fiscal 2013 was 35.1% as compared to 33.8% and 32.4% in fiscal 2012 and 2011,respectively. In all three years, we have received the benefit of the domestic production deduction and foreign ratedifferential. The increased effective tax rate in fiscal 2013 is primarily due to a less favorable effective state incometax rate than realized in the prior fiscal year. The effective tax rate of 33.8% for fiscal 2012 compares unfavorably to2011 due to non-deductible acquisition related expenses, offset by a favorable effective state income tax rate.
Non-controlling Interest
The net loss from non-controlling interest relates to a joint venture in which we have, through our NEPTCOsubsidiary, a 50% ownership interest. The joint venture between NEPTCO and its joint venture partner (an otherwiseunrelated party) is managed and operated on a day-to-day basis by NEPTCO. The purpose of this joint venture is tocombine the elements of each member’s fiber optic strength businesses.
Net Income attributable to Chase Corporation
Net income in fiscal 2013 increased $7,876,000 or 84% to $17,214,000 compared to $9,338,000 in fiscal2012. The increase in net income in fiscal 2013 was primarily due to the inclusion of NEPTCO, and the favorablemix on product sales as discussed previously. These increases were partially offset by expenses related to theacceleration of defined benefit plan settlement costs of $1,223,000 resulting from the timing of lump sumdistributions to participants. Additionally, net income in the prior year period was negatively impacted by thefollowing: (a) $3,206,000 in acquisition related expenses; (b) expenses of $828,000 in inventory fair value step uprelated to the NEPTCO acquisition; (c) plant transition and moving expenses of $874,000; and (d) acceleratedpension settlement charges of $550,000 resulting from the timing of lump sum distributions.
Net income in fiscal 2012 decreased $1,593,000 or 15% to $9,338,000 compared to $10,931,000 in fiscal2011. The decrease in net income in fiscal 2012 was a result of the following factors: (a) $3,206,000 inacquisition related expenses; (b) expenses of $828,000 in inventory fair value step up related to the NEPTCOacquisition; and (c) acceleration of defined benefit plan settlement costs of $550,000 resulting from the timing oflump sum distributions to participants. In addition, there was an increase in plant transition and moving expenses of$874,000 during fiscal 2012.
Other Important Performance Measures
We believe that EBITDA and Adjusted EBITDA are useful performance measures. They are used by our executivemanagement team and board of directors to measure operating performance, to allocate resources, to evaluate theeffectiveness of our business strategies and to communicate with our board of directors and investors concerningour financial performance. EBITDA and Adjusted EBITDA are non-GAAP financial measures.
We define EBITDA as follows: net income attributable to Chase Corporation before interest expense from borrowings,income tax expense, depreciation expense from fixed assets, and amortization from intangible assets. We define AdjustedEBITDA as EBITDA excluding costs related to our acquisitions, costs of products sold related to inventory step-up to fairvalue, and settlement (gains) or losses resulting from lump sum distributions to participants from our defined benefitplan.
20
The use of EBITDA and Adjusted EBITDA has limitations and these performance measures should not beconsidered in isolation from, or as an alternative to, U.S. GAAP measures such as net income. Our measurement ofAdjusted EBITDA may not be comparable to similarly titled measures used by other companies.
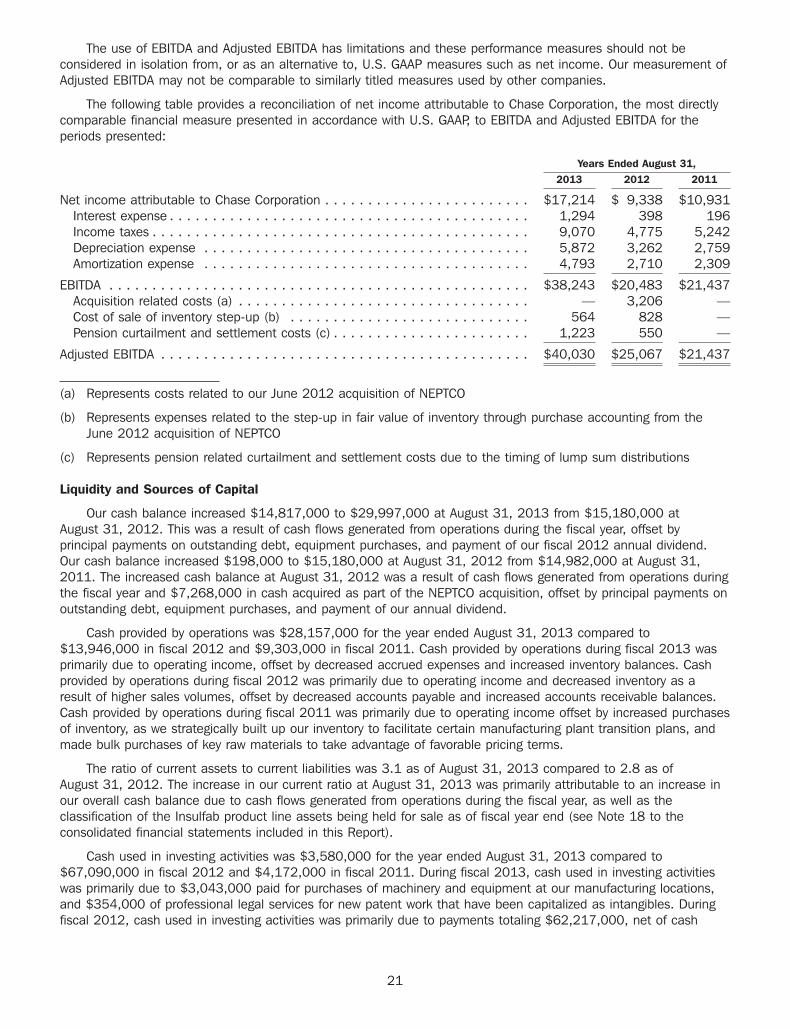
The following table provides a reconciliation of net income attributable to Chase Corporation, the most directlycomparable financial measure presented in accordance with U.S. GAAP, to EBITDA and Adjusted EBITDA for theperiods presented:
Years Ended August 31,2013 2012 2011
Net income attributable to Chase Corporation . . . . . . . . . . . . . . . . . . . . . . . . $17,214 $ 9,338 $10,931Interest expense . . . . . . . . . . . . . . . . . . . . . . . . . . . . . . . . . . . . . . . . . . 1,294 398 196Income taxes . . . . . . . . . . . . . . . . . . . . . . . . . . . . . . . . . . . . . . . . . . . . 9,070 4,775 5,242Depreciation expense . . . . . . . . . . . . . . . . . . . . . . . . . . . . . . . . . . . . . . 5,872 3,262 2,759Amortization expense . . . . . . . . . . . . . . . . . . . . . . . . . . . . . . . . . . . . . . 4,793 2,710 2,309
EBITDA . . . . . . . . . . . . . . . . . . . . . . . . . . . . . . . . . . . . . . . . . . . . . . . . . $38,243 $20,483 $21,437Acquisition related costs (a) . . . . . . . . . . . . . . . . . . . . . . . . . . . . . . . . . . — 3,206 —Cost of sale of inventory step-up (b) . . . . . . . . . . . . . . . . . . . . . . . . . . . . 564 828 —Pension curtailment and settlement costs (c) . . . . . . . . . . . . . . . . . . . . . . . 1,223 550 —
Adjusted EBITDA . . . . . . . . . . . . . . . . . . . . . . . . . . . . . . . . . . . . . . . . . . . $40,030 $25,067 $21,437
(a) Represents costs related to our June 2012 acquisition of NEPTCO
(b) Represents expenses related to the step-up in fair value of inventory through purchase accounting from theJune 2012 acquisition of NEPTCO
(c) Represents pension related curtailment and settlement costs due to the timing of lump sum distributions
Liquidity and Sources of Capital
Our cash balance increased $14,817,000 to $29,997,000 at August 31, 2013 from $15,180,000 atAugust 31, 2012. This was a result of cash flows generated from operations during the fiscal year, offset byprincipal payments on outstanding debt, equipment purchases, and payment of our fiscal 2012 annual dividend.Our cash balance increased $198,000 to $15,180,000 at August 31, 2012 from $14,982,000 at August 31,2011. The increased cash balance at August 31, 2012 was a result of cash flows generated from operations duringthe fiscal year and $7,268,000 in cash acquired as part of the NEPTCO acquisition, offset by principal payments onoutstanding debt, equipment purchases, and payment of our annual dividend.
Cash provided by operations was $28,157,000 for the year ended August 31, 2013 compared to$13,946,000 in fiscal 2012 and $9,303,000 in fiscal 2011. Cash provided by operations during fiscal 2013 wasprimarily due to operating income, offset by decreased accrued expenses and increased inventory balances. Cashprovided by operations during fiscal 2012 was primarily due to operating income and decreased inventory as aresult of higher sales volumes, offset by decreased accounts payable and increased accounts receivable balances.Cash provided by operations during fiscal 2011 was primarily due to operating income offset by increased purchasesof inventory, as we strategically built up our inventory to facilitate certain manufacturing plant transition plans, andmade bulk purchases of key raw materials to take advantage of favorable pricing terms.
The ratio of current assets to current liabilities was 3.1 as of August 31, 2013 compared to 2.8 as ofAugust 31, 2012. The increase in our current ratio at August 31, 2013 was primarily attributable to an increase inour overall cash balance due to cash flows generated from operations during the fiscal year, as well as theclassification of the Insulfab product line assets being held for sale as of fiscal year end (see Note 18 to theconsolidated financial statements included in this Report).
Cash used in investing activities was $3,580,000 for the year ended August 31, 2013 compared to$67,090,000 in fiscal 2012 and $4,172,000 in fiscal 2011. During fiscal 2013, cash used in investing activitieswas primarily due to $3,043,000 paid for purchases of machinery and equipment at our manufacturing locations,and $354,000 of professional legal services for new patent work that have been capitalized as intangibles. Duringfiscal 2012, cash used in investing activities was primarily due to payments totaling $62,217,000, net of cash
21
acquired, for the acquisition of NEPTCO and $5,230,000 paid for purchases of machinery and equipment at ourmanufacturing locations. During fiscal 2011, cash used in investing activities was primarily due to $1,930,000 paidfor machinery and equipment and improvements made for our Oxford, MA facility, $827,000 paid for machinery andequipment and improvements made for our facility in O’Hara Township, PA, $605,000 paid related to the build outof our leased property in Winnersh, UK, and cash paid for purchases of machinery and equipment at our othermanufacturing locations. These cash outflows were partially offset by additional proceeds during fiscal 2011 of$1,478,000 received from the sale of our Chase EMS business.
Cash used in financing activities was $9,614,000 for the year ended August 31, 2013 compared to cashprovided by financing activities of $53,508,000 in fiscal 2012 and cash used in financing activities of $7,729,000in fiscal 2011. During fiscal 2013, cash used in finance activities was primarily due to our annual dividend paymentand payments made on the bank loans used to finance our acquisition of NEPTCO. During fiscal 2012, cashprovided by financing activities primarily resulted from $70,000,000 in term debt used to finance our acquisition ofNEPTCO, offset by payments of $10,667,000 to retire our previously held term notes with Bank of America andRBS Citizens, payments on our line of credit arrangement, and payment of our annual dividend. Additionally, wepaid the final two scheduled promissory note payments of $1,000,000 each to the former CIM shareholders inaccordance with the CIM stock purchase agreement, described in more detail below. During fiscal 2011, cash usedin financing activities reflected our annual dividend payment and payments made on the bank loans we used tofinance our prior year acquisitions of CIM and ServiWrap. Additionally, we paid the first of three scheduledpromissory note payments of $1,000,000 to the CIM shareholders in accordance with the CIM stock purchaseagreement.
On October 13, 2011, we announced a cash dividend of $0.35 per share (totaling $3,165,000) toshareholders of record on October 31, 2011 and payable on December 5, 2011.
On October 23, 2012, we announced a cash dividend of $0.40 per share (totaling $3,626,000) toshareholders of record on November 2, 2012 and payable on December 5, 2012.
On October 23, 2013, we announced a cash dividend of $0.45 per share (totaling approximately $4,080,000)to shareholders of record on November 5, 2013 and payable on December 4, 2013.
In June 2012, as part of our acquisition of NEPTCO, we borrowed $70,000,000 under a five year term debtfinancing arrangement led and arranged by Bank of America, with participation from RBS Citizens (the ‘‘CreditFacility’’). The applicable interest rate is based on the effective LIBOR plus a range of 1.75% to 2.25%, dependingon our consolidated leverage ratio. At August 31, 2013, the applicable interest rate was 1.93% per annum and theoutstanding principal amount was $64,400,000. We are required to repay the principal amount of the term loan inquarterly installments of $1,400,000 which began in September 2012 and continue through June 2014, increasingto $1,750,000 per quarter thereafter through June 2015, and to $2,100,000 per quarter thereafter through March2017. The Credit Facility matures in June 2017. Prepayment of the Credit Facility is allowed at any time.
As part of the financing for this acquisition, we also obtained a new revolving line of credit with Bank ofAmerica (the ‘‘Revolver’’) totaling $15,000,000, which replaced our then existing $10,000,000 line. The Revolverbears interest at LIBOR plus a range of 1.75% to 2.25%, depending on our consolidated leverage ratio, or, at ouroption, at the bank’s base lending rate. As of August 31, 2013 and October 31, 2013, the entire amount of$15,000,000 was available for use. The Revolver is scheduled to mature in June 2017. This Revolver allows forincreased flexibility for working capital requirements going forward, and we plan to use this availability to helpfinance our cash needs, including potential acquisitions, in fiscal 2014 and future periods.
Our credit agreement with Bank of America, which outlines the terms of both the Credit Facility and theRevolver, contains customary affirmative and negative covenants that, among other things, restrict our ability toincur additional indebtedness. It also requires us to maintain a ratio of consolidated indebtedness to consolidatedEBITDA (each as defined in the credit agreement) of no more than 3.00 to 1.00, and to maintain a consolidatedfixed charge coverage ratio (as calculated in the credit agreement) of at least 1.25 to 1.00. We were in compliancewith our debt covenants as of August 31, 2013.
We currently have several on-going capital projects that are important to our long term strategic goals.Machinery and equipment will also be added as needed to increase capacity or enhance operating efficiencies inour other manufacturing plants.
22
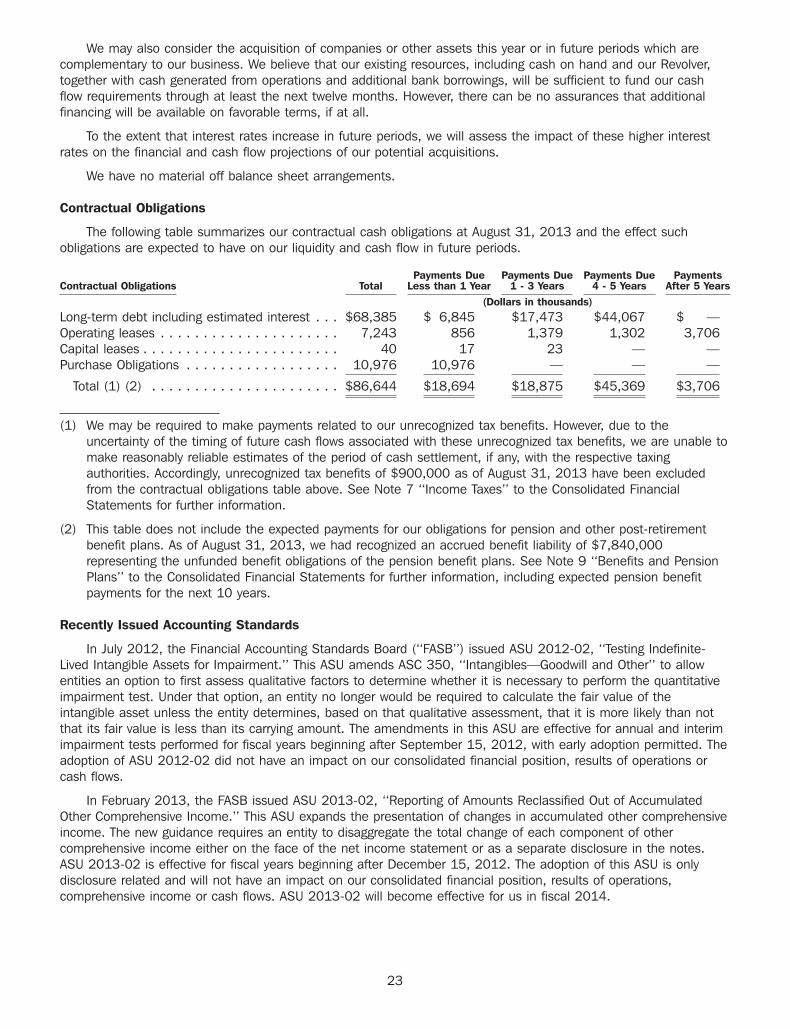
We may also consider the acquisition of companies or other assets this year or in future periods which arecomplementary to our business. We believe that our existing resources, including cash on hand and our Revolver,together with cash generated from operations and additional bank borrowings, will be sufficient to fund our cashflow requirements through at least the next twelve months. However, there can be no assurances that additionalfinancing will be available on favorable terms, if at all.
To the extent that interest rates increase in future periods, we will assess the impact of these higher interestrates on the financial and cash flow projections of our potential acquisitions.
We have no material off balance sheet arrangements.
Contractual Obligations
The following table summarizes our contractual cash obligations at August 31, 2013 and the effect suchobligations are expected to have on our liquidity and cash flow in future periods.
Payments Due Payments Due Payments Due PaymentsContractual Obligations Total Less than 1 Year 1 - 3 Years 4 - 5 Years After 5 Years
(Dollars in thousands)Long-term debt including estimated interest . . . $68,385 $ 6,845 $17,473 $44,067 $ —Operating leases . . . . . . . . . . . . . . . . . . . . . 7,243 856 1,379 1,302 3,706Capital leases . . . . . . . . . . . . . . . . . . . . . . . 40 17 23 — —Purchase Obligations . . . . . . . . . . . . . . . . . . 10,976 10,976 — — —
Total (1) (2) . . . . . . . . . . . . . . . . . . . . . . $86,644 $18,694 $18,875 $45,369 $3,706
(1) We may be required to make payments related to our unrecognized tax benefits. However, due to theuncertainty of the timing of future cash flows associated with these unrecognized tax benefits, we are unable tomake reasonably reliable estimates of the period of cash settlement, if any, with the respective taxingauthorities. Accordingly, unrecognized tax benefits of $900,000 as of August 31, 2013 have been excludedfrom the contractual obligations table above. See Note 7 ‘‘Income Taxes’’ to the Consolidated FinancialStatements for further information.
(2) This table does not include the expected payments for our obligations for pension and other post-retirementbenefit plans. As of August 31, 2013, we had recognized an accrued benefit liability of $7,840,000representing the unfunded benefit obligations of the pension benefit plans. See Note 9 ‘‘Benefits and PensionPlans’’ to the Consolidated Financial Statements for further information, including expected pension benefitpayments for the next 10 years.
Recently Issued Accounting Standards
In July 2012, the Financial Accounting Standards Board (‘‘FASB’’) issued ASU 2012-02, ‘‘Testing Indefinite-Lived Intangible Assets for Impairment.’’ This ASU amends ASC 350, ‘‘Intangibles—Goodwill and Other’’ to allowentities an option to first assess qualitative factors to determine whether it is necessary to perform the quantitativeimpairment test. Under that option, an entity no longer would be required to calculate the fair value of theintangible asset unless the entity determines, based on that qualitative assessment, that it is more likely than notthat its fair value is less than its carrying amount. The amendments in this ASU are effective for annual and interimimpairment tests performed for fiscal years beginning after September 15, 2012, with early adoption permitted. Theadoption of ASU 2012-02 did not have an impact on our consolidated financial position, results of operations orcash flows.
In February 2013, the FASB issued ASU 2013-02, ‘‘Reporting of Amounts Reclassified Out of AccumulatedOther Comprehensive Income.’’ This ASU expands the presentation of changes in accumulated other comprehensiveincome. The new guidance requires an entity to disaggregate the total change of each component of othercomprehensive income either on the face of the net income statement or as a separate disclosure in the notes.ASU 2013-02 is effective for fiscal years beginning after December 15, 2012. The adoption of this ASU is onlydisclosure related and will not have an impact on our consolidated financial position, results of operations,comprehensive income or cash flows. ASU 2013-02 will become effective for us in fiscal 2014.
23
Critical Accounting Policies, Judgments, and Estimates
The U.S. Securities and Exchange Commission (‘‘SEC’’) requires companies to provide additional disclosure andcommentary on their most critical accounting policies. The SEC has defined the most critical accounting policies asthe ones that are most important to the portrayal of a company’s financial condition and operating results, andrequires management to make its most significant estimates and judgments in the preparation of its consolidatedfinancial statements. Our critical accounting policies are described below.
Accounts Receivable
We evaluate the collectability of accounts receivable balances based on a combination of factors. In caseswhere we are aware of circumstances that may impair a specific customer’s ability to meet its financial obligationsto us, a specific allowance against amounts due to us is recorded, and thereby reduces the net recognizedreceivable to the amount we reasonably believe will be collected. For all other customers, we recognize allowancesfor doubtful accounts based on the length of time the receivables are past due, industry and geographicconcentrations, the current business environment and our historical experience. If the financial condition of ourcustomers deteriorates or if economic conditions worsen, additional allowances may be required in the future, whichcould have an adverse impact on our future operating results.
Inventories
We value inventory at the lower of cost or market using the first-in, first-out (FIFO) method. Managementassesses the recoverability of inventory based on types and levels of inventory held, forecasted demand andchanges in technology. These assessments require management judgments and estimates, and valuationadjustments for excess and obsolete inventory may be recorded based on these assessments. We estimate excessand obsolescence exposures based upon assumptions about future demand, product transitions, and marketconditions and record adjustments to reduce inventories to their estimated net realizable value. The failure toaccurately forecast demand may lead to additional excess and obsolete inventory and future charges.
Business Combinations
We assign the value of the consideration transferred to acquire a business to the tangible assets andidentifiable intangible assets acquired and liabilities assumed on the basis of their fair values at the date ofacquisition. We assess the fair value of assets, including intangible assets, using a variety of methods and eachasset is measured at fair value from the perspective of a market participant. The method used to estimate the fairvalues of intangible assets incorporates significant assumptions regarding the estimates a market participant wouldmake in order to evaluate an asset, including a market participant’s use of the asset and the appropriate discountrates for a market participant. Assets recorded from the perspective of a market participant that are determined tonot have economic use for us are expensed immediately. Any excess purchase price over the fair value of the nettangible and intangible assets acquired is allocated to goodwill. Transaction costs and restructuring costs associatedwith a transaction to acquire a business are expensed as incurred.
Goodwill, Intangible Assets, and Other Long-Lived Assets
Long-lived assets consist of goodwill, identifiable intangible assets, trademarks, patents and agreements andproperty, plant, and equipment. Intangible assets and property, plant, and equipment, excluding goodwill, areamortized using the straight-line method over their estimated useful life. We review long-lived assets and allintangible assets for impairment whenever events or changes in circumstances indicate the carrying amount of suchassets may not be recoverable.
Goodwill is also reviewed at least annually for impairment. We perform our annual goodwill impairmentassessment during the fourth fiscal quarter of each year. When evaluating the potential impairment of goodwill wefirst assess a range of qualitative factors, including but not limited to, industry conditions, the competitiveenvironment, changes in the market for our products and services, entity specific factors such as strategy andchanges in key personnel, and the overall financial performance for each of our reporting units relative to expectedhistorical or projected future operating results. If after completing this assessment, it is determined that it is morethat than likely than not that the fair value of a reporting unit is less than its carrying value, we then proceed to atwo-step impairment testing methodology using the income approach (discounted cash flow method).
24
In the first step of this testing methodology, we compare the carrying value of the reporting unit, includinggoodwill, with its fair value, as determined by its estimated discounted cash flows. If the carrying value of areporting unit exceeds its fair value, we then complete the second step of the impairment test to determine theamount of impairment to be recognized. In the second step, we estimate an implied fair value of the reporting unit’sgoodwill by allocating the fair value of the reporting unit to all of the assets and liabilities other than goodwill(including intangible assets). If the carrying value of a reporting unit’s goodwill exceeds its implied fair value, werecord an impairment loss equal to the difference in that period.
When required, we arrive at our estimates of fair value using a discounted cash flow methodology whichincludes estimates of future cash flows to be generated by particular assets, as well as selecting a discount rate tomeasure the present value of those anticipated cash flows. Estimating future cash flows requires significantjudgment and includes making assumptions about projected growth rates, industry-specific factors, working capitalrequirements, current and anticipated operating conditions, any terminal sales value at the end of the period underreview. The cash flow estimates used to determine impairment, if any, contain management’s best estimates, usingappropriate and customary assumptions and projections at the time. See Note 4 to the Consolidated FinancialStatements included in this Report.
Revenues
We recognize revenue when persuasive evidence of an arrangement exists, performance of our obligation iscomplete, our price to the buyer is fixed or determinable, and we are reasonably assured of collecting. This istypically at the time of shipment or upon receipt by the customer based on contractual terms. If a loss isanticipated on any contract, a provision for the entire loss is made immediately. Revenue recognition involvesjudgments and assessments of expected returns, and the likelihood of nonpayment by customers. We analyzevarious factors, including a review of specific customer contracts and shipment terms, historical experience,creditworthiness of customers and current market and economic conditions in determining when to recognizerevenue. Changes in judgments on these factors could impact the timing and amount of revenue recognized with aresulting impact on the timing and amount of operating income. Commissions are recognized when earned andpayments are received from the manufacturers represented. Royalty revenue is recognized based on licenseeproduction statements received from the authorized manufacturers. Billed shipping and handling fees are recordedas sales revenue with the associated costs recorded as costs of products and services sold.
Contingent Income Tax Liabilities
We are subject to routine income tax audits that occur periodically in the normal course of business. Ourcontingent income tax liabilities are estimated based on the methodology prescribed in the guidance for accountingfor uncertain tax positions, which we adopted as of the beginning of fiscal 2008. The guidance prescribes aminimum recognition threshold a tax position is required to meet before being recognized in the financialstatements. Our liabilities related to uncertain tax positions require an assessment of the probability of theincome-tax-related exposures and settlements and are influenced by our historical audit experiences with variousstate and federal taxing authorities as well as by current income tax trends. If circumstances change, we may berequired to record adjustments that could be material to our reported financial condition and results of operations.See Note 7 to the Consolidated Financial Statements included in this Report for more information on ouraccounting for uncertain tax positions.
Deferred Income Taxes
We evaluate the need for a valuation allowance to reduce our deferred tax assets to the amount that is morelikely than not to be realized. We have considered future taxable income and ongoing prudent and feasible taxplanning strategies in assessing the need for a valuation allowance. Should we determine that we would not be ableto realize all or part of our net deferred tax asset in the future, an adjustment to the deferred tax asset would becharged to income in the period such determination was made.
Stock Based Compensation
We measure compensation cost for share-based compensation at fair value, including estimated forfeitures,and recognize the expense over the period that the recipient is required to provide service in exchange for theaward, which generally is the vesting period. We use the Black-Scholes option pricing model to measure the fair
25

value of stock options. This model requires significant estimates related to the award’s expected life and futurestock price volatility of the underlying equity security. In determining the amount of expense to be recorded, we arealso required to estimate forfeiture rates for awards, based on the probability that employees will complete therequired service period. We estimate the forfeiture rate based on historical experience. If actual forfeitures differsignificantly from our estimates, additional adjustments to compensation expense may be required in future periods.
Pension Benefits
We sponsor a non-contributory defined benefit pension plan covering employees of certain divisions of theCompany. In calculating our retirement plan obligations and related expense, we make various assumptions andestimates. These assumptions include discount rates, benefits earned, expected return on plan assets, mortalityrates, and other factors. While we believe that the assumptions used are appropriate, differences in actualexperience or changes in assumptions may affect our pension obligations and future expense.
Effective December 1, 2008, the defined benefit pension plan was amended to include a soft freeze wherebyany employee hired after the effective date of December 1, 2008 will not be admitted to the plan. The onlyexception relates to employees of the International Association of Machinists and Aerospace Workers Union whosecontract was amended recently to include a soft freeze whereby any employees hired after the effective date ofJuly 15, 2012 will not be admitted to the plan. All eligible participants who were previously admitted to the planprior to the December 1, 2008 and July 15, 2012 soft freeze dates, respectively, will continue to accrue benefits asdetailed in the plan agreements.
NEPTCO has a defined benefit pension plan covering substantially all of our union employees at our Pawtucket,RI plant. This plan was frozen effective October 31, 2006, and as a result, no new participants can enter the planand the benefits of current participants were frozen as of that date. The benefits are based on years of service andthe employee’s average compensation during the earlier of five years before retirement, or October 31, 2006.
We account for our pension plans following the requirements of ASC Topic 715, ‘‘Compensation—RetirementBenefits’’ (‘‘ASC 715’’). ASC 715 requires an employer to: (a) recognize in its statement of financial position thefunded status of a benefit plan; (b) measure defined benefit plan assets and obligations as of the end of theemployer’s fiscal year (with limited exceptions); and (c) recognize as a component of other comprehensive income,net of tax, the gains or losses and prior service costs or credits that arise but are not recognized as components ofnet periodic benefit costs pursuant to prior existing guidance.
Impact of Inflation
Inflation has not had a significant long-term impact on our earnings. In the event of significant inflation, ourefforts to recover cost increases would be hampered as a result of the competitive nature of the industries in whichwe operate.
Forward-Looking Information
From time to time, we may publish, verbally or in written form, forward-looking statements relating to suchmatters as anticipated financial performance, business prospects, technological developments, new products,acquisition or consolidation strategies, anticipated sources of capital, research and development activities andsimilar matters. In fact, this Form 10-K (or any other periodic reporting documents required by the SecuritiesExchange Act of 1934, as amended) may contain forward-looking statements reflecting our current views concerningpotential or anticipated future events or developments, including our strategic goals for future fiscal periods. ThePrivate Securities Litigation Reform Act of 1995 provides a ‘‘safe harbor’’ for forward-looking statements. We cautioninvestors that any forward-looking statements made by us are not guarantees of future performance and that avariety of factors could cause our actual results and experience to differ materially from the anticipated results orother expectations expressed in our forward-looking statements. The risks and uncertainties which may affect theoperations, performance, development and results of our business include, but are not limited to, the following:uncertainties relating to economic conditions; uncertainties relating to customer plans and commitments; the pricingand availability of equipment, materials and inventories; the impact of acquisitions on our business and results ofoperations; technological developments; performance issues with suppliers and subcontractors; our ability to renewexisting credit facilities or to obtain new or additional financing as needed; economic growth; delays in testing ofnew products; our ability to comply with new regulatory requirements without undue expense or other difficulties;rapid technology changes and the highly competitive environment in which we operate. These risks and uncertainties
26
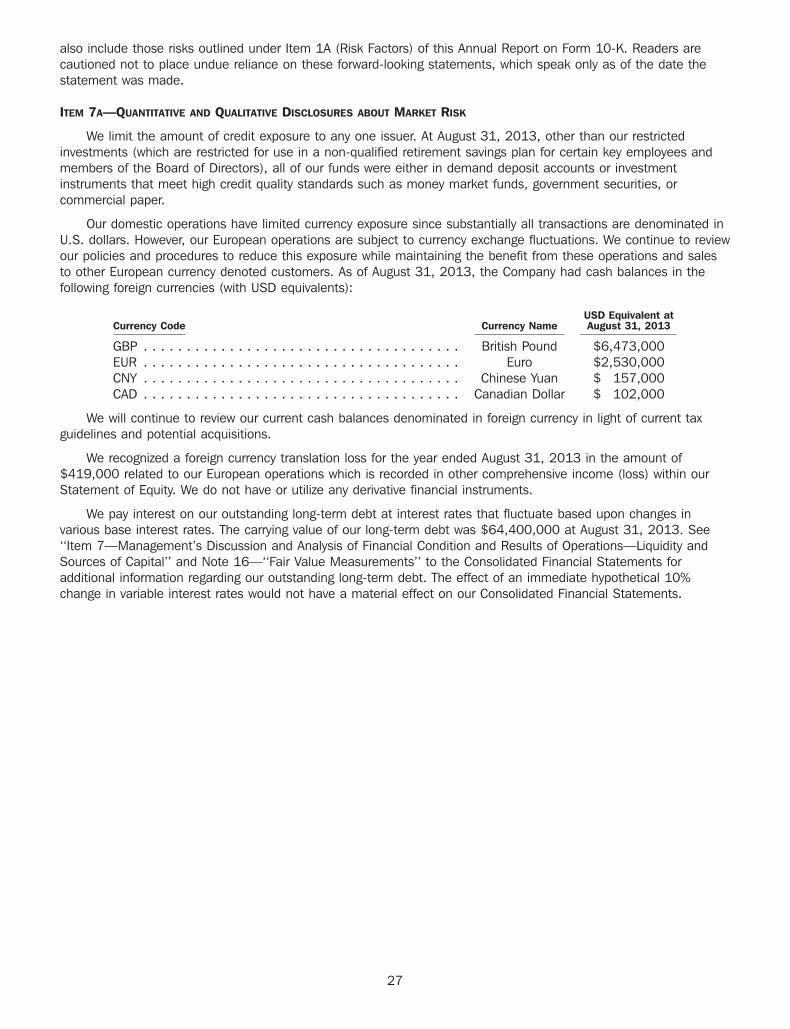
also include those risks outlined under Item 1A (Risk Factors) of this Annual Report on Form 10-K. Readers arecautioned not to place undue reliance on these forward-looking statements, which speak only as of the date thestatement was made.
ITEM 7A—QUANTITATIVE AND QUALITATIVE DISCLOSURES ABOUT MARKET RISK
We limit the amount of credit exposure to any one issuer. At August 31, 2013, other than our restrictedinvestments (which are restricted for use in a non-qualified retirement savings plan for certain key employees andmembers of the Board of Directors), all of our funds were either in demand deposit accounts or investmentinstruments that meet high credit quality standards such as money market funds, government securities, orcommercial paper.
Our domestic operations have limited currency exposure since substantially all transactions are denominated inU.S. dollars. However, our European operations are subject to currency exchange fluctuations. We continue to reviewour policies and procedures to reduce this exposure while maintaining the benefit from these operations and salesto other European currency denoted customers. As of August 31, 2013, the Company had cash balances in thefollowing foreign currencies (with USD equivalents):
USD Equivalent atCurrency Code Currency Name August 31, 2013
GBP . . . . . . . . . . . . . . . . . . . . . . . . . . . . . . . . . . . . . British Pound $6,473,000EUR . . . . . . . . . . . . . . . . . . . . . . . . . . . . . . . . . . . . . Euro $2,530,000CNY . . . . . . . . . . . . . . . . . . . . . . . . . . . . . . . . . . . . . Chinese Yuan $ 157,000CAD . . . . . . . . . . . . . . . . . . . . . . . . . . . . . . . . . . . . . Canadian Dollar $ 102,000
We will continue to review our current cash balances denominated in foreign currency in light of current taxguidelines and potential acquisitions.
We recognized a foreign currency translation loss for the year ended August 31, 2013 in the amount of$419,000 related to our European operations which is recorded in other comprehensive income (loss) within ourStatement of Equity. We do not have or utilize any derivative financial instruments.
We pay interest on our outstanding long-term debt at interest rates that fluctuate based upon changes invarious base interest rates. The carrying value of our long-term debt was $64,400,000 at August 31, 2013. See‘‘Item 7—Management’s Discussion and Analysis of Financial Condition and Results of Operations—Liquidity andSources of Capital’’ and Note 16—‘‘Fair Value Measurements’’ to the Consolidated Financial Statements foradditional information regarding our outstanding long-term debt. The effect of an immediate hypothetical 10%change in variable interest rates would not have a material effect on our Consolidated Financial Statements.
27
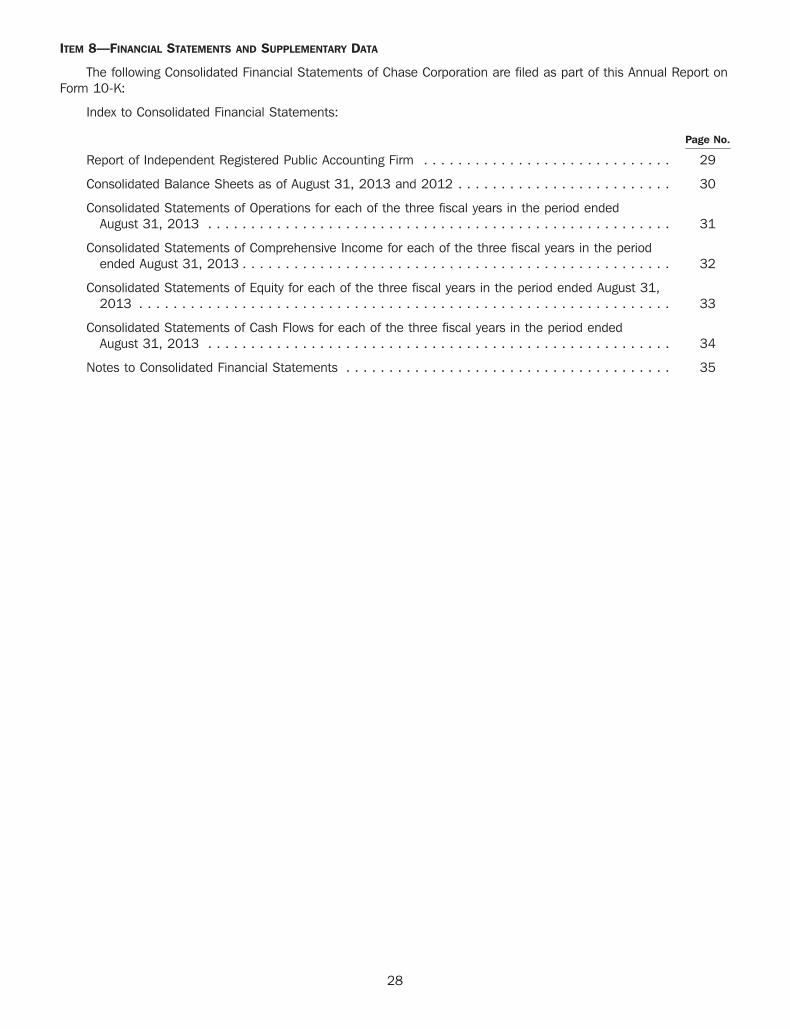
ITEM 8—FINANCIAL STATEMENTS AND SUPPLEMENTARY DATA
The following Consolidated Financial Statements of Chase Corporation are filed as part of this Annual Report onForm 10-K:
Index to Consolidated Financial Statements:
Page No.
Report of Independent Registered Public Accounting Firm . . . . . . . . . . . . . . . . . . . . . . . . . . . . . 29
Consolidated Balance Sheets as of August 31, 2013 and 2012 . . . . . . . . . . . . . . . . . . . . . . . . . 30
Consolidated Statements of Operations for each of the three fiscal years in the period endedAugust 31, 2013 . . . . . . . . . . . . . . . . . . . . . . . . . . . . . . . . . . . . . . . . . . . . . . . . . . . . . . 31
Consolidated Statements of Comprehensive Income for each of the three fiscal years in the periodended August 31, 2013 . . . . . . . . . . . . . . . . . . . . . . . . . . . . . . . . . . . . . . . . . . . . . . . . . . 32
Consolidated Statements of Equity for each of the three fiscal years in the period ended August 31,2013 . . . . . . . . . . . . . . . . . . . . . . . . . . . . . . . . . . . . . . . . . . . . . . . . . . . . . . . . . . . . . . 33
Consolidated Statements of Cash Flows for each of the three fiscal years in the period endedAugust 31, 2013 . . . . . . . . . . . . . . . . . . . . . . . . . . . . . . . . . . . . . . . . . . . . . . . . . . . . . . 34
Notes to Consolidated Financial Statements . . . . . . . . . . . . . . . . . . . . . . . . . . . . . . . . . . . . . . 35
28
Report of Independent Registered Public Accounting Firm
To the Board of Directors and Shareholders of Chase Corporation:
In our opinion, the accompanying consolidated balance sheets and the related consolidated statements ofoperations, comprehensive income, equity and cash flows present fairly, in all material respects, the financialposition of Chase Corporation and its subsidiaries at August 31, 2013 and 2012, and the results of their operationsand their cash flows for each of the three years in the period ended August 31, 2013 in conformity with accountingprinciples generally accepted in the United States of America. Also in our opinion, the Company maintained, in allmaterial respects, effective internal control over financial reporting as of August 31, 2013, based on criteriaestablished in Internal Control—Integrated Framework (1992) issued by the Committee of Sponsoring Organizationsof the Treadway Commission (COSO). The Company’s management is responsible for these financial statements, formaintaining effective internal control over financial reporting and for its assessment of the effectiveness of internalcontrol over financial reporting included in Item 9A, ‘‘Management’s Report on Internal Control over FinancialReporting.’’ Our responsibility is to express opinions on these financial statements and on the Company’s internalcontrol over financial reporting based on our integrated audits. We conducted our audits in accordance with thestandards of the Public Company Accounting Oversight Board (United States). Those standards require that we planand perform the audits to obtain reasonable assurance about whether the financial statements are free of materialmisstatement and whether effective internal control over financial reporting was maintained in all material respects.Our audits of the financial statements included examining, on a test basis, evidence supporting the amounts anddisclosures in the financial statements, assessing the accounting principles used and significant estimates made bymanagement, and evaluating the overall financial statement presentation. Our audit of internal control over financialreporting included obtaining an understanding of internal control over financial reporting, assessing the risk that amaterial weakness exists, and testing and evaluating the design and operating effectiveness of internal controlbased on the assessed risk. Our audits also included performing such other procedures as we considered necessaryin the circumstances. We believe that our audits provide a reasonable basis for our opinions.
A company’s internal control over financial reporting is a process designed to provide reasonable assuranceregarding the reliability of financial reporting and the preparation of financial statements for external purposes inaccordance with generally accepted accounting principles. A company’s internal control over financial reportingincludes those policies and procedures that (i) pertain to the maintenance of records that, in reasonable detail,accurately and fairly reflect the transactions and dispositions of the assets of the company; (ii) provide reasonableassurance that transactions are recorded as necessary to permit preparation of financial statements in accordancewith generally accepted accounting principles, and that receipts and expenditures of the company are being madeonly in accordance with authorizations of management and directors of the company; and (iii) provide reasonableassurance regarding prevention or timely detection of unauthorized acquisition, use, or disposition of the company’sassets that could have a material effect on the financial statements.
Because of its inherent limitations, internal control over financial reporting may not prevent or detectmisstatements. Also, projections of any evaluation of effectiveness to future periods are subject to the risk thatcontrols may become inadequate because of changes in conditions, or that the degree of compliance with thepolicies or procedures may deteriorate.
/s/ PricewaterhouseCoopers LLP
PricewaterhouseCoopers LLPBoston, MANovember 14, 2013
29
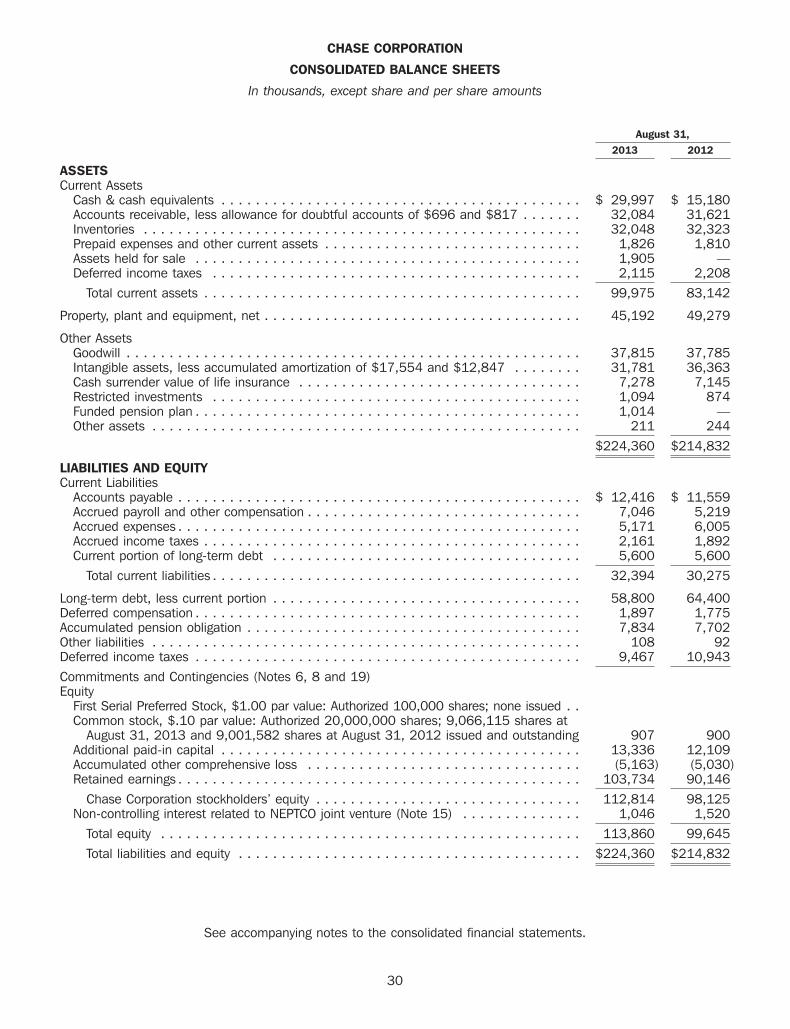
CHASE CORPORATION
CONSOLIDATED BALANCE SHEETS
In thousands, except share and per share amounts
August 31,2013 2012
ASSETSCurrent Assets
Cash & cash equivalents . . . . . . . . . . . . . . . . . . . . . . . . . . . . . . . . . . . . . . . . . . $ 29,997 $ 15,180Accounts receivable, less allowance for doubtful accounts of $696 and $817 . . . . . . . 32,084 31,621Inventories . . . . . . . . . . . . . . . . . . . . . . . . . . . . . . . . . . . . . . . . . . . . . . . . . . . 32,048 32,323Prepaid expenses and other current assets . . . . . . . . . . . . . . . . . . . . . . . . . . . . . . 1,826 1,810Assets held for sale . . . . . . . . . . . . . . . . . . . . . . . . . . . . . . . . . . . . . . . . . . . . . 1,905 —Deferred income taxes . . . . . . . . . . . . . . . . . . . . . . . . . . . . . . . . . . . . . . . . . . . 2,115 2,208
Total current assets . . . . . . . . . . . . . . . . . . . . . . . . . . . . . . . . . . . . . . . . . . . . 99,975 83,142
Property, plant and equipment, net . . . . . . . . . . . . . . . . . . . . . . . . . . . . . . . . . . . . . 45,192 49,279
Other AssetsGoodwill . . . . . . . . . . . . . . . . . . . . . . . . . . . . . . . . . . . . . . . . . . . . . . . . . . . . . 37,815 37,785Intangible assets, less accumulated amortization of $17,554 and $12,847 . . . . . . . . 31,781 36,363Cash surrender value of life insurance . . . . . . . . . . . . . . . . . . . . . . . . . . . . . . . . . 7,278 7,145Restricted investments . . . . . . . . . . . . . . . . . . . . . . . . . . . . . . . . . . . . . . . . . . . 1,094 874Funded pension plan . . . . . . . . . . . . . . . . . . . . . . . . . . . . . . . . . . . . . . . . . . . . . 1,014 —Other assets . . . . . . . . . . . . . . . . . . . . . . . . . . . . . . . . . . . . . . . . . . . . . . . . . . 211 244
$224,360 $214,832
LIABILITIES AND EQUITYCurrent Liabilities
Accounts payable . . . . . . . . . . . . . . . . . . . . . . . . . . . . . . . . . . . . . . . . . . . . . . . $ 12,416 $ 11,559Accrued payroll and other compensation . . . . . . . . . . . . . . . . . . . . . . . . . . . . . . . . 7,046 5,219Accrued expenses . . . . . . . . . . . . . . . . . . . . . . . . . . . . . . . . . . . . . . . . . . . . . . . 5,171 6,005Accrued income taxes . . . . . . . . . . . . . . . . . . . . . . . . . . . . . . . . . . . . . . . . . . . . 2,161 1,892Current portion of long-term debt . . . . . . . . . . . . . . . . . . . . . . . . . . . . . . . . . . . . 5,600 5,600
Total current liabilities . . . . . . . . . . . . . . . . . . . . . . . . . . . . . . . . . . . . . . . . . . . 32,394 30,275
Long-term debt, less current portion . . . . . . . . . . . . . . . . . . . . . . . . . . . . . . . . . . . . 58,800 64,400Deferred compensation . . . . . . . . . . . . . . . . . . . . . . . . . . . . . . . . . . . . . . . . . . . . . 1,897 1,775Accumulated pension obligation . . . . . . . . . . . . . . . . . . . . . . . . . . . . . . . . . . . . . . . 7,834 7,702Other liabilities . . . . . . . . . . . . . . . . . . . . . . . . . . . . . . . . . . . . . . . . . . . . . . . . . . 108 92Deferred income taxes . . . . . . . . . . . . . . . . . . . . . . . . . . . . . . . . . . . . . . . . . . . . . 9,467 10,943Commitments and Contingencies (Notes 6, 8 and 19)Equity
First Serial Preferred Stock, $1.00 par value: Authorized 100,000 shares; none issued . .Common stock, $.10 par value: Authorized 20,000,000 shares; 9,066,115 shares at
August 31, 2013 and 9,001,582 shares at August 31, 2012 issued and outstanding 907 900Additional paid-in capital . . . . . . . . . . . . . . . . . . . . . . . . . . . . . . . . . . . . . . . . . . 13,336 12,109Accumulated other comprehensive loss . . . . . . . . . . . . . . . . . . . . . . . . . . . . . . . . (5,163) (5,030)Retained earnings . . . . . . . . . . . . . . . . . . . . . . . . . . . . . . . . . . . . . . . . . . . . . . . 103,734 90,146
Chase Corporation stockholders’ equity . . . . . . . . . . . . . . . . . . . . . . . . . . . . . . . 112,814 98,125Non-controlling interest related to NEPTCO joint venture (Note 15) . . . . . . . . . . . . . . 1,046 1,520
Total equity . . . . . . . . . . . . . . . . . . . . . . . . . . . . . . . . . . . . . . . . . . . . . . . . . 113,860 99,645Total liabilities and equity . . . . . . . . . . . . . . . . . . . . . . . . . . . . . . . . . . . . . . . . $224,360 $214,832
See accompanying notes to the consolidated financial statements.
30
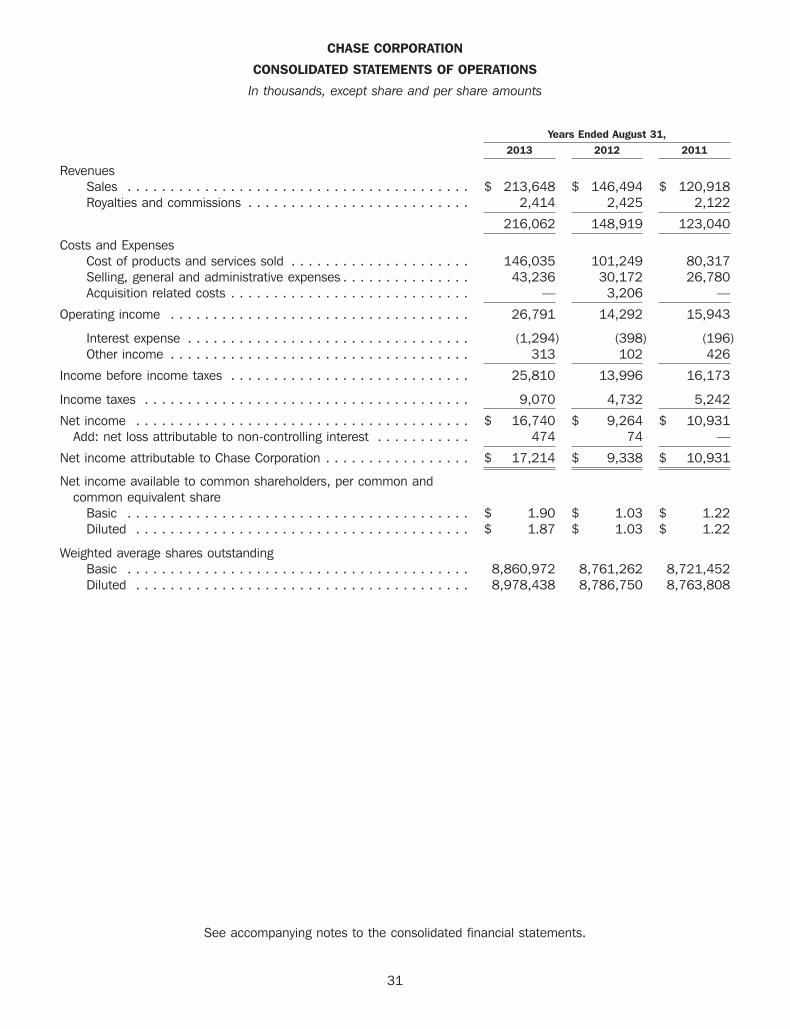
CHASE CORPORATION
CONSOLIDATED STATEMENTS OF OPERATIONS
In thousands, except share and per share amounts
Years Ended August 31,2013 2012 2011
RevenuesSales . . . . . . . . . . . . . . . . . . . . . . . . . . . . . . . . . . . . . . . . $ 213,648 $ 146,494 $ 120,918Royalties and commissions . . . . . . . . . . . . . . . . . . . . . . . . . . 2,414 2,425 2,122
216,062 148,919 123,040
Costs and ExpensesCost of products and services sold . . . . . . . . . . . . . . . . . . . . . 146,035 101,249 80,317Selling, general and administrative expenses . . . . . . . . . . . . . . . 43,236 30,172 26,780Acquisition related costs . . . . . . . . . . . . . . . . . . . . . . . . . . . . — 3,206 —
Operating income . . . . . . . . . . . . . . . . . . . . . . . . . . . . . . . . . . . 26,791 14,292 15,943
Interest expense . . . . . . . . . . . . . . . . . . . . . . . . . . . . . . . . . (1,294) (398) (196)Other income . . . . . . . . . . . . . . . . . . . . . . . . . . . . . . . . . . . 313 102 426
Income before income taxes . . . . . . . . . . . . . . . . . . . . . . . . . . . . 25,810 13,996 16,173
Income taxes . . . . . . . . . . . . . . . . . . . . . . . . . . . . . . . . . . . . . . 9,070 4,732 5,242
Net income . . . . . . . . . . . . . . . . . . . . . . . . . . . . . . . . . . . . . . . $ 16,740 $ 9,264 $ 10,931Add: net loss attributable to non-controlling interest . . . . . . . . . . . 474 74 —
Net income attributable to Chase Corporation . . . . . . . . . . . . . . . . . $ 17,214 $ 9,338 $ 10,931
Net income available to common shareholders, per common andcommon equivalent share
Basic . . . . . . . . . . . . . . . . . . . . . . . . . . . . . . . . . . . . . . . . $ 1.90 $ 1.03 $ 1.22Diluted . . . . . . . . . . . . . . . . . . . . . . . . . . . . . . . . . . . . . . . $ 1.87 $ 1.03 $ 1.22
Weighted average shares outstandingBasic . . . . . . . . . . . . . . . . . . . . . . . . . . . . . . . . . . . . . . . . 8,860,972 8,761,262 8,721,452Diluted . . . . . . . . . . . . . . . . . . . . . . . . . . . . . . . . . . . . . . . 8,978,438 8,786,750 8,763,808
See accompanying notes to the consolidated financial statements.
31

CHASE CORPORATION
CONSOLIDATED STATEMENTS OF COMPREHENSIVE INCOME
In thousands, except share and per share amounts
Years Ended August 31,2013 2012 2011
Net income . . . . . . . . . . . . . . . . . . . . . . . . . . . . . . . . . . . . . . . . . . . . . . . $16,740 $ 9,264 $10,931
Other comprehensive income:Net unrealized gain on restricted investments, net of tax of $20, $20 and $21,
respectively . . . . . . . . . . . . . . . . . . . . . . . . . . . . . . . . . . . . . . . . . . . . 85 33 35Change in funded status of pension plans, net of tax of $281, $297 and
$232, respectively . . . . . . . . . . . . . . . . . . . . . . . . . . . . . . . . . . . . . . . 201 (493) (389)Foreign currency translation adjustment . . . . . . . . . . . . . . . . . . . . . . . . . . . (419) (904) 1,418
Total other comprehensive income (loss) . . . . . . . . . . . . . . . . . . . . . . . . . . (133) (1,364) 1,064
Comprehensive income . . . . . . . . . . . . . . . . . . . . . . . . . . . . . . . . . . . . . . . 16,607 7,900 11,995Comprehensive loss attributable to non-controlling interest . . . . . . . . . . . . . . . . 474 74 —
Comprehensive income attributable to Chase Corporation . . . . . . . . . . . . . . . . $17,081 $ 7,974 $11,995
See accompanying notes to the consolidated financial statements.
32
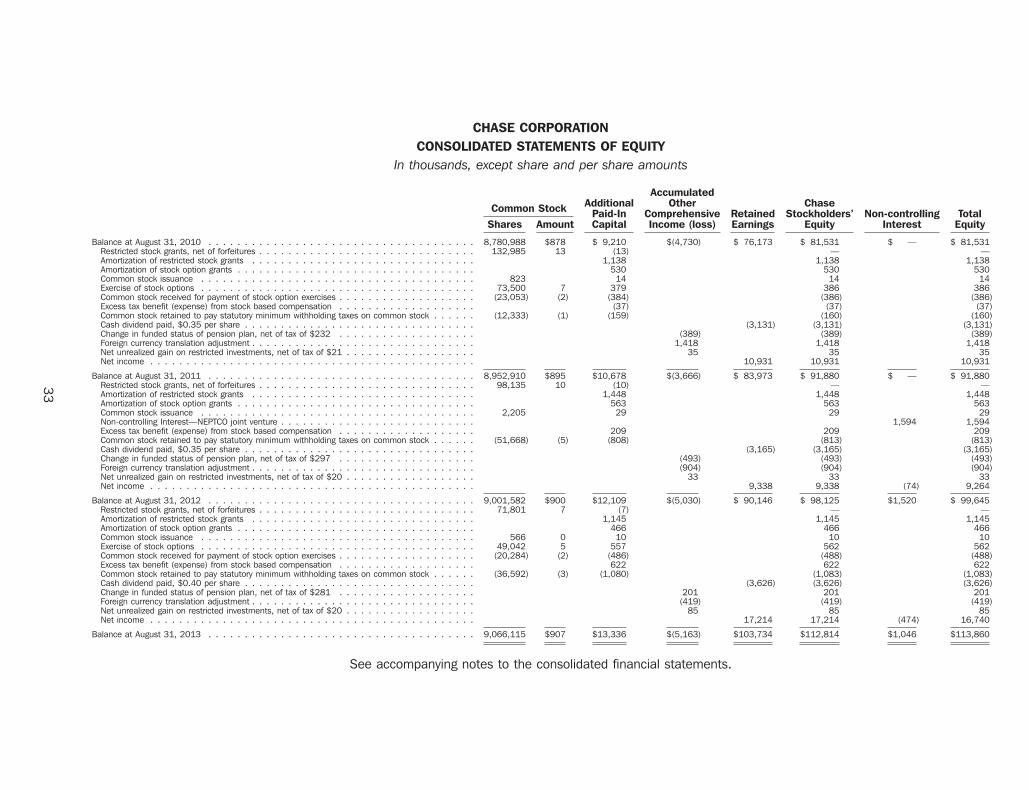
33
CHASE CORPORATIONCONSOLIDATED STATEMENTS OF EQUITY
In thousands, except share and per share amounts
AccumulatedAdditional Other ChaseCommon Stock Paid-In Comprehensive Retained Stockholders’ Non-controlling Total
Shares Amount Capital Income (loss) Earnings Equity Interest Equity
Balance at August 31, 2010 . . . . . . . . . . . . . . . . . . . . . . . . . . . . . . . . . . . . . 8,780,988 $878 $ 9,210 $(4,730) $ 76,173 $ 81,531 $ — $ 81,531Restricted stock grants, net of forfeitures . . . . . . . . . . . . . . . . . . . . . . . . . . . . . . 132,985 13 (13) — —Amortization of restricted stock grants . . . . . . . . . . . . . . . . . . . . . . . . . . . . . . . 1,138 1,138 1,138Amortization of stock option grants . . . . . . . . . . . . . . . . . . . . . . . . . . . . . . . . . 530 530 530Common stock issuance . . . . . . . . . . . . . . . . . . . . . . . . . . . . . . . . . . . . . . 823 14 14 14Exercise of stock options . . . . . . . . . . . . . . . . . . . . . . . . . . . . . . . . . . . . . . 73,500 7 379 386 386Common stock received for payment of stock option exercises . . . . . . . . . . . . . . . . . . . (23,053) (2) (384) (386) (386)Excess tax benefit (expense) from stock based compensation . . . . . . . . . . . . . . . . . . . (37) (37) (37)Common stock retained to pay statutory minimum withholding taxes on common stock . . . . . . (12,333) (1) (159) (160) (160)Cash dividend paid, $0.35 per share . . . . . . . . . . . . . . . . . . . . . . . . . . . . . . . . (3,131) (3,131) (3,131)Change in funded status of pension plan, net of tax of $232 . . . . . . . . . . . . . . . . . . . (389) (389) (389)Foreign currency translation adjustment . . . . . . . . . . . . . . . . . . . . . . . . . . . . . . . 1,418 1,418 1,418Net unrealized gain on restricted investments, net of tax of $21 . . . . . . . . . . . . . . . . . . 35 35 35Net income . . . . . . . . . . . . . . . . . . . . . . . . . . . . . . . . . . . . . . . . . . . . . 10,931 10,931 10,931
Balance at August 31, 2011 . . . . . . . . . . . . . . . . . . . . . . . . . . . . . . . . . . . . . 8,952,910 $895 $10,678 $(3,666) $ 83,973 $ 91,880 $ — $ 91,880Restricted stock grants, net of forfeitures . . . . . . . . . . . . . . . . . . . . . . . . . . . . . . 98,135 10 (10) — —Amortization of restricted stock grants . . . . . . . . . . . . . . . . . . . . . . . . . . . . . . . 1,448 1,448 1,448Amortization of stock option grants . . . . . . . . . . . . . . . . . . . . . . . . . . . . . . . . . 563 563 563Common stock issuance . . . . . . . . . . . . . . . . . . . . . . . . . . . . . . . . . . . . . . 2,205 29 29 29Non-controlling Interest—NEPTCO joint venture . . . . . . . . . . . . . . . . . . . . . . . . . . . 1,594 1,594Excess tax benefit (expense) from stock based compensation . . . . . . . . . . . . . . . . . . . 209 209 209Common stock retained to pay statutory minimum withholding taxes on common stock . . . . . . (51,668) (5) (808) (813) (813)Cash dividend paid, $0.35 per share . . . . . . . . . . . . . . . . . . . . . . . . . . . . . . . . (3,165) (3,165) (3,165)Change in funded status of pension plan, net of tax of $297 . . . . . . . . . . . . . . . . . . . (493) (493) (493)Foreign currency translation adjustment . . . . . . . . . . . . . . . . . . . . . . . . . . . . . . . (904) (904) (904)Net unrealized gain on restricted investments, net of tax of $20 . . . . . . . . . . . . . . . . . . 33 33 33Net income . . . . . . . . . . . . . . . . . . . . . . . . . . . . . . . . . . . . . . . . . . . . . 9,338 9,338 (74) 9,264
Balance at August 31, 2012 . . . . . . . . . . . . . . . . . . . . . . . . . . . . . . . . . . . . . 9,001,582 $900 $12,109 $(5,030) $ 90,146 $ 98,125 $1,520 $ 99,645Restricted stock grants, net of forfeitures . . . . . . . . . . . . . . . . . . . . . . . . . . . . . . 71,801 7 (7) — —Amortization of restricted stock grants . . . . . . . . . . . . . . . . . . . . . . . . . . . . . . . 1,145 1,145 1,145Amortization of stock option grants . . . . . . . . . . . . . . . . . . . . . . . . . . . . . . . . . 466 466 466Common stock issuance . . . . . . . . . . . . . . . . . . . . . . . . . . . . . . . . . . . . . . 566 0 10 10 10Exercise of stock options . . . . . . . . . . . . . . . . . . . . . . . . . . . . . . . . . . . . . . 49,042 5 557 562 562Common stock received for payment of stock option exercises . . . . . . . . . . . . . . . . . . . (20,284) (2) (486) (488) (488)Excess tax benefit (expense) from stock based compensation . . . . . . . . . . . . . . . . . . . 622 622 622Common stock retained to pay statutory minimum withholding taxes on common stock . . . . . . (36,592) (3) (1,080) (1,083) (1,083)Cash dividend paid, $0.40 per share . . . . . . . . . . . . . . . . . . . . . . . . . . . . . . . . (3,626) (3,626) (3,626)Change in funded status of pension plan, net of tax of $281 . . . . . . . . . . . . . . . . . . . 201 201 201Foreign currency translation adjustment . . . . . . . . . . . . . . . . . . . . . . . . . . . . . . . (419) (419) (419)Net unrealized gain on restricted investments, net of tax of $20 . . . . . . . . . . . . . . . . . . 85 85 85Net income . . . . . . . . . . . . . . . . . . . . . . . . . . . . . . . . . . . . . . . . . . . . . 17,214 17,214 (474) 16,740
Balance at August 31, 2013 . . . . . . . . . . . . . . . . . . . . . . . . . . . . . . . . . . . . . 9,066,115 $907 $13,336 $(5,163) $103,734 $112,814 $1,046 $113,860
See accompanying notes to the consolidated financial statements.
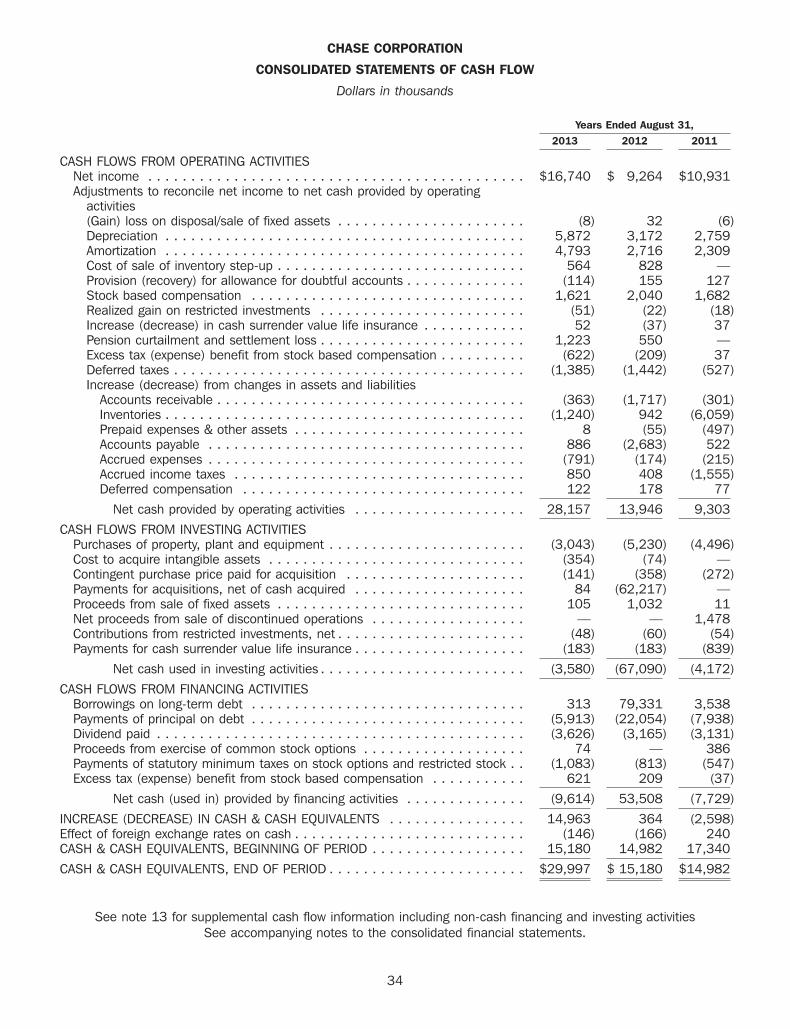
CHASE CORPORATION
CONSOLIDATED STATEMENTS OF CASH FLOW
Dollars in thousands
Years Ended August 31,2013 2012 2011
CASH FLOWS FROM OPERATING ACTIVITIESNet income . . . . . . . . . . . . . . . . . . . . . . . . . . . . . . . . . . . . . . . . . . . . $16,740 $ 9,264 $10,931Adjustments to reconcile net income to net cash provided by operating
activities(Gain) loss on disposal/sale of fixed assets . . . . . . . . . . . . . . . . . . . . . . (8) 32 (6)Depreciation . . . . . . . . . . . . . . . . . . . . . . . . . . . . . . . . . . . . . . . . . . 5,872 3,172 2,759Amortization . . . . . . . . . . . . . . . . . . . . . . . . . . . . . . . . . . . . . . . . . . 4,793 2,716 2,309Cost of sale of inventory step-up . . . . . . . . . . . . . . . . . . . . . . . . . . . . . 564 828 —Provision (recovery) for allowance for doubtful accounts . . . . . . . . . . . . . . (114) 155 127Stock based compensation . . . . . . . . . . . . . . . . . . . . . . . . . . . . . . . . 1,621 2,040 1,682Realized gain on restricted investments . . . . . . . . . . . . . . . . . . . . . . . . (51) (22) (18)Increase (decrease) in cash surrender value life insurance . . . . . . . . . . . . 52 (37) 37Pension curtailment and settlement loss . . . . . . . . . . . . . . . . . . . . . . . . 1,223 550 —Excess tax (expense) benefit from stock based compensation . . . . . . . . . . (622) (209) 37Deferred taxes . . . . . . . . . . . . . . . . . . . . . . . . . . . . . . . . . . . . . . . . . (1,385) (1,442) (527)Increase (decrease) from changes in assets and liabilities
Accounts receivable . . . . . . . . . . . . . . . . . . . . . . . . . . . . . . . . . . . . (363) (1,717) (301)Inventories . . . . . . . . . . . . . . . . . . . . . . . . . . . . . . . . . . . . . . . . . . (1,240) 942 (6,059)Prepaid expenses & other assets . . . . . . . . . . . . . . . . . . . . . . . . . . . 8 (55) (497)Accounts payable . . . . . . . . . . . . . . . . . . . . . . . . . . . . . . . . . . . . . 886 (2,683) 522Accrued expenses . . . . . . . . . . . . . . . . . . . . . . . . . . . . . . . . . . . . . (791) (174) (215)Accrued income taxes . . . . . . . . . . . . . . . . . . . . . . . . . . . . . . . . . . 850 408 (1,555)Deferred compensation . . . . . . . . . . . . . . . . . . . . . . . . . . . . . . . . . 122 178 77
Net cash provided by operating activities . . . . . . . . . . . . . . . . . . . . 28,157 13,946 9,303
CASH FLOWS FROM INVESTING ACTIVITIESPurchases of property, plant and equipment . . . . . . . . . . . . . . . . . . . . . . . (3,043) (5,230) (4,496)Cost to acquire intangible assets . . . . . . . . . . . . . . . . . . . . . . . . . . . . . . (354) (74) —Contingent purchase price paid for acquisition . . . . . . . . . . . . . . . . . . . . . (141) (358) (272)Payments for acquisitions, net of cash acquired . . . . . . . . . . . . . . . . . . . . 84 (62,217) —Proceeds from sale of fixed assets . . . . . . . . . . . . . . . . . . . . . . . . . . . . . 105 1,032 11Net proceeds from sale of discontinued operations . . . . . . . . . . . . . . . . . . — — 1,478Contributions from restricted investments, net . . . . . . . . . . . . . . . . . . . . . . (48) (60) (54)Payments for cash surrender value life insurance . . . . . . . . . . . . . . . . . . . . (183) (183) (839)
Net cash used in investing activities . . . . . . . . . . . . . . . . . . . . . . . . (3,580) (67,090) (4,172)
CASH FLOWS FROM FINANCING ACTIVITIESBorrowings on long-term debt . . . . . . . . . . . . . . . . . . . . . . . . . . . . . . . . 313 79,331 3,538Payments of principal on debt . . . . . . . . . . . . . . . . . . . . . . . . . . . . . . . . (5,913) (22,054) (7,938)Dividend paid . . . . . . . . . . . . . . . . . . . . . . . . . . . . . . . . . . . . . . . . . . . (3,626) (3,165) (3,131)Proceeds from exercise of common stock options . . . . . . . . . . . . . . . . . . . 74 — 386Payments of statutory minimum taxes on stock options and restricted stock . . (1,083) (813) (547)Excess tax (expense) benefit from stock based compensation . . . . . . . . . . . 621 209 (37)
Net cash (used in) provided by financing activities . . . . . . . . . . . . . . (9,614) 53,508 (7,729)
INCREASE (DECREASE) IN CASH & CASH EQUIVALENTS . . . . . . . . . . . . . . . . 14,963 364 (2,598)Effect of foreign exchange rates on cash . . . . . . . . . . . . . . . . . . . . . . . . . . . (146) (166) 240CASH & CASH EQUIVALENTS, BEGINNING OF PERIOD . . . . . . . . . . . . . . . . . . 15,180 14,982 17,340
CASH & CASH EQUIVALENTS, END OF PERIOD . . . . . . . . . . . . . . . . . . . . . . . $29,997 $ 15,180 $14,982
See note 13 for supplemental cash flow information including non-cash financing and investing activitiesSee accompanying notes to the consolidated financial statements.
34
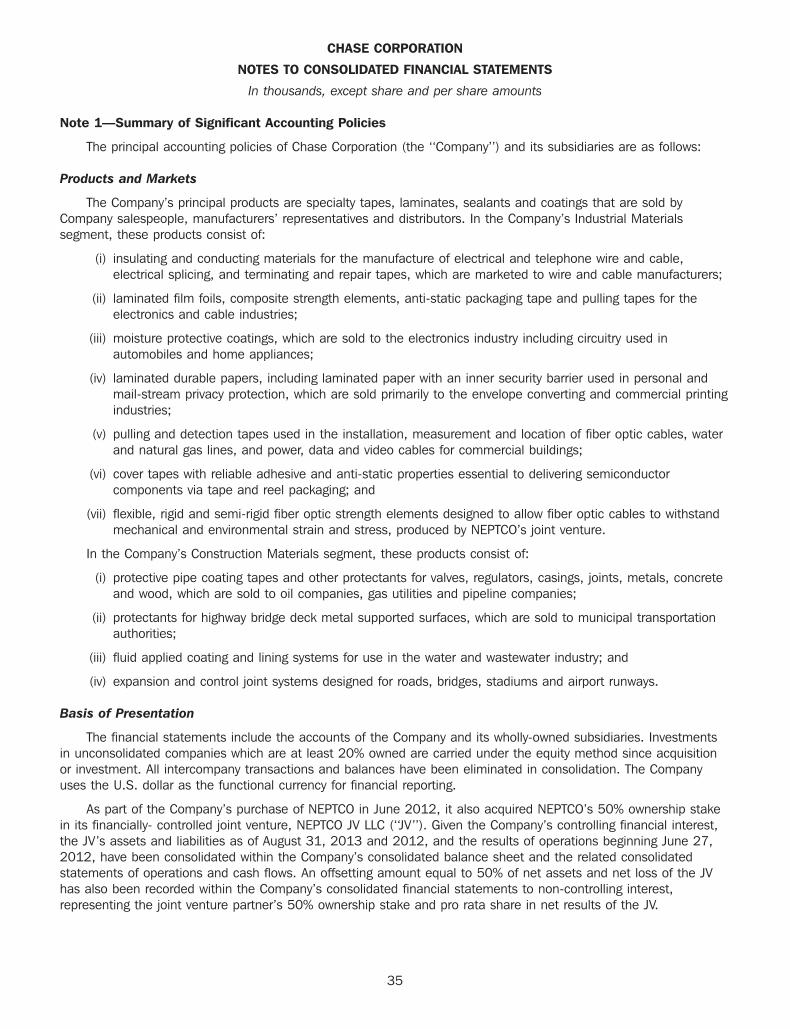
CHASE CORPORATION
NOTES TO CONSOLIDATED FINANCIAL STATEMENTS
In thousands, except share and per share amounts
Note 1—Summary of Significant Accounting Policies
The principal accounting policies of Chase Corporation (the ‘‘Company’’) and its subsidiaries are as follows:
Products and Markets
The Company’s principal products are specialty tapes, laminates, sealants and coatings that are sold byCompany salespeople, manufacturers’ representatives and distributors. In the Company’s Industrial Materialssegment, these products consist of:
(i) insulating and conducting materials for the manufacture of electrical and telephone wire and cable,electrical splicing, and terminating and repair tapes, which are marketed to wire and cable manufacturers;
(ii) laminated film foils, composite strength elements, anti-static packaging tape and pulling tapes for theelectronics and cable industries;
(iii) moisture protective coatings, which are sold to the electronics industry including circuitry used inautomobiles and home appliances;
(iv) laminated durable papers, including laminated paper with an inner security barrier used in personal andmail-stream privacy protection, which are sold primarily to the envelope converting and commercial printingindustries;
(v) pulling and detection tapes used in the installation, measurement and location of fiber optic cables, waterand natural gas lines, and power, data and video cables for commercial buildings;
(vi) cover tapes with reliable adhesive and anti-static properties essential to delivering semiconductorcomponents via tape and reel packaging; and
(vii) flexible, rigid and semi-rigid fiber optic strength elements designed to allow fiber optic cables to withstandmechanical and environmental strain and stress, produced by NEPTCO’s joint venture.
In the Company’s Construction Materials segment, these products consist of:
(i) protective pipe coating tapes and other protectants for valves, regulators, casings, joints, metals, concreteand wood, which are sold to oil companies, gas utilities and pipeline companies;
(ii) protectants for highway bridge deck metal supported surfaces, which are sold to municipal transportationauthorities;
(iii) fluid applied coating and lining systems for use in the water and wastewater industry; and
(iv) expansion and control joint systems designed for roads, bridges, stadiums and airport runways.
Basis of Presentation
The financial statements include the accounts of the Company and its wholly-owned subsidiaries. Investmentsin unconsolidated companies which are at least 20% owned are carried under the equity method since acquisitionor investment. All intercompany transactions and balances have been eliminated in consolidation. The Companyuses the U.S. dollar as the functional currency for financial reporting.
As part of the Company’s purchase of NEPTCO in June 2012, it also acquired NEPTCO’s 50% ownership stakein its financially- controlled joint venture, NEPTCO JV LLC (‘‘JV’’). Given the Company’s controlling financial interest,the JV’s assets and liabilities as of August 31, 2013 and 2012, and the results of operations beginning June 27,2012, have been consolidated within the Company’s consolidated balance sheet and the related consolidatedstatements of operations and cash flows. An offsetting amount equal to 50% of net assets and net loss of the JVhas also been recorded within the Company’s consolidated financial statements to non-controlling interest,representing the joint venture partner’s 50% ownership stake and pro rata share in net results of the JV.
35
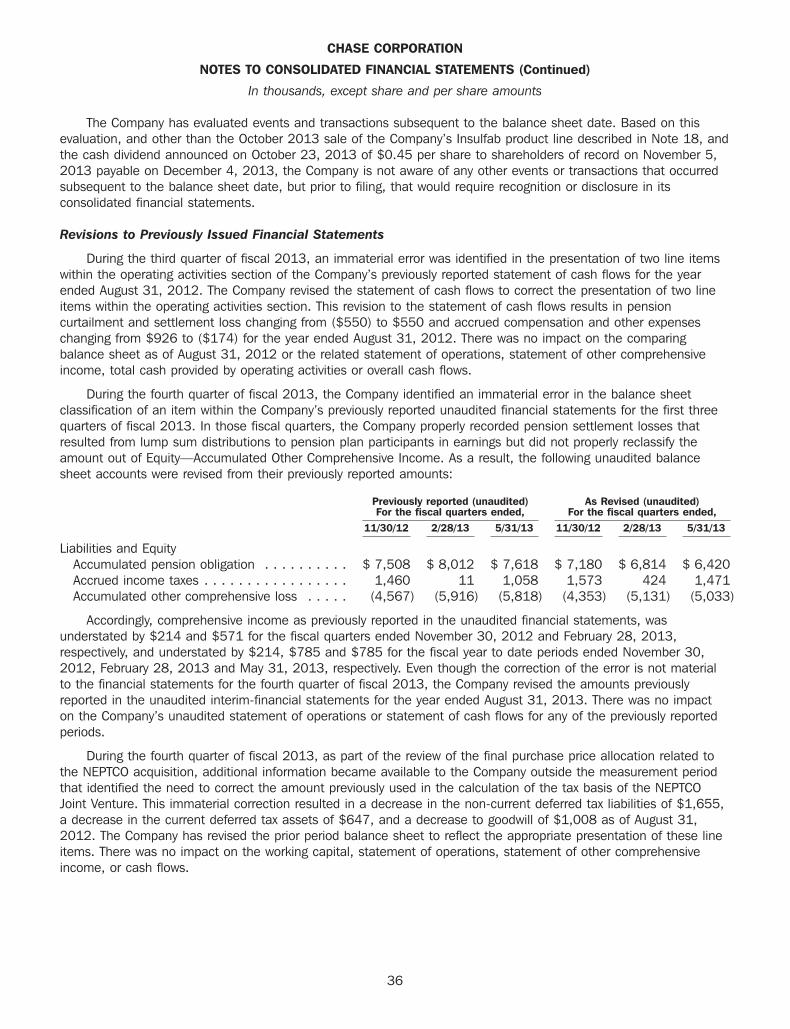
CHASE CORPORATION
NOTES TO CONSOLIDATED FINANCIAL STATEMENTS (Continued)
In thousands, except share and per share amounts
The Company has evaluated events and transactions subsequent to the balance sheet date. Based on thisevaluation, and other than the October 2013 sale of the Company’s Insulfab product line described in Note 18, andthe cash dividend announced on October 23, 2013 of $0.45 per share to shareholders of record on November 5,2013 payable on December 4, 2013, the Company is not aware of any other events or transactions that occurredsubsequent to the balance sheet date, but prior to filing, that would require recognition or disclosure in itsconsolidated financial statements.
Revisions to Previously Issued Financial Statements
During the third quarter of fiscal 2013, an immaterial error was identified in the presentation of two line itemswithin the operating activities section of the Company’s previously reported statement of cash flows for the yearended August 31, 2012. The Company revised the statement of cash flows to correct the presentation of two lineitems within the operating activities section. This revision to the statement of cash flows results in pensioncurtailment and settlement loss changing from ($550) to $550 and accrued compensation and other expenseschanging from $926 to ($174) for the year ended August 31, 2012. There was no impact on the comparingbalance sheet as of August 31, 2012 or the related statement of operations, statement of other comprehensiveincome, total cash provided by operating activities or overall cash flows.
During the fourth quarter of fiscal 2013, the Company identified an immaterial error in the balance sheetclassification of an item within the Company’s previously reported unaudited financial statements for the first threequarters of fiscal 2013. In those fiscal quarters, the Company properly recorded pension settlement losses thatresulted from lump sum distributions to pension plan participants in earnings but did not properly reclassify theamount out of Equity—Accumulated Other Comprehensive Income. As a result, the following unaudited balancesheet accounts were revised from their previously reported amounts:
Previously reported (unaudited) As Revised (unaudited)For the fiscal quarters ended, For the fiscal quarters ended,
11/30/12 2/28/13 5/31/13 11/30/12 2/28/13 5/31/13
Liabilities and EquityAccumulated pension obligation . . . . . . . . . . $ 7,508 $ 8,012 $ 7,618 $ 7,180 $ 6,814 $ 6,420Accrued income taxes . . . . . . . . . . . . . . . . . 1,460 11 1,058 1,573 424 1,471Accumulated other comprehensive loss . . . . . (4,567) (5,916) (5,818) (4,353) (5,131) (5,033)
Accordingly, comprehensive income as previously reported in the unaudited financial statements, wasunderstated by $214 and $571 for the fiscal quarters ended November 30, 2012 and February 28, 2013,respectively, and understated by $214, $785 and $785 for the fiscal year to date periods ended November 30,2012, February 28, 2013 and May 31, 2013, respectively. Even though the correction of the error is not materialto the financial statements for the fourth quarter of fiscal 2013, the Company revised the amounts previouslyreported in the unaudited interim-financial statements for the year ended August 31, 2013. There was no impacton the Company’s unaudited statement of operations or statement of cash flows for any of the previously reportedperiods.
During the fourth quarter of fiscal 2013, as part of the review of the final purchase price allocation related tothe NEPTCO acquisition, additional information became available to the Company outside the measurement periodthat identified the need to correct the amount previously used in the calculation of the tax basis of the NEPTCOJoint Venture. This immaterial correction resulted in a decrease in the non-current deferred tax liabilities of $1,655,a decrease in the current deferred tax assets of $647, and a decrease to goodwill of $1,008 as of August 31,2012. The Company has revised the prior period balance sheet to reflect the appropriate presentation of these lineitems. There was no impact on the working capital, statement of operations, statement of other comprehensiveincome, or cash flows.
36
CHASE CORPORATION
NOTES TO CONSOLIDATED FINANCIAL STATEMENTS (Continued)
In thousands, except share and per share amounts
Use of Estimates
The preparation of financial statements in conformity with accounting principles generally accepted in theUnited States of America requires management to make estimates and assumptions that affect the reportedamounts of assets and liabilities and disclosure of contingent assets and liabilities at the date of the financialstatements and the reported amounts of revenues and expenses during the reporting period. Actual results coulddiffer from those estimates.
Cash and Cash Equivalents
Cash and cash equivalents consist primarily of demand deposits accounts or investment instruments that meethigh credit quality standards such as money market funds, government securities, or commercial paper. TheCompany considers all highly liquid debt instruments purchased with a maturity of three months or less from date ofpurchase to be cash equivalents.
Accounts Receivable
The Company evaluates the collectability of accounts receivable balances based on a combination of factors. Incases where the Company is aware of circumstances that may impair a specific customer’s ability to meet itsfinancial obligations to it, a specific allowance against amounts due to the Company is recorded, and therebyreduces the net recognized receivable to the amount the Company reasonably believes will be collected. For allother customers, the Company recognizes allowances for doubtful accounts based on the length of time thereceivables are past due, industry and geographic concentrations, the current business environment and itshistorical experience. Receivables are written off against these reserves in the period they are determined to beuncollectible.
Inventories
The Company values inventory at the lower of cost or market using the first-in, first-out (FIFO) method.Management assesses the recoverability of inventory based on types and levels of inventory held, forecasteddemand and changes in technology. These assessments require management judgments and estimates, andvaluation adjustments for excess and obsolete inventory may be recorded based on these assessments. TheCompany estimates excess and obsolescence exposures based upon assumptions about future demand, producttransitions, and market conditions and records reserves to reduce inventories to their estimated net realizable value.The failure to accurately forecast demand may lead to additional excess and obsolete inventory and future charges.
Goodwill
The Company accounts for goodwill in accordance with ASC Topic 350, ‘‘Intangibles—Goodwill and Other.’’ TheCompany identified several reporting units within each of its two operating segments. These are used to evaluatethe possible impairment of goodwill annually each fourth quarter and whenever events or circumstances indicate thecarrying value of goodwill may not be recoverable. When evaluating the potential impairment of goodwill, theCompany will first assess a range of qualitative factors, including but not limited to, industry conditions, thecompetitive environment, changes in the market for our products and services, entity specific factors such asstrategy and changes in key personnel, and the overall financial performance for each of our reporting units relativeto expected historical or projected future operating results. If after completing this assessment, it is determined thatit is more likely than not that the fair value of a reporting unit is less than its carrying value, the Company will thenproceed to a two-step impairment testing methodology using the income approach (discounted cash flow method).
In the first step of this testing methodology, we compare the carrying value of the reporting unit, includinggoodwill, with its fair value, as determined by its estimated discounted cash flows. If the carrying value of areporting unit exceeds its fair value, we then complete the second step of the impairment test to determine theamount of impairment to be recognized. In the second step, we estimate an implied fair value of the reporting unit’sgoodwill by allocating the fair value of the reporting unit to all of the assets and liabilities other than goodwill(including intangible assets). If the carrying value of a reporting unit’s goodwill exceeds its implied fair value, we
37
CHASE CORPORATION
NOTES TO CONSOLIDATED FINANCIAL STATEMENTS (Continued)
In thousands, except share and per share amounts
record an impairment loss equal to the difference in that period. The key assumptions incorporated in thediscounted cash flow approach include projected operating income, changes in working capital, projected capitalexpenditures, estimated terminal sales value and a discount rate equal to the assumed long-term cost of capital.Cash flows may be adjusted to exclude certain non-recurring or unusual items. The cash flow estimates used todetermine impairment, if any, contain management’s best estimates, using appropriate and customary assumptionsand projections at the time.
Intangible Assets
Intangible assets consist of patents, agreements, formulas, trade names, customer relationships andtrademarks. The Company capitalizes costs related to patent applications and technology agreements. The costs ofthese assets are amortized using the straight-line method over the lesser of the useful life of the asset or itsstatutory life. Capitalized costs are periodically reviewed for impairment whenever events or changes incircumstances indicate that the carrying amount of the asset may not be recoverable.
Property, Plant and Equipment
Property, plant and equipment are stated at cost and depreciated using the straight-line method over theassets’ estimated useful lives. Expenditures for maintenance repairs and minor renewals are charged to expense asincurred. Betterments and major renewals are capitalized. Upon retirement or other disposition of assets, relatedallowances for depreciation and amortization are eliminated from the accounts and any resulting gain or loss isincluded in the determination of income or loss. The estimated useful lives of property, plant and equipment are asfollows:
Buildings . . . . . . . . . . . . . . . . . . . . . . . . . . . . . . . . . . . . . . . . . . . . . . . 20 to 40 yearsMachinery and equipment . . . . . . . . . . . . . . . . . . . . . . . . . . . . . . . . . . . . 3 to 10 years
Leasehold improvements are depreciated over the lesser of the useful life or the term of the lease.
Restricted Investments and Deferred Compensation
The Company has a non-qualified deferred savings plan that covers its Board of Directors and selectedemployees. Participants may elect to defer a portion of their compensation for payment in a future tax year. Theplan is funded by trusteed assets that are restricted to the payment of deferred compensation or satisfaction of theCompany’s general creditors. The Company’s restricted investments and corresponding deferred compensationliability under the plan were $1,094 and $874 at August 31, 2013 and 2012, respectively. The Company accountsfor the restricted investments as available for sale by recording unrealized gains or losses in other comprehensiveincome as a component of stockholders’ equity.
Split-Dollar Life Insurance Arrangements
The net liability related to these postretirement benefits was calculated as the difference between the presentvalue of future premiums to be paid by the Company reduced by the present value of the expected proceeds to bereturned to the Company upon the insured’s death. The Company prepared its calculation by using mortalityassumptions which are based on the IRS 2013 Combined Static Mortality Table, and a 1.52% discount rate. TheCompany’s net liability related to these postretirement obligations was $56 and $48 at August 31, 2013 and2012, respectively.
Revenues
The Company recognizes revenue when persuasive evidence of an arrangement exists, performance of itsobligation is complete, its price to the buyer is fixed or determinable, and the Company is reasonably assured ofcollecting. This is typically at the time of shipment or upon receipt by the customer based on contractual terms. If aloss is anticipated on any contract, a provision for the entire loss is made immediately. Revenue recognition involvesjudgments and assessments of expected returns, and the likelihood of nonpayment by customers. The Company
38

CHASE CORPORATION
NOTES TO CONSOLIDATED FINANCIAL STATEMENTS (Continued)
In thousands, except share and per share amounts
analyzes various factors, including a review of specific customer contracts and shipment terms, historical experience,creditworthiness of customers and current market and economic conditions in determining when to recognizerevenue. Changes in judgments on these factors could impact the timing and amount of revenue recognized with aresulting impact on the timing and amount of operating income. Commissions are recognized when earned andpayments are received from the manufacturers represented. Royalty revenue is recognized based on licenseeproduction statements received from the authorized manufacturers. Billed shipping and handling fees are recordedas sales revenue with the associated costs recorded as costs of products and services sold.
The Company’s warranty policy provides that the products (or materials) delivered will meet its standardspecifications for the products or any other specifications as may be expressly agreed to at time of purchase. Allwarranty claims must be received within 90 days from the date of delivery, unless some other period has beenexpressly agreed to within the terms of the sales agreement. The Company’s warranty costs have historically beeninsignificant. The Company records a current liability for estimated warranty claims with a corresponding debit tocost of products and services sold based upon current and historical experience and upon specific claims issues asthey arise.
In addition, the Company offers certain sales incentives based on sales levels as they are earned.
Research and Product Development Costs
Research and product development costs are expensed as incurred and include primarily engineering salaries,overhead and materials used in connection with research and development projects. Research and developmentexpense amounted to $3,395, $2,958 and $2,452 for the years ended August 31, 2013, 2012 and 2011,respectively.
Pension Plan
The Company accounts for its pension plans following the requirements of ASC Topic 715, ‘‘Compensation—Retirement Benefits’’ (‘‘ASC 715’’). ASC 715 requires an employer to: (a) recognize in its statement of financialposition the funded status of a benefit plan; (b) measure defined benefit plan assets and obligations as of the endof the employer’s fiscal year (with limited exceptions); and (c) recognize as a component of other comprehensiveincome, net of tax, the gains or losses and prior service costs or credits that arise but are not recognized ascomponents of net periodic benefit costs pursuant to prior existing guidance.
Stock Based Compensation
In accordance with the accounting for stock based compensation guidance, the Company measures andrecognizes compensation expense for all share-based payment awards made to employees and directors based onestimated fair values. This includes restricted stock, restricted stock units and stock options. The guidance allows forthe continued use of the simplified method as the Company has concluded that its historical share option exerciseexperience does not provide a reasonable basis for estimating expected term. The Company uses the short cutmethod to calculate the historical windfall tax pool.
Stock-based compensation expense recognized in fiscal years 2013, 2012 and 2011 was $1,621, $2,040and $1,682, respectively.
The fair value of options granted was estimated on the date of grant using the Black-Scholes option pricingmodel with the following weighted average assumptions for the years ending August 31, 2013, 2012 and 2011:
2013 2012 2011
Expected Dividend yield . . . . . . . . . . . . . . . . . . . . . . . . . 2.2% 2.3% 2.0%Expected life . . . . . . . . . . . . . . . . . . . . . . . . . . . . . . . . 6.0 years 6.0 years 6.0 yearsExpected volatility . . . . . . . . . . . . . . . . . . . . . . . . . . . . . 33.0% 30.0% 30.0%Risk-free interest rate . . . . . . . . . . . . . . . . . . . . . . . . . . 1.6% 2.2% 2.5%
39
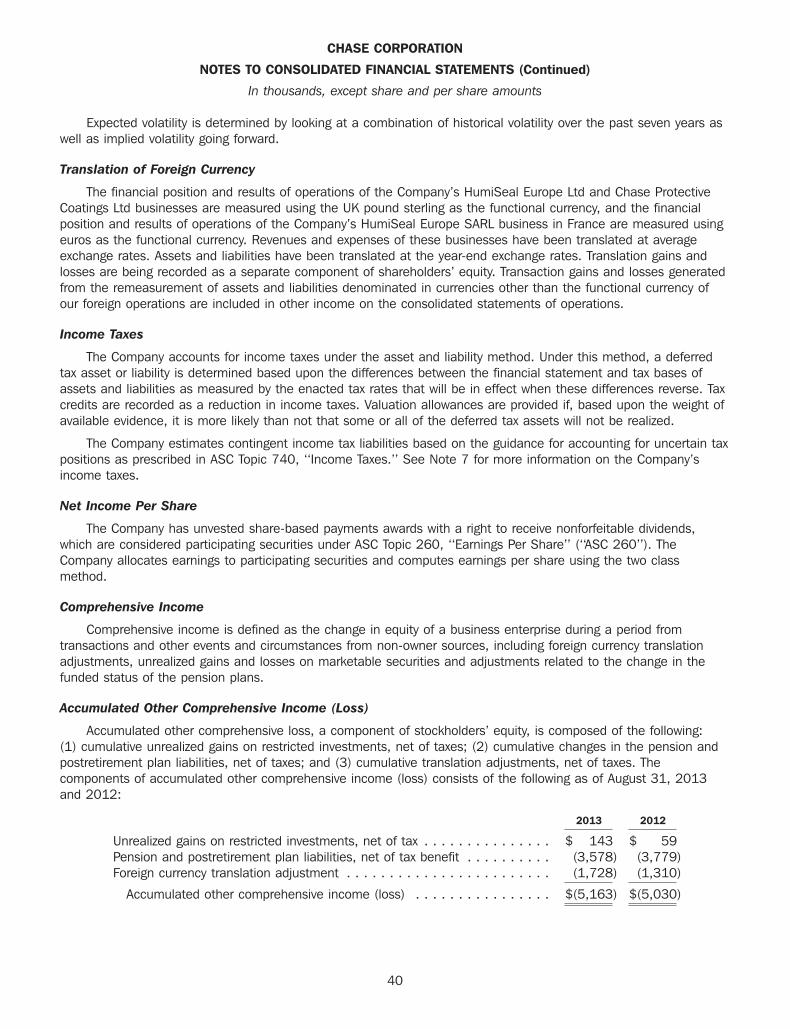
CHASE CORPORATION
NOTES TO CONSOLIDATED FINANCIAL STATEMENTS (Continued)
In thousands, except share and per share amounts
Expected volatility is determined by looking at a combination of historical volatility over the past seven years aswell as implied volatility going forward.
Translation of Foreign Currency
The financial position and results of operations of the Company’s HumiSeal Europe Ltd and Chase ProtectiveCoatings Ltd businesses are measured using the UK pound sterling as the functional currency, and the financialposition and results of operations of the Company’s HumiSeal Europe SARL business in France are measured usingeuros as the functional currency. Revenues and expenses of these businesses have been translated at averageexchange rates. Assets and liabilities have been translated at the year-end exchange rates. Translation gains andlosses are being recorded as a separate component of shareholders’ equity. Transaction gains and losses generatedfrom the remeasurement of assets and liabilities denominated in currencies other than the functional currency ofour foreign operations are included in other income on the consolidated statements of operations.
Income Taxes
The Company accounts for income taxes under the asset and liability method. Under this method, a deferredtax asset or liability is determined based upon the differences between the financial statement and tax bases ofassets and liabilities as measured by the enacted tax rates that will be in effect when these differences reverse. Taxcredits are recorded as a reduction in income taxes. Valuation allowances are provided if, based upon the weight ofavailable evidence, it is more likely than not that some or all of the deferred tax assets will not be realized.
The Company estimates contingent income tax liabilities based on the guidance for accounting for uncertain taxpositions as prescribed in ASC Topic 740, ‘‘Income Taxes.’’ See Note 7 for more information on the Company’sincome taxes.
Net Income Per Share
The Company has unvested share-based payments awards with a right to receive nonforfeitable dividends,which are considered participating securities under ASC Topic 260, ‘‘Earnings Per Share’’ (‘‘ASC 260’’). TheCompany allocates earnings to participating securities and computes earnings per share using the two classmethod.
Comprehensive Income
Comprehensive income is defined as the change in equity of a business enterprise during a period fromtransactions and other events and circumstances from non-owner sources, including foreign currency translationadjustments, unrealized gains and losses on marketable securities and adjustments related to the change in thefunded status of the pension plans.
Accumulated Other Comprehensive Income (Loss)
Accumulated other comprehensive loss, a component of stockholders’ equity, is composed of the following:(1) cumulative unrealized gains on restricted investments, net of taxes; (2) cumulative changes in the pension andpostretirement plan liabilities, net of taxes; and (3) cumulative translation adjustments, net of taxes. Thecomponents of accumulated other comprehensive income (loss) consists of the following as of August 31, 2013and 2012:
2013 2012
Unrealized gains on restricted investments, net of tax . . . . . . . . . . . . . . . $ 143 $ 59Pension and postretirement plan liabilities, net of tax benefit . . . . . . . . . . (3,578) (3,779)Foreign currency translation adjustment . . . . . . . . . . . . . . . . . . . . . . . . (1,728) (1,310)
Accumulated other comprehensive income (loss) . . . . . . . . . . . . . . . . $(5,163) $(5,030)
40
CHASE CORPORATION
NOTES TO CONSOLIDATED FINANCIAL STATEMENTS (Continued)
In thousands, except share and per share amounts
Non-controlling Interest
A legal entity is subject to the consolidation rules of ASC Topic 810, ‘‘Consolidations’’ (‘‘ASC 810’’) if the totalequity investment at risk is not sufficient to permit the legal entity to finance its activities without additionalsubordinated financial support or the equity investors lack certain specified characteristics of a controlling financialinterest. Based on the criteria in ASC 810, the Company determined that its joint venture agreement qualifies as avariable interest entity (‘‘VIE’’). The purpose of the joint venture is to combine the elements of NEPTCO’s and thejoint venture partner’s (an otherwise unrelated party) fiber optic strength element businesses. Under ASC 810, areporting entity shall consolidate a VIE when that reporting entity has a variable interest (or combination of variableinterests) that provides the reporting entity with a controlling financial interest. The reporting entity shall be deemedto have a controlling financial interest in a VIE if it has both of the following characteristics: a) the power to directthe activities of a VIE that most significantly impact the VIE’s economic performance; and b) the obligation toabsorb losses or right to receive benefits from the VIE that could potentially be significant to the VIE. The reportingentity that consolidates a VIE is called the ‘‘primary beneficiary’’ of that VIE. The Company determined that it is theprimary beneficiary of the VIE primarily due to Chase directing the activities that most significantly impact the VIE’seconomic performance, which is the actual management and operation of the joint venture and having theobligation to absorb losses and the right to receive benefits from the VIE that could potentially be significant to theVIE through our equity investment in the VIE. As a result, the Company has consolidated the operations of the jointventure in its consolidated financial statements.
Segments
The segment reporting topic of the Financial Accounting Standards Board (‘‘FASB’’) codification establishesstandards for reporting information about operating segments. The Company is organized into two operatingsegments, an Industrial Materials segment and a Construction Materials segment. The basis for this segmentation isdistinguished by the nature of the products and how they are delivered to their respective markets. The IndustrialMaterials segment reflects specified products that are used in or integrated into another company’s product withdemand dependent upon general economic conditions. Industrial Materials products include insulating andconducting materials for wire and cable manufacturers, moisture protective coatings for electronics and printingservices, laminated durable papers, and flexible composites and laminates for the packaging and industrial laminatemarkets. Effective with its acquisition in June 2012, the full listing of NEPTCO products and services are included inthe Industrial Materials segment. The Construction Materials segment reflects its construction project orientedproduct offerings which are primarily sold and used as ‘‘Chase’’ branded products in final form. ConstructionMaterials products include protective coatings for pipeline applications, coating and lining systems for use in liquidstorage and containment applications, high performance polymeric asphalt additives, and expansion and controljoint systems for use in the transportation and architectural markets.
Recently Issued Accounting Standards
In July 2012, the FASB issued ASU 2012-02, ‘‘Testing Indefinite-Lived Intangible Assets for Impairment.’’ ThisASU amends ASC 350, ‘‘Intangibles—Goodwill and Other’’ to allow entities an option to first assess qualitativefactors to determine whether it is necessary to perform the quantitative impairment test. Under that option, anentity no longer would be required to calculate the fair value of the intangible asset unless the entity determines,based on that qualitative assessment, that it is more likely than not that its fair value is less than its carryingamount. The amendments in this ASU are effective for annual and interim impairment tests performed for fiscalyears beginning after September 15, 2012, with early adoption permitted. The adoption of ASU 2012-02 did nothave an impact on the Company’s consolidated financial position, results of operations or cash flows.
In February 2013, the FASB issued ASU 2013-02, ‘‘Reporting of Amounts Reclassified Out of AccumulatedOther Comprehensive Income.’’ This ASU expands the presentation of changes in accumulated other comprehensiveincome. The new guidance requires an entity to disaggregate the total change of each component of othercomprehensive income either on the face of the net income statement or as a separate disclosure in the notes.ASU 2013-02 is effective for fiscal years beginning after December 15, 2012. The adoption of this ASU is only
41
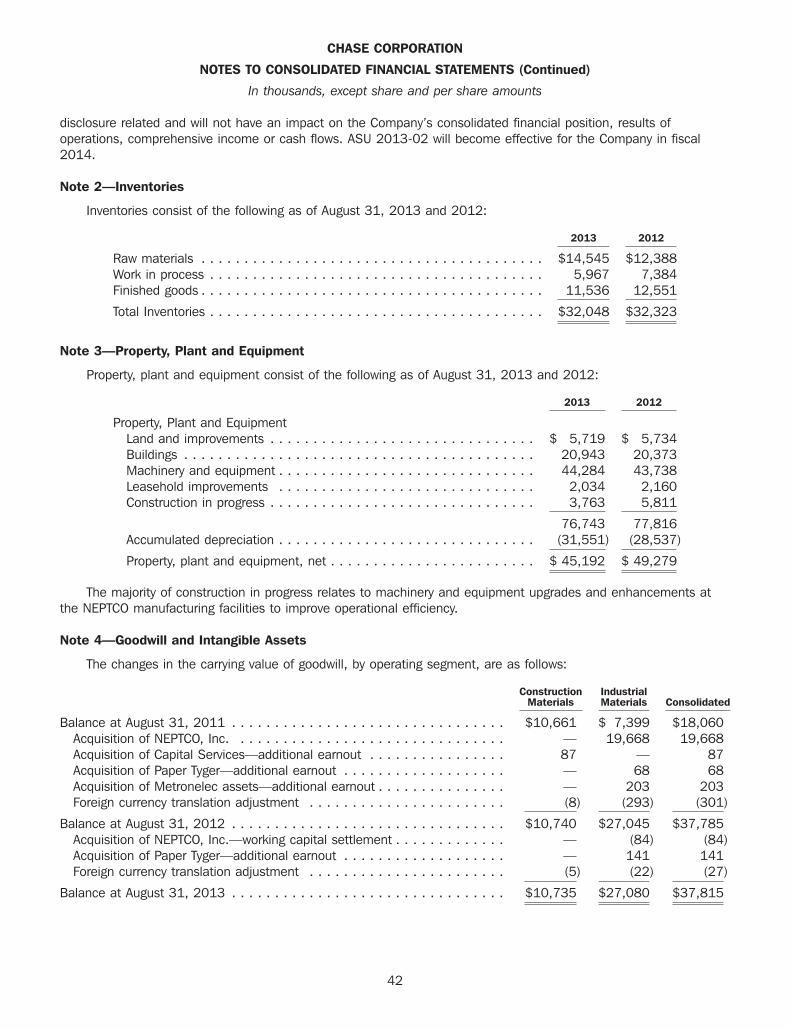
CHASE CORPORATION
NOTES TO CONSOLIDATED FINANCIAL STATEMENTS (Continued)
In thousands, except share and per share amounts
disclosure related and will not have an impact on the Company’s consolidated financial position, results ofoperations, comprehensive income or cash flows. ASU 2013-02 will become effective for the Company in fiscal2014.
Note 2—Inventories
Inventories consist of the following as of August 31, 2013 and 2012:
2013 2012
Raw materials . . . . . . . . . . . . . . . . . . . . . . . . . . . . . . . . . . . . . . . . $14,545 $12,388Work in process . . . . . . . . . . . . . . . . . . . . . . . . . . . . . . . . . . . . . . . 5,967 7,384Finished goods . . . . . . . . . . . . . . . . . . . . . . . . . . . . . . . . . . . . . . . . 11,536 12,551
Total Inventories . . . . . . . . . . . . . . . . . . . . . . . . . . . . . . . . . . . . . . . $32,048 $32,323
Note 3—Property, Plant and Equipment
Property, plant and equipment consist of the following as of August 31, 2013 and 2012:
2013 2012
Property, Plant and EquipmentLand and improvements . . . . . . . . . . . . . . . . . . . . . . . . . . . . . . . $ 5,719 $ 5,734Buildings . . . . . . . . . . . . . . . . . . . . . . . . . . . . . . . . . . . . . . . . . 20,943 20,373Machinery and equipment . . . . . . . . . . . . . . . . . . . . . . . . . . . . . . 44,284 43,738Leasehold improvements . . . . . . . . . . . . . . . . . . . . . . . . . . . . . . 2,034 2,160Construction in progress . . . . . . . . . . . . . . . . . . . . . . . . . . . . . . . 3,763 5,811
76,743 77,816Accumulated depreciation . . . . . . . . . . . . . . . . . . . . . . . . . . . . . . (31,551) (28,537)
Property, plant and equipment, net . . . . . . . . . . . . . . . . . . . . . . . . $ 45,192 $ 49,279
The majority of construction in progress relates to machinery and equipment upgrades and enhancements atthe NEPTCO manufacturing facilities to improve operational efficiency.
Note 4—Goodwill and Intangible Assets
The changes in the carrying value of goodwill, by operating segment, are as follows:
Construction IndustrialMaterials Materials Consolidated
Balance at August 31, 2011 . . . . . . . . . . . . . . . . . . . . . . . . . . . . . . . . $10,661 $ 7,399 $18,060Acquisition of NEPTCO, Inc. . . . . . . . . . . . . . . . . . . . . . . . . . . . . . . . — 19,668 19,668Acquisition of Capital Services—additional earnout . . . . . . . . . . . . . . . . 87 — 87Acquisition of Paper Tyger—additional earnout . . . . . . . . . . . . . . . . . . . — 68 68Acquisition of Metronelec assets—additional earnout . . . . . . . . . . . . . . . — 203 203Foreign currency translation adjustment . . . . . . . . . . . . . . . . . . . . . . . (8) (293) (301)
Balance at August 31, 2012 . . . . . . . . . . . . . . . . . . . . . . . . . . . . . . . . $10,740 $27,045 $37,785Acquisition of NEPTCO, Inc.—working capital settlement . . . . . . . . . . . . . — (84) (84)Acquisition of Paper Tyger—additional earnout . . . . . . . . . . . . . . . . . . . — 141 141Foreign currency translation adjustment . . . . . . . . . . . . . . . . . . . . . . . (5) (22) (27)
Balance at August 31, 2013 . . . . . . . . . . . . . . . . . . . . . . . . . . . . . . . . $10,735 $27,080 $37,815
42
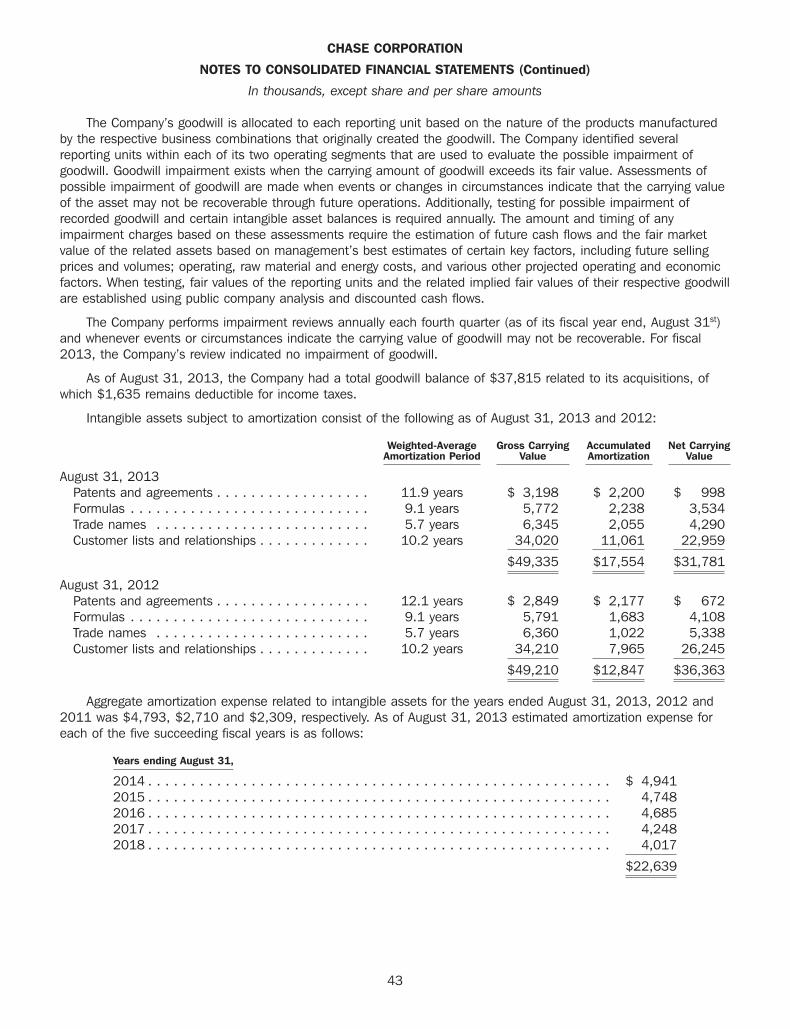
CHASE CORPORATION
NOTES TO CONSOLIDATED FINANCIAL STATEMENTS (Continued)
In thousands, except share and per share amounts
The Company’s goodwill is allocated to each reporting unit based on the nature of the products manufacturedby the respective business combinations that originally created the goodwill. The Company identified severalreporting units within each of its two operating segments that are used to evaluate the possible impairment ofgoodwill. Goodwill impairment exists when the carrying amount of goodwill exceeds its fair value. Assessments ofpossible impairment of goodwill are made when events or changes in circumstances indicate that the carrying valueof the asset may not be recoverable through future operations. Additionally, testing for possible impairment ofrecorded goodwill and certain intangible asset balances is required annually. The amount and timing of anyimpairment charges based on these assessments require the estimation of future cash flows and the fair marketvalue of the related assets based on management’s best estimates of certain key factors, including future sellingprices and volumes; operating, raw material and energy costs, and various other projected operating and economicfactors. When testing, fair values of the reporting units and the related implied fair values of their respective goodwillare established using public company analysis and discounted cash flows.
The Company performs impairment reviews annually each fourth quarter (as of its fiscal year end, August 31st)and whenever events or circumstances indicate the carrying value of goodwill may not be recoverable. For fiscal2013, the Company’s review indicated no impairment of goodwill.
As of August 31, 2013, the Company had a total goodwill balance of $37,815 related to its acquisitions, ofwhich $1,635 remains deductible for income taxes.
Intangible assets subject to amortization consist of the following as of August 31, 2013 and 2012:
Weighted-Average Gross Carrying Accumulated Net CarryingAmortization Period Value Amortization Value
August 31, 2013Patents and agreements . . . . . . . . . . . . . . . . . . 11.9 years $ 3,198 $ 2,200 $ 998Formulas . . . . . . . . . . . . . . . . . . . . . . . . . . . . 9.1 years 5,772 2,238 3,534Trade names . . . . . . . . . . . . . . . . . . . . . . . . . 5.7 years 6,345 2,055 4,290Customer lists and relationships . . . . . . . . . . . . . 10.2 years 34,020 11,061 22,959
$49,335 $17,554 $31,781
August 31, 2012Patents and agreements . . . . . . . . . . . . . . . . . . 12.1 years $ 2,849 $ 2,177 $ 672Formulas . . . . . . . . . . . . . . . . . . . . . . . . . . . . 9.1 years 5,791 1,683 4,108Trade names . . . . . . . . . . . . . . . . . . . . . . . . . 5.7 years 6,360 1,022 5,338Customer lists and relationships . . . . . . . . . . . . . 10.2 years 34,210 7,965 26,245
$49,210 $12,847 $36,363
Aggregate amortization expense related to intangible assets for the years ended August 31, 2013, 2012 and2011 was $4,793, $2,710 and $2,309, respectively. As of August 31, 2013 estimated amortization expense foreach of the five succeeding fiscal years is as follows:
Years ending August 31,
2014 . . . . . . . . . . . . . . . . . . . . . . . . . . . . . . . . . . . . . . . . . . . . . . . . . . . . . . $ 4,9412015 . . . . . . . . . . . . . . . . . . . . . . . . . . . . . . . . . . . . . . . . . . . . . . . . . . . . . . 4,7482016 . . . . . . . . . . . . . . . . . . . . . . . . . . . . . . . . . . . . . . . . . . . . . . . . . . . . . . 4,6852017 . . . . . . . . . . . . . . . . . . . . . . . . . . . . . . . . . . . . . . . . . . . . . . . . . . . . . . 4,2482018 . . . . . . . . . . . . . . . . . . . . . . . . . . . . . . . . . . . . . . . . . . . . . . . . . . . . . . 4,017
$22,639
43

CHASE CORPORATION
NOTES TO CONSOLIDATED FINANCIAL STATEMENTS (Continued)
In thousands, except share and per share amounts
Note 5—Cash Surrender Value of Life Insurance
Life insurance is provided under split dollar life insurance agreements whereby the Company will recover thepremiums paid from the proceeds of the policies. The Company recognizes an offset to expense for the growth inthe cash surrender value of the policies.
The Company recognized cash surrender value of life insurance policies, net of loans of $5 at August 31, 2013and 2012, secured by the policies, with the following carriers as of August 31, 2013 and 2012:
2013 2012
John Hancock . . . . . . . . . . . . . . . . . . . . . . . . . . . . . . . . . . . . . . . . . . $4,450 $4,343John Hancock (formerly Manufacturers’ Life Insurance Company) . . . . . . . . 1,009 954Metropolitan Life Insurance . . . . . . . . . . . . . . . . . . . . . . . . . . . . . . . . . 1,739 1,768Other life insurance carriers . . . . . . . . . . . . . . . . . . . . . . . . . . . . . . . . . 80 80
$7,278 $7,145
Subject to periodic review, the Company intends to maintain these policies through the lives or retirements ofthe insureds.
Note 6—Long-Term Debt and Notes Payable
Long-term debt consists of the following at August 31, 2013 and 2012:
2013 2012
Term note payable to bank in 19 quarterly installments that began inSeptember 2012. The principal amount of the quarterly installments is$1,400 through June 2014, increasing to $1,750 per quarterthereafter through June 2015, and to $2,100 per quarter thereafterthrough March 2017. Interest is payable monthly at LIBOR rate plus175 to 225 basis points, based upon the Company’s consolidatedleverage ratios (effective interest rate of 1.93% at August 31, 2013).Quarterly principal payments will continue through March 2017, andChase will repay the remaining principal balance plus any interest dueon the term note maturity date of June 27, 2017. . . . . . . . . . . . . . . $64,400 $70,000
64,400 70,000Less portion payable within one year classified as current . . . . . . . . . . . (5,600) (5,600)
Long-term debt, less current portion . . . . . . . . . . . . . . . . . . . . . . . . . . $58,800 $64,400
The Company has a revolving line of credit totaling $15,000 with Bank of America that bears interest atLondon Interbank Offered Rate (LIBOR) plus a range of 1.75% to 2.25%, depending on the consolidated leverageratio of Chase Corporation, or, at our option, at the bank’s base lending rate. As of August 31, 2013, the entireamount of $15,000 was available for use. The revolving line of credit is scheduled to mature in June 2017. Thisrevolving line of credit allows for increased flexibility for working capital requirements going forward, and we plan touse this availability to help finance our cash needs, including potential acquisitions, in fiscal 2014 and futureperiods.
Our credit agreement with Bank of America, which outlines the terms of both the term note payable and therevolving line of credit, contains customary affirmative and negative covenants that, among other things, restrict ourability to incur additional indebtedness. It also requires the Company to maintain a ratio of consolidatedindebtedness to consolidated EBITDA (each as defined in the agreement) of no more than 3.00 to 1.00, and tomaintain a consolidated fixed charge coverage ratio (as calculated in the agreement) of at least 1.25 to 1.00. TheCompany was in compliance with its debt covenants as of August 31, 2013.
44
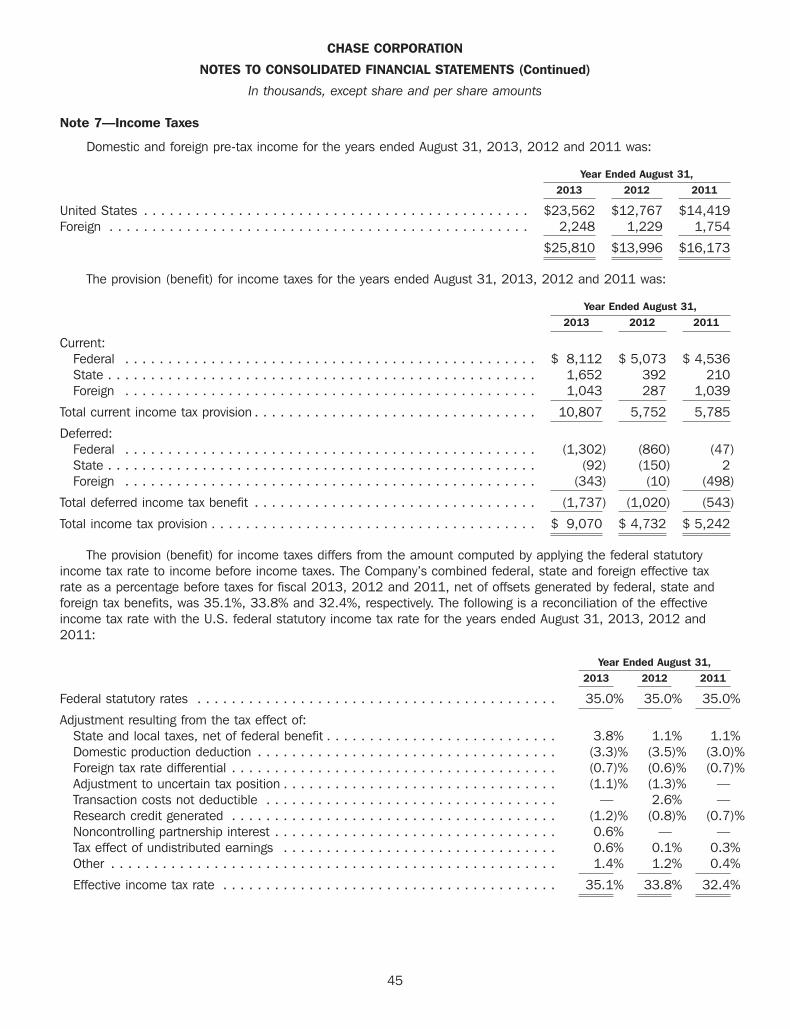
CHASE CORPORATION
NOTES TO CONSOLIDATED FINANCIAL STATEMENTS (Continued)
In thousands, except share and per share amounts
Note 7—Income Taxes
Domestic and foreign pre-tax income for the years ended August 31, 2013, 2012 and 2011 was:
Year Ended August 31,2013 2012 2011
United States . . . . . . . . . . . . . . . . . . . . . . . . . . . . . . . . . . . . . . . . . . . . . $23,562 $12,767 $14,419Foreign . . . . . . . . . . . . . . . . . . . . . . . . . . . . . . . . . . . . . . . . . . . . . . . . . 2,248 1,229 1,754
$25,810 $13,996 $16,173
The provision (benefit) for income taxes for the years ended August 31, 2013, 2012 and 2011 was:
Year Ended August 31,2013 2012 2011
Current:Federal . . . . . . . . . . . . . . . . . . . . . . . . . . . . . . . . . . . . . . . . . . . . . . . . $ 8,112 $ 5,073 $ 4,536State . . . . . . . . . . . . . . . . . . . . . . . . . . . . . . . . . . . . . . . . . . . . . . . . . . 1,652 392 210Foreign . . . . . . . . . . . . . . . . . . . . . . . . . . . . . . . . . . . . . . . . . . . . . . . . 1,043 287 1,039
Total current income tax provision . . . . . . . . . . . . . . . . . . . . . . . . . . . . . . . . . 10,807 5,752 5,785
Deferred:Federal . . . . . . . . . . . . . . . . . . . . . . . . . . . . . . . . . . . . . . . . . . . . . . . . (1,302) (860) (47)State . . . . . . . . . . . . . . . . . . . . . . . . . . . . . . . . . . . . . . . . . . . . . . . . . . (92) (150) 2Foreign . . . . . . . . . . . . . . . . . . . . . . . . . . . . . . . . . . . . . . . . . . . . . . . . (343) (10) (498)
Total deferred income tax benefit . . . . . . . . . . . . . . . . . . . . . . . . . . . . . . . . . (1,737) (1,020) (543)
Total income tax provision . . . . . . . . . . . . . . . . . . . . . . . . . . . . . . . . . . . . . . $ 9,070 $ 4,732 $ 5,242
The provision (benefit) for income taxes differs from the amount computed by applying the federal statutoryincome tax rate to income before income taxes. The Company’s combined federal, state and foreign effective taxrate as a percentage before taxes for fiscal 2013, 2012 and 2011, net of offsets generated by federal, state andforeign tax benefits, was 35.1%, 33.8% and 32.4%, respectively. The following is a reconciliation of the effectiveincome tax rate with the U.S. federal statutory income tax rate for the years ended August 31, 2013, 2012 and2011:
Year Ended August 31,2013 2012 2011
Federal statutory rates . . . . . . . . . . . . . . . . . . . . . . . . . . . . . . . . . . . . . . . . . . 35.0% 35.0% 35.0%
Adjustment resulting from the tax effect of:State and local taxes, net of federal benefit . . . . . . . . . . . . . . . . . . . . . . . . . . . 3.8% 1.1% 1.1%Domestic production deduction . . . . . . . . . . . . . . . . . . . . . . . . . . . . . . . . . . . (3.3)% (3.5)% (3.0)%Foreign tax rate differential . . . . . . . . . . . . . . . . . . . . . . . . . . . . . . . . . . . . . . (0.7)% (0.6)% (0.7)%Adjustment to uncertain tax position . . . . . . . . . . . . . . . . . . . . . . . . . . . . . . . . (1.1)% (1.3)% —Transaction costs not deductible . . . . . . . . . . . . . . . . . . . . . . . . . . . . . . . . . . — 2.6% —Research credit generated . . . . . . . . . . . . . . . . . . . . . . . . . . . . . . . . . . . . . . (1.2)% (0.8)% (0.7)%Noncontrolling partnership interest . . . . . . . . . . . . . . . . . . . . . . . . . . . . . . . . . 0.6% — —Tax effect of undistributed earnings . . . . . . . . . . . . . . . . . . . . . . . . . . . . . . . . 0.6% 0.1% 0.3%Other . . . . . . . . . . . . . . . . . . . . . . . . . . . . . . . . . . . . . . . . . . . . . . . . . . . . 1.4% 1.2% 0.4%
Effective income tax rate . . . . . . . . . . . . . . . . . . . . . . . . . . . . . . . . . . . . . . . 35.1% 33.8% 32.4%
45

CHASE CORPORATION
NOTES TO CONSOLIDATED FINANCIAL STATEMENTS (Continued)
In thousands, except share and per share amounts
The following table summarizes the tax effect of temporary differences on the Company’s income tax provision:
Year Ended August 31,2013 2012 2011
Current income tax provision . . . . . . . . . . . . . . . . . . . . . . . . . . . . . . . . . . . . $10,807 $ 5,752 $ 5,785
Deferred provision (benefit):Allowance for doubtful accounts . . . . . . . . . . . . . . . . . . . . . . . . . . . . . . . . (15) (39) 9Inventories . . . . . . . . . . . . . . . . . . . . . . . . . . . . . . . . . . . . . . . . . . . . . . (259) (640) (248)Pension expense . . . . . . . . . . . . . . . . . . . . . . . . . . . . . . . . . . . . . . . . . . (207) 446 210Deferred compensation . . . . . . . . . . . . . . . . . . . . . . . . . . . . . . . . . . . . . . (51) (70) (15)Loan finance costs . . . . . . . . . . . . . . . . . . . . . . . . . . . . . . . . . . . . . . . . . 66 (116) —Accruals . . . . . . . . . . . . . . . . . . . . . . . . . . . . . . . . . . . . . . . . . . . . . . . . 861 (177) (56)Warranty reserve . . . . . . . . . . . . . . . . . . . . . . . . . . . . . . . . . . . . . . . . . . — (56) (6)Depreciation and amortization . . . . . . . . . . . . . . . . . . . . . . . . . . . . . . . . . (1,836) (701) 66Restricted stock grant . . . . . . . . . . . . . . . . . . . . . . . . . . . . . . . . . . . . . . . (102) (74) (391)Unrepatriated earnings . . . . . . . . . . . . . . . . . . . . . . . . . . . . . . . . . . . . . . 1,572 (133) 1,137Foreign taxes net of unrepatriated earnings . . . . . . . . . . . . . . . . . . . . . . . . . (1,425) 497 (1,086)Foreign amortization . . . . . . . . . . . . . . . . . . . . . . . . . . . . . . . . . . . . . . . . (105) (134) (112)Other accrued expenses . . . . . . . . . . . . . . . . . . . . . . . . . . . . . . . . . . . . . (236) 177 (51)
Total deferred income tax benefit . . . . . . . . . . . . . . . . . . . . . . . . . . . . . . . . . (1,737) (1,020) (543)
Total income tax provision . . . . . . . . . . . . . . . . . . . . . . . . . . . . . . . . . . . . . . $ 9,070 $ 4,732 $ 5,242
46
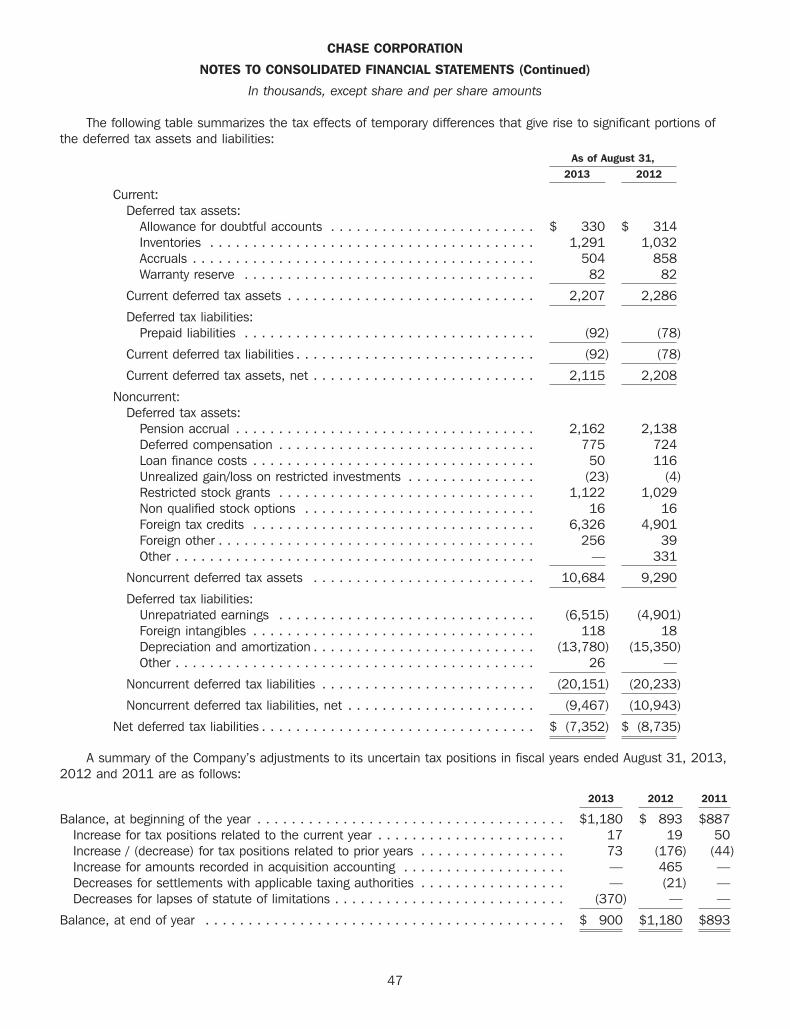
CHASE CORPORATION
NOTES TO CONSOLIDATED FINANCIAL STATEMENTS (Continued)
In thousands, except share and per share amounts
The following table summarizes the tax effects of temporary differences that give rise to significant portions ofthe deferred tax assets and liabilities:
As of August 31,2013 2012
Current:Deferred tax assets:
Allowance for doubtful accounts . . . . . . . . . . . . . . . . . . . . . . . . $ 330 $ 314Inventories . . . . . . . . . . . . . . . . . . . . . . . . . . . . . . . . . . . . . . 1,291 1,032Accruals . . . . . . . . . . . . . . . . . . . . . . . . . . . . . . . . . . . . . . . . 504 858Warranty reserve . . . . . . . . . . . . . . . . . . . . . . . . . . . . . . . . . . 82 82
Current deferred tax assets . . . . . . . . . . . . . . . . . . . . . . . . . . . . . 2,207 2,286
Deferred tax liabilities:Prepaid liabilities . . . . . . . . . . . . . . . . . . . . . . . . . . . . . . . . . . (92) (78)
Current deferred tax liabilities . . . . . . . . . . . . . . . . . . . . . . . . . . . . (92) (78)
Current deferred tax assets, net . . . . . . . . . . . . . . . . . . . . . . . . . . 2,115 2,208
Noncurrent:Deferred tax assets:
Pension accrual . . . . . . . . . . . . . . . . . . . . . . . . . . . . . . . . . . . 2,162 2,138Deferred compensation . . . . . . . . . . . . . . . . . . . . . . . . . . . . . . 775 724Loan finance costs . . . . . . . . . . . . . . . . . . . . . . . . . . . . . . . . . 50 116Unrealized gain/loss on restricted investments . . . . . . . . . . . . . . . (23) (4)Restricted stock grants . . . . . . . . . . . . . . . . . . . . . . . . . . . . . . 1,122 1,029Non qualified stock options . . . . . . . . . . . . . . . . . . . . . . . . . . . 16 16Foreign tax credits . . . . . . . . . . . . . . . . . . . . . . . . . . . . . . . . . 6,326 4,901Foreign other . . . . . . . . . . . . . . . . . . . . . . . . . . . . . . . . . . . . . 256 39Other . . . . . . . . . . . . . . . . . . . . . . . . . . . . . . . . . . . . . . . . . . — 331
Noncurrent deferred tax assets . . . . . . . . . . . . . . . . . . . . . . . . . . 10,684 9,290
Deferred tax liabilities:Unrepatriated earnings . . . . . . . . . . . . . . . . . . . . . . . . . . . . . . (6,515) (4,901)Foreign intangibles . . . . . . . . . . . . . . . . . . . . . . . . . . . . . . . . . 118 18Depreciation and amortization . . . . . . . . . . . . . . . . . . . . . . . . . . (13,780) (15,350)Other . . . . . . . . . . . . . . . . . . . . . . . . . . . . . . . . . . . . . . . . . . 26 —
Noncurrent deferred tax liabilities . . . . . . . . . . . . . . . . . . . . . . . . . (20,151) (20,233)
Noncurrent deferred tax liabilities, net . . . . . . . . . . . . . . . . . . . . . . (9,467) (10,943)
Net deferred tax liabilities . . . . . . . . . . . . . . . . . . . . . . . . . . . . . . . . $ (7,352) $ (8,735)
A summary of the Company’s adjustments to its uncertain tax positions in fiscal years ended August 31, 2013,2012 and 2011 are as follows:
2013 2012 2011
Balance, at beginning of the year . . . . . . . . . . . . . . . . . . . . . . . . . . . . . . . . . . . . $1,180 $ 893 $887Increase for tax positions related to the current year . . . . . . . . . . . . . . . . . . . . . . 17 19 50Increase / (decrease) for tax positions related to prior years . . . . . . . . . . . . . . . . . 73 (176) (44)Increase for amounts recorded in acquisition accounting . . . . . . . . . . . . . . . . . . . — 465 —Decreases for settlements with applicable taxing authorities . . . . . . . . . . . . . . . . . — (21) —Decreases for lapses of statute of limitations . . . . . . . . . . . . . . . . . . . . . . . . . . . (370) — —
Balance, at end of year . . . . . . . . . . . . . . . . . . . . . . . . . . . . . . . . . . . . . . . . . . $ 900 $1,180 $893
47
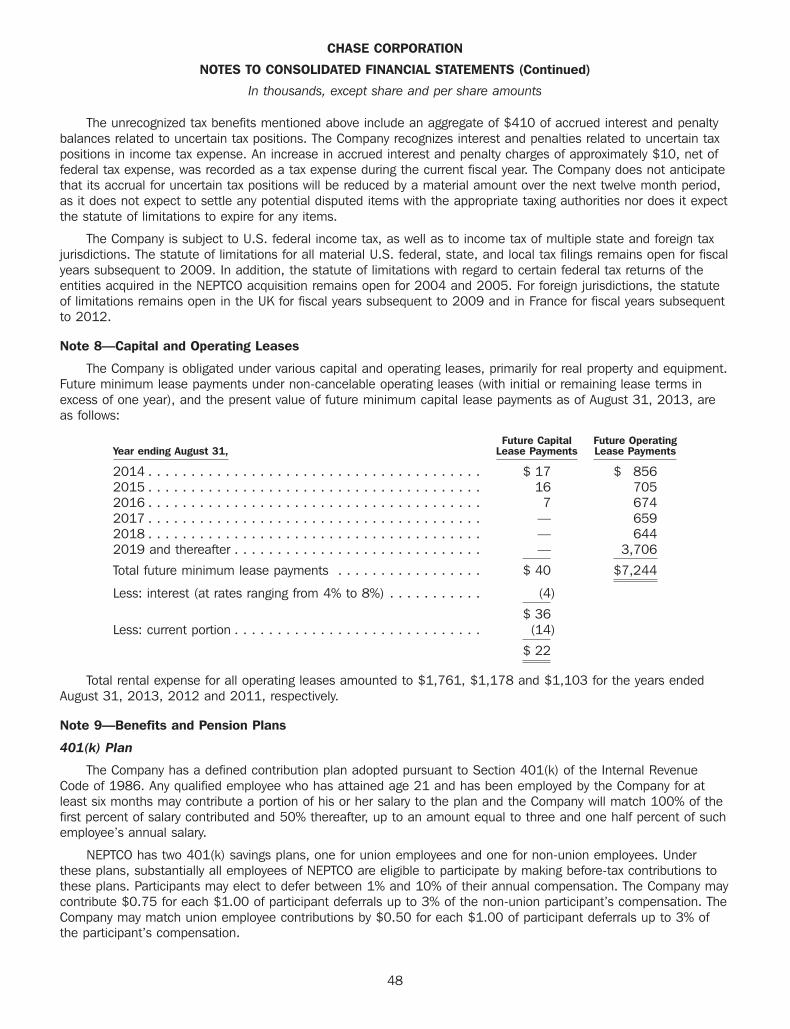
CHASE CORPORATION
NOTES TO CONSOLIDATED FINANCIAL STATEMENTS (Continued)
In thousands, except share and per share amounts
The unrecognized tax benefits mentioned above include an aggregate of $410 of accrued interest and penaltybalances related to uncertain tax positions. The Company recognizes interest and penalties related to uncertain taxpositions in income tax expense. An increase in accrued interest and penalty charges of approximately $10, net offederal tax expense, was recorded as a tax expense during the current fiscal year. The Company does not anticipatethat its accrual for uncertain tax positions will be reduced by a material amount over the next twelve month period,as it does not expect to settle any potential disputed items with the appropriate taxing authorities nor does it expectthe statute of limitations to expire for any items.
The Company is subject to U.S. federal income tax, as well as to income tax of multiple state and foreign taxjurisdictions. The statute of limitations for all material U.S. federal, state, and local tax filings remains open for fiscalyears subsequent to 2009. In addition, the statute of limitations with regard to certain federal tax returns of theentities acquired in the NEPTCO acquisition remains open for 2004 and 2005. For foreign jurisdictions, the statuteof limitations remains open in the UK for fiscal years subsequent to 2009 and in France for fiscal years subsequentto 2012.
Note 8—Capital and Operating Leases
The Company is obligated under various capital and operating leases, primarily for real property and equipment.Future minimum lease payments under non-cancelable operating leases (with initial or remaining lease terms inexcess of one year), and the present value of future minimum capital lease payments as of August 31, 2013, areas follows:
Future Capital Future OperatingYear ending August 31, Lease Payments Lease Payments
2014 . . . . . . . . . . . . . . . . . . . . . . . . . . . . . . . . . . . . . . . $ 17 $ 8562015 . . . . . . . . . . . . . . . . . . . . . . . . . . . . . . . . . . . . . . . 16 7052016 . . . . . . . . . . . . . . . . . . . . . . . . . . . . . . . . . . . . . . . 7 6742017 . . . . . . . . . . . . . . . . . . . . . . . . . . . . . . . . . . . . . . . — 6592018 . . . . . . . . . . . . . . . . . . . . . . . . . . . . . . . . . . . . . . . — 6442019 and thereafter . . . . . . . . . . . . . . . . . . . . . . . . . . . . . — 3,706
Total future minimum lease payments . . . . . . . . . . . . . . . . . $ 40 $7,244
Less: interest (at rates ranging from 4% to 8%) . . . . . . . . . . . (4)
$ 36Less: current portion . . . . . . . . . . . . . . . . . . . . . . . . . . . . . (14)
$ 22
Total rental expense for all operating leases amounted to $1,761, $1,178 and $1,103 for the years endedAugust 31, 2013, 2012 and 2011, respectively.
Note 9—Benefits and Pension Plans
401(k) Plan
The Company has a defined contribution plan adopted pursuant to Section 401(k) of the Internal RevenueCode of 1986. Any qualified employee who has attained age 21 and has been employed by the Company for atleast six months may contribute a portion of his or her salary to the plan and the Company will match 100% of thefirst percent of salary contributed and 50% thereafter, up to an amount equal to three and one half percent of suchemployee’s annual salary.
NEPTCO has two 401(k) savings plans, one for union employees and one for non-union employees. Underthese plans, substantially all employees of NEPTCO are eligible to participate by making before-tax contributions tothese plans. Participants may elect to defer between 1% and 10% of their annual compensation. The Company maycontribute $0.75 for each $1.00 of participant deferrals up to 3% of the non-union participant’s compensation. TheCompany may match union employee contributions by $0.50 for each $1.00 of participant deferrals up to 3% ofthe participant’s compensation.
48
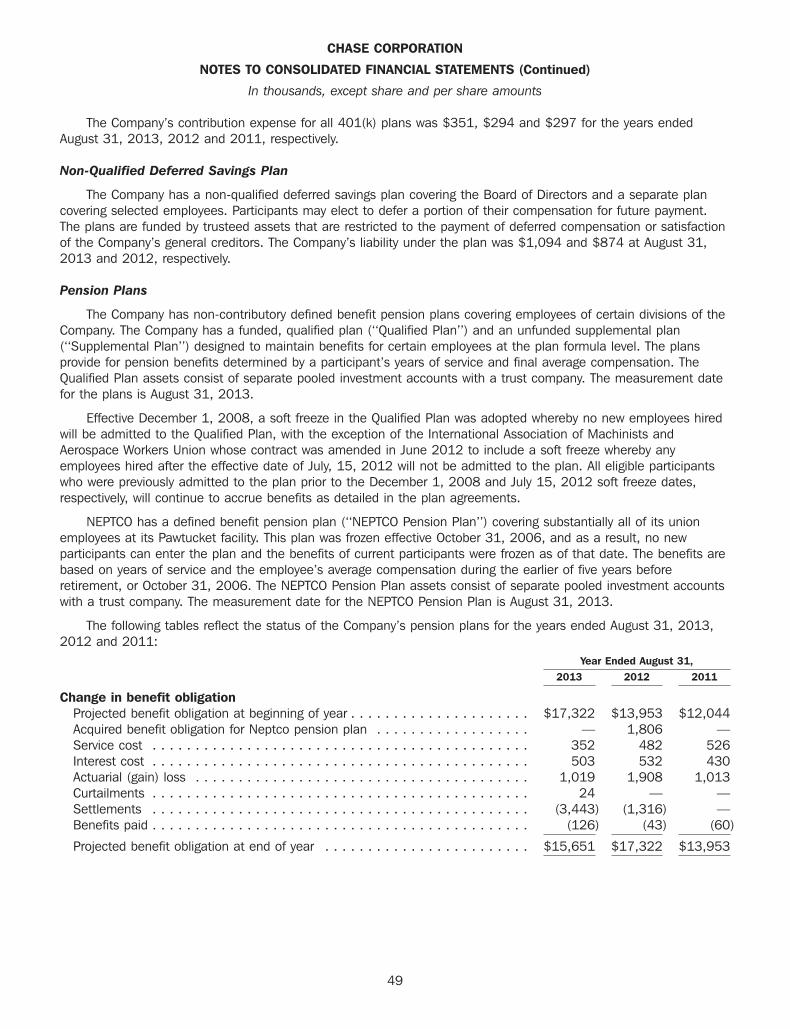
CHASE CORPORATION
NOTES TO CONSOLIDATED FINANCIAL STATEMENTS (Continued)
In thousands, except share and per share amounts
The Company’s contribution expense for all 401(k) plans was $351, $294 and $297 for the years endedAugust 31, 2013, 2012 and 2011, respectively.
Non-Qualified Deferred Savings Plan
The Company has a non-qualified deferred savings plan covering the Board of Directors and a separate plancovering selected employees. Participants may elect to defer a portion of their compensation for future payment.The plans are funded by trusteed assets that are restricted to the payment of deferred compensation or satisfactionof the Company’s general creditors. The Company’s liability under the plan was $1,094 and $874 at August 31,2013 and 2012, respectively.
Pension Plans
The Company has non-contributory defined benefit pension plans covering employees of certain divisions of theCompany. The Company has a funded, qualified plan (‘‘Qualified Plan’’) and an unfunded supplemental plan(‘‘Supplemental Plan’’) designed to maintain benefits for certain employees at the plan formula level. The plansprovide for pension benefits determined by a participant’s years of service and final average compensation. TheQualified Plan assets consist of separate pooled investment accounts with a trust company. The measurement datefor the plans is August 31, 2013.
Effective December 1, 2008, a soft freeze in the Qualified Plan was adopted whereby no new employees hiredwill be admitted to the Qualified Plan, with the exception of the International Association of Machinists andAerospace Workers Union whose contract was amended in June 2012 to include a soft freeze whereby anyemployees hired after the effective date of July, 15, 2012 will not be admitted to the plan. All eligible participantswho were previously admitted to the plan prior to the December 1, 2008 and July 15, 2012 soft freeze dates,respectively, will continue to accrue benefits as detailed in the plan agreements.
NEPTCO has a defined benefit pension plan (‘‘NEPTCO Pension Plan’’) covering substantially all of its unionemployees at its Pawtucket facility. This plan was frozen effective October 31, 2006, and as a result, no newparticipants can enter the plan and the benefits of current participants were frozen as of that date. The benefits arebased on years of service and the employee’s average compensation during the earlier of five years beforeretirement, or October 31, 2006. The NEPTCO Pension Plan assets consist of separate pooled investment accountswith a trust company. The measurement date for the NEPTCO Pension Plan is August 31, 2013.
The following tables reflect the status of the Company’s pension plans for the years ended August 31, 2013,2012 and 2011:
Year Ended August 31,2013 2012 2011
Change in benefit obligationProjected benefit obligation at beginning of year . . . . . . . . . . . . . . . . . . . . . $17,322 $13,953 $12,044Acquired benefit obligation for Neptco pension plan . . . . . . . . . . . . . . . . . . — 1,806 —Service cost . . . . . . . . . . . . . . . . . . . . . . . . . . . . . . . . . . . . . . . . . . . . 352 482 526Interest cost . . . . . . . . . . . . . . . . . . . . . . . . . . . . . . . . . . . . . . . . . . . . 503 532 430Actuarial (gain) loss . . . . . . . . . . . . . . . . . . . . . . . . . . . . . . . . . . . . . . . 1,019 1,908 1,013Curtailments . . . . . . . . . . . . . . . . . . . . . . . . . . . . . . . . . . . . . . . . . . . . 24 — —Settlements . . . . . . . . . . . . . . . . . . . . . . . . . . . . . . . . . . . . . . . . . . . . (3,443) (1,316) —Benefits paid . . . . . . . . . . . . . . . . . . . . . . . . . . . . . . . . . . . . . . . . . . . . (126) (43) (60)
Projected benefit obligation at end of year . . . . . . . . . . . . . . . . . . . . . . . . $15,651 $17,322 $13,953
49
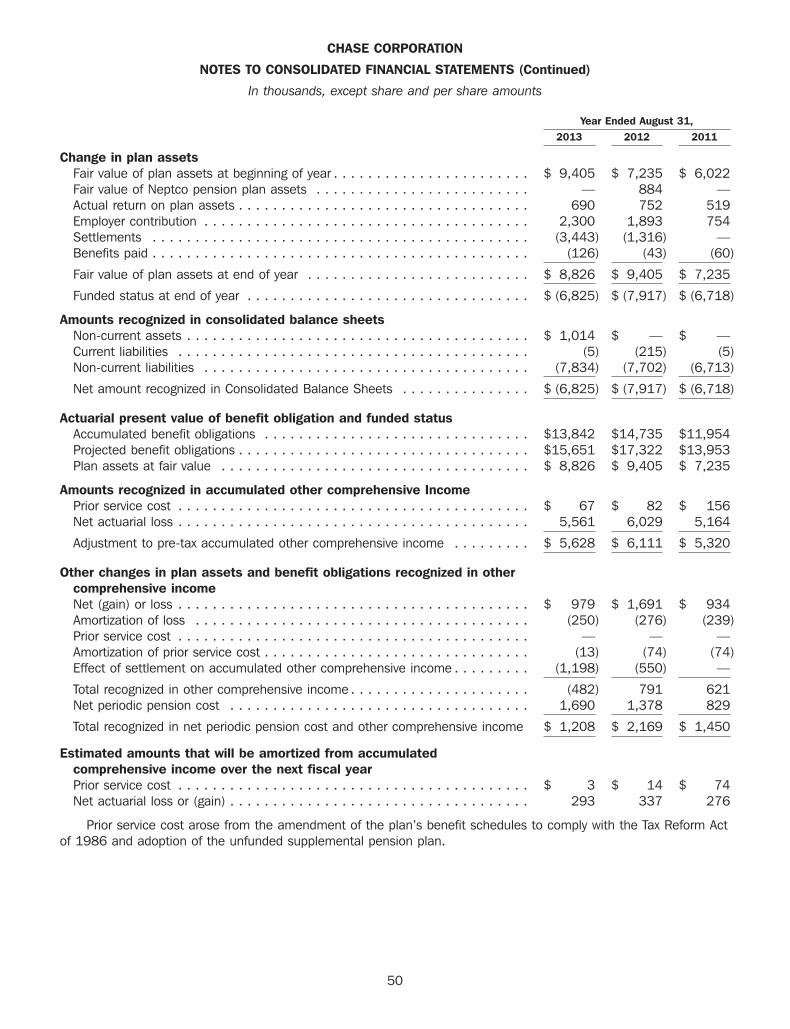
CHASE CORPORATION
NOTES TO CONSOLIDATED FINANCIAL STATEMENTS (Continued)
In thousands, except share and per share amounts
Year Ended August 31,2013 2012 2011
Change in plan assetsFair value of plan assets at beginning of year . . . . . . . . . . . . . . . . . . . . . . . $ 9,405 $ 7,235 $ 6,022Fair value of Neptco pension plan assets . . . . . . . . . . . . . . . . . . . . . . . . . — 884 —Actual return on plan assets . . . . . . . . . . . . . . . . . . . . . . . . . . . . . . . . . . 690 752 519Employer contribution . . . . . . . . . . . . . . . . . . . . . . . . . . . . . . . . . . . . . . 2,300 1,893 754Settlements . . . . . . . . . . . . . . . . . . . . . . . . . . . . . . . . . . . . . . . . . . . . (3,443) (1,316) —Benefits paid . . . . . . . . . . . . . . . . . . . . . . . . . . . . . . . . . . . . . . . . . . . . (126) (43) (60)
Fair value of plan assets at end of year . . . . . . . . . . . . . . . . . . . . . . . . . . $ 8,826 $ 9,405 $ 7,235
Funded status at end of year . . . . . . . . . . . . . . . . . . . . . . . . . . . . . . . . . $ (6,825) $ (7,917) $ (6,718)
Amounts recognized in consolidated balance sheetsNon-current assets . . . . . . . . . . . . . . . . . . . . . . . . . . . . . . . . . . . . . . . . $ 1,014 $ — $ —Current liabilities . . . . . . . . . . . . . . . . . . . . . . . . . . . . . . . . . . . . . . . . . (5) (215) (5)Non-current liabilities . . . . . . . . . . . . . . . . . . . . . . . . . . . . . . . . . . . . . . (7,834) (7,702) (6,713)
Net amount recognized in Consolidated Balance Sheets . . . . . . . . . . . . . . . $ (6,825) $ (7,917) $ (6,718)
Actuarial present value of benefit obligation and funded statusAccumulated benefit obligations . . . . . . . . . . . . . . . . . . . . . . . . . . . . . . . $13,842 $14,735 $11,954Projected benefit obligations . . . . . . . . . . . . . . . . . . . . . . . . . . . . . . . . . . $15,651 $17,322 $13,953Plan assets at fair value . . . . . . . . . . . . . . . . . . . . . . . . . . . . . . . . . . . . $ 8,826 $ 9,405 $ 7,235
Amounts recognized in accumulated other comprehensive IncomePrior service cost . . . . . . . . . . . . . . . . . . . . . . . . . . . . . . . . . . . . . . . . . $ 67 $ 82 $ 156Net actuarial loss . . . . . . . . . . . . . . . . . . . . . . . . . . . . . . . . . . . . . . . . . 5,561 6,029 5,164
Adjustment to pre-tax accumulated other comprehensive income . . . . . . . . . $ 5,628 $ 6,111 $ 5,320
Other changes in plan assets and benefit obligations recognized in othercomprehensive incomeNet (gain) or loss . . . . . . . . . . . . . . . . . . . . . . . . . . . . . . . . . . . . . . . . . $ 979 $ 1,691 $ 934Amortization of loss . . . . . . . . . . . . . . . . . . . . . . . . . . . . . . . . . . . . . . . (250) (276) (239)Prior service cost . . . . . . . . . . . . . . . . . . . . . . . . . . . . . . . . . . . . . . . . . — — —Amortization of prior service cost . . . . . . . . . . . . . . . . . . . . . . . . . . . . . . . (13) (74) (74)Effect of settlement on accumulated other comprehensive income . . . . . . . . . (1,198) (550) —
Total recognized in other comprehensive income . . . . . . . . . . . . . . . . . . . . . (482) 791 621Net periodic pension cost . . . . . . . . . . . . . . . . . . . . . . . . . . . . . . . . . . . 1,690 1,378 829
Total recognized in net periodic pension cost and other comprehensive income $ 1,208 $ 2,169 $ 1,450
Estimated amounts that will be amortized from accumulatedcomprehensive income over the next fiscal yearPrior service cost . . . . . . . . . . . . . . . . . . . . . . . . . . . . . . . . . . . . . . . . . $ 3 $ 14 $ 74Net actuarial loss or (gain) . . . . . . . . . . . . . . . . . . . . . . . . . . . . . . . . . . . 293 337 276
Prior service cost arose from the amendment of the plan’s benefit schedules to comply with the Tax Reform Actof 1986 and adoption of the unfunded supplemental pension plan.
50
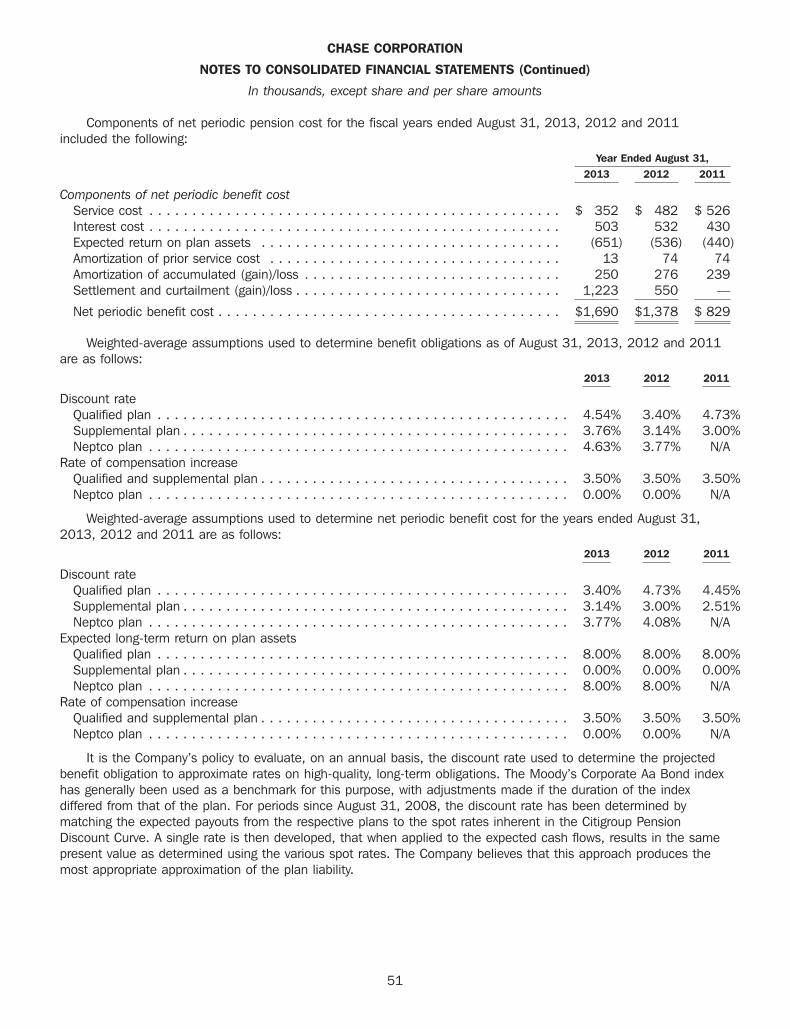
CHASE CORPORATION
NOTES TO CONSOLIDATED FINANCIAL STATEMENTS (Continued)
In thousands, except share and per share amounts
Components of net periodic pension cost for the fiscal years ended August 31, 2013, 2012 and 2011included the following:
Year Ended August 31,2013 2012 2011
Components of net periodic benefit costService cost . . . . . . . . . . . . . . . . . . . . . . . . . . . . . . . . . . . . . . . . . . . . . . . . $ 352 $ 482 $ 526Interest cost . . . . . . . . . . . . . . . . . . . . . . . . . . . . . . . . . . . . . . . . . . . . . . . . 503 532 430Expected return on plan assets . . . . . . . . . . . . . . . . . . . . . . . . . . . . . . . . . . . (651) (536) (440)Amortization of prior service cost . . . . . . . . . . . . . . . . . . . . . . . . . . . . . . . . . . 13 74 74Amortization of accumulated (gain)/loss . . . . . . . . . . . . . . . . . . . . . . . . . . . . . . 250 276 239Settlement and curtailment (gain)/loss . . . . . . . . . . . . . . . . . . . . . . . . . . . . . . . 1,223 550 —
Net periodic benefit cost . . . . . . . . . . . . . . . . . . . . . . . . . . . . . . . . . . . . . . . . $1,690 $1,378 $ 829
Weighted-average assumptions used to determine benefit obligations as of August 31, 2013, 2012 and 2011are as follows:
2013 2012 2011
Discount rateQualified plan . . . . . . . . . . . . . . . . . . . . . . . . . . . . . . . . . . . . . . . . . . . . . . . . 4.54% 3.40% 4.73%Supplemental plan . . . . . . . . . . . . . . . . . . . . . . . . . . . . . . . . . . . . . . . . . . . . . 3.76% 3.14% 3.00%Neptco plan . . . . . . . . . . . . . . . . . . . . . . . . . . . . . . . . . . . . . . . . . . . . . . . . . 4.63% 3.77% N/A
Rate of compensation increaseQualified and supplemental plan . . . . . . . . . . . . . . . . . . . . . . . . . . . . . . . . . . . . 3.50% 3.50% 3.50%Neptco plan . . . . . . . . . . . . . . . . . . . . . . . . . . . . . . . . . . . . . . . . . . . . . . . . . 0.00% 0.00% N/A
Weighted-average assumptions used to determine net periodic benefit cost for the years ended August 31,2013, 2012 and 2011 are as follows:
2013 2012 2011
Discount rateQualified plan . . . . . . . . . . . . . . . . . . . . . . . . . . . . . . . . . . . . . . . . . . . . . . . . 3.40% 4.73% 4.45%Supplemental plan . . . . . . . . . . . . . . . . . . . . . . . . . . . . . . . . . . . . . . . . . . . . . 3.14% 3.00% 2.51%Neptco plan . . . . . . . . . . . . . . . . . . . . . . . . . . . . . . . . . . . . . . . . . . . . . . . . . 3.77% 4.08% N/A
Expected long-term return on plan assetsQualified plan . . . . . . . . . . . . . . . . . . . . . . . . . . . . . . . . . . . . . . . . . . . . . . . . 8.00% 8.00% 8.00%Supplemental plan . . . . . . . . . . . . . . . . . . . . . . . . . . . . . . . . . . . . . . . . . . . . . 0.00% 0.00% 0.00%Neptco plan . . . . . . . . . . . . . . . . . . . . . . . . . . . . . . . . . . . . . . . . . . . . . . . . . 8.00% 8.00% N/A
Rate of compensation increaseQualified and supplemental plan . . . . . . . . . . . . . . . . . . . . . . . . . . . . . . . . . . . . 3.50% 3.50% 3.50%Neptco plan . . . . . . . . . . . . . . . . . . . . . . . . . . . . . . . . . . . . . . . . . . . . . . . . . 0.00% 0.00% N/A
It is the Company’s policy to evaluate, on an annual basis, the discount rate used to determine the projectedbenefit obligation to approximate rates on high-quality, long-term obligations. The Moody’s Corporate Aa Bond indexhas generally been used as a benchmark for this purpose, with adjustments made if the duration of the indexdiffered from that of the plan. For periods since August 31, 2008, the discount rate has been determined bymatching the expected payouts from the respective plans to the spot rates inherent in the Citigroup PensionDiscount Curve. A single rate is then developed, that when applied to the expected cash flows, results in the samepresent value as determined using the various spot rates. The Company believes that this approach produces themost appropriate approximation of the plan liability.
51
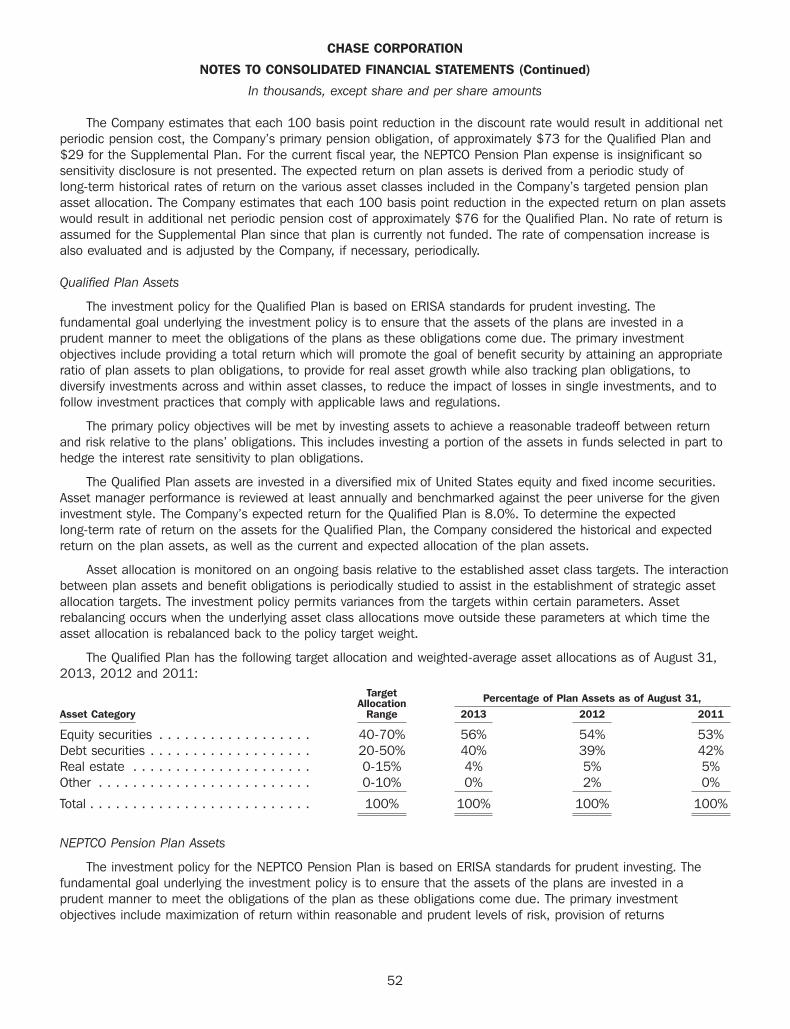
CHASE CORPORATION
NOTES TO CONSOLIDATED FINANCIAL STATEMENTS (Continued)
In thousands, except share and per share amounts
The Company estimates that each 100 basis point reduction in the discount rate would result in additional netperiodic pension cost, the Company’s primary pension obligation, of approximately $73 for the Qualified Plan and$29 for the Supplemental Plan. For the current fiscal year, the NEPTCO Pension Plan expense is insignificant sosensitivity disclosure is not presented. The expected return on plan assets is derived from a periodic study oflong-term historical rates of return on the various asset classes included in the Company’s targeted pension planasset allocation. The Company estimates that each 100 basis point reduction in the expected return on plan assetswould result in additional net periodic pension cost of approximately $76 for the Qualified Plan. No rate of return isassumed for the Supplemental Plan since that plan is currently not funded. The rate of compensation increase isalso evaluated and is adjusted by the Company, if necessary, periodically.
Qualified Plan Assets
The investment policy for the Qualified Plan is based on ERISA standards for prudent investing. Thefundamental goal underlying the investment policy is to ensure that the assets of the plans are invested in aprudent manner to meet the obligations of the plans as these obligations come due. The primary investmentobjectives include providing a total return which will promote the goal of benefit security by attaining an appropriateratio of plan assets to plan obligations, to provide for real asset growth while also tracking plan obligations, todiversify investments across and within asset classes, to reduce the impact of losses in single investments, and tofollow investment practices that comply with applicable laws and regulations.
The primary policy objectives will be met by investing assets to achieve a reasonable tradeoff between returnand risk relative to the plans’ obligations. This includes investing a portion of the assets in funds selected in part tohedge the interest rate sensitivity to plan obligations.
The Qualified Plan assets are invested in a diversified mix of United States equity and fixed income securities.Asset manager performance is reviewed at least annually and benchmarked against the peer universe for the giveninvestment style. The Company’s expected return for the Qualified Plan is 8.0%. To determine the expectedlong-term rate of return on the assets for the Qualified Plan, the Company considered the historical and expectedreturn on the plan assets, as well as the current and expected allocation of the plan assets.
Asset allocation is monitored on an ongoing basis relative to the established asset class targets. The interactionbetween plan assets and benefit obligations is periodically studied to assist in the establishment of strategic assetallocation targets. The investment policy permits variances from the targets within certain parameters. Assetrebalancing occurs when the underlying asset class allocations move outside these parameters at which time theasset allocation is rebalanced back to the policy target weight.
The Qualified Plan has the following target allocation and weighted-average asset allocations as of August 31,2013, 2012 and 2011:
Target Percentage of Plan Assets as of August 31,AllocationAsset Category Range 2013 2012 2011
Equity securities . . . . . . . . . . . . . . . . . . 40-70% 56% 54% 53%Debt securities . . . . . . . . . . . . . . . . . . . 20-50% 40% 39% 42%Real estate . . . . . . . . . . . . . . . . . . . . . 0-15% 4% 5% 5%Other . . . . . . . . . . . . . . . . . . . . . . . . . 0-10% 0% 2% 0%
Total . . . . . . . . . . . . . . . . . . . . . . . . . . 100% 100% 100% 100%
NEPTCO Pension Plan Assets
The investment policy for the NEPTCO Pension Plan is based on ERISA standards for prudent investing. Thefundamental goal underlying the investment policy is to ensure that the assets of the plans are invested in aprudent manner to meet the obligations of the plan as these obligations come due. The primary investmentobjectives include maximization of return within reasonable and prudent levels of risk, provision of returns
52
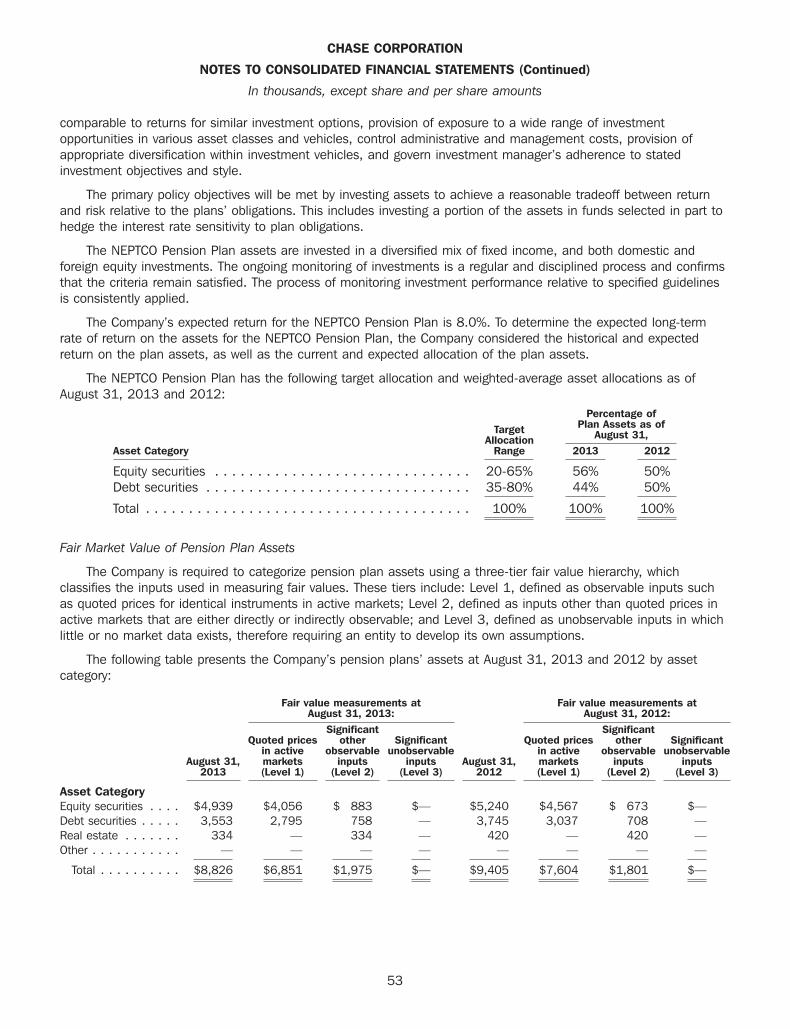
CHASE CORPORATION
NOTES TO CONSOLIDATED FINANCIAL STATEMENTS (Continued)
In thousands, except share and per share amounts
comparable to returns for similar investment options, provision of exposure to a wide range of investmentopportunities in various asset classes and vehicles, control administrative and management costs, provision ofappropriate diversification within investment vehicles, and govern investment manager’s adherence to statedinvestment objectives and style.
The primary policy objectives will be met by investing assets to achieve a reasonable tradeoff between returnand risk relative to the plans’ obligations. This includes investing a portion of the assets in funds selected in part tohedge the interest rate sensitivity to plan obligations.
The NEPTCO Pension Plan assets are invested in a diversified mix of fixed income, and both domestic andforeign equity investments. The ongoing monitoring of investments is a regular and disciplined process and confirmsthat the criteria remain satisfied. The process of monitoring investment performance relative to specified guidelinesis consistently applied.
The Company’s expected return for the NEPTCO Pension Plan is 8.0%. To determine the expected long-termrate of return on the assets for the NEPTCO Pension Plan, the Company considered the historical and expectedreturn on the plan assets, as well as the current and expected allocation of the plan assets.
The NEPTCO Pension Plan has the following target allocation and weighted-average asset allocations as ofAugust 31, 2013 and 2012:
Percentage ofPlan Assets as ofTarget August 31,Allocation
Asset Category Range 2013 2012
Equity securities . . . . . . . . . . . . . . . . . . . . . . . . . . . . . . 20-65% 56% 50%Debt securities . . . . . . . . . . . . . . . . . . . . . . . . . . . . . . . 35-80% 44% 50%
Total . . . . . . . . . . . . . . . . . . . . . . . . . . . . . . . . . . . . . . 100% 100% 100%
Fair Market Value of Pension Plan Assets
The Company is required to categorize pension plan assets using a three-tier fair value hierarchy, whichclassifies the inputs used in measuring fair values. These tiers include: Level 1, defined as observable inputs suchas quoted prices for identical instruments in active markets; Level 2, defined as inputs other than quoted prices inactive markets that are either directly or indirectly observable; and Level 3, defined as unobservable inputs in whichlittle or no market data exists, therefore requiring an entity to develop its own assumptions.
The following table presents the Company’s pension plans’ assets at August 31, 2013 and 2012 by assetcategory:
Fair value measurements at Fair value measurements atAugust 31, 2013: August 31, 2012:
Significant SignificantQuoted prices other Significant Quoted prices other Significant
in active observable unobservable in active observable unobservableAugust 31, markets inputs inputs August 31, markets inputs inputs
2013 (Level 1) (Level 2) (Level 3) 2012 (Level 1) (Level 2) (Level 3)
Asset CategoryEquity securities . . . . $4,939 $4,056 $ 883 $— $5,240 $4,567 $ 673 $—Debt securities . . . . . 3,553 2,795 758 — 3,745 3,037 708 —Real estate . . . . . . . 334 — 334 — 420 — 420 —Other . . . . . . . . . . . — — — — — — — —
Total . . . . . . . . . . $8,826 $6,851 $1,975 $— $9,405 $7,604 $1,801 $—
53

CHASE CORPORATION
NOTES TO CONSOLIDATED FINANCIAL STATEMENTS (Continued)
In thousands, except share and per share amounts
Level 1 Assets: The fair values of the common stocks, corporate bonds and U.S. Government securitiesincluded in this tier are based on the closing price reported on the active market where the individual securities aretraded.
Level 2 Assets: The fair values of the common/collective trust funds included in this tier are not traded onactive markets. These common/collective trust funds are valued based on the calculated unit values. The unit valuesare based on the fair value of the underlying assets of the common/collective trust funds derived from inputsprincipally based on quoted market prices in an active market or corroborated by observable market data bycorrelation or other means.
Estimated Future Benefit Payments
The following pension benefit payments (which include expected future service) are assumed to be paid in eachof the following fiscal years based on the participants’ normal retirement age:
Year ending August 31, Pension Benefits
2014 . . . . . . . . . . . . . . . . . . . . . . . . . . . . . . . . . . . . . . . . . . . . . . . . . . $7,6672015 . . . . . . . . . . . . . . . . . . . . . . . . . . . . . . . . . . . . . . . . . . . . . . . . . . 2622016 . . . . . . . . . . . . . . . . . . . . . . . . . . . . . . . . . . . . . . . . . . . . . . . . . . 2772017 . . . . . . . . . . . . . . . . . . . . . . . . . . . . . . . . . . . . . . . . . . . . . . . . . . 3572018 . . . . . . . . . . . . . . . . . . . . . . . . . . . . . . . . . . . . . . . . . . . . . . . . . . 7712019-2023 . . . . . . . . . . . . . . . . . . . . . . . . . . . . . . . . . . . . . . . . . . . . . . $2,820
The Company contributed $2,300, $1,893 and $754 to fund its obligations under the pension plans for theyears ended August 31, 2013, 2012 and 2011, respectively. The Company plans to make the necessarycontributions during fiscal 2014 to ensure their pension plans continue to be adequately funded given the currentmarket conditions.
Note 10—Stockholders’ Equity
2013 Equity Incentive Plan
In October 2012, the Company adopted and the stockholders subsequently approved the 2013 Equity IncentivePlan (the ‘‘2013 Plan’’). The 2013 Plan permits the grant of restricted stock, stock options, deferred stock, stockpayments or other awards to employees, participating officers, directors, consultants and advisors who are linkeddirectly to increases in shareholder value. The aggregate number of shares available for grant under the 2013 Planis 1,200,000. Additional shares may become available in connection with share splits, share dividends or similartransactions. As of August 31, 2013, the Company had not yet made any awards under the 2013 Plan.
2005 Incentive Plan
In November 2005, the Company adopted and the stockholders subsequently approved the 2005 IncentivePlan (the ‘‘2005 Plan’’). The 2005 Plan permits the grant of restricted stock, stock options, deferred stock, stockpayments or other awards to employees, participating officers, directors, consultants and advisors who are linkeddirectly to increases in shareholder value. The aggregate number of shares available for grant under the 2005 Planwas initially 1,000,000. Additional shares may become available in connection with share splits, share dividends orsimilar transactions. As of August 31, 2013, 77,174 shares remained available for future grant under the 2005Plan.
2001 Senior Management Stock Plan and 2001 Non-Employee Director Stock Option Plan
In October 2002, the Company adopted, and the stockholders subsequently approved, the 2001 SeniorManagement Stock Plan and the 2001 Non-Employee Director Stock Option Plan (the ‘‘2001 Plans’’). The2001 Plans reserved 1,500,000 and 180,000 shares of the Company’s common stock for grants related to theSenior Management Stock Plan and Non-Employee Director Stock Option Plan, respectively.
54

CHASE CORPORATION
NOTES TO CONSOLIDATED FINANCIAL STATEMENTS (Continued)
In thousands, except share and per share amounts
Under the terms of the Senior Management Stock Plan, equity awards may be granted in the form of incentivestock options, non-qualified stock options and restricted stock. Options granted under the Non-Employee DirectorStock Option Plan were issued as non-qualified stock options. Options granted under the 2001 Plans generally vestover a period ranging from three to five years and expire after ten years.
The Company is no longer granting equity awards under the 2001 Plans.
Restricted Stock
Employees and Executive Management
In August 2008, the Board of Directors of the Company approved a plan for issuing a performance and servicebased restricted stock grant of 50,657 shares in the aggregate, subject to adjustment, to key members ofmanagement with an issue date of September 1, 2008 and a vesting date of August 31, 2011. Based on the fiscalyear 2009 financial results, the aggregate size of the grant was reduced by 15,944 shares of restricted stocksubsequent to the end of fiscal year 2009 in accordance with the performance measurement criteria. The adjustedrestricted stock award of 34,713 shares was issued in the form of common stock on August 31, 2011 uponvesting. Compensation expense was recognized on a ratable basis over the vesting period.
In August 2009, the Board of Directors of Chase Corporation approved a plan for issuing a performance andservice based restricted stock grant of 76,874 shares in the aggregate, subject to adjustment, to key members ofmanagement with an issue date of September 1, 2009 and a vesting date of August 31, 2012. Based on the fiscalyear 2010 financial results, 68,453 additional shares of restricted stock were earned and granted subsequent tothe end of fiscal year 2010 in accordance with the performance measurement criteria. The adjusted restricted stockaward of 145,327 shares was issued in the form of common stock on August 31, 2012 upon vesting.Compensation expense was recognized on a ratable basis over the vesting period.
In December 2009, restricted stock in amounts of 2,377 and 8,421 shares related to the September 2008and 2009 grants, respectively, were forfeited in conjunction with the retirement of an executive officer of theCompany.
In August 2010, the Board of Directors of the Company approved the fiscal year 2011 Long Term IncentivePlan (‘‘LTIP’’) for the executive officers. The fiscal 2011 LTIP is an equity based plan with a grant date ofSeptember 1, 2010. In addition to the stock option component described below, the plan contained the followingrestricted stock components: (a) a performance and service based restricted stock grant of 32,835 shares in theaggregate, subject to adjustment, with a vesting date of August 31, 2013, for which compensation expense wasrecognized on a ratable basis over the vesting period based on quarterly probability assessments; and (b) atime-based restricted stock grant of 16,417 shares in the aggregate, and a vesting date of August 31, 2013, forwhich compensation expense was recognized on a ratable basis over the vesting period.
Based on the fiscal year 2011 financial results, 32,835 additional shares of restricted stock (total of 65,670shares) were earned and granted subsequent to the end of fiscal year 2011 in accordance with the performancemeasurement criteria. No further performance-based measurements apply to this award.
In April 2011, the Board of Directors of the Company approved a plan for issuing a time-based restricted stockgrant of 4,249 shares in the aggregate to certain non-executive officer employees, with an issue date of April 30,2011 and a vesting date of April 30, 2014. Compensation expense is being recognized on a ratable basis over thevesting period.
In August 2011, the Board of Directors of the Company approved the fiscal year 2012 LTIP for the executiveofficers. The fiscal 2012 LTIP is an equity based plan with a grant date of September 1, 2011. In addition to thestock option component described below, the plan contained the following restricted stock components: (a) aperformance and service based restricted stock grant of 33,798 shares in the aggregate, subject to adjustment,with a vesting date of August 31, 2014, for which compensation expense is recognized on a ratable basis over thevesting period based on quarterly probability assessments; and (b) a time-based restricted stock grant of 16,899
55
CHASE CORPORATION
NOTES TO CONSOLIDATED FINANCIAL STATEMENTS (Continued)
In thousands, except share and per share amounts
shares in the aggregate, and a vesting date of August 31, 2014, for which compensation expense is recognized ona ratable basis over the vesting period.
Based on the fiscal year 2012 financial results, 33,798 additional shares of restricted stock (total of 67,596shares) were earned and granted subsequent to the end of fiscal year 2012 in accordance with the performancemeasurement criteria. No further performance-based measurements apply to this award.
In August 2011, the Board of Directors of the Company approved a plan for issuing a time-based restrictedstock grant of 5,037 shares in the aggregate to certain non-executive officer employees, with an issue date ofSeptember 1, 2011 and a vesting date of August 31, 2014. Compensation expense is being recognized on aratable basis over the vesting period.
In December 2011, restricted stock in the amount of 1,887 shares related to the April 2011 grant wasforfeited in conjunction with the termination of employment of a non-executive officer of the Company.
In March 2012, the Board of Directors of the Company approved a plan for issuing a time-based restrictedstock grant of 1,368 shares to a non-executive officer employee, with an issue date of March 8, 2012 and avesting date of August 31, 2012. Compensation expense was recognized on a ratable basis over the vesting period.
In October 2012, the Board of Directors of the Company approved the fiscal year 2013 LTIP for the executiveofficers and other members of management. The 2013 LTIP is an equity based plan with a grant date ofOctober 22, 2012. In addition to the stock option component described below, the plan contained the followingrestricted stock components: (a) a performance and service based restricted stock grant of 11,861 shares in theaggregate, subject to adjustment, with a vesting date of August 31, 2014, for which compensation expense isrecognized on a ratable basis over the vesting period based on quarterly probability assessments; and (b) atime-based restricted stock grant of 16,505 and 1,931 shares in the aggregate, with a vesting date of August 31,2015 and August 31, 2013, respectively, for which compensation expense is recognized on a ratable basis over thevesting period.
Non-Employee Board of Directors
In January 2010, non-employee members of the Board received a total grant of 11,092 shares of restrictedstock for service for the period from January 30, 2010 through January 30, 2011. The shares of restricted stockvested at the conclusion of this service period. Compensation was recognized on a ratable basis over the twelvemonth vesting period.
In February 2011, non-employee members of the Board received a total grant of 11,031 shares of restrictedstock for service for the period from January 31, 2011 through January 31, 2012. The shares of restricted stockvested at the conclusion of this service period. Compensation was recognized on a ratable basis over the twelvemonth vesting period.
In February 2012, non-employee members of the Board received a total grant of 10,085 shares of restrictedstock for service for the period from January 31, 2012 through January 31, 2013. The shares of restricted stockvested at the conclusion of the service period. Compensation was recognized on a ratable basis over the twelvemonth vesting period.
Beginning in 2013, the annual retainer for non-employee members of the Board of Directors includes acombined total of $144 of Chase Corporation common stock, in the form of restricted stock valued in conjunctionwith the start of the new year of board service which generally coincides with the Company’s annual shareholdermeeting. The stock award vests one year from the date of grant. In February 2013, non-employee members of theBoard received a total grant of 7,706 shares of restricted stock for service for the period from January 31, 2013through January 31, 2014. The shares of restricted stock will vest at the conclusion of this service period.Compensation is being recognized on a ratable basis over the twelve month vesting period.
56
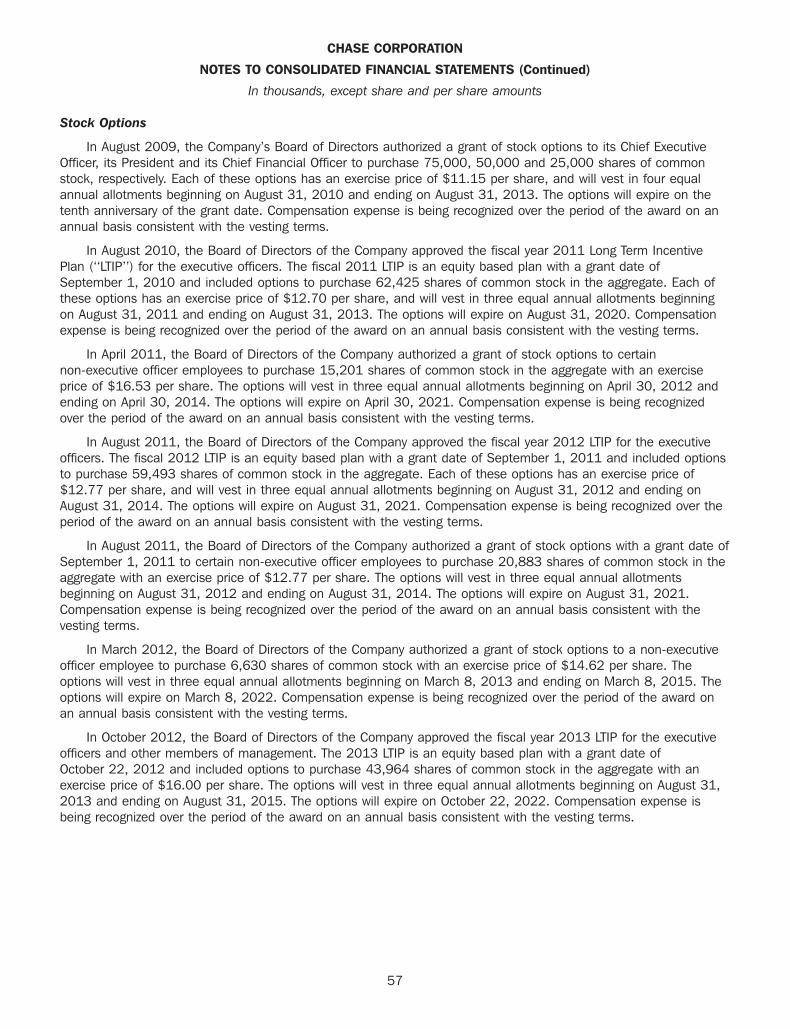
CHASE CORPORATION
NOTES TO CONSOLIDATED FINANCIAL STATEMENTS (Continued)
In thousands, except share and per share amounts
Stock Options
In August 2009, the Company’s Board of Directors authorized a grant of stock options to its Chief ExecutiveOfficer, its President and its Chief Financial Officer to purchase 75,000, 50,000 and 25,000 shares of commonstock, respectively. Each of these options has an exercise price of $11.15 per share, and will vest in four equalannual allotments beginning on August 31, 2010 and ending on August 31, 2013. The options will expire on thetenth anniversary of the grant date. Compensation expense is being recognized over the period of the award on anannual basis consistent with the vesting terms.
In August 2010, the Board of Directors of the Company approved the fiscal year 2011 Long Term IncentivePlan (‘‘LTIP’’) for the executive officers. The fiscal 2011 LTIP is an equity based plan with a grant date ofSeptember 1, 2010 and included options to purchase 62,425 shares of common stock in the aggregate. Each ofthese options has an exercise price of $12.70 per share, and will vest in three equal annual allotments beginningon August 31, 2011 and ending on August 31, 2013. The options will expire on August 31, 2020. Compensationexpense is being recognized over the period of the award on an annual basis consistent with the vesting terms.
In April 2011, the Board of Directors of the Company authorized a grant of stock options to certainnon-executive officer employees to purchase 15,201 shares of common stock in the aggregate with an exerciseprice of $16.53 per share. The options will vest in three equal annual allotments beginning on April 30, 2012 andending on April 30, 2014. The options will expire on April 30, 2021. Compensation expense is being recognizedover the period of the award on an annual basis consistent with the vesting terms.
In August 2011, the Board of Directors of the Company approved the fiscal year 2012 LTIP for the executiveofficers. The fiscal 2012 LTIP is an equity based plan with a grant date of September 1, 2011 and included optionsto purchase 59,493 shares of common stock in the aggregate. Each of these options has an exercise price of$12.77 per share, and will vest in three equal annual allotments beginning on August 31, 2012 and ending onAugust 31, 2014. The options will expire on August 31, 2021. Compensation expense is being recognized over theperiod of the award on an annual basis consistent with the vesting terms.
In August 2011, the Board of Directors of the Company authorized a grant of stock options with a grant date ofSeptember 1, 2011 to certain non-executive officer employees to purchase 20,883 shares of common stock in theaggregate with an exercise price of $12.77 per share. The options will vest in three equal annual allotmentsbeginning on August 31, 2012 and ending on August 31, 2014. The options will expire on August 31, 2021.Compensation expense is being recognized over the period of the award on an annual basis consistent with thevesting terms.
In March 2012, the Board of Directors of the Company authorized a grant of stock options to a non-executiveofficer employee to purchase 6,630 shares of common stock with an exercise price of $14.62 per share. Theoptions will vest in three equal annual allotments beginning on March 8, 2013 and ending on March 8, 2015. Theoptions will expire on March 8, 2022. Compensation expense is being recognized over the period of the award onan annual basis consistent with the vesting terms.
In October 2012, the Board of Directors of the Company approved the fiscal year 2013 LTIP for the executiveofficers and other members of management. The 2013 LTIP is an equity based plan with a grant date ofOctober 22, 2012 and included options to purchase 43,964 shares of common stock in the aggregate with anexercise price of $16.00 per share. The options will vest in three equal annual allotments beginning on August 31,2013 and ending on August 31, 2015. The options will expire on October 22, 2022. Compensation expense isbeing recognized over the period of the award on an annual basis consistent with the vesting terms.
57
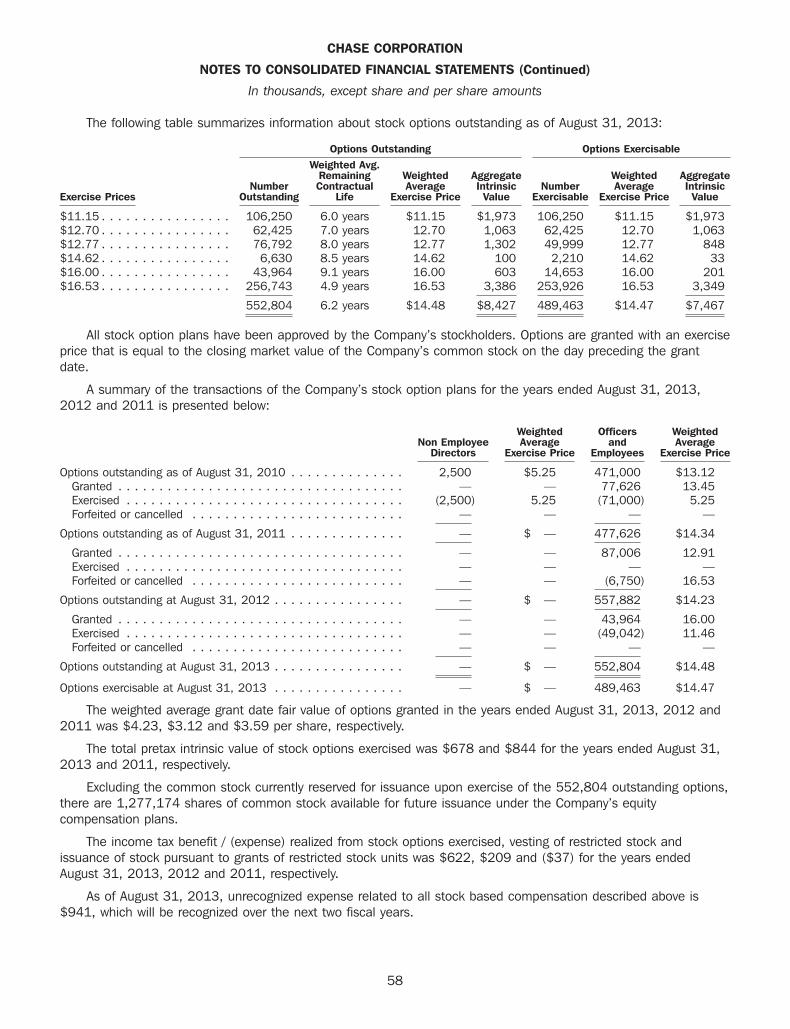
CHASE CORPORATION
NOTES TO CONSOLIDATED FINANCIAL STATEMENTS (Continued)
In thousands, except share and per share amounts
The following table summarizes information about stock options outstanding as of August 31, 2013:
Options Outstanding Options ExercisableWeighted Avg.
Remaining Weighted Aggregate Weighted AggregateNumber Contractual Average Intrinsic Number Average Intrinsic
Exercise Prices Outstanding Life Exercise Price Value Exercisable Exercise Price Value
$11.15 . . . . . . . . . . . . . . . . 106,250 6.0 years $11.15 $1,973 106,250 $11.15 $1,973$12.70 . . . . . . . . . . . . . . . . 62,425 7.0 years 12.70 1,063 62,425 12.70 1,063$12.77 . . . . . . . . . . . . . . . . 76,792 8.0 years 12.77 1,302 49,999 12.77 848$14.62 . . . . . . . . . . . . . . . . 6,630 8.5 years 14.62 100 2,210 14.62 33$16.00 . . . . . . . . . . . . . . . . 43,964 9.1 years 16.00 603 14,653 16.00 201$16.53 . . . . . . . . . . . . . . . . 256,743 4.9 years 16.53 3,386 253,926 16.53 3,349
552,804 6.2 years $14.48 $8,427 489,463 $14.47 $7,467
All stock option plans have been approved by the Company’s stockholders. Options are granted with an exerciseprice that is equal to the closing market value of the Company’s common stock on the day preceding the grantdate.
A summary of the transactions of the Company’s stock option plans for the years ended August 31, 2013,2012 and 2011 is presented below:
Weighted Officers WeightedNon Employee Average and Average
Directors Exercise Price Employees Exercise Price
Options outstanding as of August 31, 2010 . . . . . . . . . . . . . . 2,500 $5.25 471,000 $13.12Granted . . . . . . . . . . . . . . . . . . . . . . . . . . . . . . . . . . . — — 77,626 13.45Exercised . . . . . . . . . . . . . . . . . . . . . . . . . . . . . . . . . . (2,500) 5.25 (71,000) 5.25Forfeited or cancelled . . . . . . . . . . . . . . . . . . . . . . . . . . — — — —
Options outstanding as of August 31, 2011 . . . . . . . . . . . . . . — $ — 477,626 $14.34
Granted . . . . . . . . . . . . . . . . . . . . . . . . . . . . . . . . . . . — — 87,006 12.91Exercised . . . . . . . . . . . . . . . . . . . . . . . . . . . . . . . . . . — — — —Forfeited or cancelled . . . . . . . . . . . . . . . . . . . . . . . . . . — — (6,750) 16.53
Options outstanding at August 31, 2012 . . . . . . . . . . . . . . . . — $ — 557,882 $14.23
Granted . . . . . . . . . . . . . . . . . . . . . . . . . . . . . . . . . . . — — 43,964 16.00Exercised . . . . . . . . . . . . . . . . . . . . . . . . . . . . . . . . . . — — (49,042) 11.46Forfeited or cancelled . . . . . . . . . . . . . . . . . . . . . . . . . . — — — —
Options outstanding at August 31, 2013 . . . . . . . . . . . . . . . . — $ — 552,804 $14.48
Options exercisable at August 31, 2013 . . . . . . . . . . . . . . . . — $ — 489,463 $14.47
The weighted average grant date fair value of options granted in the years ended August 31, 2013, 2012 and2011 was $4.23, $3.12 and $3.59 per share, respectively.
The total pretax intrinsic value of stock options exercised was $678 and $844 for the years ended August 31,2013 and 2011, respectively.
Excluding the common stock currently reserved for issuance upon exercise of the 552,804 outstanding options,there are 1,277,174 shares of common stock available for future issuance under the Company’s equitycompensation plans.
The income tax benefit / (expense) realized from stock options exercised, vesting of restricted stock andissuance of stock pursuant to grants of restricted stock units was $622, $209 and ($37) for the years endedAugust 31, 2013, 2012 and 2011, respectively.
As of August 31, 2013, unrecognized expense related to all stock based compensation described above is$941, which will be recognized over the next two fiscal years.
58
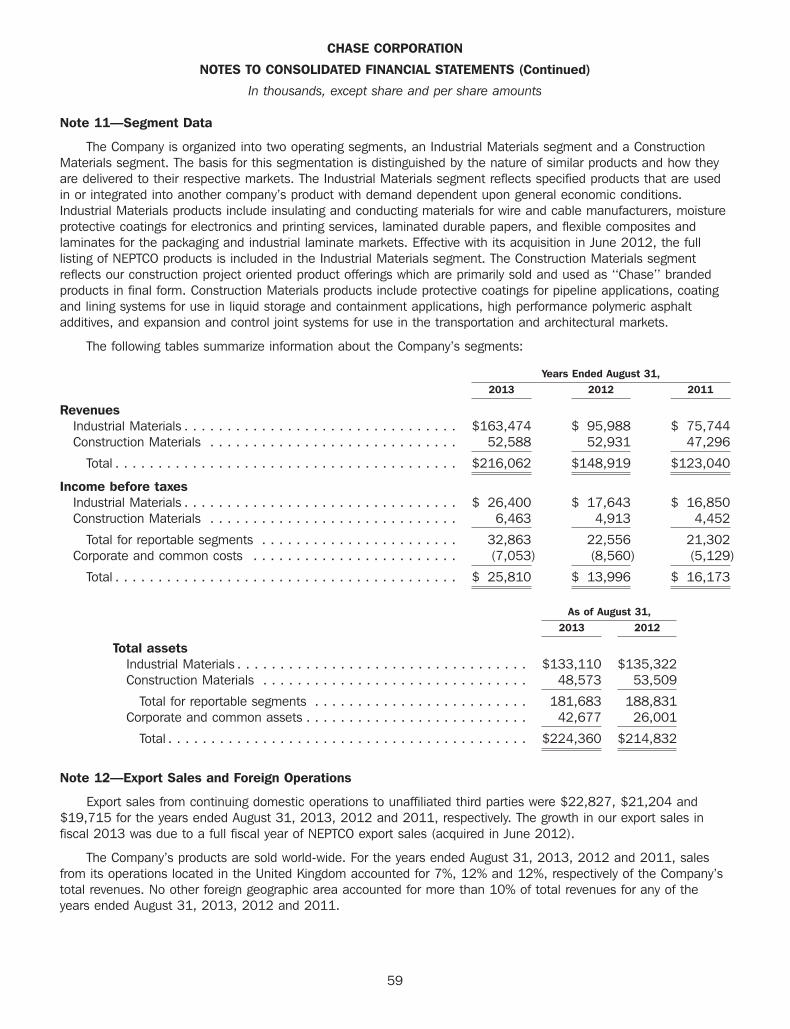
CHASE CORPORATION
NOTES TO CONSOLIDATED FINANCIAL STATEMENTS (Continued)
In thousands, except share and per share amounts
Note 11—Segment Data
The Company is organized into two operating segments, an Industrial Materials segment and a ConstructionMaterials segment. The basis for this segmentation is distinguished by the nature of similar products and how theyare delivered to their respective markets. The Industrial Materials segment reflects specified products that are usedin or integrated into another company’s product with demand dependent upon general economic conditions.Industrial Materials products include insulating and conducting materials for wire and cable manufacturers, moistureprotective coatings for electronics and printing services, laminated durable papers, and flexible composites andlaminates for the packaging and industrial laminate markets. Effective with its acquisition in June 2012, the fulllisting of NEPTCO products is included in the Industrial Materials segment. The Construction Materials segmentreflects our construction project oriented product offerings which are primarily sold and used as ‘‘Chase’’ brandedproducts in final form. Construction Materials products include protective coatings for pipeline applications, coatingand lining systems for use in liquid storage and containment applications, high performance polymeric asphaltadditives, and expansion and control joint systems for use in the transportation and architectural markets.
The following tables summarize information about the Company’s segments:
Years Ended August 31,2013 2012 2011
RevenuesIndustrial Materials . . . . . . . . . . . . . . . . . . . . . . . . . . . . . . . . $163,474 $ 95,988 $ 75,744Construction Materials . . . . . . . . . . . . . . . . . . . . . . . . . . . . . 52,588 52,931 47,296
Total . . . . . . . . . . . . . . . . . . . . . . . . . . . . . . . . . . . . . . . . $216,062 $148,919 $123,040
Income before taxesIndustrial Materials . . . . . . . . . . . . . . . . . . . . . . . . . . . . . . . . $ 26,400 $ 17,643 $ 16,850Construction Materials . . . . . . . . . . . . . . . . . . . . . . . . . . . . . 6,463 4,913 4,452
Total for reportable segments . . . . . . . . . . . . . . . . . . . . . . . 32,863 22,556 21,302Corporate and common costs . . . . . . . . . . . . . . . . . . . . . . . . (7,053) (8,560) (5,129)
Total . . . . . . . . . . . . . . . . . . . . . . . . . . . . . . . . . . . . . . . . $ 25,810 $ 13,996 $ 16,173
As of August 31,2013 2012
Total assetsIndustrial Materials . . . . . . . . . . . . . . . . . . . . . . . . . . . . . . . . . . $133,110 $135,322Construction Materials . . . . . . . . . . . . . . . . . . . . . . . . . . . . . . . 48,573 53,509
Total for reportable segments . . . . . . . . . . . . . . . . . . . . . . . . . 181,683 188,831Corporate and common assets . . . . . . . . . . . . . . . . . . . . . . . . . . 42,677 26,001
Total . . . . . . . . . . . . . . . . . . . . . . . . . . . . . . . . . . . . . . . . . . $224,360 $214,832
Note 12—Export Sales and Foreign Operations
Export sales from continuing domestic operations to unaffiliated third parties were $22,827, $21,204 and$19,715 for the years ended August 31, 2013, 2012 and 2011, respectively. The growth in our export sales infiscal 2013 was due to a full fiscal year of NEPTCO export sales (acquired in June 2012).
The Company’s products are sold world-wide. For the years ended August 31, 2013, 2012 and 2011, salesfrom its operations located in the United Kingdom accounted for 7%, 12% and 12%, respectively of the Company’stotal revenues. No other foreign geographic area accounted for more than 10% of total revenues for any of theyears ended August 31, 2013, 2012 and 2011.
59

CHASE CORPORATION
NOTES TO CONSOLIDATED FINANCIAL STATEMENTS (Continued)
In thousands, except share and per share amounts
As of August 31, 2013 and 2012, the Company had long-lived assets (defined as tangible assets providing theCompany with a future economic benefit beyond the current year or operating period, including buildings, equipmentand leasehold improvements) of $4,063 and $4,488, respectively, located in the United Kingdom. These balancesexclude goodwill and intangibles of $10,333 and $11,652, as of August 31, 2013 and 2012, respectively. Noforeign geographic area accounted for more than 10% of the Company’s total assets as of August 31, 2013 and2012.
Note 13—Supplemental Cash Flow Data
Supplemental cash flow information for the years ended August 31, 2013, 2012 and 2011 is as follows:
2013 2012 2011
Income taxes paid . . . . . . . . . . . . . . . . . . . . . . . . . . . . . . . . . . . . . . . . . . . $9,913 $ 5,561 $7,465
Interest paid . . . . . . . . . . . . . . . . . . . . . . . . . . . . . . . . . . . . . . . . . . . . . . . $1,545 $ 352 $ 276
Non-cash Investing and Financing ActivitiesCommon stock received for payment of stock option exercises . . . . . . . . . . . . . . $ 488 $ — $ 386Property, plant & equipment additions included in accounts payable . . . . . . . . . . $ 112 $ 117 $ 329
Acquisition of Neptco IncCurrent assets (excluding cash) . . . . . . . . . . . . . . . . . . . . . . . . . . . . . . . . . $ 24,948Property and equipment . . . . . . . . . . . . . . . . . . . . . . . . . . . . . . . . . . . . . . 18,657Goodwill . . . . . . . . . . . . . . . . . . . . . . . . . . . . . . . . . . . . . . . . . . . . . . . . 19,668Intangible assets . . . . . . . . . . . . . . . . . . . . . . . . . . . . . . . . . . . . . . . . . . . 23,165Accounts payable and accrued liabilities . . . . . . . . . . . . . . . . . . . . . . . . . . . (10,841)Long term liabilities . . . . . . . . . . . . . . . . . . . . . . . . . . . . . . . . . . . . . . . . . (736)Deferred tax liabilities . . . . . . . . . . . . . . . . . . . . . . . . . . . . . . . . . . . . . . . . (11,051)Minority interest of joint venture partner . . . . . . . . . . . . . . . . . . . . . . . . . . . (1,593)
Cash provided through operating cash and increase in debt . . . . . . . . . . . . . . $(62,217)
Note 14—Acquisitions
NEPTCO Incorporated
In the fourth quarter of fiscal 2012, Chase acquired 100% of the capital stock of NEPTCO, a private companybased in Pawtucket, RI, whose core products are sold primarily into the broadband communications and electronicspackaging industries. NEPTCO operates three manufacturing facilities in the United States and one in China, as wellas utilizing distribution facilities in Rotterdam, Netherlands and Mississauga, Ontario to assist in supply chainmanagement. As part of this transaction, the Company also acquired NEPTCO’s 50% ownership stake in a jointventure.
The total acquisition cost, net of cash received, was $62,217, subject to the finalization of purchaseaccounting, which was completed in the fourth quarter of fiscal 2013 and did not have a significant impact on thefinancial statements of the Company. The acquisition was funded through a five year term debt bank financingarrangement led and arranged by Bank of America, with participation from RBS Citizens.
The effective date for this acquisition was June 27, 2012 and the results of this acquisition have been includedin the Company’s financial statements since then. The acquisition was accounted for as a business combinationunder ASC Topic 805, ‘‘Business Combinations.’’ In accordance with this accounting standard, the Companyexpensed $3,206 of acquisition related costs during the year ended August 31, 2012.
60
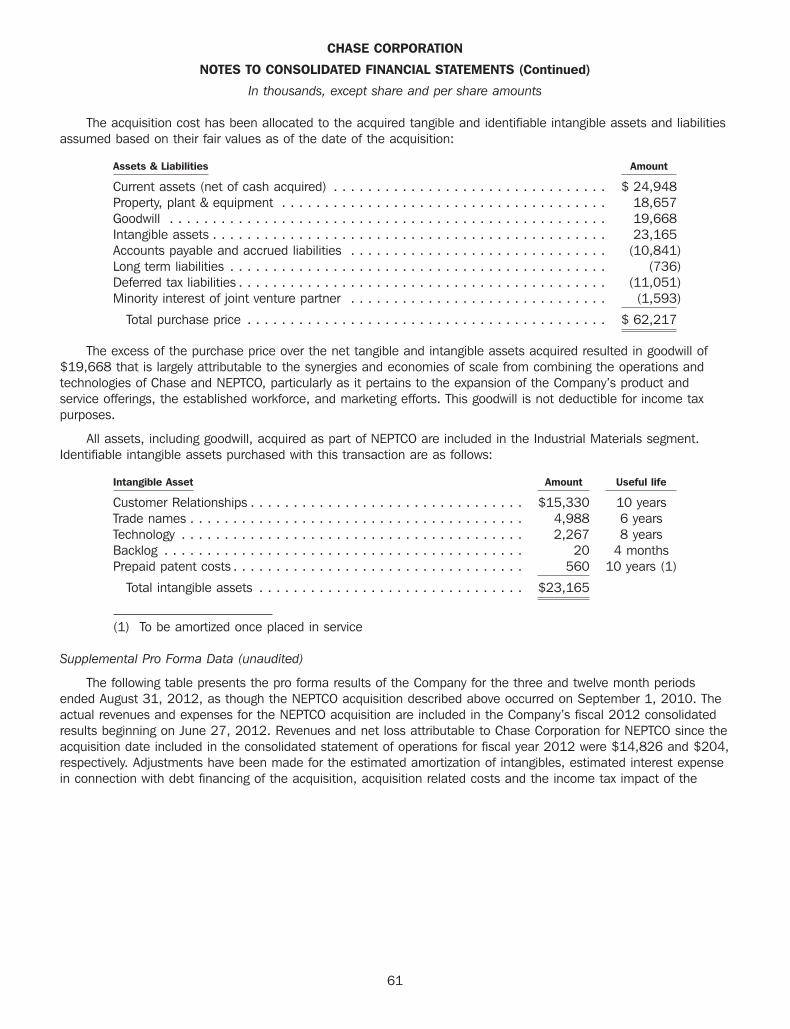
CHASE CORPORATION
NOTES TO CONSOLIDATED FINANCIAL STATEMENTS (Continued)
In thousands, except share and per share amounts
The acquisition cost has been allocated to the acquired tangible and identifiable intangible assets and liabilitiesassumed based on their fair values as of the date of the acquisition:
Assets & Liabilities Amount
Current assets (net of cash acquired) . . . . . . . . . . . . . . . . . . . . . . . . . . . . . . . . $ 24,948Property, plant & equipment . . . . . . . . . . . . . . . . . . . . . . . . . . . . . . . . . . . . . . 18,657Goodwill . . . . . . . . . . . . . . . . . . . . . . . . . . . . . . . . . . . . . . . . . . . . . . . . . . . 19,668Intangible assets . . . . . . . . . . . . . . . . . . . . . . . . . . . . . . . . . . . . . . . . . . . . . . 23,165Accounts payable and accrued liabilities . . . . . . . . . . . . . . . . . . . . . . . . . . . . . . (10,841)Long term liabilities . . . . . . . . . . . . . . . . . . . . . . . . . . . . . . . . . . . . . . . . . . . . (736)Deferred tax liabilities . . . . . . . . . . . . . . . . . . . . . . . . . . . . . . . . . . . . . . . . . . . (11,051)Minority interest of joint venture partner . . . . . . . . . . . . . . . . . . . . . . . . . . . . . . (1,593)
Total purchase price . . . . . . . . . . . . . . . . . . . . . . . . . . . . . . . . . . . . . . . . . . $ 62,217
The excess of the purchase price over the net tangible and intangible assets acquired resulted in goodwill of$19,668 that is largely attributable to the synergies and economies of scale from combining the operations andtechnologies of Chase and NEPTCO, particularly as it pertains to the expansion of the Company’s product andservice offerings, the established workforce, and marketing efforts. This goodwill is not deductible for income taxpurposes.
All assets, including goodwill, acquired as part of NEPTCO are included in the Industrial Materials segment.Identifiable intangible assets purchased with this transaction are as follows:
Intangible Asset Amount Useful life
Customer Relationships . . . . . . . . . . . . . . . . . . . . . . . . . . . . . . . . $15,330 10 yearsTrade names . . . . . . . . . . . . . . . . . . . . . . . . . . . . . . . . . . . . . . . 4,988 6 yearsTechnology . . . . . . . . . . . . . . . . . . . . . . . . . . . . . . . . . . . . . . . . 2,267 8 yearsBacklog . . . . . . . . . . . . . . . . . . . . . . . . . . . . . . . . . . . . . . . . . . 20 4 monthsPrepaid patent costs . . . . . . . . . . . . . . . . . . . . . . . . . . . . . . . . . . 560 10 years (1)
Total intangible assets . . . . . . . . . . . . . . . . . . . . . . . . . . . . . . . $23,165
(1) To be amortized once placed in service
Supplemental Pro Forma Data (unaudited)
The following table presents the pro forma results of the Company for the three and twelve month periodsended August 31, 2012, as though the NEPTCO acquisition described above occurred on September 1, 2010. Theactual revenues and expenses for the NEPTCO acquisition are included in the Company’s fiscal 2012 consolidatedresults beginning on June 27, 2012. Revenues and net loss attributable to Chase Corporation for NEPTCO since theacquisition date included in the consolidated statement of operations for fiscal year 2012 were $14,826 and $204,respectively. Adjustments have been made for the estimated amortization of intangibles, estimated interest expensein connection with debt financing of the acquisition, acquisition related costs and the income tax impact of the
61

CHASE CORPORATION
NOTES TO CONSOLIDATED FINANCIAL STATEMENTS (Continued)
In thousands, except share and per share amounts
pro forma adjustments at the statutory rate of 38%. The following pro forma information is not necessarily indicativeof the results that would have been achieved if the acquisition had been effective on September 1, 2010.
Three Months Ended Year EndedAugust 31, 2012 August 31, 2012
Revenues . . . . . . . . . . . . . . . . . . . . . . . . . . . . . . . . . . . . . . . . . . . . . . $58,900 $226,254Net income attributable to the Company . . . . . . . . . . . . . . . . . . . . . . . . . 3,590 11,779
Net income attributable to the Company available to common shareholders,per common and common equivalent shareBasic . . . . . . . . . . . . . . . . . . . . . . . . . . . . . . . . . . . . . . . . . . . . . . $ 0.40 $ 1.30Diluted . . . . . . . . . . . . . . . . . . . . . . . . . . . . . . . . . . . . . . . . . . . . . $ 0.40 $ 1.30
All acquisitions have been accounted for as purchase transactions and the operations of the acquired entity orassets are included in consolidated operations from the effective date.
Note 15—Joint Venture
As part of the Company’s purchase of NEPTCO, it also acquired NEPTCO’s 50% ownership stake in itsfinancially- controlled joint venture, NEPTCO JV LLC (‘‘JV’’). The JV was originally formed by NEPTCO and a jointventure partner, an otherwise unrelated party (collectively, the ‘‘Members’’) in 2003, whereby each member’s fiberoptic strength elements businesses were combined. This venture, which is 50% owned by each member, ismanaged and operated on a day-to-day basis by NEPTCO. The joint venture operates in the Company’s Granite Falls,NC facility.
The Company accounts for the joint venture partner’s non-controlling interest in the JV under ASC topic 810‘‘Consolidations.’’ Given the Company’s controlling financial interest, the JV’s assets and liabilities as of August 31,2013, and the results of operations beginning June 27, 2012, have been consolidated within the Company’sconsolidated balance sheet and the related consolidated statements of operations. An offsetting amount equal to50% of net assets and net loss of the JV has also been recorded within the Company’s consolidated financialstatements to non-controlling interest, representing the joint venture partner’s 50% ownership stake and pro ratashare in net loss of the JV.
At August 31, 3013 and 2012, the following amounts were consolidated in the Company’s balance sheetsrelated to the JV:
August 31,Assets 2013 2012
Cash . . . . . . . . . . . . . . . . . . . . . . . . . . . . . . . . . . . . . . . . . . . . . . . . $ 394 $1,008Accounts receivable, net . . . . . . . . . . . . . . . . . . . . . . . . . . . . . . . . . . . 1,106 1,540Inventories, net . . . . . . . . . . . . . . . . . . . . . . . . . . . . . . . . . . . . . . . . . 1,510 2,394Prepaid expenses and other assets . . . . . . . . . . . . . . . . . . . . . . . . . . . . 283 219Property, plant and equipment, net . . . . . . . . . . . . . . . . . . . . . . . . . . . . 448 630Intangible assets, net . . . . . . . . . . . . . . . . . . . . . . . . . . . . . . . . . . . . . 706 655
Total assets . . . . . . . . . . . . . . . . . . . . . . . . . . . . . . . . . . . . . . . . . . . . $4,447 $6,446Liabilities and net assets
Accounts payable and accrued expenses . . . . . . . . . . . . . . . . . . . . . . . . $ 679 $1,650Due to Members . . . . . . . . . . . . . . . . . . . . . . . . . . . . . . . . . . . . . . . . 1,677 1,757
Total liabilities . . . . . . . . . . . . . . . . . . . . . . . . . . . . . . . . . . . . . . . . . . $2,356 $3,407
Net assets . . . . . . . . . . . . . . . . . . . . . . . . . . . . . . . . . . . . . . . . . . . . $2,091 $3,039
Non-controlling interest . . . . . . . . . . . . . . . . . . . . . . . . . . . . . . . . . . . . $1,046 $1,520
62
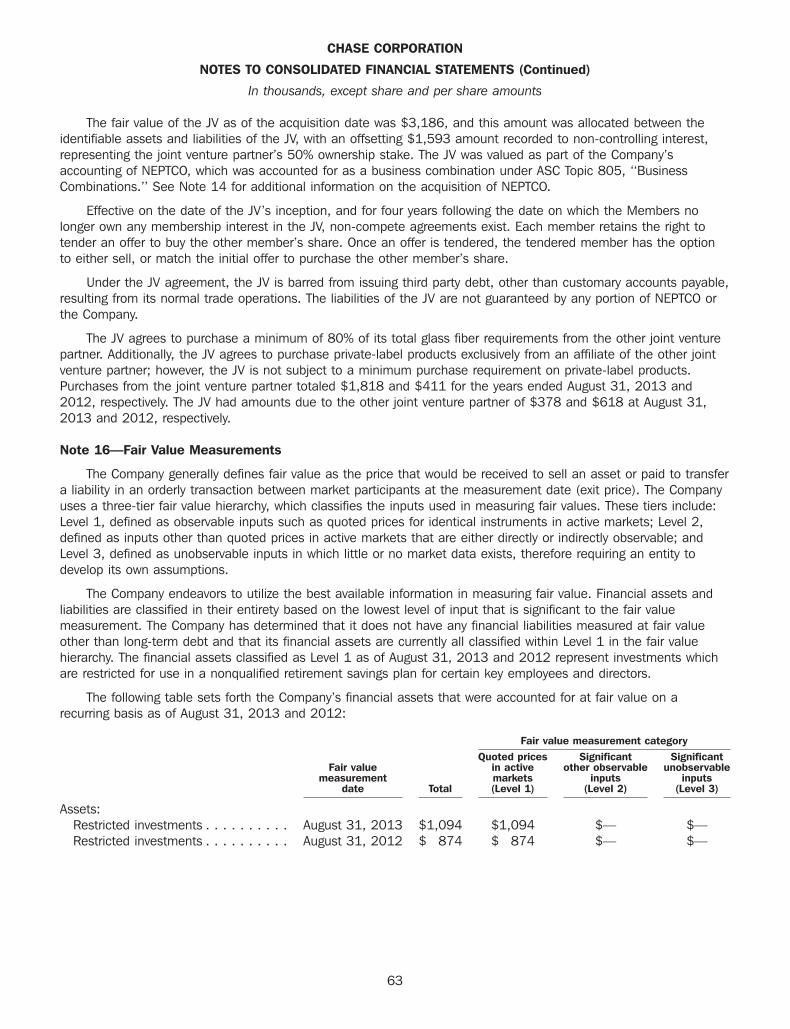
CHASE CORPORATION
NOTES TO CONSOLIDATED FINANCIAL STATEMENTS (Continued)
In thousands, except share and per share amounts
The fair value of the JV as of the acquisition date was $3,186, and this amount was allocated between theidentifiable assets and liabilities of the JV, with an offsetting $1,593 amount recorded to non-controlling interest,representing the joint venture partner’s 50% ownership stake. The JV was valued as part of the Company’saccounting of NEPTCO, which was accounted for as a business combination under ASC Topic 805, ‘‘BusinessCombinations.’’ See Note 14 for additional information on the acquisition of NEPTCO.
Effective on the date of the JV’s inception, and for four years following the date on which the Members nolonger own any membership interest in the JV, non-compete agreements exist. Each member retains the right totender an offer to buy the other member’s share. Once an offer is tendered, the tendered member has the optionto either sell, or match the initial offer to purchase the other member’s share.
Under the JV agreement, the JV is barred from issuing third party debt, other than customary accounts payable,resulting from its normal trade operations. The liabilities of the JV are not guaranteed by any portion of NEPTCO orthe Company.
The JV agrees to purchase a minimum of 80% of its total glass fiber requirements from the other joint venturepartner. Additionally, the JV agrees to purchase private-label products exclusively from an affiliate of the other jointventure partner; however, the JV is not subject to a minimum purchase requirement on private-label products.Purchases from the joint venture partner totaled $1,818 and $411 for the years ended August 31, 2013 and2012, respectively. The JV had amounts due to the other joint venture partner of $378 and $618 at August 31,2013 and 2012, respectively.
Note 16—Fair Value Measurements
The Company generally defines fair value as the price that would be received to sell an asset or paid to transfera liability in an orderly transaction between market participants at the measurement date (exit price). The Companyuses a three-tier fair value hierarchy, which classifies the inputs used in measuring fair values. These tiers include:Level 1, defined as observable inputs such as quoted prices for identical instruments in active markets; Level 2,defined as inputs other than quoted prices in active markets that are either directly or indirectly observable; andLevel 3, defined as unobservable inputs in which little or no market data exists, therefore requiring an entity todevelop its own assumptions.
The Company endeavors to utilize the best available information in measuring fair value. Financial assets andliabilities are classified in their entirety based on the lowest level of input that is significant to the fair valuemeasurement. The Company has determined that it does not have any financial liabilities measured at fair valueother than long-term debt and that its financial assets are currently all classified within Level 1 in the fair valuehierarchy. The financial assets classified as Level 1 as of August 31, 2013 and 2012 represent investments whichare restricted for use in a nonqualified retirement savings plan for certain key employees and directors.
The following table sets forth the Company’s financial assets that were accounted for at fair value on arecurring basis as of August 31, 2013 and 2012:
Fair value measurement categoryQuoted prices Significant Significant
Fair value in active other observable unobservablemeasurement markets inputs inputs
date Total (Level 1) (Level 2) (Level 3)
Assets:Restricted investments . . . . . . . . . . August 31, 2013 $1,094 $1,094 $— $—Restricted investments . . . . . . . . . . August 31, 2012 $ 874 $ 874 $— $—
63
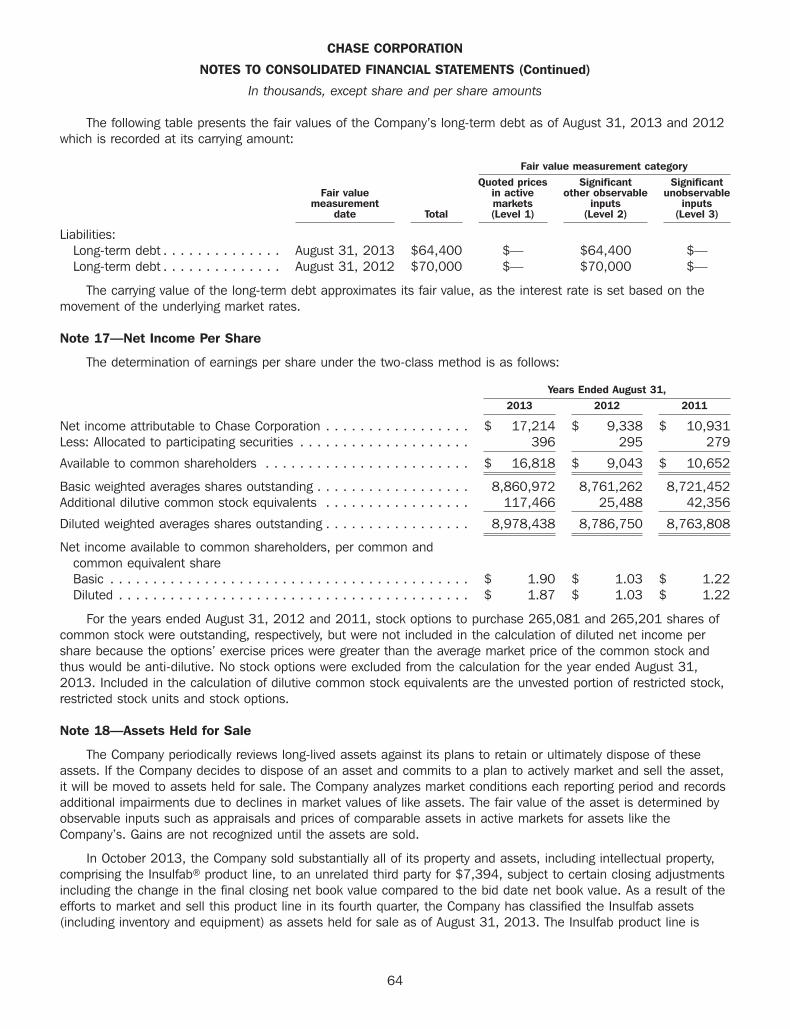
CHASE CORPORATION
NOTES TO CONSOLIDATED FINANCIAL STATEMENTS (Continued)
In thousands, except share and per share amounts
The following table presents the fair values of the Company’s long-term debt as of August 31, 2013 and 2012which is recorded at its carrying amount:
Fair value measurement categoryQuoted prices Significant Significant
Fair value in active other observable unobservablemeasurement markets inputs inputs
date Total (Level 1) (Level 2) (Level 3)
Liabilities:Long-term debt . . . . . . . . . . . . . . August 31, 2013 $64,400 $— $64,400 $—Long-term debt . . . . . . . . . . . . . . August 31, 2012 $70,000 $— $70,000 $—
The carrying value of the long-term debt approximates its fair value, as the interest rate is set based on themovement of the underlying market rates.
Note 17—Net Income Per Share
The determination of earnings per share under the two-class method is as follows:
Years Ended August 31,2013 2012 2011
Net income attributable to Chase Corporation . . . . . . . . . . . . . . . . . $ 17,214 $ 9,338 $ 10,931Less: Allocated to participating securities . . . . . . . . . . . . . . . . . . . . 396 295 279
Available to common shareholders . . . . . . . . . . . . . . . . . . . . . . . . $ 16,818 $ 9,043 $ 10,652
Basic weighted averages shares outstanding . . . . . . . . . . . . . . . . . . 8,860,972 8,761,262 8,721,452Additional dilutive common stock equivalents . . . . . . . . . . . . . . . . . 117,466 25,488 42,356
Diluted weighted averages shares outstanding . . . . . . . . . . . . . . . . . 8,978,438 8,786,750 8,763,808
Net income available to common shareholders, per common andcommon equivalent shareBasic . . . . . . . . . . . . . . . . . . . . . . . . . . . . . . . . . . . . . . . . . . $ 1.90 $ 1.03 $ 1.22Diluted . . . . . . . . . . . . . . . . . . . . . . . . . . . . . . . . . . . . . . . . . $ 1.87 $ 1.03 $ 1.22
For the years ended August 31, 2012 and 2011, stock options to purchase 265,081 and 265,201 shares ofcommon stock were outstanding, respectively, but were not included in the calculation of diluted net income pershare because the options’ exercise prices were greater than the average market price of the common stock andthus would be anti-dilutive. No stock options were excluded from the calculation for the year ended August 31,2013. Included in the calculation of dilutive common stock equivalents are the unvested portion of restricted stock,restricted stock units and stock options.
Note 18—Assets Held for Sale
The Company periodically reviews long-lived assets against its plans to retain or ultimately dispose of theseassets. If the Company decides to dispose of an asset and commits to a plan to actively market and sell the asset,it will be moved to assets held for sale. The Company analyzes market conditions each reporting period and recordsadditional impairments due to declines in market values of like assets. The fair value of the asset is determined byobservable inputs such as appraisals and prices of comparable assets in active markets for assets like theCompany’s. Gains are not recognized until the assets are sold.
In October 2013, the Company sold substantially all of its property and assets, including intellectual property,comprising the Insulfab� product line, to an unrelated third party for $7,394, subject to certain closing adjustmentsincluding the change in the final closing net book value compared to the bid date net book value. As a result of theefforts to market and sell this product line in its fourth quarter, the Company has classified the Insulfab assets(including inventory and equipment) as assets held for sale as of August 31, 2013. The Insulfab product line is
64
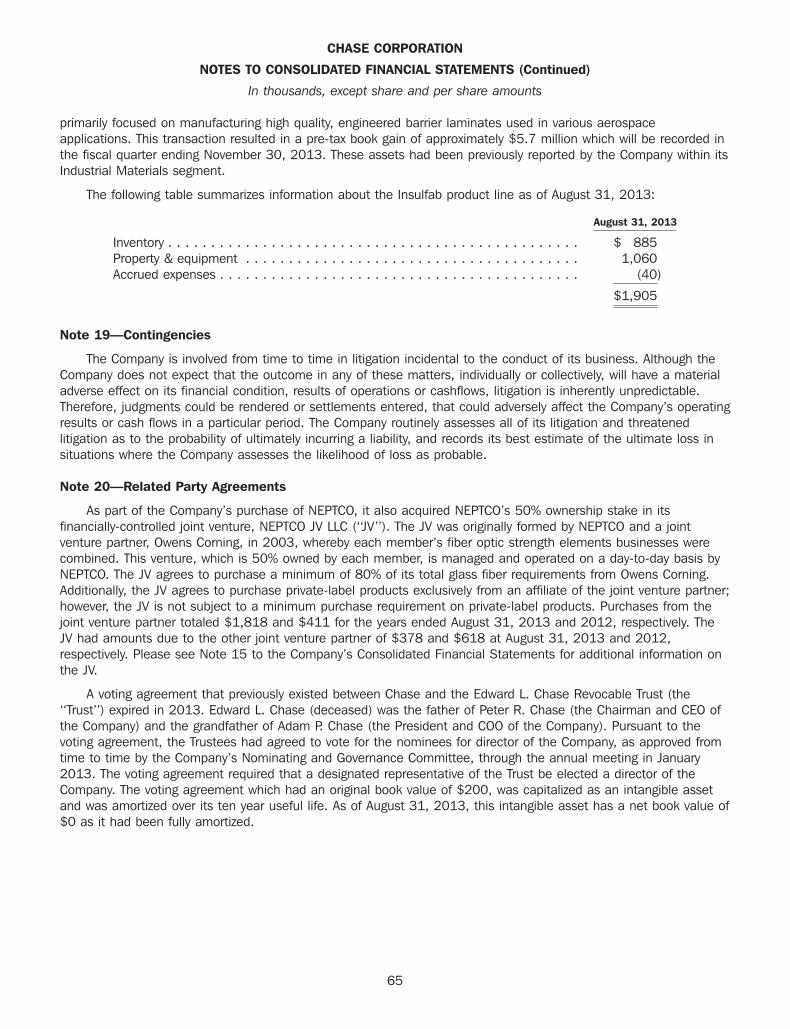
CHASE CORPORATION
NOTES TO CONSOLIDATED FINANCIAL STATEMENTS (Continued)
In thousands, except share and per share amounts
primarily focused on manufacturing high quality, engineered barrier laminates used in various aerospaceapplications. This transaction resulted in a pre-tax book gain of approximately $5.7 million which will be recorded inthe fiscal quarter ending November 30, 2013. These assets had been previously reported by the Company within itsIndustrial Materials segment.
The following table summarizes information about the Insulfab product line as of August 31, 2013:
August 31, 2013
Inventory . . . . . . . . . . . . . . . . . . . . . . . . . . . . . . . . . . . . . . . . . . . . . . . . $ 885Property & equipment . . . . . . . . . . . . . . . . . . . . . . . . . . . . . . . . . . . . . . . 1,060Accrued expenses . . . . . . . . . . . . . . . . . . . . . . . . . . . . . . . . . . . . . . . . . . (40)
$1,905
Note 19—Contingencies
The Company is involved from time to time in litigation incidental to the conduct of its business. Although theCompany does not expect that the outcome in any of these matters, individually or collectively, will have a materialadverse effect on its financial condition, results of operations or cashflows, litigation is inherently unpredictable.Therefore, judgments could be rendered or settlements entered, that could adversely affect the Company’s operatingresults or cash flows in a particular period. The Company routinely assesses all of its litigation and threatenedlitigation as to the probability of ultimately incurring a liability, and records its best estimate of the ultimate loss insituations where the Company assesses the likelihood of loss as probable.
Note 20—Related Party Agreements
As part of the Company’s purchase of NEPTCO, it also acquired NEPTCO’s 50% ownership stake in itsfinancially-controlled joint venture, NEPTCO JV LLC (‘‘JV’’). The JV was originally formed by NEPTCO and a jointventure partner, Owens Corning, in 2003, whereby each member’s fiber optic strength elements businesses werecombined. This venture, which is 50% owned by each member, is managed and operated on a day-to-day basis byNEPTCO. The JV agrees to purchase a minimum of 80% of its total glass fiber requirements from Owens Corning.Additionally, the JV agrees to purchase private-label products exclusively from an affiliate of the joint venture partner;however, the JV is not subject to a minimum purchase requirement on private-label products. Purchases from thejoint venture partner totaled $1,818 and $411 for the years ended August 31, 2013 and 2012, respectively. TheJV had amounts due to the other joint venture partner of $378 and $618 at August 31, 2013 and 2012,respectively. Please see Note 15 to the Company’s Consolidated Financial Statements for additional information onthe JV.
A voting agreement that previously existed between Chase and the Edward L. Chase Revocable Trust (the‘‘Trust’’) expired in 2013. Edward L. Chase (deceased) was the father of Peter R. Chase (the Chairman and CEO ofthe Company) and the grandfather of Adam P. Chase (the President and COO of the Company). Pursuant to thevoting agreement, the Trustees had agreed to vote for the nominees for director of the Company, as approved fromtime to time by the Company’s Nominating and Governance Committee, through the annual meeting in January2013. The voting agreement required that a designated representative of the Trust be elected a director of theCompany. The voting agreement which had an original book value of $200, was capitalized as an intangible assetand was amortized over its ten year useful life. As of August 31, 2013, this intangible asset has a net book value of$0 as it had been fully amortized.
65

CHASE CORPORATION
NOTES TO CONSOLIDATED FINANCIAL STATEMENTS (Continued)
In thousands, except share and per share amounts
Note 21—Selected Quarterly Financial Data (Unaudited)
The following table presents unaudited operating results for each of the Company’s quarters in the years endedAugust 31, 2013 and 2012:
Fiscal Year 2013 QuartersFirst Second Third Fourth Year
Net Sales . . . . . . . . . . . . . . . . . . . . . . . . . . . . . . . $52,976 $47,714 $55,096 $57,862 $213,648Gross Profit on Sales . . . . . . . . . . . . . . . . . . . . . . . 15,705 14,247 18,264 19,398 67,614Net income attributable to Chase Corporation . . . . . . . $ 3,540 $ 2,644 $ 5,134 $ 5,896 $ 17,214Net income available to common shareholders, per
common and common equivalent share:Basic . . . . . . . . . . . . . . . . . . . . . . . . . . . . . . . . $ 0.39 $ 0.29 $ 0.57 $ 0.65 $ 1.90Diluted . . . . . . . . . . . . . . . . . . . . . . . . . . . . . . . $ 0.39 $ 0.29 $ 0.56 $ 0.64 $ 1.87
Fiscal Year 2012 QuartersFirst Second Third Fourth Year
Net Sales . . . . . . . . . . . . . . . . . . . . . . . . . . . . . . . $31,654 $28,836 $34,378 $51,626 $146,494Gross Profit on Sales . . . . . . . . . . . . . . . . . . . . . . . 9,655 7,814 12,168 15,608 45,245Net income attributable to Chase Corporation . . . . . . . $ 2,327 $ 1,197 $ 3,373 $ 2,441 $ 9,338Net income available to common shareholders, per
common and common equivalent share:Basic . . . . . . . . . . . . . . . . . . . . . . . . . . . . . . . . $ 0.26 $ 0.13 $ 0.37 $ 0.27 $ 1.03Diluted . . . . . . . . . . . . . . . . . . . . . . . . . . . . . . . $ 0.26 $ 0.13 $ 0.37 $ 0.27 $ 1.03
Note: Quarterly earnings per share amounts may not sum to earnings per share for the year due to rounding.
Note 22—Valuation and Qualifying Accounts
The following table sets forth activity in the Company’s accounts receivable reserve:
Balance atBeginning of Charges to Deductions to Balance at
Year ended Year Operations Reserves End of Year
August 31, 2013 . . . . . . . . . . . . . . . . . . . . . . . . . . . . . . $817 $135 $(256) $696August 31, 2012 . . . . . . . . . . . . . . . . . . . . . . . . . . . . . . $473 $459 $(115) $817August 31, 2011 . . . . . . . . . . . . . . . . . . . . . . . . . . . . . . $347 $327 $(201) $473
The charges to operations for the fiscal year ended August 31, 2012 includes $94 recorded as part of theNEPTCO purchase accounting.
The following table sets forth activity in the Company’s warranty reserve:
Balance atBeginning of Charges to Deductions to Balance at
Year ended Year Operations Reserves End of Year
August 31, 2013 . . . . . . . . . . . . . . . . . . . . . . . . . . . . . . $249 — $ (1) $248August 31, 2012 . . . . . . . . . . . . . . . . . . . . . . . . . . . . . . $362 $157 $(270) $249August 31, 2011 . . . . . . . . . . . . . . . . . . . . . . . . . . . . . . $279 $288 $(205) $362
66
ITEM 9—CHANGES IN AND DISAGREEMENTS WITH ACCOUNTANTS ON ACCOUNTING AND FINANCIAL DISCLOSURE
None.
ITEM 9A—CONTROLS AND PROCEDURES
DISCLOSURE CONTROLS AND PROCEDURES
The Company maintains disclosure controls and procedures that are designed to ensure that informationrequired to be disclosed in the Company’s reports under the Securities Exchange Act of 1934, as amended, isrecorded, processed, summarized and reported within the time periods specified in the Commission’s rules andforms and that such information is accumulated and communicated to the Company’s management, including itsChief Executive Officer and Chief Financial Officer, as appropriate, to allow for timely decisions regarding requireddisclosure. In designing and evaluating the disclosure controls and procedures, management recognizes that anycontrols and procedures, no matter how well designed and operated, can provide only reasonable assurance ofachieving the desired control objectives, and management is required to apply its judgment in evaluating thecost-benefit relationship of possible controls and procedures.
The Company carries out a variety of ongoing procedures, under the supervision and with the participation ofthe Company’s management, including the Company’s Chief Executive Officer and Chief Financial Officer, to evaluatethe effectiveness of the design and operation of the Company’s disclosure controls and procedures. Based on theforegoing, the Company’s Chief Executive Officer and Chief Financial Officer concluded that the Company’sdisclosure controls and procedures were effective at a reasonable assurance level as of the end of the periodcovered by this report.
MANAGEMENT’S REPORT ON INTERNAL CONTROL OVER FINANCIAL REPORTING
Our management is responsible for establishing and maintaining adequate internal control over financialreporting. Internal control over financial reporting is defined in Rules 13a-15(f) and 15d-15(f) promulgated underthe Exchange Act as a process designed by, or under the supervision of, our principal executive and principalfinancial officers, or persons performing similar functions, and effected by our board of directors, management andother personnel, to provide reasonable assurance regarding the reliability of financial reporting and the preparationof financial statements for external purposes in accordance with U.S. GAAP.
Because of its inherent limitations, internal control over financial reporting may not prevent or detectmisstatements. Also, projections of any evaluation of effectiveness to future periods are subject to the risk thatcontrols may become inadequate because of changes in conditions, or that the degree of compliance with thepolicies or procedures may deteriorate.
Under the supervision and with the participation of management, including the Chief Executive Officer and ChiefFinancial Officer, the Company conducted an evaluation of the effectiveness of the Company’s internal control overfinancial reporting based on the framework in ‘‘Internal Control—Integrated Framework (1992)’’ issued by theCommittee of Sponsoring Organizations of the Treadway Commission (COSO). Based on this assessment,management has concluded that the internal control over financial reporting was effective as of August 31, 2013.
PricewaterhouseCoopers LLP, the independent registered public accounting firm that audited and reported onour consolidated financial statements contained herein, has audited the effectiveness of our internal control overfinancial reporting as of August 31, 2013, and has issued an attestation report on the effectiveness of our internalcontrol over financial reporting included herein.
CHANGES IN INTERNAL CONTROL OVER FINANCIAL REPORTING
Effective April 1, 2013, the Company began the process of implementing a single enterprise resource planning‘‘ERP’’ computer system world-wide. During the remainder of fiscal 2013, the Company expanded its existing ERPmodules to four of its domestic locations which resulted in changes to the Company’s processes and proceduresaffecting its internal control over financial reporting. The Company expects this process to continue over the nextsixteen months as it continues with its plan to deploy more effective and efficient processes to support theCompany’s financial reporting as it continues to grow in size and scale. Otherwise, there have not been any changesin the Company’s internal control over financial reporting during its most recent fiscal year that have materiallyaffected, or are reasonably likely to materially affect, its internal control over financial reporting.
ITEM 9B—OTHER INFORMATION
Not applicable.
67
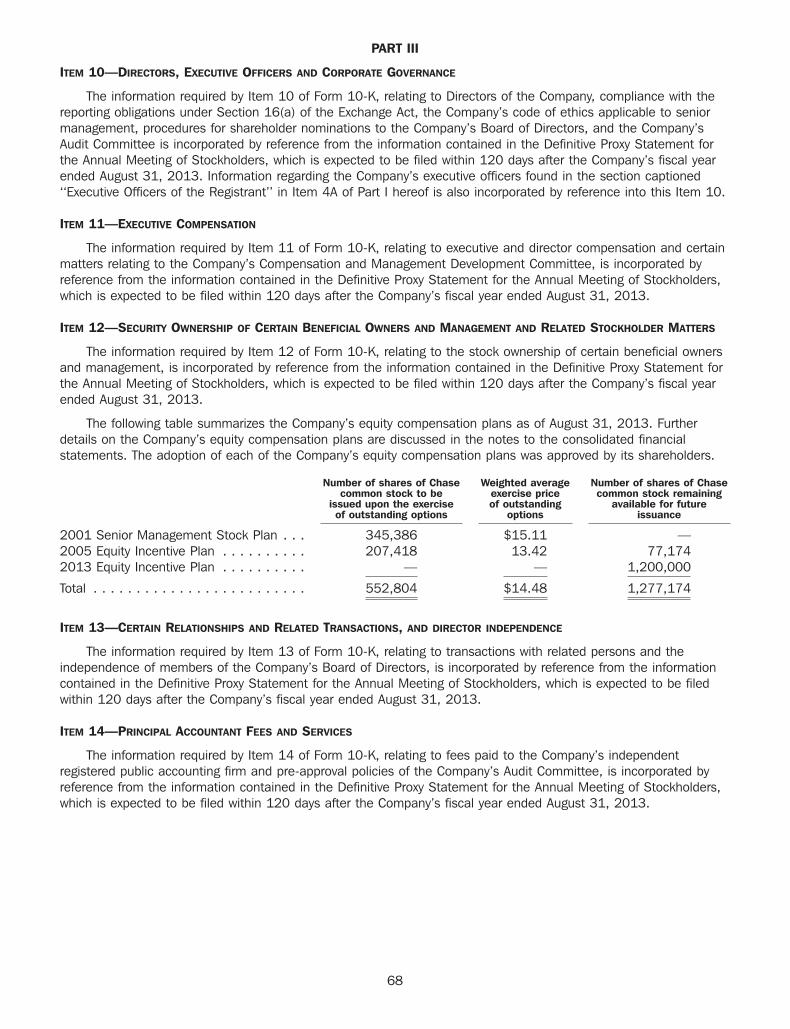
PART III
ITEM 10—DIRECTORS, EXECUTIVE OFFICERS AND CORPORATE GOVERNANCE
The information required by Item 10 of Form 10-K, relating to Directors of the Company, compliance with thereporting obligations under Section 16(a) of the Exchange Act, the Company’s code of ethics applicable to seniormanagement, procedures for shareholder nominations to the Company’s Board of Directors, and the Company’sAudit Committee is incorporated by reference from the information contained in the Definitive Proxy Statement forthe Annual Meeting of Stockholders, which is expected to be filed within 120 days after the Company’s fiscal yearended August 31, 2013. Information regarding the Company’s executive officers found in the section captioned‘‘Executive Officers of the Registrant’’ in Item 4A of Part I hereof is also incorporated by reference into this Item 10.
ITEM 11—EXECUTIVE COMPENSATION
The information required by Item 11 of Form 10-K, relating to executive and director compensation and certainmatters relating to the Company’s Compensation and Management Development Committee, is incorporated byreference from the information contained in the Definitive Proxy Statement for the Annual Meeting of Stockholders,which is expected to be filed within 120 days after the Company’s fiscal year ended August 31, 2013.
ITEM 12—SECURITY OWNERSHIP OF CERTAIN BENEFICIAL OWNERS AND MANAGEMENT AND RELATED STOCKHOLDER MATTERS
The information required by Item 12 of Form 10-K, relating to the stock ownership of certain beneficial ownersand management, is incorporated by reference from the information contained in the Definitive Proxy Statement forthe Annual Meeting of Stockholders, which is expected to be filed within 120 days after the Company’s fiscal yearended August 31, 2013.
The following table summarizes the Company’s equity compensation plans as of August 31, 2013. Furtherdetails on the Company’s equity compensation plans are discussed in the notes to the consolidated financialstatements. The adoption of each of the Company’s equity compensation plans was approved by its shareholders.
Number of shares of Chase Weighted average Number of shares of Chasecommon stock to be exercise price common stock remaining
issued upon the exercise of outstanding available for futureof outstanding options options issuance
2001 Senior Management Stock Plan . . . 345,386 $15.11 —2005 Equity Incentive Plan . . . . . . . . . . 207,418 13.42 77,1742013 Equity Incentive Plan . . . . . . . . . . — — 1,200,000
Total . . . . . . . . . . . . . . . . . . . . . . . . . 552,804 $14.48 1,277,174
ITEM 13—CERTAIN RELATIONSHIPS AND RELATED TRANSACTIONS, AND DIRECTOR INDEPENDENCE
The information required by Item 13 of Form 10-K, relating to transactions with related persons and theindependence of members of the Company’s Board of Directors, is incorporated by reference from the informationcontained in the Definitive Proxy Statement for the Annual Meeting of Stockholders, which is expected to be filedwithin 120 days after the Company’s fiscal year ended August 31, 2013.
ITEM 14—PRINCIPAL ACCOUNTANT FEES AND SERVICES
The information required by Item 14 of Form 10-K, relating to fees paid to the Company’s independentregistered public accounting firm and pre-approval policies of the Company’s Audit Committee, is incorporated byreference from the information contained in the Definitive Proxy Statement for the Annual Meeting of Stockholders,which is expected to be filed within 120 days after the Company’s fiscal year ended August 31, 2013.
68
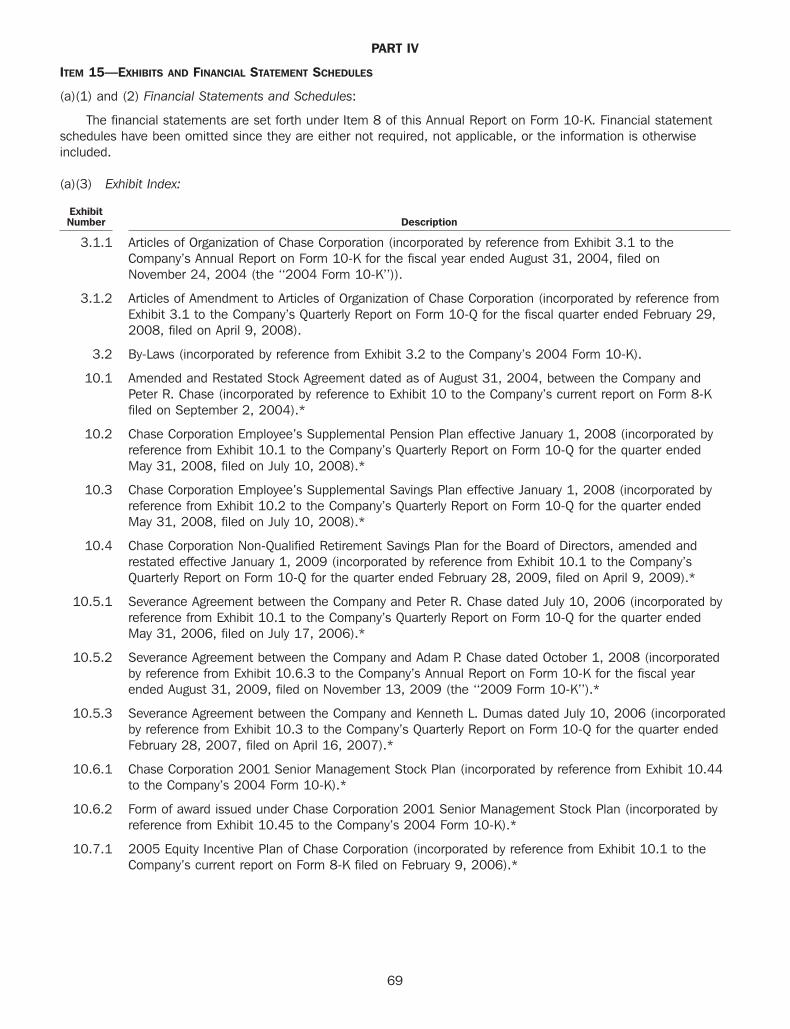
PART IV
ITEM 15—EXHIBITS AND FINANCIAL STATEMENT SCHEDULES
(a)(1) and (2) Financial Statements and Schedules:
The financial statements are set forth under Item 8 of this Annual Report on Form 10-K. Financial statementschedules have been omitted since they are either not required, not applicable, or the information is otherwiseincluded.
(a)(3) Exhibit Index:
ExhibitNumber Description
3.1.1 Articles of Organization of Chase Corporation (incorporated by reference from Exhibit 3.1 to theCompany’s Annual Report on Form 10-K for the fiscal year ended August 31, 2004, filed onNovember 24, 2004 (the ‘‘2004 Form 10-K’’)).
3.1.2 Articles of Amendment to Articles of Organization of Chase Corporation (incorporated by reference fromExhibit 3.1 to the Company’s Quarterly Report on Form 10-Q for the fiscal quarter ended February 29,2008, filed on April 9, 2008).
3.2 By-Laws (incorporated by reference from Exhibit 3.2 to the Company’s 2004 Form 10-K).
10.1 Amended and Restated Stock Agreement dated as of August 31, 2004, between the Company andPeter R. Chase (incorporated by reference to Exhibit 10 to the Company’s current report on Form 8-Kfiled on September 2, 2004).*
10.2 Chase Corporation Employee’s Supplemental Pension Plan effective January 1, 2008 (incorporated byreference from Exhibit 10.1 to the Company’s Quarterly Report on Form 10-Q for the quarter endedMay 31, 2008, filed on July 10, 2008).*
10.3 Chase Corporation Employee’s Supplemental Savings Plan effective January 1, 2008 (incorporated byreference from Exhibit 10.2 to the Company’s Quarterly Report on Form 10-Q for the quarter endedMay 31, 2008, filed on July 10, 2008).*
10.4 Chase Corporation Non-Qualified Retirement Savings Plan for the Board of Directors, amended andrestated effective January 1, 2009 (incorporated by reference from Exhibit 10.1 to the Company’sQuarterly Report on Form 10-Q for the quarter ended February 28, 2009, filed on April 9, 2009).*
10.5.1 Severance Agreement between the Company and Peter R. Chase dated July 10, 2006 (incorporated byreference from Exhibit 10.1 to the Company’s Quarterly Report on Form 10-Q for the quarter endedMay 31, 2006, filed on July 17, 2006).*
10.5.2 Severance Agreement between the Company and Adam P. Chase dated October 1, 2008 (incorporatedby reference from Exhibit 10.6.3 to the Company’s Annual Report on Form 10-K for the fiscal yearended August 31, 2009, filed on November 13, 2009 (the ‘‘2009 Form 10-K’’).*
10.5.3 Severance Agreement between the Company and Kenneth L. Dumas dated July 10, 2006 (incorporatedby reference from Exhibit 10.3 to the Company’s Quarterly Report on Form 10-Q for the quarter endedFebruary 28, 2007, filed on April 16, 2007).*
10.6.1 Chase Corporation 2001 Senior Management Stock Plan (incorporated by reference from Exhibit 10.44to the Company’s 2004 Form 10-K).*
10.6.2 Form of award issued under Chase Corporation 2001 Senior Management Stock Plan (incorporated byreference from Exhibit 10.45 to the Company’s 2004 Form 10-K).*
10.7.1 2005 Equity Incentive Plan of Chase Corporation (incorporated by reference from Exhibit 10.1 to theCompany’s current report on Form 8-K filed on February 9, 2006).*
69

ExhibitNumber Description
10.7.2 Form of restricted stock unit award issued under the Chase Corporation 2005 Incentive Plan fornon-executive members of the Board of Directors (incorporated by reference from Exhibit 10.4 to theCompany’s Quarterly Report on Form 10-Q for the period ended February 28, 2007, filed on April 16,2007).*
10.7.3 Form of restricted stock unit award issued under the Chase Corporation 2005 Incentive Plan formembers of Executive Management (incorporated by reference from Exhibit 10.5 to the Company’sQuarterly Report on Form 10-Q for the period ended February 28, 2007, filed on April 16, 2007).*
10.7.4 Form of restricted stock agreement issued under the Chase Corporation 2005 Incentive Plan fornon-executive members of the Board of Directors (incorporated by reference from Exhibit 10.3 to theCompany’s Quarterly Report on Form 10-Q for the period ended February 29, 2008, filed on April 9,2008).*
10.7.5 Form of restricted stock agreement issued under the Chase Corporation 2005 Incentive Plan formembers of Executive Management (incorporated by reference from Exhibit 10.1 to the Company’sQuarterly Report on Form 10-Q for the period ended November 30, 2007, filed on January 9, 2008).*
10.7.6 Form of stock option award issued under the Chase Corporation 2005 Incentive Plan (incorporated byreference from Exhibit 10.11.6 to the Company’s 2009 Form 10-K).*
10.8 2013 Equity Incentive Plan of Chase Corporation (incorporated by reference from Exhibit A to theCompany’s 2012 Proxy Statement filed on December 21, 2013).*
10.9.1 Life Insurance Reimbursement Agreement between Chase Corporation and Peter R. Chase datedJanuary 10, 2005 (incorporated by reference from Exhibit 10.1 to the Company’s current report onForm 8-K filed on January 14, 2005).*
10.9.2 Split Dollar Agreement between Chase Corporation and Peter R. Chase dated January 10, 2005(incorporated by reference from Exhibit 10.2 to the Company’s current report on Form 8-K filed onJanuary 14, 2005).*
10.9.3 Split Dollar Endorsement dated January 10, 2005 (incorporated by reference from Exhibit 10.3 to theCompany’s current report on Form 8-K filed on January 14, 2005).*
10.10.1 FY 2013 Chase Corporation Annual Incentive Plan (incorporated by reference from Exhibit 99.3 to theCompany’s current report on Form 8-K filed on October 11, 2013).*
10.10.2 FY 2013 Chase Corporation Long Term Incentive Plan (incorporated by reference from Exhibit 99.4 tothe Company’s current report on Form 8-K filed on October 11, 2013).*
10.11.1 Endorsement Split-Dollar Agreement among the Company, Edward L. Chase, and Sarah Chase astrustee of the ELC Irrevocable Life Insurance Trust (incorporated by reference from Exhibit 10.25 to theCompany’s Annual Report on Form 10-K for the fiscal year ended August 31, 1998, filed onNovember 27, 1998).
10.11.2 Amendment to Endorsement Split-Dollar Agreement between the Company and Sarah Chase as trusteeof the ELC Irrevocable Life Insurance Trust (incorporated by reference from Exhibit 10.2 to theCompany’s Quarterly Report on Form 10-Q for the period ended February 28, 2009, filed on April 9,2009).
10.12 Asset Purchase Agreement dated December 18, 2009 between Chase Corporation and GraceConstruction Products Limited (incorporated by reference from Exhibit 10.1 to the Company’s QuarterlyReport on Form 10-Q for the quarter ended February 28, 2010, filed on April 9, 2010).
10.13 Agreement and Plan of Merger dated as of June 27, 2012 by and among NEPTCO Holdings, Inc., ChaseCorporation and NEPTCO Acquisition Corp. (incorporated by reference from Exhibit 2.1 to the Company’scurrent report on Form 8-K filed on July 3, 2012).
10.14.1 Credit Agreement dated as of June 27, 2012 by and among Chase Corporation, NEPTCO Incorporated,Bank of America, N.A. and the Guarantors and Lenders party thereto (incorporated by reference fromExhibit 10.1 to the Company’s current report on Form 8-K filed July 3, 2012).
70
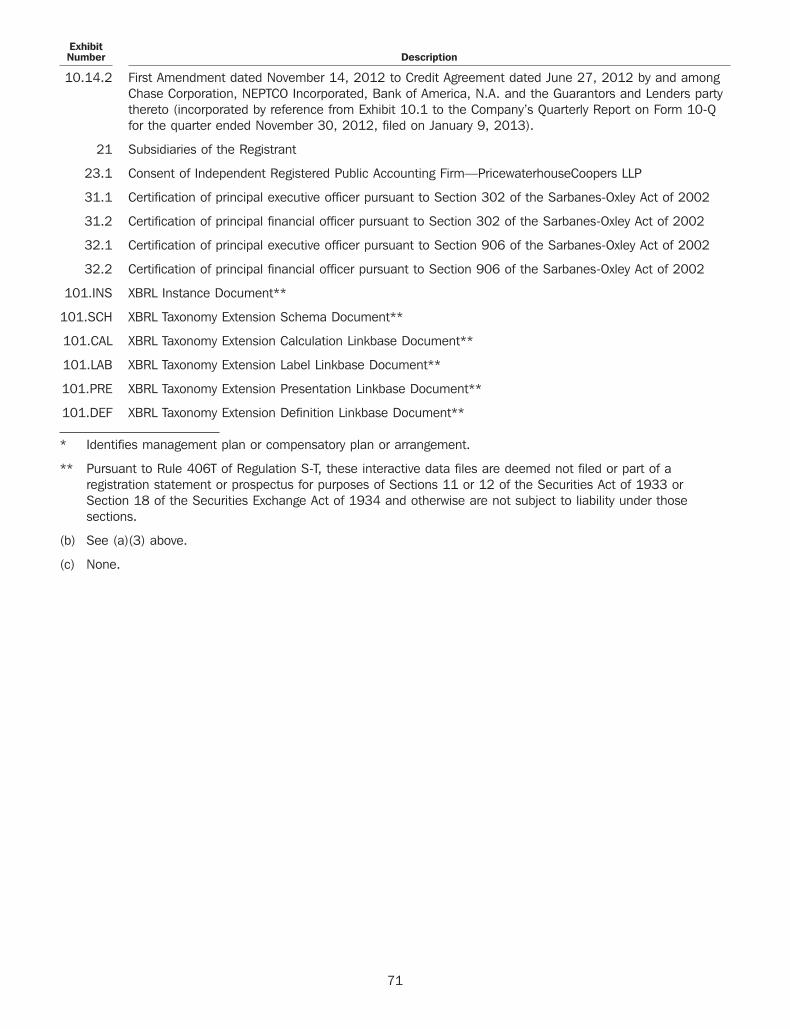
ExhibitNumber Description
10.14.2 First Amendment dated November 14, 2012 to Credit Agreement dated June 27, 2012 by and amongChase Corporation, NEPTCO Incorporated, Bank of America, N.A. and the Guarantors and Lenders partythereto (incorporated by reference from Exhibit 10.1 to the Company’s Quarterly Report on Form 10-Qfor the quarter ended November 30, 2012, filed on January 9, 2013).
21 Subsidiaries of the Registrant
23.1 Consent of Independent Registered Public Accounting Firm—PricewaterhouseCoopers LLP
31.1 Certification of principal executive officer pursuant to Section 302 of the Sarbanes-Oxley Act of 2002
31.2 Certification of principal financial officer pursuant to Section 302 of the Sarbanes-Oxley Act of 2002
32.1 Certification of principal executive officer pursuant to Section 906 of the Sarbanes-Oxley Act of 2002
32.2 Certification of principal financial officer pursuant to Section 906 of the Sarbanes-Oxley Act of 2002
101.INS XBRL Instance Document**
101.SCH XBRL Taxonomy Extension Schema Document**
101.CAL XBRL Taxonomy Extension Calculation Linkbase Document**
101.LAB XBRL Taxonomy Extension Label Linkbase Document**
101.PRE XBRL Taxonomy Extension Presentation Linkbase Document**
101.DEF XBRL Taxonomy Extension Definition Linkbase Document**
* Identifies management plan or compensatory plan or arrangement.
** Pursuant to Rule 406T of Regulation S-T, these interactive data files are deemed not filed or part of aregistration statement or prospectus for purposes of Sections 11 or 12 of the Securities Act of 1933 orSection 18 of the Securities Exchange Act of 1934 and otherwise are not subject to liability under thosesections.
(b) See (a)(3) above.
(c) None.
71
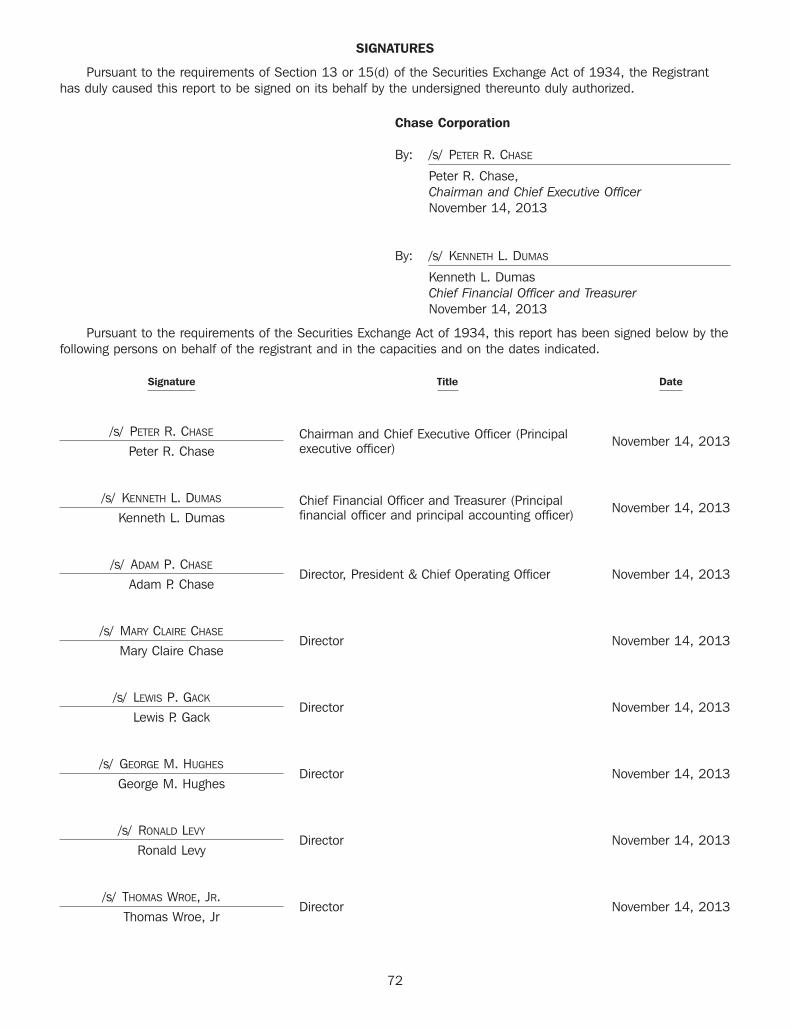
SIGNATURES
Pursuant to the requirements of Section 13 or 15(d) of the Securities Exchange Act of 1934, the Registranthas duly caused this report to be signed on its behalf by the undersigned thereunto duly authorized.
Chase Corporation
By: /s/ PETER R. CHASE
Peter R. Chase,Chairman and Chief Executive OfficerNovember 14, 2013
By: /s/ KENNETH L. DUMAS
Kenneth L. DumasChief Financial Officer and TreasurerNovember 14, 2013
Pursuant to the requirements of the Securities Exchange Act of 1934, this report has been signed below by thefollowing persons on behalf of the registrant and in the capacities and on the dates indicated.
Signature Title Date
/s/ PETER R. CHASE Chairman and Chief Executive Officer (Principal November 14, 2013executive officer)Peter R. Chase
/s/ KENNETH L. DUMAS Chief Financial Officer and Treasurer (Principal November 14, 2013financial officer and principal accounting officer)Kenneth L. Dumas
/s/ ADAM P. CHASEDirector, President & Chief Operating Officer November 14, 2013
Adam P. Chase
/s/ MARY CLAIRE CHASEDirector November 14, 2013
Mary Claire Chase
/s/ LEWIS P. GACKDirector November 14, 2013
Lewis P. Gack
/s/ GEORGE M. HUGHESDirector November 14, 2013
George M. Hughes
/s/ RONALD LEVYDirector November 14, 2013
Ronald Levy
/s/ THOMAS WROE, JR.Director November 14, 2013
Thomas Wroe, Jr
72
CHASE Corporation CHASE CORPORATIONExecutive Offices PAWTUCKET, RI PARIS, FRANCE
Officers Bethany House NEPTCO, INC. 4/6 Avenue Eiffel26 Summer Street 30 Hamlet Street 78420 Carrieres-Sur-Seine FrancePeter R. Chase Bridgewater, MA 02324 P.O. Box 2323 78232 Le Pecq Cedex FranceChairman & Chief Executive Officer Phone (508) 819-4200 • Fax (508) 697-6419 Pawtucket, RI 02861 Phone +33 (0) 1 30 09 86 86 •
Phone (401) 722-5500 • Fax (401) 728-9932 Fax +33 (0) 1 09 86 87Adam P. Chase GLOBAL OPERATIONS CENTERPresident & Chief Operating Officer 295 University Avenue PRODUCTS/SERVICES: Laminated film foils for PRODUCTS/SERVICES: Insulating conformal
Westwood, MA 02090 the electronics and cable industries. coatings, potting compounds and specialtyKenneth L. Dumas Phone (781) 332-0700 • Fax (781) 332-0701 accessory products for the protection of printedChief Financial Officer & Treasurer LENOIR, NCToll Free (800) 323-4182 circuit assembly and electronic components.NEPTCO, INC.George M. Hughes 2012 Hickory BoulevardOperating Facilities RYE, EAST SUSSEX, ENGLANDCorporate Secretary P.O. Box 1766 Harbour Road, Rye
OXFORD, MA Lenoir, NC 28645 Rye, East Sussex TN31 7TE UK24 Dana Road Phone (828) 728-5951 • Fax (828) 728-5115Legal Counsel Phone +44 (0) 1797 223561 •Oxford, MA 01540 Fax +44 (0) 1797 224530Hughes & Associates PRODUCTS/SERVICES: Laminated film foils forPhone (508) 731-2710 • Fax (508) 987-1092
P.O. Box 590321 the electronics and cable industries and cover PRODUCTS/SERVICES: Waterproofing andNewton Center, MA 02459 PRODUCTS/SERVICES: Shielding & binding tapes essential to delivering semiconductor corrosion protection systems for oil, gas andtapes for electronic & telecommunication cable. components via tape and reel packaging. water pipelines as well as high-performanceIndependent Registered Specialty laminates for automotive, packaging tapes, epoxies and cathodic protectionGRANITE FALLS, NCand medical products. Converting servicesPublic Accounting Firm accessory products.NEPTCO, INC.include specialized laminating, slitting andPricewaterhouseCoopers LLP 3908 Hickory Boulevardtraverse winding. Insulating, flame barrier,125 High Street SHAREHOLDERP.O. Box 800binder and semi-conducting tapes for powerBoston, MA 02110 INFORMATIONGranite Falls, NC 28630and telecommunications.
Phone (828) 396-2121 • Fax (828) 396-6978Registrar & PITTSBURGH, PA Common Stock
PRODUCTS/SERVICES: Pulling and detectionTransfer Agent 201 Zeta Drive and 128 First Street Common Stock of Chase Corporation is tradedtapes used in the installation, measurement andPittsburgh, PA 15238 on the NYSE MKT under the symbol ‘‘CCF’’.American Stock Transfer &location of fiber optic cables, water and naturalPhone (412) 828-1500 • Fax (412) 828-3487Trust Companygas lines. Constructed elements used to Annual Meeting ofOperations Center PRODUCTS/SERVICES: Protective coatings for provide integrity to structural components.6201 15th Avenue Shareholdersunderground gas, oil and water pipelines, as Flexible, rigid and semi-rigid fiber opticBrooklyn, NY 11219 The Annual Meeting of Shareholders will be heldwell as waterproofing membranes and high strength elements designed to allow fiber optic
at 9:30 a.m. on Tuesday, February 4, 2014 atperformance polymer additives for asphalt and cables to withstand mechanical andChase Corporation’s Global Operations Center, 295expansion joints and accessories, and private environmental strain and stress, produced byUniversity Avenue, Westwood, MA 02090.label manufacturing. Water blocking NEPTCO’s joint venture.
compounds for power and telecommunications.SUZHOU, JIANGSU, CHINAInsulating conformal coatings, potting When shares owned by one shareholder areNEPTCO, INC.compounds and specialty accessory products held in different forms of the same nameD-10 #19 Datong Roadfor the protection of printed circuit assembly (e.g., John Doe, J. Doe) or when new accountsSuzhou New District Processing Zoneand electronic components. are established for shares purchased atSuzhou, Jiangsu, China 215151 different times, duplicate mailings ofPhone 86-512-6269-6298 •EVANSTON, IL shareholder information may result. TheSKYPE 828-398-06411527 Lyons Street Company, by law, is required to mail to each
Evanston, IL 60201 name on the shareholder list unless thePRODUCTS/SERVICES: Cover tapes essential toPhone (847) 866-8500 • Fax (847) 866-8596 shareholder requests that duplicate mailings bedelivering semiconductor components via tape
eliminated or consolidates all accounts intoand reel packaging.PRODUCTS/SERVICES: Innovative products for one. Such requests should be directed, inthe protection against corrosion for WINNERSH, WOKINGHAM, ENGLAND writing, to the Shareholder Servicesunderground gas, oil and water pipelines and 505 Eskdale Road Department, American Stock Transfer & Trustmarine industries as well as private label Winnersh Company, Operations Center, 6201 15th Avenue,manufacturing. Wokingham Brooklyn, NY 11219.
Berkshire RG41 5TU UKHOUSTON, TXPhone +44 (0) 1189 442 333 • Contact: [email protected]. Industries, Inc.Fax +44 (0) 1189 335 7996900 Nelms Street
Houston, TX 77061 PRODUCTS/SERVICES: Insulating conformalPhone (713) 242-9015 • Fax (713) 242-9794 coatings, potting compounds and specialty
accessory products for the protection of printedPRODUCTS/SERVICES: High performancecircuit assembly and electronic components.industrial coatings and linings providing a
seamless, impermeable, abrasion-resistantbarrier against water and chemicals. C.I.M.’spolyurethane coatings have been keepingliquids were they belong in a variety ofapplications for over 30 years.
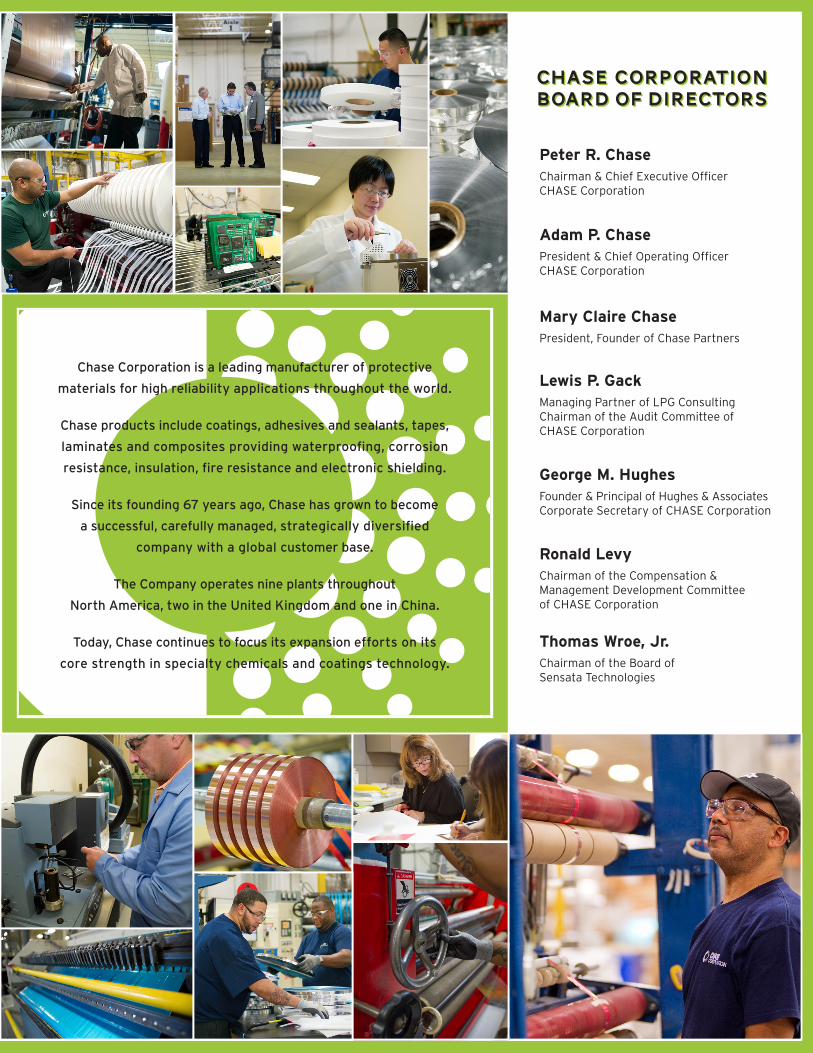
Chase Corporation is a leading manufacturer of protective
materials for high reliability applications throughout the world.
Chase products include coatings, adhesives and sealants, tapes,
laminates and composites providing waterproofing, corrosion
resistance, insulation, fire resistance and electronic shielding.
Since its founding 67 years ago, Chase has grown to become
a successful, carefully managed, strategically diversified
company with a global customer base.
The Company operates nine plants throughout
North America, two in the United Kingdom and one in China.
Today, Chase continues to focus its expansion efforts on its
core strength in specialty chemicals and coatings technology.
CHASE CORPORATION BOARD OF DIRECTORS
Adam P. ChasePresident & Chief Operating OfficerCHASE Corporation
Mary Claire ChasePresident, Founder of Chase Partners
Lewis P. GackManaging Partner of LPG ConsultingChairman of the Audit Committee of CHASE Corporation
George M. HughesFounder & Principal of Hughes & AssociatesCorporate Secretary of CHASE Corporation
Ronald LevyChairman of the Compensation & Management Development Committee of CHASE Corporation
Thomas Wroe, Jr.Chairman of the Board of Sensata Technologies
Peter R. ChaseChairman & Chief Executive Officer CHASE Corporation
CHASE CORPORATION BOARD OF DIRECTORS
EXECUTIVE OFFICES:
Bethany House, 26 Summer Street, Bridgewater, Massachusetts 02324
Tel: 508-819-4200 • Fax: 508-697-6419
GLOBAL OPERATIONS CENTER:
295 University Avenue, Westwood, Massachusetts 02090
Tel: 781-332-0700 • Fax: 781-332-0701
www.chasecorp.com • NYSE MKT : CCF
At Chase Corporation we
make a material difference
by manufacturing protective
materials that are used in a
wide variety of applications
where long lasting protection
is critical to a product’s
success and is a material
part of enhancing a product’s
value to its user.
Printed on recycled paper