Charting the Course Developing Effective Plans for the Future Youth Violence Reduction: Making the...
25
Charting the Course eveloping Effective Plans for the Future Youth Violence Reduction: Making the Case for Evidence Based Strategies
-
Upload
arnold-jordan -
Category
Documents
-
view
214 -
download
0
Transcript of Charting the Course Developing Effective Plans for the Future Youth Violence Reduction: Making the...

Charting the CourseDeveloping Effective Plans for the Future
Youth Violence Reduction: Making the Case for Evidence Based
Strategies

Presented by:
Karl Bertrand, L.M.S.W
“Evidence-Based Models” Guide HOW You Serve
“Evidence-Based Targeting” Guides WHO You Serve

Need to Target Limited Resources
• Option 1: Wait Until Kids Get Arrested
• Option 2: MOVE UPSTREAM

54 Risk Factors!
• Being Male
• Being Poor
• Being a Gang Member

We Need Weighted Risk Factors

The Standard Approach
• Survey Your Community
• Identify the Most Common Risk Factors
• Choose Which of the Most Common Risk Factors to Target
The Standard Approach is WEAK!

To Maximize Effectiveness
• DON’T Target the Most Common Risk Factors
• Target Those UNCOMMON Risk Factors (Or Combinations of Risk Factors) Most Closely Associated With Crime

The Challenge
How To Identify the Most Significant Risk Factors

The Yonkers JCEC Database
• Uses Unique IDs to Maintain Confidentiality
• Unique IDs Based on System Used for HIV Records
• Cross-References Multiple Data Sets

• Police Data
• School Data
• Social Service Data
• Census Data
The Yonkers JCEC Database
Police Data
Juvenile Arrests

School Data
• Truancy
• Suspensions
• Serious School Incidents
• Special Education Status

Social Service Data
Foster Care

Census Data
• Gender
• Age
• High Poverty Census Tracts (>20%)
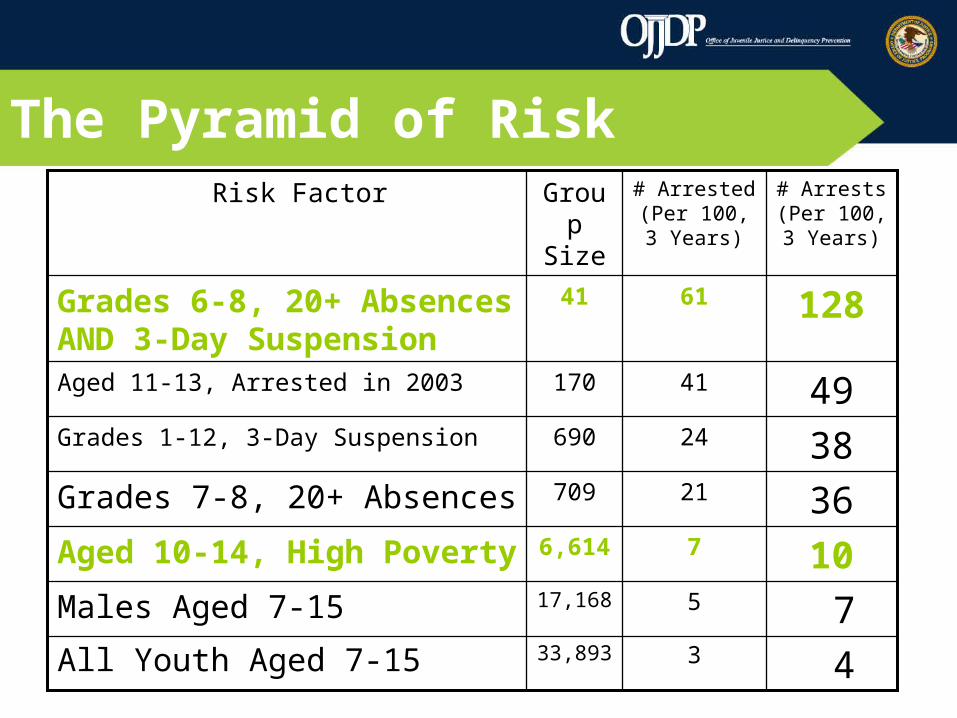
The Pyramid of Risk
4333,893All Youth Aged 7-15
7517,168Males Aged 7-15
1076,614Aged 10-14, High Poverty
3621709Grades 7-8, 20+ Absences
3824690Grades 1-12, 3-Day Suspension
4941170Aged 11-13, Arrested in 2003
1286141Grades 6-8, 20+ Absences AND 3-Day Suspension
# Arrests (Per 100, 3 Years)
# Arrested (Per 100, 3 Years)
Group Size
Risk Factor

Recommendations for Providers
1. Target the Highest Risk-Groups
HOW?
Use the Pyramid of Risk

2. But AVOID CREATING GANGS!
HOW?
Provide One-On-One Services
Mentoring
Functional Family Therapy
Scatter in Pro-Social Groups
Recommendations for Providers
3. Track Arrests (The Ultimate Outcome Measure)
HOW?
Preserve Confidentiality
Obtain Parental Consent
Give Program Participant Names to Police
Get Back ONLY Aggregate Number of Arrests
Recommendations for Providers
4. Use Yonkers Data as “Estimated Baseline”
HOW?
See “Sample Program Outcomes Form”
Recommendations for Providers

Recommendations for Providers
5. Estimate Cost Per Arrest Prevented
HOW?
Calculate Yonkers Baseline for Your Group
Compare Your Results to Estimated Baseline
Calculate Estimated Number of Arrests Prevented
Divide Costs By Number of Arrests Prevented

Recommendations for Providers
1. Target the Highest-Risk Groups
2. But AVOID CREATING GANGS
3. Track Arrests
4. Use Yonkers Data as “Estimated Baseline”
5. Estimate Cost Per Arrest Prevented

Recommendations for Funders
1. Target the Highest-Risk Groups
2. Measure % of High-Risk Groups Now Served
3. Make Funded Programs Report Arrest Rate
4. Compare Arrest Rates Across Similar Programs
5. Use Yonkers Data as Estimated Baseline
6. Estimate Cost Per Arrest Prevented
5. Join PD&D’s Proposed Research Project

Questions