Charnwood Community Safety Partnership PERFORMANCE DATA JUNE 2009.
24
Charnwood Community Safety Partnership PERFORMANCE DATA JUNE 2009
-
Upload
william-shields -
Category
Documents
-
view
214 -
download
0
Transcript of Charnwood Community Safety Partnership PERFORMANCE DATA JUNE 2009.

Charnwood Community Safety Partnership
PERFORMANCE DATA JUNE 2009

2
All Crime
12/15 from 13/15

3
SERIOUS ACQUISITIVE CRIME
SERIOUS ACQUISITIVE CRIME:
• DOMESTIC BURGLARY
• THEFT FROM MOTOR VEHICLE
• THEFT OF MOTOR VEHICLE
• ROBBERY

4
Serious Acquisitive Crime
9/15 from 10/15

5
SERIOUS ACQUISITIVE CRIMETarget reduction = -3%
Charnwood year to date % change = -2.5% (-1.1%)
Source: Leicestershire Police, 1st April 2008 to 9th June 2009
2008/9 2009/10
Charnwood LPU 197 240 21.8 49Loughborough LPU 278 223 -19.8 -47
Charnwood Borough 475 463 -2.5 2
% ChangeDifference
from Target
Crimes YTD
CHARNWOOD BOROUGH
100
150
200
250
Apr May Jun Jul Aug Sep Oct Nov Dec Jan Feb Mar
Cri
me
s
2008/09
2009/10

6
Domestic Burglary
Stayed the same 13/15

7
DOMESTIC BURGLARYTarget reduction = -3%
Charnwood year to date % change = 10% (-0.6%)
Source: Leicestershire Police, 1st April 2008 to 9th June 2009
2008/9 2009/10
Charnwood LPU 70 92 31.4 24Loughborough LPU 100 95 -5.0 -2
Charnwood Borough 170 187 10.0 22
% ChangeDifference
from Target
Crimes YTD
CHARNWOOD BOROUGH
0
50
100
150
Apr May Jun Jul Aug Sep Oct Nov Dec Jan Feb Mar
Cri
me
s
2008/09
2009/10

8
Theft from Unattended Motor Vehicle
7/15 to 8/15

9
THEFT FROM MOTOR VEHICLETarget reduction = -3%
Charnwood year to date % change = -19.1% (4.8%)
Source: Leicestershire Police, 1st April 2008 to 9th June 2009
2008/9 2009/10
Charnwood LPU 97 103 6.2 9Loughborough LPU 128 79 -38.3 -45
Charnwood Borough 225 182 -19.1 -36
Difference from Target
Crimes YTD% Change
CHARNWOOD BOROUGH
0
50
100
150
Apr May Jun Jul Aug Sep Oct Nov Dec Jan Feb Mar
Cri
me
s
2008/09
2009/10

10
Theft of a Motor Vehicle
10/15 to 11/15

11
THEFT OF MOTOR VEHICLETarget reduction = -3%
Charnwood year to date % change = 25.5% (-10.7%)
Source: Leicestershire Police, 1st April 2008 to 9th June 2009
2008/9 2009/10
Charnwood LPU 26 37 42.3 12Loughborough LPU 29 32 10.3 4
Charnwood Borough 55 69 25.5 16
Crimes YTD% Change
Difference from Target
CHARNWOOD BOROUGH
0
20
40
Apr May Jun Jul Aug Sep Oct Nov Dec Jan Feb Mar
Cri
me
s
2008/09
2009/10

12
Robbery
10/15 to 11/15

13
ROBBERYTarget reduction = -3%
Charnwood year to date % change = 0% (-21.4%)
Source: Leicestershire Police, 1st April 2008 to 9th June 2009
2008/9 2009/10
Charnwood LPU 4 8 100.0 4Loughborough LPU 21 17 -19.0 -3
Charnwood Borough 25 25 0.0 1
Crimes YTD% Change
Difference from Target
CHARNWOOD BOROUGH
0
10
20
Apr May Jun Jul Aug Sep Oct Nov Dec Jan Feb Mar
Cri
me
s
2008/09
2009/10

14
Cycle Theft
Stayed the same 15/15

15
CYCLE THEFTTarget reduction = -3%
Charnwood year to date % change = 83.3% (24%)
Source: Leicestershire Police, 1st April 2008 to 9th June 2009
2008/9 2009/10
Charnwood LPU 14 30 114.3 16Loughborough LPU 58 102 75.9 46
Charnwood Borough 72 132 83.3 62
% ChangeDifference
from Target
Crimes YTD
CHARNWOOD BOROUGH
0
50
100
Apr May Jun Jul Aug Sep Oct Nov Dec Jan Feb Mar
Cri
me
s
2008/09
2009/10
16
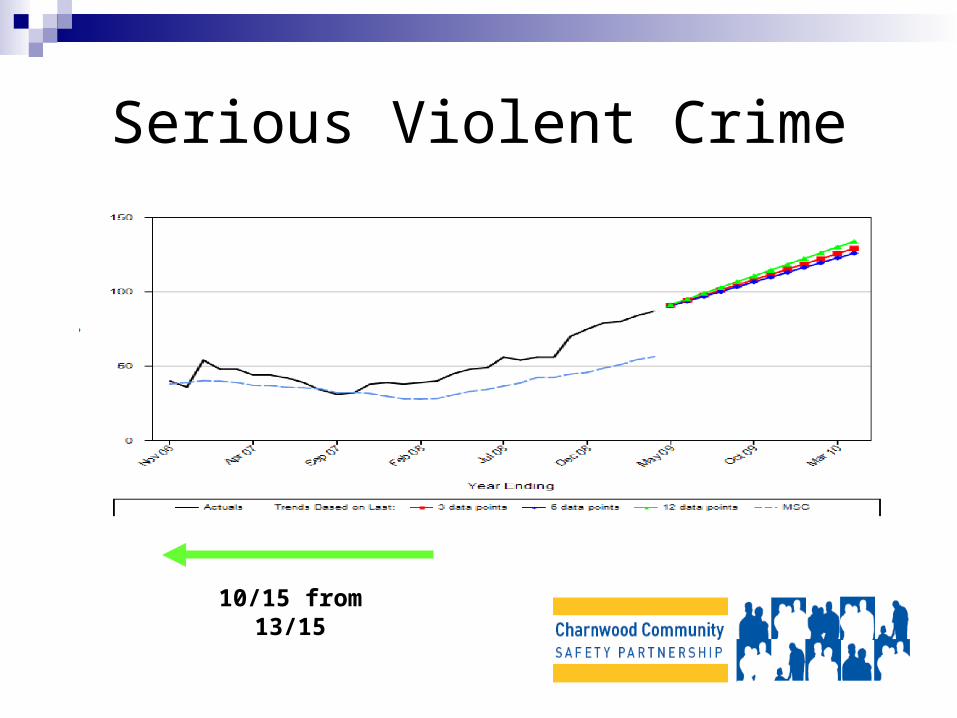
Serious Violent Crime
10/15 from 13/15

17
SERIOUS VIOLENT CRIMETarget reduction = -5%
Charnwood year to date % change = -12.5% (20%)
Source: Leicestershire Police, 1st April 2008 to 9th June 2009
2008/9 2009/10
Charnwood LPU 6 4 -33.3 -2Loughborough LPU 10 10 0.0 1
Charnwood Borough 16 14 -12.5 -1
Difference from Target
Crimes YTD% Change
CHARNWOOD BOROUGH
0
10
20
Apr May Jun Jul Aug Sep Oct Nov Dec Jan Feb Mar
Cri
me
s
2008/09
2009/10

18
Assault with Less Serious Injury
12/15 to 13/15

19
ASSAULT WITH LESS SERIOUS INJURYTarget reduction = -3%
Charnwood year to date % change = -9.7% (-5.1%)
Source: Leicestershire Police, 1st April 2008 to 9th June 2009
2008/9 2009/10
Charnwood LPU 89 73 -18.0 -13Loughborough LPU 127 122 -3.9 -1
Charnwood Borough 216 195 -9.7 -15
Crimes YTD% Change
Difference from Target
CHARNWOOD BOROUGH
50
100
150
Apr May Jun Jul Aug Sep Oct Nov Dec Jan Feb Mar
Cri
me
s
2008/09
2009/10

20
HATE INCIDENTS
HATE INCIDENTS:
• RACIAL (80%)
• RELIGIOUS (5%)
• HOMOPHOBIC (13%)
• AGE (0.5%)
• DISABILITY (0.5%)
• GENDER (1%)
(Based on data for 2008/09)

21
HATE INCIDENTS
Charnwood year to date % change = 8.6% (12.6%)
Source: Leicestershire Police, 1st April 2009 to 31st May 2009
2008/09 2009/10
Charnwood LPU 11 10 -9.1Loughborough LPU 24 28 16.7
Charnwood Borough 35 38 8.6
% ChangeIncidents YTD
CHARNWOOD BOROUGH
0
10
20
30
Apr May Jun Jul Aug Sep Oct Nov Dec Jan Feb Mar
Inc
ide
nts
2008/09
2009/10

22
ANTISOCIAL BEHAVIOUR INCIDENTS
Charnwood year to date % change = -9.8% (3.5%)
Source: Leicestershire Police, 1st April 2009 to 31st May 2009
2008/9 2009/10
Charnwood LPU 611 563 -7.9Loughborough LPU 730 646 -11.5
Charnwood Borough 1341 1209 -9.8
Incidents YTD% Change
CHARNWOOD BOROUGH
400
500
600
700
800
Apr May Jun Jul Aug Sep Oct Nov Dec Jan Feb Mar
Inc
ide
nts
2008/09
2009/10

23

24