Characterizing catches taken by different gears as a step towards ...
38
1 Please note that this is an author-produced PDF of an article accepted for publication following peer review. The definitive publisher-authenticated version is available on the publisher Web site. Fisheries Research April 2015, Volume 164 Pages 238-248 http://dx.doi.org/10.1016/j.fishres.2014.11.019 http://archimer.ifremer.fr/doc/00248/35882/ © 2014 Elsevier B.V. All rights reserved. Achimer http://archimer.ifremer.fr Characterizing catches taken by different gears as a step towards evaluating fishing pressure on fish communities Fauconnet Laurence 1, *, Trenkel Verena 1 , Morandeau Gilles 2 , Caill-Milly Nathalie 2 , Rochet Marie-Joelle 1 1 IFREMER, Département Écologie et Modéles pour l’Halieutique, B.P. 21105, 44311 Nantes Cedex 03, France 2 IFREMER, Laboratoire Ressources Halieutiques Aquitaine, UFR Côte Basque, 1 allée du Parc Montaury, 64600 Anglet, France * Corresponding author : Laurence Fauconnet, email address : [email protected] Abstract : To implement an ecosystem approach to fisheries management, there is a need to characterize the total pressure exerted by fisheries at the community level. French onboard observer data were used to derive catch metrics and compare fishing distribution across community components between two sites in the Southern Bay of Biscay. Sample-based rarefaction curves were used to standardize metrics across different active and passive gears, and correct for sample size differences. Six metrics for species, length and functional catch composition were tested. Length and functional metrics were found the most relevant metrics to highlight differences in catches between gears, sites, and gear-site interactions. Significant differences were found between gears, mainly in mean length and proportion of piscivores. None of the gears had the most diverse catch across all metrics. Small differences were found between sites, mainly in length range and species richness. Keywords : Catch diversity, Gear comparison, Multivariate analyses, Southern Bay of Biscay
-
Upload
truongcong -
Category
Documents
-
view
219 -
download
2
Transcript of Characterizing catches taken by different gears as a step towards ...
1
Please note that this is an author-produced PDF of an article accepted for publication following peer review. The definitive publisher-authenticated version is available on the publisher Web site.
Fisheries Research April 2015, Volume 164 Pages 238-248 http://dx.doi.org/10.1016/j.fishres.2014.11.019 http://archimer.ifremer.fr/doc/00248/35882/ © 2014 Elsevier B.V. All rights reserved.
Achimer http://archimer.ifremer.fr
Characterizing catches taken by different gears as a step towards evaluating fishing pressure on fish communities
Fauconnet Laurence 1, *, Trenkel Verena 1, Morandeau Gilles 2, Caill-Milly Nathalie 2, Rochet Marie-Joelle 1
1 IFREMER, Département Écologie et Modéles pour l’Halieutique, B.P. 21105, 44311 Nantes Cedex 03, France 2 IFREMER, Laboratoire Ressources Halieutiques Aquitaine, UFR Côte Basque, 1 allée du Parc Montaury, 64600 Anglet, France
* Corresponding author : Laurence Fauconnet, email address : [email protected]
Abstract : To implement an ecosystem approach to fisheries management, there is a need to characterize the total pressure exerted by fisheries at the community level. French onboard observer data were used to derive catch metrics and compare fishing distribution across community components between two sites in the Southern Bay of Biscay. Sample-based rarefaction curves were used to standardize metrics across different active and passive gears, and correct for sample size differences. Six metrics for species, length and functional catch composition were tested. Length and functional metrics were found the most relevant metrics to highlight differences in catches between gears, sites, and gear-site interactions. Significant differences were found between gears, mainly in mean length and proportion of piscivores. None of the gears had the most diverse catch across all metrics. Small differences were found between sites, mainly in length range and species richness.
Keywords : Catch diversity, Gear comparison, Multivariate analyses, Southern Bay of Biscay

1. Introduction
The ecosystem approach to fisheries (EAF) aims at maintaining ecosystem
productivity for present and future generations by balancing multiple societal
objectives (Garcia et al., 2003). One goal of fisheries management under an EAF
is to keep fishing impacts on the ecosystem within acceptable limits, where the5
ecosytem structure and functioning is not threatened. The causal relationships
formalized under the Driver - Pressure - State - Impact - Response (DPSIR)
framework can help management. In particular, pressure can be ajusted by
managers to keep the state of marine communities within, or move it towards,
acceptable limits (Piet et al., 2006).10
While methods exist and are commonly used to characterize fishing pres-
sure on target populations, the limited knowledge on the biology and ecology
and lack of fisheries data for most species imply that fishing pressures can not
be characterized by fishing mortality or harvest rate at the community level
(Piet et al., 2006). It has been hypothesized that both the total amount of fish-15
ing, and the way fishing pressure is distributed among ecosystem components
determine fishing impacts on the community level (Garcia et al., 2012). There-
fore, to develop an EAF, there is a need to characterize fishing pressure at the
community level, i.e. the mortality caused by all fishing gears deployed in a
given fishing ground on commercial and non-commercial species. Indicators are20
necessary tools to support this task as they provide information on the range
and intensity of effort and mortality (Jennings, 2005; Piet et al., 2006). Two
aspects of fishing pressure can be considered at the community level : fishing in-
tensity and distribution across community components. In this study, we focus
on how pressure is distributed across community components.25
Pressures exerted on marine communities have long been considered only
through the landings as declared by fishers and recorded on markets. How-
ever, landings represent only part of what is caught by fishers. Discards can
make up a significant part of the catch, depending on the gear, area, sea-
son and species (Cornou et al., 2013; Hall et al., 2000), including for passive30
2
gears (Morandeau et al., 2014). Most individuals when discarded are dead, and
even if few studies have been undertaken on the survival of species that are
released alive, a high level of mortality is assumed (Hall et al., 2000; Revill,
2012). Onboard observer programmes were developped to address the need
to identify and quantify the whole catch, distinguished between landings and35
discards (Alfaro-Shigueto et al., 2010; Attwood et al., 2011). By providing in-
formation on the amount, diversity and body size of the catch, onboard observer
data are a valuable source to describe fisheries catches at the community level
in its multiple dimensions such as species, length, and functional composition.
Onboard observer programmes further provide data on the characteristics40
and conditions of the fishing operations and on the main fishing metiers. Fishing
mortality is likely to differ between gears (Piet et al., 2006). Therefore fishing
pressure should be characterized by gear. Given the large diversity of gear
characteristics, a gear can be defined at different levels of precision. The fishing
method or gear group as defined by the European Union (EU) Data Collection45
Framework (DCF; European Union, 2008), e.g. bottom trawls or mid-water
trawls, subsequently called ’gear’ was chosen in this study.
The catch composition reflects both the selective properties of the gear and
how it is operated, and the available fish community. In order to study the effect
of the gear on the catch composition, we selected two sites in the Southern Bay50
of Biscay that are structurally and ecologically broadly similar, but differ in
their exploitation though they are partly exploited by similar gears (see Section
2.1). Demersal and pelagic fisheries operate in both sites. In the most Southern
site, the coastal area in ICES rectangle 16E8, the area located within 3 miles
from the coast and part of the 3-6 miles band, is prohibited to bottom and55
pelagic trawlers (figure 1 ; Sanchez et al., 2013). This site is consequently mostly
harvested by passive fishing gears (figure 1). In the second site located further
North, the coastal area in ICES rectangle 19E8, trawling is allowed due to
exemptions limiting the application of the trawling ban inside the 3 miles limit
(Le Tixerant, 2006). This site is mostly exploited by active gears (figure 1).60
These study sites are well suited to test the relevance of metrics and highlight
3

differences between gears and sites.
Data from the French onboard observer programme were used to compare
the catch for all species between gears and sites. However, the onboard ob-
server sampling plan was not established for this purpose, but for estimating65
discarded amounts per fishing metier. Therefore, the sample size was heteroge-
neous between gears and sites. Sample size is known to affect catch composition,
especially its diversity (Magurran & McGill, 2011). Besides, different gears use
different capture processes, mainly based on fish behaviour (Huse et al., 1999).
A fishing operation from a given gear is not directly comparable with a fish-70
ing operation from another gear, especially when comparing passive and active
gears. Therefore, metrics needed to be standardized before they could be com-
pared.
The objectives of this study were : i) to propose a method to standardize
and compare the distribution of catches across community components between75
passive and active fishing gears based on different sample size, and ii) to pro-
pose relevant metrics to characterize the catches that can highlight differences
between gears.
2. Materials and methods
2.1. Study sites80
The structure and sediments of the continental shelf in the Southern Bay
of Biscay are homogeneous all along the coast of Aquitaine (Le Suave et al.,
2000). Sediments are mostly sandy, except in the deep environment of the
Capbreton canyon, which is composed by a mix of rocks, coarse sediments
and mudflats. This geological formation favours the presence of species and85
life stages which live in deeper areas, such as mature hake (Merluccius mer-
luccius ; Sanchez & Gil, 2000). The Southern Bay of Biscay is important for
migratory species like meagre (Argyrosomus regius) in particular for feeding
(Sourget & Biais, 2009). The Southern Bay of Biscay is also the geographic
Northern limit of some species belonging to the Sparidae family (Quero & Vayne,90
4

Figure 1: Map of sampled fishing operations observed by gear onboard fishing vessels (2003-
2012) in the Southern site and in the Northern site in the Southern Bay of Biscay (inset).
2005). Habitats and associated communities of the two sites are influenced by
the plume of major rivers: Adour River for the Southern site, Gironde for the
Northern site (figure 1). River plumes provide habitat for spawning and feeding
for many species such as hake, monkfish (Lophius piscatorius and L. budegassa),
sea bass (Dicentrarchus labrax ), common sole (Solea solea ; Le Pape et al.,95
2003), turbot (Scophthalmus maximus), mackerels (Scomber scombrus and S.
colias ; Borja et al., 2002), anchovy (Engraulis encrasicolus ; Borja et al., 1998).
For those reasons, the two sites, situated 100 km apart, are considered ecologi-
cally broadly similar.
A major difference between the sites lies in the fact that, because of differ-100
ences in access conditions for trawlers, they are harvested by different combina-
tions of fishing gears. The Southern site is exploited by pelagic (purse seiners,
baitboaters and pelagic trawlers) and demersal (gillnetters, longliners and pots)
fisheries, most of which use passive gears. Pelagic species constitute the most
abundant fish in the catch with mackerels, pilchard (Sardina pilchardus), horse105
mackerel (Trachurus trachurus), anchovy and tunas (Thunnus alalunga and T.
5

thynnus). Pelagic species are caught by a few boats on a small number of
trips. The main demersal target species are hake, monkfishes, sea bass, com-
mon sole, turbot and Sparidae. About 70% of all boats operating in this area
are smaller than 12 m length and perform a large number of short fishing trips110
(Leblond et al., 2010). The Northern site, where trawling is allowed, is charac-
terized by pelagic and demersal fisheries targeting the same species along with
cephalopods (Loligo spp, Sepia officinalis), which deploy mostly active gears.
Pelagic species are mainly exploited by pelagic trawlers. Demersal species are
exploited by bottom trawlers and gillnetters, the latter are the most important115
metiers in this area (92% of the activity in number of months ; Leblond et al.,
2010). Eighty percent of the boats that fished at least once in this area in 2008
were longer than 12 m.
2.2. Onboard observer programme
Data from the French onboard observer programme contribute to the char-120
acterization of fishing pressure at the community level by providing information
about the catch composition, as well as the characteristics and conditions of the
fishing operation.
According to the sampling plan of the national programme, observers ran-
domly select professional fishing boats to embark on, and once aboard randomly125
sample fishing operations (FOs). A FO includes all actions from the shooting
to the hauling of the gear. The geographical positions, target species, gear and
mesh size used, fishing time, and other information on the fisher’s strategy and
conditions of the FOs are recorded.
On sampled FOs, the whole catch is also recorded for both the landed and130
the discarded parts. All species of fish and commercial invertebrates are iden-
tified to the most precise level possible, ideally to the species level, counted,
weighed (weight is sometimes calculated using the length/weight relationship)
and measured.
The level of species identification can vary according to the observer’s expe-135
rience and/or the species. To circumvent this issue, 32 taxa which are difficult
6
to identify were grouped here at the family or genus level (Allotheutis, Alosa,
Argentina, Arnoglossus, Callionymus, Hippocampus, Labrus, Loligo, Lophius,
Microchirus, Mullus, Mustelus, Octopus, Pagellus, Scomberomorus, Scorpaena,
Scyliorhinus, Sepia, Seriola, Serranus, Solea except S. solea, Sparus, Syng-140
nathus, Torpedo, Trachurus, Trisopterus, and families Carangidae, Gobiidae,
Mugilidae, Palinuridae, Rajidae except Raja clavata and Leucoraja naevus, and
Triglidae).
All observations from 2003 to 2012 were analysed together because of the
limited quantity of data available on study sites. Additional observations carried145
out between July 2011 and December 2012 on coastal netters and longliners
deployed around the Capbreton canyon in the context of the regional programme
LOUPE (Observation of the habitat and associated communities in the context
of the fisheries of the Capbreton Canyon) were also used in this study. They
followed the same protocol.150
The geographical distribution of observations collected on each site of our
case study is shown by gear in figure 1. Sampling effort was measured as the
number of observed fishing operations and vessels. The main group of target
species as declared beforehand by fishers, the mesh size mode and range informed
about the fishers’ strategy per gear and site. For each gear-site combination,155
the total number of individuals caught was calculated per FO and the mean
value over FOs was used as a proxy for the pressure intensity of an average
gear deployment. To determine which components were extracted from the
community by each gear, we characterized the catch in species, grouped by
combined taxon and main habitat (see Appendix), and in length.160
2.3. Catch metrics
Since marine communities have different dimensions, three kinds of catch
metrics were calculated (table 1): (i) species-based metrics to provide informa-
tion on the number of species under fishing pressure and their relative abun-
dance, (ii) length-based metrics to provide information on the length of the165
catch and its range, and (iii) functional metrics to provide information on the
7

trophic composition of the catch. Mean length and median length provided sim-
ilar results, so just mean length is reported below. For the functional metrics,
each species was classified as piscivore or non-piscivore, based on the main diet
of adult individuals (see Appendix).170
Table 1: List of catch metrics (ni = number of individuals for ith species ; N = total number
of individuals ; Lj = jth length class in cm ; Nj = number at jth length class ; L0.95 =
quantile 95% of length distribution ; L0.05 = quantile 5% of length distribution ; W = weight
; pisc = piscivores ; C = whole catch across all species = landings + discards) and method
used for their estimation (RC = asymptote of rarefaction curve ; x = median of all resamples
from sample sizes larger than 60% of the maximum sample size - see Section 2.3 and figure 2
; xlogit = mean on all logit-transformed replicates from sample sizes larger than 60% of the
maximum sample size - see Section 2.3 and figure 2).
Type Name Code Calculation Description Method
Species Richness S Number of species RC
Evenness E1/D1/DS with D =∑i (
ni
N )2
Variability in species abun-
dance (Simpson)
RC
Length Mean length L
∑Lj×Nj∑
NjLength of individuals in the
catch in cm
x
Length range △L L0.95 − L0.05 Interpercentile range 5-95%
of length distribution in cm
x
Functional Piscivore
weight pro-
portion
PWR
∑Wpisc∑WC
Proportion of piscivores in
catch
xlogit
Piscivore
number
proportion
PNR
∑Npisc∑NC
In comparison with PWR,
says if piscivores are larger
than other functional groups
xlogit
The FOs of passive and active gears cannot be directly compared because
they use different capture processes based on different fish behaviours (Huse et al.,
1999). Also for a given gear, the number of observed FOs per site differed (ta-
8

ble 2). Sample size is known to affect the estimates of most selected metrics,
especially species richness (Gotelli & Colwell, 2001; Magurran & McGill, 2011).175
Sample-based, i.e. FO-based, rarefaction curves were used to circumvent these
problems. Individuals from the same FO can not be considered as independant
entities. Indeed, they are likely to reflect spatial aggregation because the tar-
geting undertaken by professional fishers focuses on places with high resource
concentrations (Huse et al., 2000). FO-based, instead of individual-based, rar-180
efaction curves were thus selected because they preserve the spatial structure
of the data (Gotelli & Colwell, 2001; Magurran & McGill, 2011). Rarefaction
curves tend to favor the species with the highest occurrences, contrary to meth-
ods that use the frequency of the rarest species to estimate the frequencies
of undetected species, that provide more accurate estimates of the total species185
richness of a community (Chao et al., 2005). Since the purpose in this study is to
characterize not the whole community, but the part of the community, including
the number of species, available to each gear, rarefaction curves were preferred.
Because they are based on a re-sampling method, they could be used to estimate
uncertainty in metric estimates ascribable to sample size (Efron & Tibshirani,190
1994). Sample-based rarefaction curves were used to standardize metric esti-
mates across gears to allow comparison between them (Gotelli & Colwell, 2001).
For this, a bootstrap was carried out by randomly sampling with replacement
FOs per combination of gear-site. The size of the re-sample varied from 1 to
20 FOs, or 1 to 50 FOs for gear-site combinations with more than 100 sampled195
FOs. A thousand replicates were drawn for each re-sample size. Metrics were
calculated for each replicate.
With increasing sample size, the metric value converged toward an asymp-
totic value. The speed and shape of the convergence differed between metrics
types, so different methods were used for their estimation (summarized in table200
1; figure 2). Species metrics kept varying with increasing sample size, though
they started to level off. They were estimated by determining the asymptote
value and its associated standard deviation after fitting a Michaelis-Menten
function: S(n) = Smax×nB+n , with S the value of the metric, Smax the asymp-
9

totic value of the metric to be estimated, n the sample size and B the sample205
size to get half the asymptotic value - ’half life’ value (figure 2a). Length and
functional metrics converged rapidly with increasing sample size. Length met-
rics were estimated by calculating the median and standard deviation based on
all replicates from the largest sample sizes. A threshold of 60% of the maxi-
mum sample size was chosen. Therefore, estimates of length metrics were cal-210
culated as the median of all replicates from 12 to 20 or from 30 to 50 FOs
(figure 2b). Metrics of functional composition, bounded between 0 and 100,
were first logit-transformed (y = log( x1−x )) to make the values symmetrical and
unbounded (Jørgensen & Pedersen, 1998). They were calculated as the mean
value of all the logit-transformed replicates from 12 to 20 or 30 to 50 FOs (fig-215
ure 2c), then converted back to the original scale. The standard deviation was
calculated on the original scale as σX = X(1 − X)σY with X = exp(Y )
1+exp(Y ), Y
the logit-transformed values and σY the standard deviation calculated for the
logit-transformed values (Jørgensen & Pedersen, 1998).
(a) (b) (c)
Species Length Functional composition
Figure 2: Methods for estimating metrics devoid of sample size effect and for standardizing
catch characteristics between different passive and active gears, illustrated for gillnets in the
Southern site : (a) rarefaction curve and asymptotic value of a fitted Michaelis-Menten model
for species richness, (b) median of replicates resampled with sample size larger than 60%
of the maximum sample size, for mean length, and (c) mean of logit-transformed replicates
resampled with sample size larger than 60% of the maximum sample size, for piscivore weight
proportion.
10
2.4. Metric comparison among gears and sites220
Rarefaction curves were used to estimate catch metrics standardized for sam-
pling effort. One estimate was obtained for each gear-site combination. How-
ever, the estimates were associated with an uncertainty due to the variability
between FOs. In order to account for this variability, a parametric resampling
was carried out by randomly drawing 500 samples from a gaussian distribution225
N (Smax, σ2) with Smax the estimated value and σ its associated standard
deviation, for each gear-site combination. They are referred to as ’resamples’.
A two-way analysis of variance (ANOVA) was undertaken for all resamples
separately for each metric to highlight significant effects of gear and site. For this
ANOVA (A1) linear models with metric as response variable, and gear and site230
as factors, were fitted and the effects of the factors on each metric were tested by
a Fisher’s test. All gears were included. The percentage of variance explained
by each factor was calculated as the sum of squares for each factor divided by
the total sum of squares. Since the sample size was artificially increased by the
parametric resampling, only the relative importance of factors, and not the full235
results, was displayed and discussed.
Multivariate analyses were also undertaken using the resamples from the
different gears and sites as individuals and catch metrics as variables. A prin-
cipal component analysis (PCA1) was carried out to examine the relationships
between species, length and functional metrics. Groups of resampled replicates240
based on their center of gravity were visualised through starplots by site (North
and South) and by gear.
For the comparison of gears deployed on both sites, a second ANOVA (A2)
was performed including a gear-site interaction effect. The gear-site interaction
informs on whether the differences between gears varied between sites. Such245
differences neither ascribable to the gear nor to the site (i.e. the environment of
the FOs) would likely to be due to the way the gear was rigged and/or deployed
in the site and thus resulting from different fishers’ strategies. Bottom and
pelagic trawls as well as longlines were removed from this analysis as they were
only present on one of the sites.250
11

A second PCA (PCA2), similar to PCA1 but using only on resamples from
the gears deployed in both sites was performed to highlight differences between
sites by a given gear.
3. Results
3.1. Description of observer data for study sites255
The number of observed fishing operations differed markedly between gears
and sites ranging from 14 to 175 (table 2). All gears were mainly targeting
bottom-dwelling species, the main target species were flatfish, gadoids and other
demersal fish (table 2). The main mesh size used in both sites for all gears,
except for bottom trawls, was 100 mm. However, a wide range of mesh sizes260
were used by each gear, with a wider range in the South than in the North.
Table 2: Number of sampled fishing operations (FO) and characteristics from each site and
gear in number of sampled vessels, main group of target species (FLF = flatfish, DEF =
demersal fish except gadoids, GAF = gadoid fish, MXF = diverse or unspecified fish) and
mesh size mode with mesh size range in mm.
Site Gear
code
Gear name No of
FO
No of
vessels
Targets Mesh size [min-
max] (mm)
South TN Trammel nets 112 11 FLF 100 [85-270]
GN Gillnets 175 14 DEF, GAF, MXF 100 [50-190]
LL Longlines 12 5 GAF, DEF -
North TN Trammel nets 168 15 FLF 100 [70-100]
GN Gillnets 36 5 DEF 100 [84-110]
PT Pelagic trawls 14 7 DEF, GAF, MXF 100 [16-100]
BT Bottom trawls 62 16 FLF, MXF 70 [40-80]
The mean number of individuals per FO differed between fishing gears (figure
3 a). Bottom and pelagic trawls caught more individuals per FO than nets and
12

longlines, with trammel nets catching an intermediate number of individuals.
In the South, the mean number of individuals caught was smaller than in the265
North, even for the same gear. The variability between FOs was large, especially
for pelagic trawls.
Demersal fishes represented an important part of the catch for all gears
(figure 3 b). Benthic species also constituted an important part of the catch,
especially benthic fish and crustaceans for bottom trawls, trammel nets and,270
to a lesser extent, gillnets in the Southern site. Pelagic species were caught in
smaller proportions, even by pelagic trawls for which pelagic fishes represented
less than 20% of the total catch weight.
Differences in catch lengths were observed, with bottom trawls catching the
smallest individuals and longlines catching the largest ones (figure 3 c). All275
gears caught individuals of lengths comprised between 20 and 40 cm.
BT PT GN TN GN TN LL
Mea
n nu
mbe
r of
indi
vidu
als
per
FO
050
010
0015
0020
0025
00
(a)
North SouthGear / Site
BT PT GN TN GN TN LL
% b
iom
ass
0
20
40
60
80
100
BT PT GN TN GN TN LL0
20
40
60
80
100
CRU FIS MOLBEN DEM PEL
(b)
North SouthGear / Site
06
(c)BT
06 PT
06 GN
06 TN
0 20 40 60 80 100 120
06 LL
Leng
th c
ompo
sitio
n (%
num
ber)
Length class (cm)
Figure 3: Characterization of catches in the Southern Bay of Biscay (2003-2012): (a) fishing
intensity in mean number of individuals caught by each gear and site with vertical bars =
95% confidence intervals, and (b-c) fishing distribution across community components : (b)
composition of the catch in combined taxonomic group (CRU = crustacean; FIS = fish; MOL
= mollusc) and main habitat (BEN = benthic; DEF = demersal; PEL = pelagic), and (c)
length composition of the catch, for each gear (BT = bottom trawls ; GN = gillnets ; LL =
longlines ; PT = pelagic trawls ; TN = trammel nets) in the Southern site (black) and the
Northern site (grey).
13

3.2. Catch metrics
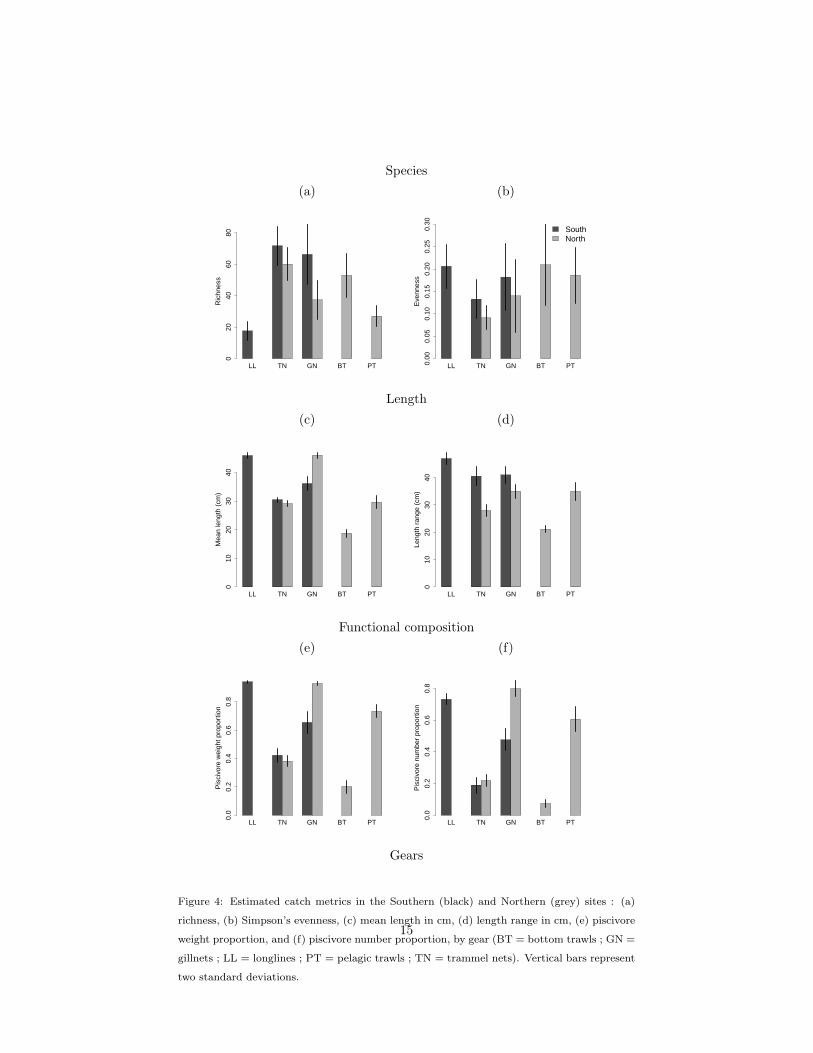
Species richness varied widely between gears (figure 4 a). Gillnets, trammel
nets and bottom trawls caught a high number of species, while pelagic trawls
caught a lower number of species and longlines caught less than 20 species. For280
gears being used in both sites (trammel nets and gillnets), richness was generally
higher in the South than in the North, but this difference was not significant
due to a high inter-FO variability.
There was no significant difference in evenness among gears (figure 4 b). For
the nets, the catch was generally more even in the South than in the North,285
though this difference was not significant.
Mean length varied between gears with longlines and gillnets catching the
largest individuals, while bottom trawls caught smaller ones (figure 4 c). Both
pelagic trawls and trammel nets caught intermediate lengths, with mean length
around 30 cm. Differences between the North and South differed among gears,290
mean length was similar for trammel nets, but smaller in the South for gillnets.
The length range was similar between gillnets, trammel nets and pelagic
trawls, while it was larger for longlines and smaller for bottom trawls (figure 4
d). This means bottom trawls caught a narrower length range than other gears.
The range of lengths caught was wider in the South than in the North for both295
gillnets and trammel nets.
The proportion of piscivores greatly differed between gears, with the propor-
tion in weight being consistently larger than the proportion in numbers (figure 4
e, f). Longlines, gillnets and pelagic trawls had a catch dominated by piscivores,
while piscivores were inferior to 40% in the catch of trammel nets and bottom300
trawls (figure 4 e, f). The proportion of piscivores was similar between both
sites for trammel nets but it was significantly lower for gillnets in the South
than in the North.
14
Species
(a) (b)
LL TN GN BT PT
Ric
hnes
s
020
4060
80
LL TN GN BT PT
Eve
nnes
s
0.00
0.05
0.10
0.15
0.20
0.25
0.30
SouthNorth
Length
(c) (d)
LL TN GN BT PT
Mea
n le
ngth
(cm
)
010
2030
40
LL TN GN BT PT
Leng
th r
ange
(cm
)
010
2030
40
Functional composition
(e) (f)
LL TN GN BT PT
Pis
civo
re w
eigh
t pro
port
ion
0.0
0.2
0.4
0.6
0.8
LL TN GN BT PT
Pis
civo
re n
umbe
r pr
opor
tion
0.0
0.2
0.4
0.6
0.8
Gears
Figure 4: Estimated catch metrics in the Southern (black) and Northern (grey) sites : (a)
richness, (b) Simpson’s evenness, (c) mean length in cm, (d) length range in cm, (e) piscivore
weight proportion, and (f) piscivore number proportion, by gear (BT = bottom trawls ; GN =
gillnets ; LL = longlines ; PT = pelagic trawls ; TN = trammel nets). Vertical bars represent
two standard deviations.
15

3.3. Comparison of catch between study sites harvested by different combinations
of gears305
Results from the ANOVA undertaken on all gears (A1) showed significant
effects of both site and gear on each metric (p(F) < 0.05). Gear explained
a higher variance proportion for all metrics (table 3), compared to site. The
unexplained part remained high (> 70%) for evenness. By contrast, for mean
length and piscivore proportions, gears explained the majority of variance (>310
85%), suggesting that those metrics are the most relevant to detect differences
among gears.
Table 3: Percentage of variance explained by gear and site for each catch metric from the
analysis of variance undertaken on all gears deployed in each site (A1).
Metric Gear Site % residuals
Richness 56.6 12.3 31.1
Evenness 26.0 3.8 70.1
Mean length 89.0 2.9 8.1
Length range 69.7 18.0 12.3
Piscivore weight proportion 85.3 4.9 9.8
Piscivore number proportion 86.8 5.3 7.9
The first two axes of the principal component analysis on all gears (PCA1)
explained 79% of the total variance, with the first axis explaining 61%. Along
this axis, a strong positive correlation was found between both piscivore pro-315
portions, mean length and length range (figure 5 a). The higher the proportion
of piscivores, the larger the individuals in the catch and the wider the length
range. Richness was negatively correlated with length and functional metrics.
The richer the catch, the smaller the proportion of piscivores, the smaller the
individuals, but also the narrower the length range. Evenness was nearly inde-320
pendent from length and functional metrics but was negatively correlated with
richness. This means that catches made of a small number of species were more
16

even.
(a)
(b) (c)
BT
GN
LL PT
TN
North
South
Figure 5: Principal component analysis of catch metrics for all gears deployed in each site
(PCA1) with 61% of the variance explained by the 1st axis, 18% explained by the 2nd axis.
(a) Catch metrics loadings (Nb = number ; Wt = weight). Groups of resamples (b) by gear
(BT = bottom trawls ; GN = gillnets ; LL = longlines ; PT = pelagic trawls ; TN = trammel
nets) and (c) by site.
The grouping of resamples by gear clearly differentiated the gears, mainly
along the length and functional metrics (figure 5 b). Bottom trawls and trammel325
nets caught smaller individuals, a narrower length range and a smaller propor-
tion of piscivore while longlines caught the largest individuals with a wide length
range and a large proportion of piscivores (figure 5 b). Pelagic trawls and gill-
nets were mainly differentiated by species metrics with gillnets having a richer
catch (figure 5 b).330
17

Small differences between the Southern and the Northern sites were observed,
the length of the individuals caught in the Southern site were slightly larger and
more dominated by piscivores than the catch in the Northern site (figure 5 c).
3.4. Comparison of catch by similar gears between study sites
Results from the ANOVA undertaken only on gears deployed in both sites,335
trammel nets and gillnets (A2) showed a significant effect of both gear and site
on all metrics, as well as an effect of the gear-site interaction on all metrics
except evenness (table 4).
While gear explained most of the variance for mean length and piscivore
proportions (> 66%), site explained a greater variance part for length range340
and richness (table 4). The gear-site interaction explained a small percentage
of the variance for all metrics, except for mean length and piscivore weight
proportion (> 16%). The unexplained part remained high (> 50%) for evenness
and richness.
Table 4: Percentage of variance explained by gear, site and gear-site interaction for each catch
metric from the analysis of variance undertaken only on common gears deployed in both sites,
trammel nets and gillnets (A2).
Metric Gear Site Gear-site interaction % residuals
Richness 11.7 30.6 5.9 51.9
Evenness 16.1 8.7 0.0 75.1
Mean length 69.2 9.4 16.6 4.8
Length range 9.6 60.5 7.4 22.5
Piscivore weight proportion 66.9 11.9 17.2 4.1
Piscivore number proportion 73.9 12.5 7.8 5.9
Results from PCA2, undertaken only on gears deployed in both sites, clearly345
separates gear from site effects, which were mixed in PCA1 due to differences
in gear deployment between the two sites. Grouping resamples by gear clearly
18

differentiated gillnets and trammel nets, mainly along the first PCA axis, with
gillnets catching larger individuals and larger proportions of piscivores than
trammel nets (figure 6 b). Differences between the Southern and the Northern350
sites were observed mainly along the second PCA axis (figure 6 c). The catch
was of wider length range, richer and more even in the Southern site than in
the Northern site.
With PCA2, we can distinguish the metrics that discriminate gears from
sites, while the differences between gears and sites were confused in PCA1 with355
differences in gear deployment. Similarly to results from PCA1, a strong posi-
tive correlation between mean length and both piscivore ratios and a negative
correlation with richness (figure 6 a) was found in PCA2. But contrary to PCA1,
results from PCA2 showed no correlation between length range and mean length,
and the correlation between richness and evenness was positive, meaning that360
the richer the catch, the more even.
4. Discussion
The first objective of this study was to propose a method to standardize
and compare the distribution of catches across community components between
passive and active fishing gears based on different sample sizes. Sample-based365
rarefaction curves were used to address this objective. This method, even if
limited by the small number of observations for some gear-site combination,
was found appropriate for this purpose because metrics converged for all com-
binations of gear-site.
The second objective of this study was to propose suitable metrics to char-370
acterize the distribution of catches across community components in species,
length and function, that can highlight differences between gears. Length and
functional metrics were found to be the most relevant metrics, in contrast to
species metrics, for which a large part of the variance remained unexplained
by gear, site, or gear-site interaction effect. Significant differences were found375
between gears, mainly in mean length and piscivore proportions. Smaller differ-
19

(a)
(b) (c)
GN
TN
North
South
Figure 6: Principal component analysis of catch metrics for the gears deployed in both sites
(PCA2) with 56% of the variance explained by the 1st axis, 24% explained by the 2nd axis.
(a) Catch metrics loadings (Nb = number ; Wt = weight). Groups of resamples (b) by gear
(GN = gillnets ; TN = trammel nets) and (c) by site.
20

ences were found between sites, mainly in length range and species richness. The
effect of the gear-site interaction was also significant when comparing catches
from the gears deployed on both sites only. This means that taking account of
the fishers’ strategy, in addition to the gear, would provide a better understand-380
ing of the catch composition.
4.1. Estimation method
To characterize total fishing pressure at the community level, we need to
take account of the pressures exerted by all gears deployed in a given area as
well as the state of the community. None of the gears is likely to sample the385
whole community (Fraser et al., 2007; Huse et al., 2000). Instead, each gear will
provide a restricted view of the marine community. Therefore, the state of the
community remains unknown and pressure can only be characterized indirectly
through catch. Characterizing the catch taken from the community implies
to simulteanously take account of both active and passive gears. For passive390
gears standardization of sampling effort is difficult. In this study, the number
of sampled fishing operations differed between gears and sites. This is known to
affect diversity, especially species richness (Magurran & McGill, 2011). Besides,
fishing operations from different gears are not directly comparable, since gears
have different capture processes which are based on different species behaviours.395
To overcome these problems, rarefaction curves were used to characterize the
part of the community available to each gear. Since convergence with increas-
ing sample size was observed on all gears and sites, we assume that rarefaction
curves accordingly reached this objective and are appropriate to compare dif-
ferent passive and active gears.400
The potential bias introduced by sample size when estimating biodiversity is
widely recognized. However, it has not been as much examined for other metrics,
such as individual length or functional composition of the catch. To avoid bias,
we widened the use of sample-based rarefaction curves to length and functional
metrics. Interestingly, convergence differed greatly between metrics. In contrast405
to species metrics which kept varying with increasing sample size, the length
21

and functional metrics had a fast convergence with increasing sample size. It
means that, despite a wide range of mesh sizes used for each gear, selection in
length and functional composition from the community by the different gears
was rather homogeneous. However, this fast convergence was favored because410
these metrics quantify an average property from a sample, while species metrics
quantify unique observations, what partly explains why they converged more
slowly.
However, a drawback of rarefaction curve is that it can be biased if sample
size is too small (Gotelli & Colwell, 2001). The limited number of observations415
for pelagic trawlers in the North and longliners in the South (n < 20) might
therefore bias our results on the differences by gear and site, especially for
species metrics. The small number of observations further limited this study,
by compelling to analyze all years and quarters together, which might mask
seasonnal or annual effects. This data limitation has three main reasons. First,420
the number of trips to sample, as calculated for the sampling plan, is limited
by technical and financial constraints. Second, the sampling plan is not fully
realized owing to weather conditions and low acceptance of the programme by
some professional fishers. Third, we had to focus on a small spatial scale, con-
strained by the need to find two sites broadly ecologically similar, differing in425
the way they were harvested, but partly exploited by similar gears. The sam-
pling plan was not established for the purpose of this study but for estimating
discarded amounts per fishing metier on all the French maritime areas. This
study suggests that the amount of data necessary to characterize fishing pres-
sure on marine communities, especially on species, is larger than to estimate430
discards. If onboard observer programmes were redesigned so as to be used to
characterize fishing pressure on marine communities, the sampling plan should
include all gears deployed in all areas, with a minimum sample size for each.
4.2. Catch metrics
A wide variety of metrics could be used to characterize catches at the commu-435
nity level. The ones selected for this study were intended to be simple and easy
22

to interpret while describing the distribution of catches across different dimen-
sions of the marine community : species, length, and function. Those metrics
have been widely calculated from survey data as ’state’ indicators to character-
ize fishing impacts on communities, including for the whole Bay of Biscay (e.g.440
Rochet & Trenkel, 2005; Rochet et al., 2010; Shin et al., 2010). But we know of
few studies estimating these metrics from catch data to characterize fishing pres-
sure except Stergiou et al. (2002); Viana et al. (2013). However, because gears
apply pressure on different components of the community (Piet et al., 2006),
the use of such metrics to characterize pressure per gear appears necessary.445
Length metrics, particularly mean length, and functional diversity in both
number and weight were the most relevant to detect differences between gears
and sites. The gears catching the largest fish were also catching the most pisci-
vores in both number and weight. These patterns tend to confirm that piscivores
were larger than other parts of the catch. Therefore, the classification of species450
into functional groups based on their diet as adults did not bias our results.
The mean lengths of the catch found in this study, between 19 and 46 cm, were
larger than estimates calculated with the EVHOE bottom trawl survey data
from the same sites, between 11 and 17 cm (Fauconnet, unpublished data). The
same was true for piscivore proportions. Our estimates varied from 20 to 94%455
in weight and from 7 to 80% in number, while estimates from survey were much
smaller : <4% in weight, and <1% in number (Fauconnet, unpublished data).
This provides empirical evidence that commercial gears in general, but some
more than others, select towards larger individuals and more piscivores than
survey gear.460
Species metrics were the metrics for which the smallest part of the vari-
ance was explained by the gears and sites. Small differences in evenness across
gears can be due to fisheries targeting and catching mainly bentho-demersal
species, many of which are solitary species. A catch made of gregarious species
would have resulted less even than this. The small difference in evenness be-465
tween fishing gears and sites can also result from the patchy sampling due to
fishers targeting places where the resource is highly concentrated. Payne et al.
23

(2005) found that Simpson’s measure of evenness gives precise and unbiased
estimates regardless of the underlying patchiness of the distribution, but it does
not perform as well if the sampling is biased towards sites with greater number470
of organisms, as it is the case here. Evenness turned out not to be appropri-
ate to detect differences between commercial gears. The grouping of species at
genus or family level undertaken to get a consistent level of species identification
across the whole dataset might have masked differences in richness and evenness
between gears or sites. This highlights the importance of the quality of species475
identification in observer programmes, and that particular care should be taken,
especially if the data are to be used for studies at the community level.
4.3. Comparison between gears and sites
Our results suggest that catch composition in species, length and function
differ among gears. However, none of the gears was found to have the most, or480
least, diverse catch across all metrics. Notably, our results are not consistent
with the prejudice that trawls have a more diverse catch than passive gears. In-
deed, we found that the gears catching the largest individuals were also catching
the widest length range. Bottom trawls caught smaller individuals than nets
and longlines as expected, but with a narrower length range. This restricted485
length range can be explained by large fish being more efficient at escaping
the trawl than smaller individuals (Huse et al., 2000). With respect to species,
pelagic trawls had a slightly more even catch than gillnets but caught fewer
species. These findings highlight that the criteria passive - active gears is not
relevant to compare fishing pressures on marine communities. It further sug-490
gests that the aspect of diversity to be considered needs to be clearly explicited
for management purpose, if fishing pressures are to be managed.
By comparing catches between two sites that are broadly similar ecologically,
and differ in the way they are harvested but are partly exploited by similar gears,
we were able to distinguish the effect of the gear from the effect of the site on the495
catch composition. Considering all gears, small differences were found between
sites, with the catch from the South slightly larger-sized and with more piscivore
24
than the catch from the North. However, the wider length range, and greater
richness when only comparing gears deployed in both sites, characterizing the
Southern site also proved that the catch was more heterogeneous in length and500
richer in this site compared to the Northern site. Those differences can be
due to a difference of harvesting between sites (i.e. pressure), in particular to
the trawling ban in the Southern site, or to the sites themselves (i.e. state).
Even if the sites were selected to be as similar as possible, some structural and
biological differences may exist between the two sites. For instance, the presence505
of the Capbreton canyon in the Southern site is known to attract mature hake
(Sanchez & Gil, 2000), while the Adour river plume plays an important role
as a nursery for many species. The importance of both biological functions on
this site might explain the wider length range observed. Studies on the annual
variations would help in determining whether catches differed between sites510
because the underlying communities were different to start with (i.e. differences
in state), or because they were harvested by different gear combinations (i.e.
differences in pressure). This would further complete the knowledge of fishing
pressure by taking account, besides their absolute values, of metric trajectories
(Jennings, 2005). The Southern Bay of Biscay has been harvested for over a515
century, mostly by trawlers but also netters and longliners (Quero & Cendrero,
1996). The catch composition has considerably changed since the beginning of
the harvest. Back then, some large demersal piscivores were highly frequent in
the catch, while now they are no longer found (Quero & Cendrero, 1996). This
historical record is qualitative though, and quantitative data have not been520
available for long enough to study in details the effects of fishing history on
marine communities.
The gear-site interaction was tested to determine whether differences be-
tween sites varied between gears, which would likely result from differences in
the way the gears were rigged and/or deployed in each site, i.e. from different525
fishers’ strategies. The gear-site interaction which could only be tested for tram-
mel nets and gillnets was significant for all metrics, particularly mean length
and piscivore weight ratio, but not for evenness. The diversity of targets and
25

strategies for those gears implies that the gear level may be too general, con-
trary to the study by Stergiou et al. (2002) which found that the gear level,530
independant of mesh size and season, was informative to characterize pressure
on species composition and diversity. Taking account of more information, such
as target species and/or mesh size, could enable to more accurately characterize
fishing pressure (Cornou et al., 2013; Dube et al., 2012). Based on the catch
composition, two main groups of gears related to the type of target species can535
be distinguished. The gears targeting benthic species, bottom trawls and tram-
mel nets, tended to catch more species with a smaller mean length, a narrower
length range and a smaller proportion of piscivores than the gears used to target
gadoids or other demersal fish, i.e. gillnets, longlines and pelagic trawls. The
diversity of target species can also play an important role. While longlines of-540
ten target a small number of species, bottom trawls are usually less specialized
(Sanchez et al., 2013). Better understanding how targeting affects the catch
composition might help assessing fishing pressures on marine communities.
4.4. Conclusions
This study aimed at characterizing fishing pressure at the community level545
based on onboard observer data. Total pressure on marine communities was
estimated here as total catch, i.e. including discards. The latter can be a
significant part of the catch and has been shown by Viana et al. (2013) to be
important to estimate fisheries’ ecological footprint. This study highlights the
importance in observer programmes to consistently and exhaustively sample the550
total catch, i.e. both landings and discards of all species. Hovewer, even total
catch is likely to underestimate pressure exerted by fisheries on marine commu-
nities. Indeed, it does not account for the mortality on individuals that were not
brought onboard, for example those that escaped the gear with potential severe
injuries (Ingolfsson & Jørgensen, 2006). Pressure on habitats and on benthic555
organisms could not be examined with the available data either. Indeed, for
practical reasons, the protocol cannot include data collection on more species,
and ’community’ had to be restricted in this study to fish and commercial in-
26
vertebrates. Some community components are likely to undergo more pressure
than others, since targets and many catch components are similar between the560
different gears deployed in both sites. How the different gears compete with
each other remains to be studied to highlight community components that are
under higher pressure. In this study, we focused on how catches were distributed
across community components. However pressure exerted on highly abundant
or productive species will likely have different impacts than pressure exerted565
on rare or vulnerable species. A complementary approach would be to quan-
tify the intensity of pressure undergone by each component, and their ability
to sustain it, for example with methods such as the Productivity Susceptibitity
Analysis (Smith et al., 2007). This study suggests that fishing pressure indeed
varies among gears and among sites exploited by different gear combinations.570
The impacts of this contrasted pressure on marine communities remain to be
studied.
Acknowledgements
We thank two anonymous referees for their comments and suggestions. Lau-
rence Fauconnet received a PhD fellowship from the Region Pays de la Loire.575
Support provided by the French Department for Ecology, Sustainable develop-
ment and Energy (Direction des Peches Maritime et de l’Aquaculture), and the
Pew Charitable Trusts. The opinions expressed are those of the authors and
do not necessarily reflect the views of the funding organizations. The authors
would like to thank Olivier Gaudou and Joel Dimeet for their valuable contribu-580
tion to the French observer programme and for their help in preparing the data
for the analyses. We thank Jocelyne Martin and Pascal Laffargue for help in
grouping the species. We also thank all fishers and observers who participated
in the French observer programme.
27

References585
Alfaro-Shigueto, J., Mangel, J. C., Pajuelo, M., Dutton, P. H., Seminoff, J. A.,
& Godley, B. J. (2010). Where small can have a large impact: Structure
and characterization of small-scale fisheries in Peru. Fish. Res., 106 , 8–17.
doi:10.1016/j.fishres.2010.06.004.
Attwood, C. G., Petersen, S. L., & Kerwath, S. E. (2011). Bycatch in South590
Africa’s inshore trawl fishery as determined from observer records. ICES J.
Mar. Sci., 68 , 2163–2174. doi:10.1093/icesjms/fsr162.
Borja, A., Uriarte, A., & Egana, J. (2002). Environmental factors and recruit-
ment of mackerel, Scomber scombrus L. 1758 , along the north-east Atlantic
coasts of Europe. Fish. Oceanogr., 11 , 116–127.595
Borja, A., Uriarte, A., Egana, J., Motos, L., & Valencia, V. (1998). Relation-
ships between anchovy (Engraulis encrasicolus) recruitment and environment
in the Bay of Biscay (1967-1996). Fish. Oceanogr., 7 , 375–380.
Chao, A., Chazdon, R. L., Colwell, R. K., & Shen, T.-J. (2005). A new statistical
approach for assessing similarity of species composition with incidence and600
abundance data: A new statistical approach for assessing similarity. Ecol.
Lett., 8 , 148–159. doi:10.1111/j.1461-0248.2004.00707.x.
Cornou, A.-S., Dimeet, J., Tetard, A., Gaudou, O., Dube, B., Fauconnet, L.,
& Rochet, M.-J. (2013). Observations a bord des navires de peche profes-
sionnelle - Bilan de l’echantillonnage 2012 . Technical Report Ifremer. URL:605
http://archimer.ifremer.fr/doc/00167/27787/25978.pdf.
Dube, B., Dimeet, J., Rochet, M.-J., Tetard, A., Gaudou, O., Mes-
sannot, C., Fauconnet, L., Morizur, Y., Biseau, A., & Salaun, M.
(2012). Observations a bord des navires de peche professionnelle - Bi-
lan de l’echantillonnage 2011 . RBE/STH/LTBH 2012-008 Ifremer. URL:610
http://archimer.ifremer.fr/doc/00109/21976/19586.pdf.
28
Efron, B., & Tibshirani, R. (1994). An Introduction to the Bootstrap. Number 57
in Monographs on Statistics & Applied Probability (Chapman and Hall/CRC
ed.).
European Union (2008). Commission Decision of 6 November 2008 adopting615
a multiannual Community programme pursuant to Council Regulation (EC)
No 199/2008 establishing a Community framework for the collection, manage-
ment and use of data in the fisheries sector and support for scientific advice
regarding the common fisheries policy.
Fraser, H. M., Greenstreet, S. P., & Piet, G. J. (2007). Taking account of620
catchability in groundfish survey trawls: implications for estimating demersal
fish biomass. ICES J. Mar. Sci., 64 , 1800–1819.
Garcia, S. M., Kolding, J., Rice, J., Rochet, M.-J., Zhou, S., Arimoto, T.,
Beyer, J. E., Borges, L., Bundy, A., Dunn, D., Fulton, E. A., Hall, M., Heino,
M., Law, R., Makino, M., Rijnsdorp, A. D., Simard, F., & Smith, A. D. M.625
(2012). Reconsidering the consequences of selective fisheries. Science, 335 ,
1045–1047. doi:10.1126/science.1214594.
Garcia, S. M., Zerbi, A., Aliaume, C., Do Chi, T., & Lasserre, G. (2003). The
ecosystem approach to fisheries: issues, terminology, principles, institutional
foundations, implementation and outlook . Number 443 in FAO Fisheries Tech-630
nical Paper. Rome: Food & Agriculture Organisation.
Gotelli, N. J., & Colwell, R. K. (2001). Quantifying biodiversity: procedures
and pitfalls in the measurement and comparison of species richness. Ecol.
Lett., 4 , 379–391.
Hall, M. A., Alverson, D. L., & Metuzals, K. I. (2000). By-catch: Problems and635
solutions. Mar. Pollut. Bull., 41 , 204–219.
Huse, I., C Gundersen, A., & H Nedreaas, K. (1999). Relative selectivity of
Greenland halibut (Reinhardtius hippoglossoides, Walbaum) by trawls, long-
lines and gillnets. Fish. Res., 44 , 75–93.
29

Huse, I., Løkkeborg, S., & Soldal, A. V. (2000). Relative selectivity in trawl,640
longline and gillnet fisheries for cod and haddock. ICES J. Mar. Sci., 57 ,
1271–1282.
Ingolfsson, O. A., & Jørgensen, T. (2006). Escapement of gadoid fish beneath
a commercial bottom trawl: relevance to the overall trawl selectivity. Fish.
Res., 79 , 303–312.645
Jennings, S. (2005). Indicators to support an ecosystem approach to fisheries.
Fish Fish., 6 , 212–232.
Jørgensen, E., & Pedersen, A. R. (1998). How to obtain those nasty standard er-
rors from transformed data - and why they should not be used: Internal report
volume 7. Aarhus Universitet, Det Jordbrugsvidenskabelige Fakultet. URL:650
http://citeseerx.ist.psu.edu/viewdoc/download?doi=10.1.1.47.9023&rep=rep1&type=pdf.
Le Pape, O., Chauvet, F., Desaunay, Y., & Guerault, D. (2003). Rela-
tionship between interannual variations of the river plume and the ex-
tent of nursery grounds for the common sole (Solea solea, L.) in Vi-
laine Bay. Effects on recruitment variability. J. Sea Res., 50 , 177–185.655
doi:10.1016/S1385-1101(03)00061-3.
Le Suave, R., Bourillet, J.-F., & Coutelle, A. (2000). La marge nord
du golfe de Gascogne: Connaissances generales et apport des nouvelles
syntheses de donnees multifaisceaux . Technical Report Ifremer. URL:
http://archimer.ifremer.fr/doc/00071/18199/.660
Le Tixerant, M. (2006). Cartographie de la reglementation des
peches professionnelles-Regions Aquitaine et Poitou Charente.
Technical Report Comites Regionaux des Peches et des Elevages
Marins de la region Aquitaine et de la region Poitou-Charentes,
Association du Grand Littoral Atlantique (AGLIA). URL:665
http://www.aglia.org/etudes.asp?Id=70&Page=14#Bottom.
30
Leblond, E., Daures, F., Berthou, P., Merrien, C., Pitel-Roudaut,
M., Brigaudeau, C., Demaneche, S., Jezequel, M., L’Equipe
D’Exploitation Du Systeme Harmonie Du Sih, Bodere, E., &
Le Blond, S. (2010). Synthese des flottilles de peche 2008 -670
Flotte Mer du Nord - Manche - Atlantique - Mediterranee. URL:
http://archimer.ifremer.fr/doc/00003/11456/8013.pdf.
Magurran, A. E., & McGill, B. J. (2011). Biological Diversity - Frontiers in
Measurement and Assessment . New York: Oxford University Press.
Morandeau, G., Macher, C., Sanchez, F., Bru, N., Fauconnet, L., & Caill-Milly,675
N. (2014). Why do fishermen discard? Distribution and quantification of the
causes of discards in the Southern Bay of Biscay passive gear fisheries. Mar.
Policy , 48 , 30–38. doi:10.1016/j.marpol.2014.02.022.
Payne, L. X., Schindler, D. E., Parrish, J. K., & Temple, S. A. (2005). Quanti-
fying spatial pattern with evenness indices. Ecol. Appl., 15 , 507–520.680
Piet, G., Quirijns, J., Robinson, L., & Greenstreet, S. (2006). Potential pressure
indicators for fishing, and their data requirements. ICES J. Mar. Sci., 64 ,
110 – 121.
Quero, J.-C., & Cendrero, O. (1996). Incidence de la peche sur la biodiver-
site ichtyologique marine: le bassin d’Arcachon et le plateau continental sud685
Gascogne. Cybium, 20 , 323–356.
Quero, J.-C., & Vayne, J.-J. (2005). Les Poissons de mer des peches francaises.
Delachaux Et Niestle.
Revill, A. (2012). Survival of discarded fish - A rapid review of studies on
discard survival rates. Request for services commitment no. S12.615631.690
European Commission, Directorate - General for maritime affairs and
fisheries, Policy development and coordination, Brussels, MAREA2. URL:
http://nsrac.org/wp-content/uploads/2012/08/EU-discard-survival-short-study-version-001.pdf.
31

Rochet, M.-J., & Trenkel, V. M. (2005). Factors for the variability of dis-
cards: assumptions and field evidence. Can. J. Fish. Aquat. Sci., 62 , 224–235.695
doi:10.1139/f04-185.
Rochet, M.-J., Trenkel, V. M., Carpentier, A., Coppin, F., De Sola, L. G.,
Leaute, J.-P., Mahe, J.-C., Maiorano, P., Mannini, A., Murenu, M., Piet,
G., Politou, C.-Y., Reale, B., Spedicato, M.-T., Tserpes, G., & Bertrand,
J. A. (2010). Do changes in environmental and fishing pressures impact ma-700
rine communities? An empirical assessment. J. Appl. Ecol., 47 , 741–750.
doi:10.1111/j.1365-2664.2010.01841.x.
Sanchez, F., & Gil, G. (2000). Hydrographic mesoscale structures and Poleward
Current as a determinant of hake (Merluccius merluccius) recruitment in
southern Bay of Biscay. ICES J. Mar. Sci., 57 , 152–170.705
Sanchez, F., Morandeau, G., Bru, N., & Lissardy, M. (2013). A re-
stricted fishing area as a tool for fisheries management: Example of the
Capbreton canyon, southern Bay of Biscay. Mar. Policy , 42 , 180–189.
doi:10.1016/j.marpol.2013.02.009.
Shin, Y.-J., Bundy, A., Shannon, L. J., Simier, M., Coll, M., Fulton, E. A.,710
Link, J. S., Jouffre, D., Ojaveer, H., & Mackinson, S. (2010). Can simple be
useful and reliable? Using ecological indicators to represent and compare the
states of marine ecosystems. ICES J. Mar. Sci., 67 , 717–731.
Smith, A. D. M., Fulton, E. J., Hobday, A. J., Smith, D. C., & Shoulder, P.
(2007). Scientific tools to support the practical implementation of ecosystem-715
based fisheries management. ICES J. Mar. Sci., 64 , 633–639.
Sourget, Q., & Biais, G. (2009). Ecologie, biologie et ex-
ploitation du maigre du golfe de Gascogne. Rapport fi-
nal convention SMIDDEST - IFREMER - CNRS. URL:
http://oai.eau-adour-garonne.fr/oai-documents/58983/GED_00000000.pdf.720
32

Stergiou, K. I., Moutopoulos, D. K., & Erzini, K. (2002). Gill net and long-
lines fisheries in Cyclades waters (Aegean Sea): species composition and gear
competition. Fish. Res., 57 , 25–37.
Viana, M., McNally, L., Graham, N., Reid, D. G., & Jackson, A. L. (2013). Ig-
noring discards biases the assessment of fisheries’ ecological fingerprint. Biol.725
Lett., 9 , 20130812–20130812. doi:10.1098/rsbl.2013.0812.
33

APPENDIX
1

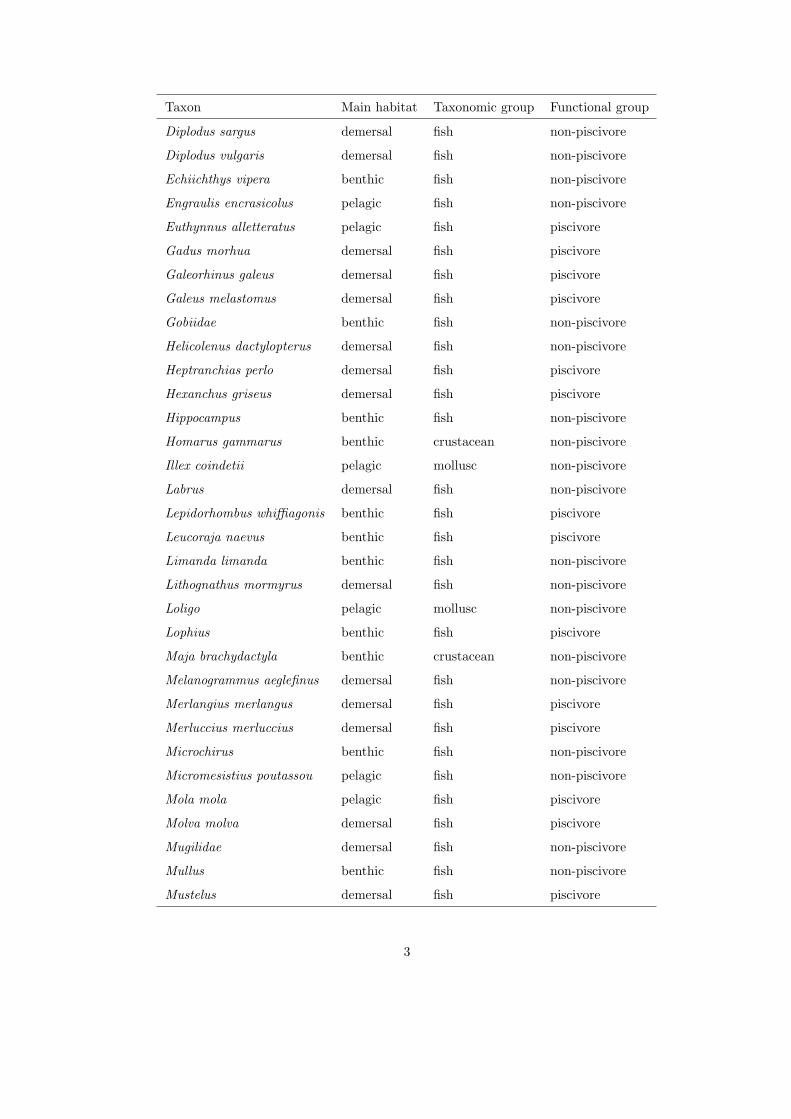
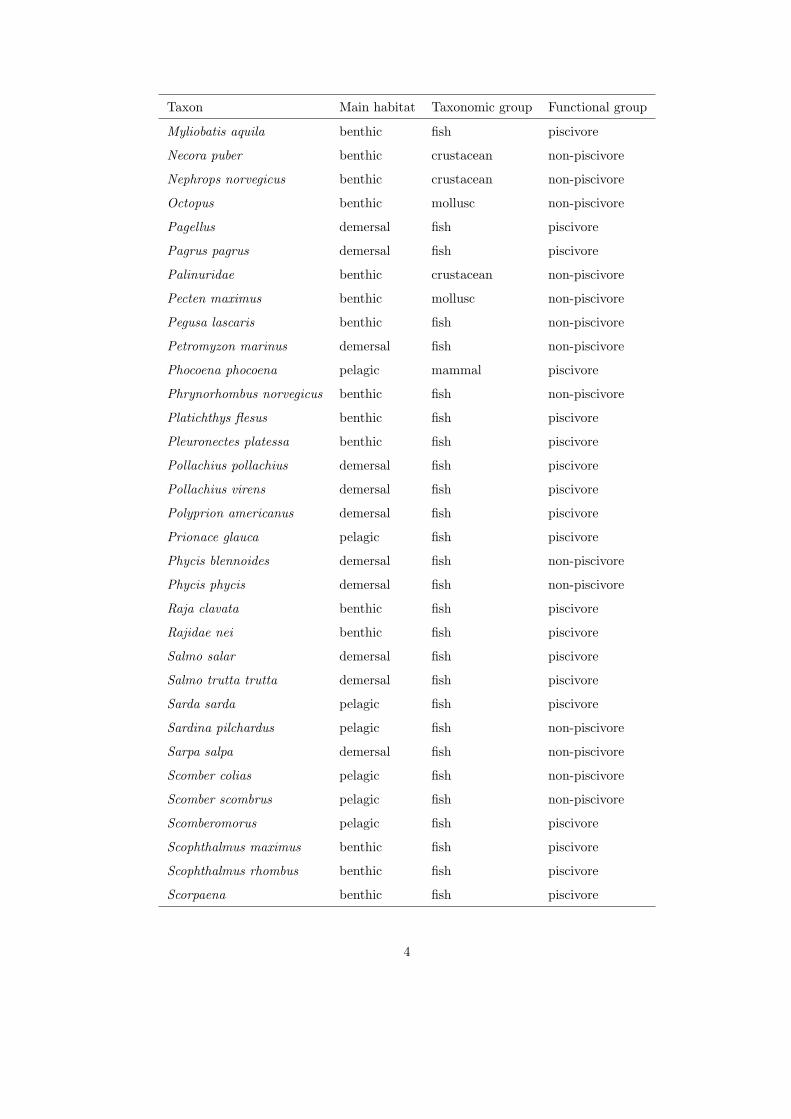
Table 1: Classification of species, genus or family by main habitat, taxonomic and functional groups (nei = not elsewhere
identified).
Taxon Main habitat Taxonomic group Functional group
Alloteuthis demersal mollusc non-piscivore
Alopias vulpinus pelagic fish piscivore
Alosa pelagic fish non-piscivore
Argentina pelagic fish non-piscivore
Argyrosomus regius demersal fish piscivore
Arnoglossus benthic fish non-piscivore
Auxis rochei rochei pelagic fish piscivore
Balistes capriscus demersal fish non-piscivore
Belone belone pelagic fish non-piscivore
Beryx decadactylus demersal fish piscivore
Boops boops pelagic fish non-piscivore
Brama brama demersal fish piscivore
Buccinum undatum benthic mollusc non-piscivore
Buglossidium luteum benthic fish non-piscivore
Callionymus benthic fish non-piscivore
Cancer pagurus benthic crustacean non-piscivore
Carangidae pelagic fish piscivore
Cepola macrophthalma demersal fish non-piscivore
Ciliata mustela demersal fish non-piscivore
Citharus linguatula benthic fish non-piscivore
Clupea harengus pelagic fish non-piscivore
Conger conger benthic fish piscivore
Crangon crangon demersal crustacean non-piscivore
Dalatias licha demersal fish piscivore
Dasyatis pastinaca benthic fish piscivore
Delphinus delphis pelagic mammal piscivore
Dicentrarchus labrax demersal fish piscivore
Dicentrarchus punctatus demersal fish piscivore
Dicologlossa cuneata benthic fish non-piscivore
Diplodus cervinus demersal fish non-piscivore
Diplodus puntazzo demersal fish non-piscivore
2
Taxon Main habitat Taxonomic group Functional group
Diplodus sargus demersal fish non-piscivore
Diplodus vulgaris demersal fish non-piscivore
Echiichthys vipera benthic fish non-piscivore
Engraulis encrasicolus pelagic fish non-piscivore
Euthynnus alletteratus pelagic fish piscivore
Gadus morhua demersal fish piscivore
Galeorhinus galeus demersal fish piscivore
Galeus melastomus demersal fish piscivore
Gobiidae benthic fish non-piscivore
Helicolenus dactylopterus demersal fish non-piscivore
Heptranchias perlo demersal fish piscivore
Hexanchus griseus demersal fish piscivore
Hippocampus benthic fish non-piscivore
Homarus gammarus benthic crustacean non-piscivore
Illex coindetii pelagic mollusc non-piscivore
Labrus demersal fish non-piscivore
Lepidorhombus whiffiagonis benthic fish piscivore
Leucoraja naevus benthic fish piscivore
Limanda limanda benthic fish non-piscivore
Lithognathus mormyrus demersal fish non-piscivore
Loligo pelagic mollusc non-piscivore
Lophius benthic fish piscivore
Maja brachydactyla benthic crustacean non-piscivore
Melanogrammus aeglefinus demersal fish non-piscivore
Merlangius merlangus demersal fish piscivore
Merluccius merluccius demersal fish piscivore
Microchirus benthic fish non-piscivore
Micromesistius poutassou pelagic fish non-piscivore
Mola mola pelagic fish piscivore
Molva molva demersal fish piscivore
Mugilidae demersal fish non-piscivore
Mullus benthic fish non-piscivore
Mustelus demersal fish piscivore
3
Taxon Main habitat Taxonomic group Functional group
Myliobatis aquila benthic fish piscivore
Necora puber benthic crustacean non-piscivore
Nephrops norvegicus benthic crustacean non-piscivore
Octopus benthic mollusc non-piscivore
Pagellus demersal fish piscivore
Pagrus pagrus demersal fish piscivore
Palinuridae benthic crustacean non-piscivore
Pecten maximus benthic mollusc non-piscivore
Pegusa lascaris benthic fish non-piscivore
Petromyzon marinus demersal fish non-piscivore
Phocoena phocoena pelagic mammal piscivore
Phrynorhombus norvegicus benthic fish non-piscivore
Platichthys flesus benthic fish piscivore
Pleuronectes platessa benthic fish piscivore
Pollachius pollachius demersal fish piscivore
Pollachius virens demersal fish piscivore
Polyprion americanus demersal fish piscivore
Prionace glauca pelagic fish piscivore
Phycis blennoides demersal fish non-piscivore
Phycis phycis demersal fish non-piscivore
Raja clavata benthic fish piscivore
Rajidae nei benthic fish piscivore
Salmo salar demersal fish piscivore
Salmo trutta trutta demersal fish piscivore
Sarda sarda pelagic fish piscivore
Sardina pilchardus pelagic fish non-piscivore
Sarpa salpa demersal fish non-piscivore
Scomber colias pelagic fish non-piscivore
Scomber scombrus pelagic fish non-piscivore
Scomberomorus pelagic fish piscivore
Scophthalmus maximus benthic fish piscivore
Scophthalmus rhombus benthic fish piscivore
Scorpaena benthic fish piscivore
4

Taxon Main habitat Taxonomic group Functional group
Scyliorhinus demersal fish piscivore
Sepia demersal mollusc non-piscivore
Seriola pelagic fish piscivore
Serranus demersal fish piscivore
Solea nei benthic fish non-piscivore
Solea solea benthic fish non-piscivore
Sparus demersal fish piscivore
Spondyliosoma cantharus demersal fish non-piscivore
Sprattus sprattus pelagic fish non-piscivore
Squalus acanthias demersal fish piscivore
Stenella coeruleoalba pelagic mammal piscivore
Syngnathus benthic fish non-piscivore
Torpedo benthic fish piscivore
Trachinus draco benthic fish non-piscivore
Trachurus pelagic fish non-piscivore
Triglidae benthic fish non-piscivore
Trisopterus demersal fish non-piscivore
Umbrina canariensis demersal fish non-piscivore
Umbrina cirrosa demersal fish non-piscivore
Zeus faber demersal fish piscivore
5