Characterization of photochemical pollution at different ...
18
Atmos. Chem. Phys., 13, 3881–3898, 2013 www.atmos-chem-phys.net/13/3881/2013/ doi:10.5194/acp-13-3881-2013 © Author(s) 2013. CC Attribution 3.0 License. Atmospheric Chemistry and Physics Open Access Characterization of photochemical pollution at different elevations in mountainous areas in Hong Kong H. Guo 1 , Z. H. Ling 1 , K. Cheung 1 , F. Jiang 2 , D. W. Wang 1 , I. J. Simpson 3 , B. Barletta 3 , S. Meinardi 3 , T. J. Wang 4 , X. M. Wang 5 , S. M. Saunders 6 , and D. R. Blake 3 1 Air Quality Studies, Department of Civil and Environmental Engineering, The Hong Kong Polytechnic University, Hong Kong, China 2 International Institute for Earth System Science, Nanjing University, Nanjing, China 3 Department of Chemistry, University of California at Irvine, California, USA 4 School of Atmospheric Sciences, Nanjing University, Nanjing, China 5 Guangzhou Institute of Geochemistry, Chinese Academy of Sciences, Guangzhou, China 6 School of Biomedical, Biomolecular and Chemical Sciences, University of Western Australia, Perth, Australia Correspondence to: H. Guo ([email protected]) Received: 24 August 2012 – Published in Atmos. Chem. Phys. Discuss.: 12 November 2012 Revised: 18 February 2013 – Accepted: 25 March 2013 – Published: 16 April 2013 Abstract. To advance our understanding on the factors that affect photochemical pollution at different elevations in mountainous areas, concurrent systematic field measure- ments (September to November 2010) were conducted at a mountain site and at an urban site at the foot of the moun- tain in Hong Kong. The mixing ratios of air pollutants were greater at the foot of the mountain (i.e., Tsuen Wan urban site, TW) than near the summit (i.e., Tai Mao Shan moun- tain site, TMS), expect for ozone. In total, only one O 3 episode day was observed at TW, whereas twenty-one (21) O 3 episode days were observed at TMS. The discrepancy of O 3 at the two sites was attributed to the mixed effects of NO titration, vertical meteorological conditions, regional transport and mesoscale circulations. The lower NO levels at TMS and the smaller differences of “oxidant” O x (O 3 + NO 2 ) between the two sites suggested that variations of O 3 at the two sites were partly attributed to different degree of NO titration. In addition, analysis of vertical structure of me- teorological variables revealed that the inversion layer at the range of altitudes of 500–1000 m might be another factor that caused the high O 3 levels at TMS. Furthermore, analyses of the wind fields, the levels of air pollutants in different air flows, ratios of different trace gases and the correlation be- tween variability and the lifetime of VOCs (volatile organic compounds) indicated that high O 3 concentrations at TMS were somewhat influenced by regional air masses from the highly polluted Pearl River delta (PRD) region. In particu- lar, the diurnal profiles and correlations of gaseous pollutants suggested influence of mesoscale circulations, which is con- firmed using the Master Chemical Mechanism moving box model (Mbox) and the Weather Research and Forecasting (WRF) model. By investigating the correlations of observed O 3 and NO * x and the relationships of O 3 and its precursors by an observation-based model (OBM), as well as the ratios of VOC/NO x , it was concluded that photochemical O 3 forma- tion at TMS was mostly influenced by VOCs, with measur- able impact of NO x , while O 3 production at TW was gener- ally limited by the concentrations of VOCs. This is the first report of the comprehensive analysis on the data of photo- chemical pollution obtained from concurrent measurements in mountainous areas in the PRD region. 1 Introduction Distinguished from surface measurements and aircraft obser- vations, studies conducted in mountain areas often provide information on the regional background concentrations of air pollutants, the influence of regional transport and mesoscale circulations, the photochemistry of biogenic volatile organic compounds (BVOCs), and the influence of meteorological factors on ozone (O 3 ) chemistry (Pochanart et al., 2003; Published by Copernicus Publications on behalf of the European Geosciences Union.
Transcript of Characterization of photochemical pollution at different ...

Atmos. Chem. Phys., 13, 3881–3898, 2013www.atmos-chem-phys.net/13/3881/2013/doi:10.5194/acp-13-3881-2013© Author(s) 2013. CC Attribution 3.0 License.
EGU Journal Logos (RGB)
Advances in Geosciences
Open A
ccess
Natural Hazards and Earth System
Sciences
Open A
ccess
Annales Geophysicae
Open A
ccessNonlinear Processes
in Geophysics
Open A
ccess
Atmospheric Chemistry
and PhysicsO
pen Access
Atmospheric Chemistry
and Physics
Open A
ccess
Discussions
Atmospheric Measurement
Techniques
Open A
ccess
Atmospheric Measurement
Techniques
Open A
ccess
Discussions
Biogeosciences
Open A
ccess
Open A
ccess
BiogeosciencesDiscussions
Climate of the Past
Open A
ccess
Open A
ccess
Climate of the Past
Discussions
Earth System Dynamics
Open A
ccess
Open A
ccess
Earth System Dynamics
Discussions
GeoscientificInstrumentation
Methods andData Systems
Open A
ccess
GeoscientificInstrumentation
Methods andData Systems
Open A
ccess
Discussions
GeoscientificModel Development
Open A
ccess
Open A
ccess
GeoscientificModel Development
Discussions
Hydrology and Earth System
Sciences
Open A
ccess
Hydrology and Earth System
Sciences
Open A
ccess
Discussions
Ocean Science
Open A
ccess
Open A
ccess
Ocean ScienceDiscussions
Solid Earth
Open A
ccess
Open A
ccess
Solid EarthDiscussions
The Cryosphere
Open A
ccess
Open A
ccess
The CryosphereDiscussions
Natural Hazards and Earth System
Sciences
Open A
ccess
Discussions
Characterization of photochemical pollution at differentelevations in mountainous areas in Hong Kong
H. Guo1, Z. H. Ling 1, K. Cheung1, F. Jiang2, D. W. Wang1, I. J. Simpson3, B. Barletta3, S. Meinardi3, T. J. Wang4,X. M. Wang5, S. M. Saunders6, and D. R. Blake3
1Air Quality Studies, Department of Civil and Environmental Engineering, The Hong Kong Polytechnic University,Hong Kong, China2International Institute for Earth System Science, Nanjing University, Nanjing, China3Department of Chemistry, University of California at Irvine, California, USA4School of Atmospheric Sciences, Nanjing University, Nanjing, China5Guangzhou Institute of Geochemistry, Chinese Academy of Sciences, Guangzhou, China6School of Biomedical, Biomolecular and Chemical Sciences, University of Western Australia, Perth, Australia
Correspondence to:H. Guo ([email protected])
Received: 24 August 2012 – Published in Atmos. Chem. Phys. Discuss.: 12 November 2012Revised: 18 February 2013 – Accepted: 25 March 2013 – Published: 16 April 2013
Abstract. To advance our understanding on the factorsthat affect photochemical pollution at different elevationsin mountainous areas, concurrent systematic field measure-ments (September to November 2010) were conducted at amountain site and at an urban site at the foot of the moun-tain in Hong Kong. The mixing ratios of air pollutants weregreater at the foot of the mountain (i.e., Tsuen Wan urbansite, TW) than near the summit (i.e., Tai Mao Shan moun-tain site, TMS), expect for ozone. In total, only one O3episode day was observed at TW, whereas twenty-one (21)O3 episode days were observed at TMS. The discrepancyof O3 at the two sites was attributed to the mixed effectsof NO titration, vertical meteorological conditions, regionaltransport and mesoscale circulations. The lower NO levelsat TMS and the smaller differences of “oxidant” Ox (O3 +NO2) between the two sites suggested that variations of O3at the two sites were partly attributed to different degree ofNO titration. In addition, analysis of vertical structure of me-teorological variables revealed that the inversion layer at therange of altitudes of 500–1000 m might be another factor thatcaused the high O3 levels at TMS. Furthermore, analyses ofthe wind fields, the levels of air pollutants in different airflows, ratios of different trace gases and the correlation be-tween variability and the lifetime of VOCs (volatile organiccompounds) indicated that high O3 concentrations at TMSwere somewhat influenced by regional air masses from the
highly polluted Pearl River delta (PRD) region. In particu-lar, the diurnal profiles and correlations of gaseous pollutantssuggested influence of mesoscale circulations, which is con-firmed using the Master Chemical Mechanism moving boxmodel (Mbox) and the Weather Research and Forecasting(WRF) model. By investigating the correlations of observedO3 and NO∗
x and the relationships of O3 and its precursors byan observation-based model (OBM), as well as the ratios ofVOC/NOx, it was concluded that photochemical O3 forma-tion at TMS was mostly influenced by VOCs, with measur-able impact of NOx, while O3 production at TW was gener-ally limited by the concentrations of VOCs. This is the firstreport of the comprehensive analysis on the data of photo-chemical pollution obtained from concurrent measurementsin mountainous areas in the PRD region.
1 Introduction
Distinguished from surface measurements and aircraft obser-vations, studies conducted in mountain areas often provideinformation on the regional background concentrations of airpollutants, the influence of regional transport and mesoscalecirculations, the photochemistry of biogenic volatile organiccompounds (BVOCs), and the influence of meteorologicalfactors on ozone (O3) chemistry (Pochanart et al., 2003;
Published by Copernicus Publications on behalf of the European Geosciences Union.

3882 H. Guo et al.: Characterization of photochemical pollution
Zellweger et al., 2003; Gao et al., 2005; Wang et al., 2006;Fu et al., 2010). The characteristics of O3 in mountainousareas have been investigated in different locations in recentyears (e.g., Evtyugina et al., 2009; Scott and Ahmet, 2009;Crowley et al., 2010). For example, Burley and Bytnerowicz(2011) investigated the O3 distribution at the White Moun-tains (1237–4342 m) in California and concluded that highO3 concentrations were correlated with slow-moving back-trajectories that had spent more time inland and less time off-shore. Monteiro et al. (2012) analyzed a high O3 episode by astatistical technique and a modeling approach at a mountainsite (1086 m) in the Mediterranean region, and reported thattransport of O3 and its precursors by local mountain breezesand sea-breeze circulation was mainly responsible for thehigh O3 concentrations. Turnipseed et al. (2004) simulatedthe mesoscale atmospheric flow conditions influenced by re-gional topography in the Niwot Ridge AmeriFlux site withinthe Rocky Mountains (3050 m), and significant influence ofmesoscale winds was found under the strong synoptic west-erly winds. Ou Yang et al. (2012) investigated the seasonaland diurnal variations of O3 at a high-altitude mountain site(2862 m) in central Taiwan and concluded that the spring-time maximum O3 concentration was most likely caused bythe long-range transport of air masses from Southeast Asia.
In mainland China, limited studies have been undertakento investigate the characteristics of O3 pollution in mountain-ous areas (e.g., Gao et al., 2005; Wang et al., 2006; Li etal., 2008; Xue et al., 2011). Gao et al. (2005) reported mea-surements of O3 and CO at the summit of Mt. Tai (1534 m)and suggested that air masses from the North China Plainsor the recirculation over the Shandong Peninsula had signif-icant influence on air pollutants. Li et al. (2008) investigatedthe impact of chemical production and transport on summerdiurnal O3 behavior at a mountainous site in the North ChinaPlain. They suggested that in situ chemistry accounted formost of the O3 increment from morning to mid-afternoon.Wang et al. (2006) and Xue et al. (2011) studied the ori-gin of surface O3 and reactive nitrogen speciation at Mt.Waliguan (3816 m) in western China, and indicated that highO3 events were mostly derived from the downward transportof the upper tropospheric air rather than anthropogenic pol-lution. Nonetheless, all of these studies were carried out onlyat mountain sites in northern/western China.
Hong Kong and the rest of Pearl River delta (PRD) re-gion are situated along the coast of southern China. The rapideconomic development has caused elevated levels of air pol-lution in this region (Huang et al., 2006; Guo et al., 2009).Owning to its critical role in the atmospheric oxidizing ca-pacity, human health and vegetation (NRC, 1991; PORG,1997; IPCC, 2007), photochemical O3 has been studied inHong Kong and the PRD region for the past two decades(Chan et al., 1998a, b; Wang et al., 2003; Ding et al., 2004;Zhang et al., 2007; Guo et al., 2009). Though these studieshelp us to better understand the O3 pollution in the PRD re-
gion, they were conducted at low-elevation urban and ruralsites (< 50 m).
Many studies showed that mesoscale circulations like sea–land breezes and/or mountain–valley breezes play importantroles in air pollution transport in such a region with com-plex topography and land use/land cover. The role of sea–land breezes in air pollution transport has been well-studiedpreviously (Zhang and Zhang, 1997; Liu et al., 2000; Dinget al., 2004). For mountain–valley breezes, there were rela-tively few Hong Kong studies focusing on this topic, eventhough it is almost certainly very important to air pollutiontransport in Hong Kong, where topography and physical fea-tures are complex and where about 75 % of the land area ishilly (AFCD, 2008). In addition, there were very few worksconducting field measurements at a mountain site, especiallythe concurrent measurements at the foot and summit of themountain in this region. To investigate the variations of O3at the mountain site and low-elevation location, the influ-ence of mesoscale circulation/regional transport on air pol-lutants and the relationship between O3 and its precursorsat mountainous areas, concurrent field measurements includ-ing air pollutants and meteorological conditions were con-ducted in a mountain site and an urban site at the foot ofthe mountain. The characteristics of air pollutants and thecauses of variations of air pollutants at the two sites wereinvestigated; the relationships between the two sites and theinfluence of mesoscale circulations were explored by inte-grated data analysis and different models, and the relation-ships of O3-precursors at the two different sites were furtherevaluated. To our best knowledge, this is the first attempt toconduct these concurrent measurements and comprehensiveanalysis of air pollutants in the mountainous area in this re-gion.
2 Methodologies
2.1 Site description
In this study, field measurements were carried out simultane-ously at different elevations at the highest mountain in HongKong, Mt. Tai Mo Shan (Mt. TMS) (Fig. 1). Sampling wasconducted from 6 September to 29 November 2010, whenhigh O3 mixing ratios were frequently observed in this sea-son (So and Wang, 2003; Wang et al., 2005). The Hong KongEnvironmental Protection Department (HKEPD) air qualitymonitoring station at Tsuen Wan (TW) – the closest HKEPDmonitoring station at the foot of Mt. TMS – was selected asthe measurement site at the foot of the mountain (22.373◦ N,114.112◦ E, elevation of 10 m). Tsuen Wan (TW) is a mixedresidential, commercial and light industrial area in the NewTerritories in Hong Kong. The site is adjacent to a main traf-fic road and surrounded by residential and industrial blocks.The high-elevation site (TMS) was set up on the rooftop of abuilding at Mt. TMS (22.405◦ N, 114.118◦ E) at an elevation
Atmos. Chem. Phys., 13, 3881–3898, 2013 www.atmos-chem-phys.net/13/3881/2013/
H. Guo et al.: Characterization of photochemical pollution 3883
of 640 m. The TW and TMS sites are separated by a straightline distance of about 7 km and an elevation of 630 m.
Mt. TMS is surrounded by 1440 ha of natural territory andborders with the Tai Po Kau Nature Reserve to the east, ShingMun Country Park to the south, Route Twisk highway andTai Lam Country Park to the west, and the old valley ofthe Lam Tsuen to the north (AFCD, 2008). Surrounding thefoot of the mountain are urban centers with a population of2.23 million, including Tsuen Wan, Sha Tin, Tuen Mun andYuen Long areas. The straight distances between the moun-tain summit and the urban centers at the foot are about 5–10 km. Further to the south are the urban centers of the par-tial New Territory, Kowloon Peninsula, Hong Kong Islandand the South China Sea. To the southwest are the newly-developed residential area of Tung Chung, the Hong Konginternational airport, and the South China Sea. Because of itsunique topography, mesoscale circulations, i.e., mountain–valley breezes and sea–land breezes, are often observed atMt. TMS, which would enhance the interaction of pollutedurban air and the mountain air.
2.2 Measurement techniques
2.2.1 Continuous measurements of O3, CO, SO2and NOx
Hourly data of O3, CO, SO2, NO-NO2-NOx and meteoro-logical parameters at TW were obtained from the HKEPD(Hong Kong Environmental Protection Department,http://epic.epd.gov.hk/ca/uid/airdata). Detailed information aboutthe measurements, quality assurance and control protocolscan be found in the HKEPD report (HKEPD, 2012). At TMS,sampling instruments were installed in a room of a buildingand ambient air samples were drawn through a 5 m long per-fluoroalkoxy (PFA) Teflon tube (OD: 12.7 mm; ID: 9.6 mm).The inlet of the sampling tube was located 2 m above therooftop of the building and was connected to a PFA manifoldwith a bypass pump drawing air at a rate of 5 L min−1 into theintakes of the analyzers for O3, CO, SO2 and NO-NO2-NOx.
O3 was measured using a commercial UV photometric in-strument (Advanced Pollution Instrumentation (API), model400E) with a detection limit of 0.6 ppbv. This analyzer wascalibrated by a transfer standard (Thermo EnvironmentalInstruments (TEI) 49PS) prior to the field studies. Sulfurdioxide was measured with a pulsed UV fluorescence (API,model 100E) with a detection limit of 0.4 ppbv and 2σ pre-cision of 0.5 % for ambient levels of 50 ppbv (2 min aver-age). Carbon monoxide was measured with a gas filter cor-relation, nondispersive infrared analyzer (API, Model 300E)with a heated catalytic scrubber to convert CO to CO2 forbaseline determination. Zeroing was conducted every 2 h for12 min. The 2 min data at the end of each zeroing weretaken as the baseline. The detection limit was 30 ppbv fora 2 min average. The 2 s precision was about 1 % for a COlevel of 500 ppbv (2 min average) and the overall uncer-
tainty was estimated to be 10 %. Oxides of nitrogen were de-tected using a commercial chemiluminescence with an inter-nal molybdenum converter (API, Model 200E) and a detec-tion limit of 0.4 ppbv. The analyzers were calibrated daily byinjecting scrubbed ambient air (TEI, Model 111) and a spangas mixture. A NIST (National Institute of Standards andTechnology)-traceable standard (Scott-Marrin, Inc.) contain-ing 156.5 ppmv CO (±2 %), 15.64 ppmv SO2 (±2 %), and15.55 ppmv NO (±2 %) was diluted using a dynamic calibra-tor (Environics, Inc., Model 6100). For the O3, SO2, CO andNO-NO2-NOx analyzers, a data logger (Environmental Sys-tems Corporation, Model 8832) was used to control the cal-ibrations and to collect data, which were averaged to 1 minintervals.
Meteorological parameters, including temperature, solarradiation, relative humidity, wind speed and wind direc-tion, were monitored by a weather station (Vantage Pro TM& Vantage Pro 2 plus TM Weather Stations, Davis Instru-ments).
2.2.2 Sampling and analysis of VOCs
Concurrent VOC samples were collected on selected non-O3episode (i.e., 28 September; 2, 8, 14, 18–19, 27–28 Octo-ber; and 20–21 November) and O3 episode days (i.e., 23–24, 29–31 October; 1–3, 9 and 19 November) at both sites.The potentially high O3 episode days were selected basedon weather prediction and meteorological data analysis, andwere generally related to stronger solar radiation, lower windspeeds, and less vertical dilution of air pollution compared tonon-O3 episode days. These O3 episode and non-O3 episodedays were later confirmed by the observed O3 mixing ra-tios. In this study, an O3 episode day is defined when thepeak 1 h average O3 mixing ratio exceeds 100 ppbv (i.e.,China’s Grade II standard). Ambient VOC samples werecollected using cleaned and evacuated 2 L electro-polishedstainless steel canisters. The canisters were prepared and de-livered to Hong Kong by the Rowland/Blake group at Uni-versity of California, Irvine (UCI). A flow-controlling devicewas used to collect 1 h integrated samples. During non-O3episode days, VOC samples were collected at 2 h intervalsfrom 07:00 to 19:00 LT (local time) per day at both sites.For O3 episode days, hourly samples were consecutively col-lected from 09:00 to 16:00 LT, with additional samples col-lected at 18:00, 21:00, 00:00, 03:00 and 07:00 LT. Due tologistic issues, 19 additional samples were collected at TMS,and one additional sample was taken at TW. Totally, 201 and183 VOC samples were collected at TMS and TW, respec-tively.
Before sampling, all canisters were cleaned at least fivetimes by repeatedly filling and evacuating with humidifiedpure nitrogen gas (N2). To test for any contamination inthe canister, the evacuated canister was filled with pure N2,stored for at least 24 h, then checked by the same VOCanalytical methods to ensure that all the target compounds
www.atmos-chem-phys.net/13/3881/2013/ Atmos. Chem. Phys., 13, 3881–3898, 2013

3884 H. Guo et al.: Characterization of photochemical pollution
Fig. 1. The sampling sites and the surrounding environment.
Fig. 2. (a) Surface meteorological conditions, (b) average diurnal patterns of trace gases at
TMS and TW and (c) vertical profiles of meteorological conditions and O3 in Hong Kong.
Fig. 1.The sampling sites and the surrounding environment.
were not found or were under the method detection limit(MDL). In addition, duplicate samples were regularly col-lected to check the precision and reliability of the samplingand analytical methods. After sampling, the VOC sampleswere returned to the laboratory at UCI for chemical analysis.The analytical system, which is fully described in Simpsonet al. (2010), uses multicolumn gas chromatography (GC)with five column-detector combinations. The oven param-eters employed for each GC can be found in Colman etal. (2001).
VOCs were identified by their retention times and theirmass spectra. The quantification of target VOCs was accom-plished using multipoint external calibration curves, a com-bination of National Bureau of Standards, Scott SpecialtyGases (absolute accuracy estimated to be within±5 %) andUCI made standards. The detection limit, measurement pre-cision and accuracy for each VOC varies by compound classand is listed in Simpson et al. (2010). Generally, alkanes,alkenes and aromatics have a detection limit of 3 pptv, a pre-cision of 3 %, and an accuracy of 5 %.
2.3 WRF simulation
The Weather Research and Forecasting (WRF) model is anext-generation mesoscale numerical weather prediction sys-tem designed to serve both operational forecasting and at-mospheric research needs (Skamarock and Klemp, 2008).It is suitable for use in a broad spectrum of applicationsacross scales ranging from meters to thousands of kilometres(http://wrf-model.org/index.php). Simulations and real-timeforecasting tests have indicated that the WRF model has agood performance for weather forecasts, and has broad ap-plication prospects (Steven et al., 2004; Done et al., 2004). Adetailed description can be found in Guo et al. (2009).
As mountain–valley breezes are small-scale weather phe-nomena caused by thermal forcing, and there is a com-plex terrain in Hong Kong (AFCD, 2008), considerably highmodel resolution is needed to capture these breezes. In thisstudy, the mountain–valley breezes were simulated using adomain system of five nested grids (36, 12, 4, 1.333, and
0.444 km). The domain with finest resolution (0.444 km grid)covers the Hong Kong region. In the vertical scale, therewere 31 sigma levels for all five domains, with the model topfixed at 100 hPa. For physical processes, the WRF single-moment 3-class microphysics scheme (Hong et al., 2004),RRTM (Rapid Radiative Transfer Model) long-wave radia-tion scheme (Mlawer et al., 1997), Goddard short-wave ra-diation scheme (Chou and Suarez, 1994), MM5 (MesoscaleModel v5) similarity surface layer (Zhang and Anthes,1982), Noah land surface model coupled with urban canopymodel (Chen and Dudhia, 2001), and the Yonsei planetaryboundary-layer scheme (Hong et al., 2006) were applied forall domains. The Grell–Devenyi ensemble cumulus parame-terization scheme (Grell and Devenyi, 2002) was applied forthe outer three domains, while there was no cumulus parame-terization scheme for the inner two domains. In addition, thedistribution of urban land cover was replaced using the latestdata downloaded fromhttp://webmap.ornl.gov.
2.4 Master Chemical Mechanism box (Mbox) modelsimulation
In this study, a photochemical box model (PBM) implement-ing the most up-to-date version of near-explicit photochem-ical mechanism, namely the Master Chemical Mechanismversion 3.2 (MCMv3.2), has been applied to simulated theO3 pollution at the two sites (Lam et al., 2013). MCMv3.2was employed to describe the photochemical degradation inthis study, including 143 VOCs in 16 500 reactions (Jenkinet al., 1997, 2003; Saunders et al., 2003; Bloss et al., 2005).The mechanism is accessible via the website:http://mcm.leeds.ac.uk/MCM. Three model scenarios were consideredin this study: (1) Stationary photochemical box in TW: inthis scenario, the monitoring station at TW is assumed to bethe center of the box model and the concentrations of the tar-geted species are homogenous throughout the box. Hence,the model in scenario 1 is constrained with TW data only;(2) Stationary photochemical box in TMS: similar to scenario1, monitoring station at TMS is assumed to be the center ofthe box model and the model is constrained only with TMS
Atmos. Chem. Phys., 13, 3881–3898, 2013 www.atmos-chem-phys.net/13/3881/2013/
H. Guo et al.: Characterization of photochemical pollution 3885
Table 1.Statistics of trace gases at the TMS and TW sites.
Species TMS TW
Mean± 95 % CI∗ Max Value Mean± 95% CI∗ Max value
O3 (ppbv) 55± 1 163 22± 1 116Ox (ppbv)1 58± 1 178 47± 1 157NOx (ppbv)2 10.7± 0.3 75 55± 1 262CO (ppbv) 436± 7 842 517± 8 1150SO2 (ppbv) 4.1± 0.1 28 6.1± 0.2 31
∗ Mean±95 % confidence intervals,1 Ox = NO2+ O3, 2 NOx = NO + NO2
data; (3) Moving box (Mbox): this scenario is an oversim-plified mountain–valley breezes phenomenon, with the gridlocated between TW and TMS monitoring stations and anair parcel moving in an idealized trajectory. During daytimehours (08:00–17:00 LT), the monitoring station in TW wasassumed to be the center of the box model and the concen-trations of the targeted species were homogenous throughoutthe box. The air parcel from TW followed the valley breezeentering the grid simultaneously, which brought trace gasesemitted from TW to the top of the mountain. Photochemi-cal reaction occurred under abundant sunlight at the top ofthe mountain (TMS). At this scenario, the model was con-strained with TW data only. If mesoscale circulations weredominant, the modeled O3 levels compared well with the ob-servations in TMS during daytime hours. When, at dusk, theair parcel was carried back down by the mountain breeze andinto the grid until the next morning (18:00–07:00 LT), at thisscenario, TMS was assumed to be the center of the box modeland the model was constrained with TMS data only.
3 Results and discussion
3.1 Overall observation results
3.1.1 Levels of trace gases and O3 episodes
Table 1 summarizes the statistics of trace gases during thesampling period. In general, the mixing ratios of air pol-lutants were greater at TW than TMS, whereas the sec-ondary pollutant O3 was greater at TMS than TW. The av-erage concentrations of NOx, CO and SO2 at TMS were10.7±0.3 ppbv, 436±7 ppbv and 4.1±0.1 ppbv, which were0.19, 0.85 and 0.67 times those measured at TW, respec-tively. On the other hand, the mean O3 concentration was55±1 ppbv at TMS, 2.5 times that of TW. To gain further in-formation on the O3 pollution at the two sites, the frequencyof O3 episode days was investigated. At the urban TW site,only one O3 episode day (19 September, concentration=
116 ppbv) and three near-O3 episode days (i.e., the peakhourly O3 mixing ratio between 80–100 ppbv, or China’sGrade I standard) were observed. At the TMS site, the max-imum hourly average O3 mixing ratio reached 163 ppbv.
Twenty-one O3 episode days (i.e., 8, 19–20 September; 23–24, 29–31 October; and 1–3, 8–9, 11, 17–19, 22–23, 26–27November) were found during the sampling period.
3.1.2 Diurnal variation
Figures 2a and b show the diurnal variations of mean O3,NOx, CO, SO2 and surface winds at TMS and TW, respec-tively. TMS and TW had similar diurnal patterns of O3, expe-riencing O3 maxima in the afternoon and minimum at nightand in the morning. However, the maximum O3 at TMSshowed a delay, when compared to that at TW. The aver-age daily maximum O3 mixing ratio at TMS (70± 6 ppbv,15:00 LT) appeared 1 h later (p < 0.05) than that observed atTW (35±4 ppbv, 14:00 LT). The delayed daily maximum O3at TMS was due to the fact that the air mass arriving at TMSwas generally more aged than that at TW, which may be at-tributed to regional transport (see Sect. Regional transport)and/or mesoscale circulations (see Sect. Mesoscale circula-tion). At TMS, O3 exhibited relatively stable concentrationsfrom midnight to the early morning, a decrease at sunrise,a minimum at about 10:00 LT, a daytime buildup to a broadmaximum value at about 15:00 LT, and a slow decrease untilmidnight, with an average diurnal difference of 16 ppbv. Theslow nighttime decay of O3 at TMS might be attributed to thelimited NO titration and the reduced boundary-layer mixingheight. Indeed, the boundary-layer height was approximately2 km in the daytime and reduced to about 1 km at night inHong Kong (Guo et al., 2012).
The diurnal variations of O3 at TW had one peak atabout 03:00 and another at 14:00 LT with a trough at about07:00 LT (Fig. 2b). The peaks and the trough of O3 were cor-responding to NO minimum and maximum, consistent withprevious studies (Chan et al., 1998a; So and Wang, 2003).The combination of photochemical formation and downwardmixing from the overlying air masses could result in the O3daily peak in the afternoon (So and Wang, 2003; Guo et al.,2009). After reaching the daily peak (14:00 LT), O3 gradu-ally decreased and approached the normal background levelat night due to the fact that NO emitted during the rush hourscould titrate some O3 and the photochemical production ofO3 ceased at night (Chan et al., 1998a; So and Wang, 2003);
www.atmos-chem-phys.net/13/3881/2013/ Atmos. Chem. Phys., 13, 3881–3898, 2013

3886 H. Guo et al.: Characterization of photochemical pollution
Fig. 1. The sampling sites and the surrounding environment.
Fig. 2. (a) Surface meteorological conditions, (b) average diurnal patterns of trace gases at
TMS and TW and (c) vertical profiles of meteorological conditions and O3 in Hong Kong.
Fig. 2. (a)Surface meteorological conditions,(b) average diurnal patterns of trace gases at TMS and TW and(c) vertical profiles of meteo-rological conditions and O3 in Hong Kong.
and to a lesser extent, the dry deposition process could alsocause the drop of O3 concentration (Zanis et al., 2007; Xue etal., 2011). Then, O3 started to buildup slowly and presenteda peak in the early morning, which was more obvious whena trough was generated at 07:00 LT. This trough was causedby the NO from the fresh vehicular emission which titratedpart of the O3 (Chan et al., 1998a; So and Wang et al., 2003).On the other hand, the small O3 peak in the early morningmay be caused by the decreased titration of NO. While NOstarted to decrease at 00:00 LT and reached its lowest level atabout 04:00 LT (data not shown), O3 increased gradually andformed a peak from 00:00–05:00 LT. In addition, the smallO3 peak in the early morning might be also attributed tothe constant transport of O3 to TW by southeasterly flowsfrom the South China Sea where O3 was less consumed (Soand Wang et al., 2003; Guo et al., 2009). This speculationwas based on the fact that the winds changed from easterlyto southeasterly from midnight until dawn. The imposed O3from the South China Sea and the minimum traffic activi-ties caused higher O3 concentrations in the early morningthan the normal background level at night (So and Wang,2003; Guo et al., 2009). The speculation was further evi-denced by the diurnal variations of dimethyl sulfide (DMS),an ocean tracer. DMS had a small peak observed from 00:00to 03:00 LT (data not shown), corresponding to the small O3peak observed between midnight and dawn. Previous stud-ies indeed reported that southeasterly winds from the SouthChina Sea could result in higher O3 levels at night (So andWang, 2003; Guo et al., 2009).
The diurnal variation of NOx at the TW site showed atypical urban profile, i.e., bimodal structure. The first peak
appeared in the early morning (07:00–09:00 LT) while thesecond peak was at about 18:00–19:00 LT, coincident withthe traffic pattern of Hong Kong. On the other hand, a broadNOx peak with a delay (compared to TW) was observed atTMS. The peak NOx value (15.3± 2.2 ppbv) at TMS wasmuch lower (p < 0.01) than that at TW (84.5± 8.1 ppbv).In addition, the diurnal profiles of SO2 and CO were simi-lar at TMS, with a small and broad peak in the afternoon,which might be indicative of the influence of regional trans-port (Guo et al., 2009; Jiang et al., 2010) and/or mesoscalecirculations (Parrish et al., 1993; Gao et al., 2005; Wang etal., 2006).
3.2 Which factors are responsible for the discrepancyof O3 pollution observed at TMS and TW?
While comparable solar radiation was found at the two sites(p > 0.1, with the average value of 275± 114 and 270±105 W m−2 at TMS and TW, respectively), higher tempera-ture, lower relative humidity and wind speed, which are con-ducive for photochemical O3 formation (Wang et al., 2003;Jiang et al., 2008; Guo et al., 2009), were found at the urbanTW site (Fig. 2a, b). Nonetheless, the O3 concentrations atTW were much lower than TMS. The difference of the meanO3 levels between the two sites during the sampling periodwas 33 ppbv (Table 1), while hourly differences reached upto 122 ppbv. As the two sites are separated by a distance ofabout 7 km and an elevation of 630 m, the factors that couldcause the discrepancy of O3 levels observed at the two sitesare discussed in the following sections.
Atmos. Chem. Phys., 13, 3881–3898, 2013 www.atmos-chem-phys.net/13/3881/2013/
H. Guo et al.: Characterization of photochemical pollution 3887
Fig. 3. The mean mixing ratios of (a) different VOC species and (b) OH radical at TMS and
TW during the sampling period. Vertical bars are 95% confidence intervals.
Fig. 4. The scatter plots of (a) m, p-xylenes vs. ethylbenzene and (b) i-butane vs. propane at
TMS and TW.
Fig. 5. Combined wind rose maps at daytime hours during the sampling period at (a) TMS
and (b) TW.
Fig. 3. The mean mixing ratios of(a) different VOC species and(b) OH radical at TMS and TW during the sampling period. Vertical barsare 95 % confidence intervals.
3.2.1 Degree of photochemical reactions
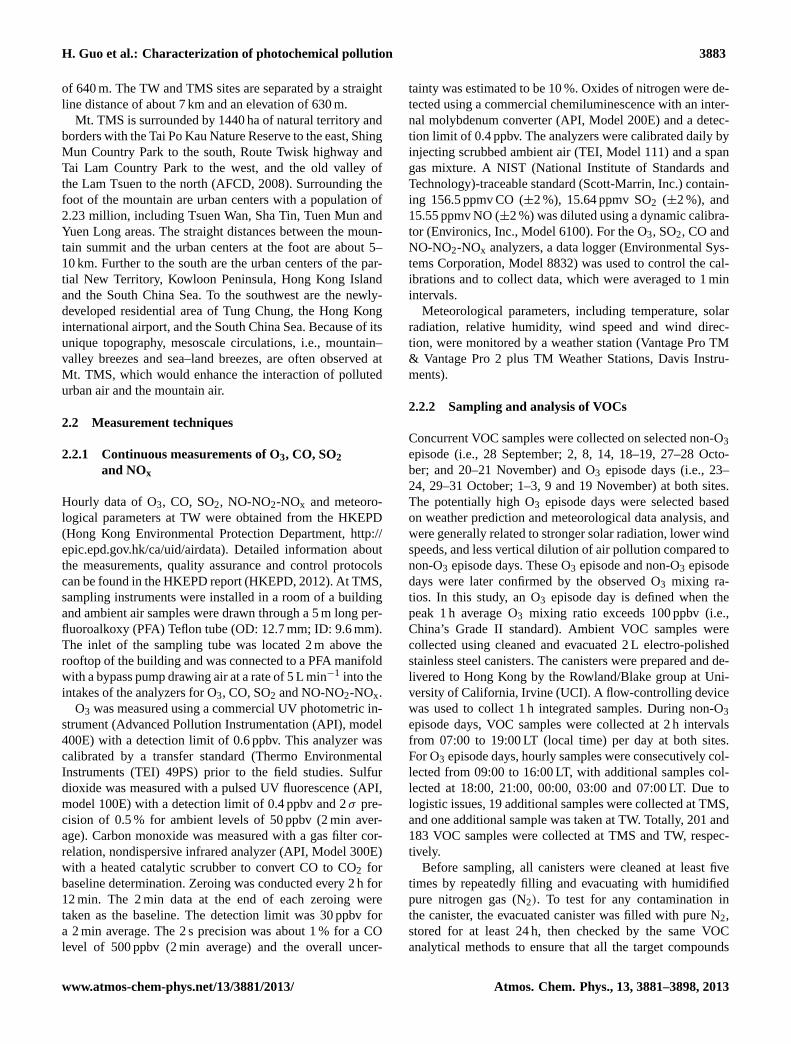
Comparing the levels of precursors is a useful tool to in-vestigate the degree of photochemical reactions at two dif-ferent sites (Sillman, 1999; Jenkin and Clemitshaw, 2000).Figure 3a shows the mean mixing ratios of different VOCgroups at the two sites. The VOC species were classified intosix functional types, i.e., R-AROM group (reactive aromat-ics; including xylenes, toluene, trimethylbenzenes and ethyl-benzene), R-OLE (reactive olefins; comprising all olefins ex-cept ethene), C≥ 4 (including alkanes with four or more car-bons), LRHC (low reactive hydrocarbon carbons; comprisingethane, propane, ethyne and benzene), ETHE (ethene) andBVOC (including isoprene,α/β-pinene and limonene). Dur-ing the sampling period, the VOC levels were considerablylower at TMS than TW (p < 0.01), which is consistent withother O3 precursors, i.e., NOx and CO (Table 1).
On the other hand, the levels of hydroxyl radical (OH rad-ical) were further compared at the two sites. As we did notmeasure OH radical in situ, its mixing ratio during daytimehours (07:00–19:00 LT) was calculated using two models,i.e., an observation based model (OBM) and a Master Chem-ical Mechanism (MCM) model. The detailed description ofthe OBM model can be found elsewhere (Zhang et al., 2007,2008; Cheng et al., 2010; Ling et al., 2011). Besides simu-lation results, the concentration of OH radical was also esti-mated from the parameterization method through the empir-ical relationship between isoprene (ISOP) and its oxidationproducts, i.e., methacrolein (MAC) and methyl vinyl ketone(MVK), based on the assumption that the processing timeof the air mass was identical for MAC and MVK and therewere no additional sources of MAC and MVK apart from theoxidation of isoprene (Eqs. 1–5 as follows),
ISOP+ OH → 0.63HCHO+ 0.32MVK
+0.23MACk1 = 1.0× 10⁻¹⁰cm−3s−1, (1)
MAC + OH → productsk2 = 3.3× 10⁻¹¹cm−3s−1, (2)
MVK + OH → productsk3 = 1.9× 10⁻¹¹cm−3s−1, (3)
[MAC]
[ISOP]=
0.23k1
(k2 − k1)(1− e(k1−k2)[OH]avgt ), (4)
[MVK ]
[ISOP]=
0.32k1
(k3 − k1)(1− e(k1−k3)[OH]avgt ), (5)
where [MAC], [ISOP] and [MVK] were the measuredvalues for MAC, isoprene and MVK, respectively, andt is the processing time. Details of this method can befound in Liu et al. (2009) and Yuan et al. (2012). Fig-ure 3b presents the calculated and simulated OH radi-cal concentrations at TMS and TW during daytime hours.At TMS, the average mixing ratios of OH radical simu-lated by OBM and MCM models were (2.31± 0.27)× 106
and (3.93± 0.74)× 106 molecule cm−3, respectively, and(2.03± 0.28)× 106 molecule cm−3 from the calculations ofthe parameterization method. On the other hand, the averageconcentration of OH at TW calculated by the correspond-ing three methods were (2.63± 0.29)× 106, (4.26± 0.74)× 106 and (2.27± 0.31)× 106 molecule cm−3, respectively.Though variations were found for the results of differentmethods, the average mixing ratios of OH radical at the twosites were comparable (p > 0.05). In addition, by consider-ing the factor of fractional conversion, which representedthe relative importance of photolysis reactions on OH radi-cal formation in the atmosphere (Atkinson, 1997; Jenkin andClemitshaw, 2000), the mean fraction conversion index atTMS (0.17± 0.03) was lower than that at TW (0.23± 0.04,p < 0.05). Based on the aforementioned analyses, it couldbe concluded that photochemical reactions at TMS were notstronger than at TW. Hence, the higher O3 levels observedat TMS than those at TW were not induced by the differentdegrees of photochemical reactions.
3.2.2 Influence of NO titration
The feature of higher O3 at the higher elevation site (TMS)than at the ground-level site (TW) is somewhat in line withthe vertical profiles of O3 observed in Hong Kong and other
www.atmos-chem-phys.net/13/3881/2013/ Atmos. Chem. Phys., 13, 3881–3898, 2013
3888 H. Guo et al.: Characterization of photochemical pollution
Fig. 3. The mean mixing ratios of (a) different VOC species and (b) OH radical at TMS and
TW during the sampling period. Vertical bars are 95% confidence intervals.
Fig. 4. The scatter plots of (a) m, p-xylenes vs. ethylbenzene and (b) i-butane vs. propane at
TMS and TW.
Fig. 5. Combined wind rose maps at daytime hours during the sampling period at (a) TMS
and (b) TW.
Fig. 4.The scatter plots of(a) m,p-xylene vs. ethylbenzene and(b) i-butane vs. propane at TMS and TW.
locations (e.g., Wang et al., 2001; Chen et al., 2002; Tseng etal., 2009; Ma et al., 2011). Wang et al. (2001) showed that O3generally increased with elevation above surface and had amodest peak between 550 and 650 m at the subtropical CapeD’ Aguilar site in Hong Kong in October and November2001. In addition, Chen et al. (2002) and Tseng et al. (2009)reported that high O3 concentrations appeared at the heightof 500–600 m and decreased rapidly towards the ground dur-ing daytime in central Taiwan. Both studies suggested thathigh O3 concentrations in the higher elevations were partiallyattributed to the limited NO titrations, due to the lower lev-els of NO at higher elevations. In this study, the average NOmixing ratio at the mountain site (TMS) was 3.5± 0.1 ppbv,compared to 28± 1 ppbv at TW, indicating that the higherO3 mixing ratios at TMS were likely attributed to the limitedNO titration (O3 + NO = NO2 + O2). The NO titration is amain process of loss for O3, which can convert NO to NO2rapidly (Tang et al., 2012). In order to investigate the titrationeffect, the concentrations of “oxidant” Ox (the sum concen-tration of O3 + NO2) were calculated at the two sites (Jenkinand Clemitshaw, 2000; Chen et al., 2002; Jiang et al., 2010).The mean Ox mixing ratio was 47± 1 ppbv at TW, close tothe value (58± 1 ppbv) found at TMS (Table 1), confirminglower degree of NO titration at the TMS site.
3.2.3 Influence of vertical meteorological conditions
Besides NO titration, vertical structure of meteorologicalvariables is an important factor that could influence theO3 levels at different elevations (Lin et al., 2007; Ma etal., 2011). Therefore, we investigated the vertical profilesof meteorological conditions, such as temperature and rel-ative humidity in Hong Kong on the selected 40 days, in-cluding twenty-one (21) O3 episode days and selected nine-teen (19) non-O3 episode days before/after the O3 episodedays. Two cases (23 and 27 October) are presented hereas examples (Fig. 2c). The vertical profile of meteorolog-ical data for Hong Kong was downloaded from the De-partment of Atmospheric Science, College of Engineering,
University of Wyoming (http://weather.uwyo.edu/upperair/sounding.html). In addition, the vertical profile of O3 wasthe average pattern of the data in 2005–2010, which was ob-tained from the Measurement of Ozone by Airbus In-ServiceAircraft project (MOZAIC, http://mozaic.aero.obs-mip.fr/web/). Detailed description for this dataset could be foundin Ding et al. (2008). It should be noted that the verticalmeteorological data presented here were obtained from theKing’s Park station (site 45004, 22.32◦ N, 114.17◦ E, withstraight line distances of 12 km and 7 km to TMS and TW,respectively), at 08:00 LT. Inspection of the figures suggestedthat fluctuation in relative humidity and potential temperaturecaused by inversion layers was found at the altitudes of 600–900 m on 23 October and 720–1000 m on 27 October. Fur-thermore, the modified bulk Richardson number (Ri) (Doranet al., 2003) was calculated, and theRi values were 4.6 and1.0 at the altitudes from 600 to 900 m on 23 October and from720 to 1000 m on 27 October, respectively, indicating that theatmosphere was stable and no wind-shear turbulence existedat those elevations (Lin et al., 2007). These inversion layerssuppressed dispersion of air pollutants and gave rise to highO3 levels at high altitudes, consistent with previous studies(Lin et al., 2007; Ma et al., 2011). Indeed, the inversion layerwas often (24 days of the selected 40 days) observed at therange of altitudes of 500 to 1000 m, which may be a factorthat resulted in the high O3 levels at the TMS site located atthe elevation of 640 m.
3.2.4 Influence of atmospheric processes
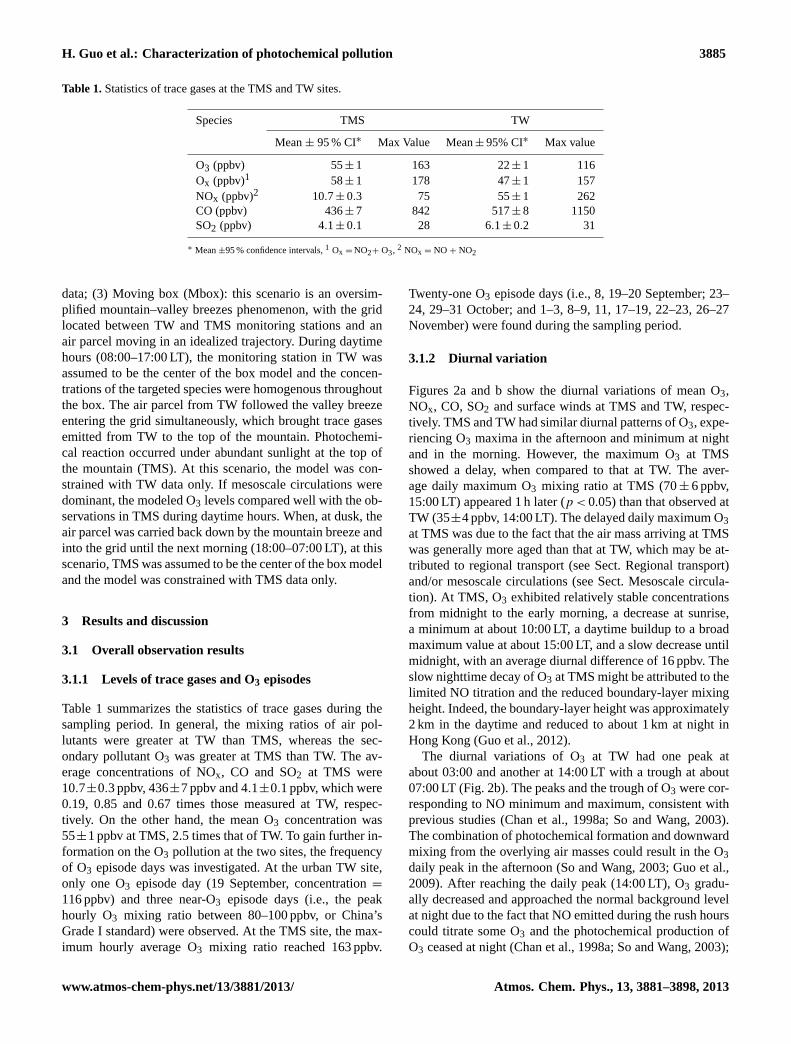
Figure 4 presents the scatter plots of (a)m,p-xyleneto ethylbenzene and (b)i-butane to propane at TMSand TW. Sincem,p-xylene and i-butane are more re-active than ethylbenzene and propane, respectively, theratios of m,p-xylene/ethylbenzene andi-butane/propanewill decrease when photochemical reaction occurs dur-ing the air mass transport. These two pairs of ra-tios were much lower at TMS (p < 0.05), with them,p-xylene/ethylbenzene ratio of 0.74± 0.04 pptv pptv−1
Atmos. Chem. Phys., 13, 3881–3898, 2013 www.atmos-chem-phys.net/13/3881/2013/

H. Guo et al.: Characterization of photochemical pollution 3889
Fig. 5.Combined wind rose maps at daytime hours during the sampling period at(a) TMS and(b) TW.
(1.66± 0.05 at TW) and thei-butane/propane ratio of0.62± 0.06 pptv pptv−1 (0.78± 0.02 at TW). In addition, theratio of alkyl nitrates to their parent hydrocarbons was alsoinvestigated. Since the lifetime of ethyl nitrate is shorter thanethane, and the lifetime of 2-butyl nitrate is longer thann-butane, the more aged air mass will have a smaller ratioof ethyl nitrate/ethane vs. 2-butyl nitrate/n-butane (Robertset al., 1998; Reeves et al., 2007). The ratio of ethyl ni-trate/ethane vs. 2-butyl nitrate/n-butane was 0.17± 0.01 atTMS, while it was 0.91± 0.10 at TW. The results suggestedthat the air mass arriving at TMS was generally more agedthan that at TW, which may be attributed to regional trans-port (Guo et al., 2009; Cheng et al., 2010) and/or mesoscalecirculations, i.e., mountain–valley breezes.
Regional transport
Different wind fields were observed at TMS and TW, indicat-ing the influence of different air masses. The combined windroses (Fig. 5) during the sampling period clearly demon-strated that the dominated surface wind at TMS was gener-ally from the north with the dominant wind speeds between0.02 and 4 m s−1, whereas the prevailing winds were gen-erally from the southeast with dominnt wind speeds of 1–3 m s−1 at TW. Moreover, the diurnal wind patterns showeda clear shift in wind direction at TW, from easterly winds atnight and early morning to stronger southerly winds in theafternoon (Fig. 2a, b). On the other hand, the winds at TMSwere generally from the north, with increased speeds at nightand in the early morning, and decreased speeds during day-time hours. The two different wind patterns indicated that O3mixing ratios at TMS and TW may be influenced by differ-ent air flows. Previous studies (So and Wang, 2003; Wangand Kwok, 2003; Guo et al., 2009) have reported that ratiosof SO2/NOx and CO/NOx were lower in Hong Kong than
in the PRD due to the use of low-sulfur-containing fuel andmore efficient combustion technology in Hong Kong. In thisstudy, the ratios of SO2/NOx and CO/NOx were 0.13± 0.04and 12.85± 0.37 ppbv ppbv−1 at TW, within the ranges of0.02–0.19 and 5.21–19.25 ppbv ppbv−1 from September toNovember 2010 observed in Hong Kong urban air (datafrom HKEPD, http://www.epd.gov.hk), respectively. Thissuggested that air masses at TW were mainly influenced byHong Kong local emissions. On the other hand, the ratiosof SO2/NOx and CO/NOx were much higher at TMS, withthe values of 0.40± 0.01 and 46.38± 0.71 ppbv ppbv−1, re-spectively, which were within the values reported in the PRDregion (0.4–1.26 and 11.9–52.0, respectively) (Wang et al.,2005; Guo et al., 2009; Zhao et al., 2011). Hence, the rela-tively higher ratios of SO2/NOx and CO/NOx at TMS indi-cated the possible influence of PRD emissions.
The urban centers in the PRD region of China, locatedat straight line distances of 15–184 km north of the TMSsite, are sources of air pollutants, including O3 and its pre-cursors (Chan and Chan, 2000; Huang et al., 2006; Guoet al., 2009). At high wind speed (> 2m s−1), interregionaltransport of air pollutants generated from the PRD regioncould arrive in Hong Kong in several hours, thereby in-creasing the levels of O3 and its precursors (Wang et al.,2005, 2009; Huang et al., 2006; Zhang et al., 2007; HKEPD,2012). To investigate the effect of regional transport fromthe PRD region on the air pollutants at the TMS site, wefirst examined the levels of air pollutants under the in-fluence of regional transport (scenario 1), i.e., northerlywinds (270◦ < wind direction≤ 360◦ and 0◦ ≤ wind direc-tion< 90◦) with high speed (> 2m s−1) and local emis-sions (scenario 2), i.e., southerly and easterly winds (90◦
≤
wind direction ≤ 270◦) and northerly winds with lowspeed (< 2m s−1). O3, CO, SO2 and TVOCs showed
www.atmos-chem-phys.net/13/3881/2013/ Atmos. Chem. Phys., 13, 3881–3898, 2013

3890 H. Guo et al.: Characterization of photochemical pollution
Table 2.Comparison of VOC ratios for TMS regional air, urban Hong Kong and PRD region.
Site TMS regional TW urban Other Hong Kong PRD regionc
aira aira urban airb
Ethyne/propane 1.46 0.89 0.99 0.73–1.89Benzene/propane 0.57 0.25 0.29 0.35–0.70Toluene/benzene 3.14 5.13 4.11 1.75–5.40n-Butane/propane 0.62 1.22 0.93 0.47–0.52
a This study;b HKEPD (2010);c data from Barletta et al. (2008) and Zhang et al. (2012).
higher mixing ratios (p < 0.05) in scenario 1, with aver-age values of 57± 2 ppbv, 495± 9 ppbv, 4.6± 0.2 ppbv and47± 7 ppbC, respectively, while the respective average con-centrations were 48± 2 ppbv, 370± 11 ppbv, 3.6± 0.2 ppbvand 33± 7 ppbC for scenario 2. This feature was consistentwith previous studies (Chan and Chan, 2000; Guo et al.,2009). In addition, the relationship between VOC variabil-ity and the atmospheric lifetime was analyzed to estimate thedistance of the sources of air pollutants with/without the in-fluence of regional transport (Jobson et al., 1998; Warnekeand de Gouw, 2001; Wang et al., 2005). This relationship isexpressed as follows:
Slnx = Aτ−b , (6)
whereSlnx is the standard deviation of the natural logarithmof the mixing ratioX, τ is the atmospheric lifetime, andAand b are fit parameters. The detailed description for thisfunction can be referred to in Wang et al. (2005). In brief,the constantb is related to the source–receptor distances andlies between 0 and 1. The closer the sampling site is from theair pollutant sources, the smaller the exponentb (Ehhalt etal., 1998; Wang et al., 2005). Figure 6 presents the relation-ship of variability with lifetime for different VOC speciesunder the influence of scenarios 1 and 2. It can be foundthat theb exponent was higher in scenario 1 than in sce-nario 2 (p < 0.05), indicating that air masses at TMS weremore frequently impacted by regional transport, particularlyunder prevailing northerly winds with high speeds (Wang etal., 2005).
Therefore, to further assess the possible influence ofPRD air masses on the air quality at TMS, ambientconcentration ratios of VOCs i.e., ethyne/propane, ben-zene/propane, toluene/benzene andn-butane/propane werecompared among the TMS samples affected by regionaltransport, the Hong Kong urban air samples and samples col-lected in the PRD region (Table 2). Compared to those inHong Kong urban areas, higher ratios of ethyne/propane andbenzene/propane were found in the PRD region due to thehigh combustion emissions and solvent usage (Barletta et al.,2008; HKEPD, 2010; Zhang et al., 2012). On the other hand,n-butane and propane are generally liquefied petroleum gas(LPG) tracers. The ratio ofn-butane/propane was lower inthe PRD than that in Hong Kong urban areas because of
Fig. 6. The correlation of variability with lifetime for different VOC species with/without the
influence of regional transport
Fig. 7. Scatter plots of (a) CO and (b) SO2 during daytime and nighttime hours between TMS
and TW.
Fig. 8. The correlation between the observed data and the MCM modeled results during
daytime hours
Fig. 6.The correlation of variability with lifetime for different VOCspecies with/without the influence of regional transport.
the high percentage ofn-butane in the composition of LPGused in Hong Kong (Tsai et al., 2006; Tang et al., 2008; Hoet al., 2009; Zhang et al., 2012). Moreover, a higher ratioof toluene/benzene was found in Hong Kong urban air astoluene was a distinct emission from Hong Kong due to thehigh toluene content in unleaded gasoline (So and Wang etal., 2003; Ho et al., 2004, 2009). In this study, for the TMSsamples affected by regional air masses, the above four ratioswere between the values observed in Hong Kong urban airand the PRD region. These results confirmed that the air pol-lutants at TMS were somewhat influenced by air masses fromthe highly polluted PRD region, apart from the influence ofHong Kong urban air by mesoscale circulations (discussed inSect. Mesoscale circulation).
Mesoscale circulation
To investigate the influence of mountain–valley breezes onair mass transport during this study, correlations of SO2 andCO at the TMS and TW sites were analyzed. Figures 7aand b show correlations of daytime and nighttime averagesof CO and SO2 for TMS vs. TW. In general, good to mod-erate correlations were found for both CO (R2
= 0.73 and0.63 for daytime and nighttime hours, respectively) and SO2(R2
= 0.62 and 0.69 for daytime and nighttime hours, re-spectively) between the two sites, suggesting some interplaysof air masses. The slopes, which were less than one, impliedthe dilution of air masses during their transport from TWto TMS. Note that the prevailing winds at the mountain site
Atmos. Chem. Phys., 13, 3881–3898, 2013 www.atmos-chem-phys.net/13/3881/2013/

H. Guo et al.: Characterization of photochemical pollution 3891
Fig. 6. The correlation of variability with lifetime for different VOC species with/without the
influence of regional transport
Fig. 7. Scatter plots of (a) CO and (b) SO2 during daytime and nighttime hours between TMS
and TW.
Fig. 8. The correlation between the observed data and the MCM modeled results during
daytime hours
Fig. 7.Scatter plots of(a) CO and(b) SO2 during daytime and nighttime hours between TMS and TW.
Fig. 6. The correlation of variability with lifetime for different VOC species with/without the
influence of regional transport
Fig. 7. Scatter plots of (a) CO and (b) SO2 during daytime and nighttime hours between TMS
and TW.
Fig. 8. The correlation between the observed data and the MCM modeled results during
daytime hours
Fig. 8. The correlation between the observed data and the MCMmodeled results during daytime hours.
were mainly from the north while those at TW were mostlyfrom the southeast (Fig. 2a). It is unlikely that the correla-tions for TMS vs. TW were caused by the same regionalair mass. Therefore, it suggested that the interplays of airmasses and the moderate to good correlations between thetwo sites were likely caused by the influence of mesoscalecirculations, i.e., mountain–valley breezes. The lower corre-lation for CO observed during the nighttime hours was likelydue to the fact that the observed CO concentrations at TWwere higher because of the local urban emissions. The lowercorrelation for SO2 during daytime hours was driven by a fewdata points with higher observed than predicted SO2 levels atTMS. This is mostly attributed to the influence of regionaltransport (Sect. 3.2.4), which could bring the air pollutantsfrom the PRD region to TMS (Fig. 7b).
The correlation between the observation and the resultsof the moving box (Mbox) model for TMS and TW devel-oped by the PBM-MCM was also explored to evaluate theinfluence of mesoscale circulation. Since photochemical O3formation occurs during daytime hours, the photochemicalprocesses between 08:00 and 17:00 LT were simulated us-ing the Mbox model on the selected VOC sampling days,
i.e., 24, 29–31 October, 1–3, 9 and 19 November 2010, whenthe potential influence of mesoscale circulations was dom-inant (Fig. 9). In addition, to determine whether regionaltransport had influence on the air pollutants for the model-ing periods as stated above, wind speeds, ratios of SO2/NOx,CO/NOx, and toluene/benzene during daytime hours (08:00–17:00 LT) at TMS were compared with those influenced bythe regional transport (in Sect. Regional transport). If themesoscale circulations were dominant during the Mbox mod-eling periods, lower wind speeds, lower ratios of SO2/NOxand CO/NOx and a higher ratio of toluene/benzene would beobserved when compared to those observed for the periodinfluenced by regional transport (Sect. Regional transport).Indeed, the wind speed, ratios of SO2/NOx and CO/NOx dur-ing the mesoscale modeling period were 1.57± 0.16 m s−1,0.37± 0.02 and 42.01± 1.08 ppbv ppbv−1, respectively,which were much lower (p < 0.05) than those ob-served in the period influenced by regional transport atTMS, with values of 2.93± 0.07 m s−1, 0.45± 0.02 and51.01± 1.28 ppbv ppbv−1, respectively. Moreover, the ra-tio of toluene/benzene (4.01± 0.28 pptv pptv−1) was muchhigher (p < 0.05) during the selected days for MBox model-ing than that (3.14± 0.38) in the periods affected by regionaltransport, confirming that mesoscale circulations were domi-nant for the modeling periods. Figure 8 shows the correlationbetween observed and modeled O3 during daytime hours.The time lag between the two sites was evaluated from di-viding the distance between TMS and TW by the averagevalue of the observed wind speed during daytime hours. Thevalue of time lag was factored in for pairs of data points usedfor correlation analysis, i.e., a sample collected at 09:00 LT atTW corresponded to a sample at 10:00 LT at TMS for a valleybreeze during daytime hours if the time difference was onehour. Good correlation (R2
= 0.70) between Mbox modeledand observed O3 was found during daytime hours (Fig. 8),suggesting that O3 at TMS was related to the air pollutants atTW. This further indicated the influence of mesoscale circu-lations.
www.atmos-chem-phys.net/13/3881/2013/ Atmos. Chem. Phys., 13, 3881–3898, 2013

3892 H. Guo et al.: Characterization of photochemical pollution
Fig. 9. Simulation of mountain-valley breezes on 9 November 2010: (a) valley breezes at
daytime; (b) mountain breezes at nighttime.
Fig. 9.Simulation of mountain–valley breezes on 9 November 2010:(a) valley breezes at daytime;(b) mountain breezes at nighttime.
In addition to the above analysis, mountain–valley breezeswere simulated using a domain system of five nested grids(Sect. 2.3). The modeling focused on 16–18, 23 September,23–24, 29–31 October, 1–3, 9, 12, and 19 November 2010,when evidence for the mesoscale circulation was clear basedon the meteorological data and the levels of air pollutants.Here, the simulation results for 9 November are presented asan example (Fig. 9).
The outer four nested domains were simulated using atwo-way interactive method from 00:00 UTC (08:00 LT) on8 November, which was initialized using NCEP (NationalCenters for Environmental Prediction) FNL (Final AnalysisData) Operational Model Global Tropospheric Analyses data(1◦
× 1◦, http://rda.ucar.edu/datasets/ds083.2/), while the in-ner domain was simulated using a one-way nested methodfrom 12:00 UTC (20:00 LT) on 8 November, with initial andboundary fields provided by the fourth domain (1.333 kmgrid). The model results show that, although the dominantsynoptic wind direction was from the north during daytimeand nighttime hours, weak mesoscale flows were observed.The model simulation showed a valley breeze in daytime(09:00 LT) on 9 November and a mountain breeze duringnighttime (23:00 LT) hours. Therefore, the model simula-tion results further confirmed the influence of mountain–valley breezes on the redistribution of air pollutants betweenTW and TMS. Since O3 is a secondary pollution, as the airmasses aged, secondary reactions occurred and the accumu-lated O3 pollution increased (Jiang et al., 2010). Mesoscale
circulations, i.e., mountain–valley breezes, can bring freshly-emitted precursors such as VOCs and newly-formed O3 in-cluding that formed during the transit from the urban areasat the foot of the mountain (i.e., TW) to the summit (i.e.,TMS) during daytime hours, which induced higher O3 levelsat TMS.
In summary, based on the above discussion, it could beconcluded that the higher O3 mixing ratios at TMS were at-tributed to the combination influence of NO titration, verti-cal meteorological conditions, and different atmospheric pro-cesses including mesoscale circulations and regional trans-port.
3.3 The relationships between O3 and its precursors
Different variations of O3 and other trace gases at the twosites indicated that relationships between O3 and its precur-sors may be different at the two sites. Correlations betweenO3 and reactive nitrogen (NOy) can provide useful informa-tion on the chemistry of photochemical O3 formation in agiven location (Sillman et al., 1998, and references therein).In this study, NO was detected with a chemiluminescenceanalyzer (API, Model 200E), while NO2 was converted toNO by a hot molybdenum oxide (MoO) convertor and mea-sured by the chemiluminescene detector. This analysis tech-nique converts not only NO2 but also other reactive nitro-gen species, including peroxyacetyl nitrate anhydride (PAN),organic nitrates and nitric acid to NO (Wang et al., 2001;
Atmos. Chem. Phys., 13, 3881–3898, 2013 www.atmos-chem-phys.net/13/3881/2013/
H. Guo et al.: Characterization of photochemical pollution 3893
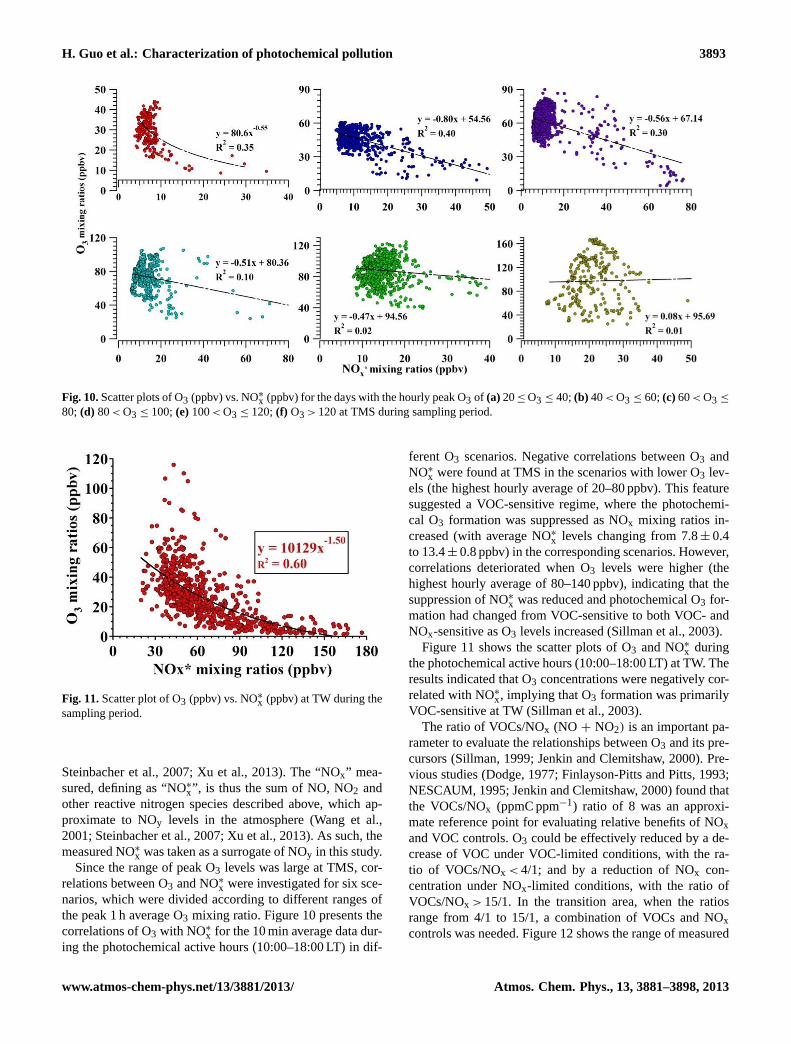
Fig. 10. Scatter plots of O3 (ppbv) vs. NOx* (ppbv) for the days with the hourly peak O3 of (a)
20 ≤ O3 ≤ 40; (b) 40 < O3 ≤ 60; (c) 60 < O3 ≤ 80; (d) 80 < O3 ≤ 100; (e) 100 < O3 ≤ 120; (f)
O3 > 120 at TMS during sampling period.
Fig. 11. Scatter plots of O3 (ppbv) vs. NOx* (ppbv) at TW during the sampling period.
Fig. 12. Scatter plots of VOCs vs. NOx at daytime hours (07:00-18:00 LST) during sampling
period at (a) TW and (b) TMS.
Fig. 10.Scatter plots of O3 (ppbv) vs. NO∗x (ppbv) for the days with the hourly peak O3 of (a) 20≤ O3 ≤ 40;(b) 40< O3 ≤ 60;(c) 60< O3 ≤
80; (d) 80< O3 ≤ 100;(e)100< O3 ≤ 120;(f) O3 > 120 at TMS during sampling period.
Fig. 10. Scatter plots of O3 (ppbv) vs. NOx* (ppbv) for the days with the hourly peak O3 of (a)
20 ≤ O3 ≤ 40; (b) 40 < O3 ≤ 60; (c) 60 < O3 ≤ 80; (d) 80 < O3 ≤ 100; (e) 100 < O3 ≤ 120; (f)
O3 > 120 at TMS during sampling period.
Fig. 11. Scatter plots of O3 (ppbv) vs. NOx* (ppbv) at TW during the sampling period.
Fig. 12. Scatter plots of VOCs vs. NOx at daytime hours (07:00-18:00 LST) during sampling
period at (a) TW and (b) TMS.
Fig. 11.Scatter plot of O3 (ppbv) vs. NO∗x (ppbv) at TW during thesampling period.
Steinbacher et al., 2007; Xu et al., 2013). The “NOx” mea-sured, defining as “NO∗x”, is thus the sum of NO, NO2 andother reactive nitrogen species described above, which ap-proximate to NOy levels in the atmosphere (Wang et al.,2001; Steinbacher et al., 2007; Xu et al., 2013). As such, themeasured NO∗x was taken as a surrogate of NOy in this study.
Since the range of peak O3 levels was large at TMS, cor-relations between O3 and NO∗
x were investigated for six sce-narios, which were divided according to different ranges ofthe peak 1 h average O3 mixing ratio. Figure 10 presents thecorrelations of O3 with NO∗
x for the 10 min average data dur-ing the photochemical active hours (10:00–18:00 LT) in dif-
ferent O3 scenarios. Negative correlations between O3 andNO∗
x were found at TMS in the scenarios with lower O3 lev-els (the highest hourly average of 20–80 ppbv). This featuresuggested a VOC-sensitive regime, where the photochemi-cal O3 formation was suppressed as NOx mixing ratios in-creased (with average NO∗x levels changing from 7.8± 0.4to 13.4± 0.8 ppbv) in the corresponding scenarios. However,correlations deteriorated when O3 levels were higher (thehighest hourly average of 80–140 ppbv), indicating that thesuppression of NO∗x was reduced and photochemical O3 for-mation had changed from VOC-sensitive to both VOC- andNOx-sensitive as O3 levels increased (Sillman et al., 2003).
Figure 11 shows the scatter plots of O3 and NO∗x during
the photochemical active hours (10:00–18:00 LT) at TW. Theresults indicated that O3 concentrations were negatively cor-related with NO∗x, implying that O3 formation was primarilyVOC-sensitive at TW (Sillman et al., 2003).
The ratio of VOCs/NOx (NO + NO2) is an important pa-rameter to evaluate the relationships between O3 and its pre-cursors (Sillman, 1999; Jenkin and Clemitshaw, 2000). Pre-vious studies (Dodge, 1977; Finlayson-Pitts and Pitts, 1993;NESCAUM, 1995; Jenkin and Clemitshaw, 2000) found thatthe VOCs/NOx (ppmC ppm−1) ratio of 8 was an approxi-mate reference point for evaluating relative benefits of NOxand VOC controls. O3 could be effectively reduced by a de-crease of VOC under VOC-limited conditions, with the ra-tio of VOCs/NOx < 4/1; and by a reduction of NOx con-centration under NOx-limited conditions, with the ratio ofVOCs/NOx > 15/1. In the transition area, when the ratiosrange from 4/1 to 15/1, a combination of VOCs and NOxcontrols was needed. Figure 12 shows the range of measured
www.atmos-chem-phys.net/13/3881/2013/ Atmos. Chem. Phys., 13, 3881–3898, 2013

3894 H. Guo et al.: Characterization of photochemical pollution
Fig. 12.Scatter plots of VOCs vs. NOx at daytime hours (07:00–18:00 LT) during sampling period at(a) TW and(b) TMS.
Fig. 13.RIR values of O3 precursors, i.e., THC (total hydrocarbons, consist of the VOCs described in Sect. 3.2.1), NO and CO at(a) TMSand(b) TW.
VOCs vs. NOx during daytime hours at TW and TMS. AtTW, about 82 % of data points had a VOC/NOx ratio withinthe range of 1 to 4, while the ratio for 17 % of data points wasranging from 4 to 8. This result indicated that photochemi-cal O3 formation was mainly VOC-limited at TW; therefore,VOC reduction was most effective in reducing O3, and in-creasing NOx would suppress O3 formation. On the otherhand, different characteristics were observed at TMS. Mostof the data points (about 60 %) had the ratios in the transi-tion area, with values of 4 to 15, while the rest 40 % of datapoints had values ranging from 1 to 4. Additionally, about96 % of those data points with ratios ranging from 4 to 15were found to range from 4 to 8. The relatively higher ratiosof VOCs/NOx at TMS indicated that though VOCs were themost important compounds in the production of O3 at TMS,the contribution of NOx was also significant and a combina-tion of VOC and NOx reductions may be warranted. How-ever, it should be noted that the VOCs observed at the ruralsite, i.e., TMS, may be residues left from the VOCs in theupwind source areas due to photochemical reactions duringtransport. In addition, different VOC species react at differ-ent rates and with different reaction mechanisms, which in-duce the nonlinear dependency of O3 formation on NOx andVOCs. The above limitation could cause uncertainties for theanalysis of the ratios of VOCs/NOx at TMS.
Therefore, in order to investigate the O3-precursor rela-tionship in more details, an observation-based model (OBM)was applied in this study. The OBM model, developed byCardelino and Chameides (1995), uses concentrations of O3and its precursors (i.e., VOCs, NO and CO), as well as mete-orological data measured as a function of time at given sites.The calculated relative incremental reactivity (RIR) functionextracted from the OBM model could be used to investi-gate the change of O3 formation according to the changeof its precursors’ concentrations in different environments(Chameides and Demerjian, 2000; Chou et al., 2006; Zhanget al., 2007, 2008; Cheng et al., 2010; Ling et al., 2011). Inthis study, measured data at 10:00–18:00 LT on the selectedO3 episode days at TMS and TW were input into the OBMmodel to calculate the sensitivity of O3 production to its pre-cursors, i.e., RIR. Figure 13 presents the RIRs for O3 pre-cursors at TMS and TW. It was found that VOC showed thehighest RIR values at the both sites, meaning that VOC wasthe most important group in O3 production. In addition, rel-atively higher RIRs were found for CO at TMS, indicatingthat CO could have a significant impact on the O3 formationwhen it is transported from the upwind areas (Ling et al.,2011). Interestingly, the RIRs of NO at TMS were positivebut small, indicating that NO also had some influence on O3production. On the other hand, the RIRs of NO were negativeat TW, indicating a strong VOC-limited regime. Based on the
Atmos. Chem. Phys., 13, 3881–3898, 2013 www.atmos-chem-phys.net/13/3881/2013/

H. Guo et al.: Characterization of photochemical pollution 3895
VOC/NOx ratio analysis and the OBM results, it was con-cluded that photochemical O3 formation at TMS was mostlyinfluenced by VOCs, with measurable impact of NO, whileO3 production at TW was generally limited by the concen-trations of VOCs.
4 Conclusions
Simultaneous systematic measurements of air pollutantswere conducted at the foot and near the summit of a mountainin Hong Kong from September to November 2010. The lev-els of primary air pollutants (i.e., CO, SO2, NOx and VOCs)were lower at TMS than at TW, while O3 was greater atTMS than at TW. Only one O3 episode day and three near-O3 episode days were observed at TW, while a total twenty-one (21) O3 episode days were found at TMS. The relativelyhigher levels of O3 at TMS were attributed to the combina-tion effects of NO titration, vertical meteorological condi-tions, regional transport and mesoscale circulations. On theother hand, the correlations over the entire ranges of ob-served O3 with NO∗
x, the ratio of VOCs/NOx and the OBMmodeling results implied that photochemical O3 formationat TMS was mostly influenced by VOCs, with a measurableeffect of NOx, while O3 production at TW was generally lim-ited by the concentrations of VOCs.
Acknowledgements.This project is supported by the ResearchGrants Council of the Hong Kong Special Administrative Regionvia grants PolyU5179/09E and NPolyU545/09. This study is partlysupported by the internal grants of the Hong Kong PolytechnicUniversity (A-PK25 and 1-ZV7A). The authors acknowledgethe strong support of the European Commission, Airbus, and theAirlines (Lufthansa, Austrian, Air France) who carry free of chargethe MOZAIC equipment and perform the maintenance since 1994.MOZAIC is presently funded by INSU-CNRS (Institute Nationaldes Sciences del’Univers – Centre National de la RechercheScientifique, France), Meteo-France, and FZJ (ForschungszentrumJulich, Germany). The Final Analysis Data (FNL) was obtainedfrom NOAA CDC. We are grateful to Yu Yufan, Choi Yu-Leung,Chan Wai-Lun, Tam Wai Fan, Shen Yi and Liu Qian for theirtechnical support. The comments from anonymous reviewers arehighly appreciated.
Edited by: A. B. Guenther
References
AFCD (Agriculture, Fisheries and conservation Department), avail-able at:http://www.afcd.gov.hk/, 2008.
Atkinson, R.: Gas-phase tropospheric chemistry of volatile organiccompounds: 1. Alkanes and alkenes, J. Phys. Chem. Ref. Data,26, 215–290, 1997.
Barletta, B., Meinardi, S., Simpson, I. J., Zou, S. C., Rowland, F.S., and Blake, D. R.: Ambient mixing ratios of nonmethane hy-drocarbons (NMHCs) in two major urban centers of the Pearl
River Delta (PRD) region: Guangzhou and Dongguan, Atmos.Environ., 42, 4393–4408, 2008.
Bloss, C., Wagner, V., Jenkin, M. E., Volkamer, R., Bloss, W. J.,Lee, J. D., Heard, D. E., Wirtz, K., Martin-Reviejo, M., Rea,G., Wenger, J. C., and Pilling, M. J.: Development of a detailedchemical mechanism (MCMv3.1) for the atmospheric oxidationof aromatic hydrocarbons, Atmos. Chem. Phys., 5, 641–664,doi:10.5194/acp-5-641-2005, 2005.
Burley, J. D. and Bytnerowicz, A.: Surface ozone in the whitemountains of California, Atmos. Environ., 45, 4591–4602, 2011.
Cardelino, C. A. and Chameides, W. L.: An observation-basedmodel for analyzing ozone precursor relationships in the urbanatmosphere, J. Air Waste Manage., 45, 161–180, 1995.
Chameides, W. L. and Demerjian, K. L.: An Assessment of Tro-pospheric Ozone Pollution: a North America Perspective, PaloAlto, California, USA, 2000.
Chan, C. Y. and Chan, L. Y.: Effect of meteorology and air pollutanttransport on ozone episodes at a subtropical coastal Asian city,Hong Kong, J. Geophys. Res., 105, 20707–20724, 2000.
Chan, L. Y., Chan, C. Y., and Qin, Y.: Surface ozone pattern in HongKong, J. Appl. Meteorol., 37, 1153–1165, 1998a.
Chan, L. Y., Liu, H. Y., and Lam, K. S.: Analysis of the seasonalbehavior of tropospheric ozone at Hong Kong, Atmos. Environ.,32, 159–168, 1998b.
Chen, C. L., Tsuang, B. J., Tu, C. Y., Cheng, W. L., and Lin, W. D.:Wintertime vertical profiles of air pollutants over a suburban areain central Taiwan, Atmos. Environ., 36, 2049–2059, 2002.
Chen, F. and Dudhia, J.: Coupling an Advanced Land Surface-Hydrology Model with the Penn State-NCAR MM5 Model-ing System. Part I: Model implementation and sensitivity, Mon.Weathrt Rev., 129, 569–585, 2001.
Cheng, H. R., Guo, H., Wang, X. M., Saunders, S. M., Lam, S. H.M., Jiang, F., Wang, T., Ding, A., Lee, S., and Ho, K. F.: Onthe relationship between ozone and its precursors in the PearlRiver Delta: application of an observation-based model (OBM),Environ. Sci. Pollut. Res., 17, 547–560, 2010.
Chou, C. C. K., Liu, S. C., Lin, C. Y., Shiu, C. J., and Chang, K.H.: The trend of surface ozone in Taipei, Taiwan, and its causes:Implications for ozone control strategies, Atmos. Environ., 40,3898–3908, 2006.
Chou, M. D. and Suarez, M. J.: An efficient thermal infrared ra-diation parameterization for use in general circulation models,NASA Tech. Memo. 104606, 3, 85 pp., 1994.
Colman, J. J., Swanson, A., Meinardi, S., Sive, B. C., Blake, D. R.,and Rowland, F. S.: Description of the analysis of a wide range ofvolatile organic compounds in whole air samples collected dur-ing PEM-Tropics A and B, J. Anal. Chem., 73, 3723–3731, 2001.
Crowley, J. N., Schuster, G., Pouvesle, N., Parchatka, U., Fischer,H., Bonn, B., Bingemer, H., and Lelieveld, J.: Nocturnal nitro-gen oxides at a rural mountain-site in south-western Germany,Atmos. Chem. Phys., 10, 2795–2812,doi:10.5194/acp-10-2795-2010, 2010.
Ding, A. J., Wang, T., Zhao M., Wang, T. J., and Li, Z. K.: Simula-tion of sea-land breezes and a discussion of their implications onthe transport of air pollution during a multi-day ozone episode inthe Pearl River Delta of China, Atmos. Environ., 38, 6737–6750,2004.
Ding, A. J., Wang, T., Thouret, V., Cammas, J.-P., and Nedelec, P.:Tropospheric ozone climatology over Beijing: analysis of aircraft
www.atmos-chem-phys.net/13/3881/2013/ Atmos. Chem. Phys., 13, 3881–3898, 2013

3896 H. Guo et al.: Characterization of photochemical pollution
data from the MOZAIC program, Atmos. Chem. Phys., 8, 1–13,doi:10.5194/acp-8-1-2008, 2008.
Dodge, M. C.: Combined use of modeling techniques and smogchamber data to derive ozone-precursor relationships. Interna-tional Conference on Photochemical Oxidant Pollution and itsControl: Proceedings, Vol. II B, EPA/600/3-77-001b, US Envi-ronmental Protection Agency, Research Triange Park, NC, 881–889, 1977.
Done, J., Davis, C., and Weisman, M.: The next generation ofNWP: Explicit forecasts of convection using the Weather Re-search and Forecast (WRF) model, Atmos. Sci. Lett., 5, 110–117,doi:10.1002/asl.72, 2004.
Doran, J. C., Berkowitz, C. M., Coulter, R. L., Spicer, C. W., andShaw, W. J.: The 2001 Phoenix Sunrise experiment: vertical mix-ing and chemistry during the morning transition in Phoenix, At-mos. Environ., 37, 2365–2377, 2003.
Ehhalt, D. H., Rohrer, F., Wahner, A., Prather, M. J., and Blake, D.R.: On the use of hydrocarbons for the determination of tropo-spheric OH concentrations, J. Geophys. Res., 103, 18981–18997,1998.
Evtyugina, M. G., Nunes, T., Alves, C., and Marques, M. C.: Pho-tochemical pollution in a rural mountainous area in the northeastof Portugal, Atmos. Res., 92, 151–158, 2009.
Finlayson-Pitts, B. J. and Pitts, N.: VOCs, NOx and ozone produc-tion, J. Air Waste Manage., 43, 1093–1101, 1993.
Fu, P. Q., Kawamura, K., Kanaya, Y., and Wang, Z. F.: Contribu-tions of biogenic volatile organic compounds to the formationof secondary organic aerosols over Mt. Tai, Central East China,Atmos. Environ., 44, 4817–4826, 2010.
Gao, J., Wang, T., Ding, A. J., and Liu, C. B.: Observationalstudy of ozone and carbon monoxide at the summit of mountTai (1534 m a.s.l.) in central-eastern China, Atmos. Environ., 39,4779–4791, 2005.
Grell, G. A. and Devenyi, D.: A generalized approach toparameterizing convection combining ensemble and dataassimilation techniques, Geophys. Res. Lett., 29, 1693,doi:10.1029/2002GL015311, 2002.
Guo, H., Jiang, F., Cheng, H. R., Simpson, I. J., Wang, X. M., Ding,A. J., Wang, T. J., Saunders, S. M., Wang, T., Lam, S. H. M.,Blake, D. R., Zhang, Y. L., and Xie, M.: Concurrent observa-tions of air pollutants at two sites in the Pearl River Delta and theimplication of regional transport, Atmos. Chem. Phys., 9, 7343–7360,doi:10.5194/acp-9-7343-2009, 2009.
Guo, H., Ling, Z. H., Simpson, I. J., Blake, D. R., and Wang, D. W.:Observations of isoprene, methacrolein (MAC) and methyl vinylketone (MVK) at a mountain site in Hong Kong, J. Geophys.Res., 117, D19303,doi:10.1029/2012JD017750, 2012.
Ho, K. F., Lee, S. C., Ho, W. K., Blake, D. R., Cheng, Y., Li, Y.S., Ho, S. S. H., Fung, K., Louie, P. K. K., and Park, D.: Ve-hicular emission of volatile organic compounds (VOCs) from atunnel study in Hong Kong, Atmos. Chem. Phys., 9, 7491–7504,doi:10.5194/acp-9-7491-2009, 2009.
Ho, K. F., Lee, S. C., Guo, H., Tsai, W. Y.: Seasonal and diurnalvariations of volatile organic compounds (VOCs) in the atmo-sphere of Hong Kong, Sci. Total Environ., 322, 155–166, 2004.
Hong Kong Environmental Protection Department (HKEPD): Anoverview on air quality and air pollution control in HongKong, http://www.epd.gov.hk/epd/english/environmentinhk/air/air maincontent.html, 2010.
Hong Kong Environmental Protection Department (HKEPD): AirQuality in Hong Kong 2011 (Preliminary Report), Air ScienceGroup, Environmental Protection Department, the Governmentof the Hong Kong Special Administrative Region, 2012.
Hong, S. Y., Dudhia, J., and Chen, S.-H.: A revised approach to ice-microphysical processes for the bulk parameterization of cloudand precipitation, Mon. Weather Rev., 132, 103–120, 2004.
Hong, S. Y., Noh, Y., and Dudhia, J.: A new vertical diffusionpackage with explicit treatment of entrainment processes, Mon.Weather Rev., 134, 2318–2341, 2006.
Huang, J. P., Fung, J. C. H., and Lau, A. K. H.: Integrated pro-cesses analysis and systematic meteorological classification ofozone episodes in Hong Kong, J. Geophys. Res., 111, D20309,doi:10/1029/2005JD007012, 2006.
IPCC (Intergovernmental Panel on Climate Change): The PhysicalScience Basis. Contribution of Working Group I to the FourthAssessment Report of the Intergovernmental Panel on ClimateChange, Cambridge Univ. Press, Cambridge, UK, 2007.
Jenkin, M. E. and Clemitshaw, K. C.: Ozone and other secondaryphotochemical pollutants: chemical processes governing theirformation in the planetary boundary layer, Atmos. Environ., 34,2499–2527, 2000.
Jenkin, M. E., Saunders, S. M., Wagner, V., and Pilling, M. J.: Thetropospheric degradation of volatile organic compounds: A pro-tocol for mechanism development, Atmos. Environ., 31, 81–107,1997.
Jenkin, M. E., Saunders, S. M., Wagner, V., and Pilling, M. J.:Protocol for the development of the Master Chemical Mecha-nism, MCM v3 (Part B): tropospheric degradation of aromaticvolatile organic compounds, Atmos. Chem. Phys., 3, 181–193,doi:10.5194/acp-3-181-2003, 2003.
Jiang, F., Wang, T. J., Wang, T. T., Xie, M., and Zhao, H.: Numeri-cal modeling of a continuous photochemical pollution episode inHong Kong using WRF-chem., Atmos. Environ., 42, 8717–8727,2008.
Jiang, F., Guo, H., Wang, T. J., Cheng, H. R., Wang, X. M., Simp-son, I. J., Ding, A. J., Saunders, S. M., Lam, S. H. M., and Blake,D. R.: An ozone episode in the Pearl River Delta: Field obser-vation and model simulation, J. Geophys. Res., 115, D22305,doi:10.1029/2009JD013583, 2010.
Jobson, B. T., Mckeen, S. A., and Parrish, D. D.: Spatial and tem-poral variability of nonmethane hydrocarbon mixing ratios andtheir relation to photochemical lifetime, J. Geophys. Res., 103,13557–13567, 1998.
Lam, S. H. M., Ling, Z. H., Guo, H., Saunders, S. M., Jiang, F.,Wang, X. M., and Wang, T. J.: Modelling VOC source impactson high ozone episode days observed at a mountain summit inHong Kong under the influence of mountain-valley breezes, J.Environ. Manage., submitted, 2013.
Li, J., Pochanart, P., Wang, Z. F., Liu, Y., Yamaji, K., Takigawa, M.,Kanaya, Y., and Akimoto, H.: Impact of chemical production andtransport on summertime diurnal ozone behavior at a mountain-ous site in North China Plain, Sola, 4, 121–124, 2008.
Lin, C. H., Lai, C. H., Wu, Y. L., Lai, H. C., and Lin, P. H.: Verti-cal ozone distributions observed using tethered ozonesondes in acoastal industrial city, Kaohsiung, in southern Taiwan, Environ.Monit. Assess., 127, 253–270, 2007.
Ling, Z. H., Guo, H., Cheng, H. R., and Yu, Y. F.: Sources ofambient volatile organic compounds and their contributions to
Atmos. Chem. Phys., 13, 3881–3898, 2013 www.atmos-chem-phys.net/13/3881/2013/

H. Guo et al.: Characterization of photochemical pollution 3897
photochemical ozone formation at a site in the Pearl River Delta,southern China, Environ. Pollut., 159, 2310–2319, 2011.
Liu, H. P., Chan, J. C. L., and Cheng, A. Y. S.: Internal boundarylayer structure under sea-breeze conditions in Hong Kong, At-mos. Environ., 35, 683–692, 2000.
Liu, Y., Shao, M., Kuster, W. C., Goldan, P. D., Li, X. H., Lu, S.H., and de Gouw, J. A.: Source identification of reactive hydro-carbons and oxygenated VOCs in the summertime in Beijing,Environ. Sci. Technol., 43, 75–81, 2009.
Ma, Z. Q., Zhang, X. L., Xu, J., Zhao, X. J., and Wei, M.: Charac-teristics of ozone vertical profile observed in the boundary layeraround Beijing in autumn, J. Environ. Sci., 23, 1316–1324, 2011.
Mlawer, E. J., Taubman, S. J., Brown, P. D., Iacono, M. J., andClough, S. A.: Radiative transfer for inhomogeneous atmo-spheres: RRTM, a validated correlated-k model for the longwave,J. Geophys. Res., 102D, 16663–16682, 1997.
Monteiro, A., Strunk, A., Carvalho, A., Tchepep, O., Miranda, A.I., Borrego, C., Saavedra, S., Rpdrıguez, A., Souto, J., Casares,J., Friese, E., and Elbern, H.: Investigating a high ozone episodein a rural mountain site, Environ. Pollut., 162, 176–189, 2012.
NESCAUM (Northeast States for Coordinated Air Use Manage-ment), 1995: Preview of 1994.
NRC (National Research Council): The effects of meteorological ontropospheric ozone, in: Rethinking the ozone problem in urbanand regional air pollution, National Academy Press, Washington,DC, USA, 1991.
Ou Yang, C. F., Liu, N. H., Sheu, G. R., Lee, C. T., and Wang, J. L.:Seasonal and diurnal variations of ozone at a high-altitude moun-tain baseline station in East Asia, Atmos. Environ., 46, 279–288,2012.
Parrish, D. D., Buhr, M. P., Trainer, M., Northon, R. B., Shimshock,J. P., Fehsenfeld, F. C., Anlauf, K. G., Bottenheim, J. W., Tang,Y. Z., Wiebe, H. A., Roberts, J. M., Tanner, R. L., Newman, L.,Bowersox, V. C., Olszyna, K. J., Bailey, E. M., Rodgers, M. O.,Wang, T., Berresheim, H., Roychowdhury, U. K., and Demer-jiani, K. L.: The total reactive oxidized nitrogen levels and theirpartitioning between the individual species at six rural sites ineastern North America, J. Geophys. Res., 98, 2927–2939, 1993.
Pochanart, P., Akimoto, H., Kajii, Y., Potemkin, V. M., andKhodzher, V. T.: Regional background ozone and carbon monox-ide variations in remote Siberia/east Asia, J. Geophys. Res., 108,4028,doi:10.1029/2001JD001412, 2003.
PORG (Photochemical Oxidants Review Group): Ozone in theUnited Kingdom, Fourth Report of the UK photochemical Ox-idants review group, Department of the Environment, Transportand the Regions, London, 1997.
Reeves, C. E., Slemr, J., Oram, D. E., Worton, D., Penkett, S. A.,Stewart, D. J., Purvis, R., Watson, N., Hopkins, J., Lewis, A.,Methven, J., Blake, D. R., and Atlas, E.: Alkyl nitrates in out-flow from North America over the North Atlantic during Inter-continental Transport of Ozone and Precursors 2004, J. Geophys.Res., 112, D10S37,doi:10.1029/2006JD007567, 2007.
Roberts, J. M., Bertman, S. B., Parrish, D. D., Fehsenfeld, F. C.,Jobson, B. T., and Niki, H.: Measurement of alkyl nitrates atChebogue Point, Nova Scotia during the 1993 North AtlanticRegional Experiment (NARE) intensive, J. Geophys. Res., 103,13569–13580, 1998.
Saunders, S. M., Jenkin, M. E., Derwent, R. G., and Pilling, M.J.: Protocol for the development of the Master Chemical Mech-
anism, MCM v3 (Part A): tropospheric degradation of non-aromatic volatile organic compounds, Atmos. Chem. Phys., 3,161–180,doi:10.5194/acp-3-161-2003, 2003.
Scott, B. and Ahmet, P.: Influence of synoptic and mesoscale me-teorology on ozone pollution potential for San Joaquin Valley ofCalifornia, Atmos. Environ., 43, 1779–1788, 2009.
Sillman, S.: The relation between ozone, NOx and hydrocarbonsin urban and polluted rural environments, Atmos. Environ., 33,1821–1845, 1999.
Sillman, S., He, D. Y., and Pippin, M. R.: Model correlations forozone, reactive nitrogen, and peroxides for Nashville in compar-ison with measurements: Implications for O3-NOx-hydrocarbonchemistry, J. Geophys. Res., 103, 22629–22644, 1998.
Sillman, S., Vautard, R., Menut, L., and Kley, D.: O3-NOx-VOC sensitivity and NOx-VOC indicators in Paris: Re-sults from models and atmospheric pollution over the ParisArea (ESQUIF) measurements, J. Geophys. Res., 108, 8563,doi:10.1029/2002JD001561, 2003.
Simpson, I. J., Blake, N. J., Barletta, B., Diskin, G. S., Fuelberg, H.E., Gorham, K., Huey, L. G., Meinardi, S., Rowland, F. S., Vay, S.A., Weinheimer, A. J., Yang, M., and Blake, D. R.: Characteriza-tion of trace gases measured over Alberta oil sands mining opera-tions: 76 speciated C2–C10 volatile organic compounds (VOCs),CO2, CH4, CO, NO, NO2, NOy, O3 and SO2, Atmos. Chem.Phys., 10, 11931–11954,doi:10.5194/acp-10-11931-2010, 2010.
Skamarock, W. C. and Klemp, J. B.: A time split non hydrostaticatmospheric model for weather research and forecasting applica-tions, J. Comput. Phys., 227, 7, 3465–3485, 2008.
So, K. L. and Wang, T.: On the local and regional influence onground-level ozone concentrations in Hong Kong, Environ. Pol-lut., 123, 307–317, 2003.
Steinbacher, M., Zellweger, C., Schwarzenbach, B., Bugmann, S.,Buchmann, B., Ordonez, C., Prevot, A., and Hueglin, C.: Ni-trogen oxide measurements at rural sites in Switzerland: Biasof conventional measurement techniques, J. Geophys. Res., 112,D11307,doi:10.1029/2001JD001412, 2007.
Steven, E. K., Benjamin, S. G., McGinley, J. A., Brown, J. M.,Schultz, P., Szoke, E. J., Smirnova, T. G., Shaw, B. L., Birken-heuer, D., Albers, S., Peckham, S., and Grell, G.: Real-time Ap-plications of the WRF Model at the Forecast Systems Laboratory,84th AMS Annual Meeting, Seattle, USA, 10–15 January 2004.
Tang, G., Wang, Y., Li, X., Ji, D., Hsu, S., and Gao, X.: Spatial-temporal variations in surface ozone in Northern China as ob-served during 2009–2010 and possible implications for future airquality control strategies, Atmos. Chem. Phys., 12, 2757–2776,doi:10.5194/acp-12-2757-2012, 2012.
Tang, J. H., Chan, L. Y., Chan, C. Y., Li, Y. S., Chang, C. C., Wang,X. M., Zou, S. C., Barletta, B., Blake, D. R., and Wu, D.: Impli-cations of changing urban and rural emissions on non-methanehydrocarbons in the Pearl River Delta region of China, Atmos.Environ., 42, 3780–3794, 2008.
Tseng, K. H., Chen, C. L., Lin, M. D., Chang, K. H., and Tsuang,B. J.: Vertical profile of ozone and accompanying air pollutantconcentrations observed at a downwind foothill site of industrialand urban areas, Aerosol Air Qual. Res., 9, 421–434, 2009.
Tsai, W. Y., Chan, L. Y., Blake, D. R., and Chu, K. W.: Vehicu-lar fuel composition and atmospheric emissions in South China:Hong Kong, Macau, Guangzhou, and Zhuhai, Atmos. Chem.Phys., 6, 3281–3288,doi:10.5194/acp-6-3281-2006, 2006.
www.atmos-chem-phys.net/13/3881/2013/ Atmos. Chem. Phys., 13, 3881–3898, 2013

3898 H. Guo et al.: Characterization of photochemical pollution
Turnipseed, A. A., Anderson, D. E., Burns, S., Blanken, P. D., andMonson, R. K.: Airflows and turbulent flux measurements inmountainous terrain Part 2: mesoscale effects, Agr. Forest Me-terol., 125, 187–205, 2004.
Wang, T. and Kwok, J. Y. H.: Measurement and analysis of a multi-day photochemical smog episode in the Pearl River Delta ofChina, J. Appl. Meteorol., 42, 404-416, 2003.
Wang, T., Cheung, V. T. F., Lam, K. S., Kok, G. L., and Harris, J.M.: The characteristics of ozone and related compounds in theboundary layer of the South China coast: temporal and verti-cal variations during autumn season, Atmos. Environ., 35, 2735–2746, 2001.
Wang, T., Poon, C. N., Kwok, Y. H., and Li, Y. S.: Characteriz-ing the temporal variability and emission patterns of pollutionplumes in the Pearl River Delta of China, Atmos. Environ., 37,3539–3550, 2003.
Wang, T., Guo, H., Blake, D. R., Kwok, Y. H., Simpson, I. J., and Li,Y. S.: Measurements of trace gases in the inflow of South ChinaSea background air and outflow of regional pollution at Tai O,Southern China, J. Atmos. Chem., 52, 295–317, 2005.
Wang, T., Wong, H. L. A., Tang, J., Ding, A., Wu, W. S., andZhang, X. C.: On the origin of surface ozone and reactive ni-trogen observed at remote site in the northeastern Qinghai-Tibetan Plateau, western China, J. Geophys. Res., 111, D08303,doi:10.1029/2005JD006527, 2006.
Wang, T., Wei, X. L., Ding, A. J., Poon, C. N., Lam, K. S., Li, Y. S.,Chan, L. Y., and Anson, M.: Increasing surface ozone concen-trations in the background atmosphere of Southern China, 1994–2007, Atmos. Chem. Phys., 9, 6217–6227,doi:10.5194/acp-9-6217-2009, 2009.
Warneke, C. and de Gouw, J. A.: Organic trace gas compositionof the marine boundary layer over the northwest India Ocean inApril 2000, Atmos. Environ., 35, 5923–5933, 2001.
Xu, Z., Wang, T., Xue, L. K., Louie, P., Luk, C., Gao, J., Wang,S. L., Chai, F. H., an Wang, W. X.: Evaluating the uncertain-ties of thermal catalytic conversion for measuring atmosphericnitrogen dioxide at four polluted sites in China, Atmos. Environ.,doi:10.1016/j.atmosenv.2012.09.043, in press, 2013.
Xue, L. K., Wang, T., Zhang, J. M., Zhang, X. C., Delig-Geer, Poon,C. N., Ding, A. J., Zhou, X. H., Wu, W. S., Tang, J., Zhang, Q. Z.,and Wang, W. X.: Source of surface ozone and reactive nitrogenspeciation at Mount Waliguan in Western China: New insightsfrom the 2006 summer study, J. Geophys. Res., 116, D07306,doi:10.1029/2010JD014735, 2011.
Yuan, B., Shao, M., de Gouw, J., Parrish, D. D., Lu, S. H.,Wang, M., Zeng, L. M., Zhang, Q., Song, Y., Zhang, J. B.,and Hu, M.: Volatile Organic Compounds (VOCs) in UrbanAir: How Chemistry Affects the Interpretation of Positive Ma-trix Factorization (PMF) Analysis, J. Geophys. Res., 117, D24,doi:10.1029/2012JD018236, 2012.
Zanis, P., Ganser, A., Zellweger, C., Henne, S., Steinbacher, M.,and Staehelin, J.: Seasonal variability of measured ozone produc-tion efficiencies in the lower free troposphere of Central Europe,Atmos. Chem. Phys., 7, 223–236,doi:10.5194/acp-7-223-2007,2007.
Zellweger, C., Forrer, J., Hofer, P., Nyeki, S., Schwarzenbach, B.,Weingartner, E., Ammann, M., and Baltensperger, U.: Partition-ing of reactive nitrogen (NOy) and dependence on meteoro-logical conditions in the lower free troposphere, Atmos. Chem.Phys., 3, 779–796,doi:10.5194/acp-3-779-2003, 2003.
Zhang, D. and Anthes, R. A.: A high-resolution model of the plan-etary boundary layer – sensitivity tests and comparison withSESAME-79 data, J. Appl. Meteorol., 21, 1594–1609, 1982.
Zhang, J., Wang, T., Chameides, W. L., Cardelino, C., Kwok, J.,Blake, D. R., Ding, A., and So, K. L.: Ozone production andhydrocarbon reactivity in Hong Kong, Southern China, Atmos.Chem. Phys., 7, 557–573,doi:10.5194/acp-7-557-2007, 2007.
Zhang, L. F. and Zhang, M.: Study of the sea-land breeze system inHong Kong, HKMetS Bulletin, 7, 22–42, 1997.
Zhang, Y. H., Su, H., Zhong, L. J., Cheng, Y. F., Zeng, L. M., Wang,X. S., Xiang, Y. R., Wang, J. L., Gao, D. F., Shao, M., Fan, S. J.,and Liu, S. C.: Regional ozone pollution and observation-basedapproach for analyzing ozone-precursor relationship during thePRIDE-PRD2004 campaign, Atmos. Environ., 42, 6203–6218,2008.
Zhang, Y. L., Wang, X. M., Blake, D. R., Li, L. F., Zhang, Z., Wang,Shao, Y., Guo, H., Lee, S. C., Guo, B., Chan, L. Y., Wu, D.,and Rowland, F. S.: Aromatic hydrocarbons as ozone precursorsbefore and after outbreak of the 2008 financial crisis in the PearlRiver Delta region, south China, J. Geophys. Res.-Atmos., 117,D15306,doi:10.1029/2011JD017356, 2012.
Zhao, Y., Shao, M., Wang, C., Wang, B. G., Lu, S. H., and Zhong, L.J.: Characterizing spatial patterns of NOx, SO2 and O3 in PearlRiver Delta by Passive Sampling, J. Environ. Sci., 32, 324–329,2011.
Atmos. Chem. Phys., 13, 3881–3898, 2013 www.atmos-chem-phys.net/13/3881/2013/