Characterization of Microbial Fuel Cells at Microbially...
7
Published: February 17, 2011 r2011 American Chemical Society 2435 dx.doi.org/10.1021/es103115a | Environ. Sci. Technol. 2011, 45, 2435–2441 ARTICLE pubs.acs.org/est Characterization of Microbial Fuel Cells at Microbially and Electrochemically Meaningful Time scales Zhiyong Ren,* ,†,‡ Hengjing Yan, † Wei Wang, ‡ Matthew M. Mench, § and John M. Regan † † Department of Civil and Environmental Engineering, The Pennsylvania State University, University Park, Pennsylvania 16802, United States ‡ Department of Civil Engineering, University of Colorado Denver, Denver, Colorado 80204, United States § Department of Mechanical, Aerospace, and Biomedical Engineering, University of Tennessee, Knoxville, Tennessee 37996, United States b S Supporting Information ABSTRACT: The variable biocatalyst density in a microbial fuel cell (MFC) anode biofilm is a unique feature of MFCs relative to other electrochemical systems, yet performance characterizations of MFCs typically involve analyses at electrochemically relevant time scales that are insufficient to account for these variable biocatalyst effects. This study investigated the electrochemical performance and the development of anode biofilm architecture under different external loadings, with duplicate acetate-fed single- chamber MFCs stabilized at each resistance for microbially relevant time scales. Power density curves from these steady-state reactors generally showed comparable profiles despite the fact that anode biofilm architectures and communities varied considerably, showing that steady-state biofilm differences had little influence on electrochemical performance until the steady-state external loading was much larger than the reactor internal resistance. Filamentous bacteria were dominant on the anodes under high external resistances (1000 and 5000 Ω), while more diverse rod-shaped cells formed dense biofilms under lower resistances (10, 50, and 265 Ω). Anode charge transfer resistance decreased with decreasing fixed external resistances, but was consistently 2 orders of magnitude higher than the resistance at the cathode. Cell counting showed an inverse exponential correlation between cell numbers and external resistances. This direct link of MFC anode biofilm evolution with external resistance and electricity production offers several operational strategies for system optimization. ’ INTRODUCTION Microbial fuel cells (MFCs) or bioelectrochemical systems present a promising technology for concurrent waste treatment and electricity generation. Using microorganisms as biocatalysts, the performance of MFC systems ultimately depends on the effective biocatalyst availability and activity. Different approaches have been used to improve MFC performance, including reduc- ing internal resistance, 1,2 optimizing operations by sequential anode-cathode flow-through or electrolyte recirculation, 3-5 and improving biocatalyst attachment on the electrodes. 6,7 However, few studies have provided information on the relation- ship between biocatalyst density and diversity and the system electrochemical performance, and how to regulate the growth of the anode biofilm and therefore optimize the system for different objectives. 8,9 As MFC technology becomes more economically and practically feasible for full-scale applications, such as in wastewater treatment processes or remote power production from benthic deployments, the understanding and utilization of the biological and electrochemical relationship should become very important. The resistance of the external circuit in an MFC directly influences the anode potential and the resultant bioavailability of the anode for exoelectrogenic bacteria, offering an opera- tional parameter to influence anode biofilm development and performance. 10 Low resistances lead to more positive poten- tials, which provide more free energy to the microorganisms and enable a higher flux of electrons through exoelectrogenic metabolisms, imparting a selective advantage to exoelectro- gens over competing functional groups. 11,12 For example, several studies have demonstrated that low external loadings could limit methanogenesis in the MFC anode chamber. 13,14 In addition to influencing this competition with other groups, the external resistance (anode potential) also exerts a selective pressure on the exoelectrogenic community composition due to their di fferent attributes related to anode affinity and maximum substrate utilization rate. 10,15 This presents an oppor- tunity to tailor the anode biofilm structure and composition, and potentially MFC performance with respect to power output and substrate utilization, through the adjustment of external resistance. The typical method of characterizing MFC power produc- tion involves operating the MFC at a fixed external resistance or applied potential, and then transiently obtaining polariza- tion data by applying a series of external resistances each for a 5-30 min interval. 16 These measurements are based on the observation that the voltage stabilizes within such short periods. However, there is a significant difference in the time Received: September 13, 2010 Accepted: January 14, 2011 Revised: January 10, 2011
Transcript of Characterization of Microbial Fuel Cells at Microbially...

Published: February 17, 2011
r 2011 American Chemical Society 2435 dx.doi.org/10.1021/es103115a | Environ. Sci. Technol. 2011, 45, 2435–2441
ARTICLE
pubs.acs.org/est
Characterization of Microbial Fuel Cells at Microbially andElectrochemically Meaningful Time scalesZhiyong Ren,*,†,‡ Hengjing Yan,† Wei Wang,‡ Matthew M. Mench,§ and John M. Regan†
†Department of Civil and Environmental Engineering, The Pennsylvania State University, University Park, Pennsylvania 16802,United States‡Department of Civil Engineering, University of Colorado Denver, Denver, Colorado 80204, United States§Department of Mechanical, Aerospace, and Biomedical Engineering, University of Tennessee, Knoxville, Tennessee 37996,United States
bS Supporting Information
ABSTRACT: The variable biocatalyst density in a microbial fuel cell (MFC) anode biofilm is a unique feature of MFCs relative toother electrochemical systems, yet performance characterizations of MFCs typically involve analyses at electrochemically relevanttime scales that are insufficient to account for these variable biocatalyst effects. This study investigated the electrochemicalperformance and the development of anode biofilm architecture under different external loadings, with duplicate acetate-fed single-chamber MFCs stabilized at each resistance for microbially relevant time scales. Power density curves from these steady-state reactorsgenerally showed comparable profiles despite the fact that anode biofilm architectures and communities varied considerably,showing that steady-state biofilm differences had little influence on electrochemical performance until the steady-state externalloading was much larger than the reactor internal resistance. Filamentous bacteria were dominant on the anodes under high externalresistances (1000 and 5000Ω), while more diverse rod-shaped cells formed dense biofilms under lower resistances (10, 50, and 265Ω).Anode charge transfer resistance decreased with decreasing fixed external resistances, but was consistently 2 orders of magnitudehigher than the resistance at the cathode. Cell counting showed an inverse exponential correlation between cell numbers andexternal resistances. This direct link ofMFC anode biofilm evolution with external resistance and electricity production offers severaloperational strategies for system optimization.
’ INTRODUCTION
Microbial fuel cells (MFCs) or bioelectrochemical systemspresent a promising technology for concurrent waste treatmentand electricity generation. Using microorganisms as biocatalysts,the performance of MFC systems ultimately depends on theeffective biocatalyst availability and activity. Different approacheshave been used to improve MFC performance, including reduc-ing internal resistance,1,2 optimizing operations by sequentialanode-cathode flow-through or electrolyte recirculation,3-5
and improving biocatalyst attachment on the electrodes.6,7
However, few studies have provided information on the relation-ship between biocatalyst density and diversity and the systemelectrochemical performance, and how to regulate the growth ofthe anode biofilm and therefore optimize the system for differentobjectives.8,9 As MFC technology becomes more economicallyand practically feasible for full-scale applications, such as inwastewater treatment processes or remote power productionfrom benthic deployments, the understanding and utilization ofthe biological and electrochemical relationship should becomevery important.
The resistance of the external circuit in an MFC directlyinfluences the anode potential and the resultant bioavailabilityof the anode for exoelectrogenic bacteria, offering an opera-tional parameter to influence anode biofilm development andperformance.10 Low resistances lead to more positive poten-tials, which provide more free energy to the microorganisms
and enable a higher flux of electrons through exoelectrogenicmetabolisms, imparting a selective advantage to exoelectro-gens over competing functional groups.11,12 For example,several studies have demonstrated that low external loadingscould limit methanogenesis in theMFC anode chamber.13,14 Inaddition to influencing this competition with other groups, theexternal resistance (anode potential) also exerts a selectivepressure on the exoelectrogenic community compositiondue to their different attributes related to anode affinity andmaximum substrate utilization rate.10,15 This presents an oppor-tunity to tailor the anode biofilm structure and composition,and potentially MFC performance with respect to power outputand substrate utilization, through the adjustment of externalresistance.
The typical method of characterizing MFC power produc-tion involves operating the MFC at a fixed external resistanceor applied potential, and then transiently obtaining polariza-tion data by applying a series of external resistances each for a5-30 min interval.16 These measurements are based on theobservation that the voltage stabilizes within such shortperiods. However, there is a significant difference in the time
Received: September 13, 2010Accepted: January 14, 2011Revised: January 10, 2011

2436 dx.doi.org/10.1021/es103115a |Environ. Sci. Technol. 2011, 45, 2435–2441
Environmental Science & Technology ARTICLE
scales required to achieve electrochemical versus microbialsteady states. When the external resistance is changed, theelectrochemical response of the biofilm established at theantecedent resistance quickly stabilizes. However, the biofilmtakes much longer to stabilize, with changes in biofilm struc-ture and community composition potentially leading to a long-term stable performance that differs from the short-termelectrochemical response. A full cycle at each external resis-tance, which is the approach used in some MFC studies, couldpartially reduce this time-scale discrepancy, but may still beinsufficient for steady-state biofilm development at each re-sistance. Measuring a polarization curve generated with elec-trochemically steady-state data may misrepresent the truebiological steady state of the system.
In this study, we looked at the long-term operation ofMFCs atdifferent fixed resistances and the performances, architectures,and compositions of these different steady-state biofilms. Ourobjective was to characterize the effects of external resistances onboth electrochemical and microbiological attributes, and topropose operational strategies to adjust to different goals inwaste-to-energy processes.
’MATERIALS AND METHODS
MFC Construction and Operation. Duplicate single-cham-ber air-cathode bottle MFCs were operated in fed-batch modeunder five different external loadings at an incremental in-crease of a factor of 5 (10, 50, 265, 1000, and 5000Ω) for morethan 3 months. Reactor configurations and experimental con-ditions were identically maintained for all MFCs except thedifference of external loadings. The anodes were made of plaincarbon paper (BASF, NJ) and the air-cathodes with diffusionlayers were made according to Cheng et al.17 MFCs wereinoculated with secondary effluent from the Pennsylvania StateUniversity Wastewater Treatment Plant. The reactors were fedwith 250 mL of medium containing 1.0 g/L sodium acetate,0.31 g/L NH4Cl, 0.13 g/L KCl, 5.85 g/L NaH2PO4 3H2O, 4.09g/L Na2HPO4, 12.5 mL/L mineral solution, and 12.5 mL/Lvitamin solution.18 Except for batches in which Coulombicefficiency was calculated, where medium was replaced afterwhole-batch operation for individual reactors, medium wasreplaced at the same time for all reactors when the voltage ofthe 10 Ω reactors dropped to below ∼7 mV, which generallytook 7-8 days. Reference electrodes (Bioanalytical Sys-tems, Inc., OH) were introduced into the anode chamberfor conducting electrochemical measurements on individualelectrodes.Analyses. Cell voltage across the external resistor was con-
tinuously monitored using a data acquisition system (KeithleyInstruments, OH). Polarization data were collected duringthe stable power production stage of each batch, and the sameresistance series was applied on each reactor using a variableresistor box. To achieve steady electrochemical conditions,the cells were held at one resistance for approximately 25 minbefore switching to thenext resistance. Both low-to-high andhigh-to-low measurement directions were conducted for comparisonpurpose. The calculations of power density and Coulombicefficiency (i.e., the fraction of electrons removed from theelectron donor that are recovered as current through the externalcircuit) were performed as previously described.16,18 Data wereaveraged over triplicate tests from two reactors running with thesame resistance (mean ( SD).
Electrochemical impedance spectroscopy (EIS) and reactorohmic resistances were tested using a Zahner IM6ex potentio-stat-AC frequency analyzer and the results were analyzed usingZView software. Impedance measurements were taken on twoconfigurations designated anode (A) and cathode (C). Becausethe reference electrode (RE) was installed adjacent to theanode, the solution effects on the anode impedance wereminimized, while the cathode impedance taken with respectto the RE also included the electrolyte resistances. To obtainelectrochemical charge transfer resistances for the electrodes,two equivalent circuit models were adapted from our previousEIS studies.19,20 Specifically, the cathode equivalent circuitconsisted of an ohmic resistance, followed by an electrochem-ical charge transfer resistance (Rct) and a Warburg’s diffusionelement (W) in parallel with a constant phase element (CPE)(Figure S1A, Supporting Information). The anode data werefitted to an equivalent circuit with two sets of parallel resistor-capacitor elements connected in series (Figure S1B). Thefrequency of the AC signal was varied from 10 kHz to 100mHz with an amplitude of (10 mV. Impedance experimentswere performed under galvanostatic closed-circuit conditionsat 50 μA. To ensure steady state during galvanostatic opera-tion, the MFCs were allowed to equilibrate for 10 min beforeapplying the AC signal.After over 3 months of operation, anode biofilm samples were
prepared and analyzed as described previously.21,22 Briefly, asection of anode for each reactor was randomly selected andmounted onto a glass slide. The anode biofilm was then stainedfor 15 min using the LIVE/DEAD BacLight Bacterial ViabilityKit (Invitrogen, CA). The stained biofilm was observed andanalyzed by a confocal laser scanning microscope (CLSM;Olympus America Inc., NY) equipped with 3 lasers (peaks at488, 543, and 633 nm). The 3-dimensional biofilm architecture(z-stack) was scanned and displayed as an ortho view. Imageswere analyzed by Photoshop and FV10-ASW software. Biofilmcell counts were performed by removing the biofilm from a 1 cm2
anode sample and washing and suspending the cells in 2mL of 50mM phosphate buffer. Suspended cells were serially diluted andstained using the viability staining kit, filtered through a 0.45-μmmembrane filter, and counted using a Zeiss Axiophot epifluor-escent microscope. The cell density per anode geometric areawas calculated using the dilution factor, the filtered volume, andthe ratio of total filtered area to image area.Phylogenetic Analysis. The composition of anode biofilm
communities was determined by 16S rRNA gene-targeted PCR,denaturing gradient gel electrophoresis (DGGE) screening ofPCR products, cloning and sequencing of prominent DGGEbands, and phylogenetic analysis as described in detail else-where.22 Briefly, genomic DNA was extracted from anodesubsamples using the PowerSoil DNA Isolation Kit (MO BIOLaboratories, Inc., Carlsbad, CA), a fragment of the 16S rRNAgene was PCR amplified using primers 968F (50-AACGCGAA-GAACCTTAC-30) with a GC clamp and 1401R (50-CGGTG-TGTACAAGACCC-30),23 and DGGE was performed with adenaturing gradient ranging from 30 to 60%. Prominent DGGEbands were excised, eluted, and used as the template for a PCRwith the primers listed above except that the forward primerlacked the GC clamp. PCR products were purified and cloned,and the inserts from five randomly selected clones for each bandwere sequenced to determine whether multiple 16S rRNA genefragments had comigrating on the DGGE band. The 16S rRNAgene sequences were analyzed in the GenBank database and have

2437 dx.doi.org/10.1021/es103115a |Environ. Sci. Technol. 2011, 45, 2435–2441
Environmental Science & Technology ARTICLE
been deposited in the GenBank database under accessionnumbers HQ157169-HQ157181.
’RESULTS
Electricity Generation and Coulombic Efficiency As aFunction of External Resistance. Duplicate reactors at eachof the five resistor settings showed identical voltage profiles atsteady state. Reactors under higher resistance showed reducedperiods before reaching steady-state voltage, consistent withanother study.24 The lag time for 5000, 1000, 265, 50, and 10Ωreactors to reach 80% of their maximum voltage was 91, 104,106, 108, and 120 h, respectively (Figure 1). Power densitycurves generated from polarization data collected after the3-month biofilm-development period generally showed similarprofiles that were also consistent with the steady-state powersof systems at each fixed resistance (Figure 2). The highest powerdensity among the reactors ranged from 139 to 157 mW/m2, all
achieved at the 265 Ω resistance. The maximum currentdensity of the 5000 Ω reactor was much lower than that ofthe other reactors, suggesting that the restricted growth ofbiofilm could not catalyze a high current in the short durationof the polarization tests. The data from the other pairedreactors showed a pattern of slightly higher maximum currentdensity with decreasing steady-state resistance. Moreover,bigger variations of power densities among the reactor pairswere generated at lower resistances, as small voltage differ-ences created much higher power density variations throughthe square transform (P = V2/R). Higher power density valueswere observed when external resistances were changed fromhigh to low (from 5000 to 10 Ω) compared to low to high(from 10 to 5000Ω) at 25 min intervals (data not shown), butthe variations were within standard deviation limits.All reactors achieved more than 90% COD removal in each
batch, but the Coulombic efficiency showed an inverse correla-tion with the applied external loading. The average Coulombicefficiency for the 10Ω resistor MFCs was 45%, while the averagevalue for 5000Ω resistor MFCs was only 6% (Table 1). The lowelectron recovery at high resistances was mainly due to the longbatch duration, which resulted in more electron loss to none-lectricity related reactions such as aerobic respiration and per-haps methanogenesis, though the latter was not measured.Electrochemical Impedance Variation As a Function of
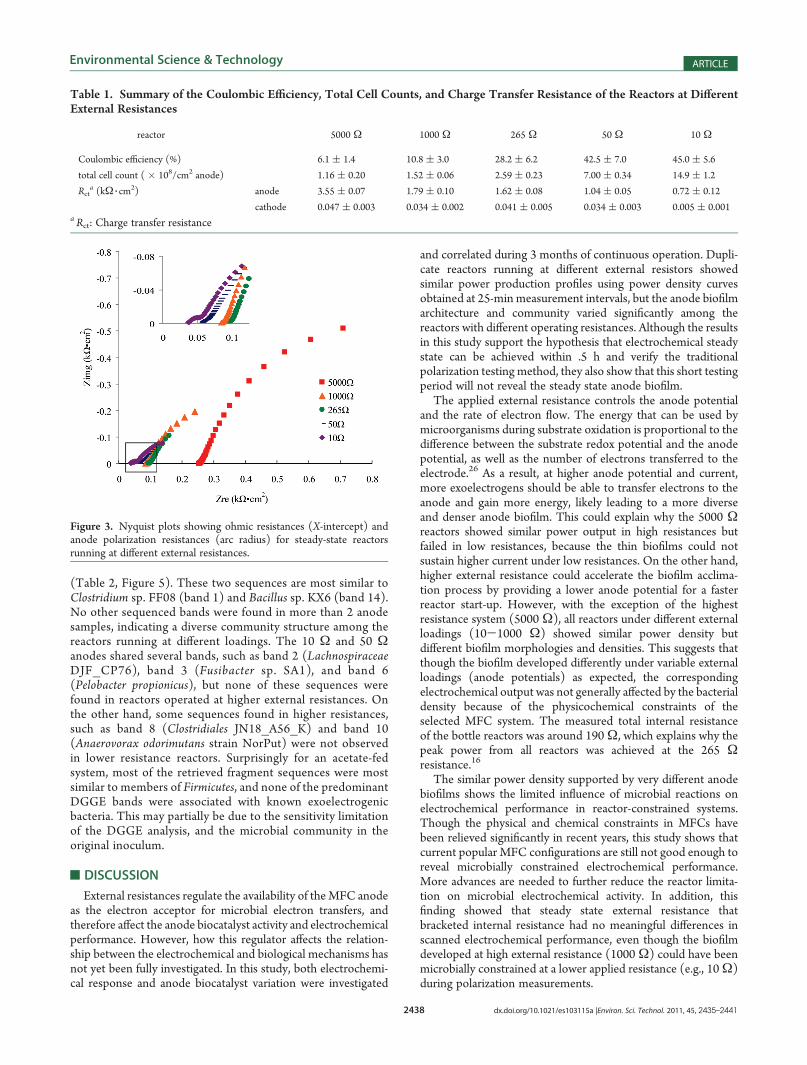
External Resistance. The EIS data were fitted with a Randle’stype equivalent electrical circuit to obtain values for the anodeand cathode charge transfer resistances.22 As shown in theFigure 3 inset graph, an additional Nyquist arc in higher fre-quency became visible as the external resistance decreased.With decreasing external loading, the anode charge transferresistance decreased consistently from 3.55 kΩ 3 cm
2 under5000 Ω resistance to 0.72 kΩ 3 cm
2 under 10 Ω resistance(Table 1). This is consistent with the accompanied develop-ment of thicker biofilm, which enables higher current density.In contrast, the effects of external resistances on the MFC air-cathode seemed to be minimal, as the cathode charge transferresistances at different external loadings were mostly abouttwo magnitudes lower than the anode resistances and stablethroughout the experiment. The cathode biofilm on one 10Ωreactor fell off before the EIS measurement and caused a reducedcathode charge transfer resistance and increased measuredpower density.22,25
Anode Biofilm Variation As a Function of External Resis-tance. Despite the similar electrochemical performance, thebiofilm structures and compositions at different resistances after3-month continuous operation were quite different from eachother (Figure 4). Bacteria with a filamentous structure domi-nated and formed relatively thin and patchy biofilm (0-30 μm)on the anodes under high external resistances (1000 and 5000Ω),while rod-shaped cells accumulated and formed dense biofilms(more than 50 μm) that covered the anodes under lowerresistances (10, 50, and 265 Ω). As the external resistancedecreased, the biofilm cells tended to aggregate and finallycovered the whole anode with thick biofilm. This is consistentwith the total direct cell counts, which showed an inverse expo-nential correlationwith external resistances. The total cell densityon the 10Ω anodes was 1.49� 109 cells/cm2 of projected anodesurface area, which was 13 times higher than the cell density onthe 5000 Ω anode (Table 1).DGGE screening of amplified 16S rRNA gene fragments
showed two common sequences among all anode communities
Figure 1. Profile of cell voltage production at different externalresistances during the acclimation period.
Figure 2. Power density curves derived from electrochemical steady-state reactors at different resistances. The same series of resistors wasused for polarization tests.
2438 dx.doi.org/10.1021/es103115a |Environ. Sci. Technol. 2011, 45, 2435–2441
Environmental Science & Technology ARTICLE
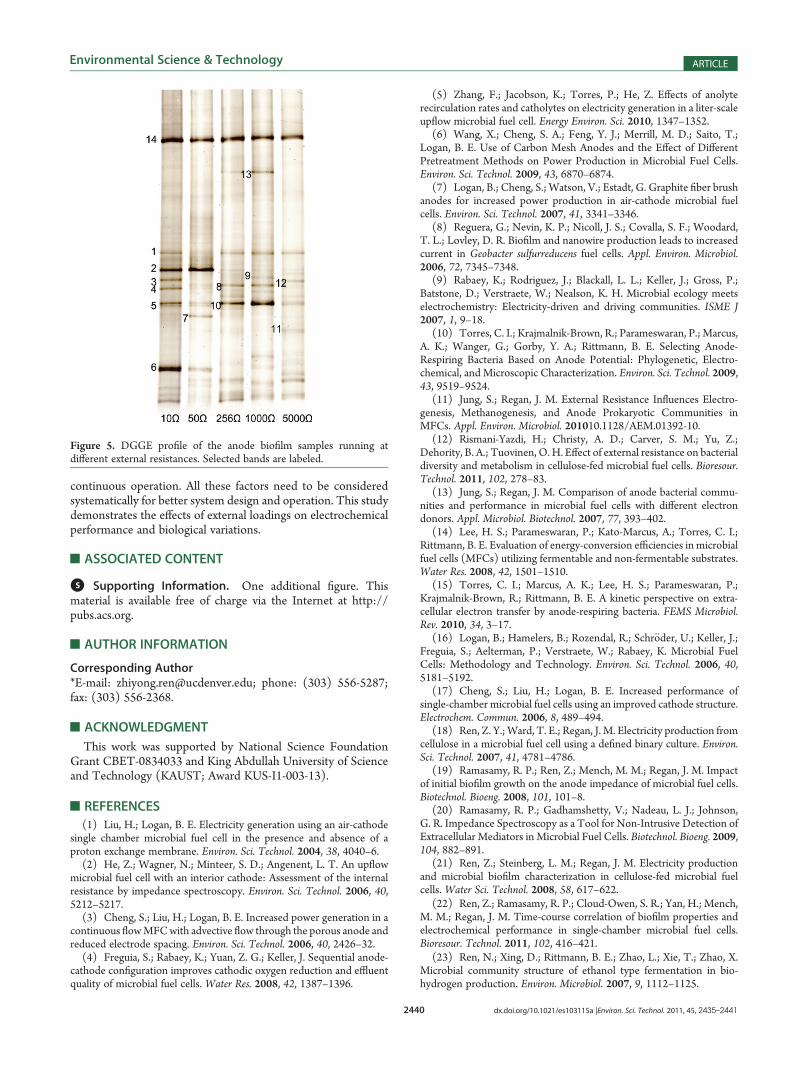
(Table 2, Figure 5). These two sequences are most similar toClostridium sp. FF08 (band 1) and Bacillus sp. KX6 (band 14).No other sequenced bands were found in more than 2 anodesamples, indicating a diverse community structure among thereactors running at different loadings. The 10 Ω and 50 Ωanodes shared several bands, such as band 2 (LachnospiraceaeDJF_CP76), band 3 (Fusibacter sp. SA1), and band 6(Pelobacter propionicus), but none of these sequences werefound in reactors operated at higher external resistances. Onthe other hand, some sequences found in higher resistances,such as band 8 (Clostridiales JN18_A56_K) and band 10(Anaerovorax odorimutans strain NorPut) were not observedin lower resistance reactors. Surprisingly for an acetate-fedsystem, most of the retrieved fragment sequences were mostsimilar to members of Firmicutes, and none of the predominantDGGE bands were associated with known exoelectrogenicbacteria. This may partially be due to the sensitivity limitationof the DGGE analysis, and the microbial community in theoriginal inoculum.
’DISCUSSION
External resistances regulate the availability of theMFC anodeas the electron acceptor for microbial electron transfers, andtherefore affect the anode biocatalyst activity and electrochemicalperformance. However, how this regulator affects the relation-ship between the electrochemical and biological mechanisms hasnot yet been fully investigated. In this study, both electrochemi-cal response and anode biocatalyst variation were investigated
and correlated during 3 months of continuous operation. Dupli-cate reactors running at different external resistors showedsimilar power production profiles using power density curvesobtained at 25-min measurement intervals, but the anode biofilmarchitecture and community varied significantly among thereactors with different operating resistances. Although the resultsin this study support the hypothesis that electrochemical steadystate can be achieved within .5 h and verify the traditionalpolarization testing method, they also show that this short testingperiod will not reveal the steady state anode biofilm.
The applied external resistance controls the anode potentialand the rate of electron flow. The energy that can be used bymicroorganisms during substrate oxidation is proportional to thedifference between the substrate redox potential and the anodepotential, as well as the number of electrons transferred to theelectrode.26 As a result, at higher anode potential and current,more exoelectrogens should be able to transfer electrons to theanode and gain more energy, likely leading to a more diverseand denser anode biofilm. This could explain why the 5000 Ωreactors showed similar power output in high resistances butfailed in low resistances, because the thin biofilms could notsustain higher current under low resistances. On the other hand,higher external resistance could accelerate the biofilm acclima-tion process by providing a lower anode potential for a fasterreactor start-up. However, with the exception of the highestresistance system (5000Ω), all reactors under different externalloadings (10-1000 Ω) showed similar power density butdifferent biofilm morphologies and densities. This suggests thatthough the biofilm developed differently under variable externalloadings (anode potentials) as expected, the correspondingelectrochemical output was not generally affected by the bacterialdensity because of the physicochemical constraints of theselected MFC system. The measured total internal resistanceof the bottle reactors was around 190Ω, which explains why thepeak power from all reactors was achieved at the 265 Ωresistance.16
The similar power density supported by very different anodebiofilms shows the limited influence of microbial reactions onelectrochemical performance in reactor-constrained systems.Though the physical and chemical constraints in MFCs havebeen relieved significantly in recent years, this study shows thatcurrent popular MFC configurations are still not good enough toreveal microbially constrained electrochemical performance.More advances are needed to further reduce the reactor limita-tion on microbial electrochemical activity. In addition, thisfinding showed that steady state external resistance thatbracketed internal resistance had no meaningful differences inscanned electrochemical performance, even though the biofilmdeveloped at high external resistance (1000Ω) could have beenmicrobially constrained at a lower applied resistance (e.g., 10Ω)during polarization measurements.
Table 1. Summary of the Coulombic Efficiency, Total Cell Counts, and Charge Transfer Resistance of the Reactors at DifferentExternal Resistances
reactor 5000 Ω 1000 Ω 265 Ω 50 Ω 10 Ω
Coulombic efficiency (%) 6.1 ( 1.4 10.8 ( 3.0 28.2 ( 6.2 42.5 ( 7.0 45.0 ( 5.6
total cell count ( � 108/cm2 anode) 1.16 ( 0.20 1.52 ( 0.06 2.59 ( 0.23 7.00 ( 0.34 14.9 ( 1.2
Rcta (kΩ 3 cm
2) anode 3.55 ( 0.07 1.79 ( 0.10 1.62 ( 0.08 1.04 ( 0.05 0.72 ( 0.12
cathode 0.047 ( 0.003 0.034 ( 0.002 0.041 ( 0.005 0.034 ( 0.003 0.005 ( 0.001a Rct: Charge transfer resistance
Figure 3. Nyquist plots showing ohmic resistances (X-intercept) andanode polarization resistances (arc radius) for steady-state reactorsrunning at different external resistances.

2439 dx.doi.org/10.1021/es103115a |Environ. Sci. Technol. 2011, 45, 2435–2441
Environmental Science & Technology ARTICLE
Despite the limitation of current MFC configurations, theeffects of external resistances on MFC performance and biofilmarchitecture carry important practical significance for the appli-cation at wastewater treatment facilities. Multiple MFC reactorsmay be needed in series or parallel and operated accordingly
based on different objectives, such as more efficient CODremoval, higher voltage, or higher current output (i.e., shorterretention time). So the external load may be used as a tuningknob to properly regulate the operation in different stages andmeet different objectives. For example, high resistance can beapplied to accelerate biofilm acclimation and power productionduring MFC start up. When the voltage stabilizes, the resistancecan be reduced to increase biofilm growth and current density.On the other hand, the loading could be switched from low tohigh when the reactor needs to “hibernate” but the biofilm needsto be kept for the next active operation. Lower resistance isgenerally preferred in active wastewater treatment processes, asthe reactor will have higher efficiency in COD removal andelectron recovery, but the associated biosolid production willincrease as well due to accelerated biofilm growth. Moreover, theresistance tuning knob can also be used to select an ideal bacterialcommunity and inhibit unnecessary or harmful biofilm growth.As indicated in Figure 4, filamentous bacteria tend to dominatewhen a high resistance is applied, while using lower resistancecould inhibit such bacteria from growing and thus preventclogging problems during operation or potential bulking insubsequent clarifiers, if needed.
There are many factors that affect MFC performance in addi-tion to external resistances, such as reactor configuration, sub-strate characteristics, planktonicmicroorganisms, and flow rate in
Figure 4. Confocal images (composite plan and cross section) of anode biofilms at (A) 5000Ω, (B) 1000Ω, (C) 265Ω, and (D) 10Ω. Samples wereviability stained, resulting in green live cells and red dead cells. The 50Ω anode biofilm had architecture similar to the 10Ω anode (data not shown).
Table 2. Phylogenetic Identification of Predominant 16SrRNA Gene Fragment DGGE Bands
band closest cultivated isolate
identity
(%)
1 Clostridium sp. FF08 (AB276319) 98
2 Lachnospiraceae DJF_CP76 (EU728729) 94
3 Fusibacter sp. SA1 (AF491333) 92
5 Clostridium sp. PPf35E6 (AY548783) 98
6 Pelobacter propionicus (X70954) 97
7 Clostridiaceae FH042 (AB298771) 94
8 Clostridiales JN18_A56_K (DQ168652) 99
9 Pseudomonas aeruginosa ZQP5 (GU384228) 99
10 Anaerovorax odorimutans strain NorPut (NR_028911) 93
11 Eubacterium saphenum ATCC 49989 (NR_026031) 94
12 Clostridium indolis strain 7 (NR_026493) 99
13 Clostridium aminovalericum strainDSM1283 (NR_029245) 97
14 Bacillus sp. KX6 (AB043862) 90
2440 dx.doi.org/10.1021/es103115a |Environ. Sci. Technol. 2011, 45, 2435–2441
Environmental Science & Technology ARTICLE
continuous operation. All these factors need to be consideredsystematically for better system design and operation. This studydemonstrates the effects of external loadings on electrochemicalperformance and biological variations.
’ASSOCIATED CONTENT
bS Supporting Information. One additional figure. Thismaterial is available free of charge via the Internet at http://pubs.acs.org.
’AUTHOR INFORMATION
Corresponding Author*E-mail: [email protected]; phone: (303) 556-5287;fax: (303) 556-2368.
’ACKNOWLEDGMENT
This work was supported by National Science FoundationGrant CBET-0834033 and King Abdullah University of Scienceand Technology (KAUST; Award KUS-I1-003-13).
’REFERENCES
(1) Liu, H.; Logan, B. E. Electricity generation using an air-cathodesingle chamber microbial fuel cell in the presence and absence of aproton exchange membrane. Environ. Sci. Technol. 2004, 38, 4040–6.(2) He, Z.; Wagner, N.; Minteer, S. D.; Angenent, L. T. An upflow
microbial fuel cell with an interior cathode: Assessment of the internalresistance by impedance spectroscopy. Environ. Sci. Technol. 2006, 40,5212–5217.(3) Cheng, S.; Liu, H.; Logan, B. E. Increased power generation in a
continuous flowMFCwith advective flow through the porous anode andreduced electrode spacing. Environ. Sci. Technol. 2006, 40, 2426–32.(4) Freguia, S.; Rabaey, K.; Yuan, Z. G.; Keller, J. Sequential anode-
cathode configuration improves cathodic oxygen reduction and effluentquality of microbial fuel cells. Water Res. 2008, 42, 1387–1396.
(5) Zhang, F.; Jacobson, K.; Torres, P.; He, Z. Effects of anolyterecirculation rates and catholytes on electricity generation in a liter-scaleupflow microbial fuel cell. Energy Environ. Sci. 2010, 1347–1352.
(6) Wang, X.; Cheng, S. A.; Feng, Y. J.; Merrill, M. D.; Saito, T.;Logan, B. E. Use of Carbon Mesh Anodes and the Effect of DifferentPretreatment Methods on Power Production in Microbial Fuel Cells.Environ. Sci. Technol. 2009, 43, 6870–6874.
(7) Logan, B.; Cheng, S.; Watson, V.; Estadt, G. Graphite fiber brushanodes for increased power production in air-cathode microbial fuelcells. Environ. Sci. Technol. 2007, 41, 3341–3346.
(8) Reguera, G.; Nevin, K. P.; Nicoll, J. S.; Covalla, S. F.; Woodard,T. L.; Lovley, D. R. Biofilm and nanowire production leads to increasedcurrent in Geobacter sulfurreducens fuel cells. Appl. Environ. Microbiol.2006, 72, 7345–7348.
(9) Rabaey, K.; Rodriguez, J.; Blackall, L. L.; Keller, J.; Gross, P.;Batstone, D.; Verstraete, W.; Nealson, K. H. Microbial ecology meetselectrochemistry: Electricity-driven and driving communities. ISME J2007, 1, 9–18.
(10) Torres, C. I.; Krajmalnik-Brown, R.; Parameswaran, P.; Marcus,A. K.; Wanger, G.; Gorby, Y. A.; Rittmann, B. E. Selecting Anode-Respiring Bacteria Based on Anode Potential: Phylogenetic, Electro-chemical, and Microscopic Characterization. Environ. Sci. Technol. 2009,43, 9519–9524.
(11) Jung, S.; Regan, J. M. External Resistance Influences Electro-genesis, Methanogenesis, and Anode Prokaryotic Communities inMFCs. Appl. Environ. Microbiol. 201010.1128/AEM.01392-10.
(12) Rismani-Yazdi, H.; Christy, A. D.; Carver, S. M.; Yu, Z.;Dehority, B. A.; Tuovinen, O. H. Effect of external resistance on bacterialdiversity and metabolism in cellulose-fed microbial fuel cells. Bioresour.Technol. 2011, 102, 278–83.
(13) Jung, S.; Regan, J. M. Comparison of anode bacterial commu-nities and performance in microbial fuel cells with different electrondonors. Appl. Microbiol. Biotechnol. 2007, 77, 393–402.
(14) Lee, H. S.; Parameswaran, P.; Kato-Marcus, A.; Torres, C. I.;Rittmann, B. E. Evaluation of energy-conversion efficiencies in microbialfuel cells (MFCs) utilizing fermentable and non-fermentable substrates.Water Res. 2008, 42, 1501–1510.
(15) Torres, C. I.; Marcus, A. K.; Lee, H. S.; Parameswaran, P.;Krajmalnik-Brown, R.; Rittmann, B. E. A kinetic perspective on extra-cellular electron transfer by anode-respiring bacteria. FEMS Microbiol.Rev. 2010, 34, 3–17.
(16) Logan, B.; Hamelers, B.; Rozendal, R.; Schr€oder, U.; Keller, J.;Freguia, S.; Aelterman, P.; Verstraete, W.; Rabaey, K. Microbial FuelCells: Methodology and Technology. Environ. Sci. Technol. 2006, 40,5181–5192.
(17) Cheng, S.; Liu, H.; Logan, B. E. Increased performance ofsingle-chamber microbial fuel cells using an improved cathode structure.Electrochem. Commun. 2006, 8, 489–494.
(18) Ren, Z. Y.;Ward, T. E.; Regan, J. M. Electricity production fromcellulose in a microbial fuel cell using a defined binary culture. Environ.Sci. Technol. 2007, 41, 4781–4786.
(19) Ramasamy, R. P.; Ren, Z.; Mench, M. M.; Regan, J. M. Impactof initial biofilm growth on the anode impedance of microbial fuel cells.Biotechnol. Bioeng. 2008, 101, 101–8.
(20) Ramasamy, R. P.; Gadhamshetty, V.; Nadeau, L. J.; Johnson,G. R. Impedance Spectroscopy as a Tool for Non-Intrusive Detection ofExtracellular Mediators in Microbial Fuel Cells. Biotechnol. Bioeng. 2009,104, 882–891.
(21) Ren, Z.; Steinberg, L. M.; Regan, J. M. Electricity productionand microbial biofilm characterization in cellulose-fed microbial fuelcells. Water Sci. Technol. 2008, 58, 617–622.
(22) Ren, Z.; Ramasamy, R. P.; Cloud-Owen, S. R.; Yan, H.; Mench,M. M.; Regan, J. M. Time-course correlation of biofilm properties andelectrochemical performance in single-chamber microbial fuel cells.Bioresour. Technol. 2011, 102, 416–421.
(23) Ren, N.; Xing, D.; Rittmann, B. E.; Zhao, L.; Xie, T.; Zhao, X.Microbial community structure of ethanol type fermentation in bio-hydrogen production. Environ. Microbiol. 2007, 9, 1112–1125.
Figure 5. DGGE profile of the anode biofilm samples running atdifferent external resistances. Selected bands are labeled.

2441 dx.doi.org/10.1021/es103115a |Environ. Sci. Technol. 2011, 45, 2435–2441
Environmental Science & Technology ARTICLE
(24) Lyon, D.; Buret, F.; Vogel, T.; Monier, J. Is resistance futile?Changing external resistance does not improve microbial fuel cellperformance. Bioelectrochemistry 2010, 78, 2–7.(25) Kiely, P. D.; Radera, G.; Regan, J. M.; Logan, B. E. Long-term
cathode performance and the microbial communities that develop inmicrobial fuel cells fed different fermentation endproducts. Bioresour.Technol. 2011, 102, 361–366.(26) Aelterman, P.; Versichele, M.; Marzorati, M.; Boon, N.; Verstraete,
W. Loading rate and external resistance control the electricity generationof microbial fuel cells with different three-dimensional anodes. Bioresour.Technol. 2008, 99, 8895–8902.