CHARACTERIZATION OF ASPHALTENES STRUCTURE: …
74
CHARACTERIZATION OF ASPHALTENES STRUCTURE: ASPHALTENE CHEMICAL STRUCTURAL CHANGES DUE TO CARBON DIOXIDE INJECTION A Thesis by NIKOO GOLSHAHI Submitted to the Office of Graduate and Professional Studies of Texas A&M University in partial fulfillment of the requirements for the degree of MASTER OF SCIENCE Chair of Committee, Hisham A. Nasr-El-Din Committee Members, Jerome J. Schubert Mahmoud El-Halwagi Head of Department, Jeff Spath August 2020 Major Subject: Petroleum Engineering Copyright 2020 Nikoo Golshahi
Transcript of CHARACTERIZATION OF ASPHALTENES STRUCTURE: …

CHARACTERIZATION OF ASPHALTENES STRUCTURE: ASPHALTENE
CHEMICAL STRUCTURAL CHANGES DUE TO CARBON DIOXIDE INJECTION
A Thesis
by
NIKOO GOLSHAHI
Submitted to the Office of Graduate and Professional Studies of
Texas A&M University
in partial fulfillment of the requirements for the degree of
MASTER OF SCIENCE
Chair of Committee, Hisham A. Nasr-El-Din
Committee Members, Jerome J. Schubert
Mahmoud El-Halwagi
Head of Department, Jeff Spath
August 2020
Major Subject: Petroleum Engineering
Copyright 2020 Nikoo Golshahi

ii
ABSTRACT
Asphaltenes precipitation during carbon dioxide injection to enhance recovery has been
considered as one of the major challenges in the tertiary production phase. How CO2 would change
the asphaltenes structure is still unknown. The present study investigates the effects of CO2 on the
isolated asphaltenes utilizing various analytical techniques. Chemical structure of precipitated
asphaltenes in the presence and absence of CO2 were characterized and compared. These results
were coupled with the results of the stability assessment to determine the effects of structural
alteration on asphaltenes stability in the oil matrix.
Four different crude oils were used to implement this experiment. In the first step,
asphaltenes were precipitated by n-heptane. The asphaltenes were then dissolved in toluene and
CO2 was injected (at 870 psi) to these solutions and they were mixed at 752°F. This process was
repeated for three days, and one week to identify the effect of time on the possible reaction between
CO2 and asphaltenes at elevated temperature and pressure. Next, CO2 was injected into the crude
oils to determine whether it would react with other components of the oils other than asphaltenes.
The same procedures were repeated with nitrogen as controlling experiments. For characterization,
Fourier Transform Infrared Spectroscopy (FTIR spectroscopy) was conducted to specify the
functional groups and their changes due to the addition of CO2. Finally, stability alteration of
precipitated asphaltenes after reaction with CO2 was evaluated by UV-Vis spectroscopy.
FTIR results analyses demonstrated that in one tested sample the peak related to the amide
functional group is created after injecting CO2. This peak was intensified by increasing the reaction
time. To characterize the origin and mechanism of amide formation, 1,4-diazabicyclo[2.2.2]octane
(DABCO) was added to this asphaltenes sample during reaction with CO2. Neither escalation of

iii
carbonyl group nor generation of aldehyde functional group was detected in the presence of
DABCO. Such an observation proves that the amide group was formed by the reaction of amine
in the asphaltenes and CO2. The stability of this sample in model oil was decreased after reaction
with CO2. On the contrary, the FTIR spectrums of the other three samples were not altered after
reaction with CO2. Interestingly, one of these three asphaltenes samples became unstable in the
model oil after reaction with CO2.
This study shows that the asphaltenes instability in the presence of CO2 could be a
consequence of either chemical structural alteration of asphaltenes or change of the oil matrix
solubility. Hence a comprehensive characterization of an oil sample is essential before designing
any CO2 injection treatment. Accordingly, these results can be utilized to select more efficient
inhibitors and stabilizers to prevent asphaltenes precipitation.

iv
DEDICATION
In the name of GOD, the most merciful and compassionate
This thesis is dedicated to my beloved parents and my lovely husband.
“Yesterday I was clever so I wanted to change the world.
Today I am wise so I am changing myself. What you seek is seeking you.”
— Jalal al-Din Rumi

v
ACKNOWLEDGMENTS
I would like to express my deepest appreciation to my committee chair, Dr. Hisham A.
Nasr-El-Din, for providing me the opportunity to research under his supervision. I thank him for
his continuous encouragement, guidance, and support throughout the course of this research. I
would like also to thank Dr. Jerome Schubert and Dr. Mahmoud El-Halwagi for serving as the
committee members.
I would like to thank my friends, colleagues in my research group, department faculty, and
staff for making my experience at Texas A&M University a wonderful one.
I acknowledge the people who mean a lot to me, my parents, for their continued
encouragement to pursue my dreams and giving me the liberty to choose what I desired. I cannot
thank you enough for all the support and love you have given me. Finally, I owe special thanks to
my love, Kambiz for his extreme support, love, and understanding. You were always here at times
I thought that it is impossible to continue. This journey would not have been possible without
everyone’s encouragement.
vi
CONTRIBUTORS
This study was supervised by a thesis committee of Dr. Hisham A. Nasr-El-Din and Dr.
Jerome Schubert of the Harold Vance Department of Petroleum Engineering and Dr. Mahmoud
El-Halwagi of the Artie McFerrin Department of Chemical Engineering.
All other work on the fourier-transform infrared spectroscopy (FTIR) and ultraviolet-
visible spectroscopy studies for the thesis were completed by the student independently.
vii
NOMENCLATURE
A Absorbance
AFM Atomic Force Microscopy
APCI Atmospheric Pressure Chemical Ionization
API American Petroleum Institute
ASTM American Society for Testing and Materials
Be Beryllium
Br Bromine
C Carbon
C5 n-pentane
C7 n-heptane
Ca Calcium
Cl Chlorine
CO2 Carbon Dioxide
CT Computer Tomography
Cu Copper
d Thickness, in
Da Dalton, g/mol
DABCO 1,4-Diazabicyclo[2.2.2]Octane
EDXRF Energy Dispersive X-ray Fluorescence
EOR Enhanced Oil Recovery
ESI Electrospray Ionization
F Fluorine
FAR Fused Aromatic Ring
FD/FI Field Desorption/Field Ionization
FTICR-MS Fourier Transform Ion Cyclotron Resonance Mass Spectrometry
FTIR Fourier Transform Infrared Spectroscopy

viii
γ gamma
H Hydrogen
HCl Hydrochloric Acid
H2O Water
HOMO−LUMO Highest Occupied Molecular Orbital−Lowest Unoccupied Molecular
Orbital
HPLC High-Performance Liquid Chromatography
I Intensity, T
IFT Interfacial Tension
IMS Ion Mobility Spectrometry
IR Infrared Spectroscopy
λ Wavelength, cm
LDI Laser Desorption/Ionization
m/z mass-to-charge ratio
MALDI Matrix-Assisted Laser Desorption/Ionization
MMP Minimum Miscibility Pressure, psi
Mn Manganese
MS Mass Spectrometry
MW Molecular Weight, Ib/Ibmol
N Nitrogen
Na Sodium
NIR Near-Infrared
NMR Nuclear Magnetic Resonance
P Pressure, psi
PAH Polycyclic Aromatic Hydrocarbon
PVT Pressure, Volume, Temperature
Density, Ib/ft3
RF Recovery Factor

ix
rpm revolution per minute
S Sulfur
SARA Saturates, Aromatics, Resins, Asphaltenes
SO2 Sulfur dioxide
T Temperature, °F
T% Transmittance Percentage
TOF−MS Time-of-Flight Mass Spectrometry
TWIM Traveling Wave Ion Mobility
U Uranium
UV-Vis Ultraviolet-Visible Spectrophotometry
V Vanadium
Vol% Volume Percentage, ft3%
W Wavenumber, cm-1
WDXRF Wavelength Dispersive X-ray Fluorescence
wt.% Weight Percent, Ib%
XRD X-ray Diffraction
XRF X-ray Fluorescence

x
TABLE OF CONTENTS
Page
ABSTRACT .................................................................................................................................... ii
DEDICATION ............................................................................................................................... iv
ACKNOWLEDGMENTS .............................................................................................................. v
CONTRIBUTORS ......................................................................................................................... vi
NOMENCLATURE ..................................................................................................................... vii
TABLE OF CONTENTS ................................................................................................................ x
LIST OF FIGURES ...................................................................................................................... xii
LIST OF TABLES ....................................................................................................................... xiv
CHAPTER I INTRODUCTION AND LITERATURE REVIEW ................................................. 1
Properties of Asphaltenes ............................................................................................................ 1
Asphaltenes Characterization ...................................................................................................... 4
CO2 Flooding............................................................................................................................... 9
Asphaltenes Precipitation Onset Point ...................................................................................... 13
Research Objectives .................................................................................................................. 16
CHAPTER II EXPERIMENTAL METHODOLOGY ................................................................. 17
Materials .................................................................................................................................... 17
SARA Analysis ......................................................................................................................... 18
Elemental (C, H, N, S) Analysis ............................................................................................... 20
X-ray Fluorescence (XRF) ........................................................................................................ 22
CO2 Injection ............................................................................................................................. 25
Fourier Transform Infrared Spectroscopy (FTIR) .................................................................... 26
Identification Tests .................................................................................................................... 30
Control Test ............................................................................................................................... 31

xi
UV-Visible Spectroscopy .......................................................................................................... 31
Asphaltenes Precipitation Onset Point ...................................................................................... 33
CHAPTER III RESULTS AND DISCUSSION ........................................................................... 36
Oil Characterization .................................................................................................................. 36
SARA Analysis...................................................................................................................... 36
Asphaltenes Characterization .................................................................................................... 37
Elemental (C, H, N, S) Analysis ............................................................................................ 37
X-ray Fluorescence (XRF) ........................................................................................................ 38
Effect of CO2 Injection on Asphaltenes FTIR Spectra ............................................................. 39
Characterizing the Functional Group Formed by CO2 Injection............................................... 43
Control Test ............................................................................................................................... 47
Effects of CO2 on Asphaltenes Stability ................................................................................... 48
CHAPTER IV CONCLUSIONS .................................................................................................. 53
REFERENCES ............................................................................................................................. 55

xii
LIST OF FIGURES
Page
Figure 1. Yen−Mullins Model. ....................................................................................................... 4
Figure 2. Chemical Structure of the DABCO Base. ..................................................................... 18
Figure 3. SARA Analysis Separation. .......................................................................................... 19
Figure 4. Scheme of SARA Analysis. .......................................................................................... 20
Figure 5. Perkin-Elmer 2400 C, H, N, S Analyzer. ...................................................................... 21
Figure 6. Three Main Interactions of X-Rays with Matter. .......................................................... 22
Figure 7. Design of the X-Ray Tube. ............................................................................................ 23
Figure 8. Reactor Used in Experiments. ....................................................................................... 26
Figure 9. An Example of a Wave’s Cycle and Wavelength. ........................................................ 27
Figure 10. Thermo Nicolet 380 FTIR Spectrometer. .................................................................... 28
Figure 11. Components of the FTIR Spectrometer. ...................................................................... 29
Figure 12. Reaction of the Amide with Water in the Presence of Hydrochloric Acid for
Producing a Carboxylic Acid. ....................................................................................... 31
Figure 13. Shimadzu UV 2501PC Spectrophotometer. ................................................................ 34
Figure 14. FTIR Spectra of (A) the Asphaltenes A in Which CO2 Was Injected to the
Asphaltenes for 3 Days, (B) the Asphaltenes That Were Precipitated from Crude Oil
A in Which CO2 Was Injected to the Oil for 7 Days, and (C) the Asphaltenes A
without CO2 Injection. ................................................................................................... 39
Figure 15. FTIR Spectra of the Asphaltenes A in Which CO2 Was Injected to the Asphaltenes
for (A) 7 Days and (B) 3 Days. ..................................................................................... 40
Figure 16. FTIR Spectra of (A) the Asphaltenes That Were Precipitated from Crude Oil B in
Which CO2 Was Injected to the Oil for 7 Days, (B) the Asphaltenes B without CO2
Injection, and (C) the Asphaltenes B in Which CO2 Was Injected to the Asphaltenes
for 7 Days. ..................................................................................................................... 41
Figure 17. FTIR Spectra of (A) the Asphaltenes C without CO2 Injection, (B) the Asphaltenes
That Were Precipitated from Crude Oil C in Which CO2 Was Injected to the Oil for

xiii
7 Days, and (C) the Asphaltenes C in Which CO2 Was Injected to the Asphaltenes
for 7 Days. ..................................................................................................................... 42
Figure 18. FTIR Spectra of (A) the Asphaltenes D without CO2 Injection, (B) the Asphaltenes
That Were Precipitated from Crude Oil D in Which CO2 Was Injected to the Oil for
7 Days, and (C) the Asphaltenes D in Which CO2 Was Injected to the Asphaltenes
for 7 Days. ..................................................................................................................... 43
Figure 19. FTIR Spectra of the Asphaltenes A in Which CO2 Was Injected to the Asphaltenes
(A) without DABCO Base and (B) with DABCO Base. .............................................. 45
Figure 20. FTIR Spectra of the Asphaltenes A in Which CO2 Was Injected to the Asphaltenes
(A) After the Qualitative Test and (B) Before the Qualitative Test
(HCl Addition). ............................................................................................................. 46
Figure 21. FTIR Spectra of Toluene in the Presence and Absence of CO2. ................................. 47
Figure 22. FTIR Spectra of the Asphaltenes A (A) in Which N2 Was Injected to the
Asphaltenes for 7 Days, and (B) without N2 Injection. ................................................. 48
Figure 23. Results of the Absorbance at 350 Nm Vs N-Heptane Vol% from UV-Vis
Spectroscopy Technique for Determination of Asphaltene Precipitation Onset Point
from Model Oil (Asphaltenes A and Toluene) Diluted with N-C7. .............................. 50
Figure 24. Results of the Absorbance at 350 Nm Vs N-Heptane Vol% from UV-Vis
Spectroscopy Technique for Determination of Asphaltene Precipitation
Onset Point from Model Oil (CO2-Reacted Asphaltenes A and Toluene)
Diluted with N-C7. ......................................................................................................... 51

xiv
LIST OF TABLES
Page
Table 1. Oil samples Characterization. ......................................................................................... 36
Table 2. Elemental Analysis of Asphaltenes. ............................................................................... 37
Table 3. Atomic Ratios of Asphaltenes. ....................................................................................... 38
Table 4. XRF Results of Asphaltenes A. ...................................................................................... 38
Table 5. XRF Results of Asphaltenes B. ...................................................................................... 38

1
CHAPTER I
INTRODUCTION AND LITERATURE REVIEW
Properties of Asphaltenes
Asphaltenes are the largest, heaviest and most complex fraction of crude oil that contains
condensed aromatic rings with alkyl side chains, heteroatoms, like nitrogen, sulfur, oxygen, and
traces amount of metals, such as nickel and vanadium (Moreira et al. 1999). Asphaltenes are the
most polar and surface-active part of the oil that is defined based on a solubility regime.
Asphaltenes are soluble in light aromatics such as benzene, toluene, and pyridine. however, they
are insoluble in n-alkane solvents such as n-heptane (C7) or n-pentane (C5). The Saturates,
Aromatics, Resins, and Asphaltenes (SARA) analysis begin with asphaltenes precipitation by
heptane (Melendez et al. 2012).
When asphaltene was first identified, its molecular weight was the main parameter that was
used for its characterization. It was the first parameter for asphaltenes identification. Nowadays, it
is obvious that molecular weight couldn’t be the most accurate factor for asphaltenes
characterization and molecular weight should not be the only parameter for asphaltenes
description. Because, the solubility of asphaltenes in pentane or heptane, polarity, aliphatic length
chain and combinations of these factors help to define the asphaltenes (Sheu 2002). The asphaltene
color changes from clear to deep brown or black when asphaltene content in oil grows from 0 to
20 percent (Hortal et al. 2007).
2
Several experiments have been conducted for finding the molecular weight (MW) of
asphaltenes, including electrospray ionization (ESI), atmospheric pressure chemical ionization
(APCI), and field desorption/field ionization (FD/FI). The detected asphaltenes MWs are in the
range of 500-3000 Da. These results are very sensitive to the temperature, sample concentration,
and type of solvent. On the other hand, much higher MWs have been identified by matrix-assisted
laser desorption/ionization (MALDI) and Laser desorption/ionization (LDI). These changes in
molecular weight arise from the aggregation tendency of asphaltenes molecules. Hence, higher
MWs were obtained due to the aggregation (Cunico et al. 2004; Qian et al. 2007).
Pomerantz et al. (2009) used a two-step laser mass spectrometry to obtain the asphaltenes
MW. In this experiment, to eliminate the aggregation effect on MW, a short pulse of low-energy
photons was used. The energy of these photons is below the ionization energy of asphaltenes.
Hence, all molecules are thermally desorbed very fast. Then, the neutral molecules are ionized by
a higher energy laser pulse. With this technique, the highest MW distribution for asphaltenes is
1000-1500 Da. Then, Pinkston et al. (2009) published a comprehensive paper containing all the
mass spectroscopies techniques. The asphaltenes average molecular weight was concluded to be
750 Da. In addition, most of the tested asphaltenes have a molecular weight of 500–1000 Da.
The problems due to the presence of asphaltenes in crude oils come from its destabilization
by different factors in flow assurance. Changes in temperature and composition of crude oil are
the main factors causing asphaltenes precipitation. For instance, a heavy crude oil with a high
percentage of asphaltenes may not cause the asphaltenes precipitation trouble, whereas oil with
less than 0.1 wt.% asphaltenes may lead to serious asphaltenes precipitation problems. Pressure
depletion during primary recovery is another reason for the asphaltenes precipitation. Moreover,

3
CO2 flooding can alter the phase behavior of the fluid, and consequently causes the precipitation
of organic solids such as asphaltenes (Ibrahim and Idem 2004). So, the major problem of CO2
injection is related to the asphaltenes precipitation. Asphaltenes precipitation could occur in the
wellbore, reservoir, surface facilities, and subsurface formations. The thick deposit of asphaltenes
can sharply decrease production by pore plugging, blocking the valves and submersible pumps,
and alteration in rock wettability, which eventually causes a reduction in enhanced oil recovery
(EOR) performance.
To optimize oil production, finding the asphaltenes composition and the situations in which
asphaltenes remain in a solution can be beneficial. Hence, an acceptable method has been
developed to fraction the crude oil components based on its polarity and solubility to saturates,
aromatics, resins, and asphaltenes (SARA). The SARA method has a simple procedure that can be
performed in many chemical laboratories and it is the main advantage of this separation method.
However, SARA analysis has many disadvantages. The results may not be representative under
actual reservoir conditions. Because the gaseous components that are lacked from dead oil can be
dissolved in live oils. In addition, the solubility of asphaltenes changes with the type of n-alkane
that is used as a precipitant. Although its simplicity makes the SARA analysis a widespread method
for oil comparison, single oil may have two different SARA results. Therefore, to reduce the
variations in SARA analysis results, the asphaltenes precipitant (type of n-alkane) should be
constant for different oils.

4
Asphaltenes Characterization
The incomplete knowledge of asphaltenes chemical structure and their features are the
challenging issues in dealing with asphaltenes in the oil and gas industry. These pieces of
knowledge help the industry to obtain the most relevant techniques for inhibiting its precipitation.
The early asphaltenes model named Yen model was proposed regarding the asphaltenes structure.
However, major uncertainties found in this model, including the asphaltene molecular weight,
molecular architecture, aggregation species, aggregation numbers, and concentration of formation.
In recent years, due to specific data, the modified Yen model was proposed. It has been called the
Yen-Mullins model that is shown in Figure 1 (Mullins 2010).
Figure 1. Yen−Mullins Model.
This model shows the dominant molecular and colloidal structures for asphaltenes. The most
probable asphaltene molecular weight is ∼750 g/mol (Da), and the island molecular architecture
dominates with one aromatic ring system per molecule. With sufficient concentration, asphaltene
molecules form nanoaggregates with small (10) aggregation numbers and with one disordered
stack of aromatics. At higher concentrations, nanoaggregates form clusters, again with small (10)

5
aggregation numbers. Based on the recent progress of the Yen-Mullins model, asphaltene
aggregate structure contains fused aromatic rings (FAR), heteroatoms and alkyl groups. The FAR
region in asphaltenes is similar to polycyclic aromatic hydrocarbons (PAHs) (Mullins et al. 2012).
The highest occupied molecular orbital−lowest unoccupied molecular orbital
(HOMO−LUMO) gap of asphaltenes should be calculated as an index of molecular size and
structure for PAHs. It has been identified that the magnitude of the (HOMO−LUMO) gap is related
to the number of fused aromatic rings in the PAH region of asphaltenes. The experimental
HOMO−LUMO gap range of asphaltenes is obtained from fluorescence emission data. It has been
concluded that based on the HOMO-LUMO gap results, 5 FAR-10 FAR is the most common PAH
size in asphaltenes structure (Ruiz-Morales 2002).
Schuler et al. (2015) found the 18 FAR and larger ring systems in asphaltenes structure by
using atomic force microscopy (AFM) and scanning tunneling microscopy. The atomic-resolution
imaging and molecular orbital imaging of more than 100 asphaltenes were combined. A single
aromatic core with peripheral alkyl chains is the main part of the asphaltene structure. Observation
of many asphaltenes with AFM showed that their structures are island structure, not the
archipelago molecular structure type. The archipelago structure contains two or more PAH cores
connecting with an alkane chain. The island molecular architecture of asphaltenes, where there is
a single PAH core per molecule with peripheral alkanes has also been confirmed by fluorescence
depolarization molecular diffusion measurements and unimolecular decomposition utilizing laser
ionization mass spectrometry.
6
Nuclear magnetic resonance (NMR) spectroscopy is one of the main techniques for
studying the asphaltenes structure. 1H and 13C solid and solution-state NMR are useful tools for
analyzing the asphaltenes structure. The early liquid-state 1H and 13C NMR demonstrated that the
most probable number of fused rings in asphaltenes is seven. To be more in-depth, one coal-
derived asphaltene and one petroleum asphaltene has been studied by Dutta Majumdar et al. (2016)
utilizing a solid-state 13C NMR study. Their results showed that the asphaltene architecture ranges
from small PAH cores (5 condensed rings) to large PAH cores (9 condensed rings). The small
one is related to the coal-derived asphaltene.
Time-of-flight mass spectrometry (TOF−MS) is appropriate for the detection of asphaltene
aggregates. Because it charges ions up to 20 kDa. Based on the mass analysis results,
nanoaggregate and monomeric species of asphaltenes have m/z higher and lower 2000
respectively. To characterize and determine the elemental composition of lower mass species of
asphaltenes, fourier transform ion cyclotron resonance mass spectrometry (FT-ICR MS) is used.
Both ultrahigh-resolution FT-ICR MS and TOF−MS techniques were performed by McKenna et
al. (2013) for analyzing the asphaltene aggregation with m/z1400. The results showed that only
the most aromatic part of asphaltenes is ionized. Furthermore, most asphaltenes are non-covalently
aggregated at concentrations that are detectable for most mass spectrometers.
Mass spectrometry (MS) was one of the principals and common techniques for asphaltene
characterization. Furthermore, the combination of MS and chromatographic methods have been
widely applied to oils and their derivatives. Ion mobility spectrometry (IMS) is a gas-phase ion
separation technique in which the matters are separated based on their charges and sizes. A cell
that has a weak electric field, is filled with an inert gas that is usually helium. Then, ions are
7
injected into the filled cells. This spectrometry worked based on the time that ions of samples
needed to cross the cell. The combination of IMS with MS (IMS-MS) is developed for identifying
the ion mobility of petroleum samples such as asphaltenes. Furthermore, traveling wave ion
mobility (TWIM) has been introduced as a new model for IMS experiments. In TWIM, ions are
accumulated and periodically released into a T-wave cell, where the transient voltage pulses
(traveling waves) applied continuously to pairs of stacked ring electrodes. This technique has a
high ion transmission and separation resolution (Koolen et al. 2018). These methods couldn’t
determine the chemical components and functional groups of asphaltenes. This study can propose
the island architecture for asphaltenes.
The structure of asphaltenes can be observed by using the X-ray diffraction (XRD) spectra.
X-ray peaks contain gamma-peak (γ-peak) and (002)-peak that represent alkyl chain and aromatic
material respectively. In this research, the cubic solid structure should be assumed for the
asphaltenes structure. For estimating the aromaticity and crystalline behavior, the asphaltene
molecular dimensions should also be calculated. The positions and size of the diffraction peaks
are used for characterizing the structure and crystallite size of asphaltenes. Tall narrow peaks in
the XRD patterns are crystalline. On the other hand, broad peaks are related to less crystalline and
smaller particle sizes (Shirokoff and Lye 2019). These types of researches need validation.
Because they are based on some solid assumptions for the asphaltenes structure.
Coelho et al. (2007) utilized two infrared regions for characterizing the aromatic hydrogens
of asphaltenes functional groups by FTIR tests. 700-900 cm-1 was the first region in which single
H and paired one in the aromatic rings were characterized in the 860-900 cm-1 and 800-860 cm-1
regions respectively. 2900-3100 cm-1 was the second region that symmetrical and asymmetrical

8
stretching of aromatic hydrogens were shown. Then, the percentage of isolated H and paired H
that are attached to aromatic rings of asphaltenes were calculated.
Structures of SARA fractions of crude oils were investigated by Akmaz et al. (2011).
Elemental analysis, NMR, and FTIR were the analytical tools in this experiment. The distribution
of carbon atoms from different fractions of oil was identified. The C=C, C=O, CH2 and CH3
functional groups were recognized by FTIR. Since asphaltene is a complex fraction of oil, there
are still some hypotheses for its structure. The saturate fraction contained a long aliphatic chain.
But the aromatic fraction consisted of aromatic groups with short aliphatic chains. On the other
hand, fused aromatic rings with branched paraffin and polar compounds were observed in resins
and asphaltene was the most complex fraction.
The asphaltenes from three different crude oils were analyzed by Hosseini et al. (2016) for
identifying the effect of the electrostatic field on the aggregation rate and its size by using the
optical microscope and a high voltage direct current power supply. Then, C, H, N, S elemental
analysis and FTIR tests were conducted for finding the characterization of asphaltenes. It has
resulted that the asphaltene aggregation rate is directly proportional to the number of hetero-atoms
on asphaltene molecules. Aggregation size was also related to the concentration of asphaltene
particles in the mixture and the voltage that applied to them. In addition, asphaltene was deposited
faster under the electrostatic field. Hence, based on the literature review, FTIR was used in my
present work for asphaltenes characterization due to its rapidity, low cost, sample preparation
simplicity, and huge applicability. One of the main interests of the petroleum industry is
determining the structure of asphaltenes. The new structural features of asphaltenes may better

9
explain their physical-chemical properties, affording new insights to heavy oil extraction and
refining.
CO2 Flooding
CO2 flooding is used for increasing oil production and reducing oil viscosity in the
Enhanced Oil Recovery (EOR) process in the oil field (Kokal and Sayegh 1995). CO2 dissolution
into the crude oil causes oil viscosity reduction. Hence, the irreducible oil saturation is reduced.
The great amounts of residual oil can be recovered by this treatment. Oil recovery is increased by
8-16% by this process (Magruder et al. 1990). Various processes are involving in enhancement oil
production by CO2. CO2 flooding is conducted with oil-viscosity reduction and oil-swelling effect,
which causes changes in CO2-crude oil properties such as reducing the interfacial tension and
increasing the oil mobility (Srivastava et al. 1999). Another environmental benefit of CO2 storage
in the reservoir is decreasing greenhouse gas emissions (Godec et al. 2013). However, CO2
transportation and corrosion are challenging issues in CO2 EOR treatment (Wang et al. 2019).
Furthermore, in tertiary oil production, many reservoirs are subjected to CO2 flooding in which it
contacts with the reservoir oil and changes the fluid properties and reservoir equilibrium
conditions. It may lead to the precipitation of asphaltenes. Hence, one of the major challenges in
the oil and gas industry during EOR treatment is related to asphaltenes precipitation.
Asphaltene deposition causes severe problems in the oil industry such as plugging the
pores, altering the rock wettability, reducing the core permeability and subsequently decreasing
the productivity rate (Kokal et al. 1992; Gabrienko et al. 2016). Asphaltenes deposition leads the
production problems such as blocking the valves and submersible pumps (Leontaritis and
Mansoori 1988). Mitigation of these problems is the goal of production engineers because the
10
remediation techniques are more expensive than its prevention. The treatment techniques for
solving the formation damage problems causing by asphaltenes precipitation are slow, expensive,
and hard to handle. Identifying the functional groups of asphaltene molecules is critical for the
mitigation techniques of asphaltene precipitation. This thesis research aims to understand the
changes in functional groups of asphaltenes in the presence and absence of carbon dioxide.
Srivastava et al. (1999) conducted the experimental analysis to indicate that the asphaltene
precipitation in the single-phase region is increased linearly by CO2 concentration. Carbonate
reservoir oil in a PVT cell by using the light-scattering technique was studied by Takahashi et al.
(2003). To find out the effect of CO2 concentration on asphaltene precipitation, the pressure was
gradually decreased at each predetermined CO2 concentration and the results were compared.
Based on their results, the precipitated asphaltene became considerable by exceeding the carbon
dioxide concentration to more than 50 mol%. Furthermore, the asphaltene was precipitated due to
CO2 injection at the reservoir pressure.
Hu et al. (2004) studied the effects of pressure and injected CO2 concentration on the
asphaltenes precipitation under reservoir temperature. They concluded that the asphaltene was not
precipitated under the pressure depletion process without CO2 injection. But, when CO2 was
injected into the same system, the great amount of asphaltene was precipitated. There is a direct
correlation between asphaltenes precipitation amount and injected CO2 concentration.
The structure and molecular characteristics of four different asphaltenes were investigated
by Ibrahim and Idem (2004) for determining the differences of inhibition effectiveness between
CO2 and n-heptane induced asphaltene precipitation. The results from FTIR and NMR tests

11
showed that the mechanism and behavior of asphaltenes precipitation is related to the oil and
asphaltene characteristics, and asphaltene precipitant agent (that can be CO2 or n-heptane).
Furthermore, the type of inhibitor for asphaltene precipitation depends on the type of asphaltene
precipitant and oil characteristics.
Okwen (2006) conducted a research on the chemical characteristics of formation water that
influences on the rate or amount of CO2 induced asphaltenes precipitation. CO2 dissolves in the
formation water and makes a buffer. Therefore, it is beneficial to identify the ideal formation water
during the CO2 injection. Minimizing the concentration of CO2 injection to the reservoirs reduces
the asphaltenes flocculation and precipitation. Core flooding and computer tomography (CT)
scanning tests were also used to investigate the formation damage that is causing by the
precipitation of asphaltenes during CO2 flooding. It is very important to study the rock composition
before CO2 injection in EOR treatment.
Verdier et al. (2006) worked on the changes in asphaltene phase behavior by carbon dioxide
injection. To do so, the high-pressure cell and a filtration technique were utilized. They found
asphaltenes became more stable by increasing the pressure. However, for CO2 injection,
asphaltenes were more stable as the temperature decreased.
Zanganeh et al. (2012) visualized the asphaltene precipitation process by using a high-
pressure cell and image processing technique. Their results show that CO2 injection increases
asphaltene precipitation in all pressure ranges. Moreover, increasing the mole percentage of CO2
from 5 to 20%, rises the area of precipitated asphaltene and the differences in asphaltene molecular
structures could be one of the main factors affecting asphaltene precipitation.

12
The asphaltene precipitation mechanism in the tight sandstone reservoir core plugs during
immiscible, near-miscible, and miscible CO2 flooding was studied by Cao and Gu (2013). The
measured oil recovery factor (RF) shows that it increased by raising the pressure of immiscible
CO2 flooding. When the oil pressure exceeds the minimum miscibility pressure (MMP), the oil RF
increases to reaches its highest value that is the maximum value in the miscible CO2 flooding.
Moreover, a higher average asphaltene content of the produced oil is found during the immiscible
CO2 injection conditions, whereas a lower average asphaltene content of the produced oil occurs
under the miscible CO2 flooding.
Dong et al. (2014) investigated the effect of temperature, pressure, and concentration of
CO2 on asphaltene precipitation. FTIR, interfacial tensiometer, and drill core displacement
experimental apparatus were used in this experiment to determine the variation of the core oil
permeability, and asphaltene content of produced oil by CO2 flooding. By increasing the pressure
of carbon dioxide and the molar ratio of CO2 to oil and decreasing the temperature, the amount of
precipitated asphaltene is increased due to the changes in interfacial tensions. These changes
reduce the oil permeability that is related to blocking the pores by asphaltene precipitation.
Mohammed and Gadikota (2019) studied the effect of CO2 injection on the structural
properties of asphaltenes solvated in toluene in calcite nanopores by using molecular dynamics
simulations. By increasing the CO2 mole fraction, the van der Waals and electrostatic forces
between the asphaltene and calcite surface are decreased. It also facilitates the asphaltene
aggregation. In addition, CO2 has a higher influence on asphaltene aggregation in the absence of
confining solid interfaces.

13
Considering all the literature review, the impact of CO2 on asphaltenes structure hasn’t
been studied completely by using the experimental techniques. Hence, my research area focuses
on releasing the applicable and low-cost technique for finding the probable changes of asphaltenes
structure during CO2 flooding that is relevant in small laboratory scale running the test on a large
scale in the industry.
Asphaltenes Precipitation Onset Point
One of the first steps to prevent asphaltene deposition is attaining the accurate information
about the asphaltenes structure and its properties like stability. The stability of asphaltene is
defined by measuring the onset of asphaltene precipitation, which means the minimum amount of
precipitant that is required for precipitating the asphaltenes and the beginning point of separation
of asphaltenes from oil. This point is obtained by monitoring the flocculating agent's volume that
is essential for observing the first point of asphaltenes precipitation (Mansur et al. 2009). In this
experiment, the onset of asphaltene precipitation was determined by ultraviolet-visible
spectrophotometry (UV-Vis) and spectrofluorimetry for comparing the effect of stabilizers.
Generally, spectrometer works based on comparing the quantity of light passes through the sample
with the ones that pass through the reference (blank).
There are many methods and experimental techniques for determining the asphaltenes
precipitation onset point to investigate its stability in crude oil. For instance, it can be found
through detecting the accurate viscosity of oil that is diluted with a precipitant. It works based on
an increase in the viscosity of the suspension of oil and precipitant, and comparison of the analyte
curve with a reference system (Escobedo and Mansoori 1995). The capillary viscometer was used
for measuring the viscosity. Moreover, the polyaromatic core of asphaltenes can strongly interact
14
with the external electric field. As a result, the electrical conductivity has appeared. Since the
asphaltene precipitated from oil, the electrical conductivity changes abruptly. Therefore, it is one
of the methods for finding the onset of asphaltenes precipitation point (Behar et al. 1998; Fotland
et al. 1993).
Optical microscopy is another method that has been used to identify the precipitation of
asphaltenes as a function of precipitant concentration. A series of oils and different n-alkane
precipitants from n-pentane through n-pentadecane were prepared in a certain volume. After
reaching the equilibrium, the optical microscope at a magnification of 320× was used for finding
the onset of asphaltenes precipitation (Wang and Buckley 2003). However, the optical microscopy
technique is not so accurate. Since ultra-heavy crude oils are so viscous, a laser with near-infrared
wavelength cannot penetrate them.
Wattana et al. (2003) utilized the refractive index of crude oils to understand their tendency
to precipitate from crude oils. First, different crude oils were titrated by heptane or pentane to
induce asphaltenes precipitation. Then the refractive index of these solutions was measured. At the
beginning of the measurement, it is the linear combination of refractive indexes of the components
of oils. When asphaltene starts precipitating from oil, the refractive index has slightly deviated
from the linear line. In this experiment, the careful analysis of refractive indexes is required to see
the small deviation from the linear line.
Gharfeh et al. (2004) presented the near-infrared (NIR) light transmittance technique for
detecting the onset of asphaltenes precipitation of crude oils. The system contains a titration vessel,
a temperature controller, an automatic titrator, a NIR laser set, and a transmittance detector. A

15
sample was titrated continuously at a rate of 1 mL/min with heptane. Then, the transmittance was
plotted as a function of the titrant volume or time. The apex of this plot is the onset point for
asphaltenes precipitation. This method is also applicable to ultra-heavy oil cases. On the other
hand, Mousavi-Dehghani et al. (2004) conducted research on finding the asphaltene precipitation
onset point based on the measuring the interfacial tension (IFT) between oil and water phases that
the sudden changes in the IFT show the onset point. First, the crude oils were mixed with n-
heptane. Then, the IFT between the water and this solution was measured by the DuNouy ring
method.
The direct methods for measuring the precipitation onset point can detect the presence of
asphaltenes particle with a minimum size of 0.5 to 1 µm. It means that the direct methods such as
optical microscopy and NIR scattering determine the onset point when the aggregation of
precipitated asphaltenes exceeds this particle size. These methods couldn't detect the precipitation
amount. They just identify the particles with a specific size, not their quantities. Alboudwarej et
al. (2005) utilized the indirect procedure for detecting the asphaltenes concentration adsorbed on
the solid metal surface by using the UV-Vis spectrophotometry. In this research, the differences
between initial and final asphaltene concentrations reveal the number of deposited asphaltenes on
the metal surface. This work motivated other researchers to use the indirect method for finding the
onset of asphaltenes precipitation.
Tavakkoli et al. (2015) prepared samples containing different ratios of n-heptane and oil.
UV-Vis spectrophotometer was used to detect the onset point and quantify the number of
precipitated asphaltenes. This indirect method can be used for various crude oil types with different
asphaltenes concentration. Furthermore, this method is very sensitive to the asphaltene particle

16
size that is precipitated and the minimum detectable particle size of asphaltene is smaller than the
previous direct methods. Therefore, with this literature review, for quantifying the amount of
asphaltenes precipitation, its stability is measured by the UV-Vis test in the presence of n-alkane
and carbon dioxide separately to distinguish the effect of precipitant on its precipitation onset
point.
Research Objectives
The propensity of the asphaltene molecule toward precipitation is associated with its
structure (Borton et al. 2010), but the exact composition and chemical structure of asphaltenes are
still unknown. It is obscure that the precipitation of asphaltene by CO2 is coming from structural
changes or not. So, it is beneficial to understand how amplifier factors will precipitate the
asphaltenes.
The current study identifies the relationship between the asphaltenes composition and its
stability under CO2 flooding. The influences of CO2 on asphaltenes structure has not been studied
thoroughly. Since the main purpose of this work is to present the valid techniques for determining
the probable changes in the structure of asphaltenes under CO2 injection and its effects on the onset
of asphaltenes precipitation. Another important interest in this work is to specify which new
functional group in CO2-reacted asphaltene has a direct impact on its instability.

17
CHAPTER II
EXPERIMENTAL METHODOLOGY*
The objective of experimental work is evaluating the probability of asphaltene structural
changes due to carbon dioxide injection and understanding how these changes affect asphaltene
stability in the crude oil system. These will be experimentally conducted by fourier transform
infrared and ultraviolet-visible spectroscopy.
Materials
Four different light, medium, and heavy crude oils from different regions (A from China,
B from the Gulf of Mexico, C from Alaska, and D from west Texas) were studied in the present
work. Normal heptane (≥99 wt.%, HPLC Grade), and toluene (99.8 wt.%, HPLC Grade) from Alfa
Aesar were used as an asphaltenes precipitant and solvent, respectively. 1,4-
diazabicyclo[2.2.2]octane (DABCO) base was obtained from Alfa Aesar with 98% purity. The
function of this base is collapsing the H-bonded ion pair that existed in the asphaltenes structure.
In other words, it can capture asphaltenes acidic hydrogens. The structure of this base is shown in
Figure 2. Hydrochloric acid will be used to determine the functional group generated by carbon
dioxide in the identification test. It was obtained from Macron and was titrated against a 1N sodium
* Part of this chapter is reprinted with permission from “Asphaltene Structural Changes Induced by Carbon Dioxide
Injection” by Golshahi, N., Afra, A., Samouei, H., Nasr-El-Din, H. 2019 OTC Offshore Technology Conference
Brasil, OTC-29730-MS. Copyright 2019, Offshore Technology Conference.

18
hydroxide solution and found to have a concentration of 36.8 wt.%. Acetone (Semiconductor
Grade, 99.5%) will also be used for resin separation from Alfa Aesar.
Figure 2. Chemical Structure of the DABCO Base.
SARA Analysis
SARA analysis experiment was conducted to determine the composition of oil samples
based on their solubility in solvents of diverse polarity and affinity for absorption to solid granular
packing columns such as silica gel, alumina, and natural clays. In this method, the oil samples are
classified into saturates, aromatics, resins, and asphaltenes based on the American Society for
Testing and Materials (ASTM) standard D2007-11. Figure 3 shows the SARA analysis separation.
Asphaltenes from four different crude oils were precipitated by adding n-heptane in a ratio of 1:40
oil to n-heptane (Goual and Firoozabadi 2002). n-Heptane is chosen to preserve the light fractions
of oil. The beaker containing mixtures of n-heptane and crude oils were stirred for 12 hours at
86°F on hotplate stirrer for n-heptane evaporation. The mixture was poured into a flask through a
funnel with a filter paper. Then, they were allowed to rest for 2 hours. This process caused the
precipitation of aggregation particles of asphaltenes that were left in filter paper. After vacuum
filtration and air drying, the asphaltenes were collected and weighted.

19
Figure 3. SARA Analysis Separation.
After asphaltene precipitation, the fraction that remains dissolved named maltenes. The
adsorption columns needed for separating the saturates, aromatics and resins from maltenes. The
maltenes passed through the clay-packed column and an activated silica-gel column, to adsorb
resins and aromatics, respectively. For resins separation, a 50-50 volume mixture of toluene-
acetone is charged through the column. The solution is passed through a filter paper and collected
in a flask. n-Heptane is used to wash the funnel and filter paper and remove traces of the oil sample.
The solution is evaporated at 86°F in a hotplate stirrer to remove the toluene, acetone, and n-
heptane. Therefore, the resin is collected and weighted. For aromatics determination, Soxhlet
extraction of the silica gel in toluene is utilized for recovering the aromatics fraction. Saturate is
the remaining part and it is the last component of SARA analysis. The scheme of the SARA
separation method is illustrated in Figure 4 (Rakhmatullin et al. 2018).
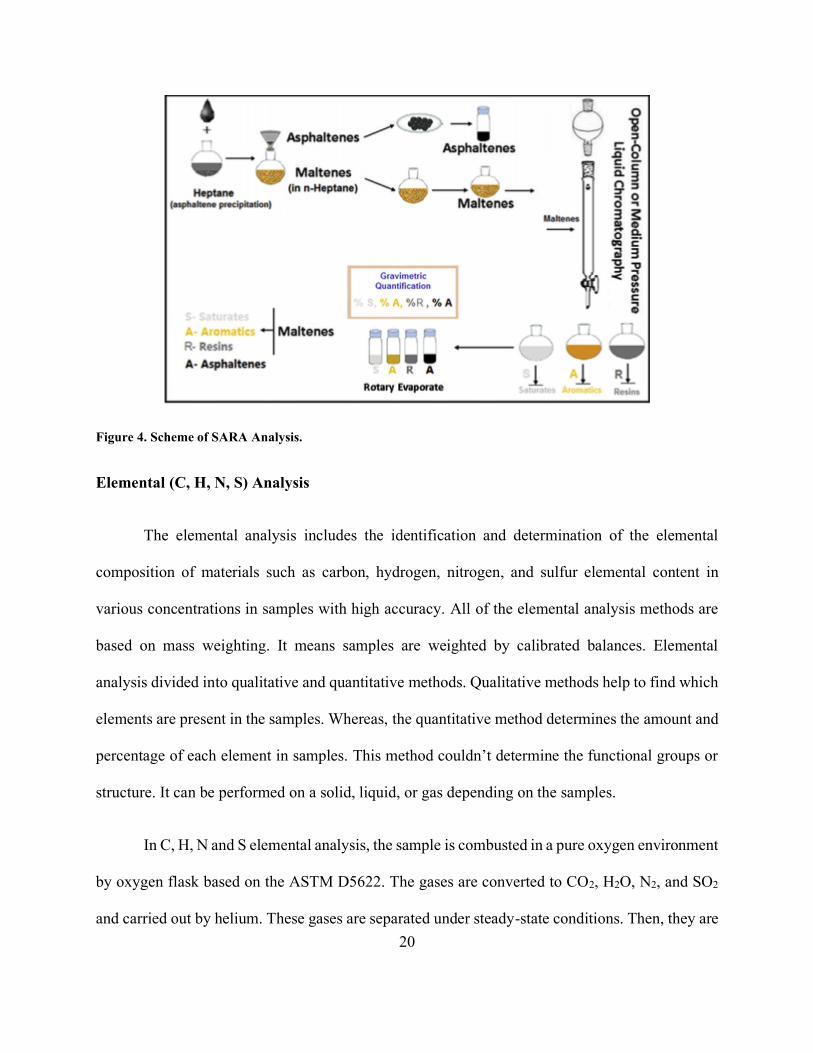
20
Figure 4. Scheme of SARA Analysis.
Elemental (C, H, N, S) Analysis
The elemental analysis includes the identification and determination of the elemental
composition of materials such as carbon, hydrogen, nitrogen, and sulfur elemental content in
various concentrations in samples with high accuracy. All of the elemental analysis methods are
based on mass weighting. It means samples are weighted by calibrated balances. Elemental
analysis divided into qualitative and quantitative methods. Qualitative methods help to find which
elements are present in the samples. Whereas, the quantitative method determines the amount and
percentage of each element in samples. This method couldn’t determine the functional groups or
structure. It can be performed on a solid, liquid, or gas depending on the samples.
In C, H, N and S elemental analysis, the sample is combusted in a pure oxygen environment
by oxygen flask based on the ASTM D5622. The gases are converted to CO2, H2O, N2, and SO2
and carried out by helium. These gases are separated under steady-state conditions. Then, they are
21
detected by Infrared Spectroscopy (IR). Based on ASTM D5622, to find the organic oxygen
percentage the sample is pyrolyzed. After the filtration of acid gases, the IR spectroscopy is used
for organic oxygen detection. Furthermore, ion chromatography is used for the determination of
halogen percentages (F, Cl, Br and I%). Oxygen flask combustion converts the halogens of
samples to their ionic forms, such as bromide and chloride. After dilution and filtration, the
percentages are calculated.
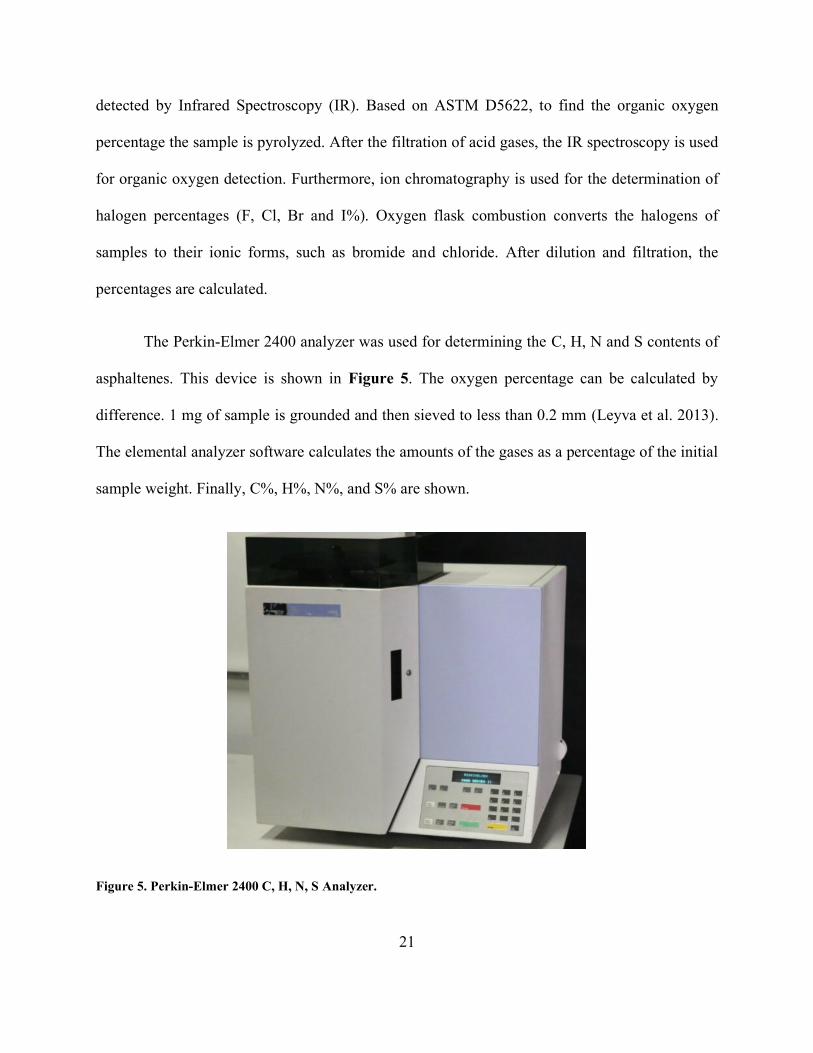
The Perkin-Elmer 2400 analyzer was used for determining the C, H, N and S contents of
asphaltenes. This device is shown in Figure 5. The oxygen percentage can be calculated by
difference. 1 mg of sample is grounded and then sieved to less than 0.2 mm (Leyva et al. 2013).
The elemental analyzer software calculates the amounts of the gases as a percentage of the initial
sample weight. Finally, C%, H%, N%, and S% are shown.
Figure 5. Perkin-Elmer 2400 C, H, N, S Analyzer.

22
X-ray Fluorescence (XRF)
The X-ray can be defined as electromagnetic waves with their wavelengths, or beams of
photons with their energies. When X-rays contact the matter, three main interactions would
happen: Fluorescence, Compton scatters and Rayleigh scatters (Brouwer 2006). These interactions
are shown in Figure 6. A fraction of the beam of X-ray photons can be adsorbed and produced
fluorescent radiation or scattered. Scattering with a loss of energy is Compton scatter. On the other
hand, Rayleigh scatter is the one without loss of energy. The scatter or fluorescence depends on
density (), thickness (d), the composition of the material, and energy of the X-rays.
Figure 6. Three Main Interactions of X-Rays with Matter.
X-ray Fluorescence (XRF) is one of the broad application elemental analysis techniques in
science and industry. Since, it is the nondestructive elemental analysis method for solids and
liquids, powders, and other forms. This method is fast, easy, accurate and requires a minimum of
23
sample preparation. The analysis time varies between seconds and 30 minutes based on the number
of elements. The analysis time after the measurement is only a few seconds.
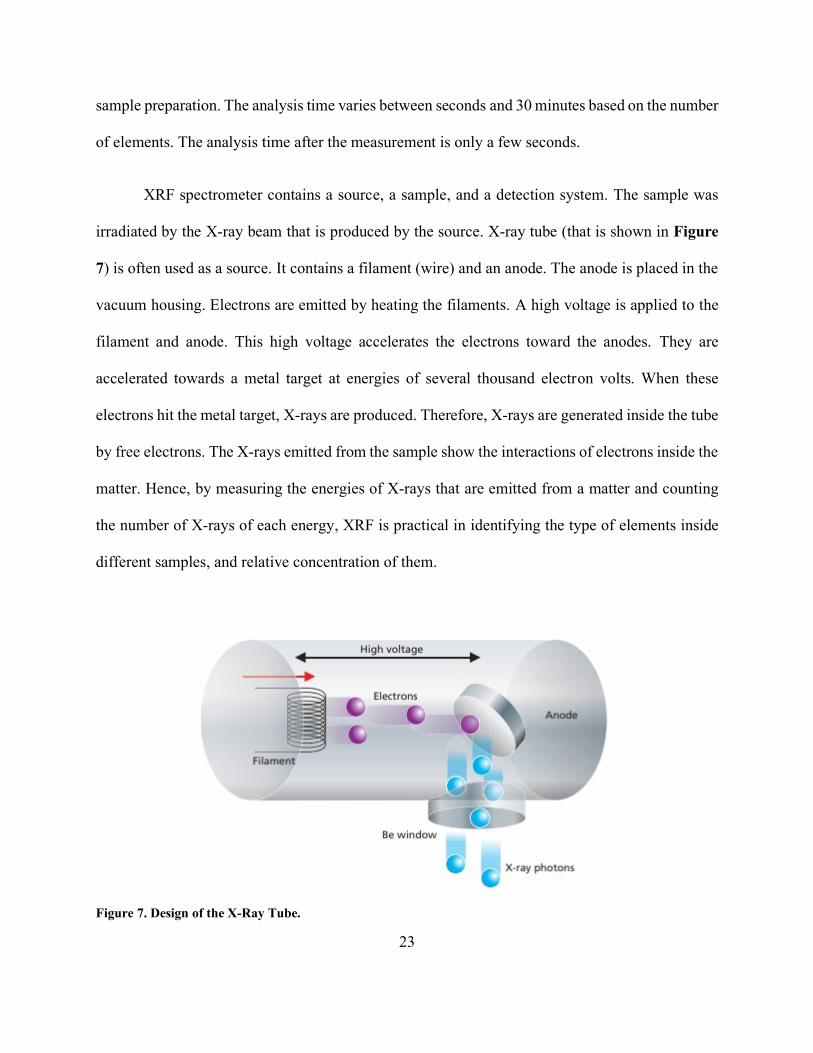
XRF spectrometer contains a source, a sample, and a detection system. The sample was
irradiated by the X-ray beam that is produced by the source. X-ray tube (that is shown in Figure
7) is often used as a source. It contains a filament (wire) and an anode. The anode is placed in the
vacuum housing. Electrons are emitted by heating the filaments. A high voltage is applied to the
filament and anode. This high voltage accelerates the electrons toward the anodes. They are
accelerated towards a metal target at energies of several thousand electron volts. When these
electrons hit the metal target, X-rays are produced. Therefore, X-rays are generated inside the tube
by free electrons. The X-rays emitted from the sample show the interactions of electrons inside the
matter. Hence, by measuring the energies of X-rays that are emitted from a matter and counting
the number of X-rays of each energy, XRF is practical in identifying the type of elements inside
different samples, and relative concentration of them.
Figure 7. Design of the X-Ray Tube.

24
The emitted X-rays can be detected by using energy or wavelength dispersive detector.
Therefore, the elements present in the sample are detected by the energies or wavelengths of the
emitted X-rays and their concentrations are determined by the intensity of the X-rays. Generally,
spectrometers are divided into energy dispersive systems (EDXRF) and wavelength dispersive
systems (WDXRF). Detectors of EDXRF measure the energies of radiation that is emitted from
the sample. Then, the radiation from the sample is separated into the radiations from the elements
inside the sample. This separation is called dispersion. Solid-state detectors are mainly used in
EDXRF. This wide range of detectors measures all elements from sodium (Na) to uranium (U). In
WDXRF spectrometers, the analyzing crystal is used to disperse the different energies of radiation
that is coming from the sample. The detectors used in this spectrometer are gas-filled detectors
that measure elements from beryllium (Be) up to copper (Cu), and scintillation detectors that
quantify elements from Cu up to U. The resolution of these two detectors are poor. So, they are
suitable for wavelength dispersive spectrometers in which the resolution is enhanced by the crystal.
Since XRF is a sensitive technique, the samples should be completely clean without the
sign of fingerprint. The sample is placed in a cup, and the cup is placed in the spectrometer. Most
XRF spectrometers are designed to measure samples with a radius between 5 and 50 mm. It is
required to clean and polish the solid samples. Liquids are poured into cups that contain supporting
films. For obtaining sufficient liquids, diluents should be added. In this experiment, the XRF
analysis was taken from the solution of asphaltenes and toluene for finding the elements and their
concentrations in asphaltenes samples.

25
CO2 Injection
To identify the probable changes in asphaltene structure during CO2 flooding, carbon
dioxide should be injected into model oils. The model oil is the solution of 200 mg of asphaltenes
and 5 ml of toluene. Figure 8 shows the pressurized reactor that was used in this experiment. The
initial pressure of CO2 was 870 psi. Afterward, the pressurized reactor was placed on hot plate
stirrer (752°F) for 3 days. Due to providing the small scale of downstream in petroleum labs, this
T and P were selected. The magnetic stirrer should be used in the reactor for circulating the CO2
and solution constantly. Otherwise, CO2 may place at top of the reactor and don’t have a chemical
reaction with oil. The experiment was repeated for 7 days to determine the effect of CO2 injection
time on asphaltenes structure. Due to the dispersion of the negligible amount of CO2-reacted
asphaltenes, they could not be collected and measured from the reactor entirely after the
experiment. Carbon dioxide (with the same pressure and temperature) was injected into four
different crude oils directly. After running the same experiment, n-heptane was added to these oils
for precipitating the asphaltene, in which the n-heptane volume was 40 times more than the oil
volume.

26
Figure 8. Reactor Used in Experiments.
Fourier Transform Infrared Spectroscopy (FTIR)
FTIR method can help us to characterize the samples, identify unknown materials, and
determine the amount and quality of components in a mixture. The light used in this spectroscopy
is electromagnetic radiation that is composed of electric and magnetic waves called the electric
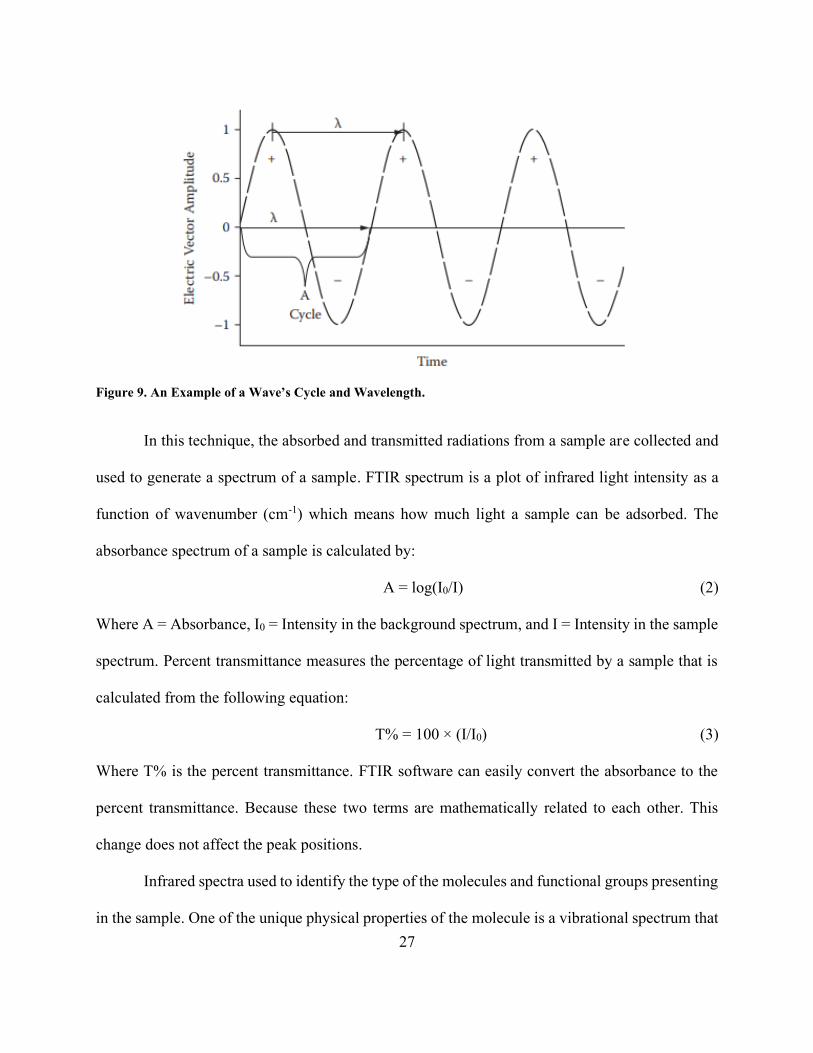
vector and the magnetic vector. These two waves go through the cycle because their motions are
repetitive. One cycle is terminated when a wave has crossed zero amplitude a third time as
illustrated in Figure 9. Wavelength is the distance between two identical adjacent points in a wave.
Another light property is wavenumber that defines by the number of waves in a unit distance.
Wavenumber and wavelength are reciprocals of each other where W is wavenumber and λ is the
wavelength.
W = 1/λ (1)
27
Figure 9. An Example of a Wave’s Cycle and Wavelength.
In this technique, the absorbed and transmitted radiations from a sample are collected and
used to generate a spectrum of a sample. FTIR spectrum is a plot of infrared light intensity as a
function of wavenumber (cm-1) which means how much light a sample can be adsorbed. The
absorbance spectrum of a sample is calculated by:
A = log(I0/I) (2)
Where A = Absorbance, I0 = Intensity in the background spectrum, and I = Intensity in the sample
spectrum. Percent transmittance measures the percentage of light transmitted by a sample that is
calculated from the following equation:
T% = 100 × (I/I0) (3)
Where T% is the percent transmittance. FTIR software can easily convert the absorbance to the
percent transmittance. Because these two terms are mathematically related to each other. This
change does not affect the peak positions.
Infrared spectra used to identify the type of the molecules and functional groups presenting
in the sample. One of the unique physical properties of the molecule is a vibrational spectrum that
28
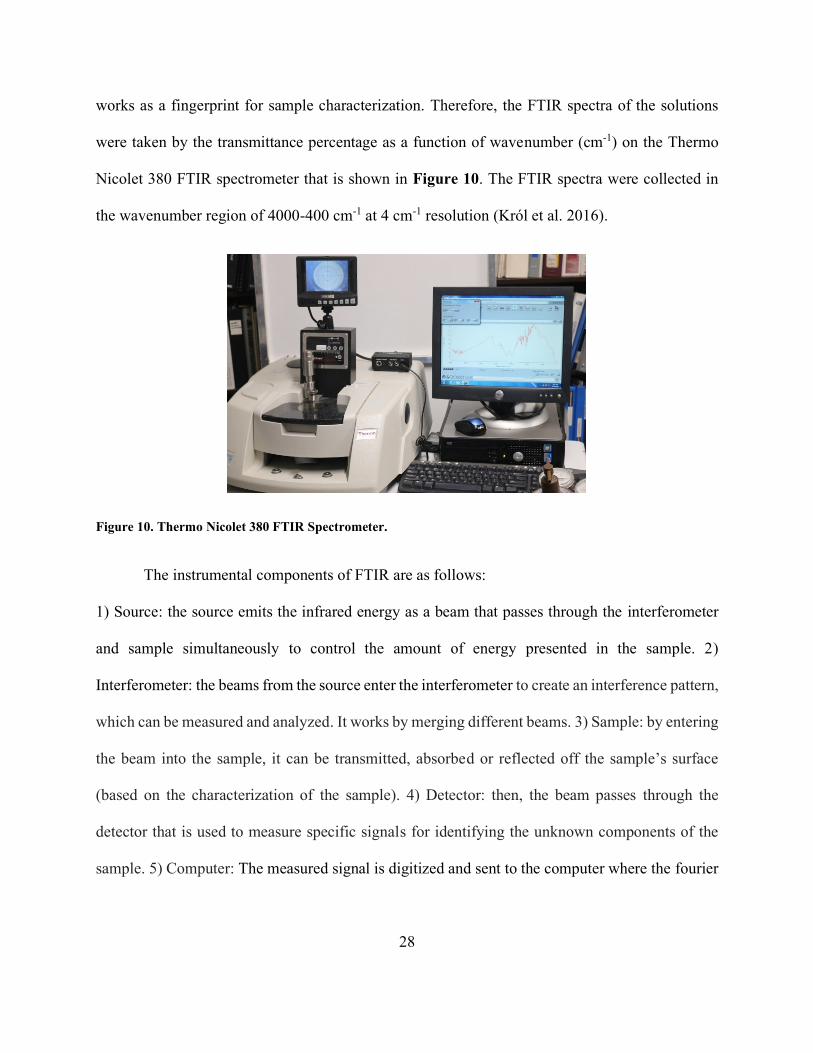
works as a fingerprint for sample characterization. Therefore, the FTIR spectra of the solutions
were taken by the transmittance percentage as a function of wavenumber (cm-1) on the Thermo
Nicolet 380 FTIR spectrometer that is shown in Figure 10. The FTIR spectra were collected in
the wavenumber region of 4000-400 cm-1 at 4 cm-1 resolution (Król et al. 2016).
Figure 10. Thermo Nicolet 380 FTIR Spectrometer.
The instrumental components of FTIR are as follows:
1) Source: the source emits the infrared energy as a beam that passes through the interferometer
and sample simultaneously to control the amount of energy presented in the sample. 2)
Interferometer: the beams from the source enter the interferometer to create an interference pattern,
which can be measured and analyzed. It works by merging different beams. 3) Sample: by entering
the beam into the sample, it can be transmitted, absorbed or reflected off the sample’s surface
(based on the characterization of the sample). 4) Detector: then, the beam passes through the
detector that is used to measure specific signals for identifying the unknown components of the
sample. 5) Computer: The measured signal is digitized and sent to the computer where the fourier

29
transformation takes place. Then, the final spectrum is presented to the user for further
interpretation. Figure 11 shows the components of the FTIR spectrometer.
Figure 11. Components of the FTIR Spectrometer.
The FTIR method has some advantages over the previous methods such as its speed and
sensitivity. All the signals are measured simultaneously and running the FTIR test on a sample
takes less than a minute. Furthermore, FTIR is a very sensitive method. Because the detectors used
have high sensitivity. Hence, the results have much lower noise levels compared to the previous
methods. For avoiding the probable noises, the background spectrum must be measured when there
is no sample in the beam. Another advantage of FTIR is internally calibrated. It means that the
instrument is self-calibrating and never needs to be calibrated by the user.
Samples may be in liquid, solid or gaseous form. In this experiment, to obtain high
precision dried solid samples of asphaltenes were used. In this spectrometer, the analysis area can
30
be as small as 10 µm. The FTIR results of asphaltenes were compared before and after CO2
injection to identify the possible changes in its structure by carbon dioxide.
Identification Tests
To determine and characterize the functional groups generated by carbon dioxide and their
formation mechanism, two identification tests were conducted. The first test consisted of mixing
100 mg of DABCO with 200 mg of asphaltenes that were diluted in 3.5 ml toluene. Then, the
solution was pressurized with CO2 at 752°F for 2 days and its FTIR spectrum was collected. In
addition, the same experiment was repeated for the solution of 7 g of oil and 100 mg of DABCO
base as a control experiment. Next, its asphaltene was precipitated by n-heptane. Most of the
common bases can react with CO2 and generate new functional groups, however, the DABCO
base that is selected for this experiment does not have any chemical reaction with CO2. The
function of this base is collapsing the H-bonded ion pair that existed in the asphaltenes structure
(Cecchi et al. 2006). In other words, it can capture asphaltenes acidic hydrogens. This experiment
is conducted to identify the existence of any hydroxyl groups in CO2-reacted asphaltenes and to
determine the functional group that detected the carbonyl group belongs to.
Analysis of asphaltenes structural changes can be done by the hydrolysis and degradation
reaction of the amide group in the presence of HCl that is shown in Figure 12 (O’Connor 1970).
This reaction shows that the amide hydrolysis generates carboxylic acid and amine groups.
Therefore, the second identification test was done by mixing 100 mg of CO2-reacted asphaltenes
with 5 ml of hydrochloric acid and 2 ml of water. Then, the solution was heated for 30 min at
140°F. After drying, the FTIR spectrum of this sample was taken.

31
Figure 12. Reaction of the Amide with Water in the Presence of Hydrochloric Acid for Producing a Carboxylic
Acid.
Control Test
To examine whether the changes in the structure of asphaltenes were due to carbon dioxide
injection, nitrogen gas (870 psi) was also injected to the solution of 200 mg asphaltenes and 5 ml
toluene. The solution containing N2 gas was stirred at 752°F for 7 days. Then, the FTIR test was
taken from these asphaltenes. Since N2 gas is neutral and doesn’t have any chemical reaction with
the crude oil, it was selected for this control experiment.
UV-Visible Spectroscopy
Several different processes can occur when radiation interacts with the surface. They can
be the reflection, scattering, absorbance, fluorescence and photochemical reaction (absorbance and
bond breaking). The absorbance is just considered in UV-Visible spectra. The absorbance of light
by a compound can increase the energy level of molecules. Because light is a form of energy. The
total potential energy of a molecule equals the summation of electronic, vibrational, rotational and
translational energies.
𝐸𝑡𝑜𝑡𝑎𝑙 = 𝐸𝑒𝑙𝑒𝑐𝑡𝑟𝑜𝑛𝑖𝑐 + 𝐸𝑣𝑖𝑏𝑟𝑎𝑡𝑖𝑜𝑛𝑎𝑙 + 𝐸𝑟𝑜𝑡𝑎𝑡𝑖𝑜𝑛𝑎𝑙 + 𝐸𝑡𝑟𝑎𝑛𝑠𝑙𝑎𝑡𝑖𝑜𝑛𝑎𝑙 (4)

32
Translational energy relates to the displacement of molecules in space as a function of the thermal
motions of matter but the rotational energy refers to the tumbling motion of a molecule as a result
of the absorption of energy within the microwave region. Furthermore, the vibrational energy
relates to the absorption of energy by a molecule that is vibrated about the mean center of their
chemical bonds. Eventually, electronic energy is the transition energy of electrons when they are
distributed throughout the molecule. It may happen in some molecules and atoms that the photons
of UV and visible light have enough energy to cause transitions between the different electronic
energy levels. This energy is enough to move an electron from a lower energy level to a higher
energy level.
A spectrophotometer is an instrument for measuring the transmittance or absorbance of a
sample as a function of the wavelength of radiation. The components of a spectrophotometer are
a source, dispersion device, sample, detector, lenses, and mirrors. Two sources are used in UV-
Vis spectrophotometers including deuterium arc lamp and tungsten-halogen lamp. The deuterium
arc lamp yields good intensity in the visible region with very low noise. The intensity of light
decreases steadily in time. The tungsten-halogen lamp provides a useful intensity over part of the
UV spectrum. It has a very low noise like the other lamp. Finally, the light from two sources is
mixed to make a broad single source. The dispersion devices are used to disperse the light from
different angles. Prisms and holographic gratings are the two common dispersion devices in UV-
Vis spectrophotometers. Prisms are inexpensive dispersion device that generates rainbow from
sunlight. But the dispersion angle is sensitive to temperature. Therefore, the recent
spectrophotometers contain holographic gratings instead of prisms. These are made of glass blanks
with an aluminum coating to reflect the light at diverse angles. A detector converts a light signal

33
to an electrical one. The response should be linear with high sensitivity and low noise. Detectors
used in UV-Visible spectrophotometer are photomultiplier tube detector or a photodiode detector.
The photomultiplier tube contains cathode and anode part that combines signal conversion with
several stages of amplification. This detector provides high sensitivity at a low level of light while
the ideal detector must have low noise at high-intensity levels to distinguish the small differences
between the blank and sample measurements. Thus, the photodiode detector is recently used as a
detector. It has a litter wide dynamic range. In this detector, when light falls on the material, it
allows an electron to flow in it and depletes the charge in a capacitor. The amount of charge for
recharging the capacitor is proportional to the light intensity. In some modern spectrophotometers,
an array of photodiode detectors is used instead of one.
The cells that are used in the UV-Vis spectrometer, must be transparent at all wavelengths.
Fused quartz cells should be beneficial up to 210 nm and fused synthetic silica cells are transparent
down to 190 nm. The ideal solvent for sample preparation would dissolve all kinds of compounds
and be transparent to all wavelengths.
Only a few broad absorbance bands are seen in UV-Vis spectra. Therefore, it can provide
a limited amount of qualitative analysis results compared with the FTIR spectra and they are not
able to identify the unknown compounds. But they are used to confirm the identity of a matter by
comparing the measured spectrum with a reference one.
Asphaltenes Precipitation Onset Point
Stabilities of asphaltenes samples were evaluated through the measuring of precipitation
onset point following the method proposed by Tavakkoli et al. (2015). The toluene was added to

34
the proper amount of asphaltenes to prepare the 0.5 wt.% model oil. To avoid any undissolved
sediment particles in the mixture, the solution was stirred continuously for 30 minutes at 180°F
and then sonicating it for 15 minutes at 50 kHz. After centrifugation, no undissolved particles were
observed. The 0.5 wt.% was selected for a concentration of model oil to represent a low asphaltene
concentration and avoid asphaltene deposition problems. Therefore, it is arbitrary. Then n-heptane
was added at the rate of 1 ml/min in the concentration range of 10 to 90 vol% to induce asphaltenes
precipitation. So, samples containing different ratios of model oil and n-heptane were prepared.
The test tubes were shaken by hand and placed on the untouched surface for a couple of minutes.
Next, the test tubes were centrifuged for 2 hours at 10,000 rpm to remove the unstable asphaltene
particles. 1 ml of the supernatant of each solution was taken and diluted with 4 ml of toluene. Then,
the absorbance of samples as a function of wavelength was measured by the Shimadzu UV 2501PC
spectrophotometer that is shown in Figure 13.
Figure 13. Shimadzu UV 2501PC Spectrophotometer.

35
The dilution effect should be removed from the measured absorbance and the plot of
absorbance vs n-heptane volume fraction was obtained. The sharp deviation of the linear line of
the plot shows the onset point of asphaltene precipitation. This experiment was conducted to
identify the relation of asphaltene structural changes by CO2 flooding and its stability alteration.
To better identify the onset point, the absorbance at 350 nm was plotted as a function of n-
heptane vol%. Because the changes in absorbance of samples at 350 nm were greater compared to
the other wavelengths. So, 350 nm was selected. But, the absorbance at different wavelengths can
be selected and this method works for any wavelengths.

36
CHAPTER III
RESULTS AND DISCUSSION†
Oil Characterization
SARA Analysis
Table 1 shows the SARA fractions of four tested crude oils. Various types of crude oils in
terms of asphaltenes fraction and API gravity were investigated in the present study using the
ASTM D2007-11. Also, these samples are different regarding asphaltenes associated problems
and its percentage in the oil. For instance, although sample D has the lowest amount of asphaltenes,
it has severe asphaltenes precipitation and deposition problems during production (Afra et al.
2017). There is not a logical correlation between the asphaltenes amount and its problem severity
in the oil and gas industry.
Table 1. Oil Samples Characterization.
Oil Sample Type Saturates
(wt.%)
Aromatics
(wt.%)
Resins
(wt.%)
Asphaltenes
(wt.%)
A Heavy 31 26 15.7 27.3
B Heavy 20.6 24.5 19.1 35.8
C Medium 43 30 11 16
D Light 48 43 5 4
† Part of this chapter is reprinted with permission from “Asphaltene Structural Changes Induced by Carbon Dioxide
Injection” by Golshahi, N., Afra, A., Samouei, H., Nasr-El-Din, H. 2019 OTC Offshore Technology Conference
Brasil, OTC-29730-MS. Copyright 2019, Offshore Technology Conference.
37
Asphaltenes Characterization
Elemental (C, H, N, S) Analysis
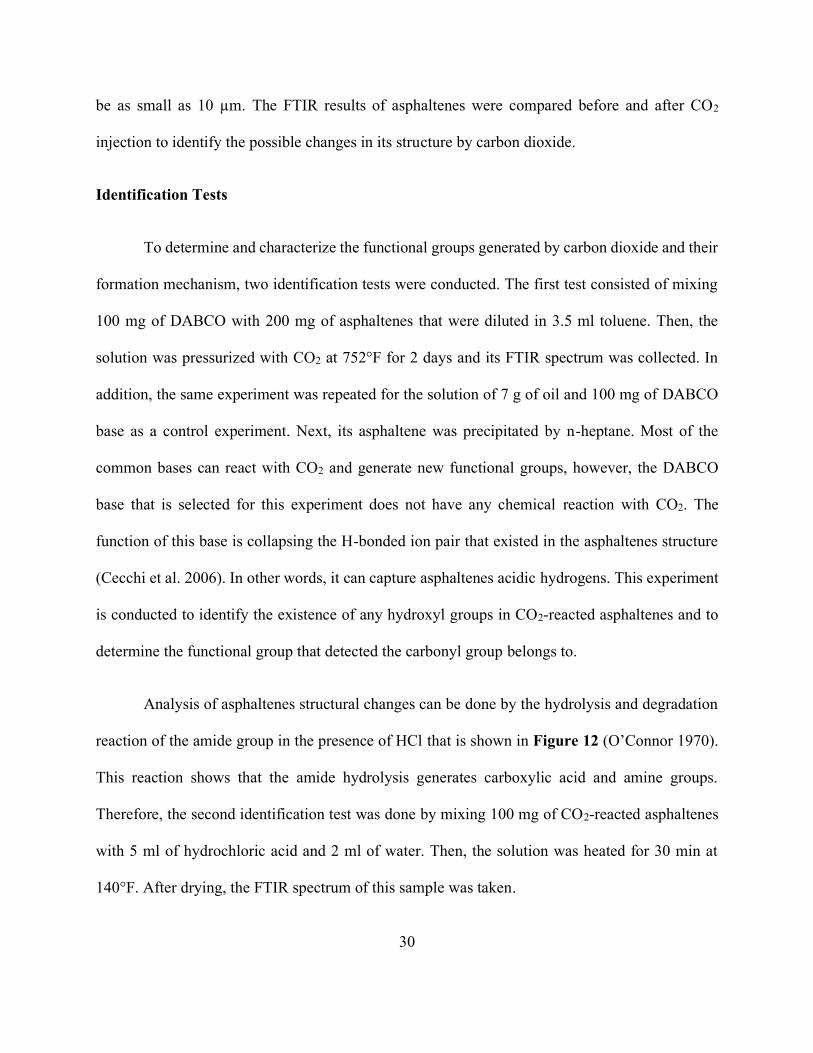
Table 2 presents the elemental analysis results of asphaltenes. The hydrogen to carbon
ratio (H/C) was used to find the level of asphaltenes aromaticity. The higher H/C ratio represents
the lower aromaticity (Marcano et al. 2011).
Table 2. Elemental Analysis of Asphaltenes.
Asphaltene A B
Carbon (wt.%) 87.48 82.03
Hydrogen (wt.%) 7.50 7.87
Nitrogen (wt.%) 1.32 0.68
Sulfur (wt.%) 2.77 2.24
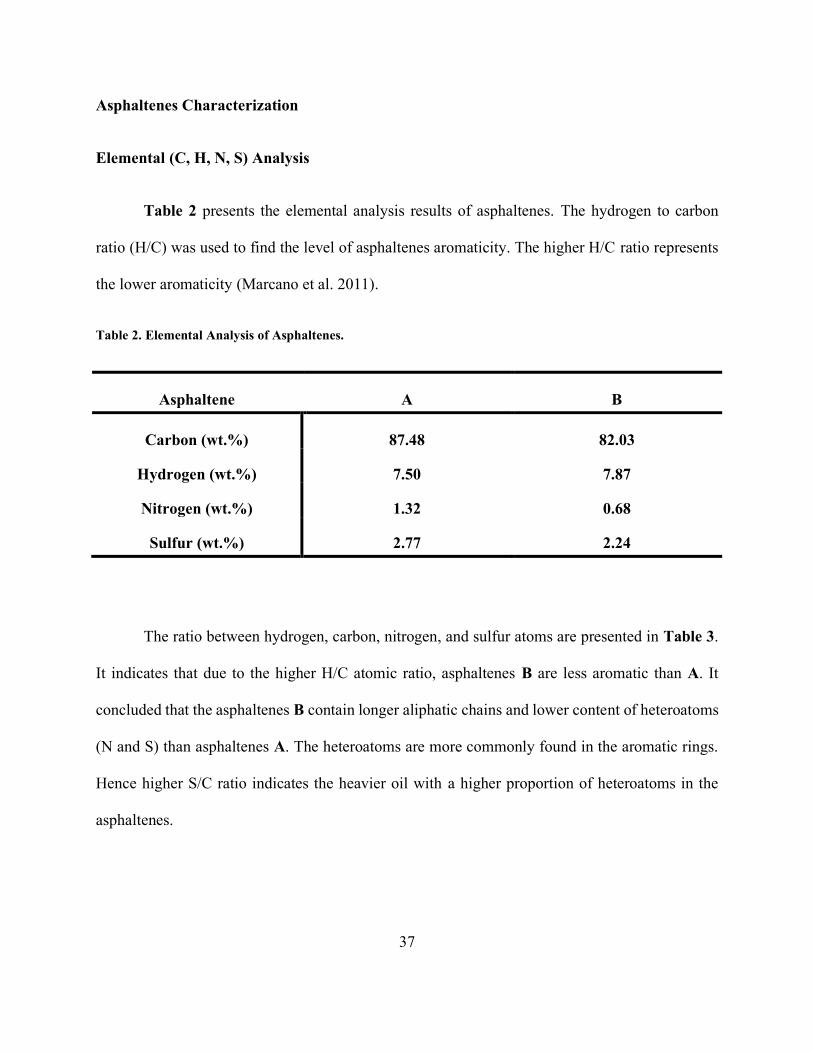
The ratio between hydrogen, carbon, nitrogen, and sulfur atoms are presented in Table 3.
It indicates that due to the higher H/C atomic ratio, asphaltenes B are less aromatic than A. It
concluded that the asphaltenes B contain longer aliphatic chains and lower content of heteroatoms
(N and S) than asphaltenes A. The heteroatoms are more commonly found in the aromatic rings.
Hence higher S/C ratio indicates the heavier oil with a higher proportion of heteroatoms in the
asphaltenes.
38
Table 3. Atomic Ratios of Asphaltenes.
Asphaltene A B
H/C 0.086 0.096
S/C 0.032 0.027
N/C 0.015 0.0082
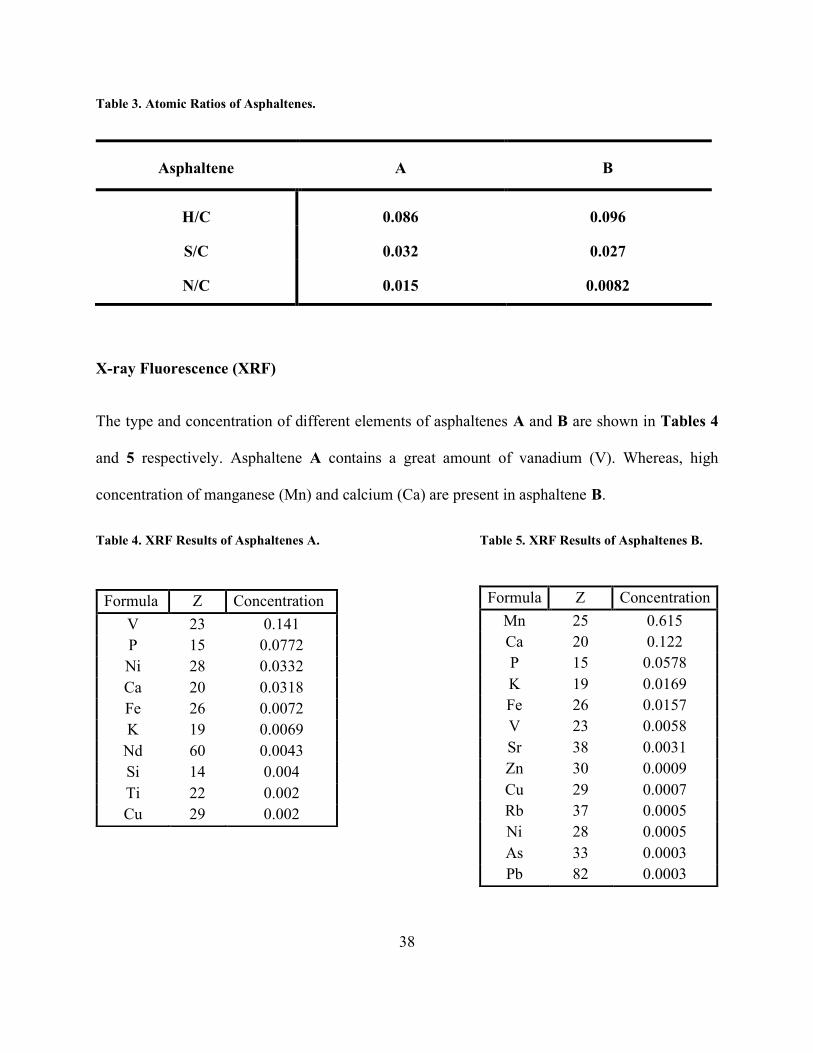
X-ray Fluorescence (XRF)
The type and concentration of different elements of asphaltenes A and B are shown in Tables 4
and 5 respectively. Asphaltene A contains a great amount of vanadium (V). Whereas, high
concentration of manganese (Mn) and calcium (Ca) are present in asphaltene B.
Table 4. XRF Results of Asphaltenes A. Table 5. XRF Results of Asphaltenes B.
Formula Z Concentration
V 23 0.141
P 15 0.0772
Ni 28 0.0332
Ca 20 0.0318
Fe 26 0.0072
K 19 0.0069
Nd 60 0.0043
Si 14 0.004
Ti 22 0.002
Cu 29 0.002
Formula Z Concentration
Mn 25 0.615
Ca 20 0.122
P 15 0.0578
K 19 0.0169
Fe 26 0.0157
V 23 0.0058
Sr 38 0.0031
Zn 30 0.0009
Cu 29 0.0007
Rb 37 0.0005
Ni 28 0.0005
As 33 0.0003
Pb 82 0.0003

39
Effect of CO2 Injection on Asphaltenes FTIR Spectra
FTIR spectroscopy was conducted to investigate the existence of a correlation between
asphaltenes functional groups and their properties such as solubility and stability. To do so, the
FTIR spectrums of asphaltenes samples before and after reaction with CO2 were compared to
detect the differences in the intensity and type of functional groups. Figure 14 shows the FTIR
spectrums of asphaltenes A.
Figure 14. FTIR Spectra of (A) the Asphaltenes A in Which CO2 Was Injected to the Asphaltenes for 3 Days,
(B) the Asphaltenes That Were Precipitated from Crude Oil A in Which CO2 Was Injected to the Oil for 7
Days, and (C) the Asphaltenes A without CO2 Injection.
Two peaks of 1600 and 1475 cm-1 are indicating the C=C aromatic bonds. The peaks indicating
the CH stretching and bending are located at 2800-2990 cm-1 and 1405 cm-1 respectively. In
addition, the FTIR spectrum in the region of 2800-3000 cm-1 is representative of the carbon-

40
hydrogen stretching vibrations. These results also stipulated that after a reaction time of 3 days, a
new peak at 1690 cm-1 was formed in the presence of CO2. The band at around 1700 cm-1 can be
attributed to the carbon-oxygen double bond (Pavia et al. 2008). Therefore, this peak could be
associated with different carbonyl functional groups. Further experimental results on the
characterization of this functional group will be discussed later in the thesis. These results prove
that carbon dioxide can react with asphaltenes A and produce a new functional group.
To understand the influences of a duration of the CO2 reaction experiments on the
asphaltenes compositional change, carbon dioxide was injected into the solution of asphaltenes A
and toluene for 3 and 7 days and their FTIR spectrums were collected (Figure 15).
Figure 15. FTIR Spectra of the Asphaltenes A in Which CO2 Was Injected to the Asphaltenes for (A) 7 Days
and (B) 3 Days.
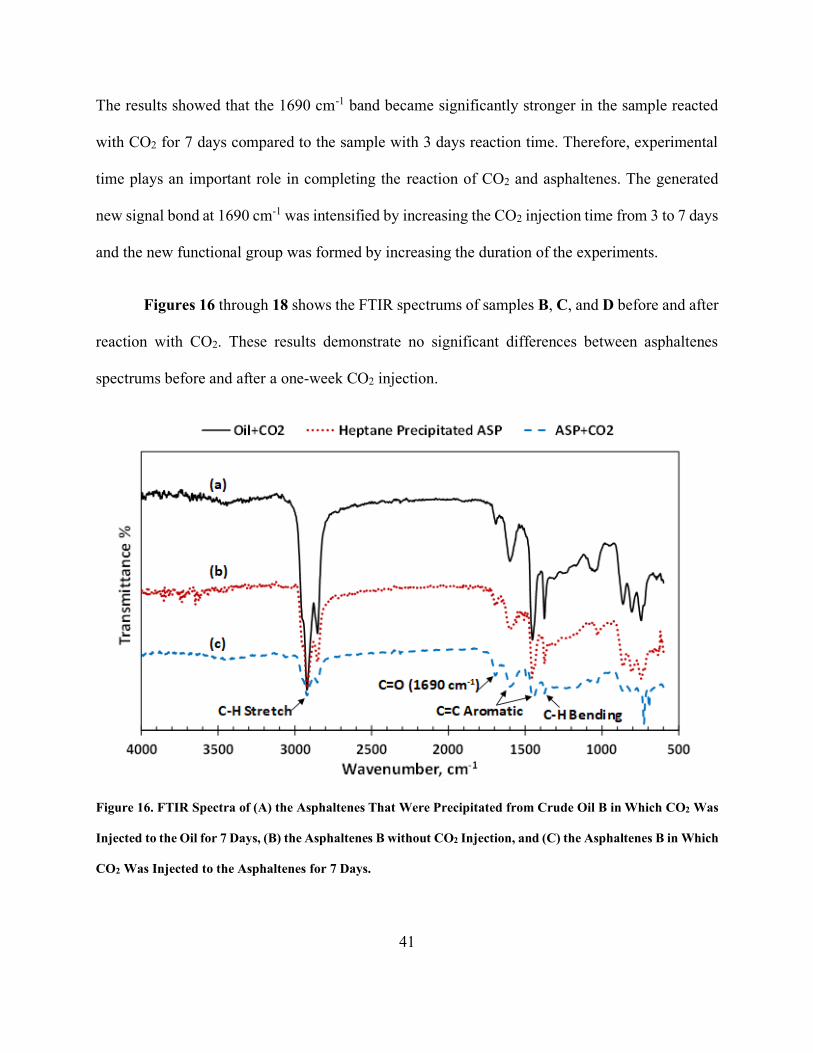
41
The results showed that the 1690 cm-1 band became significantly stronger in the sample reacted
with CO2 for 7 days compared to the sample with 3 days reaction time. Therefore, experimental
time plays an important role in completing the reaction of CO2 and asphaltenes. The generated
new signal bond at 1690 cm-1 was intensified by increasing the CO2 injection time from 3 to 7 days
and the new functional group was formed by increasing the duration of the experiments.
Figures 16 through 18 shows the FTIR spectrums of samples B, C, and D before and after
reaction with CO2. These results demonstrate no significant differences between asphaltenes
spectrums before and after a one-week CO2 injection.
Figure 16. FTIR Spectra of (A) the Asphaltenes That Were Precipitated from Crude Oil B in Which CO2 Was
Injected to the Oil for 7 Days, (B) the Asphaltenes B without CO2 Injection, and (C) the Asphaltenes B in Which
CO2 Was Injected to the Asphaltenes for 7 Days.

42
Figure 17. FTIR Spectra of (A) the Asphaltenes C without CO2 Injection, (B) the Asphaltenes That Were
Precipitated from Crude Oil C in Which CO2 Was Injected to the Oil for 7 Days, and (C) the Asphaltenes C in
Which CO2 Was Injected to the Asphaltenes for 7 Days.
These results also indicate that the peak at 1690 cm-1 was observed in both pure and CO2-
reacted asphaltenes samples. Thus, CO2 may not have any significant chemical reaction with these
asphaltenes samples or not detectable by the FTIR spectrums. It is worth mentioning that the FTIR
spectra of tested oil samples were not altered significantly after the addition of CO2 which is
indicative of the fact that asphaltene is the only portion of the crude oil that may participate in a
chemical reaction with CO2.

43
Figure 18. FTIR Spectra of (A) the Asphaltenes D without CO2 Injection, (B) the Asphaltenes That Were
Precipitated from Crude Oil D in Which CO2 Was Injected to the Oil for 7 Days, and (C) the Asphaltenes D in
Which CO2 Was Injected to the Asphaltenes for 7 Days.
Characterizing the Functional Group Formed by CO2 Injection
To identify the primary functional groups in asphaltenes A that reacted with CO2 and
resulted in the formation of a detected carbonyl functional group, several identification tests were
carried out. Most of the common bases can react with CO2 and generate new functional groups,
however, the DABCO base that is selected for this experiment does not have any chemical reaction
with CO2. The function of this base (same as the other bases) is collapsing the H-bonded ion pair
that existed in the asphaltenes structure (Cecchi et al. 2006). In other words, it can capture
asphaltenes acidic hydrogens. This experiment is conducted to identify the existence of any
hydroxyl groups, such as alcohols or phenols, in CO2-reacted asphaltenes and to determine the
functional group that detected the carbonyl group belongs to.
44
The base was added to the solution of asphaltenes and toluene, then CO2 was injected into
the solution and reacted for 3 days. Figure 19 shows the FTIR spectrums of CO2-reacted
asphaltenes A in the absence and presence of DABCO. No significant differences between these
two spectra were observed. Therefore, asphaltenes A that was reacted by CO2 may not contain any
acidic hydrogen groups such as, alcohol, and carboxylic acid functional groups. These
observations are indicating that the generated carbonyl group belongs to either amide or aldehyde
functional groups (McMurry et al. 2010). On the other hand, aldehyde can only be formed from
the reaction of CO2 with alcohol or phenol compounds. As a result, since we previously showed
that the asphaltenes sample does not consist of any alcohol, the only functional group that can be
assigned to the generated carbonyl bond is the amide functional group.
Due to the generation of aldehydes from alcohol groups, the CO2-reacted asphaltenes A
could not have aldehydes too. In this experiment, the concentration of the solution of CO2-reacted
asphaltenes A and DABCO base was 30% more than the solution without the base. Consequently,
the peak of 1690 cm-1 related to the first solution is more intensified compared to the one without
the base as seen in Figure 19.

45
Figure 19. FTIR Spectra of the Asphaltenes A in Which CO2 Was Injected to the Asphaltenes (A) without
DABCO Base and (B) with DABCO Base.
To further investigate the system, another identification test was conducted using
hydrochloric acid. CO2-reacted asphaltene was mixed with HCl for 30 min at 140°F. Then the
solution was dried and its FTIR spectrum was collected. Figure 20 shows the FTIR spectrums of
CO2-reacted asphaltenes before and after the addition of HCl. Two significant dissimilarities can
be observed in the FTIR spectrums: first, the carbonyl peak at 1690 cm-1 (which was generated
after the reaction of asphaltenes with CO2) disappeared and the new peak at 1706 cm-1 was formed
that can be assigned to C=O stretching vibration of the carboxylic acid group; second, a new broad
peak in the region of 3200-3500 cm-1 was generated which can be assigned to N-H stretching
vibrations. Analysis of these changes can be done by looking at the hydrolysis and degradation
reaction of the amide group in the presence of HCl has shown in Figure 12. This reaction shows

46
that the amide hydrolysis generates carboxylic acid and amine groups. The associated FTIR peaks
of these functional groups (1706 and 3200-3500 cm-1 for C=O stretching of carboxylic acid and
N-H band of amine, respectively) are in the same regions of the generated observed peaks in the
FTIR spectrum of CO2-reacted asphaltenes after reaction with HCl. These results are in good
agreement with the first identification tests due to the fact that aldehydes would not hydrolyze in
the presence of HCl. Hence, the coupling of base addition and qualitative test observations prove
the presence of amide in this asphaltene after carbon dioxide flooding.
Figure 20. FTIR Spectra of the Asphaltenes A in Which CO2 Was Injected to the Asphaltenes (A) After the
Qualitative Test and (B) Before the Qualitative Test (HCl Addition).
It is worth noting that in FTIR, the conjugations of C=O groups of amides or carboxylic
acids with aromatics or aliphatic groups shift the wavenumbers of carbonyl groups slightly to the
right. Therefore, as the asphaltene is a complex and conjugated molecule, all wavelengths related

47
to carbonyl functional groups are shifted to the lower wavelengths compared to carbonyl groups
of the simple and unconjugated molecules.
Control Test
As a control test, CO2 was injected to toluene and its FTIR spectrum is compared with
regular toluene to confirm that there is no reaction between solvent and CO2. This is shown in
Figure 21. No change was observed in the FTIR spectrum of toluene after the addition of CO2.
Therefore, carbon dioxide has no chemical reaction with toluene and the observed changes in the
FTIR peaks originated from asphaltenes structural alteration.
Figure 21. FTIR Spectra of Toluene in the Presence and Absence of CO2.
5001000150020002500300035004000
Tran
smit
tan
ce %
Wavenumber, cm-1
Toluene Toluene+CO2
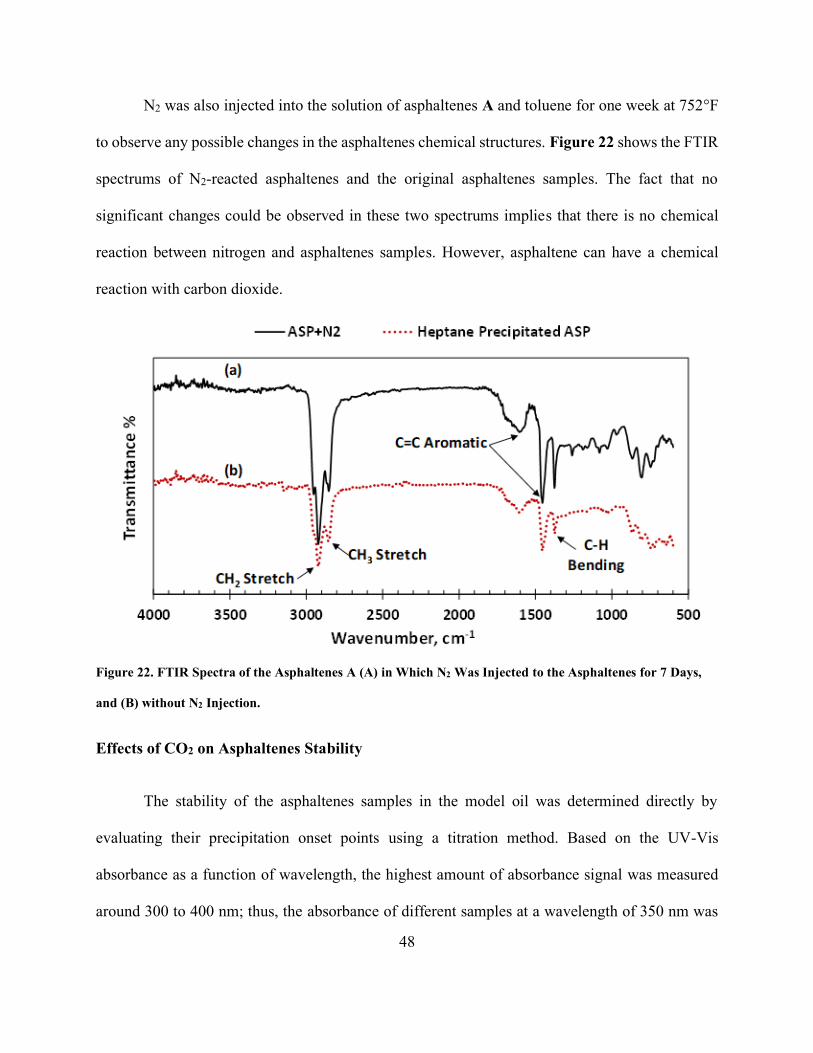
48
N2 was also injected into the solution of asphaltenes A and toluene for one week at 752°F
to observe any possible changes in the asphaltenes chemical structures. Figure 22 shows the FTIR
spectrums of N2-reacted asphaltenes and the original asphaltenes samples. The fact that no
significant changes could be observed in these two spectrums implies that there is no chemical
reaction between nitrogen and asphaltenes samples. However, asphaltene can have a chemical
reaction with carbon dioxide.
Figure 22. FTIR Spectra of the Asphaltenes A (A) in Which N2 Was Injected to the Asphaltenes for 7 Days,
and (B) without N2 Injection.
Effects of CO2 on Asphaltenes Stability
The stability of the asphaltenes samples in the model oil was determined directly by
evaluating their precipitation onset points using a titration method. Based on the UV-Vis
absorbance as a function of wavelength, the highest amount of absorbance signal was measured
around 300 to 400 nm; thus, the absorbance of different samples at a wavelength of 350 nm was
49
plotted as a function of the n-heptane concentration. This method works in any other wavelengths
in the range of 250-1100 nm; however, the highest differences between absorbance values are
observed at 350 nm. The deviation from linearity parallels the onset point of the solution. To
identify the appropriate onset point, the dilution effect should be adjusted. Before dilution effect
elimination, the UV-Vis plot of absorbance as a function of the n-heptane volume percentage is
linear. The samples were diluted two times. First, the model oil was diluted with different volumes
of precipitant (n-heptane). Then, after centrifuge, the 1 ml of samples were diluted with 4 ml
toluene. The dilution does not affect the asphaltenes onset point detection. Tavakkoli et al. (2015)
suggest the method to remove the influence of dilution. The absorbance of fluid becomes
excessively noisy. Hence it is critical to eliminate the dilution effect. To do so, during the sample's
preparation, the mass of each liquid (precipitant and toluene) was measured. The exact volume of
oil is also required. Due to the very low concentration of asphaltene in solution, the density of
model oil is approximately equal to the density of toluene. By having the model oil and n-heptane
volumes (cm3), the dilution ratio of adding n-heptane to oil is calculated:
Dilution ratio for n − heptane addition =(n−C7 volume+Model oil volume)
Model oil volume (5)
Furthermore, for measuring the dilution ratio of 4 ml additional toluene, the toluene volumes are
required. Equation 6 is required for finding the dilution ratio of adding toluene to the 1 ml of
supernatant liquid after centrifuge:
Dilution ratio for toluene addition =(Toluene volume+Supernatant liquid volume)
Supernatant liquid volume (6)

50
The overall dilution ratio for this method is calculated by multiplying the dilution ratio for
n-heptane addition to the dilution ratio of toluene adding to the 1 ml of supernatant liquid after
centrifuge. By multiplying the absorbance values at 350 nm to the overall dilution ratio, the
corrected absorbance is calculated for each sample. Therefore, the dilution effect is removed from
the UV-Vis graph.
Figure 23 shows the absorbance of 1 ml of model oil from asphaltenes A that were diluted
with 4 ml toluene as a function of n-heptane volume%. The sharp decline of absorbance at 44 vol%
of n-heptane indicates the onset point of asphaltenes precipitation. Figure 24 shows the
corresponding results for CO2-reacted asphaltenes A. It can be seen from this plot that the onset
point for the CO2-reacted asphaltenes occurred after the addition of 26 vol% of n-heptane.
Figure 23. Results of the Absorbance at 350 Nm Vs N-Heptane Vol% from UV-Vis Spectroscopy Technique
for Determination of Asphaltene Precipitation Onset Point from Model Oil (Asphaltenes A and Toluene)
Diluted with N-C7.

51
Figure 24. Results of the Absorbance at 350 Nm Vs N-Heptane Vol% from UV-Vis Spectroscopy Technique
for Determination of Asphaltene Precipitation Onset Point from Model Oil (CO2-Reacted Asphaltenes A and
Toluene) Diluted with N-C7.
The differences between the asphaltenes precipitation onset points, prove that carbon
dioxide makes the asphaltene unstable. Therefore, the asphaltenes stability is correlated to its
structure and functional groups. Formation of the amide functional group would result in an
increasing asphaltene molecule's propensity toward forming clusters and aggregating. It
consequently leads to a decrease in precipitation onset point.
The onset point of asphaltenes C and D were not changed after reaction with CO2. As noted
earlier, their chemical structures were not changed by CO2 flooding. However, the onset point of
asphaltene B (the one extracted from heavy crude oil) was changed slightly after reaction with
CO2. Since no significant change was observed in the FTIR spectrum of asphaltene B in the
presence of CO2, the alteration of its stability cannot be related to any significant chemical reaction.

52
As a result, such an observation can be explained by the possible interaction of CO2 with the oil
matrix.

53
CHAPTER IV
CONCLUSIONS
In this research study, several experiments were conducted to better understand the
influences of carbon dioxide on the structure and stability of asphaltenes samples from four crude
oils during the tertiary oil recovery. The differences between the structures and stabilities of n-C7
and CO2 asphaltenes were examined using FTIR and UV-Vis spectroscopy, respectively. Based
on the obtained results, the following conclusions were drawn:
• Asphaltenes are the only portion of crude oil that may have a chemical reaction
with carbon dioxide. However, the chemical reaction of CO2 with diverse
asphaltenes are completely different. There is not a meaningful correlation between
the crude oil composition (SARA) and the asphaltenes structural changes by CO2.
This is attributed to the functional groups of asphaltenes.
• Based on FTIR spectroscopy and acid/base identification tests, the asphaltenes A
contain amine groups and it does not have any hydroxyl groups. After CO2
injection, its chemical structure was changed, and the amide functional group
appeared in the FTIR spectrum.
• The new functional group that was created by CO2 treatment induces the reduction
in onset of asphaltenes precipitation. It was observed that the amide functional
group disturbed and decreased asphaltenes stability as well.
• It was also shown that although asphaltenes B did not react with CO2 chemically,
however, its stability was impaired after exposure to CO2.
54
It can be concluded from these results that depending on the nature of the asphaltenes, its
solubilization or stabilization can be done to prevent asphaltenes associated problems. The main
achievement of this work is using reliable techniques for identifying the new functional groups
after CO2 injection that has a direct influence on asphaltenes instability. Further, these results
stipulate the importance of understanding the nature of asphaltenes destabilization mechanism by
CO2 to use any appropriate chemical methods or inhibitors to prevent asphaltenes related
problems.
55
REFERENCES
Afra, S., Alrashidi, H. G., and Nasr-EL-Din, H. A. 2017. Interrelationship Between
Asphaltene Precipitation Methods and Asphaltene Characteristics and Self-Association
Behavior. Presented at the SPE Latin America and Caribbean Petroleum Engineering
Conference, Buenos Aires, Argentina, 17-19 May. SPE-185542-MS.
https://doi.org/10.2118/185542-MS.
Akmaz, S., Iscan, O., Gurkaynak, M. A. et al. 2011. The structural characterization of saturate,
aromatic, resin, and asphaltene fractions of Batiraman crude oil. J Petroleum Science and
Technology 29 (2): 160-171. https://doi.org/10.1080/10916460903330361.
Alboudwarej, H., Pole, D., Svrcek, W. Y. et al. 2005. Adsorption of Asphaltenes on
Metals. Industrial & engineering chemistry research 44 (15): 5585-5592.
https://doi.org/10.1021/ie048948f.
Behar, E., Hasnaoui, N., Achard, C. et al. 1998. Study of Asphaltene Solutions by Electrical
Conductivity Measurements. Review of the French Institute of Petroleum 53 (1): 41-
50. https://doi.org/10.2516/ogst:1998007.
Borton, D., Pinkston, D. S., Hurt, M. R. et al. 2010. Molecular Structures of Asphaltenes
Based on the Dissociation Reactions of Their Ions in Mass Spectrometry. Energy & Fuels
24 (10): 5548-5559. https://doi.org/10.1021/ef1007819.
Brouwer, P. 2006. Theory of XRF: Getting acquainted with the principles. PANalytical BV.
Cao, M. and Gu, Y. 2013. Oil recovery mechanisms and asphaltene precipitation phenomenon
in immiscible and miscible CO2 flooding processes. Fuel 109: 157-166.
https://doi.org/10.1016/j.fuel.2013.01.018.
Cecchi, L., De Sarlo, F., and Machetti, F. 2006. 1,4‐Diazabicyclo[2.2.2]octane (DABCO) as
an Efficient Reagent for the Synthesis of Isoxazole Derivatives from Primary Nitro
Compounds and Dipolarophiles: The Role of the Base. European J Organic
Chemistry 2006 (21): 4852-4860. https://doi.org/10.1002/ejoc.200600475.
Coelho, R. R., Hovell, I., Moreno, E. L. et al. 2007. Characterization of functional groups of
asphaltenes in vacuum residues using molecular modelling and FTIR techniques. J
Petroleum Science and Technology 25 (1-2): 41-54.
https://doi.org/10.1080/10916460601054198.
Cunico, R. L., Sheu, E. Y., and Mullins, O.C. 2004. Molecular weight measurement of UG8
asphaltene using APCI mass spectroscopy. J Petroleum Science and Technology 22 (7-
8): 787-798. https://doi.org/10.1081/LFT-120038719.

56
Dong, Z. X., Wang, J., Liu, G. et al. 2014. Experimental study on asphaltene precipitation
induced by CO2 flooding. J Petroleum Science 11 (1): 174-180.
https://link.springer.com/article/10.1007/s12182-014-0329-2.
Dutta Majumdar, R., Bake, K. D., Ratna, Y. et al. 2016. Single-core PAHs in petroleum-and
coal-derived asphaltenes: size and distribution from solid-state NMR spectroscopy and
optical absorption measurements. Energy & Fuels 30 (9): 6892-6906.
https://doi.org/10.1021/acs.energyfuels.5b02815.
Escobedo, J. and Mansoori, G. A. 1995. Viscometric Determination of the Onset of
Asphaltene Flocculation: A Novel Method. SPE Prod & Fac 10 (02): 115-118. SPE-
28018-PA. https://doi.org/10.2118/28018-PA.
Fotland, P., Anfindsen, H., and Fadnes, F. H. 1993. Detection of Asphaltene Precipitation and
Amounts Precipitated by Measurement of Electrical Conductivity. Fluid Phase
Equilibria 82: 157-164. https://doi.org/10.1016/0378-3812(93)87139-R.
Gabrienko, A. A., Martyanov, O. N., and Kazarian, S. G. 2016. Behavior of Asphaltenes in
Crude Oil at High-Pressure CO2 Conditions: In Situ Attenuated Total Reflection–Fourier
Transform Infrared Spectroscopic Imaging Study. Energy & Fuels 30 (6): 4750-4757.
https://doi.org/10.1021/acs.energyfuels.6b00718.
Gharfeh, S., Yen, A., Asomaning, S. et al. 2004. Asphaltene flocculation onset determinations
for heavy crude oil and its implications. J Petroleum Science and Technology 22(7-8):
1055-1072. https://doi.org/10.1081/LFT-120038711.
Godec, M. L., Kuuskraa, V. A., and Dipietro, P. 2013. Opportunities for using anthropogenic
CO2 for enhanced oil recovery and CO2 storage. Energy & Fuels 27 (8): 4183-4189.
https://doi.org/10.1021/ef302040u.
Goual, L. and Firoozabadi, A. 2002. Measuring Asphaltenes and Resins, and Dipole Moment
in Petroleum Fluids. AIChE J 48 (11): 2646-2663.
https://doi.org/10.1002/aic.690481124.
Hosseini, A., Zare, E., Ayatollahi, S. et al. 2016. Electrokinetic behavior of asphaltene
particles. Fuel 178: 234-242. https://doi.org/10.1016/j.fuel.2016.03.051.
Hu, Y. F., Li, S., Liu, N. et al. 2004. Measurement and corresponding states modeling of
asphaltene precipitation in Jilin reservoir oils. J Petroleum Science and Engineering 41
(1-3): 169-182. https://doi.org/10.1016/S0920-4105(03)00151-7.
Ibrahim, H. H. and Idem, R. O. 2004. Correlations of Characteristics of Saskatchewan Crude
Oils/Asphaltenes with Their Asphaltenes Precipitation Behavior and Inhibition
Mechanisms: Differences between CO2- and n-Heptane-Induced Asphaltene
Precipitation. Energy & Fuels 18 (5): 1354-1369. https://doi.org/10.1021/ef034044f.
57
Kokal, S. L., Najman, J., Sayegh, S. G. et al. 1992. Measurement and Correlation of
Asphaltene Precipitation from Heavy Oils by Gas Injection. J Can Pet Technol 31 (04).
PETSOC-92-04-01. https://doi.org/10.2118/92-04-01.
Kokal, S. L. and Sayegh, S. G. 1995. Asphaltenes: The Cholesterol of Petroleum. Presented
at Society of Petroleum Engineers, Bahrain, 11-14 March. SPE-29787-MS.
https://doi.org/10.2118/29787-MS.
Koolen, H. H., Gomes, A. F., de Moura, L. G. et al. 2018. Integrative mass spectrometry
strategy for fingerprinting and tentative structural characterization of asphaltenes. Fuel
220: 717-724. https://doi.org/10.1016/j.fuel.2017.12.078.
Król, M., Minkiewicz, J., and Mozgawa, W. 2016. IR Spectroscopy Studies of Zeolites in
Geopolymeric Materials Derived from Kaolinite. J Molecular Structure 1126: 200-206.
https://doi.org/10.1016/j.molstruc.2016.02.027.
Leontaritis, K. J. and Mansoori, G. A. 1988. Asphaltene Deposition: A Survey of Field
Experiences and Research Approaches. J Petroleum Science and Engineering 1 (3): 229-
239. https://doi.org/10.1016/0920-4105(88)90013-7.
Leyva, C., Ancheyta, J., Berrueco, C. et al. 2013. Chemical characterization of asphaltenes
from various crude oils. J Fuel Processing Technology 106: 734-738.
https://doi.org/10.1016/j.fuproc.2012.10.009.
Li, Y., Sorribes, I., Yan, T. et al. 2013. Selective Methylation of Amines with Carbon Dioxide
and H2. Angewandte Chemie International Edition 52 (46): 12156-12160.
https://doi.org/10.1002/anie.201306850.
Magruder, J. B., Stiles, L. H., and Yelverton, T. D. 1990. Review of the Means San Andres
Unit CO2 Tertiary Project. J Petroleum Technology 42 (05): 638-644. SPE-17349-PA.
https://doi.org/10.2118/17349-PA.
Mansur, C. R., Guimaraes, A. R., Gonzalez, G. et al. 2009. Determination of the Onset of
Asphaltene Precipitation by Visible Ultraviolet Spectrometry and
Spectrofluorimetry. Analytical Letters 42 (16): 2648-2664.
https://doi.org/10.1080/00032710903243612.
McKenna, A. M., Donald, L. J., Fitzsimmons, J. E. et al. 2013. Heavy petroleum composition.
3. Asphaltene aggregation. Energy & Fuels 27 (3): 1246-1256.
https://doi.org/10.1021/ef3018578.
McMurry, J., Ballantine, D. S., Hoeger, C. A. et al. 2010. Fundamentals of General, Organic,
and Biological Chemistry, Sixth Edition: Pearson Education.
Melendez, L. V., Lache, A., Orrego-Ruiz, J. A. et al. 2012. Prediction of the SARA Analysis
of Colombian Crude Oils using ATR–FTIR Spectroscopy and Chemometric Methods. J

58
Petroleum Science and Engineering 90: 56-60.
https://doi.org/10.1016/j.petrol.2012.04.016.
Mohammed, S. and Gadikota, G. 2019. The influence of CO2 on the structure of confined
asphaltenes in calcite nanopores. Fuel 236: 769-777.
https://doi.org/10.1016/j.fuel.2018.08.124.
Moreira, L. F. B., Lucas, E. F., and González, G. 1999. Stabilization of Asphaltenes by
Phenolic Compounds Extracted from Cashew‐Nut Shell Liquid. J Applied Polymer
Science 73 (1): 29-34. https://doi.org/10.1002/(SICI)1097-
4628(19990705)73:1<29::AID-APP3>3.0.CO;2-O.
Mousavi-Dehghani, S. A., Riazi, M. R., Vafaie-Sefti, M. et al. 2004. An Analysis of Methods
for Determination of Onsets of Asphaltene Phase Separations. J Petroleum Science and
Engineering 42 (2-4): 145-156. https://doi.org/10.1016/j.petrol.2003.12.007.
Mullins, O. C. 2010. The modified Yen model. Energy & Fuels 24 (4): 2179-2207.
https://doi.org/10.1021/ef900975e.
Mullins, O. C., Sabbah, H., Eyssautier, J. et al. 2012. Advances in asphaltene science and the
Yen–Mullins model. Energy & Fuels 26 (7): 3986-4003.
https://doi.org/10.1021/ef300185p.
O'Connor, C. 1970. Acidic and Basic Amide Hydrolysis. Chemical Society 24 (4): 553-564.
Okwen, R. T. 2006. Formation Damage by CO2 Asphaltene Precipitation. SPE International
Symposium and Exhibition on Formation damage control. SPE-98180-MS.
https://doi.org/10.2118/98180-MS.
Pavia, D. L., Lampman, G. M., Kriz, G. S. et al. 2008. Introduction to spectroscopy, Third
Edition: Cengage Learning.
Pinkston, D. S., Duan, P., Gallardo, V. A. et al. 2009. Analysis of Asphaltenes and Asphaltene
Model Compounds by Laser-Induced Acoustic Desorption/Fourier Transform Ion
Cyclotron Resonance Mass Spectrometry. Energy & Fuels 23 (11): 5564-5570.
https://doi.org/10.1021/ef9006005.
Pomerantz, A. E., Hammond, M. R., Morrow, A. L. et al. 2009. Asphaltene molecular-mass
distribution determined by two-step laser mass spectrometry. Energy & Fuels 23(3): 1162-
1168. https://doi.org/10.1021/ef8006239.
Qian, K., Edwards, K. E., Siskin, M. et al. 2007. Desorption and Ionization of Heavy
Petroleum Molecules and Measurement of Molecular Weight Distributions. Energy &
Fuels 21 (2): 1042-1047. https://doi.org/10.1021/ef060360t.
Rakhmatullin, I. Z., Efimov, S. V., Tyurin, V. A. et al. 2018. Application of high-resolution
NMR (1H and 13C) and FTIR spectroscopy for characterization of light and heavy crude
59
oils. J Petroleum Science and Engineering 168: 256-262.
https://doi.org/10.1016/j.petrol.2018.05.011.
Ruiz-Morales, Y. 2002. HOMO− LUMO gap as an index of molecular size and structure for
polycyclic aromatic hydrocarbons (PAHs) and asphaltenes: A theoretical study. I. J
Physical Chemistry A 106 (46): 11283-11308. https://doi.org/10.1021/jp021152e.
Schuler, B., Meyer, G., Peña, D. et al. 2015. Unraveling the molecular structures of
asphaltenes by atomic force microscopy. J American Chemical Society 137 (31): 9870-
9876. https://doi.org/10.1021/jacs.5b04056.
Sheu, E. Y. 2002. Petroleum asphaltene properties, characterization, and issues. Energy &
Fuels 16 (1): 74-82. https://doi.org/10.1021/ef010160b.
Shirokoff, J. and Lye, L. 2019. A Review of Asphalt Binders Characterized by X-ray
Diffraction. Innovations in Corrosion and Materials Science 9 (1): 28-
40. https://doi.org/10.2174/2352094909666190401205036.
Srivastava, R. K., Huang, S. S., and Dong, M. 1999. Asphaltene Deposition during CO2
Flooding. SPE Prod & Fac 14 (04): 235-245. SPE-59092-PA.
https://doi.org/10.2118/59092-PA.
Takahashi, S., Hayashi, Y., Takahashi, S. et al. 2003. Characteristics and impact of asphaltene
precipitation during CO2 injection in sandstone and carbonate cores: An investigative
analysis through laboratory tests and compositional simulation. SPE International
Improved Oil Recovery Conference in Asia Pacific. SPE-84895-MS.
https://doi.org/10.2118/84895-MS.
Tavakkoli, M., Grimes, M. R., Liu, X. et al. 2015. Indirect Method: A Novel Technique for
Experimental Determination of Asphaltene Precipitation. Energy & Fuels 29 (5): 2890-
2900. https://doi.org/10.1021/ef502188u.
Verdier, S., Carrier, H., Andersen, S. I. et al. 2006. Study of pressure and temperature effects
on asphaltene stability in presence of CO2. Energy & Fuels 20 (4): 1584-1590.
https://doi.org/10.1021/ef050430g.
Wang, J. and Buckley, J. S. 2003. Asphaltene stability in crude oil and aromatic solvents the
influence of oil composition. Energy & Fuels 17 (6): 1445-1451.
https://doi.org/10.1021/ef030030y.
Wang, S., Li, K., Chen, C. et al. 2019. Isolated mechanism study on in situ CO2 EOR. Fuel
254: 115575. https://doi.org/10.1016/j.fuel.2019.05.158.
Wattana, P., Wojciechowski, D. J., Bolaños, G. et al. 2003. Study of asphaltene precipitation
using refractive index measurement. J Petroleum Science and Technology 21 (3-4): 591-
613. https://doi.org/10.1081/LFT-120018541.

60
Zanganeh, P., Ayatollahi, S., Alamdari, A. et al. 2012. Asphaltene Deposition during CO2
Injection and Pressure Depletion: A Visual Study. Energy & Fuels 26 (2): 1412-1419.
https://doi.org/10.1021/ef2012744.