CHARACTERISTICS OF PLAYING PERFORMANCE AT THE...
14
CHARACTERISTICS OF PLAYING PERFORMANCE AT THE WOMEN’S 17 EUROPEAN HANDBALL CHAMPIONSHIP Martin Tůma, František Urban, Róbert Kandráč, Ondřej Václavek Introduction The tenth Women’s 17 European Handball Championship (W17 ECh) was held from the 23 rd June – 3 rd July 2011 in Brno (Groups C,D, M2, I2, Placement Matches 1-8) and Zlín (Groups A,B, M1, I1, Placement Matches 9-16), the Czech Republic. Playing venues were well prepared for the games. The EHF ensures, even during the course of individual championships, the collection and public presentation of quantitative playing performance indexes, which may be made use of, thanks to electronic media (see www.euro2011.cz ), not only by the participants, but by other interested parties as well. Therefore our aim is to concentrate on the qualitative characteristics of the playing performance (including its assumptions) at the 2011 W17 ECh and perhaps compare them with the results of the previous analyses. We chose the method of direct observation with record. We especially focused on the latter part of the championship, i.e. on placement matches, semi-finals and finals. Investigated group From an initial 31 teams fighting for their chance to participate, only 16 teams took part in W17 ECh after having succeeded in the qualification. Among the participants there were no „newcomers“, ie. that each participating federation had its representative in previous championships. On the other hand the teams of DEN, HUN, RUS and ROU have participated in nine out of ten championships! The complete overview of the participation of individual countries (2005-2011) is presented in table 1. Place Austria ECh 05 W17 Slovakia ECh 07 W17 Serbia ECh 09 W17 Czech Republic ECh 11 W17 1 DEN FRA DEN RUS 2 ROU ESP RUS DEN 3 FRA NED NOR NOR 4 SLO RUS FRA HUN 5 SVK SRB HUN FRA 6 CRO DEN NED SWE 7 GER SVK SWE ROU 8 HUN CZE ESP NED 9 RUS NOR GER CRO 10 AUT CRO ROU GER 11 SWE SLO CRO ESP 12 LTU AUT SRB CZE 13 ESP MNE SVK POR 14 SCG ROU CZE AUT 15 CZE BUL LTU POL 16 TUR UKR MKD SVK Table 1: Results of the European Championships 2005 - 2011 with 16 teams in the final round
Transcript of CHARACTERISTICS OF PLAYING PERFORMANCE AT THE...

CHARACTERISTICS OF PLAYING PERFORMANCE AT THE
WOMEN’S 17 EUROPEAN HANDBALL CHAMPIONSHIP
Martin Tůma, František Urban, Róbert Kandráč, Ondřej Václavek
Introduction The tenth Women’s 17 European Handball Championship (W17 ECh) was held from the 23 rd
June – 3 rd July 2011 in Brno (Groups C,D, M2, I2, Placement Matches 1-8) and Zlín (Groups
A,B, M1, I1, Placement Matches 9-16), the Czech Republic. Playing venues were well prepared for the games. The EHF ensures, even during the course of individual championships, the collection and public presentation of quantitative playing performance indexes, which may be made use of, thanks to electronic media (see www.euro2011.cz), not only by the participants, but by other interested parties as well. Therefore our aim is to concentrate on the qualitative characteristics of the playing performance (including its assumptions) at the 2011 W17 ECh and perhaps compare them with the results of the previous analyses. We chose the method of direct observation with record. We especially focused on the latter part of the championship, i.e. on placement matches, semi-finals and finals. Investigated group From an initial 31 teams fighting for their chance to participate, only 16 teams took part in W17 ECh after having succeeded in the qualification. Among the participants there were no „newcomers“, ie. that each participating federation had its representative in previous championships. On the other hand the teams of DEN, HUN, RUS and ROU have participated in nine out of ten championships! The complete overview of the participation of individual countries (2005-2011) is presented in table 1.
Place Austria ECh 05
W17
Slovakia ECh 07
W17
Serbia ECh 09 W17
Czech Republic ECh 11
W17 1 DEN FRA DEN RUS 2 ROU ESP RUS DEN 3 FRA NED NOR NOR 4 SLO RUS FRA HUN 5 SVK SRB HUN FRA 6 CRO DEN NED SWE 7 GER SVK SWE ROU 8 HUN CZE ESP NED 9 RUS NOR GER CRO 10 AUT CRO ROU GER 11 SWE SLO CRO ESP 12 LTU AUT SRB CZE 13 ESP MNE SVK POR 14 SCG ROU CZE AUT 15 CZE BUL LTU POL 16 TUR UKR MKD SVK
Table 1: Results of the European Championships 2005 - 2011 with 16 teams in the final round

Nations ranked by their number of Women’s Youth EC-participation(1992-2011) 1. DEN, HUN, ROU, RUS (represented at 9 European Championships) 2. CZE, GER (at 8 European Championships) 3. CRO, ESP, NOR (at 7 European Championships) 4. AUT, LTU (at 6 European Championships) 5. NED, SLO, SVK (at 5 European Championships)
The medals were split between the same teams as in previous championship (2009 SRB). We consider it a sign of stability in the work in women´s handball. From the point of view of age distribution it is understandable that the largest age group consisted of players born in the year 1994, who made up three-quarters of the participants. We found the higher number (more than 35 %) of younger players only in 3 teams – CZE, GER, POR. Regarding the number of participating clubs we can find two trends. Some federations (RUS, HUN, AUT) selected the national team from a limited number of clubs, whereone of the clubshas a distinct advantage in the number of players in the representation (see table 2). On the other hand some federations used more than 10 clubs for the selection players. We didn´t find any two players from the same club in the team ESP! The complete overview is presented in table 2.
Table 2 : Team structure
Physical parameters Body build in sports games represents one of the underlying factors of performance exerting significant influence on the effectiveness of position-specific game skills (Urban, Kandráč, 2010). Overall changes in handball rules resulted in faster, more dynamic and demanding game with respect to both physical conditioning and player's morphological profile, which is based especially on appropriate somatotype (Urban, Kandráč, Táborský, 2010). Our measured sample consisted of 240 players of 15 participating national teams (except Norway). The body fat percentage was determined using the method by Pařízková (1962), which was based on the measurements of skinfold thickness (measured by caliper BEST) on ten body landmarks (face, chin, chest - 2 skinfolds, supraspinale, triceps, subscapular, abdominal, thigh
Team No. of
players Born 1994
Born 1995
Born 1996(97)
No. of participating
clubs Highest
participation RUS 16 11 5 0 5 Dinamo 5x DEN 16 12 4 0 11 FCM Handbold 3x NOR 16 13 3 0 13 Ranheim IL 3x HUN 16 12 3 1 5 Györi ETO 7x FRA 16 10 5 (1) 13 3 clubs 2x SWE 16 14 2 0 13 3 clubs 2x ROU 16 12 4 0 8 R. Valcea 6x NED 16 12 3 1 11 Quintus 4x CRO 16 15 1 0 10 Sinj 4x GER 16 9 7 0 12 Leipzig 3x ESP 16 13 3 0 16 0 CZE 16 9 5 2 7 Zlín 4x POR 16 9 6 (1) 10 Alcanena 4x AUT 16 12 4 0 6 Hypo NÖ 6x POL 16 12 4 0 12 Koszalin 3x SVK 16 10 6 0 7 2 clubs 4x Σ 256 185 65 6 % 100 72 25 3

and calf). The percentage of fat was determined using the tables for fat percentage determination by Riegerová, Přidalová, Ulbrichová, 2006, which are based on the sum of thickness of ten skinfolds. The somatotypes were assessed using a modified somatotyping method devised by Heath - Carter (1967), which uses numerical rating of each somatotype component. The data required to determine somatotypes of handball players were processed using the program SOMATO. The collected data were processed using basic statistical characteristics: x - arithmetic mean, Sd - standard deviation, min - minimum value (blue-color number) and max - maximum value (red-color number). Body Height
The average body height of the players was 173.50 ±6.41 cm. The biggest difference in body height (8.14 cm) was found between the players of Portugal (169.6 ±4.61 cm) and the players of Poland (177.7 ±6.61 cm) (see Table 2). The average body height of the All-Star Team players was 174.67 ± 5.60 cm (166.0 - 185.5 cm). Body height over 185.0 cm was recordered in 11 players. The overview of the tallest and the shortest players is shown in Table 3.
Tab. 3 Players with highest and lowest body height values
Playing
Positions Team Name Body
height Team Name Body
height
Goalkeeper POL Borkowska J. 187.0 POR Oliveira C. 163.0
Wing SWE Gustin D. 179.8 AUT Müller V. 157.5
Center Back NED Dulfer K. 187.0 ESP Lopez N. 163.5
Back HUN Bárány K. 190.5 NED Nieuwenweg A. 165.4
Pivot FRA Zulemaro K. 185.0 AUT Kietaibl A. 163.8
Arm span (D-D)
The average arm span of the players was 173.89 ±7.79 cm. The biggest difference in arm span (8.10 cm) was found between the players of Austria (170.0 ±7.96 cm) and the players of France (178.1 ±8.02 cm). An interesting finding was that players on the teams in the 1st to 8th place demonstrated greater difference between arm span and body height (+ 0.92 cm). There was negative difference between arm span and body height in players on the teams in the 9th to 16th place. The greatest difference between arm span and body height was found in French players (+ 5.35 cm) and the lowest difference in their Slovenian counterparts (- 1.4 cm). The average arm span of the All-Star Team players was 174.67 ±6.70 cm (166.0 – 186.0 cm).
In teams sports including handball, the ratio of arm span to body height represents a beneficial somatic parameter (Urban, 2010), when high absolute and relative values of body height and arm span are considerably beneficial (Štěpnička, 1972). Body Weight
The average body weight of championship players was 69.09 ±7.97 kg, whereas the body weight of All-Star Team players averaged 68.47 ±8.00 kg (60.0 - 83.2 kg). The biggest difference in weight (7.5 kg) was found between the players of Austria (66.1 ±6.69 kg) and the players of Poland (73.6 ±8.90 kg). Percentage of Body (subcutaneous) Fat
Average percentage of body fat was 11.31 ±2.05 %, when the highest fat percentage of 14.84 % was found in Slovak players. Players from Romania averaged the lowest body fat percentage of 8.19 %, being the only team with average value less than 9 %. The All-Star Team players averaged 11.15 ±2.90 % (6.6 - 14.0 %) of body fat. The lowest body fat percentage was 3.4 % (two players: wing and center back) and highest one in pivot (21.7 %). Somatotype

The average value of endomorphic component in players participating in the championship equaled 2.36 ±0.83. Value lower than 2.0 was found in Romanian, German (1.9) and Swedish players (1.8), which is indicative of relatively low fat percentage and good physical preparedness. The highest endomorphy value (3.0) was recorded in Polish and Slovenian players. Average mesomorphy values ranged from 3.8 (CRO) to 4.8 (ESP), when such range indicates relatively well-developed musculature. The highest average value (2.6) in ectomorphy was found in GER and SWE players demonstrating linearity and surface of individual body segments. For the details of somatotype data see Fig. 1. The complete overview of physical parametres is presented in table 4. Figure 1

Tab. 4 Teams physical characteristics
SOMATOTYPE
Ranking
Body
height D-D Diff.
Body
mass Endo Meso Ecto Categorization
1. RUS 175.6 176.8 + 1.2 72.9 2.2 4.3 2.1 balanced mesomorph
2. DEN 175.3 175.6 + 0.3 68.7 2.0 3.9 2.5 balanced mesomorph
3. NOR – – – – – – – – 4. HUN 174.2 174.0 - 0.2 69.4 2.5 4.3 2.4 balanced mesomorph
5. FRA 172.8 178.1 + 5.3 68.9 2.4 4.2 2.2 balanced mesomorph
6. SWE 174.6 173.8 - 0.8 68.1 1.8 3.9 2.6 ectomorphic mesomorph
7. ROU 175.1 175.6 + 0.5 71.0 1.9 4.4 2.2 balanced mesomorph
8. NED 170.3 170.4 + 0.1 66.8 2.6 4.4 1.9 endomorphic mesomorph
Average 1-8 173.98 174.90 + 0.92 68.82 2.21 4.18 2.27
9. CRO 174.6 174.2 - 0.4 68.2 2.6 3.8 2.5 balanced mesomorph
10. GER 175.0 175.0 0.0 68.1 1.9 4.0 2.6 ectomorphic mesomorph
11. ESP 172.5 173.1 + 0.6 71.5 2.9 4.8 1.7 endomorphic mesomorph
12. CZE 172.7 172.9 + 0.2 69.3 2.3 4.0 2.1 balanced mesomorph
13. POR 169.6 171.1 + 1.5 67.4 2.1 4.5 1.9 balanced mesomorph
14. AUT 170.1 170.0 - 0.1 66.1 2.1 4.2 2.1 balanced mesomorph
15. POL 177.7 176.5 - 1.2 73.6 3.0 4.1 2.3 endomorphic mesomorph
16. SVK 171.8 170.4 - 1.4 67.1 3.0 4.0 2.3 endomorphic mesomorph
Average 9-16 173.00 172.90 - 0.10 68.91 2.48 4.16 2.18
Total average 173.50 173.89 + 0.39 69.09 2.36 4.17 2.22 balanced mesomorph
Legend: D-D – arm span; Diff. – difference between body height and arm span; Endo – endomorphy; Meso – mesomorphy; Ecto – ectomorphy;
From the above facts the following conclusions can be drawn:
- the highest body height and body mass average values were found in Polish players; - the maximum body height measured was 190.5 cm and the lowest value equaled 157.5 cm; - the teams that placed 1st to 8th were found to have 1.02 positive difference between arm span and body height as compared to teams that placed 9th to 16th. The greatest difference between these parameters was recorded in French players (+ 5.3 cm). - relatively low values of subcutaneous fat percentage in most players indicate adequate physical preparedness, which resulted from current demands of fast, offensive and dynamic sport of handball; - all teams demonstrated higher mesomorphy average value compared to endomorphy and ectomorphy, which is indicative of adequately developed musculature relative to body build; - average value in ectomorphy higher than endomorphy was found in 4 teams only (DEN, SWE, ROU, GER). This finding showed there was an inadequate ratio of body height, body mass, fat precentage and muscle mass in players on most teams. - the placement of teams with regard to somatotype categorization was as follows:
- balanced mesomorph: 9 teams - AUS, CRO, CZE, DEN, FRA, HUN, POR, ROM, RUS; - endomorphic mesomorph: 4 teams - NED, POL, SVK, ESP; - ectomorphic mesomorph: 2 teams - GER, SWE;
- overall, the players of U17 category were classified as balanced mesomorphs;
Results Competition Characteristics
Match dynamics are shown in table 5. A quarter of all matches ended in victory for one team with one or two goals. On the other side 20 % (11) of all matches ended in victory with more than 10 goals. It was mostly the case of preliminary groups. This shows that there were significant differences between contesting teams. Compared with the previous championship (see Eliasz 2009) there was a reduced number of matches which ended with significant difference. On the contrary, the number of matches with the victory of one or two goals increased. We see it as a positive tendency.
Table 5 Match dynamics The average result of a match was 29,25:23,41. Based on the results of the seven matches played by each team we can state that the average score of the top six teams of the ECh was 26,86:23,57, which is similar to Championship W 17 2007 (28:25, see Hianik 2007). The average result of a match in the best team was 29:22, which is the same value as the winner reached two years ago (Eliasz 2009). The average number of goals scored in one match was consistent from the preliminary and semi-final groups to placement matches (52,95; 52,75; 52,12). From the point of view of the goals scored, the best team was the Netherlands (total 208, i.e. 30 in one match); the most successful team in the defence phase (received goals) was Russia (total 152, i.e. 22 in one match). The complete overview of score characteristics is presented in table 6.
Table 6 Score characteristics
General trends
(Technical and Tactical Characteristics)
Fast break and fast throw-off Fast break (FB) is one of the most important factors for winning in the modern handball. Especially the number and the effectivity of FB plays an important role in playing performance of the best teams. It was repeatedly a very successful feature, as FB was the basis of 20 % of all the goals scored at W17 Ech in the first eight teams. But we found significant differences after closer investigation. The best teams (RUS, DEN, NOR) scored
Draw 1 - 2 3 - 5 6 - 9 > 10 Σ matches Preliminary 0 3 3 9 9 24 Main 2 5 5 3 1 16 Semifinal 0 3 5 4 0 12 Final 0 0 0 1 1 4 Total 2 13 13 17 11 56
Rank Team Preliminary Main Total 1 RUS 30:18 28:24 29:22 2 DEN 32:23 31:25 30:24 3 NOR 33:25 25:23 28:24 4 HUN 33:23 24:27 26:25 5 FRA 27:21 22:24 24:23 6 SWE 21:21 24:25 23:24 7 ROU 30:29 28:28 29:29 8 NED 32:31 28:29 30:30

more than 20 % of the goals from the FB (24%,21%,24%). In contrast the teams ROU, SWE and HUN scored only 13%(!) or 16% of the goals from the FB. The number of FB goals is influenced by several factors. One of them is total number of FB. This relates to the quality of defence set-play including the efficiency of own goalkeepers. Good performance in defense allows, among other things, more gains (steals) of ball and following the creation of FB. From this point of view there is a little bit surprise, that the team ROU with highest (119) number of steals (see qualitative data) realised the second lowest (45) number of FB. On the other hand the team NED (118 steals) was able to realise the highest number (69) of FB despite the low (32%) efficiency of goalkeepers. There is another factor naturally consisted in effectiveness of FB. The best teams (RUS,DEN) reached the highest value (75%, 80 %) which is comparable with the best womens teams. On the other hand, the low effectiveness of FB did not allow teams ROU (58%) or SWE (61%) better placement. The complete overview of FB factors is presented in table 7. The data shows, that only one team (RUS) excelled in all factors. We think that it may be one reason why RUS became a winner.
Tab.7 Fast break factors
Fast throw-off was a tactical element which was used very rarely during the W17 Ech. One of the possible explanations is substituting of defence specialists, which in a way limited the application of more tactical possibilities. Concerning the concept of FB, we consider the similarity to the concept of national teams of women or juniors in the best teams. A number of teams that have reached the medal phase of the tournament were characterized by a very good organization of the game in terms of second wave FB. We chose as an example the concept of FB of team DEN shown in fig. 2. Figure 2
Team Steals GK eff. (%) Number of FB Eff. of FB (%) RUS 115 40 65 75 DEN 92 39 51 80 NOR 84 36 69 70 HUN 76 36 43 72 FRA 90 41 60 73 SWE 106 34 41 61 ROU 119 29 45 58 NED 118 32 69 67

We noticed some interesting tactical means in defense against FB. Team CRO moved immediately after forewarning signal for passive play two players on their own half as a base for defense of opponent´s FB! The attack was then finished with only four players. The situation is shown in fig. 3. Figure 3
Defense set-up play The basic feature was a high level of individual ability to effectively solve the 1:1 situation. This might have been the reason why a number of teams used the substitution of 1-2 defence specialists. The defence system, which was dominant during the ECh, was set to 6:0. But some teams did not use it as a basic system (HUN, FRA, NED, ESP, CZE etc.). Compared with the previous championship we saw more open systems as a basic defense conception. Among the teams ranked places 1 – 8 FRA started the games with 5:1, NED with 5:1 or 4:2. In the second group ESP started usually with 3:2:1 (3:3), CZE, POR, AUT with 5:1. It should be emphasized that some teams were able to change the defense system very well according to circumstances. An interesting variant of tactics presented team RUS. They started to defend opponent's attack with the system 6:0. After 5-8 seconds, when the attackers came under pressure, they changed continuously in 5+1 (man to man defence against one of the opponent´s back) for a short time (till winning the ball or till interruption of the attack). Occasionally the zone defense system has been changed in to the combined (NED 4:2 into 4+2 f.e.) for a longer period. Sometimes we noticed a change in the form of different variants of the same system. For example, RUS had played against HUN 5:1 with the forward defender against left back or ROU played sometimes (f.e. against SWE) the system 6:0 with very tight marking (man to man) of opponent´s wings. Occasionally combined systems (5+1, 4+2) were applied by the teams (RUS, NED, ROM etc.) during the defence when outnumbered. The purpose was to increase the pressure on attackers or eliminate the involvement of „key“ players in the play. When playing numerical inferiority in defense all teams used 5:0 system. Only ESP used sometimes the system 4:1. Note: We have seen efforts to „clean“ defense in the whole championship. Only five red cards during 56 matches is certainly very positive trend. Offence set-up play There was again a characteristic high rate of individual solutions of the playing situations. All the observed teams had at their disposal players with an excellent level of individual playing skills supported by a high level of their fitness abilities, namely that of dynamic strength. For

practical consequence of this fact we consider a high level of versatility of some players. We saw them play on different positions with a good performance. As an example Szekerczés (HUN) – an excellent right wing - played very often on right back position or Michielsen (NED) – the best pivot (and the best thrower of the tournament too) – played as right back etc. Several times we have seen that the pivot ran out to the back position and shot over the defenders (using jump shot). As an „allrounder“ we consider Vyakhiereva (RUS) – the best right wing of the tournament – who often played on right back position, but we remember her playing on the center back position at W17 Ech 2009 in SRB! The basis of the attack concept of the majority of the participating teams was one pivot system. Only the team POL used the system with two pivots to a greater extent. The basic positioning of it is shown in fig. 4. Figure 4
All of the participating teams were able to use the transition from the system with one pivot to the system with two pivots.To exert stronger pressure on the inner defenders, the run of the wing into the area of the second pivot was often applied. We found this transition as one of the main tactical means which had been used during W17 Ech 2011. An example (NOR) is shown in fig. 5. Figure 5

Another much-used combination (HUN, SWE, SVK) was the run of the back (middle back, right back) into the area of the second pivot. The incurred screens had used other backs for shooting from a distance. An example (HUN) is shown in fig. 6 Figure 6
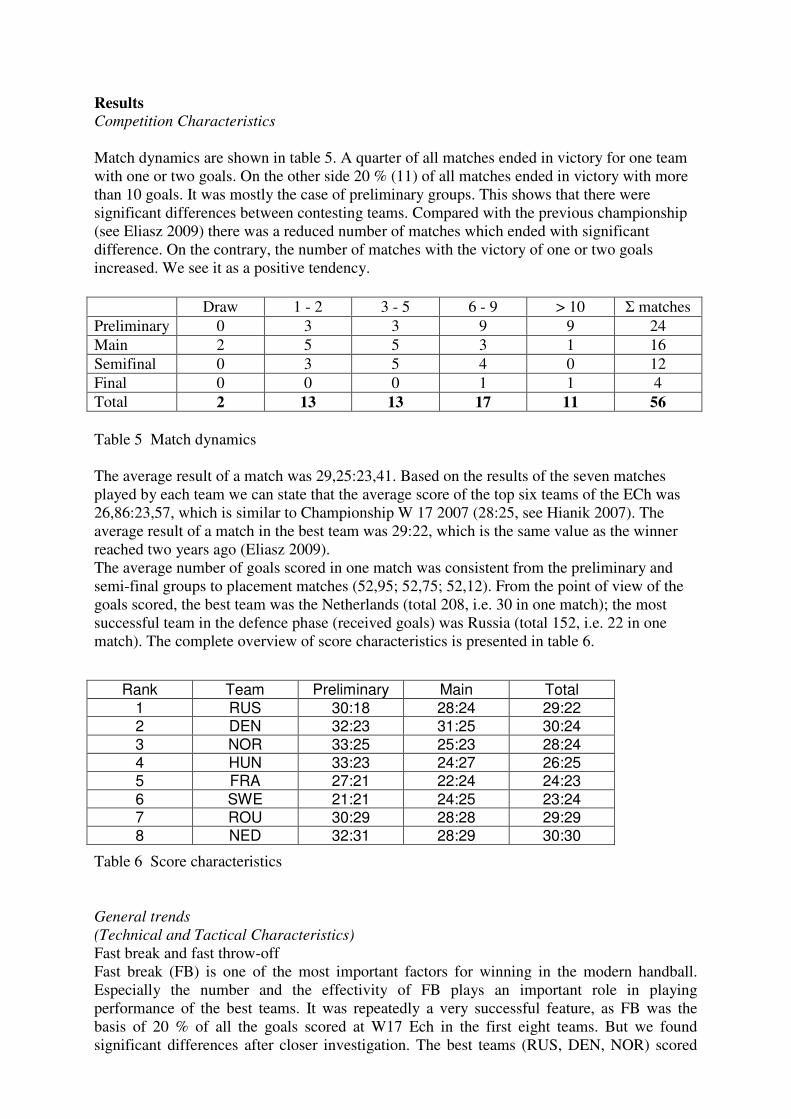
The change of positions between the backs as a preparatory combination for an alternative finish (shooting x breaking free of the pivot) was in general a very frequent tactical mean. The examples are shown in fig. 7 (NOR, DEN), 8 (DEN, ROU), 9 (NED). Figure 7
Figure 8
Figure 9

During the attack when outnumbered, the teams mostly didn´t change the playing conception. Some of them used a trained combination of the signal. An example (NOR) is shown in fig. 10. We observed more tendences in the teams playing in numerical inferiority in attack. The first one was a little bit „traditional“ – playing without a pivot (3 backs and 2 wings) used by ROU, SVK. Another conception demonstrated by the teams of ESP, partly DEN or RUS – playing with 2 backs, 1 pivot and two wings. We saw relatively frequently a different solution – the team (FRA, NOR, HUN, POL, partly DEN) started without a pivot (a pivot player was moved to the right/left wing position), after a few passes the wing ran into the pivot position and the team continued with 3 backs, 1 wing and 1 pivot. Again it is a tactical mean which uses the appropriate woman´s national teams. Figure 10
Characteristics of the Best Teams Russia
The winner of the championship gave the impression of the best prepared team as for both condition and tactics. Moreover it was a very balanced group of players. We found in the statistic 9 players (most of all teams) who have played more than half of the possible total playing time, so during the championship the load could be distributed much more evenly than it was the case with some other teams. On the other hand neither RUS could not avoid the regular substitution of defense specialist. Not at all was very good defense the basic for success. The quality of defense is underlined by the fact that P. Vedenina was declared the best defese player of W17 Ech. The main defense system was 0:6, but they were able to adapt it according to circumstances or to use above-described alternative. The good defence was connected with the excellent performances of the balanced pair of goalkeepers too. It is definitely no coincidence that they ended up in the forefront when looking at the rate of success (45 and 40 %). In addition E. Anoshkina was included in the all stars team. Thanks to both good defense and excellent goalkeepers the team RUS gained large number of balls, which created the precondition for successful fast break (see chapter „General trends“). The offence set-up play of the team RUS was effective specifically in the elements dominating in modern handball – the solution of 1:1 situation and in simple combinations of rather small groups of players (2, 3). Orientation to the individual solutions is also apparent in the detailed analysis of the shooting effectiveness. Furthemore as for fast break the team RUS was very good in breakthroughs (69 %), but the effectiveness from the back position was the lowest of medal winners. Relatively weak efficiency of wingers in positional attack is similar as well as in all the best teams with exception of team NOR.
Denmark
As usual the team consisted of technically excellently prepared players. It was especially noticeable at players who played on back positions. Finally, two of the three back positions in the all stars team were „occupied“ by Danish players. In addition N. Offendal was not only included in all stars team as the best center back but also declared as most valuable player of the championship. In the defense, the team used solely the 6:0 system in rather defensive variant. This fact is partly confirmed through the second highest number of defensive blocks and average number of attack interruptions. On the other hand, we saw in final match (especially in the second half) very aggressive concept of defense. Team DEN had at one´s disposal (similar as team RUS) the balanced pair of goalkeepers with great cooperation with defence in terms shots from the distance. This created good preconditions for realization of FB. The quality of FB of team DEN was described above. Regarding offence set-up we emphasize the activity of all attackers within the meaning exchange positions. The run of the wing or one of the backs into the area of the second pivot led to the creation of screens and therefore advantageous shooting situations for the backs. Another much-used mean was the cross movement of the backs. This all together with high level of individual skills of players is reflected in the highest (48 %!) shooting efectivness of backs among the teams of final group. The tactical scope of the team is also proved by the fact that out of all the finalists it had the most evenly distributed shots from individual areas in offence set-up. There are perhaps some reserves in the success rate from wings area (50 %). On the other hand team DEN reached exceptional efficiency of 7m throws – 94%! Norway
It was a team with very similar characteristics as a team DEN. For a slight difference could be considered less distinctive personalities (only one player in the all stars team) and perhaps some closure to the neighborhood (see chapter „Physical parametrs“). In the defense, the team used solely the 6:0 system too, but in a more aggressive approach (the highest number of attack interruptions among the teams of final group). Even so, team NOR belonged to teams with minimum punishments ( see Team fair play statistic). In comparison with previous teams were goalkeepers a slightly weaker especially against the shots from 6m distance (the lowest efficiency out of all the finalists). As mentioned, the team NOR was excellent in the realization of FB, especially in the use of the second wave. Because the conception of offence set-up was very similar as by team DEN, we describe only certain specifics. The team NOR had the best wings (finally K. Venn was declared as the best left wing ). This is confirmed by two characteristics – excellent FB and the highest rate of efficiency of wing shots out of all finalists. In offence set-up used the team NOR own variant of run in of wing. In the moment of the movement of the wing was the pivot in the position between first and second defender on the same side. Than she followed the running wing with smaller distance. Thereby were created situations suitable for passing the pivot. Hungary
It was a team with high level of involvement, fighiting to the end of the match. Feeling the match complicated sometimes both playing performance of players and coaching of realization team. In the defense, the team used mainly 5:1 system with the effort of maximum aggressiveness. But sometimes it was too „rough“ concept, possibly due to insufficient level of individual defending skills. Anyway the team HUN was on last place in team fair play competition. Frequent weakening had still one consequence – team HUN gained the lowest number of ball

out of all finalists. And so even though the goalkeepers reached solid efficiency the preconditions for FB were not so good. Thereby the total number of the goals from FB is lower than in the teams that won medails. Team HUN tried to play easy and very fast in offence set-up. The preference of individual solutions was similar as by team RUS. Both resulted in the highest number of shots on opponent´s goal (see team statistics). Perhaps there are some reserves in the success rate of shootig (comparing to medail winners), especially from the wing positions. The high level of individual attacking skills is demonstrated by the fact that in the team HUN was reported significantly lower number of turnovers than in other teams. Conclusions On the basis of the above mentioned facts, the following general conclusions can be stated:
1. The similarity of the playing concept of youth teams with the concept of national teams of women or juniors (W 19) may be considered a permanent tendency. We hold it to be proof of a long term cooperation of the national federations.
2. The high level of individual playing skills is manifested in a high level of versatility of majority players
3. There is a growing rate of open (5:1, 3:2:1, 4:2) and combined defence systems used by individual teams. It brings more aggressiveness in the playing performance but without influences on fair play.
4. Well organized fast break (two waves) with high efficiency is a prerequisite for success. A certain reserve we see in the fact that fast throw-off has been used rarely
5. A frequent team tactial means were: - position changes of back players - transition on playing systems with two pivots
6. Defence specialist substitution became part of the currently applied tactical means