chapter2 Sensors and transducers - İTÜweb.itu.edu.tr/~yalcinme/files/courses/MMG/ch2_1 Sensors...
35
Chapter 2 Sensors and Transducers
Transcript of chapter2 Sensors and transducers - İTÜweb.itu.edu.tr/~yalcinme/files/courses/MMG/ch2_1 Sensors...

Chapter 2
Sensors and Transducers
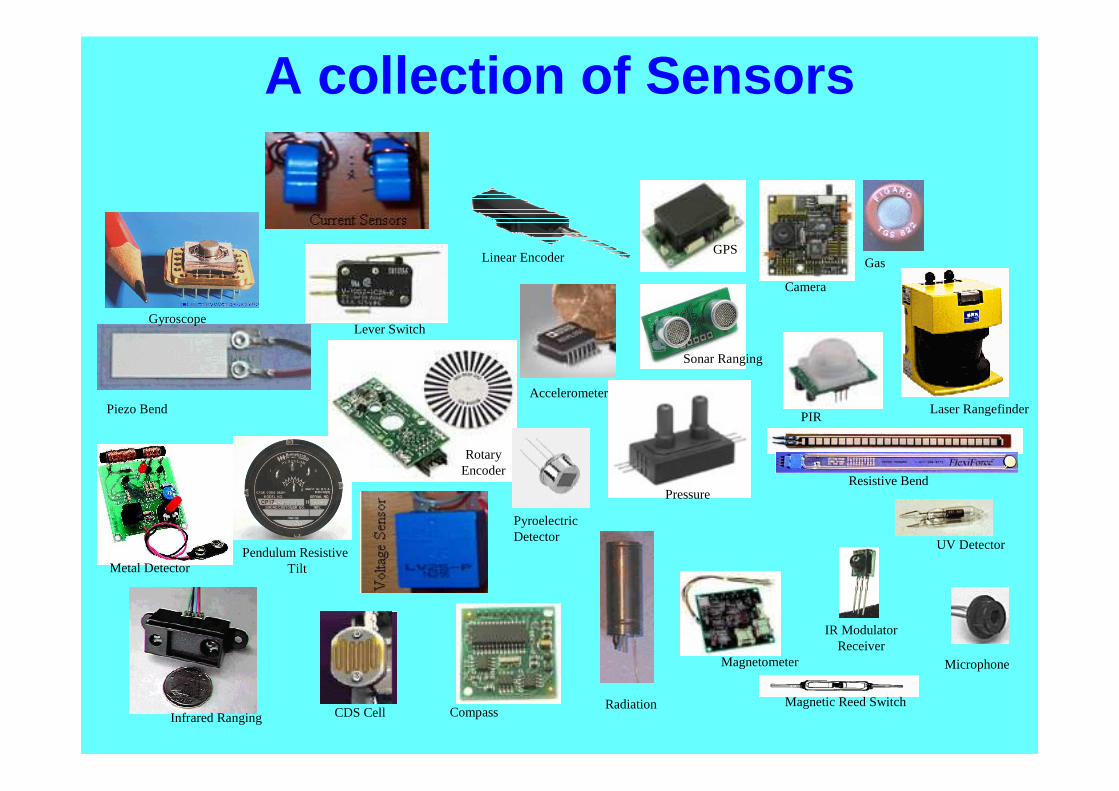
Infrared RangingMagnetic Reed Switch
Gas
Radiation
Piezo Bend
Resistive Bend
Pendulum Resistive Tilt
CDS Cell
IR ModulatorReceiver
UV Detector
Metal Detector
A collection of Sensors
Gyroscope
Compass
PIR
GPS
Magnetometer
Sonar Ranging
RotaryEncoder
Pressure
PyroelectricDetector
Accelerometer
Linear Encoder
Camera
Lever Switch
Laser Rangefinder
Microphone
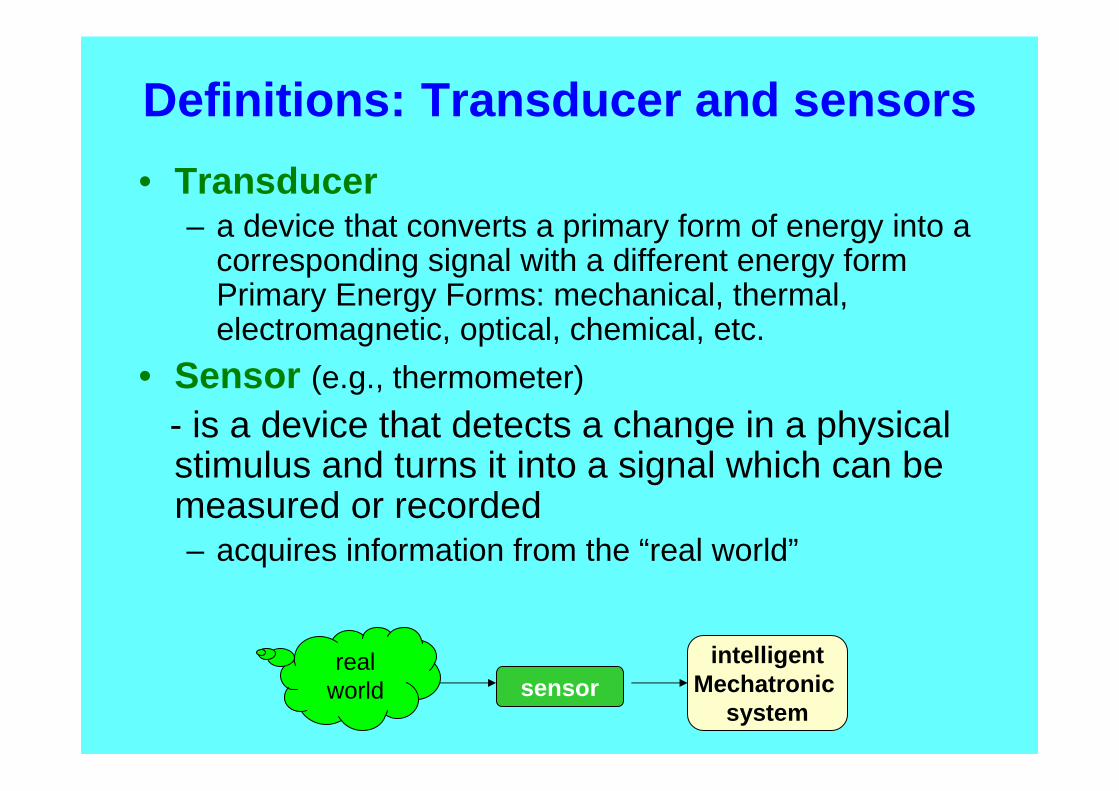
Definitions: Transducer and sensors
• Transducer– a device that converts a primary form of energy into a
corresponding signal with a different energy form Primary Energy Forms: mechanical, thermal, electromagnetic, optical, chemical, etc.
• Sensor (e.g., thermometer)
- is a device that detects a change in a physical stimulus and turns it into a signal which can be measured or recorded– acquires information from the “real world”
realworld sensor
intelligentMechatronic
system

usablevalues
Sensor SystemsTypically sensor system
– convert desired parameter into electrically measurable signal
• General Sensor system– Sensor/ transducer: sense “real world” parameter and
converted into a suitable signal– Signal conditioning: converts the sensed signal into an
analog or digital electrical value
realworld
A/Dsignaltransducer
Signal conditioning
sensor
inputsignal
(measured)
microcontrollersignal processingcommunicationsensed data
networkdisplay

Performance and terminologyPerformance and terminologyThe desirable features of sensors are:1. Range / span2. Errors and accuracy 3. Nonliearity4. Hysteresis5. Dead band and Saturation6. Output impedance7. Repeatability8. Reliability9. Sensitvity10.Resolution11.Frequency Response12.Response time13.calibration
Range and Span
• Range: lowest and highest values of the stimulus
• Span: the arithmetic difference between the highest and lowest values of the input that being sensed.
• Input full scale (IFS) = span• Output full scale (OFS): difference between
the upper and lower ranges of the output of the sensor.
• Dynamic range: ratio between the upper and lower limits and is usually expressed in db

Range and Span (Example)
• Example: a sensors is designed for: −30 °C to +80 °C to output 2.5V to 1.2V
• Range: −30°C and +80 °C • Span: 80− (−30)=110 °C• Input full scale = 110 °C• Output full scale = 2.5V-1.2V=1.3V• Dynamic range=20log(140/30)=13.38db

Errors and Accuracy• Errors : is the difference between the result of the
measurement and the true value of the quantity being measured
error= measured value –true value• As a percentage of full scale (span for
example) error is calculated as;e = ∆t/(tmax-tmin)*100 where tmax and tmin are the maximum and minimum values the device is designed to operate at.
Errors and Accuracy Example:• Accuracy: is the extent to which the
measured value might be wrong and normally expressed in percentage
• Example: A thermistor is used to measure temperature between –30 and +80 °C and produce an output voltage between 2.8V and 1.5V. Because of errors, the accuracy in sensing is ±0.5°C. so the measured value may be high than or lower than by 0.5 °C
• a. In terms of the input as ±0.5°C• b. Percentage of input: error = 0.5/(80+30)*100 = 0.454%• c. In terms of output. From the transfer function:
error= ±0.059V. ?
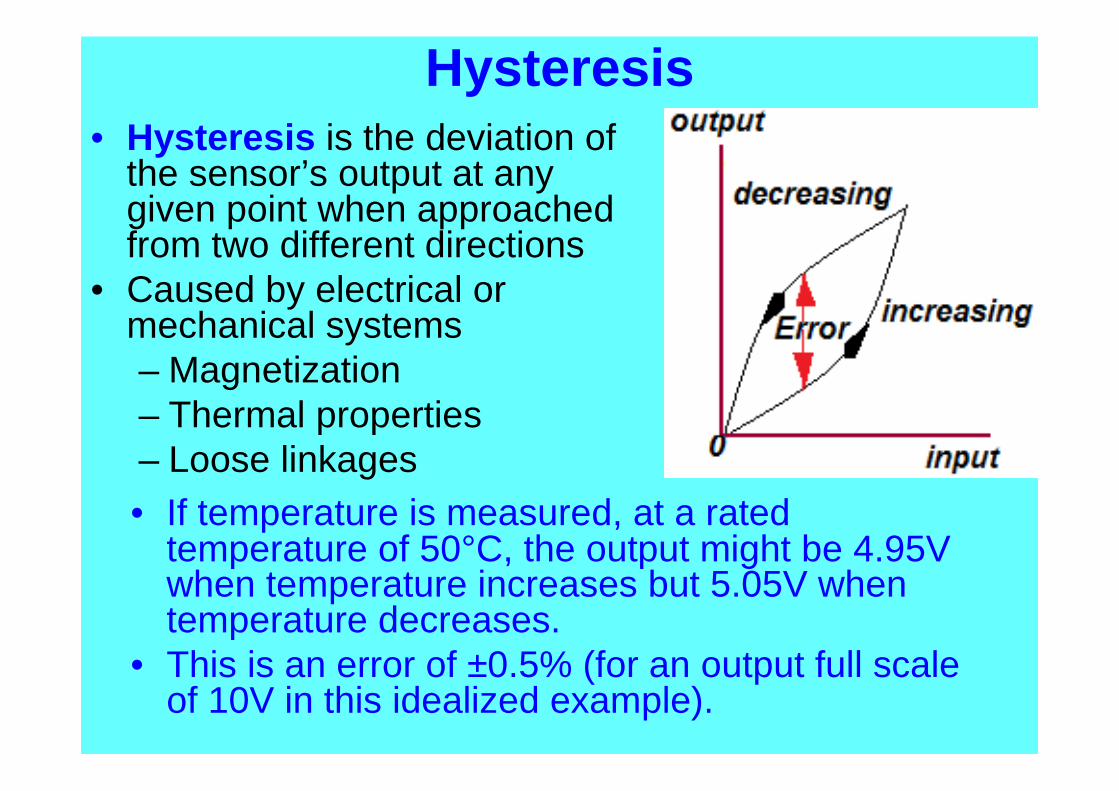
Hysteresis• Hysteresis is the deviation of
the sensor’s output at any given point when approached from two different directions
• Caused by electrical or mechanical systems– Magnetization– Thermal properties– Loose linkages• If temperature is measured, at a rated
temperature of 50°C, the output might be 4.95V when temperature increases but 5.05V when temperature decreases.
• This is an error of ±0.5% (for an output full scale of 10V in this idealized example).

Nonlinearity• Nonlinearity is defined as the
maximum deviation from the ideal linear transfer function.
• Nonlinearity must be deduced from the actual transfer function or from the calibration curve
• A few methods to do so:• a. by use of the range of the
sensor– Pass a straight line between
the range points (line 1)• b. use a linear best fit (least
squares) through the points of the curve (line 2)
• c. use the tangent to the curve at some point on the curveTake a point in the middle of the range of interest
-Draw the tangent and extend to the range of the curve (line 3)
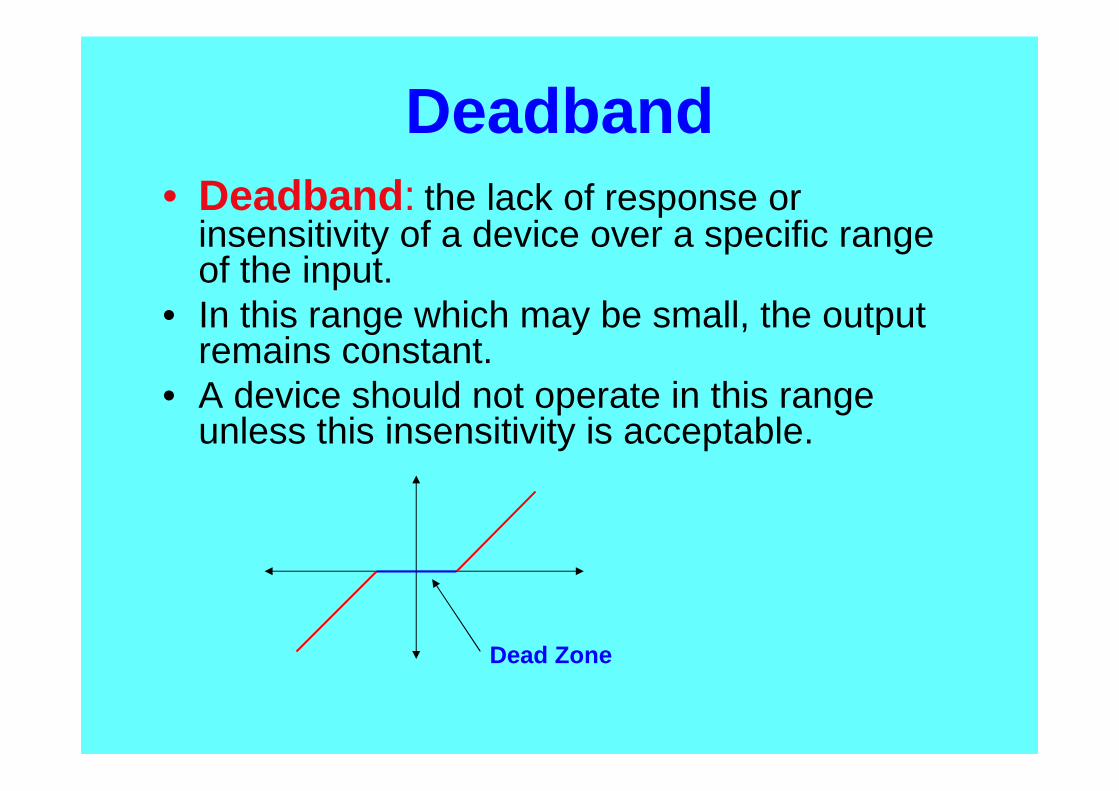
Deadband• Deadband : the lack of response or
insensitivity of a device over a specific range of the input.
• In this range which may be small, the output remains constant.
• A device should not operate in this range unless this insensitivity is acceptable.
Dead Zone
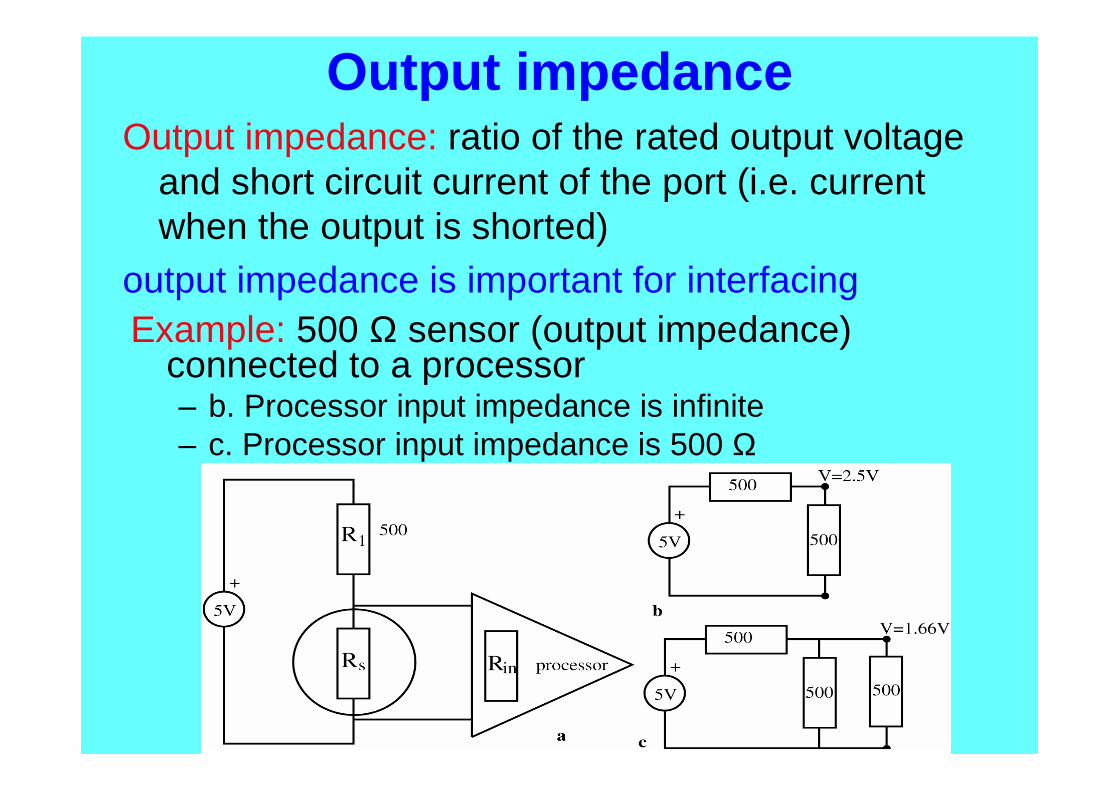
Output impedanceOutput impedance: ratio of the rated output voltage
and short circuit current of the port (i.e. current when the output is shorted)
output impedance is important for interfacingExample: 500 Ω sensor (output impedance)
connected to a processor– b. Processor input impedance is infinite – c. Processor input impedance is 500 Ω

Repeatability
• Also called reproducibility: failure of the sensor to represent the same value under identical conditions when measured at different times. – usually associated with calibration
– given as percentage of input full scale of the maximum difference between two readings taken at different times under identical input conditions.
100.minmax
Re ×−=rangefull
givenvaluesypeatabilit

Reliability
• Reliability : a statistical measure of quality of a device which indicates the ability of the device to perform its stated function, under normal operating conditions without failure for a stated period of time or number of cycles.
• Given in hours, years or in MTBF• Usually provided by the manufacturer• Based on accelerated lifetime testing

Sensitivity• Sensitivity of a sensor is defined as the
change in output for a given change in input, usually a unit change in input. Sensitivity represents the slope of the transfer function.
• Also is used to indicate sensitivity to other environment that is not measured.
• Example: sensitivity of resistance measurement to temperature change
ddR
aT + b = 1 → dRdT
= a Ω°C

Resolution• Resolution: the minimum increment in
stimulus to which the sensor can respond. It is the magnitude of the input change which results in the smallest observable output.
• Example: a digital voltmeter with resolution of 0.1V is used to measure the output of a sensor. The change in input (temperature, pressure, etc.) that will provide a change of 0.1V on the voltmeter is the resolution of the sensor/voltmeter system.
• In digital systems generally, resolution may be specified as 1/ 2N (N is the number of bit.)

Frequency response
• Frequency response: The ability of the device to respond to a harmonic (sinusoidal) input
• A plot of magnitude (power, displacement, etc.) as a function of frequency
• Indicates the range of the stimulus in which the device is usable (sensors and actuators)
• Provides important design parameters
• Sometimes the phase is also given (the pair of plots is the Bode diagram of the device)
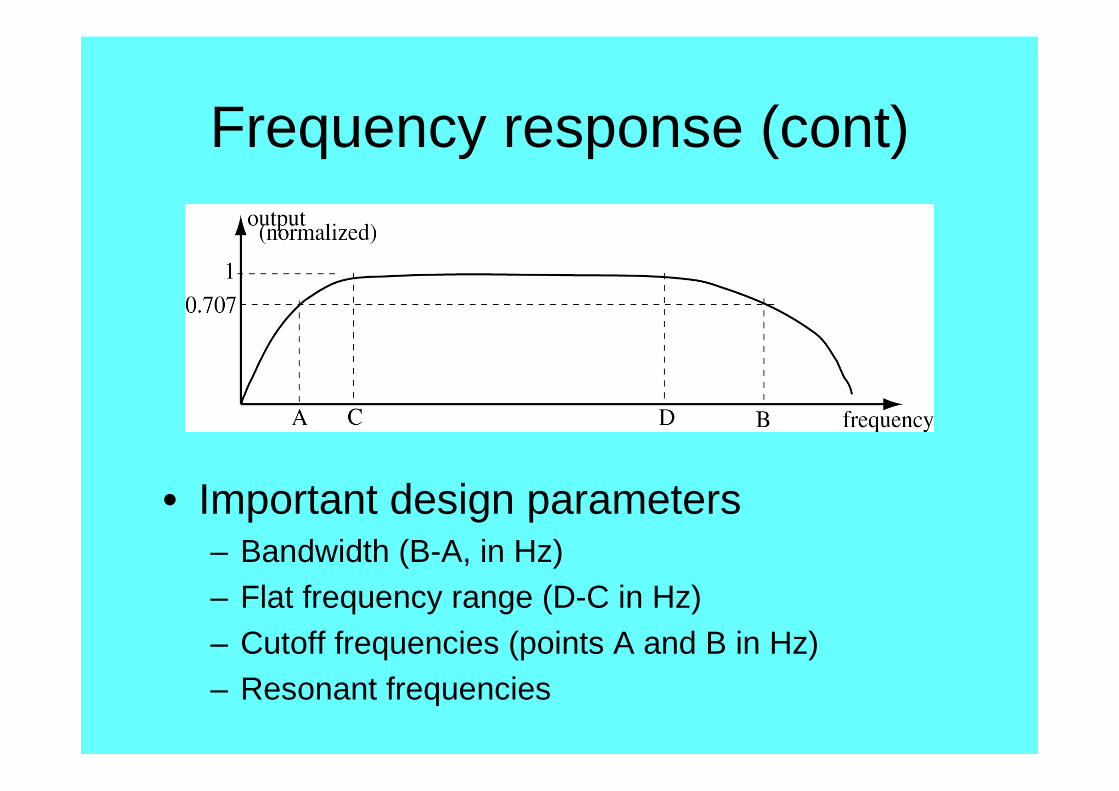
Frequency response (cont)
• Important design parameters– Bandwidth (B-A, in Hz)– Flat frequency range (D-C in Hz)– Cutoff frequencies (points A and B in Hz)– Resonant frequencies
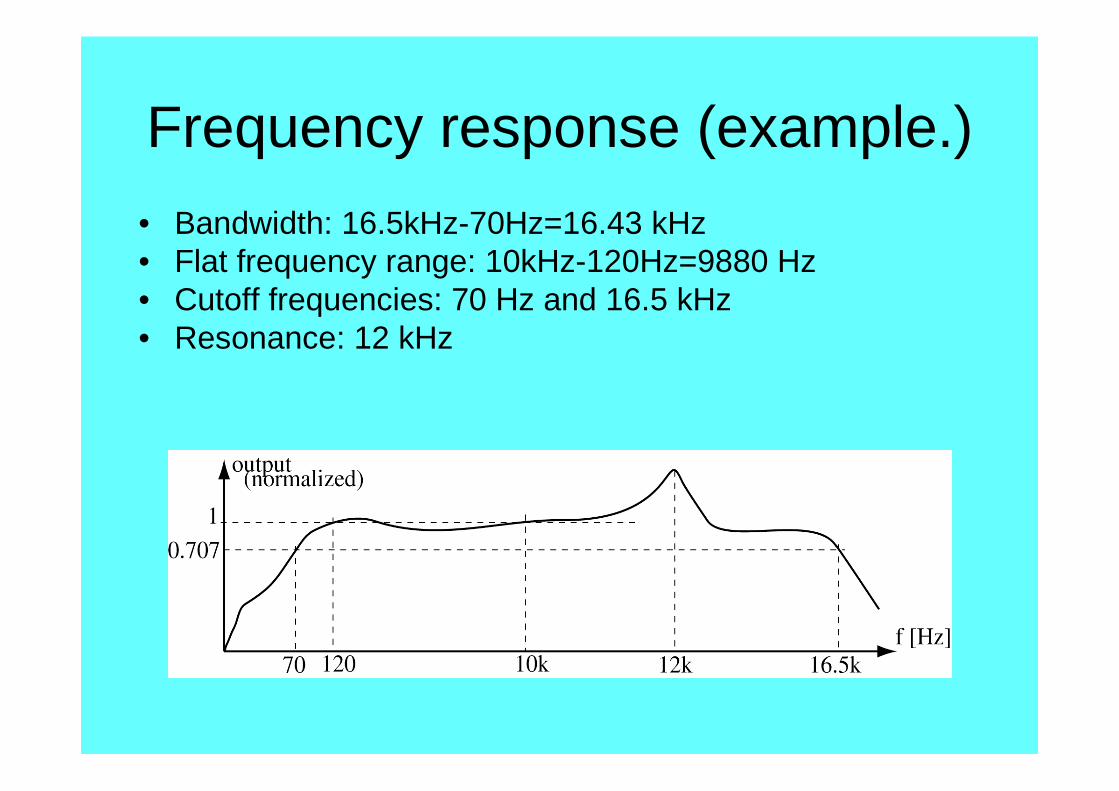
Frequency response (example.)
• Bandwidth: 16.5kHz-70Hz=16.43 kHz• Flat frequency range: 10kHz-120Hz=9880 Hz• Cutoff frequencies: 70 Hz and 16.5 kHz• Resonance: 12 kHz

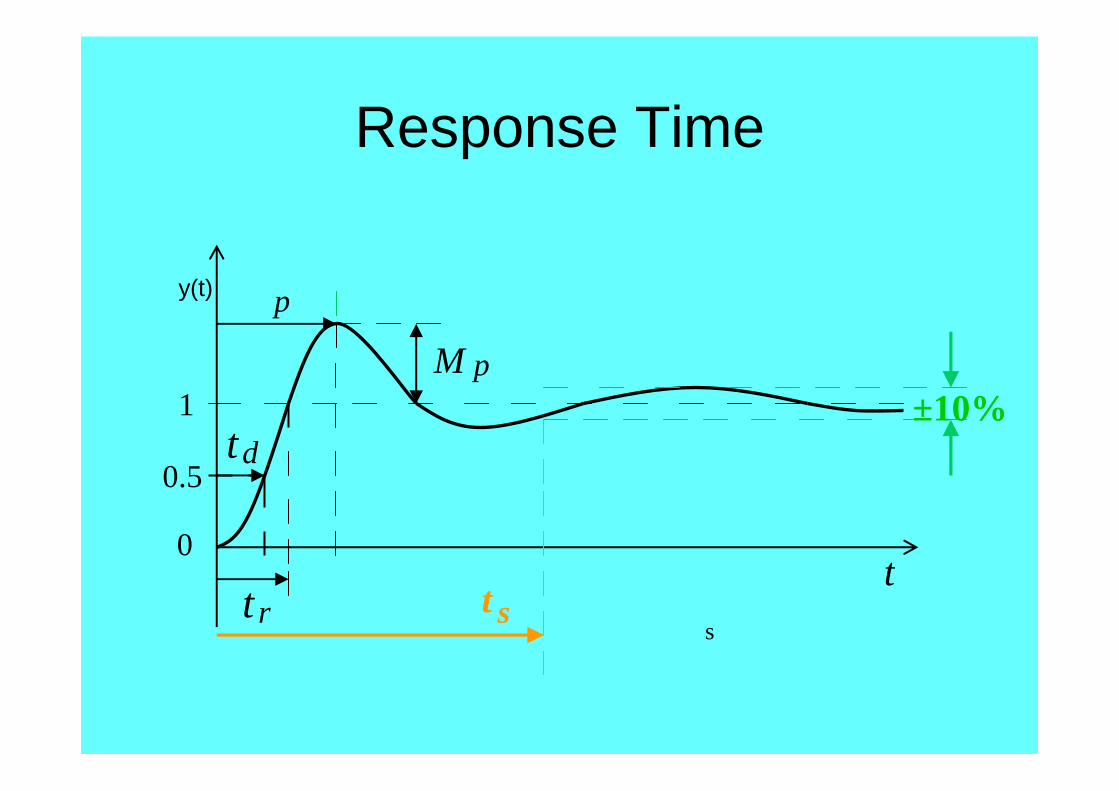
Response time
• Response time : indicates the time needed for the output to reach steady state for a step change in input.
• Typically the response time will be given as the time needed to reach 90% of steady state output upon exposure to a unit step change in input.
• The response time of the device is due to the inertia of the device (both “mechanical” and “electrical”).
• Fast response time is usually desirable • Slow response times tend to average readings
Response Time
t
1
0.5td
0
rt
p
M p
t ss
±10%
y(t)
Calibration• Calibration: the experimental determination of
the transfer function of a sensor or actuator. • Typically, needed when the transfer function
is not known or, • When the device must be operated at
tolerances below those specified by the manufacturer.
• Example, use a thermistor with a 5% tolerance on a full scale from 0 to 100°C to measure temperature with accuracy of, say, ±0.5°C.
• The only way this can be done is by first establishing the transfer function of the sensor.

Calibration (cont.)• Two methods:• Method1. known transfer function:
– Determine the slope and crossing point (line function) from two known stimuli (say two temperatures) if the transfer function is linear
– Measure the output– Calculate the slope and crossing point in V=aT+b– If the function is more complex, need more points:
V = aT + bT2 + cT3 + d– 4 measurements to calculate a,b,c,d– Must choose points effectively - if linear, use
points close to the range. If not, use equally spaced points or points around the locations of highest curvature

Calibration (con..)
Determine the output equation ?

Calibration (cont.)
• Method 2:
• b. Unknown transfer function:– Measure the output Ri at as many input values Ti as is
practical– Use the entire span– Calculate a best linear fit (least squares for example)– If the curve is not linear use a polynomial fit– May use piecewise linear segments if the number of points is
large.

Calibration (cont.)
• Calibration is sometimes an operational requirement (thermocouples, pressure sensors)
• Calibration data is usually supplied by the manufacturer
• Calibration procedures must be included with the design documents
• Errors due to calibration must be evaluated and specified
Displacement, position and proximity sensor
Displacement sensors are concerned with the measurement of amount by which some object has moved
Position sensors are concerned with the determination of the position of some object with rereference to some reference point
Proximity sensors are a form of position sensors. They are used to determine when an object has moved to within some particular critical distance of the sensor
When selecting these sensors its essential to care of :
-The size of displacement -Nature of the displacement
-The required resolution & accuracy -The material of the measured object
-cost

Contact sensors
Displacement, position and proximity sensor
Non-contacting sensors
The presence in the vicinity of the measured object cause change in air pressure or change in inductance or capacitance
The movement of the sensor element’s is used to cause a change in electrical volatge, resistance, capacitance or mutual inductance
The commonly used displacement sensors are given
below
1-10
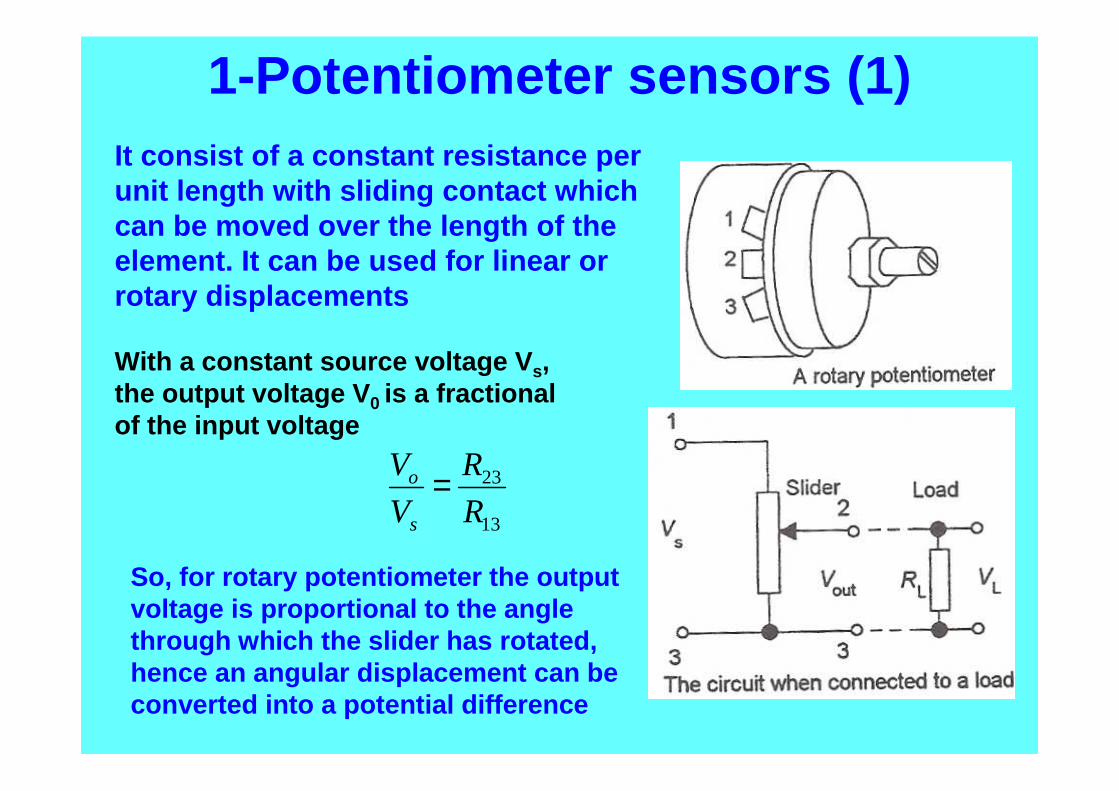
1-Potentiometer sensors (1)It consist of a constant resistance per unit length with sliding contact which can be moved over the length of the element. It can be used for linear or rotary displacements
With a constant source voltage V s, the output voltage V 0 is a fractional of the input voltage
13
23
R
R
V
V
s
o =
So, for rotary potentiometer the output voltage is proportional to the angle through which the slider has rotated, hence an angular displacement can be converted into a potential difference

1-Potentiometer sensors (2)It is very important to consider the effect of the load resistance R L connected across the output. The load voltage V L is only directly proportional to V0 if the load resistance is infinite.
Assuming that the total potentiometer resistance is R P, find the error in the output reading in terms of x as suggested in the shown figure. And if Vs=4 volt, R P=500 ohm and the slider is in the middle of the traveling range with a load resistance of 10 k Ohm. Find the value of the error (in volt)

2-Strain gauged element (1)Strain gauge is a metal wire, metal foil or a strip of semiconductor material, these elements can be stuck onto surfaces like a postage stamp. When subjected to strain, its resistance R changes, the fractional change in resistance being proportional to the strain ǫǫǫǫ, i.e
εGR
R =∆
For R=100, G=2, the change in resistance due to 0.001 strain is ∆R=RGǫ=0.2 ohm
G is the gauge factor typical values are 2 for metal foil or wires +100 for P-type, -100 for N-type semiconductor
Strain is the ratio of
change in length / orignal length

When the flexible element is bent or deformed as a result of forces being applied by a contact point being displaced, then the electrical resistance strain gauges mounted on the element are strained and so give a resistance change, which can be monitored. The change in resistance is thus a measure of the displacement or deformation of the flexible element
2-Strain gauged element (2)

3- Capacitive element (1)
• Since capacitance C of a parallel plate is given by:
• Capacitive sensors for monitoring of linear displacements might take the forms shown.
d
AC r 0εε=
In (a) if d is changed by a displacement x then capacitance is
xd
ACC r
+=∆+ 0εε
d
AC r 0εε=
dx
dx
C
C
/1
/
+−=∆
The change in the capacitance value is non linear relationship

3- Capacitive element (2)This nonlinearity can be overcome by using a push-pull displacement sensor shown. The displacement moves the central plate between the two outer plates so if initially the distance between plate 1 &2 equal the distance between plate 2 & 3 then C1=C2
And for small displacement x So when C1 is in one arm of an ac bridge and C2 in other arm then the result out balance voltage is proportional to x
V=a+bx ????
Show how