Chapter 2unstats.un.org/unsd/envaccounting/seeaw/egm/Draft_Chapter2.… · Web viewThe following...
30
5 November 2013 Rev 27 Chapter 2 INTEGRATION OF DATA IN ACCOUNTS TO RESPOND TO POLICY NEEDS This chapter provides and overview of the principles and main components of the accounts in the System of Environmental-Economic Accounts (SEEA) as they are applied to water in order to develop a monitoring system of comprehensive, consistent and comparable policy relevant information. The chapter also gives an overview of the standards that are used to classify economic activities and products. The concepts are explained through practical examples, which illustrate the use of the standard tables for checking data consistency, as well as providing a the basis for planning the data collection processes. I. Structure of water accounts and statistics Supply and use tables in physical and monetary terms Emission accounts Asset accounts Sequence of economic accounts Functional account Employment, demographic and social information tables II. International classification standards Industry (ISIC) and product (CPC) classifications Industrial activities and products most relevant for water accounts D R A F T 1
Transcript of Chapter 2unstats.un.org/unsd/envaccounting/seeaw/egm/Draft_Chapter2.… · Web viewThe following...

5 November 2013Rev 27
Chapter 2 INTEGRATION OF DATA IN ACCOUNTS TO RESPOND TO POLICY NEEDS
This chapter provides and overview of the principles and main components of the accounts in the System of Environmental-Economic Accounts (SEEA) as they are applied to water in order to develop a monitoring system of comprehensive, consistent and comparable policy relevant information. The chapter also gives an overview of the standards that are used to classify economic activities and products.
The concepts are explained through practical examples, which illustrate the use of the standard tables for checking data consistency, as well as providing a the basis for planning the data collection processes.
I. Structure of water accounts and statistics Supply and use tables in physical and monetary terms Emission accounts Asset accounts Sequence of economic accounts Functional account Employment, demographic and social information tablesII. International classification standards Industry (ISIC) and product (CPC) classifications Industrial activities and products most relevant for water accounts
D R A F T 1

.I. Structure of water accounts and statistics
The System of Environmental Economic Accounts for Water (SEEA-Water) and the International Recommendations for Water Statistics (IRWS), in combination with other statistical standards, provide the methodological basis for developing a monitoring system that provides comprehensive, consistent and comparable information for water policy design and evaluation.
The SEEA-Water is a subsystem of the System of Environmental Economic Accounts (SEEA). It applies the accounting concepts, structures, rules and principles of the System of National Accounts (SNA), which allows comparing and contrasting data across a broad spectrum of environmental and economic issues.
The following accounts and tables are characteristic of the SEEA and its subsystems:
Table 2.1.1. SEEA tables and accounts
Tables or accounts Brief descriptionSupply and use tables in physical and monetary terms (SEEA 2.3.2)
Show the flows of natural inputs, products and residuals for the different sectors or industrial activities. Supply and use tables are also compiled in monetary terms, especially to show information about the water supply and sewerage industries. Supply and use tables also include the release of pollutants.
Asset accounts (SEEA 2.3.3) Show the opening and closing stocks of environmental assets and the different types of changes of the stocks over an accounting period, in order to determine the depletion, if applicable, of the environmental assets.
Sequence of economic accounts (SEEA 2.3.4)
Follows the broad structure of the SNA sequence of accounts, showing the balancing items, such as value added, operating surplus, and net lending or borrowing. These balances can be adjusted using depletion measures from asset accounts.
Functional accounts (SEEA 2.3.5) These accounts highlight the relevant monetary information about transactions related to environmental activities and environmental goods and services.
Employment, demographic and social information tables (SEEA 2.3.6)
These complementary tables enhance the usefulness of the information in the other tables and accounts by relating environmental and economic data to estimates of employment, population and various demographic breakdowns.
Each of the five groups of tables and accounts for the case of water will be described below through examples.
D R A F T 2

Monetary supply and use tables
Monetary supply and use tables record all the flows of products in an economy between different economic units in monetary terms. They are compiled to describe the structure of an economy and the level of economic activity (SEEA 2.30). Monetary supply and use tables are actually a component of the SNA. They can be constructed with the information already available in the national accounts. The information has to be disaggregated and often complemented in order to respond to the needs of information for water policy.
Tables 2.1.2 and 2.1.3 show an example of monetary supply and use tables. They are part of the Sugarland example provided in these Guidelines. For simplicity, in the example it is assumed that there are neither taxes nor subsidies on products.
D R A F T 3

Table 2.1.2. Example of monetary supply table (in million dollars per year)
SUPPLYGrowing
sugar caneSugar milling
Manu-facture
Restau-rants and
hotels
Water Supply
SewerageRoW
(imports)
Total Supply (at basic prices)
Sugar cane 190 0 190Sugar 261 0 261Manufactured goods, services and minerals 312 500 812Restaurant and hotel services 250 0 250Water 30 0 30Sewerage 24 0 24
190 261 312 250 30 24 500 1 567
The supply table has industrial activities in the columns and products in the rows. Each column shows the output of the industrial activity in terms of each product shown in the corresponding row. There is an additional column, Rest of the World (RoW), which shows the monetary amounts of the imports of the different products.
Table 2.1.3. Example of monetary use table (in million dollars per year)
USEGrowing
sugar caneSugar milling
Manu-facture
Restau-rants and
hotels
Water Supply
SewerageRoW
(exports)GCF
Household consumption
Government consumption
Total Use (at purchaser's
prices)
Sugar cane 190 0 0 0 190Sugar 1 255 5 0 261Manufactured goods, services and minerals 5 10 152 15 5 5 60 250 310 0 812Restaurant and hotel services 5 225 20 0 250Water 10 0 20 0 30Sewerage 6 0 18 0 24
5 200 152 37 5 5 540 250 373 0 1567
The use table has a structure very similar to the supply table, but it shows uses instead of output. The columns of industrial activities show the intermediate consumption of each product necessary to produce the products shown in the supply table.
D R A F T 4

In the example, the supply table shows that the activity of “growing sugar cane” produced 190 million dollars worth of sugar cane. The use table shows that 5 million dollar worth of manufacturing goods, services and minerals were consumed in order to produce the sugar cane.
The column Rest of the World (RoW) shows the value of the exports of the different products. An additional column shows the Gross Capital Formation (GCF), which is the amount of products accumulated as fixed capital or in inventories. Two additional columns show the final consumption of the different products by households and government.
The main property of the supply and use tables is that supply is equal to use, so the sum of each row of the supply table is equal to the corresponding row in the use table. Adjustments need to be made due to taxes, subsidies, trade and transport margins. The quantities in the supply table are typically expressed at basic prices (excluding taxes, trade and transport margins, and including subsidies), and those of the use table are expressed at purchasers’ prices (including taxes, trade and transport margins, and excluding subsidies).
From the supply and use tables Gross Value Added (GVA) can be calculated as the difference between supply and use of each column. The sum of GVA of all the industries at basic prices plus taxes on products less subsidies on products is the Gross Domestic Product (GDP). Since in the example there are neither taxes nor subsidies on products, GDP is simply the sum of all the GVA. In the example GDP = 185 + 61 + 160 + 213 + 25 + 19 = 663 million dollars per year.
Table 2.1.4. Balance of supply and use by column (in million dollars per year)
Growing sugar cane
Sugar milling
Manu-facture
Restau-rants and
hotels
Water Supply
Sewerage
Total supply 190 261 312 250 30 24Total use 5 200 152 37 5 5Gross value added 185 61 160 213 25 19
In the example, the gross value added of the water and sewerage industrial activities represent respectively 3.8% and 2.9% of the GDP of the country or territory.
Physical supply and use tables
A very similar structure of the monetary supply and use tables can be used to record information of flows of materials and energy that enter and leave the economy and flows of materials and energy within the economy itself. When this information is recorded the tables are called physical supply and use tables. For the case of water, the flows of materials are flows of water expressed in units of volume per unit of time (e.g. million cubic meters per year).
In the physical supply and use tables the flows from the environment to the economy are recorded as natural inputs (e.g. abstractions of water). Flows within the economy are recorded as product flows, and flows from the economy to the environment are recorded as residuals (SEEA 2.14). Residuals may also be captured, collected, treated, recycled or reused by economic units (SEEA 3.74) remaining in the economy. D R A F T 5

The following is an example of physical water supply and use tables of a country or territory expressed in a simplified format:
Table 2.1.5. Example of physical water supply and use tables (in million cubic meters per year)
SUPPLYGrowing
sugar cane
Sugar milling
Manufacture
Restaurants and hotels
Water Supply
SewerageHouse-holds
Environment to
Economy
Total Supply
Surface water 0Groundwater 164 164Water 50 50Losses of water 21 50 71Sewage 8 29 37Treated wastewater 2 2 37 41Water returns to the environment 15 15"Water consumption" 18 3 3 2 11 37SUM 54 5 5 10 100 37 40 164 415
USEGrowing
sugar cane
Sugar milling
Manufacture
Restaurants and hotels
Water Supply
SewerageHouse-holds
Economy to
Environment
Total Use
Surface water 0Groundwater 54 5 5 100 164Water 10 40 50Losses of water 71 71Sewage 37 0 37Treated wastewater 41 41Water returns to the environment 15 15"Water consumption" 37 37SUM 54 5 5 10 100 37 40 164 415
D R A F T 6

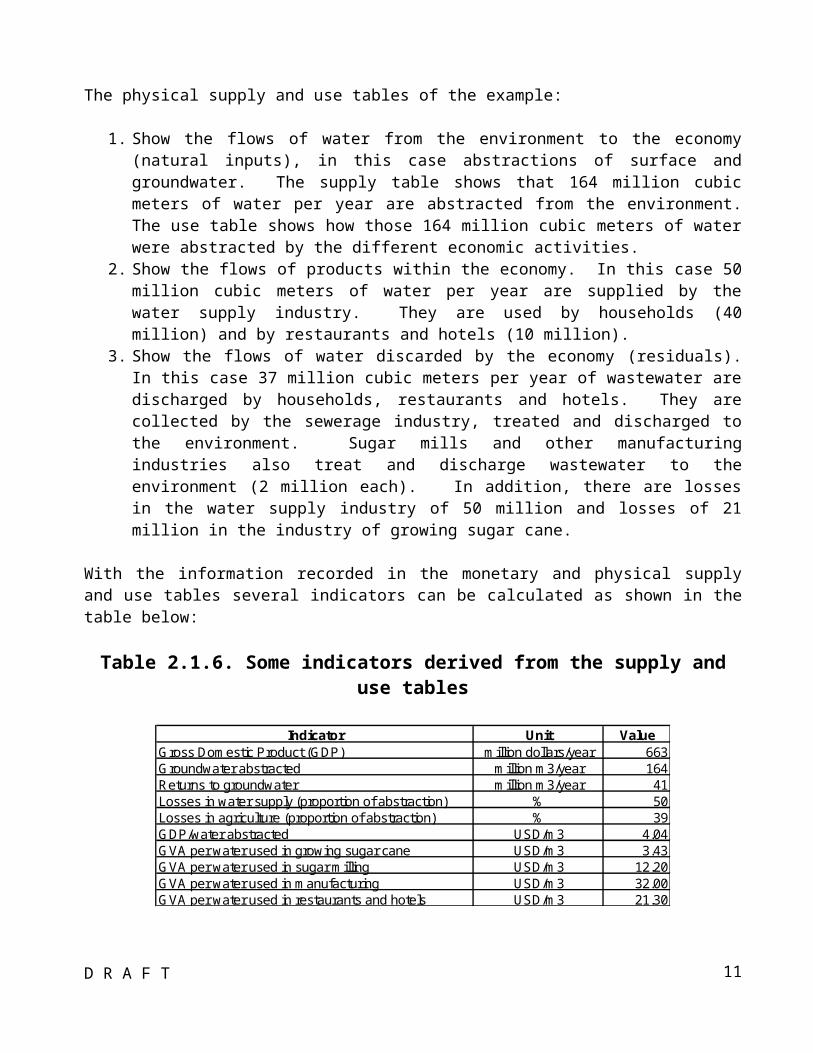
The physical supply and use tables of the example:
1. Show the flows of water from the environment to the economy (natural inputs), in this case abstractions of surface and groundwater. The supply table shows that 164 million cubic meters of water per year are abstracted from the environment. The use table shows how those 164 million cubic meters of water were abstracted by the different economic activities.
2. Show the flows of products within the economy. In this case 50 million cubic meters of water per year are supplied by the water supply industry. They are used by households (40 million) and by restaurants and hotels (10 million).
3. Show the flows of water discarded by the economy (residuals). In this case 37 million cubic meters per year of wastewater are discharged by households, restaurants and hotels. They are collected by the sewerage industry, treated and discharged to the environment. Sugar mills and other manufacturing industries also treat and discharge wastewater to the environment (2 million each). In addition, there are losses in the water supply industry of 50 million and losses of 21 million in the industry of growing sugar cane.
With the information recorded in the monetary and physical supply and use tables several indicators can be calculated as shown in the table below:
Table 2.1.6. Some indicators derived from the supply and use tables
Indicator Unit ValueGross Domestic Product (GDP) million dollars/year 663Groundwater abstracted million m3/year 164Returns to groundwater million m3/year 41Losses in water supply (proportion of abstraction) % 50Losses in agriculture (proportion of abstraction) % 39GDP/water abstracted USD/m3 4.04GVA per water used in growing sugar cane USD/m3 3.43GVA per water used in sugar milling USD/m3 12.20GVA per water used in manufacturing USD/m3 32.00GVA per water used in restaurants and hotels USD/m3 21.30
Emission accounts
Emission accounts have the same structure of the physical supply and use tables, but instead of showing amounts of water supplied or used they show amounts of pollutants supplied or used.
Releases are polluting substances released by establishments and households as a result of production, consumption and accumulation. Emissions are releases to the environment. Releases and emissions only consider the amounts of pollution added by the activities.
The tables below shows an example of emission accounts. In the example households release 8 100 tons of BOD to sewerage. Manufacture industries release 1 500 and restaurants and hotels release 2 000. Sewerage collects 11 600 tons of BOD, but only releases to the environment (emissions) 3 200. Also the activity of sugar milling releases 800 tons of BOD to the environment (emissions).
D R A F T 7

Table 2.1.7. Example of emission accounts (in tons of BOD per year)
SUPPLYGrowing
sugar caneSugar milling
Manu-facture
Restau-rants and
hotels
Water Supply
SewerageHouse- holds
Flows from the environ-
mentTotal Supply
Emissions of organic pollution (tons of BOD)
800 3 200 0 4 000
Releases (in the economy) of organic pollution (tons of BOD)
1 500 2 000 8 100 11 600
0 800 1 500 2 000 0 3 200 8 100 0 15 600
USEGrowing
sugar caneSugar milling
Manu-facture
Restau-rants and
hotels
Water Supply
SewerageHouse- holds
Flows to the environ-
mentTotal Use
Emissions of organic pollution (tons of BOD)
4 000 4 000
Releases (in the economy) of organic pollution (tons of BOD)
11 600 0 11 600
0 0 0 0 0 11 600 0 4 000 15 600
D R A F T 8

Asset accounts
The intent of asset accounts is to record the opening and closing stock of environmental assets and the different types of changes in the stock over an accounting period. One motivation for accounting for environmental assets is to assess whether current patterns of economic activity are depleting and degrading the available environmental assets (SEEA 2.49).
Asset accounts can be recorded in physical and monetary terms. In the case of water asset accounts are only recorded in physical terms, since there is yet no standardized way of valuing the water assets.
Asset accounts start with the opening stock, at the beginning of the accounting period, of environmental assets, and end with the closing stock, at the end of the accounting period, of environmental assets. The changes in between are recorded as additions and reductions in stock with a description of the additions and reductions.
The following table shows an example of asset accounts. It builds on the example shown above for the supply and use tables.
Table 2.1.8. Example of asset accounts (million cubic meters)
Surface water
Ground-water Soil water TOTAL
Opening stock of water resources 250 250Additions to stock
Returns 17 41 58Precipitation 2210 2210
Inflows from other territories 0Inflows from other inland water resources 1436 111 1547
Discoveries of water in aquifers 0Total additions to stock 1453 152 2210 3815
Reductions in stockAbstraction 164 164
Evapotranspiration 663 663Outflows to other territories 0
Outflows to the sea 1453 1453Outflows to other inland water resources 1547 1547
Total reductions in stock 1453 164 2210 3827Closing stock of water resources 238 238
The example above in physical terms can be expressed graphically as shown in the following figures.
The first figure below shows key information about the water cycle, such as precipitation, evapotranspiration, surface runoff, infiltration to the aquifers, and outflow to the sea. All the information to construct the figure is recorded in the asset accounts shown above.
The second figure shows key information about the water cycle in the economy, such as abstractions, water supplied, and returns. All the information to construct the figure is recorded in the supply and use tables shown above.
D R A F T 9

Figure 2.1.1. Example of inland water resources flows (million cubic meters)
Surface water
Sea
Aquifer
111
2210
Soil
663
1436
41164
17
69
0
Returns from Sugarcanefields and sugar mills
Wastewater from sewers and Manufacturing. Losses from water supplynetwork
Losses
Abstractions
1453
B.1C.1
D.5D.6
Figure 2.1.2. Example of water flows in the economy (million cubic meters)
Surface water resources
Water utility
Sugarcanefields
Losses:
Households
Sugar mills
Losses:
Sewers
Sea
Aquifer
Manufacturing
Hotels and restaurants
15
5
229
10054 21
50
408
37
2
5
50
10
30
20
D R A F T 10
Sequence of economic accounts
A wide range of monetary flows are recorded in the sequence of accounts of the SNA. The SEEA sequence of accounts follows the broad structure of the SNA sequence of accounts, showing the balancing items, such as value added, operating surplus, and net lending or borrowing. These balances are adjusted using depletion measures from asset accounts.
The table below shows the accounts that make the SEEA sequence of economic accounts.
Table 2.1.9. SEEA sequence of economic accounts
Account Balancing items1 Production account Gross value added (GVA)
Net value added = GVA less consumption of fixed capital (CFC) Depletion adjusted Net Value Added = Net Value Added less
depletion of natural resources2 Generation of income
account Gross operating surplus (GOS) Net operating surplus = GOS less CFC Depletion adjusted net operating surplus = Net operating surplus
less depletion of natural resources3 Allocation of primary
income account Gross balance of primary income Net balance of primary income = Gross balance of primary
income less CFC. Depletion adjusted net balance of primary income = net balance
of primary income less depletion adjusted natural resources4 Secondary distribution of
income account Gross disposable income Net disposable income = Gross disposable income less CFC Depletion adjusted disposable income = Net disposable income
less depletion of natural resources5 Use of disposable income
account Gross saving Net saving = Gross saving less CFC Depletion adjusted net saving = Net saving less depletion of
natural resources6 Capital account Net lending or borrowing
The sequence of economic accounts is also useful for understanding the financial flows of specific sectors or industries. For example, the sequence is very useful for identifying financial gaps in the water supply and sewerage industries.
The following is an example of financial flows in the water and sewerage industries. In the example: the output of the industry is 100 million dollars (producers’ price). This is the total amount
billed as concept of water and sewerage, including taxes and excluding subsidies on products. 40 million dollars are spent on the different goods and services consumed as inputs in the
processes of providing the services.
D R A F T 11

40 million dollars are spent in compensation of employees, which includes wages, salaries and employee’s social contributions.
2 million dollars are taxes on products collected on behalf of the government through the water and sewerage price.
10 million dollars are received from the government for the concept of subsidies on products. 1 million dollars is paid to the government as concept of taxes on production. 2 million dollars are received from the government as concept of subsidy on production. 3 million dollars are paid for the concept of property income. This includes interest on loans
payable and also the amounts payable for the concept of royalties or water rights to the government for the abstraction of water.
There are no current transfers in the example, but this concept includes income taxes, among other transfers.
35 million dollars is the consumption of fixed capital. It is the depreciation of all the equipment and infrastructure used for water supply and sewerage.
5 million dollars were received for the concept of capital transfers. These are occasional transfers, such as investment grants.
Table 2.1.10. Simplified sequence of accounts for the water supply and sewerage industries (million dollars per year)
Resources Uses BalanceOutput (producers' price) 100
Intermediate consumption 40GROSS VALUE ADDED 60
Compensation of employees 40Taxes on products 2
Subsidies on products 10Other taxes on production 1
Other subsidies on production 2GROSS OPERATING SURPLUS 29
Property income 0 3 -3BALANCE OF PRIMARY INCOME 26
Current transfers 0 0 0GROSS SAVING 26
Consumption of fixed capital 35Capital transfers 5 0 5
CHANGES IN NET WORTH DUE TO SAVING & TRANSFERS -4
Changes in volume 0Revaluation 0
CHANGES IN NET WORTH -4
D R A F T 12

The example shows that there was a loss of net worth of 4 million dollars for the current accounting period. If this loss occurs every year, it means there is a financial gap, which could be covered increasing the tariffs for the services (increasing output) or increasing the different subsidies (current and capital transfers. Also the efficiency of the system could be increased.
Figure 2.1.3. Graphical representation of the sequence of accounts (in million dollars per year)
GAP = 4D9r = 5D39 = 2
F = 6D4 = 3D2 = 3
P51c = 35 (CFC)
"Tariffs"
"Taxes and Transfers"
P2 = 40
D1 = 40
D31 = 10
P1 = 100
P51g = 25 (GFCF)
CODESP1 = Output at producers' priceP2 = Intermediate consumption at purchasers' priceD2 = Taxes on production and importsD4 = Property income payable less receivableD9r = Capital transfersD31 = Subsidies on productsD39 = Other subsidies on productionF = Acquisition of financial assets
Another important aspect to consider is the efficiency in the collection of the water and sewerage tariffs. In many developing countries the efficiency in the collection of tariffs is very low and
D R A F T 13

therefore there is an accumulation of accounts receivable, which will appear in the financial account. Eventually, it may not be possible to collect the accounts receivable, and therefore they will have to be written off, decreasing the financial assets. This issue is discussed in more detail in chapters 3 and 4.
Functional accounts
These accounts provide further disaggregation of the conventional industry and product classifications in order to highlight environmental activities and products. They include monetary information about activities undertaken to preserve and protect the environment. There are also taxes and subsidies that reflect efforts by governments to influence the behaviour of producers and consumers with respect to the environment.
Environmental activities are classified as: Environmental protection activities, which have the primary purpose of preventing, reducing
and eliminating pollution and other forms of degradation of the environment. This includes wastewater management activities.
Resource management activities, which have the primary purpose of preserving and maintaining the stock of natural resources and hence safeguarding against depletion. This includes management of water resources activities.
Environmental goods and services include specific services, “connected” products and “adapted” goods. “Adapted” products include, for example, phosphate-free washing products and highly biodegradable products. “Connected” products include, for example, septic tanks, biological activators of septic tanks and services for collecting septic tank sludge.
Employment, demographic and social information tables
The usefulness of the information in the various tables and accounts of the SEEA-CF can be enhanced by relating different environmental and economic data to estimates of employment, estimates of population, various demographic breakdowns (such as age, household income levels, and household characteristics related to material well-being), and social measures, such as health and education (SEEA 6.48).
.II. International classification standards
D R A F T 14

Accounts are designed to provide information about the behaviour of institutional units and the activities in which they engage, namely production, consumption, and accumulation. This is achieved by recording the exchange of goods, services and assets between institutional units in the form of transactions1. Institutional units can be households, and legal or social entities, which include enterprises, government units, and non-profit institutions.
The statistical work is aimed at collecting data from each element of the system (the institutional units) and aggregate them according to specific rules in order to understand the behaviour of the interconnected elements. In order to better understand the system according to the different production activities, enterprises are broken down into one or more establishments. An establishment is an enterprise, or part of an enterprise, that is situated in a single location and in which only a single productive activity accounts for most of the value added. For statistical purposes the establishment becomes the basic statistical unit. In some cases it may not be possible or practical to divide enterprises into establishments, and therefore the information is reported by enterprises.
Industry and product classifications
In order to combine the data, the establishments are classified according to the International Standard Industrial Classification of All Economic Activities (ISIC). Likewise the products produced, consumed or accumulated by each establishment are classified according to another standard, the Central Product Classification (CPC). This standard classifications and their relevance to water are described below.
The ISIC is organized in a hierarchical four-level structure of mutually exclusive and collectively exhaustive categories. Each category is coded with a letter for the section, and then numerically with two digits for divisions, three for groups, and four for classes. The zeros to the left are relevant in the classification codes of industrial activities and products (e.g. growing of non-perennial crops has the ISIC code 011 and not 11, which corresponds to manufacture of beverages).
EXAMPLE: Operation of waterway locks is identified by the code 5222, according to ISIC. It belongs to section H, transportation and storage; division 52, warehousing and support activities for transportation; group 522, support activities for transportation; class 5222, service activities incidental to water transportation.
Different versions of the ISIC have been adopted by the United Nations Statistical Commission (UNSC) through the years. The most recent version of the standard is revision 4, which was adopted in 2006.
The Central Product Classification (CPC) provides standardized mutually exclusive and collectively exhaustive categories of products (goods and services) produced by the different industries. The most recent version of the classification is version 2, which was completed on 31 December 2008.
1 System of National Accounts 2008, paragraph 1.7
D R A F T 15

The classification of products is divided into sections, divisions, groups, classes and subclasses with identifiers of up to 5 digits.
EXAMPLE: Seeds of wheat belong to CPC subclass 01111. They belong to section 0, agriculture, forestry, and fishery products; division 01, products of agriculture, horticulture and market gardening; group 011, cereals; class 0111, wheat subclass 01111, wheat, seed.
CPC classifies products into categories based on the physical properties and the intrinsic nature of the products as well as the principle of industrial origin. The table below shows in the columns the different industries by ISIC section category and in the rows it shows the products by the different CPC section categories.
As it can be seen through the diagonal of the table below, there is some correlation between the industries and the products, e.g. industries in section A of ISIC (agriculture, forestry and fishing) are the main producers of products in section 0 of CPC (agriculture, forestry and fishing), even though, industries in this section also produce food products, in section 2, for example.
A B C D E F G H I J K L M N O P Q R S T U
Agr
icul
ture
, for
estry
and
fish
ing
Min
ing
and
quar
ryin
g
Man
ufac
turin
g
Ele
ctric
ity, g
as, s
team
and
air
cond
ition
ing
supp
ly
Wat
er s
uppl
y; s
ewer
age,
was
te
man
agem
ent a
nd re
med
iatio
n ac
tiviti
es
Con
stru
ctio
n
Who
lesa
le a
nd re
tail
trade
; rep
air o
f mot
or
vehi
cles
and
mot
orcy
cles
Tran
spor
tatio
n an
d st
orag
e
Acc
omm
odat
ion
and
food
ser
vice
act
iviti
es
Info
rmat
ion
and
com
mun
icat
ion
Fina
ncia
l and
insu
ranc
e ac
tiviti
es
Rea
l est
ate
activ
ities
Pro
fess
iona
l, sc
ient
ific
and
tech
nica
l ac
tiviti
es
Adm
inis
trativ
e an
d su
ppor
t ser
vice
act
iviti
es
Pub
lic a
dmin
istra
tion
and
defe
nce;
co
mpu
lsor
y so
cial
sec
urity
Edu
catio
n
Hum
an h
ealth
and
soc
ial w
ork
activ
ities
Arts
, ent
erta
inm
ent a
nd re
crea
tion
Oth
er s
ervi
ce a
ctiv
ities
Act
iviti
es o
f hou
seho
lds
as e
mpl
oyer
s;
undi
ffere
ntia
ted
good
s- a
nd s
ervi
ces-
prod
ucin
g ac
tiviti
es o
f hou
seho
lds
for o
wn
use
Act
iviti
es o
f ext
rate
rrito
rial o
rgan
izat
ions
and
bo
dies
0 Agriculture, forestry and fishery products
1 Ores and minerals; electricity, gas and water
2 Food products, beverages and tobacco; textiles, apparel and leather products
3 Other transportable goods, except metal products, machinery and equipment
4 Metal products, machinery and equipment
5 Constructions and construction services
6 Distributive trade services; accommodation, food and beverage serving services; transport services; and electricity, gas and water distribution services
7 Financial and related services; real estate services; and rental and leasing services
8 Business and production services9 Community, social and personal
services
Industries by ISIC section
Products by CPC section
D R A F T 16

The latest version of CPC is version 2, which was completed in 2008.
Different regions and countries have adapted the standard classifications for their own specific needs. Some examples follow:
Region or Country Standard Classification of Industries
Standard Classification of Products
European Community Statistical Classification of Economic Activities in the European Community (known by the French acronym NACE).
Statistical Classification of Products by Activity in the European Economic Community (CPA)
Canada, Mexico and the United States of America
North American Industry Classification System (NAICS)
North American Product Classification System (NAPCS)
Australia and New Zealand
Australian and NewZealand StandardIndustrial Classification(ANZSIC)
Australian and New Zealand Standard Product Classification (ANZSPC)
Brazil National Classification of Economic Activities (CNAE)
List of industry products (PRODLIST)
Most of the regional and country specific classifications of industrial activities and products follow the same principles of the ISIC and CPC. However, they may have more detailed classifications or provide a different disaggregation. Correspondence tables for the different classifications have been developed in order to facilitate their comparability.
Industrial activities and products most relevant for water accounts
The two products most relevant to water resources management and water policy are natural water (CPC 18000), which is a good, and sewage treatment services (CPC 94110), which is a service:
Product subclass according to CPC
Description of products related to water
Remarks
18000 Natural water Includes potable and non-potable water, suitable for further use, including treated and untreated water.
94110 Sewerage and sewage treatment services
Includes sewage removal services and sewage treatment services.
The two products above are generated primarily by two industrial activities: water supply (ISIC 3600) and sewerage (ISIC 3700):
Industry class according to ISIC
Description of activities related to water
Remarks
3600 Water collection, treatment and supply
In water accounts it is important to separate the establishments that supply water through water supply networks in cities (drinking water that is
D R A F T 17

Industry class according to ISIC
Description of activities related to water
Remarks
used in households and industries connected to the water supply network) from the ones that operate irrigation canals, or supply water for other purposes.
3700 Sewerage This activity includes the collection and treatment of wastewater.
The following table shows a breakdown of industrial activities or divisions of activities that are most relevant in terms of use of water:
Industry category according to ISIC
Description of activities related to water
Remarks
Section A (Divisions 01 to 03)
Agriculture, forestry and fishing
This is the activity that uses the largest proportion of inland water resources abstracted for off-stream uses in the world. The main use of water is irrigation of crops. The abstraction may be performed by this industrial activity or by ISIC 3600, which supplies the water to agriculture.
0161 Operation of agricultural irrigation equipment.
A support activity that includes the operation of agricultural irrigation equipment.
3510 Electric power generation It is important to separate the establishments that produce electricity in hydroelectric plants (instream use) from the establishments that produce it through other types of power stations, using water mainly for cooling (offstream use)..
5222 Operation of waterway locks The operation of locks requires large quantities of water. This use of water is considered an instream use.
Section B (Divisions 05 to 09)
Mining and quarrying Mining industries may be significant water users and may also be significant sources of water discharges and waterborne emissions (pollution). Water use by mining industries includes abstracting water as a part of mine dewatering operations (i.e., removing water from mines to make them passable by labour and equipment so that minerals can be recovered) (IRWS 3.50).
Section C (Divisions 10 to 33) and Section F (Divisions 41 to 43)
Manufacturing and construction
The following divisions are usually most relevant for water accounts:10 – Manufacture of food.11 – Manufacture of beverages.17 – Manufacture of paper and paper products.19 – Manufacture of coke and refined petroleum20 – Manufacture of chemicals and chemical products
D R A F T 18

Industry category according to ISIC
Description of activities related to water
Remarks
Divisions 38 to 99 A wide variety of service industries, including wholesalers, retailers, accommodation and food service activities.
Often, these industries are supplied by the water supply industry (activity 3600) through the drinking water supply network.
The following divisions are usually most relevant for water accounts:55 – Accommodation.56 – Food and beverage service activities.
Also, for the functional accounts, the activity 3900, remediation activities and other waste management services is of special interest to water. It includes the decontamination of soils and groundwater at the place of pollution. It also includes the decontamination and cleaning up of surface water following accidental pollution.
REFERENCES:
United Nations Statistics Division.- International Standard Industrial Classification of All Economic Activities, Revision 4 (ISIC).- New York 2008.
United Nations Statistics Division.- Central Product Classification, Revision 1.1 (CPC).- New York 2002. (Publication Series M, No. 77/Ver.1.1)
United Nations Statistics Division.- International Recommendations for Water Statistics.- 2012.
United Nations Statistics Division.- System of Environmental-Economic Accounting for Water (SEEA-Water).- 2012.
United Nations Statistics Division – System of Environmental-Economic Accounting Central Framework (SEEA-CF). White cover publication. 2012
United Nations Statistics Division.- System of National Accounts (SNA) 2008
D R A F T 19