
Gowanus Watershed Potential Blueways Map DRAFT, January 2011
Chapter 5
WATERSHED SURVEY AND MAP ASSESSMENT
• Directions for Completing the Watershed Survey and Map Assessment Forms
• Create A Map of Your Watershed
• Land Use Activities and Impervious Cover
• General Waterbody and Watershed Characteristics
• Pipe and Drainage Ditch Inventory
• Sample Watershed Survey and Map Assessment Form One of the most rewarding and least costly monitoring activities a volunteer program can conduct is the Watershed Survey. Some programs call it a windshield survey, a visual survey, or a watershed inventory. It is, in essence, a comprehensive survey of the geography, land and water uses, potential and actual pollution sources, and history of the waterbody and its watershed. The watershed survey requires little in the way of training or equipment. Its chief uses include:
• Screening for pollution problems
• Identifying potential sources of pollution
• Identifying sites for monitoring
• Helping interpret biological and chemical information
• Giving volunteers and local residents a sense of the value of the stream or watershed
• Educating volunteers and the local community about potential pollution sources and the stressors affecting the stream and its watershed
• Providing a blueprint for possible community restoration efforts such as cleanups, stream bank stabilization and riparian tree plantings
• Determining whether those stressors are, in fact, affecting the stream requires additional monitoring of chemical, physical, or biological conditions.
Researching the watershed is generally a one time per year activity, which should yield valuable information about the cultural and natural history of your waterbody and the uses of the land surrounding it. This information will prove helpful in orienting new volunteers to the purpose of the monitoring program, in building a sense of the importance of the stream, lake, or wetland, and identifying land use activities in the watershed with a potential to affect the quality of the waterbody. The background investigation is essentially a "detective investigation" for information.
Asking the Questions Before beginning the Watershed Survey and Map Assessment, think about what it is you want to know about the stream, lake or wetland you are surveying. Types of information include:
• Location of the stream's headwaters, its length, where it flows, and where it empties
• Name and boundaries of the watershed it occupies, the population in the watershed, and the communities through which it flows
• Roles of various jurisdictions in managing the waterbody and watershed (city, county, state government)
• Percentage of watershed land area in each town or jurisdiction
• Land uses in the watershed
• Industries and others that discharge to the stream
• Current uses of the waterbody (such as fishing, swimming, drinking water supply, irrigation)
• Historical land uses
• History of the waterbody
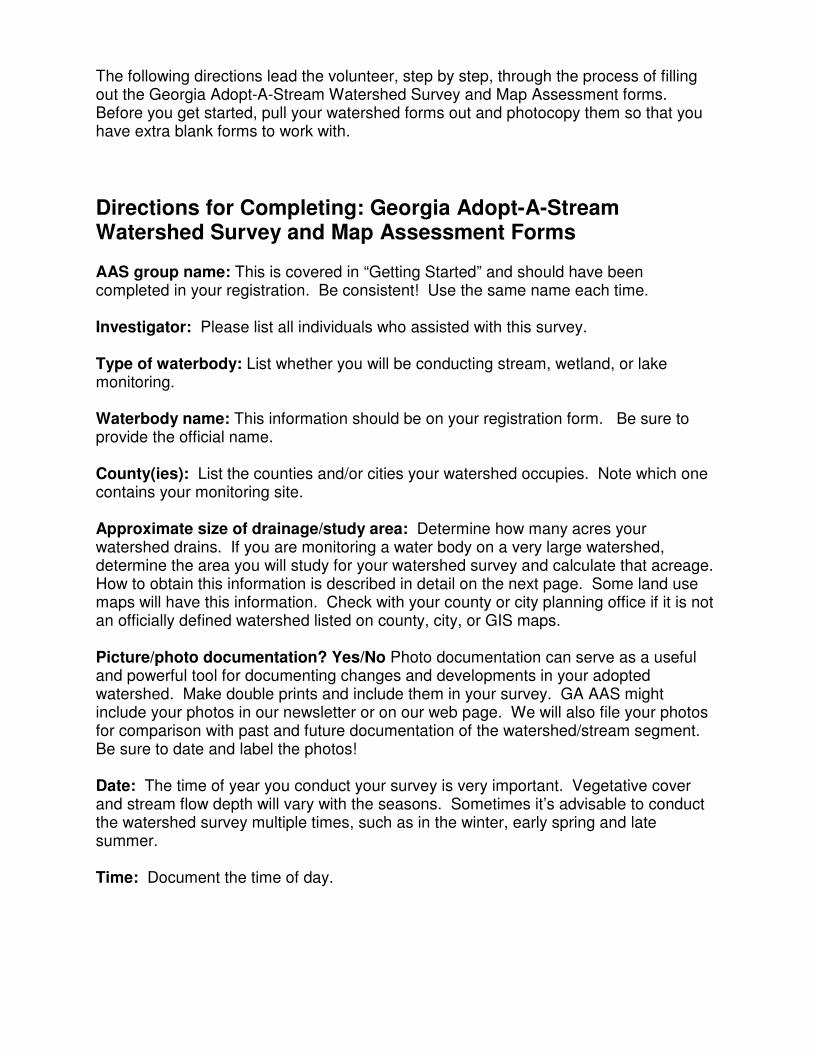
The following directions lead the volunteer, step by step, through the process of filling out the Georgia Adopt-A-Stream Watershed Survey and Map Assessment forms. Before you get started, pull your watershed forms out and photocopy them so that you have extra blank forms to work with.
Directions for Completing: Georgia Adopt-A-Stream Watershed Survey and Map Assessment Forms AAS group name: This is covered in “Getting Started” and should have been completed in your registration. Be consistent! Use the same name each time. Investigator: Please list all individuals who assisted with this survey. Type of waterbody: List whether you will be conducting stream, wetland, or lake monitoring. Waterbody name: This information should be on your registration form. Be sure to provide the official name. County(ies): List the counties and/or cities your watershed occupies. Note which one contains your monitoring site. Approximate size of drainage/study area: Determine how many acres your watershed drains. If you are monitoring a water body on a very large watershed, determine the area you will study for your watershed survey and calculate that acreage. How to obtain this information is described in detail on the next page. Some land use maps will have this information. Check with your county or city planning office if it is not an officially defined watershed listed on county, city, or GIS maps. Picture/photo documentation? Yes/No Photo documentation can serve as a useful and powerful tool for documenting changes and developments in your adopted watershed. Make double prints and include them in your survey. GA AAS might include your photos in our newsletter or on our web page. We will also file your photos for comparison with past and future documentation of the watershed/stream segment. Be sure to date and label the photos! Date: The time of year you conduct your survey is very important. Vegetative cover and stream flow depth will vary with the seasons. Sometimes it’s advisable to conduct the watershed survey multiple times, such as in the winter, early spring and late summer. Time: Document the time of day.
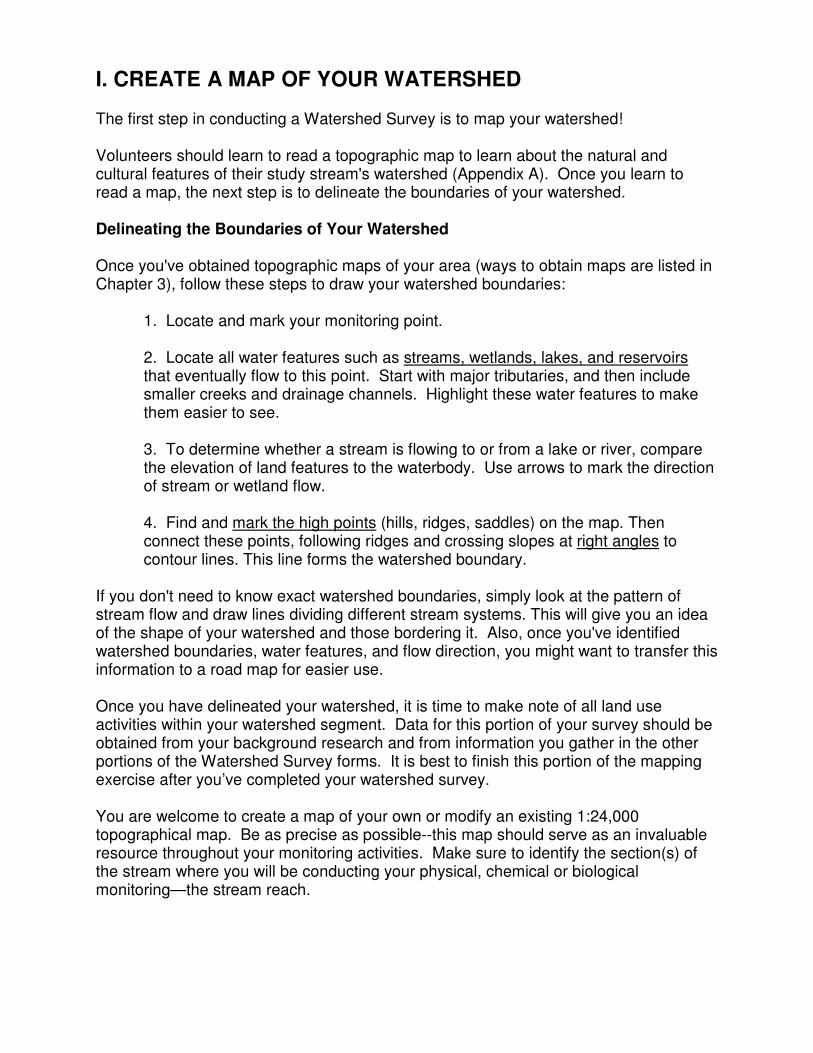
I. CREATE A MAP OF YOUR WATERSHED The first step in conducting a Watershed Survey is to map your watershed! Volunteers should learn to read a topographic map to learn about the natural and cultural features of their study stream's watershed (Appendix A). Once you learn to read a map, the next step is to delineate the boundaries of your watershed. Delineating the Boundaries of Your Watershed Once you've obtained topographic maps of your area (ways to obtain maps are listed in Chapter 3), follow these steps to draw your watershed boundaries:
1. Locate and mark your monitoring point. 2. Locate all water features such as streams, wetlands, lakes, and reservoirs that eventually flow to this point. Start with major tributaries, and then include smaller creeks and drainage channels. Highlight these water features to make them easier to see. 3. To determine whether a stream is flowing to or from a lake or river, compare the elevation of land features to the waterbody. Use arrows to mark the direction of stream or wetland flow. 4. Find and mark the high points (hills, ridges, saddles) on the map. Then connect these points, following ridges and crossing slopes at right angles to contour lines. This line forms the watershed boundary.
If you don't need to know exact watershed boundaries, simply look at the pattern of stream flow and draw lines dividing different stream systems. This will give you an idea of the shape of your watershed and those bordering it. Also, once you've identified watershed boundaries, water features, and flow direction, you might want to transfer this information to a road map for easier use. Once you have delineated your watershed, it is time to make note of all land use activities within your watershed segment. Data for this portion of your survey should be obtained from your background research and from information you gather in the other portions of the Watershed Survey forms. It is best to finish this portion of the mapping exercise after you’ve completed your watershed survey. You are welcome to create a map of your own or modify an existing 1:24,000 topographical map. Be as precise as possible--this map should serve as an invaluable resource throughout your monitoring activities. Make sure to identify the section(s) of the stream where you will be conducting your physical, chemical or biological monitoring—the stream reach.

Sample Delineated Watershed
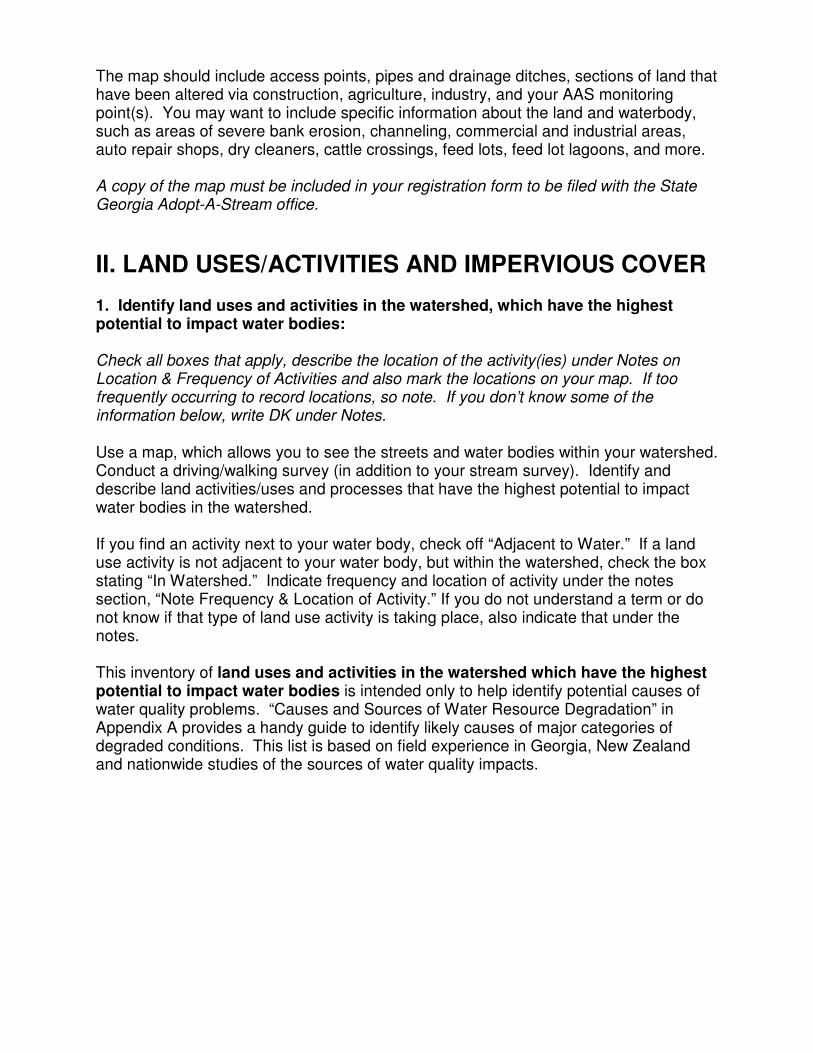
The map should include access points, pipes and drainage ditches, sections of land that have been altered via construction, agriculture, industry, and your AAS monitoring point(s). You may want to include specific information about the land and waterbody, such as areas of severe bank erosion, channeling, commercial and industrial areas, auto repair shops, dry cleaners, cattle crossings, feed lots, feed lot lagoons, and more. A copy of the map must be included in your registration form to be filed with the State Georgia Adopt-A-Stream office.
II. LAND USES/ACTIVITIES AND IMPERVIOUS COVER 1. Identify land uses and activities in the watershed, which have the highest potential to impact water bodies: Check all boxes that apply, describe the location of the activity(ies) under Notes on Location & Frequency of Activities and also mark the locations on your map. If too frequently occurring to record locations, so note. If you don’t know some of the information below, write DK under Notes. Use a map, which allows you to see the streets and water bodies within your watershed. Conduct a driving/walking survey (in addition to your stream survey). Identify and describe land activities/uses and processes that have the highest potential to impact water bodies in the watershed. If you find an activity next to your water body, check off “Adjacent to Water.” If a land use activity is not adjacent to your water body, but within the watershed, check the box stating “In Watershed.” Indicate frequency and location of activity under the notes section, “Note Frequency & Location of Activity.” If you do not understand a term or do not know if that type of land use activity is taking place, also indicate that under the notes. This inventory of land uses and activities in the watershed which have the highest potential to impact water bodies is intended only to help identify potential causes of water quality problems. “Causes and Sources of Water Resource Degradation” in Appendix A provides a handy guide to identify likely causes of major categories of degraded conditions. This list is based on field experience in Georgia, New Zealand and nationwide studies of the sources of water quality impacts.
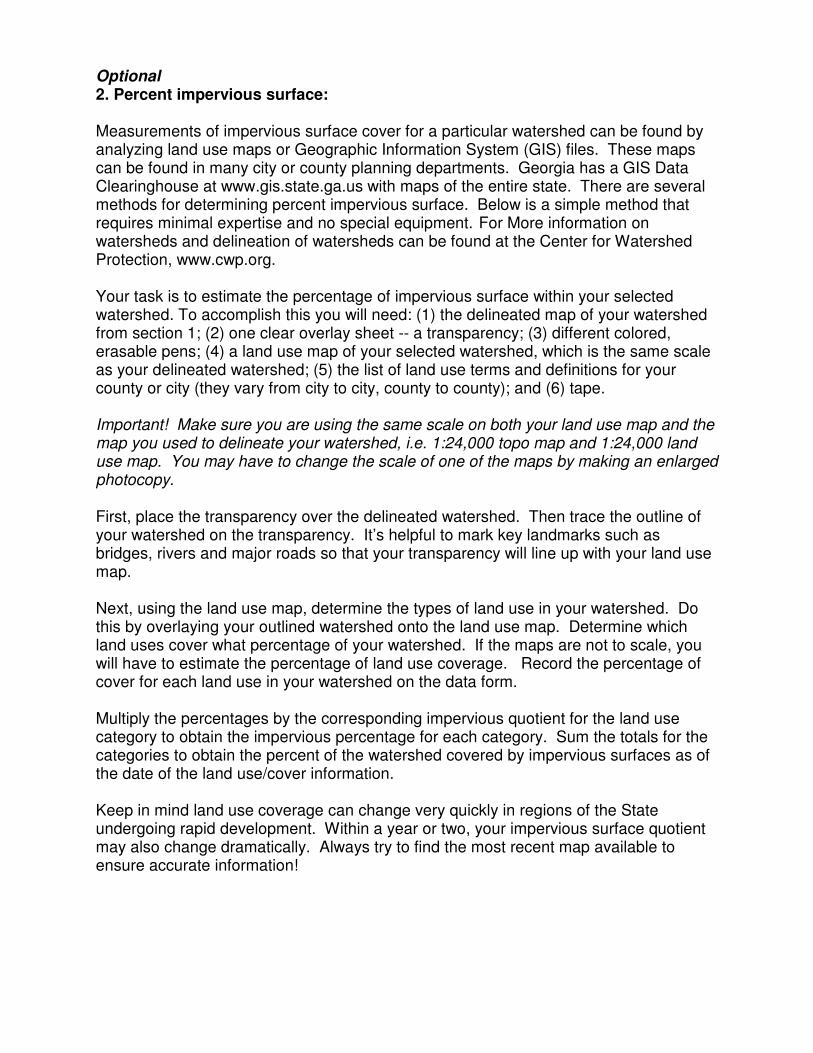
Optional 2. Percent impervious surface: Measurements of impervious surface cover for a particular watershed can be found by analyzing land use maps or Geographic Information System (GIS) files. These maps can be found in many city or county planning departments. Georgia has a GIS Data Clearinghouse at www.gis.state.ga.us with maps of the entire state. There are several methods for determining percent impervious surface. Below is a simple method that requires minimal expertise and no special equipment. For More information on watersheds and delineation of watersheds can be found at the Center for Watershed Protection, www.cwp.org. Your task is to estimate the percentage of impervious surface within your selected watershed. To accomplish this you will need: (1) the delineated map of your watershed from section 1; (2) one clear overlay sheet -- a transparency; (3) different colored, erasable pens; (4) a land use map of your selected watershed, which is the same scale as your delineated watershed; (5) the list of land use terms and definitions for your county or city (they vary from city to city, county to county); and (6) tape. Important! Make sure you are using the same scale on both your land use map and the map you used to delineate your watershed, i.e. 1:24,000 topo map and 1:24,000 land use map. You may have to change the scale of one of the maps by making an enlarged photocopy. First, place the transparency over the delineated watershed. Then trace the outline of your watershed on the transparency. It’s helpful to mark key landmarks such as bridges, rivers and major roads so that your transparency will line up with your land use map. Next, using the land use map, determine the types of land use in your watershed. Do this by overlaying your outlined watershed onto the land use map. Determine which land uses cover what percentage of your watershed. If the maps are not to scale, you will have to estimate the percentage of land use coverage. Record the percentage of cover for each land use in your watershed on the data form. Multiply the percentages by the corresponding impervious quotient for the land use category to obtain the impervious percentage for each category. Sum the totals for the categories to obtain the percent of the watershed covered by impervious surfaces as of the date of the land use/cover information. Keep in mind land use coverage can change very quickly in regions of the State undergoing rapid development. Within a year or two, your impervious surface quotient may also change dramatically. Always try to find the most recent map available to ensure accurate information!
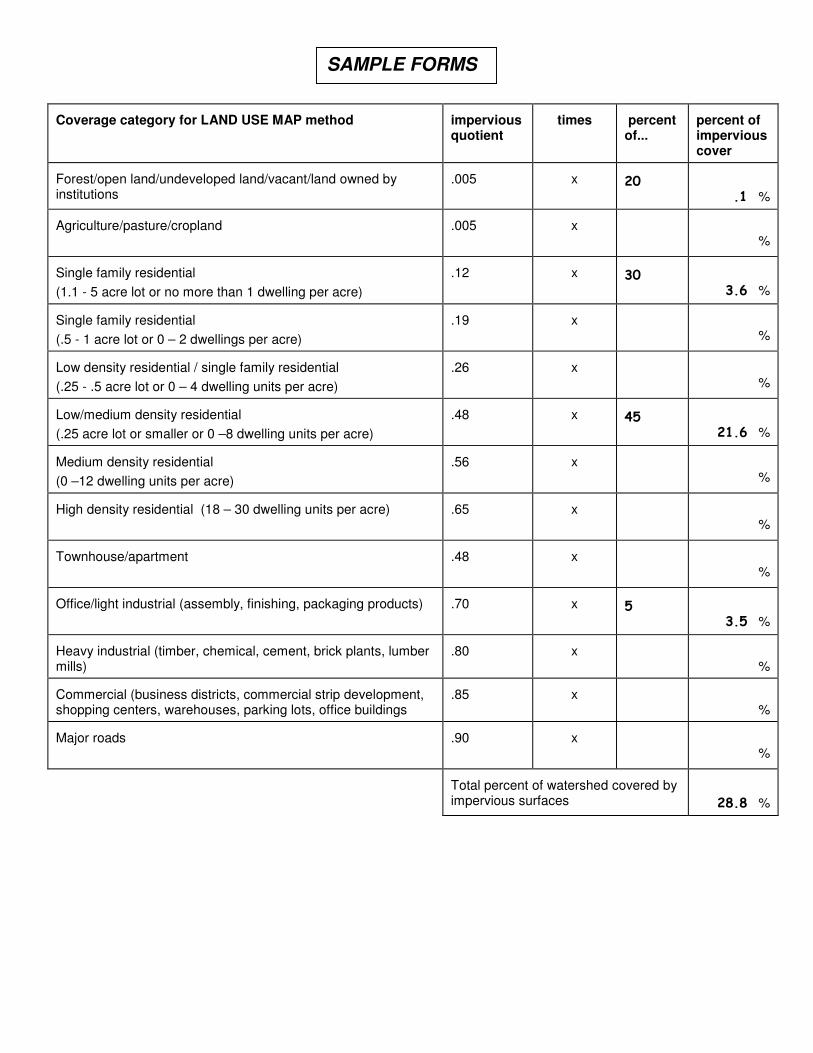
Coverage category for LAND USE MAP method
impervious quotient
times
percent of...
percent of impervious cover
Forest/open land/undeveloped land/vacant/land owned by institutions
.005
x
20
.1 % Agriculture/pasture/cropland
.005
x
%
Single family residential
(1.1 - 5 acre lot or no more than 1 dwelling per acre)
.12
x
30
3.6 % Single family residential
(.5 - 1 acre lot or 0 – 2 dwellings per acre)
.19
x
%
Low density residential / single family residential
(.25 - .5 acre lot or 0 – 4 dwelling units per acre)
.26
x
%
Low/medium density residential
(.25 acre lot or smaller or 0 –8 dwelling units per acre)
.48
x
45
21.6 % Medium density residential
(0 –12 dwelling units per acre)
.56
x
%
High density residential (18 – 30 dwelling units per acre)
.65
x
%
Townhouse/apartment
.48
x
%
Office/light industrial (assembly, finishing, packaging products)
.70
x
5
3.5 % Heavy industrial (timber, chemical, cement, brick plants, lumber mills)
.80
x
% Commercial (business districts, commercial strip development, shopping centers, warehouses, parking lots, office buildings
.85
x
% Major roads
.90
x
%
Total percent of watershed covered by impervious surfaces
28.8 %
SAMPLE FORMS
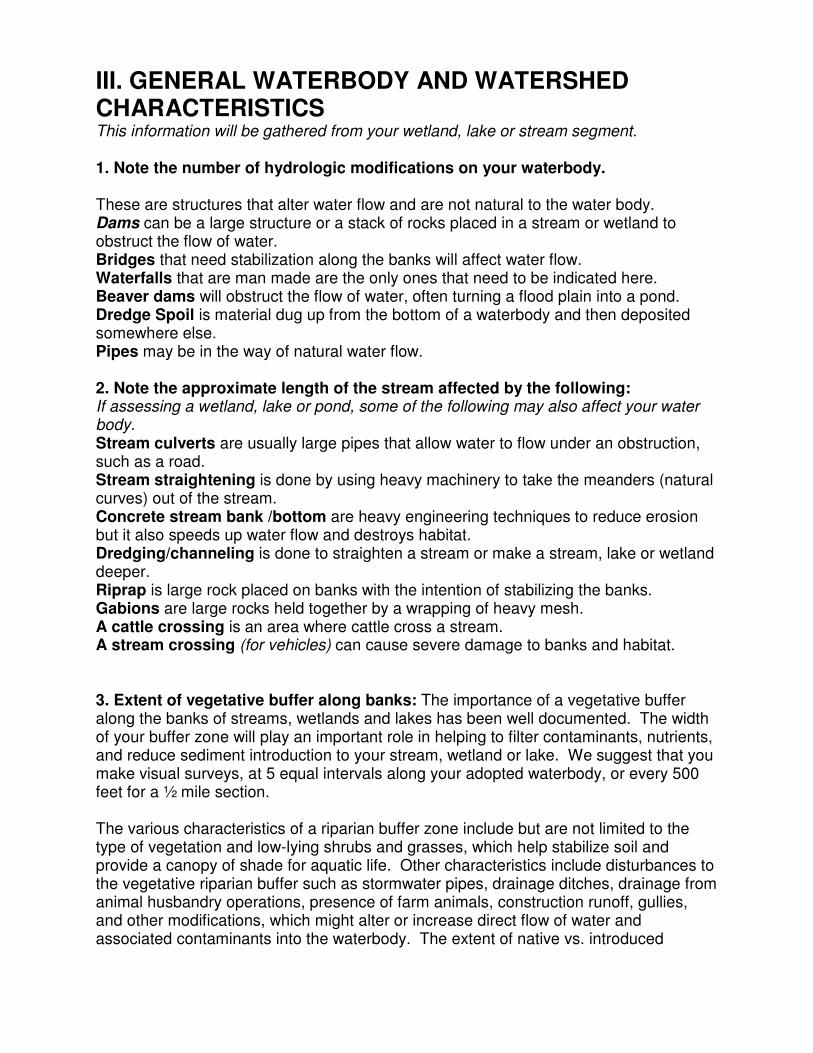
III. GENERAL WATERBODY AND WATERSHED CHARACTERISTICS This information will be gathered from your wetland, lake or stream segment. 1. Note the number of hydrologic modifications on your waterbody.
These are structures that alter water flow and are not natural to the water body. Dams can be a large structure or a stack of rocks placed in a stream or wetland to obstruct the flow of water. Bridges that need stabilization along the banks will affect water flow. Waterfalls that are man made are the only ones that need to be indicated here. Beaver dams will obstruct the flow of water, often turning a flood plain into a pond. Dredge Spoil is material dug up from the bottom of a waterbody and then deposited somewhere else. Pipes may be in the way of natural water flow. 2. Note the approximate length of the stream affected by the following: If assessing a wetland, lake or pond, some of the following may also affect your water body. Stream culverts are usually large pipes that allow water to flow under an obstruction, such as a road. Stream straightening is done by using heavy machinery to take the meanders (natural curves) out of the stream. Concrete stream bank /bottom are heavy engineering techniques to reduce erosion but it also speeds up water flow and destroys habitat. Dredging/channeling is done to straighten a stream or make a stream, lake or wetland deeper. Riprap is large rock placed on banks with the intention of stabilizing the banks. Gabions are large rocks held together by a wrapping of heavy mesh. A cattle crossing is an area where cattle cross a stream. A stream crossing (for vehicles) can cause severe damage to banks and habitat. 3. Extent of vegetative buffer along banks: The importance of a vegetative buffer along the banks of streams, wetlands and lakes has been well documented. The width of your buffer zone will play an important role in helping to filter contaminants, nutrients, and reduce sediment introduction to your stream, wetland or lake. We suggest that you make visual surveys, at 5 equal intervals along your adopted waterbody, or every 500 feet for a ½ mile section. The various characteristics of a riparian buffer zone include but are not limited to the type of vegetation and low-lying shrubs and grasses, which help stabilize soil and provide a canopy of shade for aquatic life. Other characteristics include disturbances to the vegetative riparian buffer such as stormwater pipes, drainage ditches, drainage from animal husbandry operations, presence of farm animals, construction runoff, gullies, and other modifications, which might alter or increase direct flow of water and associated contaminants into the waterbody. The extent of native vs. introduced
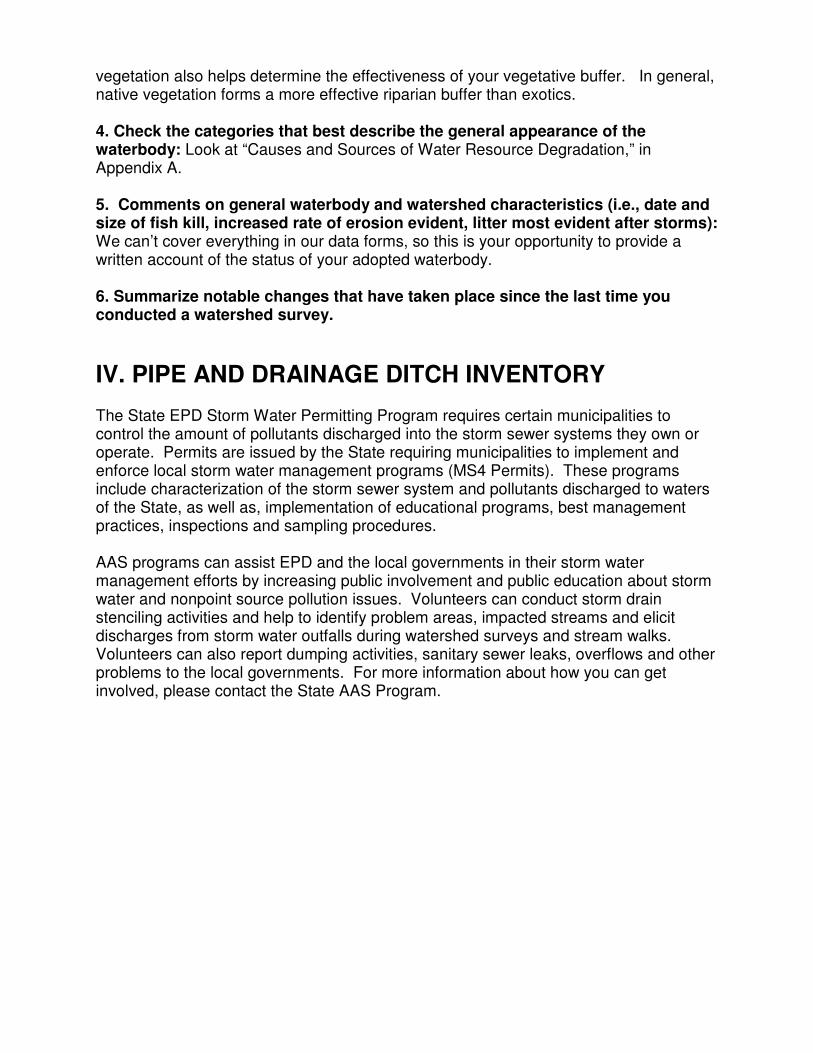
vegetation also helps determine the effectiveness of your vegetative buffer. In general, native vegetation forms a more effective riparian buffer than exotics. 4. Check the categories that best describe the general appearance of the waterbody: Look at “Causes and Sources of Water Resource Degradation,” in Appendix A.
5. Comments on general waterbody and watershed characteristics (i.e., date and size of fish kill, increased rate of erosion evident, litter most evident after storms): We can’t cover everything in our data forms, so this is your opportunity to provide a written account of the status of your adopted waterbody. 6. Summarize notable changes that have taken place since the last time you conducted a watershed survey.
IV. PIPE AND DRAINAGE DITCH INVENTORY The State EPD Storm Water Permitting Program requires certain municipalities to control the amount of pollutants discharged into the storm sewer systems they own or operate. Permits are issued by the State requiring municipalities to implement and enforce local storm water management programs (MS4 Permits). These programs include characterization of the storm sewer system and pollutants discharged to waters of the State, as well as, implementation of educational programs, best management practices, inspections and sampling procedures. AAS programs can assist EPD and the local governments in their storm water management efforts by increasing public involvement and public education about storm water and nonpoint source pollution issues. Volunteers can conduct storm drain stenciling activities and help to identify problem areas, impacted streams and elicit discharges from storm water outfalls during watershed surveys and stream walks. Volunteers can also report dumping activities, sanitary sewer leaks, overflows and other problems to the local governments. For more information about how you can get involved, please contact the State AAS Program.
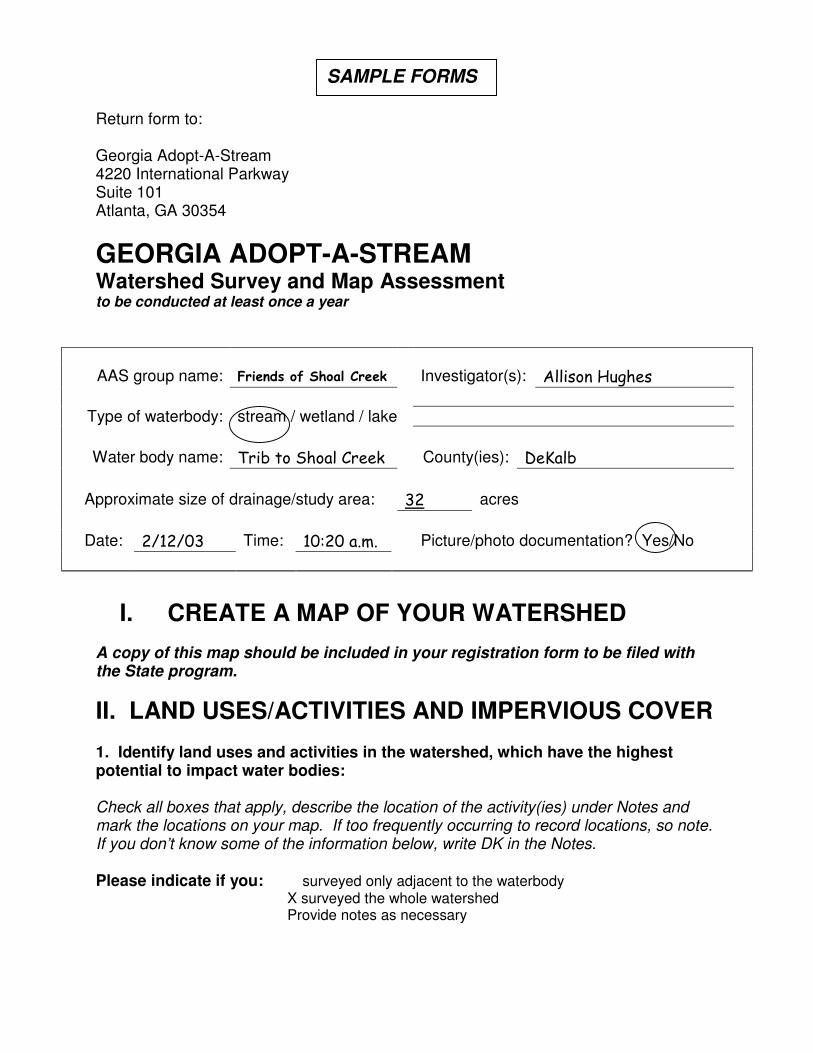
Return form to: Georgia Adopt-A-Stream 4220 International Parkway Suite 101 Atlanta, GA 30354
GEORGIA ADOPT-A-STREAM Watershed Survey and Map Assessment to be conducted at least once a year
I. CREATE A MAP OF YOUR WATERSHED
A copy of this map should be included in your registration form to be filed with the State program.
II. LAND USES/ACTIVITIES AND IMPERVIOUS COVER 1. Identify land uses and activities in the watershed, which have the highest potential to impact water bodies: Check all boxes that apply, describe the location of the activity(ies) under Notes and mark the locations on your map. If too frequently occurring to record locations, so note. If you don’t know some of the information below, write DK in the Notes. Please indicate if you: � surveyed only adjacent to the waterbody X surveyed the whole watershed Provide notes as necessary
AAS group name: Friends of Shoal Creek Investigator(s): Allison Hughes
Type of waterbody: stream / wetland / lake
Water body name: Trib to Shoal Creek County(ies): DeKalb
Approximate size of drainage/study area: 32 acres
Date: 2/12/03 Time: 10:20 a.m. Picture/photo documentation? Yes/No
SAMPLE FORMS
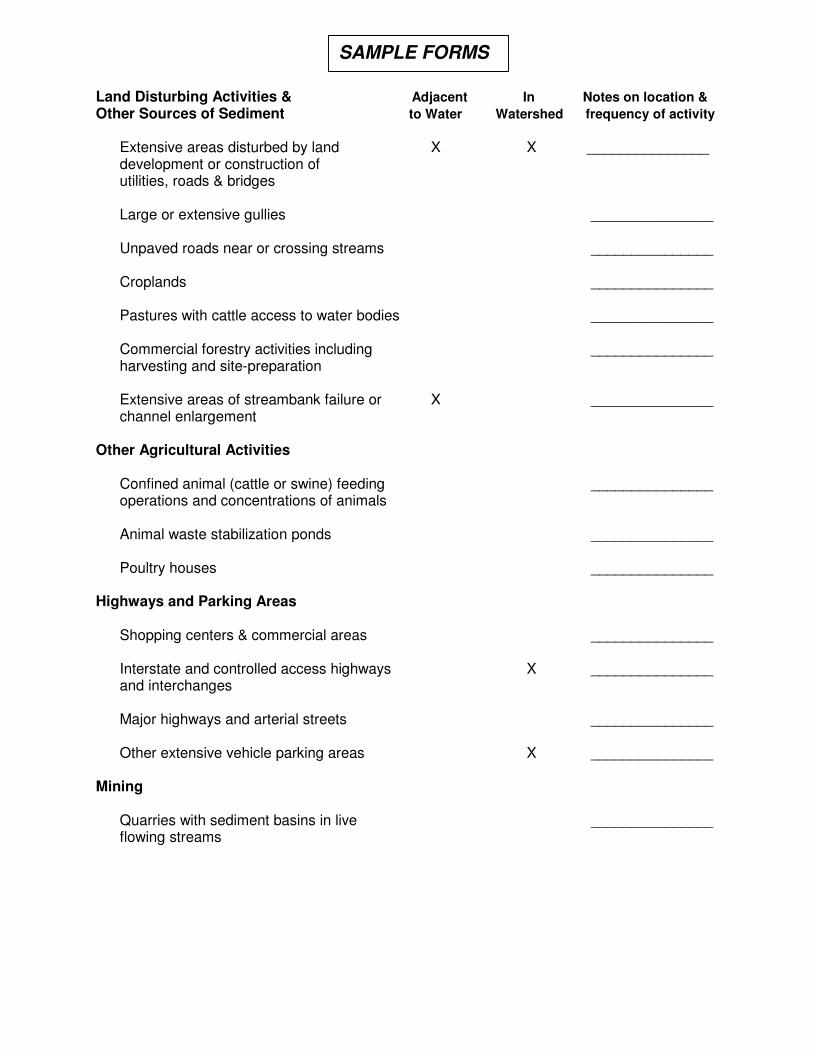
Land Disturbing Activities & Adjacent In Notes on location & Other Sources of Sediment to Water Watershed frequency of activity
Extensive areas disturbed by land X X _______________ development or construction of utilities, roads & bridges
Large or extensive gullies � � _______________
Unpaved roads near or crossing streams � � _______________
Croplands � � _______________ Pastures with cattle access to water bodies � � _______________ Commercial forestry activities including � � _______________ harvesting and site-preparation Extensive areas of streambank failure or X � _______________ channel enlargement
Other Agricultural Activities
Confined animal (cattle or swine) feeding � � _______________ operations and concentrations of animals
Animal waste stabilization ponds � � _______________ Poultry houses � � _______________
Highways and Parking Areas
Shopping centers & commercial areas � � _______________
Interstate and controlled access highways � X _______________ and interchanges
Major highways and arterial streets � � _______________ Other extensive vehicle parking areas � X _______________
Mining
Quarries with sediment basins in live � � _______________ flowing streams
SAMPLE FORMS
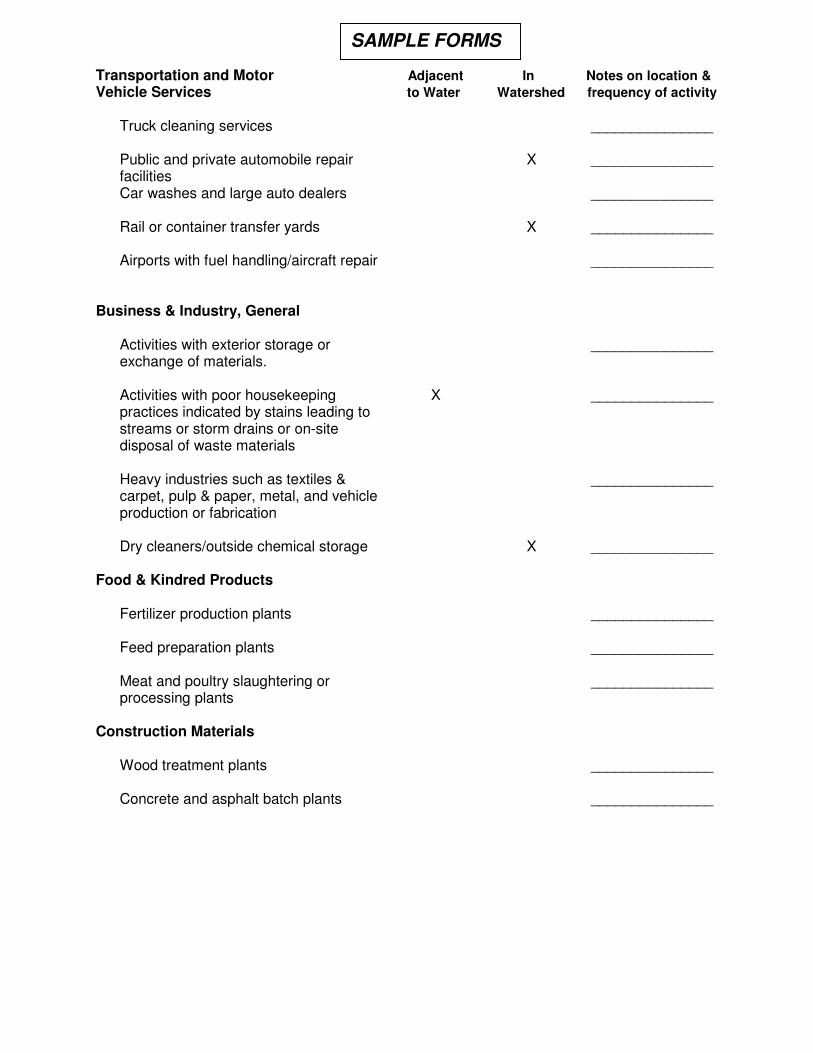
Transportation and Motor Adjacent In Notes on location & Vehicle Services to Water Watershed frequency of activity
Truck cleaning services � � _______________
Public and private automobile repair � X _______________ facilities Car washes and large auto dealers � � _______________
Rail or container transfer yards � X _______________
Airports with fuel handling/aircraft repair � � _______________
Business & Industry, General
Activities with exterior storage or � � _______________ exchange of materials.
Activities with poor housekeeping X � _______________ practices indicated by stains leading to streams or storm drains or on-site disposal of waste materials
Heavy industries such as textiles & � � _______________ carpet, pulp & paper, metal, and vehicle production or fabrication
Dry cleaners/outside chemical storage � X _______________
Food & Kindred Products
Fertilizer production plants � � _______________
Feed preparation plants � � _______________
Meat and poultry slaughtering or � � _______________ processing plants
Construction Materials
Wood treatment plants � � _______________ Concrete and asphalt batch plants � � _______________
SAMPLE FORMS
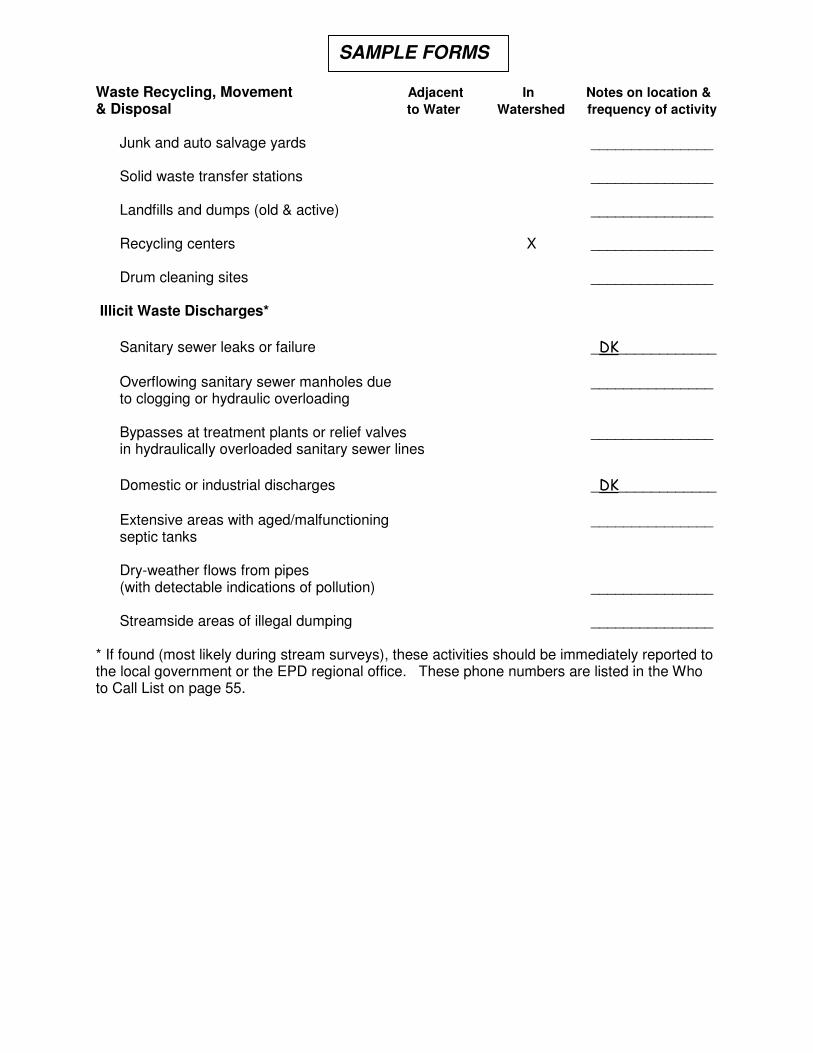
Waste Recycling, Movement Adjacent In Notes on location & & Disposal to Water Watershed frequency of activity
Junk and auto salvage yards � � _______________
Solid waste transfer stations � � _______________
Landfills and dumps (old & active) � � _______________
Recycling centers � X _______________
Drum cleaning sites � � _______________ Illicit Waste Discharges*
Sanitary sewer leaks or failure � � _DK____________
Overflowing sanitary sewer manholes due � � _______________ to clogging or hydraulic overloading
Bypasses at treatment plants or relief valves � � _______________ in hydraulically overloaded sanitary sewer lines
Domestic or industrial discharges � � _DK____________
Extensive areas with aged/malfunctioning � � _______________ septic tanks Dry-weather flows from pipes (with detectable indications of pollution) � � _______________
Streamside areas of illegal dumping � � _______________
* If found (most likely during stream surveys), these activities should be immediately reported to the local government or the EPD regional office. These phone numbers are listed in the Who to Call List on page 55.
SAMPLE FORMS
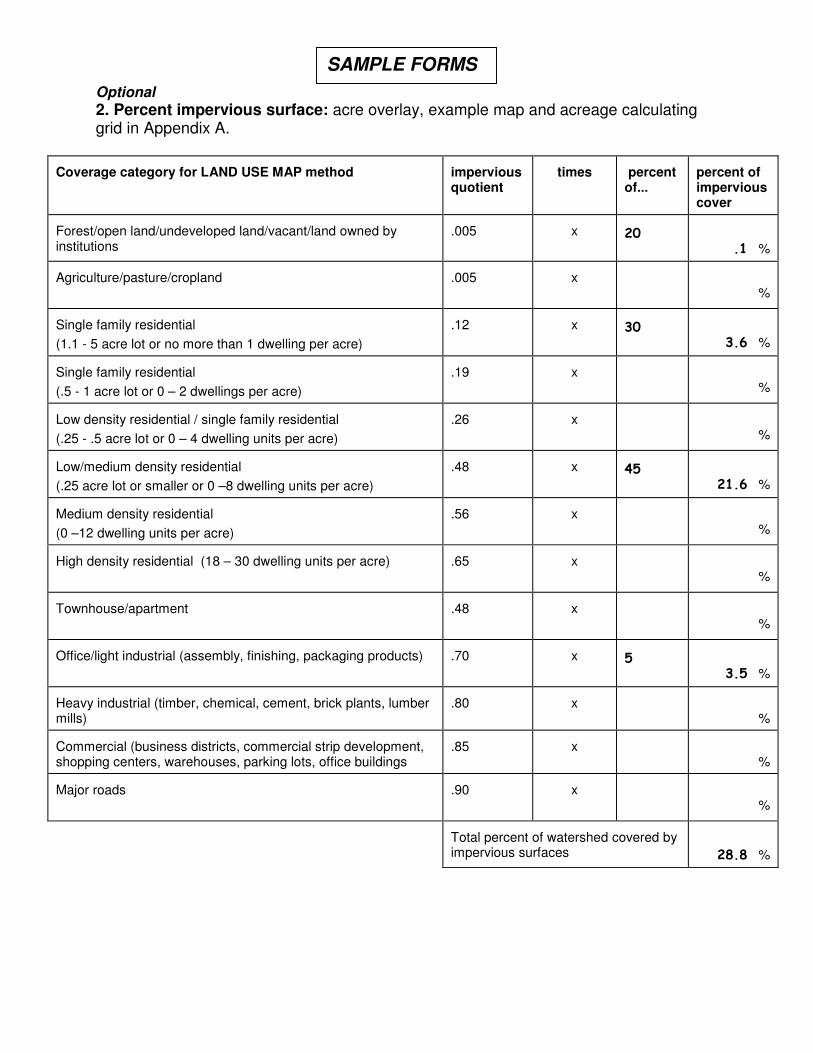
Optional
2. Percent impervious surface: acre overlay, example map and acreage calculating grid in Appendix A.
Coverage category for LAND USE MAP method
impervious quotient
times
percent of...
percent of impervious cover
Forest/open land/undeveloped land/vacant/land owned by institutions
.005
x
20
.1 % Agriculture/pasture/cropland
.005
x
%
Single family residential
(1.1 - 5 acre lot or no more than 1 dwelling per acre)
.12
x
30
3.6 % Single family residential
(.5 - 1 acre lot or 0 – 2 dwellings per acre)
.19
x
%
Low density residential / single family residential
(.25 - .5 acre lot or 0 – 4 dwelling units per acre)
.26
x
%
Low/medium density residential
(.25 acre lot or smaller or 0 –8 dwelling units per acre)
.48
x
45
21.6 % Medium density residential
(0 –12 dwelling units per acre)
.56
x
%
High density residential (18 – 30 dwelling units per acre)
.65
x
%
Townhouse/apartment
.48
x
%
Office/light industrial (assembly, finishing, packaging products)
.70
x
5
3.5 % Heavy industrial (timber, chemical, cement, brick plants, lumber mills)
.80
x
% Commercial (business districts, commercial strip development, shopping centers, warehouses, parking lots, office buildings
.85
x
% Major roads
.90
x
%
Total percent of watershed covered by impervious surfaces
28.8 %
SAMPLE FORMS
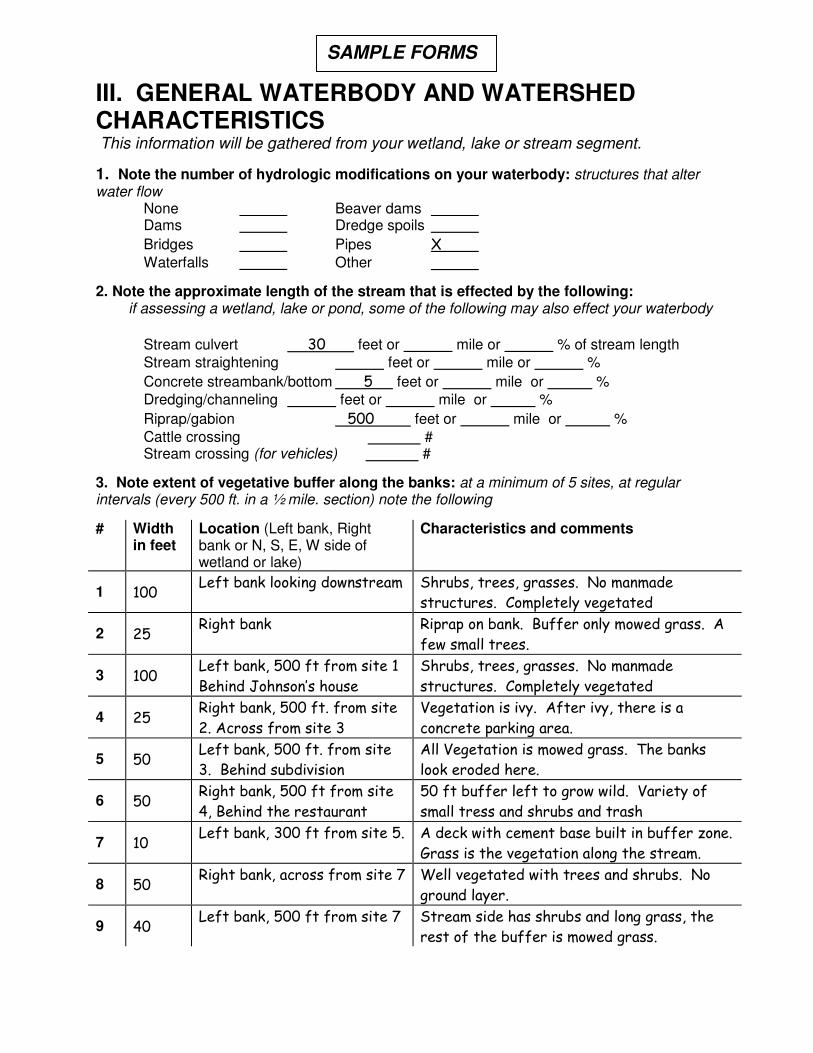
III. GENERAL WATERBODY AND WATERSHED CHARACTERISTICS This information will be gathered from your wetland, lake or stream segment.
1. Note the number of hydrologic modifications on your waterbody: structures that alter water flow
None Beaver dams Dams Dredge spoils
Bridges Pipes X
Waterfalls Other
2. Note the approximate length of the stream that is effected by the following: if assessing a wetland, lake or pond, some of the following may also effect your waterbody
Stream culvert 30 feet or mile or % of stream length
Stream straightening feet or mile or %
Concrete streambank/bottom 5 feet or mile or %
Dredging/channeling feet or mile or %
Riprap/gabion 500 feet or mile or %
Cattle crossing # Stream crossing (for vehicles) #
3. Note extent of vegetative buffer along the banks: at a minimum of 5 sites, at regular intervals (every 500 ft. in a ½ mile. section) note the following
# Width in feet
Location (Left bank, Right bank or N, S, E, W side of wetland or lake)
Characteristics and comments
1 100 Left bank looking downstream Shrubs, trees, grasses. No manmade
structures. Completely vegetated
2 25 Right bank Riprap on bank. Buffer only mowed grass. A
few small trees.
3 100 Left bank, 500 ft from site 1
Behind Johnson’s house
Shrubs, trees, grasses. No manmade
structures. Completely vegetated
4 25 Right bank, 500 ft. from site
2. Across from site 3
Vegetation is ivy. After ivy, there is a
concrete parking area.
5 50 Left bank, 500 ft. from site
3. Behind subdivision
All Vegetation is mowed grass. The banks
look eroded here.
6 50 Right bank, 500 ft from site
4, Behind the restaurant
50 ft buffer left to grow wild. Variety of
small tress and shrubs and trash
7 10 Left bank, 300 ft from site 5. A deck with cement base built in buffer zone.
Grass is the vegetation along the stream.
8 50 Right bank, across from site 7 Well vegetated with trees and shrubs. No
ground layer.
9 40 Left bank, 500 ft from site 7 Stream side has shrubs and long grass, the
rest of the buffer is mowed grass.
SAMPLE FORMS
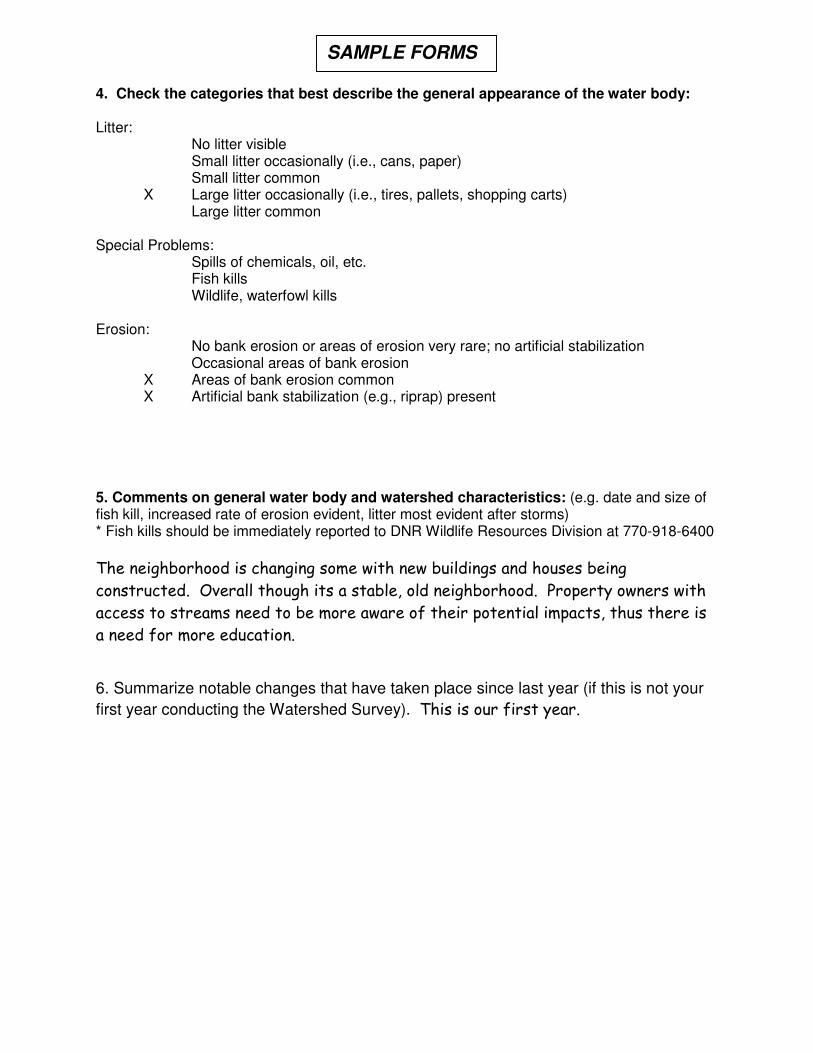
4. Check the categories that best describe the general appearance of the water body: Litter:
� No litter visible � Small litter occasionally (i.e., cans, paper) � Small litter common X Large litter occasionally (i.e., tires, pallets, shopping carts)
� Large litter common Special Problems:
� Spills of chemicals, oil, etc. � Fish kills
� Wildlife, waterfowl kills Erosion:
� No bank erosion or areas of erosion very rare; no artificial stabilization � Occasional areas of bank erosion X Areas of bank erosion common X Artificial bank stabilization (e.g., riprap) present
5. Comments on general water body and watershed characteristics: (e.g. date and size of fish kill, increased rate of erosion evident, litter most evident after storms) * Fish kills should be immediately reported to DNR Wildlife Resources Division at 770-918-6400
The neighborhood is changing some with new buildings and houses being
constructed. Overall though its a stable, old neighborhood. Property owners with
access to streams need to be more aware of their potential impacts, thus there is
a need for more education.
6. Summarize notable changes that have taken place since last year (if this is not your
first year conducting the Watershed Survey). This is our first year.
SAMPLE FORMS
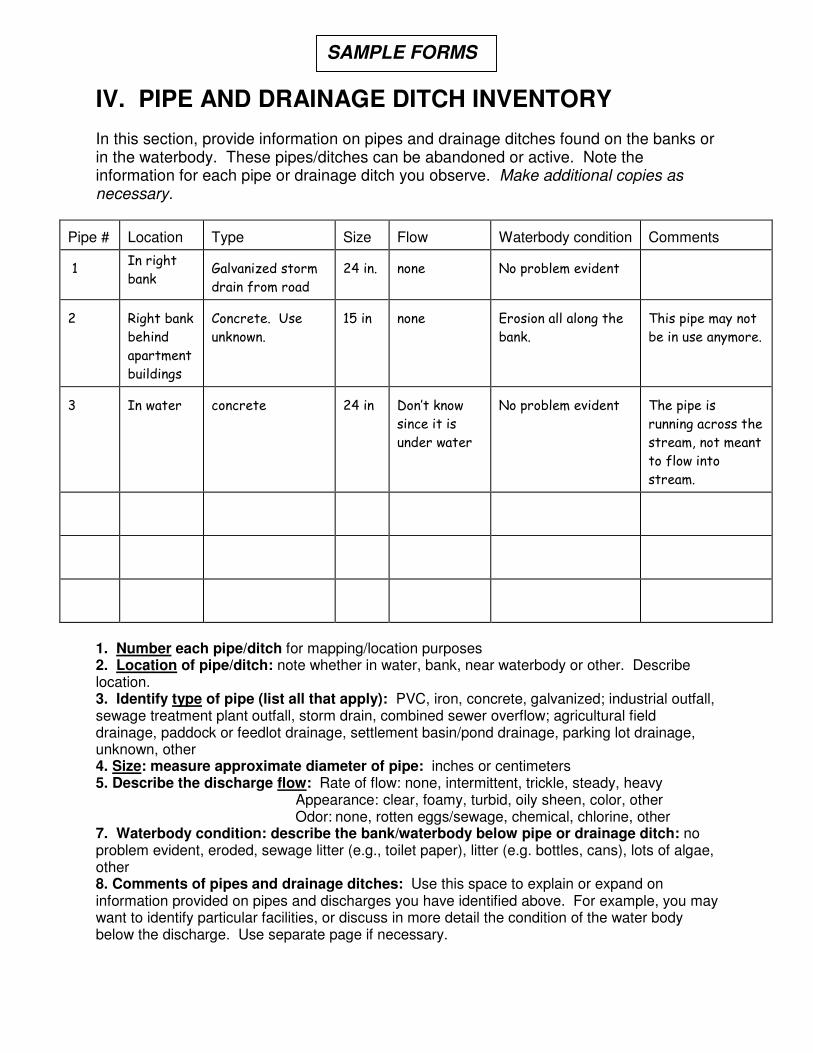
IV. PIPE AND DRAINAGE DITCH INVENTORY
In this section, provide information on pipes and drainage ditches found on the banks or in the waterbody. These pipes/ditches can be abandoned or active. Note the information for each pipe or drainage ditch you observe. Make additional copies as necessary.
Pipe #
Location
Type
Size
Flow
Waterbody condition
Comments
1
In right
bank
Galvanized storm
drain from road
24 in.
none
No problem evident
2
Right bank
behind
apartment
buildings
Concrete. Use
unknown.
15 in
none
Erosion all along the
bank.
This pipe may not
be in use anymore.
3
In water
concrete
24 in
Don’t know
since it is
under water
No problem evident
The pipe is
running across the
stream, not meant
to flow into
stream.
1. Number each pipe/ditch for mapping/location purposes 2. Location of pipe/ditch: note whether in water, bank, near waterbody or other. Describe location. 3. Identify type of pipe (list all that apply): PVC, iron, concrete, galvanized; industrial outfall, sewage treatment plant outfall, storm drain, combined sewer overflow; agricultural field drainage, paddock or feedlot drainage, settlement basin/pond drainage, parking lot drainage, unknown, other 4. Size: measure approximate diameter of pipe: inches or centimeters 5. Describe the discharge flow: Rate of flow: none, intermittent, trickle, steady, heavy
Appearance: clear, foamy, turbid, oily sheen, color, other Odor: none, rotten eggs/sewage, chemical, chlorine, other
7. Waterbody condition: describe the bank/waterbody below pipe or drainage ditch: no problem evident, eroded, sewage litter (e.g., toilet paper), litter (e.g. bottles, cans), lots of algae, other 8. Comments of pipes and drainage ditches: Use this space to explain or expand on information provided on pipes and discharges you have identified above. For example, you may want to identify particular facilities, or discuss in more detail the condition of the water body below the discharge. Use separate page if necessary.
SAMPLE FORMS


![Risk MAP and Discovery FEMA Region [#], [WATERSHED NAME] Watershed](https://static.fdocuments.in/doc/165x107/56815ed1550346895dcd5fd2/risk-map-and-discovery-fema-region-watershed-name-watershed.jpg)


![Risk MAP and Discovery FEMA Region [#], [WATERSHED NAME] Watershed Discovery Meetings [DATE]](https://static.fdocuments.in/doc/165x107/56649d005503460f949d2390/risk-map-and-discovery-fema-region-watershed-name-watershed-discovery.jpg)


