Scientific Method Collect Facts and Data Hypothesis Test hypothesis Modify hypothesis Conclusion.
162
Chapter V
Analysis interpretation,
hypothesis testing and Causal
relationship between certain
variables and the outcome
163
5.1 Interpretations
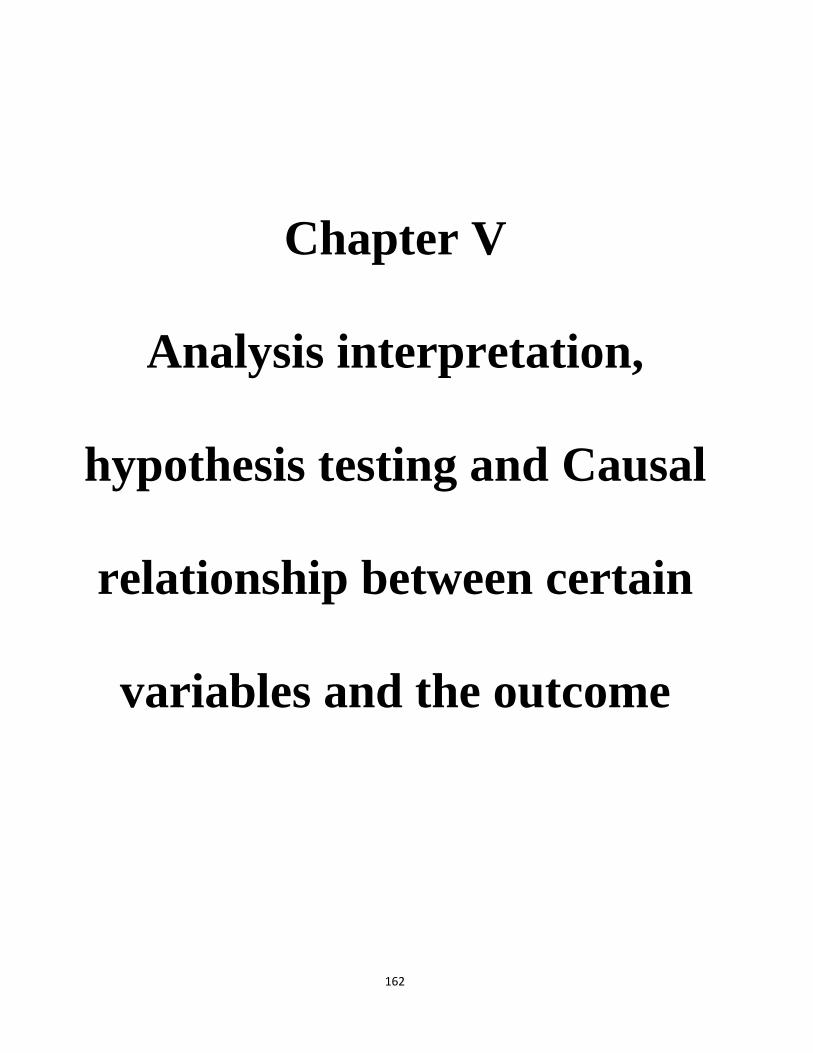
Table 5.1 classification of sample retailers based on age
Frequency Percent Valid Percent
Cumulative
Percent
Valid 25-30yrs 33 6.5 6.5 6.5
31-40yrs 110 21.8 21.8 28.3
41-50yrs 184 36.4 36.4 64.8
51 and above 178 35.2 35.2 100.0
Total 505 100.0 100.0
Source: Data Derived from primary Survey Time Period 2009-10
Interpretation:
The above graph shows the age of unorganized retailers who are into the retailing business 36% of
respondents are between the age of 41-50, 35% of respondents are between the age group of 51%
and above, 21% are between 31-40 years, and only 75 are between 25-30 years. age group of 41 to
60 years.
Chart 6.1 Chart 6.1

164
Table 5.2 classification of sample retailers based on
Place
Frequency Percent
Valid
Percent
Cumulative
Percent
Valid Hubli 150 29.7 29.7 29.7
Dharwad 101 20.0 20.0 49.7
Belgaum 150 29.7 29.7 79.4
Bijapur 51 10.1 10.1 89.5
Bagalkot 53 10.5 10.5 100.0
Total 505 100.0 100.0
Source: Data Derived from primary Survey Time Period 2009-10
Interpretation:
Based on size of the city and population 150 respondents from Hubli, 100 respondents from
Dharwad, 50 respondents from Belgaum, and 50 each from Bijapur and Bagalkot were selected for
the survey.
Chart 6.2 Chart 6.2

165
Table 5.3 From how many days you are doing this business?.....
Frequency Percent
Valid
Percent
Cumulative
Percent
Valid From 1 year 49 9.7 9.7 9.7
2-3 year 63 12.5 12.5 22.2
4-5 year 194 38.4 38.4 60.6
5 and above 199 39.4 39.4 100.0
Total 505 100.0 100.0
Source: Data Derived from primary Survey Time Period 2009-10
Interpretation: From the above graph it is found that 80% of people are doing business since 4 to 5
years and above, 12% people are doing business since 2-3 years, 10% of them are doing business
since 1year. It is evident that most of the shops are older and having existence for long time.
Chart 6.3

166
Table 5.4 Do you own or rent the place where you do the business?
Frequency Percent
Valid
Percent Cumulative Percent
Valid Own 288 57.0 57.0 57.0
Rent 198 39.2 39.2 96.2
Any other
form 19 3.8 3.8 100.0
Total 505 100.0 100.0
Source: Data Derived from primary Survey Time Period 2009-10
Interpretation:
From the above graph it is clear that 57% of the respondents own the retail premises followed by
rental that is 39%. It is evident that most of retail outlets are managed by families and small
operators.
Chart 5.4
167
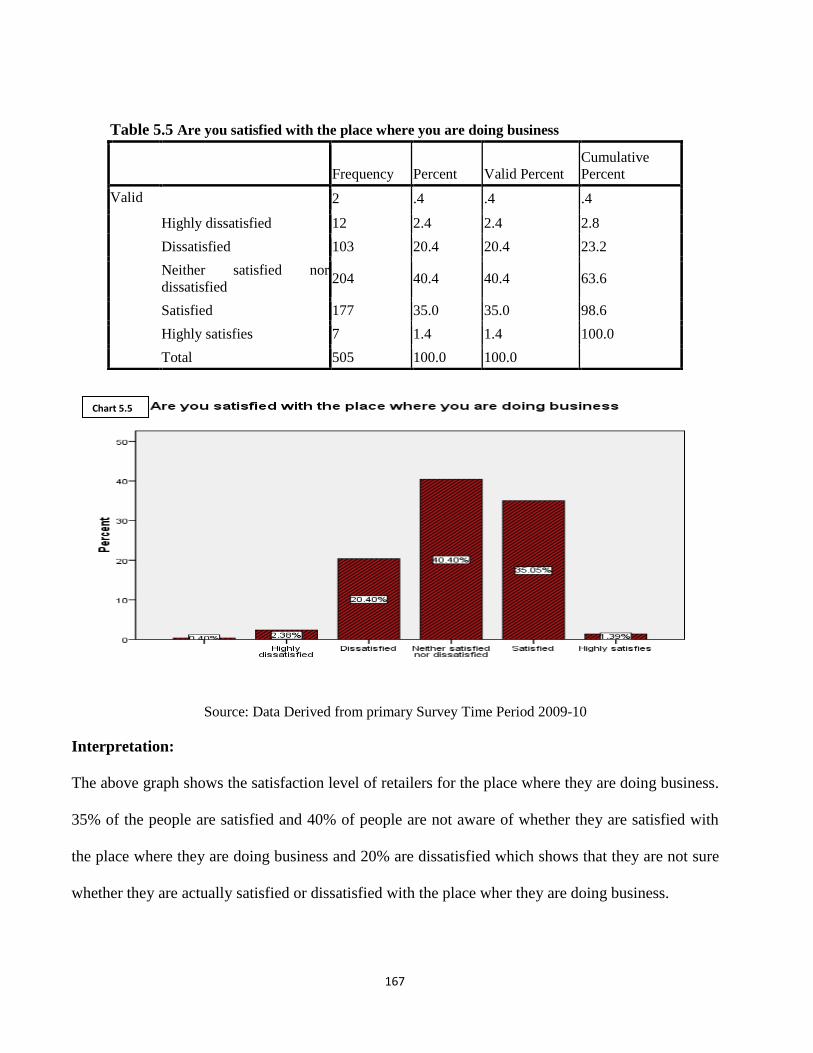
Table 5.5 Are you satisfied with the place where you are doing business
Frequency Percent Valid Percent
Cumulative
Percent
Valid 2 .4 .4 .4
Highly dissatisfied 12 2.4 2.4 2.8
Dissatisfied 103 20.4 20.4 23.2
Neither satisfied nor
dissatisfied 204 40.4 40.4 63.6
Satisfied 177 35.0 35.0 98.6
Highly satisfies 7 1.4 1.4 100.0
Total 505 100.0 100.0
Source: Data Derived from primary Survey Time Period 2009-10
Interpretation:
The above graph shows the satisfaction level of retailers for the place where they are doing business.
35% of the people are satisfied and 40% of people are not aware of whether they are satisfied with
the place where they are doing business and 20% are dissatisfied which shows that they are not sure
whether they are actually satisfied or dissatisfied with the place wher they are doing business.
Chart 5.5
168
Table 5.6 Approximate number of shops doing same business near to your shop
Frequency Percent Valid Percent Cumulative Percent
Valid 5-10 221 43.8 43.8 43.8
11-15 211 41.8 41.8 85.5
15-20 45 8.9 8.9 94.5
21 and above 28 5.5 5.5 100.0
Total 505 100.0 100.0
Source: Data Derived from primary Survey Time Period 2009-10
Interpretation:
Above graph reveals that there are approximately 5-10 shops near the respondents shop i.e 42% out
of total respondents, 11-15 shops that is 42% of respondents, 15-20 shops that is 9% of respondents
and more than 21 shops that 5 % of respondents. It shows that there is high competition in
unorganized retail business when it comes to people doing same business in one area.
Chart 5.6

169
Table 5.7 Which of the following best describes your business compare to retail
giants like Big Bazaar and Reliance Fresh
Frequency Percent Valid Percent Cumulative Percent
Valid Terrible 28 5.5 5.5 5.5
Poor 208 41.2 41.2 46.7
Fair 198 39.2 39.2 85.9
good 65 12.9 12.9 98.8
very well 6 1.2 1.2 100.0
Total 505 100.0 100.0
Source: Data Derived from primary Survey Time Period 2009-10
Interpretation: The above graph reveals that unorganized retail business compare to giant retailer is
poor as per 41% respondent, fair as per 39% respondents, good as per 13% of respondents, terrible as
per 6% of respondents and very well as per 1% of respondents. Majority of the respondents say that
they are not comparable when it comes to organized retailing.
Chart 5.7
170
Table 5.8 Did you find any changes in customer buying
behavior after they came to know about organized retailing?
Frequency Percent Valid Percent
Cumulative
Percent
Valid Don't know 279 55.2 55.2 55.2
Yes 31 6.1 6.1 61.4
No 195 38.6 38.6 100.0
Total 505 100.0 100.0
Source: Data Derived from primary Survey Time Period 2009-10
Interpretation:
From the above graph it is revealed that respondents are not aware about changes in customer buying
behavior after they came to know about organized retailing as 55% of respondents say they don‘t
know , 39% said they could not find any change in the buying behavior , and 6% of respondents say
yes they could sense change in buying behavior.
Chart 5.8
171
Table 5.9 Do you think that the market like Hubli, Dharwad,
Belgaum, Bijapur and Bagalkot Can accommodate Big retail giants
Frequency Percent Valid Percent Cumulative Percent
Valid Don't know 191 37.8 37.8 37.8
Yes 230 45.5 45.5 83.4
No 84 16.6 16.6 100.0
Total 505 100.0 100.0
Source: Data Derived from primary Survey Time Period 2009-10
Interpretation:
The above graph reveals that the 46% respondents say yes when they were asked whether the market
like Hubli, Dharwad, Belgaum, Bijapur and Bagalkot can accommodate big retail giants.38% were
unaware whether the giant retailer can accommodate in north Karnataka, and 17% said No for the
same.
Chart 5.9
172
Table 5.10 The general public prefer the……….
Frequency Percent Valid Percent
Cumulative
Percent
Valid Retail outlets 207 41.0 41.0 41.0
Vendormarket 85 16.8 16.8 57.8
Shanties 157 31.1 31.1 88.9
Road side Shoppes 56 11.1 11.1 100.0
Total 505 100.0 100.0
Source: Data Derived from primary Survey Time Period 2009-10
Interpretation:The above graph reveals that the general public opinion when asked about their
preference is 41% for retail outlets, 31% for shanties, 17% for vendor market, and 11% for road side
shoppes. It means there is good scope for retail outlets as per common man‘s preference.
Chart 5.10

173
Table 5.11 What do you think is the main factor affecting big retailers to
enter the urban cities like Hubli, Dharwad, Belgaum, Bijapur and Bagalkot? [
Frequency Percent Valid Percent Cumulative Percent
Valid Financial ability of
customer 102 20.2 20.2 20.2
Life style 161 31.9 31.9 52.1
Culture 159 31.5 31.5 83.6
Infrastructure 83 16.4 16.4 100.0
Total 505 100.0 100.0
Source: Data Derived from primary Survey Time Period 2009-10
Interpretation:
The above graph reveals that life style and culture are the main factors that affect big retailers to
enter the urban cities of north Karnataka as the 32% respondents say that life style is the factor, 31%
say due to culture, 20% say financial ability of customer, and 16% say infrastructure can be reason.
Hence it could be concluded that financial ability is not the reason but life style and culture is.
Chart 5.11
174
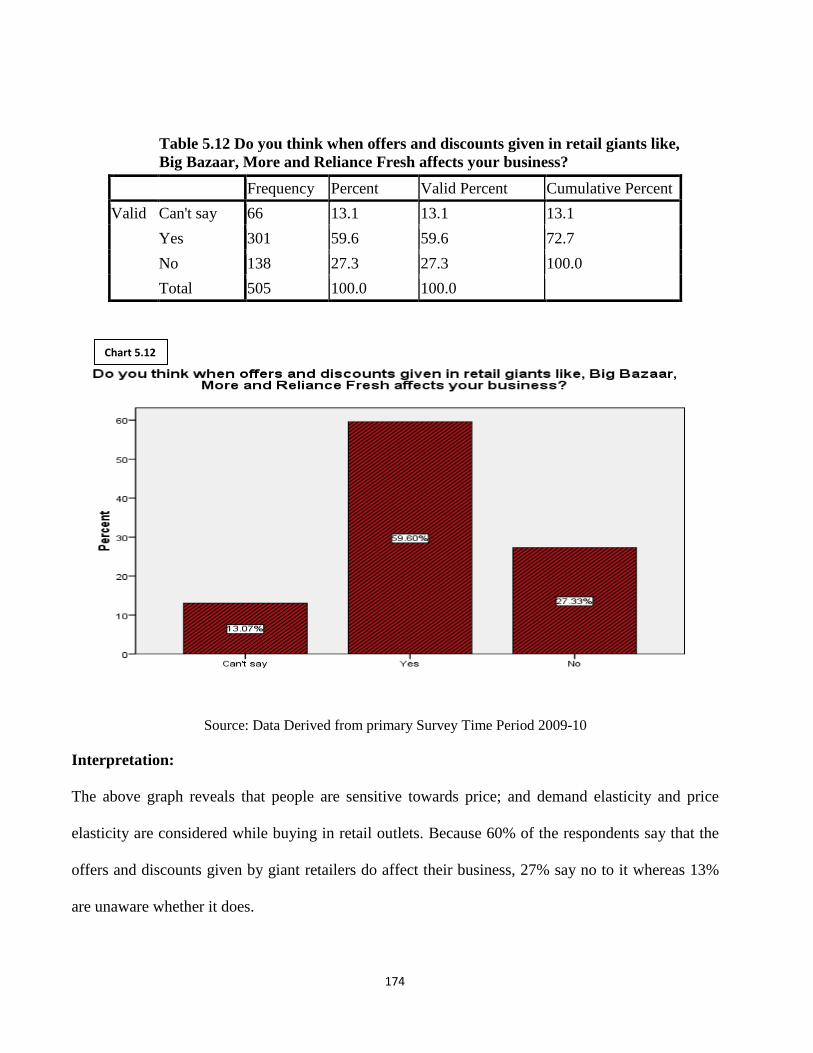
Table 5.12 Do you think when offers and discounts given in retail giants like,
Big Bazaar, More and Reliance Fresh affects your business?
Frequency Percent Valid Percent Cumulative Percent
Valid Can't say 66 13.1 13.1 13.1
Yes 301 59.6 59.6 72.7
No 138 27.3 27.3 100.0
Total 505 100.0 100.0
Source: Data Derived from primary Survey Time Period 2009-10
Interpretation:
The above graph reveals that people are sensitive towards price; and demand elasticity and price
elasticity are considered while buying in retail outlets. Because 60% of the respondents say that the
offers and discounts given by giant retailers do affect their business, 27% say no to it whereas 13%
are unaware whether it does.
Chart 5.12
175
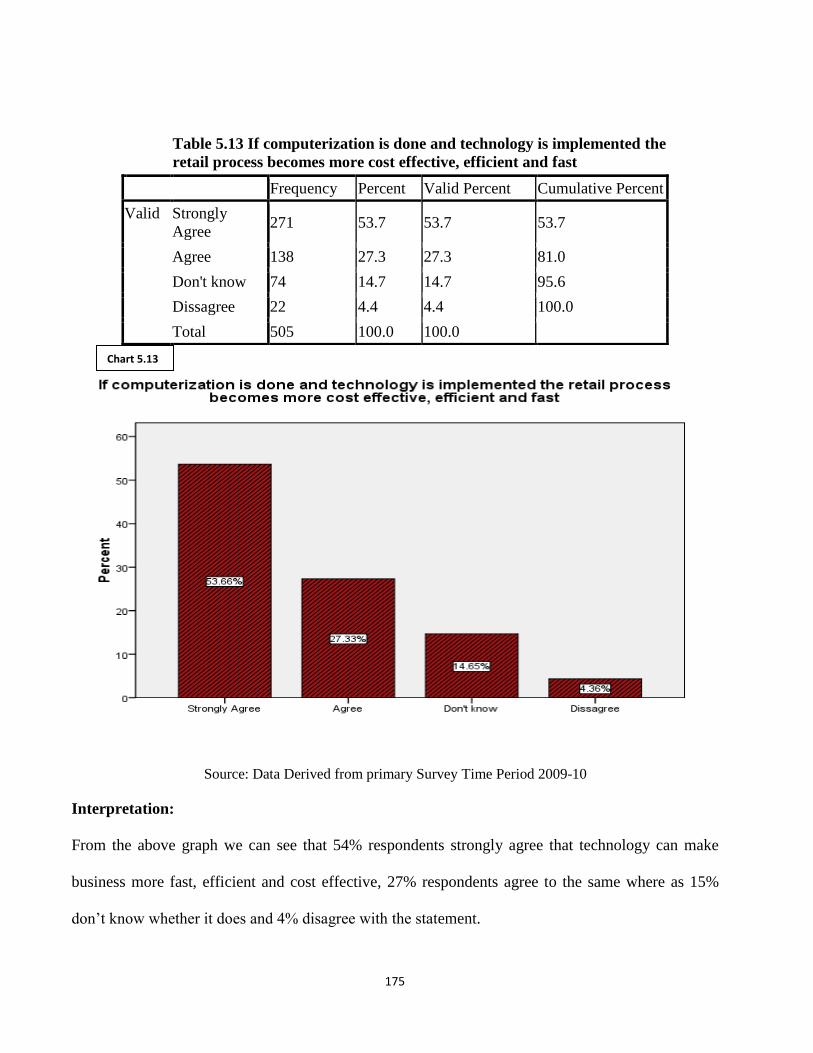
Table 5.13 If computerization is done and technology is implemented the
retail process becomes more cost effective, efficient and fast
Frequency Percent Valid Percent Cumulative Percent
Valid Strongly
Agree 271 53.7 53.7 53.7
Agree 138 27.3 27.3 81.0
Don't know 74 14.7 14.7 95.6
Dissagree 22 4.4 4.4 100.0
Total 505 100.0 100.0
Source: Data Derived from primary Survey Time Period 2009-10
Interpretation:
From the above graph we can see that 54% respondents strongly agree that technology can make
business more fast, efficient and cost effective, 27% respondents agree to the same where as 15%
don‘t know whether it does and 4% disagree with the statement.
Chart 5.13

176
Table 5.14 Mark any one important factor which influences the organized
retailing
Frequency Percent Valid Percent Cumulative Percent
Valid Population 21 4.2 4.2 4.2
Economic status of people 230 45.5 45.5 49.7
Infrastructure of the city 96 19.0 19.0 68.7
Life style of the people 117 23.2 23.2 91.9
Investment on retailing 18 3.6 3.6 95.4
Location of the retail sector 9 1.8 1.8 97.2
Business environment 9 1.8 1.8 99.0
Advertisement 5 1.0 1.0 100.0
Total 505 100.0 100.0
Source: Data Derived from primary Survey Time Period 2009-10
Interpretation:
Various factor which are playing important role in influencing organized retailing but the major
factor found is economic status of people because 46% of the respondents considers it to be followed
by life style of the people that is 23% and infrastructure of the city that is 19%.
Chart 5.14

177
Table 5.15 What impression do the public generally have about organized retail
outlets in cities like Hubli, Dharwad, Belgaum, Bijapur and Bagalkot?
Frequency Percent Valid Percent Cumulative Percent
Valid Very expensive 318 63.0 63.0 63.0
Availability of all
products in one place 66 13.1 13.1 76.0
Nice place to shop and
enjoy 48 9.5 9.5 85.5
Being proud for
shopping there 73 14.5 14.5 100.0
Total 505 100.0 100.0
Source: Data Derived from primary Survey Time Period 2009-10
Interpretation:
From the above graph we can see that the public‘s impression about organized retail outlets in North
Karnataka is very expensive. As 63% respondents consider it to be very expensive, 14% feel proud
of shopping, 13% feel the availability of all products in one place and 10% feel it is nice place to
shop and enjoy.
Chart 5.15

178
Table 5.16 Do you think that retailing industry in Karnataka providing
more employment opportunities compare to other states?
Frequency Percent Valid Percent Cumulative Percent
Valid Don't know 11 2.2 2.2 2.2
Yes 340 67.3 67.3 69.5
No 154 30.5 30.5 100.0
Total 505 100.0 100.0
Source: Data Derived from primary Survey Time Period 2009-10
Interpretation:
The above graph reveals that retailing industry in Karnataka provides more employment
opportunities compare to other sectors because the 67% respondents agree that it provides more
employment opportunities whereas 31% feel it doesn‘t and 2% don‘t know whether it really does
have any effect.
Chart 5.16

179
Table 5.17 Retailing industry has immense scope of investment
Frequency Percent Valid Percent
Cumulative
Percent
Valid Strongly agree 105 20.8 20.8 20.8
Agree 204 40.4 40.4 61.2
Neither disagree nor
agree 120 23.8 23.8 85.0
Disagree 55 10.9 10.9 95.8
Strongly disagree 21 4.2 4.2 100.0
Total 505 100.0 100.0
Source: Data Derived from primary Survey Time Period 2009-10
Interpretation:
The above graph shows that 40% of respondents agree that retailing industry has immense scope of
investment, 21% of respondents strongly agree with it, 24% of respondents neither disagree nor
agree, 11% of respondents disagree and 4% strongly disagree with the statement.
Chart 5.17
180
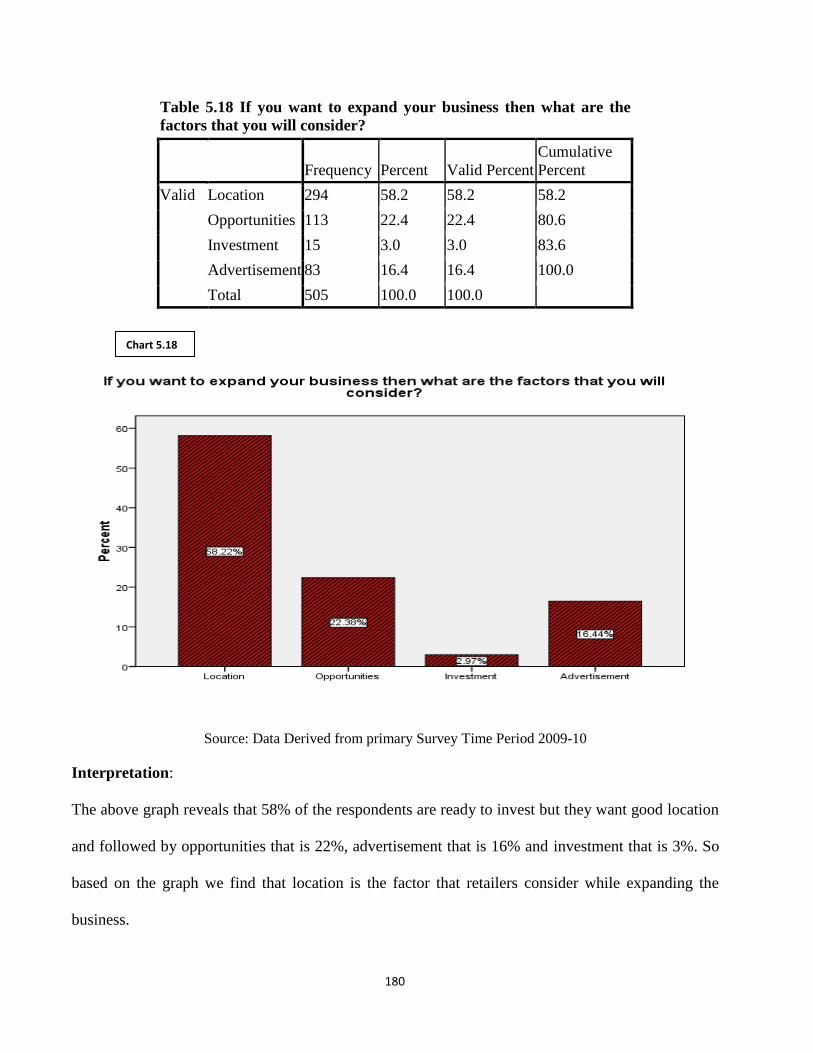
Table 5.18 If you want to expand your business then what are the
factors that you will consider? [
Frequency Percent Valid Percent
Cumulative
Percent
Valid Location 294 58.2 58.2 58.2
Opportunities 113 22.4 22.4 80.6
Investment 15 3.0 3.0 83.6
Advertisement 83 16.4 16.4 100.0
Total 505 100.0 100.0
Source: Data Derived from primary Survey Time Period 2009-10
Interpretation:
The above graph reveals that 58% of the respondents are ready to invest but they want good location
and followed by opportunities that is 22%, advertisement that is 16% and investment that is 3%. So
based on the graph we find that location is the factor that retailers consider while expanding the
business.
Chart 5.18
181
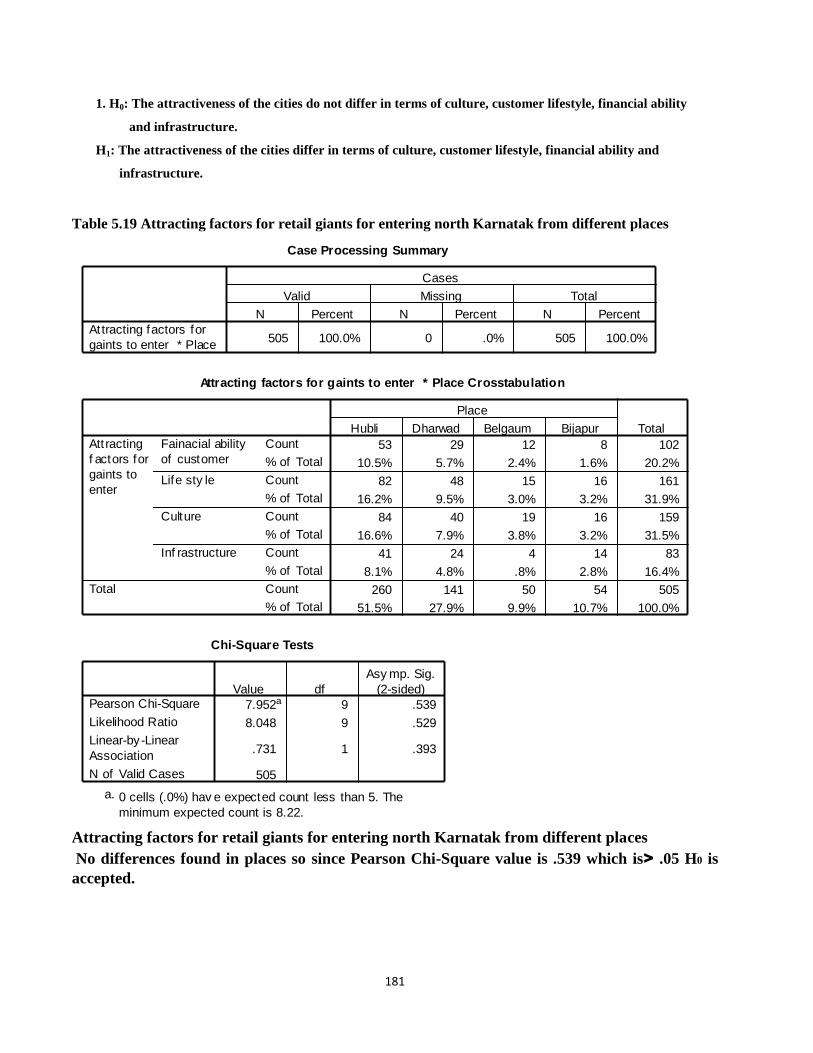
1. H0: The attractiveness of the cities do not differ in terms of culture, customer lifestyle, financial ability
and infrastructure.
H1: The attractiveness of the cities differ in terms of culture, customer lifestyle, financial ability and
infrastructure.
Table 5.19 Attracting factors for retail giants for entering north Karnatak from different places
Case Processing Summary
505 100.0% 0 .0% 505 100.0%Attracting factors for
gaints to enter * Place
N Percent N Percent N Percent
Valid Missing Total
Cases
Attracting factors for gaints to enter * Place Crosstabulation
53 29 12 8 102
10.5% 5.7% 2.4% 1.6% 20.2%
82 48 15 16 161
16.2% 9.5% 3.0% 3.2% 31.9%
84 40 19 16 159
16.6% 7.9% 3.8% 3.2% 31.5%
41 24 4 14 83
8.1% 4.8% .8% 2.8% 16.4%
260 141 50 54 505
51.5% 27.9% 9.9% 10.7% 100.0%
Count
% of Total
Count
% of Total
Count
% of Total
Count
% of Total
Count
% of Total
Fainacial ability
of customer
Life sty le
Culture
Inf rastructure
Att racting
f actors for
gaints to
enter
Total
Hubli Dharwad Belgaum Bijapur
Place
Total
Chi-Square Tests
7.952a 9 .539
8.048 9 .529
.731 1 .393
505
Pearson Chi-Square
Likelihood Ratio
Linear-by-Linear
Association
N of Valid Cases
Value df
Asy mp. Sig.
(2-sided)
0 cells (.0%) hav e expected count less than 5. The
minimum expected count is 8.22.
a.
Attracting factors for retail giants for entering north Karnatak from different places
No differences found in places so since Pearson Chi-Square value is .539 which is> .05 H0 is
accepted.

182
2. H0: Unorganized retailer’s perceived threat of organized retailer’s entry is independent of the city.
H1: Unorganized retailer’s perceived threat of organized retailer’s entry is dependent of the city.
Table 5.20 Perception of unorganized retail sector towards competition by organized
retailer’s views differed across places
Case Processing Summary
505 100.0% 0 .0% 505 100.0%
Perception of
competition wrt
organised play er * Place
N Percent N Percent N Percent
Valid Missing Total
Cases
Perception of competition wrt organised player * Place Crosstabulation
36 24 6 11 77
7.1% 4.8% 1.2% 2.2% 15.2%
65 27 19 4 115
12.9% 5.3% 3.8% .8% 22.8%
56 37 7 15 115
11.1% 7.3% 1.4% 3.0% 22.8%
101 51 18 20 190
20.0% 10.1% 3.6% 4.0% 37.6%
2 2 4 8
.4% .4% .8% 1.6%
260 141 50 54 505
51.5% 27.9% 9.9% 10.7% 100.0%
Count
% of Total
Count
% of Total
Count
% of Total
Count
% of Total
Count
% of Total
Count
% of Total
Terrible
Poor
Fair
Good
Very good
Percept ion of
competition
wrt organised
player
Total
Hubli Dharwad Belgaum Bijapur
Place
Total
Chi-Square Tests
30.861a 12 .002
27.721 12 .006
.165 1 .684
505
Pearson Chi-Square
Likelihood Ratio
Linear-by-Linear
Association
N of Valid Cases
Value df
Asy mp. Sig.
(2-sided)
4 cells (20.0%) have expected count less than 5. The
minimum expected count is .79.
a.
Perception of unorganized retail sector towards competition by organized retailer’s views
differed across places so since Pearson Chi-Square value is .002 which is< .05 H0 is rejected.
183
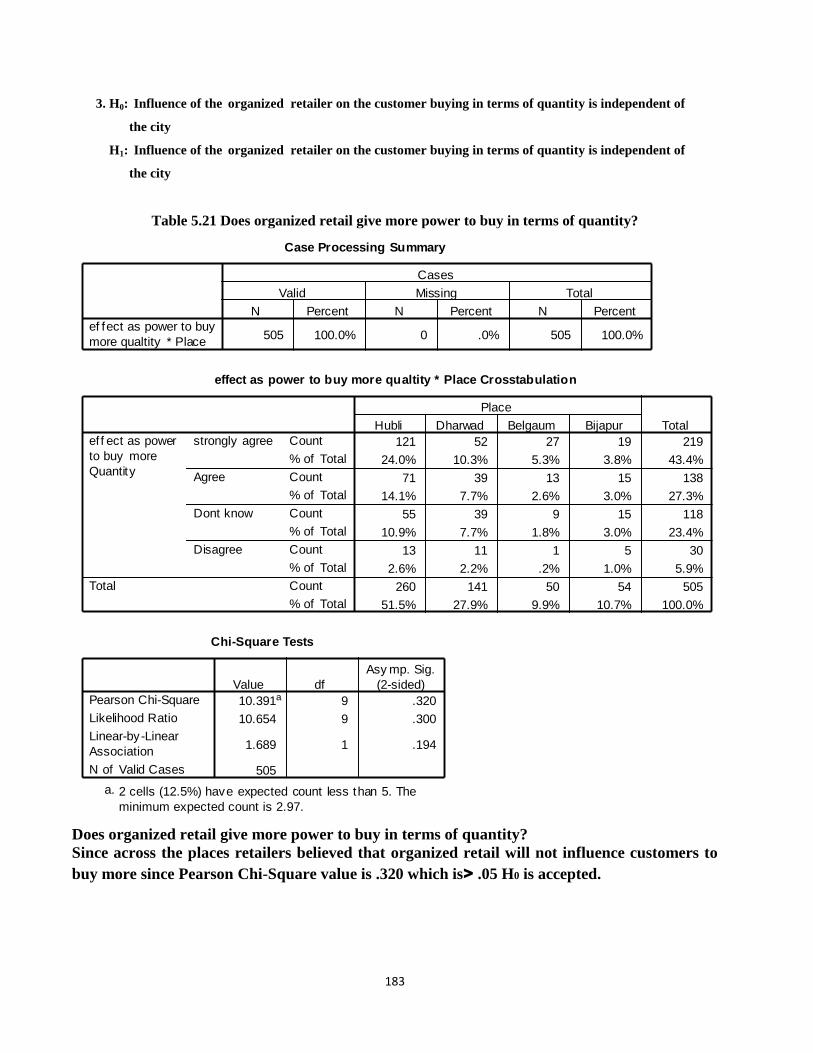
3. H0: Influence of the organized retailer on the customer buying in terms of quantity is independent of
the city
H1: Influence of the organized retailer on the customer buying in terms of quantity is independent of
the city
Table 5.21 Does organized retail give more power to buy in terms of quantity?
Case Processing Summary
505 100.0% 0 .0% 505 100.0%ef fect as power to buy
more qualtity * Place
N Percent N Percent N Percent
Valid Missing Total
Cases
effect as power to buy more qualtity * Place Crosstabulation
121 52 27 19 219
24.0% 10.3% 5.3% 3.8% 43.4%
71 39 13 15 138
14.1% 7.7% 2.6% 3.0% 27.3%
55 39 9 15 118
10.9% 7.7% 1.8% 3.0% 23.4%
13 11 1 5 30
2.6% 2.2% .2% 1.0% 5.9%
260 141 50 54 505
51.5% 27.9% 9.9% 10.7% 100.0%
Count
% of Total
Count
% of Total
Count
% of Total
Count
% of Total
Count
% of Total
strongly agree
Agree
Dont know
Disagree
ef f ect as power
to buy more
Quantity
Total
Hubli Dharwad Belgaum Bijapur
Place
Total
Chi-Square Tests
10.391a 9 .320
10.654 9 .300
1.689 1 .194
505
Pearson Chi-Square
Likelihood Ratio
Linear-by-Linear
Association
N of Valid Cases
Value df
Asy mp. Sig.
(2-sided)
2 cells (12.5%) have expected count less than 5. The
minimum expected count is 2.97.
a.
Does organized retail give more power to buy in terms of quantity?
Since across the places retailers believed that organized retail will not influence customers to
buy more since Pearson Chi-Square value is .320 which is> .05 H0 is accepted.
184
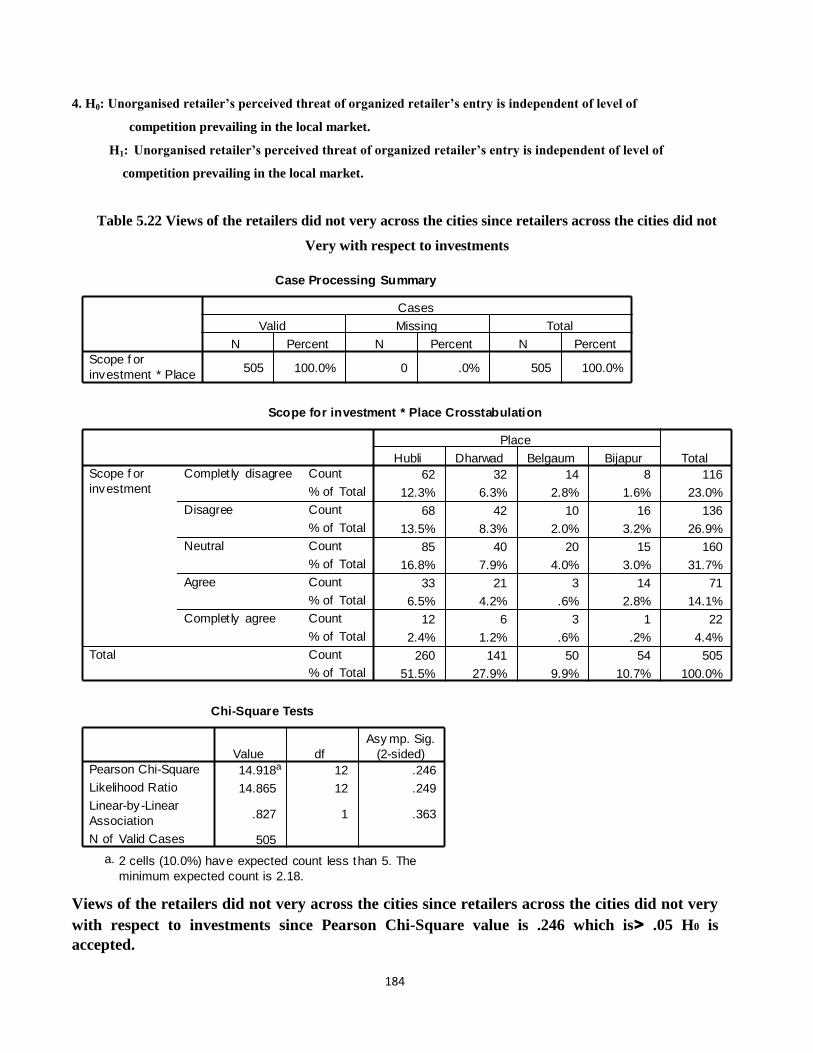
4. H0: Unorganised retailer’s perceived threat of organized retailer’s entry is independent of level of
competition prevailing in the local market.
H1: Unorganised retailer’s perceived threat of organized retailer’s entry is independent of level of
competition prevailing in the local market.
Table 5.22 Views of the retailers did not very across the cities since retailers across the cities did not
Very with respect to investments
Case Processing Summary
505 100.0% 0 .0% 505 100.0%Scope f or
investment * Place
N Percent N Percent N Percent
Valid Missing Total
Cases
Scope for investment * Place Crosstabulation
62 32 14 8 116
12.3% 6.3% 2.8% 1.6% 23.0%
68 42 10 16 136
13.5% 8.3% 2.0% 3.2% 26.9%
85 40 20 15 160
16.8% 7.9% 4.0% 3.0% 31.7%
33 21 3 14 71
6.5% 4.2% .6% 2.8% 14.1%
12 6 3 1 22
2.4% 1.2% .6% .2% 4.4%
260 141 50 54 505
51.5% 27.9% 9.9% 10.7% 100.0%
Count
% of Total
Count
% of Total
Count
% of Total
Count
% of Total
Count
% of Total
Count
% of Total
Complet ly disagree
Disagree
Neutral
Agree
Complet ly agree
Scope f or
investment
Total
Hubli Dharwad Belgaum Bijapur
Place
Total
Chi-Square Tests
14.918a 12 .246
14.865 12 .249
.827 1 .363
505
Pearson Chi-Square
Likelihood Ratio
Linear-by-Linear
Association
N of Valid Cases
Value df
Asy mp. Sig.
(2-sided)
2 cells (10.0%) have expected count less than 5. The
minimum expected count is 2.18.
a.
Views of the retailers did not very across the cities since retailers across the cities did not very
with respect to investments since Pearson Chi-Square value is .246 which is> .05 H0 is
accepted.
185
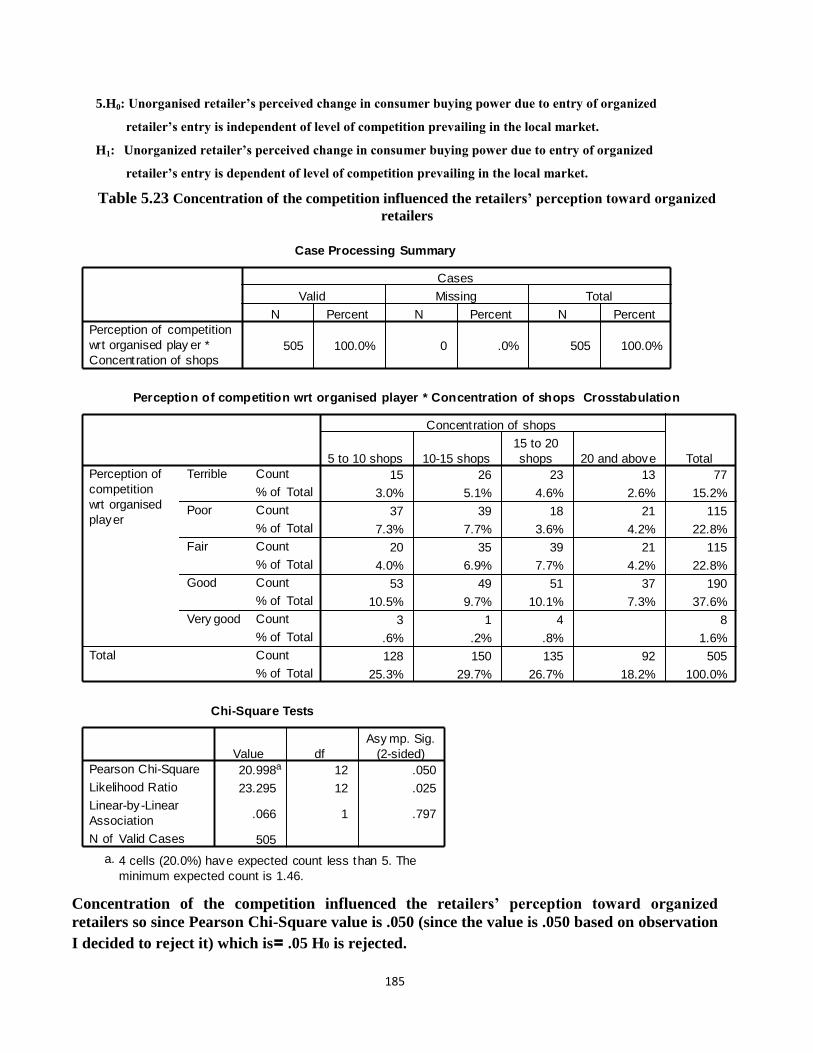
5.H0: Unorganised retailer’s perceived change in consumer buying power due to entry of organized
retailer’s entry is independent of level of competition prevailing in the local market.
H1: Unorganized retailer’s perceived change in consumer buying power due to entry of organized
retailer’s entry is dependent of level of competition prevailing in the local market.
Table 5.23 Concentration of the competition influenced the retailers’ perception toward organized
retailers
Case Processing Summary
505 100.0% 0 .0% 505 100.0%
Perception of competition
wrt organised play er *
Concentration of shops
N Percent N Percent N Percent
Valid Missing Total
Cases
Perception of competition wrt organised player * Concentration of shops Crosstabulation
15 26 23 13 77
3.0% 5.1% 4.6% 2.6% 15.2%
37 39 18 21 115
7.3% 7.7% 3.6% 4.2% 22.8%
20 35 39 21 115
4.0% 6.9% 7.7% 4.2% 22.8%
53 49 51 37 190
10.5% 9.7% 10.1% 7.3% 37.6%
3 1 4 8
.6% .2% .8% 1.6%
128 150 135 92 505
25.3% 29.7% 26.7% 18.2% 100.0%
Count
% of Total
Count
% of Total
Count
% of Total
Count
% of Total
Count
% of Total
Count
% of Total
Terrible
Poor
Fair
Good
Very good
Perception of
competition
wrt organised
player
Total
5 to 10 shops 10-15 shops
15 to 20
shops 20 and above
Concentration of shops
Total
Chi-Square Tests
20.998a 12 .050
23.295 12 .025
.066 1 .797
505
Pearson Chi-Square
Likelihood Ratio
Linear-by-Linear
Association
N of Valid Cases
Value df
Asy mp. Sig.
(2-sided)
4 cells (20.0%) have expected count less than 5. The
minimum expected count is 1.46.
a.
Concentration of the competition influenced the retailers’ perception toward organized
retailers so since Pearson Chi-Square value is .050 (since the value is .050 based on observation
I decided to reject it) which is= .05 H0 is rejected.

186
6.H0: Location, opportunity, investment and advertisement do not influence the risk
perception of unorganized retailer.
H1: Location, opportunity, investment and advertisement influence risk perception of
unorganized retailer.
Table 5.24 The concentration of the retailers from unorganized sector did not believe that
organized retail can influence consumer behavior
Case Processing Summary
505 100.0% 0 .0% 505 100.0%
Imapct of organised
reatling on buy ing
behav iuor *
Concentration of shops
N Percent N Percent N Percent
Valid Missing Total
Cases
Imapct of organised reatling on buying behaviuor * Concentration of shops Crosstabulation
72 75 82 50 279
14.3% 14.9% 16.2% 9.9% 55.2%
7 10 6 7 30
1.4% 2.0% 1.2% 1.4% 5.9%
48 65 47 35 195
9.5% 12.9% 9.3% 6.9% 38.6%
1 1
.2% .2%
128 150 135 92 505
25.3% 29.7% 26.7% 18.2% 100.0%
Count
% of Total
Count
% of Total
Count
% of Total
Count
% of Total
Count
% of Total
Cant say
Yes
No
11
Imapct of organised
reatling on buy ing
behaviuor
Total
5 to 10 shops 10-15 shops
15 to 20
shops 20 and above
Concentration of shops
Total
Chi-Square Tests
7.006a 9 .636
6.802 9 .658
.848 1 .357
505
Pearson Chi-Square
Likelihood Ratio
Linear-by-Linear
Association
N of Valid Cases
Value df
Asy mp. Sig.
(2-sided)
4 cells (25.0%) have expected count less than 5. The
minimum expected count is .18.
a.
The concentration of the retailers from unorganized sector did not believe that organized retail
can influence consumer behavior since Pearson Chi-Square value is .636 which is> .05 H0 is
accepted.
187
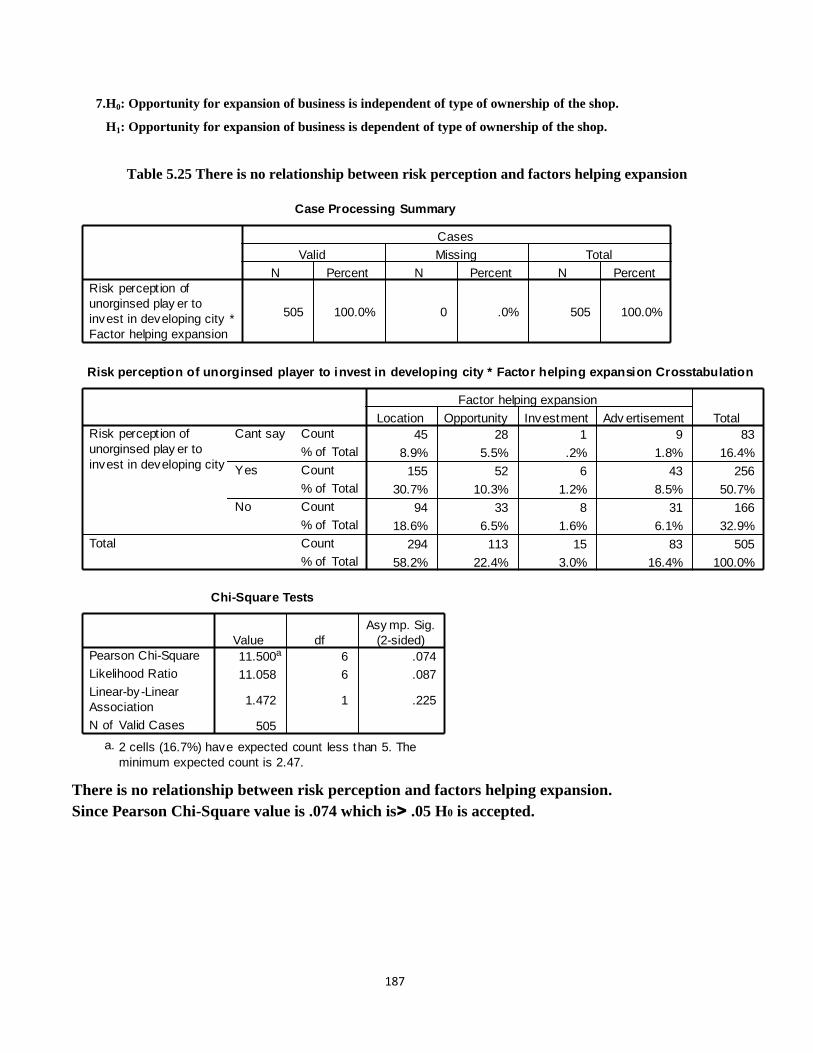
7.H0: Opportunity for expansion of business is independent of type of ownership of the shop.
H1: Opportunity for expansion of business is dependent of type of ownership of the shop.
Table 5.25 There is no relationship between risk perception and factors helping expansion
Case Processing Summary
505 100.0% 0 .0% 505 100.0%
Risk percept ion of
unorginsed play er to
invest in developing city *
Factor helping expansion
N Percent N Percent N Percent
Valid Missing Total
Cases
Risk perception of unorginsed player to invest in developing city * Factor helping expansion Crosstabulation
45 28 1 9 83
8.9% 5.5% .2% 1.8% 16.4%
155 52 6 43 256
30.7% 10.3% 1.2% 8.5% 50.7%
94 33 8 31 166
18.6% 6.5% 1.6% 6.1% 32.9%
294 113 15 83 505
58.2% 22.4% 3.0% 16.4% 100.0%
Count
% of Total
Count
% of Total
Count
% of Total
Count
% of Total
Cant say
Yes
No
Risk percept ion of
unorginsed play er to
invest in developing city
Total
Location Opportunity Investment Adv ertisement
Factor helping expansion
Total
Chi-Square Tests
11.500a 6 .074
11.058 6 .087
1.472 1 .225
505
Pearson Chi-Square
Likelihood Ratio
Linear-by-Linear
Association
N of Valid Cases
Value df
Asy mp. Sig.
(2-sided)
2 cells (16.7%) have expected count less than 5. The
minimum expected count is 2.47.
a.
There is no relationship between risk perception and factors helping expansion.
Since Pearson Chi-Square value is .074 which is> .05 H0 is accepted.

188
8.H0: There is equal opportunity across the cities for organized retailer to enter.
H1: There is no equal opportunity across the cities for organized retailer to enter.
Table 5.26 Type of ownership did not affect factors helping expansion.
Case Processing Summary
505 100.0% 0 .0% 505 100.0%
Type of Ownership
of the shop * Factor
helping expansion
N Percent N Percent N Percent
Valid Missing Total
Cases
Type of Ownership of the shop * Factor helping expansion Crosstabulation
162 65 13 48 288
32.1% 12.9% 2.6% 9.5% 57.0%
116 41 2 33 192
23.0% 8.1% .4% 6.5% 38.0%
11 4 2 17
2.2% .8% .4% 3.4%
5 3 8
1.0% .6% 1.6%
294 113 15 83 505
58.2% 22.4% 3.0% 16.4% 100.0%
Count
% of Total
Count
% of Total
Count
% of Total
Count
% of Total
Count
% of Total
Own
Rent
Other
4
Type of Ownership
of the shop
Total
Location Opportunity Investment Adv ertisement
Factor helping expansion
Total
Chi-Square Tests
8.495a 9 .485
10.923 9 .281
1.743 1 .187
505
Pearson Chi-Square
Likelihood Ratio
Linear-by-Linear
Association
N of Valid Cases
Value df
Asy mp. Sig.
(2-sided)
7 cells (43.8%) have expected count less than 5. The
minimum expected count is .24.
a.
Type of ownership did not affect factors helping expansion. since Pearson Chi-Square value is
.485 which is> .05 H0 is accepted.
189
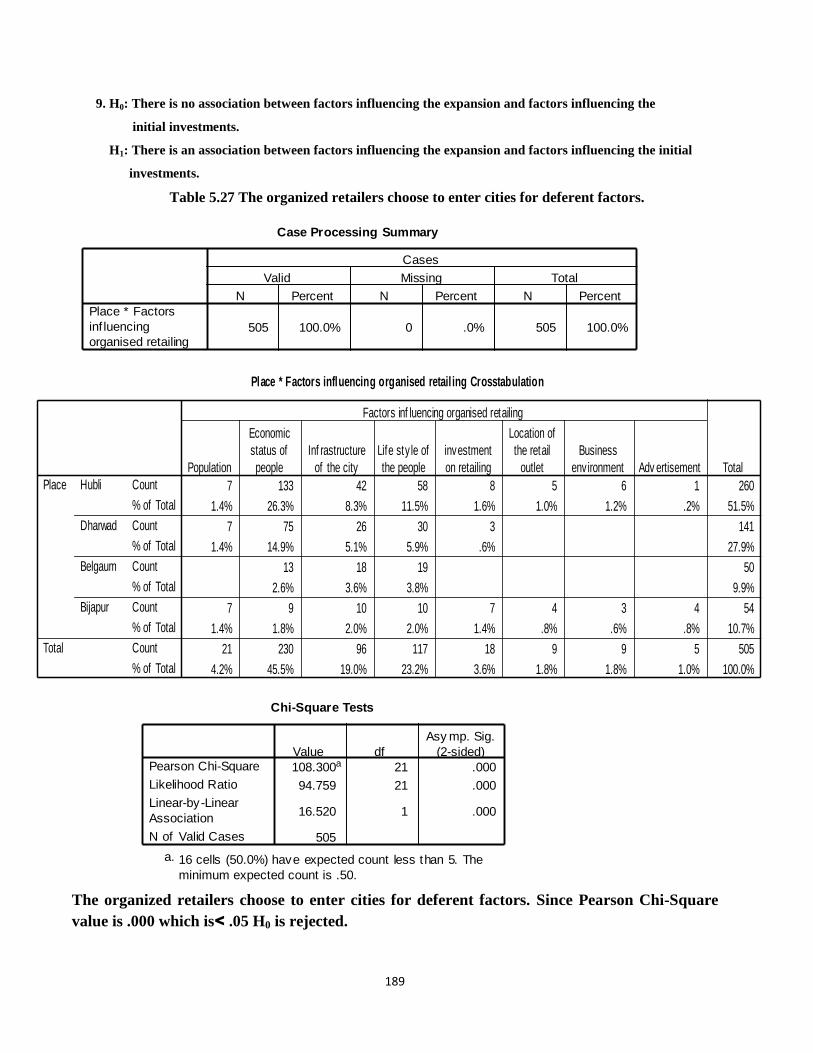
9. H0: There is no association between factors influencing the expansion and factors influencing the
initial investments.
H1: There is an association between factors influencing the expansion and factors influencing the initial
investments.
Table 5.27 The organized retailers choose to enter cities for deferent factors.
Case Processing Summary
505 100.0% 0 .0% 505 100.0%
Place * Factors
inf luencing
organised retailing
N Percent N Percent N Percent
Valid Missing Total
Cases
Place * Factors influencing organised retail ing Crosstabulation
7 133 42 58 8 5 6 1 260
1.4% 26.3% 8.3% 11.5% 1.6% 1.0% 1.2% .2% 51.5%
7 75 26 30 3 141
1.4% 14.9% 5.1% 5.9% .6% 27.9%
13 18 19 50
2.6% 3.6% 3.8% 9.9%
7 9 10 10 7 4 3 4 54
1.4% 1.8% 2.0% 2.0% 1.4% .8% .6% .8% 10.7%
21 230 96 117 18 9 9 5 505
4.2% 45.5% 19.0% 23.2% 3.6% 1.8% 1.8% 1.0% 100.0%
Count
% of Total
Count
% of Total
Count
% of Total
Count
% of Total
Count
% of Total
Hubli
Dharwad
Belgaum
Bijapur
Place
Total
Population
Economic
status of
people
Inf rastructure
of the city
Life sty le of
the people
investment
on retailing
Location of
the retail
outlet
Business
environment Adv ertisement
Factors inf luencing organised retailing
Total
Chi-Square Tests
108.300a 21 .000
94.759 21 .000
16.520 1 .000
505
Pearson Chi-Square
Likelihood Ratio
Linear-by-Linear
Association
N of Valid Cases
Value df
Asy mp. Sig.
(2-sided)
16 cells (50.0%) have expected count less than 5. The
minimum expected count is .50.
a.
The organized retailers choose to enter cities for deferent factors. Since Pearson Chi-Square
value is .000 which is< .05 H0 is rejected.

190
10. H0:There is no relationship between why existing unorganized retailers are not expanding and why
organized retail giants are entering north Karnatak
H1 There is relationship between why existing unorganized retailers are not expanding and why organized
retail giants are entering north Karnatak
Table 5.28 There is no relationship between why existing unorganized retailers are not expanding
and why organized retail giants are entering these Markets
Case Processing Summary
505 100.0% 0 .0% 505 100.0%
Factor helping expansion
* Factors inf luencing
organised retailing
N Percent N Percent N Percent
Valid Missing Total
Cases
Factor helping expansion * Factors influencing organised retai ling Crosstabulation
13 141 60 58 8 5 7 2 294
2.6% 27.9% 11.9% 11.5% 1.6% 1.0% 1.4% .4% 58.2%
6 41 17 39 6 2 1 1 113
1.2% 8.1% 3.4% 7.7% 1.2% .4% .2% .2% 22.4%
10 2 1 1 1 15
2.0% .4% .2% .2% .2% 3.0%
2 38 17 20 3 2 1 83
.4% 7.5% 3.4% 4.0% .6% .4% .2% 16.4%
21 230 96 117 18 9 9 5 505
4.2% 45.5% 19.0% 23.2% 3.6% 1.8% 1.8% 1.0% 100.0%
Count
% of Total
Count
% of Total
Count
% of Total
Count
% of Total
Count
% of Total
Location
Opportunity
Investment
Adv ertisement
Factor
helping
expansion
Total
Population
Economic
status of
people
Inf rastructure
of the city
Life sty le of
the people
investment
on retailing
Location of
the retail
outlet
Business
environment Adv ertisement
Factors inf luencing organised retailing
Total
Chi-Square Tests
30.717a 21 .078
32.266 21 .055
.557 1 .456
505
Pearson Chi-Square
Likelihood Ratio
Linear-by-Linear
Association
N of Valid Cases
Value df
Asy mp. Sig.
(2-sided)
18 cells (56.3%) have expected count less than 5. The
minimum expected count is .15.
a.
There is no relationship between why existing unorganized retailers are not expanding and
why organized retail giants are entering these Markets since Pearson Chi-Square value is .078
which is> .05 H0 is accepted

191
5.3 Employment Situation
The overall employment situation showed no change in the treatment sample which is in tune with
the authors' earlier analysis (Table 5.15). The treatment sample shows some decline in
employment in Delhi and Ahmedabad, while Kolkata and Hyderabad have some increase in
employment. In the control sample, Kolkata and Ahmedabad record strong growth in employment
in the unorganized retail sector. Surprisingly, Delhi indicates a large decline in unorganized retail
employment in the control sample and Hyderabad, no change.
Table 5.29: Employment Impact - Control vs Treatment Sample
Treatment Sample Control Sample
Average age
of organized
outlets (Yrs)
% Change in
employment Annualized %
change in
employment
Annual % change in
Employment
Delhi 1.37 -0.91 -0.67 -3.37
Kolkata 3.02 6.19 2.01 4.58
Hyderabad 1.97 1.16 0.59 0
Ahmedabad 1.10 -3.06 -2.79 4.47
Overall 1.65 0 0 -0.53
Source: DRS-ICRIER Retail Survey 2007.
5.4 Impact on Turnover and Profit
Table 5.16 brings out the comparative position with regard to turnover and profit for unorganized
retail in both treatment and control samples. The control sample records an overall growth in
turnover of about 2 per cent and profit of about 5 per cent in the past one year; in the treatment
sample, both turnover and profit declined by about 10 per cent per annum. This diverse impact as
between the treatment and control samples is evident in all the four cities.
192
The dissimilar impact as between the treatment and control samples is also seen in the proportion of
retailers who experienced a decline in turnover or profit. In the treatment sample, overall 50-
51 per cent of unorganized retailers indicated a decline in turnover and profit, while that
proportion was only 28-29 per cent in the control sample (Table 5.4).
The unorganized retailers who were subject to a decline in turnover and profit were asked the major
reason for that decline. In the treatment sample, 50-58 per cent of retailers who were subject
to decline in turnover and profit attributed it to competition from organized retail, whereas only 24-
25 per cent in the control sample attributed it to organized retail . Similarly, while only 12-
13 per cent quoted competition from the unorganized retailers as the main reason for
decline in the treatment sample, a larger 26-32 per cent considered that as the main reason for the
decline in the control sample.
5.5 Consumer Survey Results
The purpose of the survey of consumers is to understand the behaviour of and benefits to consumers
in shopping at organized vs. unorganized retail outlets. Exit interviews were conducted with 505
consumers who shopped at 101 organized outlets in the selected 10 cities and an equal number
of consumers who shopped at 101 unorganized outlets in the same cities. After dropping the outliers,
the sample has 470 customers at organized outlets and 462 at unorganized outlets.
5.6 Income Levels of Shoppers
As expected, consumers shopping at organized outlets have higher income levels than consumers
shopping at unorganized outlets. However, the middle class including the aspirers (covering
monthly household income between Rs.10,000 to Rs. 1,00,000) which is the mainstay for
retail, shop at both organized and unorganized outlets.
193
5.7 Location Advantage for the Unorganized Retailers
Location is a comparative advantage for unorganized retailers as the mean distance to the residence
for consumers at unorganized outlets is 1.1 km compared to 2.6 km for consumers at organized
outlets . As expected, a majority of consumers walk to traditional retailers, while most of the
consumers use own vehicle to reach organized outlets.
5.8 Preference for Organized vs Unorganized Retailers
Those who shopped at organized outlets reported the main reasons as better product quality, lower
price, one-stop shopping, choice of more brands and products, family shopping, fresh stocks, etc.
Those who shopped at unorganized outlets attributed it to proximity to residence, goodwill, credit
availability, possibility of bargaining, choice of loose items, convenient timings, home delivery, etc.
The survey also throws light on the fact that shoppers do not shop exclusively at the
organized or the unorganized outlets. They shop at both outlets and the share of spending
varies from product to product. Even those who were interviewed at organized outlets,
declared that 43-46 per cent of their spending on vegetables, fruit, non-staple food items, cooking
oil and other packaged food items was from unorganized outlets (Table 5.7). On the
whole, the sample shoppers at organized outlets make a 30 per cent of their spending on
food and grocery, and textiles and clothing at unorganized outlets.
Similarly, consumers interviewed at unorganized outlets also spend at organized outlets; on an
average, 39 per cent of their monthly shopping is done at organized outlets. This is
relatively higher for toiletries (59 per cent), household cleaning products (45 per cent),
readymade garments (45 per cent), and cooking oil (41 per cent).

194
The consumers at organized outlets were asked whether their overall spending on food and
grocery, and textiles and clothing has increased, decreased, or remained the same after they started
shopping from organized outlets. While 32 per cent of sampled consumers declared an increase in
spending, 21 per cent indicated a decrease and the balance no change. Thus the arrival of
organized retail has enhanced spending in general. The reasons indicated for higher spending
have been mainly the purchase of larger quantities due to wider range of products, availability of
attractive offers like discounts and promotional schemes, and access to better quality products with
higher prices.
5.9 Savings from Organized Outlets
Do the shoppers who buy at organized outlets save money? Yes, they save but the degree of
saving depends upon the type of modern formats. The sampled consumers at organized outlets
reported an overall saving of 4 per cent, and the saving is higher at 8 per cent at discount stores
and supermarkets, and a low of 2 per cent at hypermarkets and hardly one per cent at
departmental stores (textiles and clothing outlets). Interestingly, the survey has shown that
small spenders save more from shopping at organized outlets
Is it that the small spenders who save more at organized outlets are into cherry picking on discounted
items irrespective of income levels or are they from the low- income brackets?
5.10 Consumers' View on Opening of More Organized Outlets
Finally, consumers were asked about their opinion about opening of more organized outlets. Among
the shoppers at organized outlets, 73 per cent wanted more organized outlets whereas only 34 per
cent of shoppers at unorganized outlets preferred to have more organized outlets. Among both
shoppers, a quarter did not want any more organized outlets.

195
5.11 Consumer Survey at Unorganized Fruit and Vegetable Outlets
The above consumer survey did not include consumers who are shopping at pure fruit and vegetable
shops located in fixed market areas or the push-cart hawkers selling fruit and vegetables.
Separate exit interviews were conducted of a total of 308 consumers shopping at these outlets
in nine major cities (all ten cities included earlier minus Kochi). The findings of this survey are given
below.
5.12 Income Levels of Consumers
About 52 per cent of the sampled shoppers at fixed and push-cart fruit and vegetable vendors are the
low-income households (monthly income up to Rs. 10,000). Within the sample, it is observed that
about 37 per cent (114 numbers) of consumers shop also from organized retail outlets and the
majority (63 per cent) shop exclusively from unorganized outlets. If we consider the part of
shoppers who exclusively shop from these outlets, 66 per cent of them belong to the low-
income group . Among those who also shop from organized outlets for fruit and vegetables,
the majority (71 per cent) belongs to the middle-income category (monthly household income
from Rs. 10,000 to Rs. 1,00,000).
5.13 Attractiveness of Shopping from Fruit and Vegetable Vendors
Proximity comes out clearly as the major advantage of the traditional fruit and vegetable
shops and hawkers with their mean distance for consumers at just one km (Chart 5.4). A majority of
consumers walk to these outlets (62 per cent), some travel by scooter or motor cycle (19 per cent).
These results are similar to what was evident in the case of consumers shopping at neighbourhood
kirana shops.

196
Mean Distance = 1.04 km
Besides closeness to residence, the survey has highlighted the other attractive features of shopping
from these retail outlets as: possibility of bargaining, freshness of products, better quality,
lower price, choice of varieties, credit availability, convenient timings, etc.
5.14 Share of Purchases, Organized vs Unorganized Outlets
As indicated earlier, some of the consumers who shop at unorganized fruit and vegetable
outlets also shop from organized outlets. On an average, these shoppers make 11 purchases in
a month of which two are made from organized outlets. In the case of the shoppers who also shop
from organized outlets (which constitute 37 per cent of the sample); they make 13 purchases a
month of which four are from organized outlets. If we consider all those who shop
exclusively from unorganized outlets, they shop 10 times a month.
As regards the level of spending in these outlets, the consumers on an average spend approximately
Rs. 1,085 in a month on fruit and vegetables of which nearly one-fifth is spent at organized outlets.
If one takes into account only those who shop also from organized outlets, they make over two-
fifths of their fruit and vegetable purchases from organized outlets.
5.15 Preference for Additional Organized Outlets
These consumers were also asked whether they would like the opening of additional organized
outlets for fruit and vegetables, a third answered in the positive. About 29 per cent did not want any
additional organized outlets and 38 per cent did not have any opinion.
197
5.16 Business Profile and Employment
Intermediation is the core business for 96 per cent of the sampled intermediaries. A majority of
them have been in business for a very long period: 36 per cent are in
business for more than 20 years and only 29 per cent are for less than 10 years. Thirty-two
per cent of the intermediaries interviewed are company-appointed stockists or distributors.
A bulk of the sampled intermediaries has good infrastructural backing: 71 per cent have warehouses
and 80 per cent of them own those warehouses; 50 per cent of the intermediaries have their own
transport and 77 per cent of them own them. 97 intermediaries employed 586 persons under
them in 2006-07, almost the same number of 587 employees in 2005-06.
5.17 Business Turnover and Profit
The sampled intermediaries reported an increase of turnover by 7.5 per cent in 2006- 07 over 2005-
06 and an increase in profit by 15 per cent also over the same period. However, the sample
indicated that there was: (i) some decline in turnover in fruit, vegetables and apparel; (ii) a
decline in profit in vegetables and apparel; and (iii) stagnation in profit in pulses, packaged
consumer products and fruit (Table 5.13).
The sampled intermediaries were asked whether they have experienced an increase, decrease
or constant turnover and profit in the past year compared to the previous year. In both
turnover and profit, the number who reported increase had been 23-24 per cent which is lower
than those who reported decrease (33 per cent for turnover and 38 per cent for profit). With both
overall turnover and profit showing an increase, it implies that the smaller intermediaries have
been affected. Interestingly, product- wise response indicated that a greater number of

198
intermediaries had decreases than increases except in product categories of rice and wheat for both
turnover and profit, and pulses for turnover (Table 5.14).
Intermediaries were asked whether the emergence of organized retail had any adverse impact on
them. Thirty seven per cent have admitted an adverse impact, while 59 per cent indicated no
adverse impact. However a larger proportion of intermediaries dealing in commodities, such as
rice (54 per cent), fruit (56 per cent), vegetables (50 per cent) and packaged consumer products
(42 per cent) have indicated negative impact (Table 5.15).
The intermediaries were also asked whether they adopted changes in their business strategy
to meet the threat from organized retail. Only 19 per cent had admitted changes in business
strategy during 2006-07. The measures included improved services to customers, reduction in
margins, dealing in better quality products, reduction of expenditure, reduced staff, new product
lines, and increased credit sales. While 37 per cent had indicated adverse impact of organized retail,
a lower proportion of 31 per cent intermediaries reported possible adverse impact of organized retail
in their future business (Chart 5.6). Even this 31 per cent plan different strategies to remain
competitive to cope with the adverse effect of organized retailing, such as offering discounts,
reducing margins, putting pressure on the government, shifting to better quality and branded
products, increasing the variety of products, enhancing credit facility, etc.
With regard to future plans, 66 per cent are prepared to invest and expand business and remain
competitive. About 89 per cent want to remain in the same business, while only 3 per cent are
thinking of changing the business line. An overwhelming proportion - almost two-thirds want
their children to get into intermediary business and only 22 per cent did not want their
children to be in the same business (Chart 5.7).

199
5.18 Impact of Organized Retailing on Producers
The presence of those intermediaries (wholesalers) within the dotted arrow boxes is optional. On
most occasions, these wholesalers are absent from the chain. These wholesalers are typically
responsible for the produce reaching the small retailers such as the small stationery vegetable shops
and the many push-cart vendors and hawkers.
With the exception of the last two chains, (f) and (g)), which pertain only to organized retailers, in
all the other chains, the retailer may be an organized or a traditional retailer. Most farmers
utilize a mix of the chains listed above.
5.19 Manufacturers anticipate several threats.
• The price pressure threat. Manufacturers anticipate that the growth of organized retail will
put pressure on their prices as large retailers are already deSanteng lower prices in return for larger
volumes. Manufacturers also face the additional issue of delayed payments vis-à-vis large retailers
that impacts their profitability. Manufacturers felt that some of these price/payment
pressures arise from the underlying cost structure of large retailers who are facing increase
in costs in the entire value chain because of high real estate prices and increased employee
cost.
• The private label threat. Manufacturers anticipate that large retailers will expend efforts on
building their own store brands and will favour those brands in building in-store visibility and
allocation of shelf space. This will become more of a threat as the point of consumer decision-
making shifts from the home to the shop floor as consumers build a preference for self-
200
service formats. The threat is somewhat mitigated in the short term by their belief that modern
retailers will tend to launch private labels more in the staples category, where the presence of
brands is currently low. Manufacturers also felt that they have constantly battled strong
regional/local brands successfully and that private labels are another form of such competition.
Also, modern retailers will first face the arduous task of building strong, differentiated store brands
before developing and building their private label brands. The multiplicity of categories in which
private labels will need to be built also makes this task harder for the retailers.
5. Manufacturers are gearing up to counter these threats in various ways.
• Reinforcing/building brand strength to help maintain countervailing power.
Manufacturers recognize that their most powerful counter to price and private label threats is a
strong brand. Therefore they felt that their brands have strong consumer preference which would
help them counter competition from private label brands and give them more bargaining power
since these brands also generate footfalls for modern retailers. They, therefore, will continue
to focus on building strong brands (which they see as their area of competence), allowing
them to negotiate terms that are mutually beneficial, collabourative, and lead to a "win-win"
situation for both parties concerned.
• Increasing manufacturer's own retail presence. Manufacturers are also moving towards
increasing their own retail presence in order to compete with modern retailers. Apparel
manufacturers, for example, are opening exclusive showrooms to give their brands more visibility
and to strengthen their position in this competitive scenario.
• Helping small retailers. Most of the FMCG companies interviewed stated that their
companies were ready to assist small retailers by "adopting" them and helping them upgrade
201
service levels, systems, and operations. They anticipate that, in the next few years, the
number of such "adopted" stores would almost double.
They believe that if small retailers also come forward and unite, they can more effectively counter
the competition posed by modern retail. Manufacturers stated that they are encouraging
kiranas to consolidate buying of products from manufacturing companies as it would help
small retailers build economies and efficiencies in their scale of operations. Many retailers
are already coming forward to form these associations.
They think that kiranas need to learn several aspects of retailing - like store promotions - from
organized retailers and that they are ready to support kiranas by developing promotional offers
customized to their set of customers.
• Constituting dedicated teams internally to deal with modern retailers.
Manufacturers are creating dedicated teams of accounts and category managers to deal
with modern retailers. At the central/regional level they are recruiting teams to manage relationships
with modern retailers as well as plan for new accounts. At the front end, dedicated teams are
being constituted to work on developing store promotions through modern retailers.
• Challenging times ahead for modern retailers too. Large manufacturers felt that high rentals
arising out of a shortage of real estate will be a challenge for modern retailers and will affect their
competitiveness vis-à-vis small retailers.
Manufacturers were of the opinion that, while modern retail is an exciting phenomenon for
small town consumers, in larger cities consumers want convenience and so being present in the
right location are even more critical in these cities.
202
Finally, manufacturers strongly believe that retailing is a local business and the large retailers
will have to understand the local consumer's tastes and preferences and conduct extensive
research to build their knowledge of local markets and consumers.
5.20 Future Scenario in Retailing
The emergence of organized retail has been a recent phenomenon in the country, starting in
the late 1990s. Its growth till 2006-07 was reasonably fast, at nearly 20 per cent per annum during
the past three years. Unorganized retail also grew but at a slower pace of nearly 11 per cent
per annum. There are signs that the growth of organized retail has accelerated in 2007-08
and is expected to gather further momentum during the coming years. This chapter highlights
the following issues: (a) industrial estimate of future growth in total retail during the next five
years; (b) relative share of organized vs. unorganized sectors; (c) the amount of additional
investments that are envisaged in retail in the medium term; (d) estimates of employment
generation; (e) geographical penetration of organized retail; (f) projection of real estate
availability; and (h) the concentration in retail industry.
5.21 Growth of Retail and its Distribution
The NCAER, based on its Market Information Survey of Households (MISH), has projected
that the consuming class consisting of the "aspirers", the middle class and the rich with annual
household income of above Rs. 90,000 will rise from about 336 million in 2005-06 to 505 million in
2009-10. This implies a huge growth potential of retail in the country. The sales of the Indian retail
industry have been about US$ 322 billion (Rs. 14,574 billion) in 2006-07, amounting to about
35 per cent of India's GDP. It is the seventh largest retail market in the world. Indian retail
industry is projected to grow to about US$ 590 billion by 2011-12 and further to over US$
203
1 trillion by 2016-17 (Chart 5.13).
5.22 The Retail Real Estate Scenario
The real estate sector in India has historically been unorganized and dominated by
opportunistic development rather than any planned creation of quality space. There were
various factors that impeded organized development, such as: (i) absence of a centralized title
registry providing title guarantee; (ii) lack of uniformity in local laws and their application; (ii)
non-availability of bank financing; (iii) high interest rates and transfer taxes; and (iv) lack
of transparency in transaction values. Also, there were very few takers of quality space, as
retail was also dominated by unorganized players. The unorganized players prefer to operate from
neighbourhood convenience stores.
Whilst the Indian real estate market still lacks transparency and liquidity compared to more mature
real estate markets, there are various factors which could expedite the process of
professionalism of the industry. Some of these factors are:
• Changing profile of the business consumers, like large multinational companies
(MNCs) and professional Indian corporates, who would prefer to deal with companies with
proper credentials;
• Listing of many developers on stock exchanges, both in India and abroad, and also raising funds
through global institutions;
• Increasing transactions facilitated through professional banks, who would once again verify
all the records before releasing any funds. The nature of demand is also changing with the
entry of large corporates into organized retailing. These large corporates cater to higher

204
consumer aspirations resulting from larger disposable incomes, increased globalization, and
greater awareness levels.
The organized retail real estate sector has grown from a miniscule 0.9 million sq. ft. in 1999 to 28
million sq. ft. in 2006. The growth till now has been at a scorching pace of over 60 per cent per
annum for the last seven years (though on a smaller base) and is expected to grow at least at 50
per cent per annum in the next 4-5 years. The last financial year witnessed a number of retail
centric projects.
5.23 Organized Retail Investment
Until a couple of years ago, the Indian organized retail market was either dominated by the apparel
brands or regional retail chains. However, the scenario has changed dramatically. The sector
has attracted not only the large Indian corporates but also received the attention of large global
players.
As per Technopak Advisers Pvt. Ltd. estimates, investments amounting to approximately
US$ 35 billion are being planned for the next five years or so (Table 7.1). Of this, about 70 per cent
is expected to come from top seven players including Reliance Industries, Aditya Birla Group,
Bharti-Wal-Mart, Future Group and others. Also, it is estimated that about 40 per cent of the total
investments will be contributed by foreign players including Wal-Mart, Metro, Auchan, Tesco
and many others, signifying the importance that the international community is attaching to the
Indian retail opportunity.
In short, India is attempting to do in 10 years what took 25-30 years in other major markets in the
world and shall bypass many stages of "evolution" of modern retail. India is likely to see the

205
emergence of several "innovative" India-specific retail business models and retail formats during
the coming years.
5.24 Share of Investments by City
Of the US$ 35 billion investment being planned over next 5-7 years, almost all the investment
(i.e. 93 per cent) is slated for the urban market. Though the investment is expected to be across the
spectrum of all types of cities, a large proportion (more than 60 per cent) is slated for the top 25
cities falling in category A-type or above .
AAA cities will include the markets of NCR Delhi, Mumbai, and Kolkata, while AA cities will
include the metros including Bangalore, Chennai, Hyderabad, Pune, and Ahmedabad. A
typical A-class city will include cities like Surat, Nagpur, Indore, Vadodara, etc., while B+
cities will be represented by Nashik, Rajkot, Agra, Jallandhar, etc. Kota, Bhubaneswar,
Bilaspur will be a B-class cities, while Sonepat, Alwar, Tumkur, Hubli , Belgaum, Mysore ,
manglore etc will categorized as C-type and D- type cities.
5.25 Expected Share of Top Players in Indian Retail
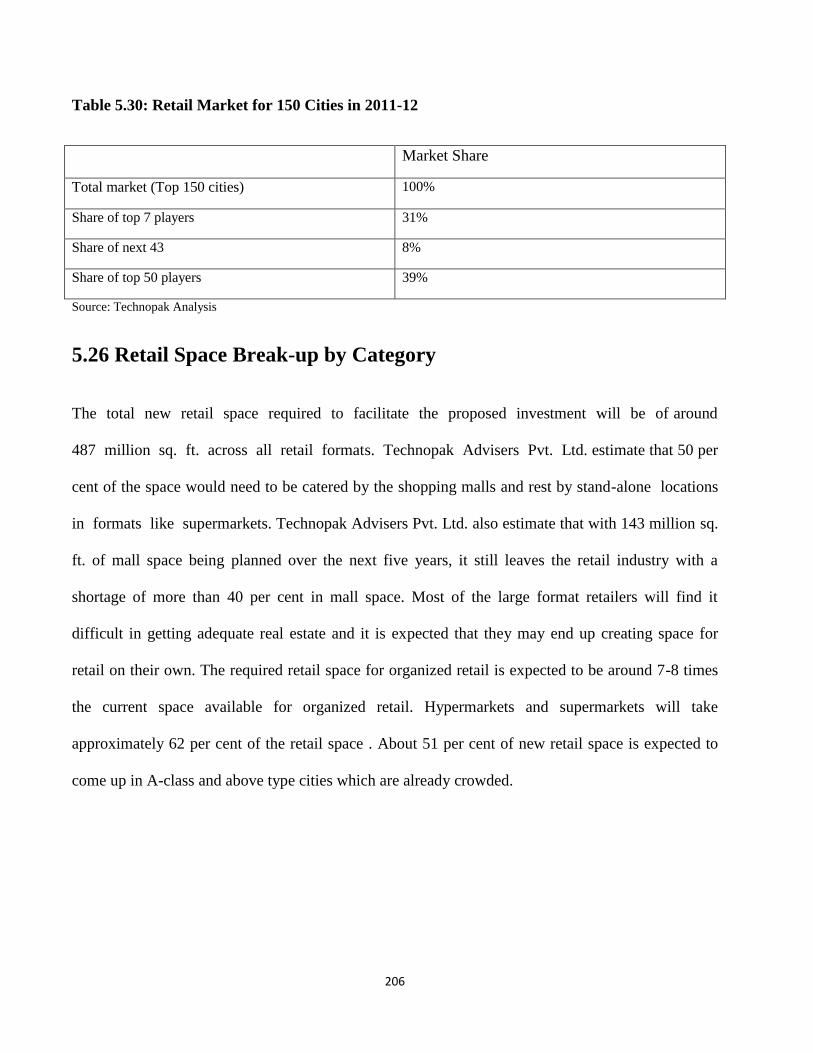
The top 50 players are geared to take about 39 per cent share of total retail in the top 150 cities.
These top players will dominate the market in Indian retail. This high concentration in the
retail market is in tune with international trends. For example, in the US, the top five retailers,
such as Wal-Mart, Kroger, Albertsons, Safeway, and Ahold, account for about 40 per cent of the
US grocery market.
206
Table 5.30: Retail Market for 150 Cities in 2011-12
Market Share
Total market (Top 150 cities) 100%
Share of top 7 players 31%
Share of next 43 8%
Share of top 50 players 39%
Source: Technopak Analysis
5.26 Retail Space Break-up by Category
The total new retail space required to facilitate the proposed investment will be of around
487 million sq. ft. across all retail formats. Technopak Advisers Pvt. Ltd. estimate that 50 per
cent of the space would need to be catered by the shopping malls and rest by stand-alone locations
in formats like supermarkets. Technopak Advisers Pvt. Ltd. also estimate that with 143 million sq.
ft. of mall space being planned over the next five years, it still leaves the retail industry with a
shortage of more than 40 per cent in mall space. Most of the large format retailers will find it
difficult in getting adequate real estate and it is expected that they may end up creating space for
retail on their own. The required retail space for organized retail is expected to be around 7-8 times
the current space available for organized retail. Hypermarkets and supermarkets will take
approximately 62 per cent of the retail space . About 51 per cent of new retail space is expected to
come up in A-class and above type cities which are already crowded.

207
5.27 Employment Growth
As per the industry estimates of employment of one person per 350-400 sq. ft. of retail
space, about 1.5 million jobs will be created in the front-end alone in the next five years. Assuming
that 10 per cent extra people are required for the back-end, the direct employment generated by the
organized retail sector in India over the coming five years will be close to 1.7 million jobs. This
constitutes nearly 5 per cent of the existing employment of about 37 million in the retail industry.
Indirect employment generated on the supply chain to feed this retail business will add
further to this already high number. While a boon for the Indian economy in terms
of the employment generation, at the same time it is a significant challenge for the organized retail
industry to gain access to such a high number of trained manpower in such a short period of
time.
Table 5.31: Employment Generation by Organized Retail during 2007-12
Hypermarket Supermarket Cash &
Carry
Speciality &
Department
Store
Total
New retail space (Million sq. ft.) 218 86 76 107 487
Retail space per floor staff (sq.ft.) 350 200 450 350
No. of front-end staff ('000) 623 430 169 306 1527
No. of back-end staff ('000) 62 43 17 31 153
Total manpower ('000) 685 473 186 336 1527
Source: Technopak Analysis and Industry Estimates

208
5.28 A Balanced Approach to Retail
India is at the crossroads with regard to the retail sector. Several emerging market economies
have gone ahead and reaped the benefits of modern retail. India is however a latecomer to organized
retail expansion and the picture still remains unclear as to its future direction. The study advocates a
balanced approach to retail and suggests that the government plays a major role in shaping its future
course.
There is no doubt that traditional retail has been performing a vital function in the economy
and is a significant source of employment. However, it suffers from huge inefficiencies as a
result of which consumers do not get what they want, and farmers often get prices for their
produce much below what is considered fair. In contrast, organized retail provides consumers
with a wider choice of products, lower prices, and a pleasant shopping environment. It gives
farmers a better alternative channel for selling their products at a better price. The competition
from organized retail has affected the business of traditional retailers but they are making efforts to
stay on. In their struggle to face this competition, they are handicapped by a lack of access
to formal credit from commercial banks. As in other countries, government policy can and should
play an important role in modernizing the unorganized sector and improve its competitiveness. On
the other hand, a policy of protection of traditional retailers by restricting organized retail will
harm the growth prospects of the country by foregoing the enormous benefits that are generated
by organized retail.
209
5.29 Modern Retail Formats in India
Hypermarket
Typically varying between 50,000 sq. ft. and 1, 00,000 sq. ft., hypermarkets offer a large
basket of products, ranging from grocery, fresh and processed food, beauty and household products,
clothing and appliances, etc. The key players in the segment are: the RPG Group's Giant (Spencer's)
hypermarkets, and Pantaloon Retail's Big Bazaars.
Cash-and-carry
These are large B2B focused retail formats, buying and selling in bulk for various
commodities. At present, due to legal constraints, in most states they are not able to sell fresh
produce or liquor. Cash-and-carry (C&C) stores are large (more than 75,000 sq. ft.), carry
several thousand stock-keeping units (SKUs) and generally have bulk buying requirements. In India
an example of this is Metro, the Germany-based C&C, which has outlets in Bangalore and
Hyderabad.
Department Store
Department stores generally have a large layout with a wide range of merchandise mix,
usually in cohesive categories, such as fashion accessories, gifts and home furnishings, but
skewed towards garments. These stores are focused towards a wider consumer audience catchment,
with in-store services as a primary differentiator. The department stores usually have 10,000 -
60,000 sq. ft. of retail space. Various examples include: (i) Shoppers' Stop, controlled by the K.
Raheja Group, a pioneering chain in the country's organized retail; (ii) Pantaloons, a family chain
store, which is another major player in the segment; (iii) Westside, the department store chain from
210
Tata Group's Trent Ltd; (iv) Ebony, a department store chain from another real- estate
developer, the DS Group; (v) Lifestyle, part of the Dubai-based retail chain, Landmark
Group; and (vi) the Globus department and superstore chain.
Supermarket
Supermarkets, generally large in size and typical in layouts, offer not only household products but
also food as an integral part of their services. The family is their target customer and typical
examples of this retailing format in India are Apna Bazaar, Sabka Bazaar, Haiko, Nilgiri's,
Spencer's from the RPG Group, Food Bazaar from Pantaloon Retail, etc.
Shop-in-Shop
There is a proliferation of large shopping malls across major cities. Since they are becoming
a major shopping destination for customers, more and more retail brands are devising
strategies to scale their store size in order to gain presence within the large format,
department or supermarket, within these malls. For example, Infinity, a retail brand selling
international jewellery and crystal ware from Kolkata's Magma Group, has already established
presence in over 36 department chains and exclusive brand stores in less than five years. Shop-
in-shops have to rely heavily on a very efficiently managed supply chain system so as to ensure
that stock replenishment is done fast, as there is limited space for buffer stocks.
Specialty Store
Specialty stores are single-category, focusing on individuals and group clusters of the same class,
with high product loyalty. Typical examples of such retail format are: footwear stores, music
stores, electronic and household stores, gift stores, food and beverages retailers, and even
211
focused apparel chain or brand stores. Besides all these formats, the Indian market is flooded
with formats labelled as multi-brand outlets (MBOs), exclusive brand outlets (EBOs), kiosks and
corners, and shop-in-shops.
Category Killers - Large Speciality Retailers
Category killers focus on a particular segment and are able to provide a wide range of choice to the
consumer, usually at affordable prices due to the scale they achieve. Examples of category
killers in the West include Office Mart in the US. In the Indian context, the experiment in the sector
has been led by "The Loft", a footwear store in Powai, Mumbai measuring 18,000 sq. ft.
Discount Store
A discount store is a retail store offering a wide range of products, mostly branded, at discounted
prices. The average size of such stores is 1,000 sq.ft. Typical examples of such stores in India are:
food and grocery stores offering discounts, like Subhiksha, Margin Free, etc. and the factory
outlets of apparel and footwear brands, namely, Levi's factory outlet, Nike's factory outlet,
Koutons, etc.
Convenience Store
A convenience store is a relatively small retail store located near a residential area (closer to
the consumer), open long hours, seven days a week, and carrying a limited range of staples and
groceries. Some Indian examples of convenience stores include: In & Out, Safal, amongst others.
The average size of a convenience store is around 800 sq.ft.
Source: Technopak Advisors Pvt. Ltd.
Note: The list may vary from state to state and as per the store format.