Notes Over 2.3 Graphing with the Slope-Intercept Form Graph the equation.
Upload
byron-parsonsCategory
view
224download
2
Chapter Two: Science Skills
2.1 Mass and Volume
2.2 Density
2.3 Graphing
2.4 Solving Problems

2.1 Measuring massMass describes the
amount of matter in an object.
The SI unit for mass is the kilogram (kg).
The kilogram is too large a unit to be convenient for small masses.
One gram (g) is one-thousandth of a kilogram.What is the estimated mass of ONE zinc nut?

2.1 Mass and weight are different We tend to use the terms mass
and weight interchangeably, but they are not the same thing.
Mass is the amount of matter in an object.
Weight is a measure of the pulling force of gravity on an object.
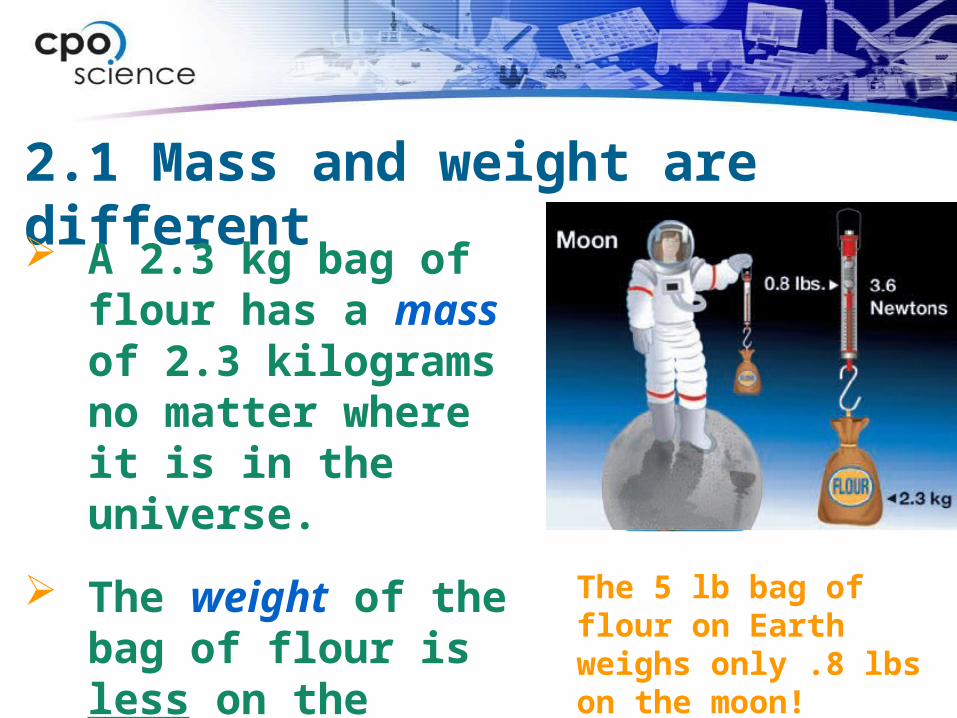
2.1 Mass and weight are different A 2.3 kg bag of
flour has a mass of 2.3 kilograms no matter where it is in the universe.
The weight of the bag of flour is less on the moon.
The 5 lb bag of flour on Earth weighs only .8 lbs on the moon!


2.1 VolumeVolume is the amount of space an
object takes up.
The fundamental unit of volume in SI is the cubic meter (m3).
More convenient smaller units are cubic centimeters (cc or cm3), liters (L) and milliliters (mL).
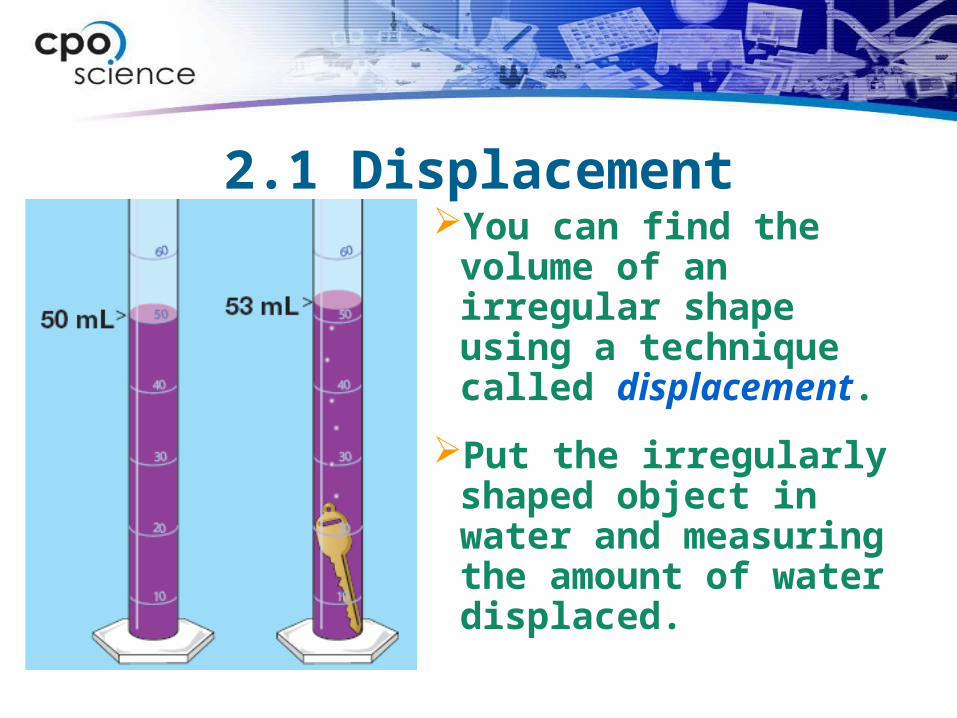
2.1 DisplacementYou can find the
volume of an irregular shape using a technique called displacement.
Put the irregularly shaped object in water and measuring the amount of water displaced.
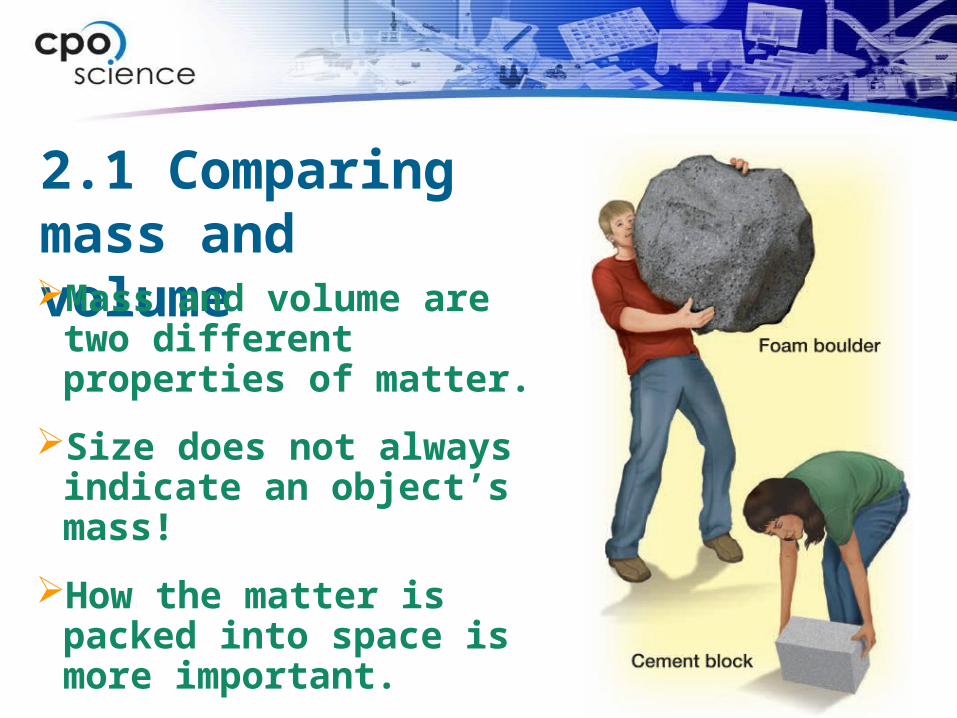
2.1 Comparing mass and volumeMass and volume are two different properties of matter.
Size does not always indicate an object’s mass!
How the matter is packed into space is more important.

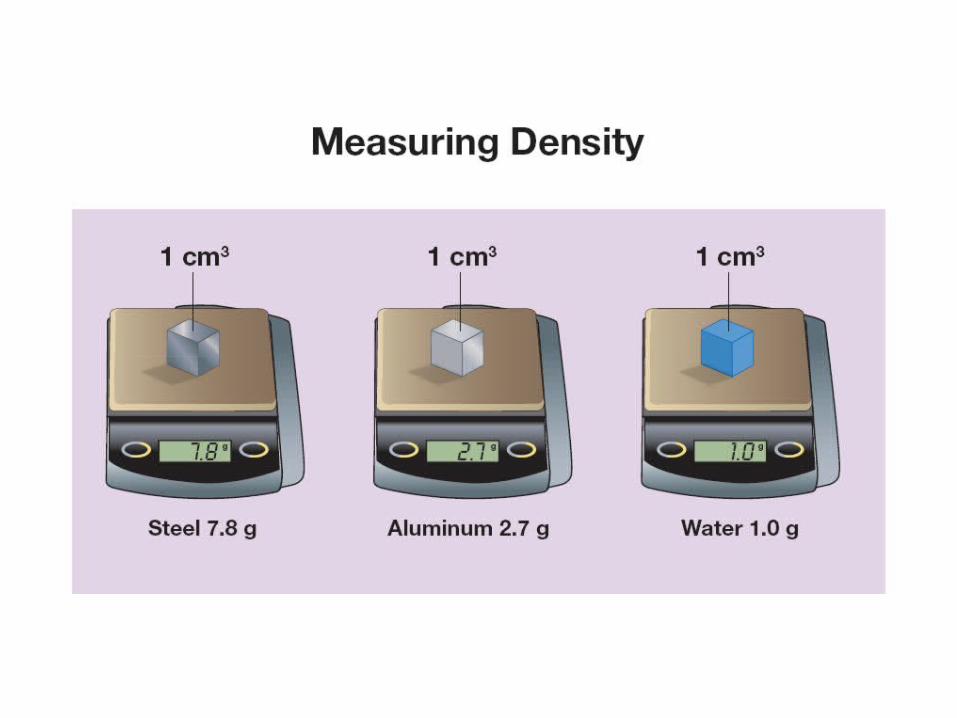
2.2 DensityDensity describes how much mass is in a given volume of a material.

2.2 DensityThe units used
for density depend on whether the substance is solid or liquid. For liquids use
units of grams per milliliter (g/mL)
For solids use density in units of g/cm3 or kg/m3.


2.2 DensityDensity changes for different
substances because:1. Atoms have different masses.2. Atoms may be “packed” tightly or
loosely.


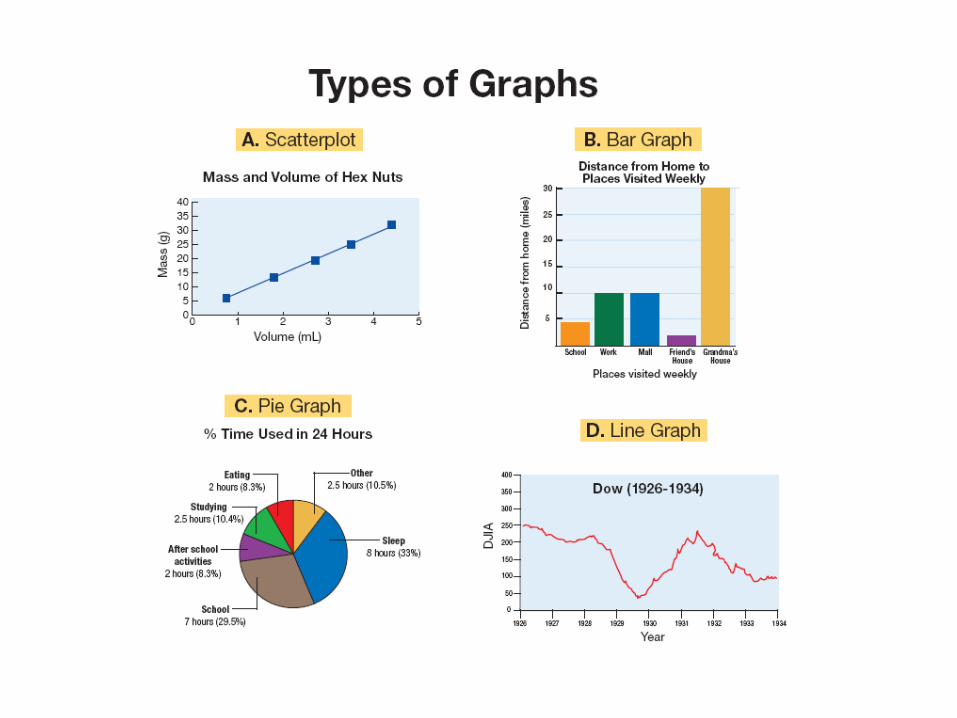
2.3 Graphing A graph is a visual way to
organize data.
A scatterplot or XY graph is used to see if two variables are related.
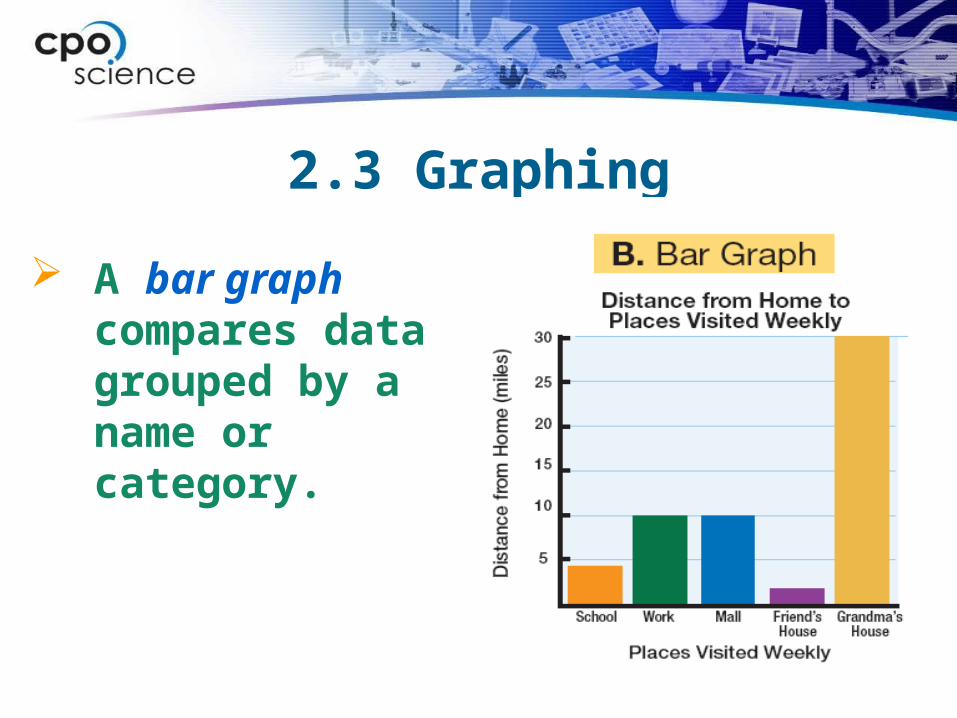
2.3 Graphing
A bar graph compares data grouped by a name or category.

2.3 Graphing A pie graph
shows the amount each part makes of up of the whole (100%).
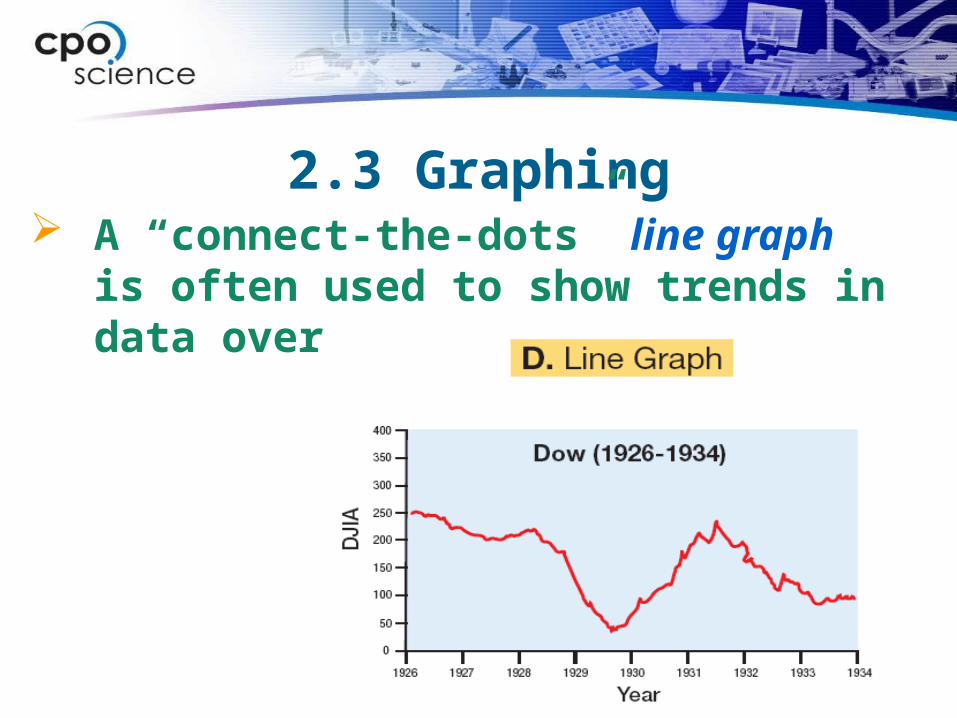
2.3 Graphing A “connect-the-dots” line graph
is often used to show trends in data over time.
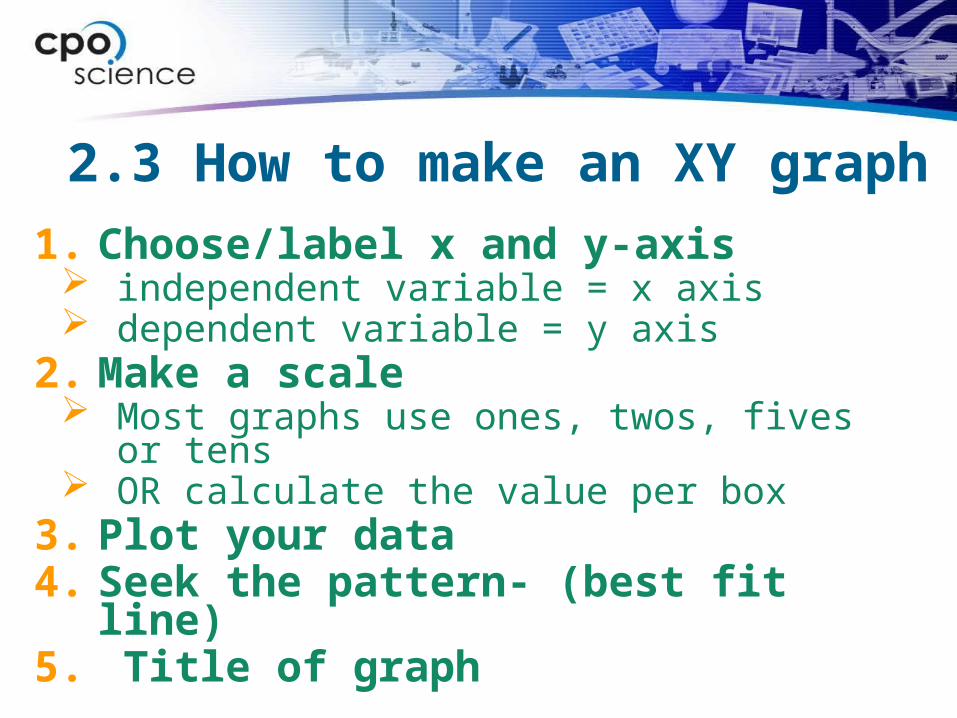
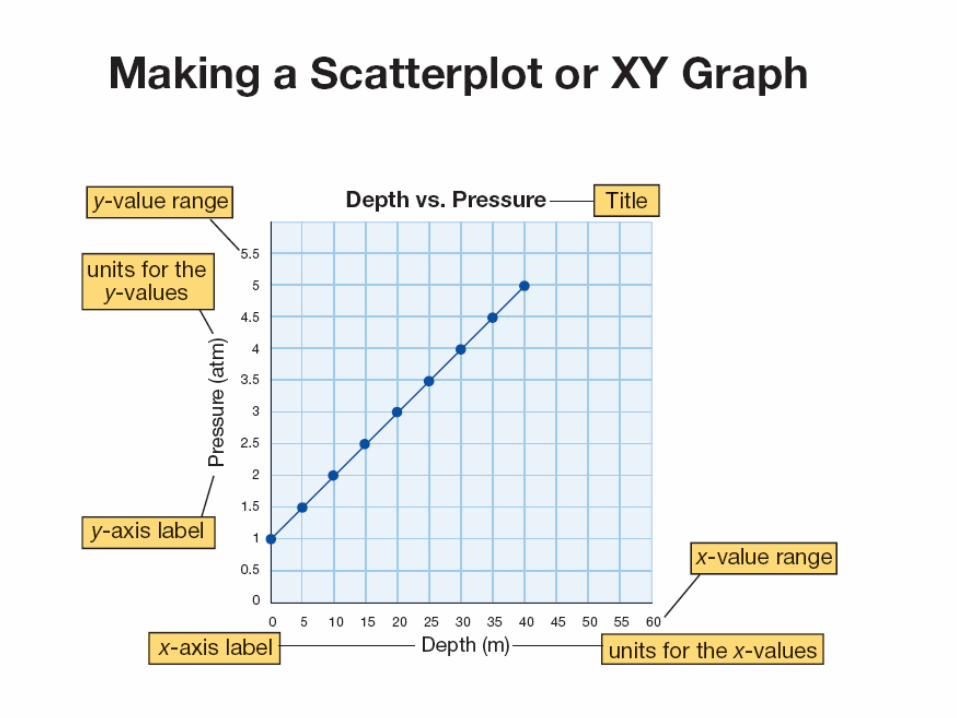
2.3 How to make an XY graph
1. Choose/label x and y-axis independent variable = x axis dependent variable = y axis
2. Make a scale Most graphs use ones, twos, fives or tens OR calculate the value per box
3. Plot your data4. Seek the pattern- (best fit line) 5. Title of graph

2.3 Identifying graph relationshipsIn a direct
relationship, when one variable increases, so does the other.The speed and distance variables show a direct relationship.

2.3 Identifying graph relationships
When there is no relationship the graph looks like a collection of dots.
No pattern appears.

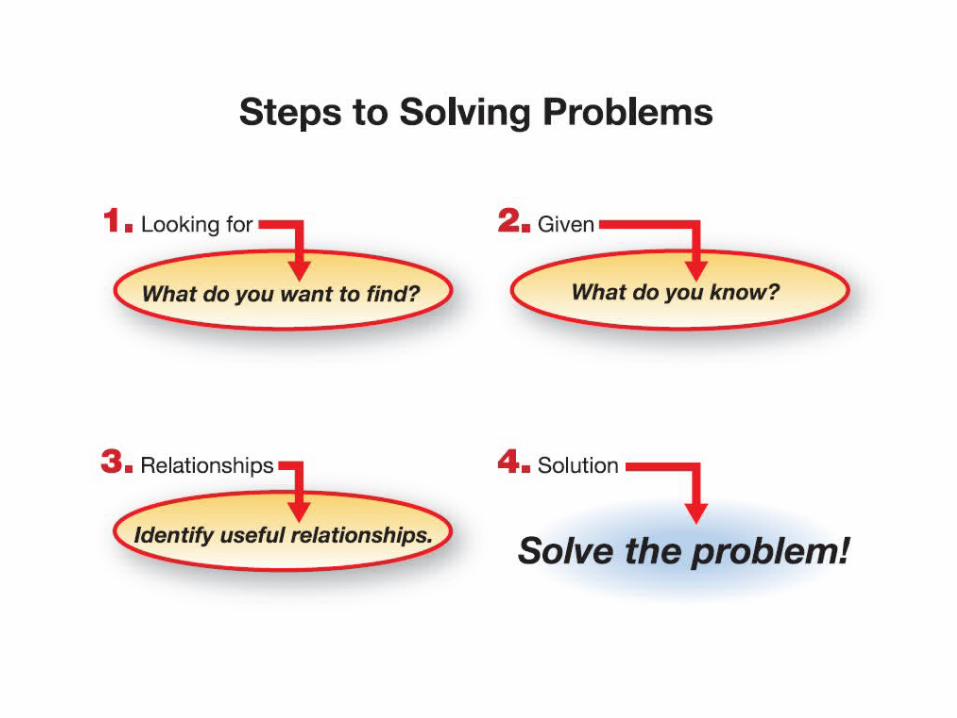

2.4 Solving Problems

Calculate marble’s volume & density
1. Looking for: volume, then density
2. Givens: mass = 6 g , water displaced 30 to 32 mL
3. Relationships: water displaced = marble volume, D =
m/V4. Solution: 32 mL – 30 mL = 2 mL D = 6 g / 2 mL
= 3 g/mL
Solving Problems

2.4 How to solve design problemsUse what you know to design a
solution that solves the problem.
Unlike “formula problems,” design problems have many correct solutions.
The solutions are only limited by your creativity, ingenuity, skill, and patience.
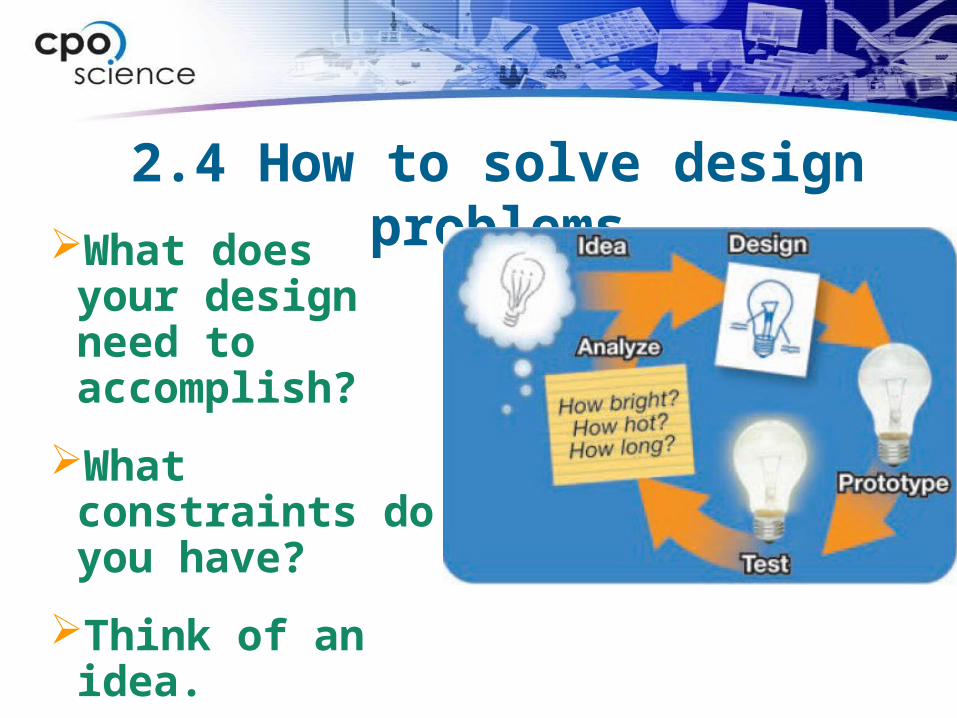
2.4 How to solve design problemsWhat does
your design need to accomplish?
What constraints do you have?
Think of an idea.
Follow the design cycle…

Density and Ocean CurrentsDid you know that there are
underwater waterfalls in the ocean? While it may seem strange for water to
fall through water, it really happens due to density differences in ocean water coming from different sources.