ULTRASONIC WAVE CHARACTERISTICS OF ARUMANIS MANGOES AND DAMAGE ARUMANIS MANGOES BY FRUIT FLY
Chapter Three
Marketing and
Processing
Investments
67
3.1 Investment in Quality Enhancement for Market
Produce
Introduction
This article explores the need for value chain finance with particular regard to enhancing the quality of food products sold in urban markets in Uganda.
We start by describing some of the major supply food chains, namely for some important staple foods, fresh fruits and vegetables, livestock and fish. We then describe some challenges and constraints that affect the quality of the food products as they move along the supply chains. We briefly bring organic farming in the context of improving quality, and finally we make some recommendations for providers of finance for financing these supply chains with respect to maintaining quality, enhancing shelf life, and adding value.
Supply Food Chains For Market Produce Sold In Urban Areas
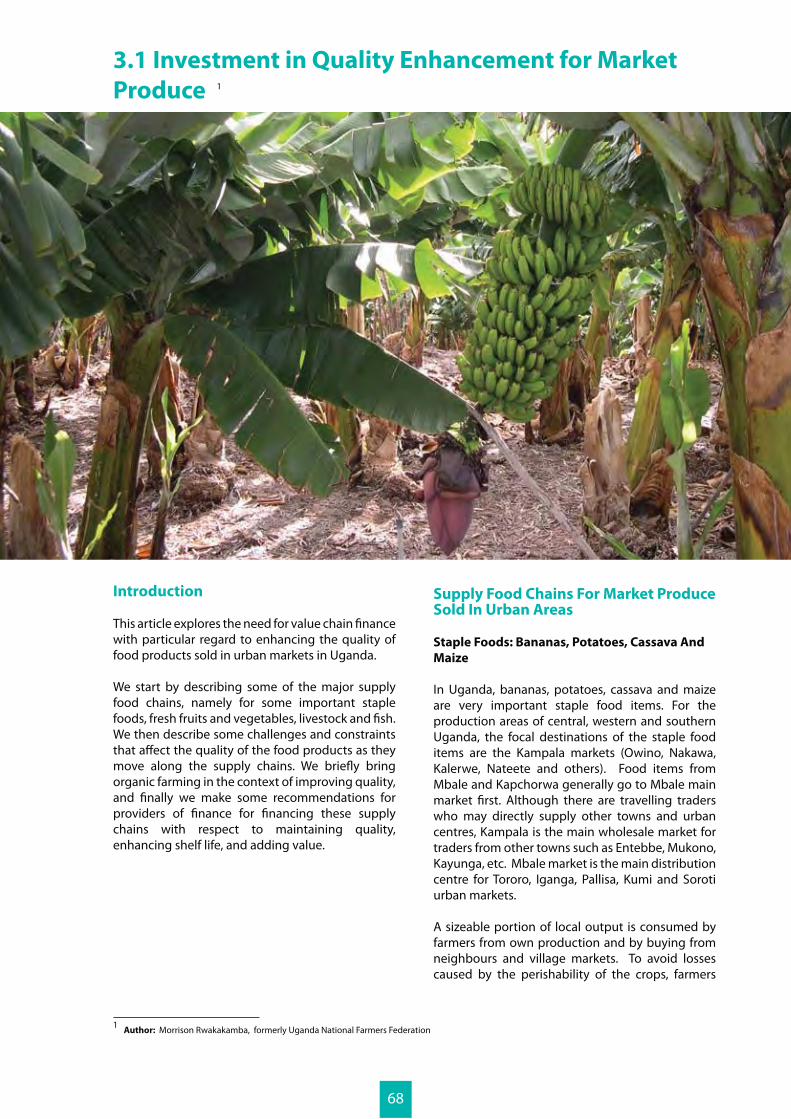
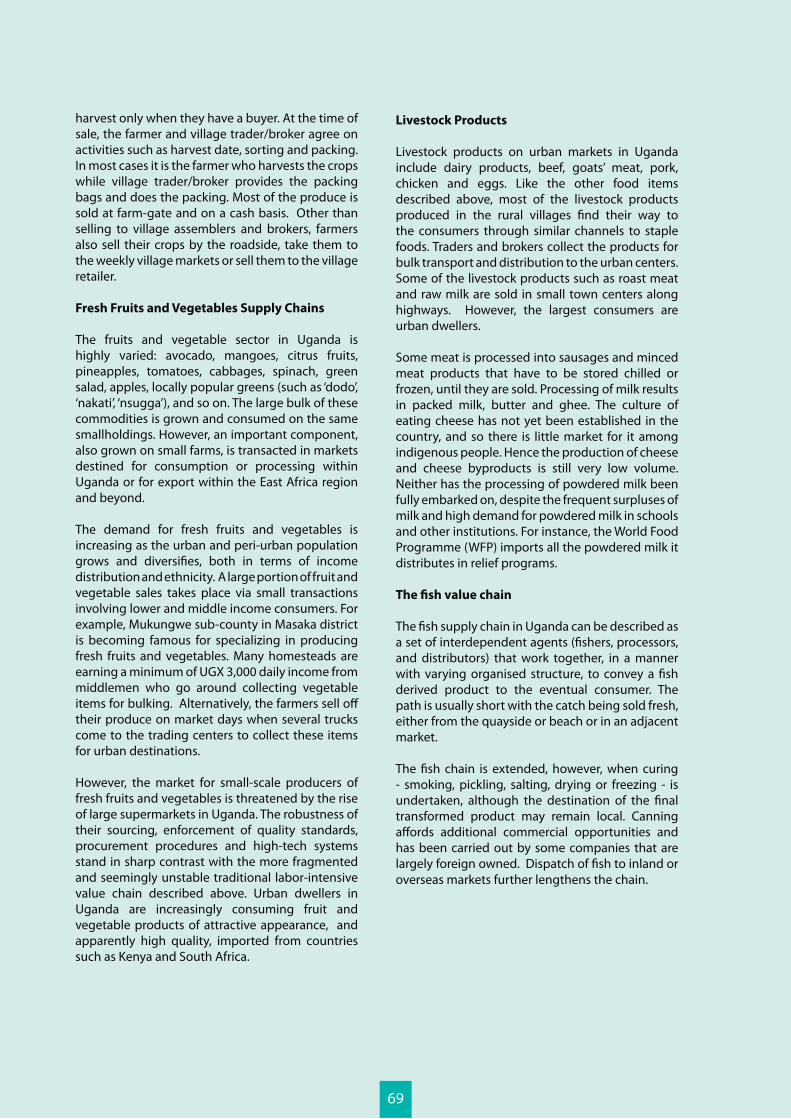
Staple Foods: Bananas, Potatoes, Cassava And
Maize
In Uganda, bananas, potatoes, cassava and maize are very important staple food items. For the production areas of central, western and southern Uganda, the focal destinations of the staple food items are the Kampala markets (Owino, Nakawa, Kalerwe, Nateete and others). Food items from Mbale and Kapchorwa generally go to Mbale main market first. Although there are travelling traders who may directly supply other towns and urban centres, Kampala is the main wholesale market for traders from other towns such as Entebbe, Mukono, Kayunga, etc. Mbale market is the main distribution centre for Tororo, Iganga, Pallisa, Kumi and Soroti urban markets.
A sizeable portion of local output is consumed by farmers from own production and by buying from neighbours and village markets. To avoid losses caused by the perishability of the crops, farmers
1 Author: Morrison Rwakakamba, formerly Uganda National Farmers Federation
1
68
harvest only when they have a buyer. At the time of sale, the farmer and village trader/broker agree on activities such as harvest date, sorting and packing. In most cases it is the farmer who harvests the crops while village trader/broker provides the packing bags and does the packing. Most of the produce is sold at farm-gate and on a cash basis. Other than selling to village assemblers and brokers, farmers also sell their crops by the roadside, take them to the weekly village markets or sell them to the village retailer.
Fresh Fruits and Vegetables Supply Chains
The fruits and vegetable sector in Uganda is highly varied: avocado, mangoes, citrus fruits, pineapples, tomatoes, cabbages, spinach, green salad, apples, locally popular greens (such as ‘dodo’, ‘nakati’, ‘nsugga’), and so on. The large bulk of these commodities is grown and consumed on the same smallholdings. However, an important component, also grown on small farms, is transacted in markets destined for consumption or processing within Uganda or for export within the East Africa region and beyond.
The demand for fresh fruits and vegetables is increasing as the urban and peri-urban population grows and diversifies, both in terms of income distribution and ethnicity. A large portion of fruit and vegetable sales takes place via small transactions involving lower and middle income consumers. For example, Mukungwe sub-county in Masaka district is becoming famous for specializing in producing fresh fruits and vegetables. Many homesteads are earning a minimum of UGX 3,000 daily income from middlemen who go around collecting vegetable items for bulking. Alternatively, the farmers sell off their produce on market days when several trucks come to the trading centers to collect these items for urban destinations.
However, the market for small-scale producers of fresh fruits and vegetables is threatened by the rise of large supermarkets in Uganda. The robustness of their sourcing, enforcement of quality standards, procurement procedures and high-tech systems stand in sharp contrast with the more fragmented and seemingly unstable traditional labor-intensive value chain described above. Urban dwellers in Uganda are increasingly consuming fruit and vegetable products of attractive appearance, and apparently high quality, imported from countries such as Kenya and South Africa.
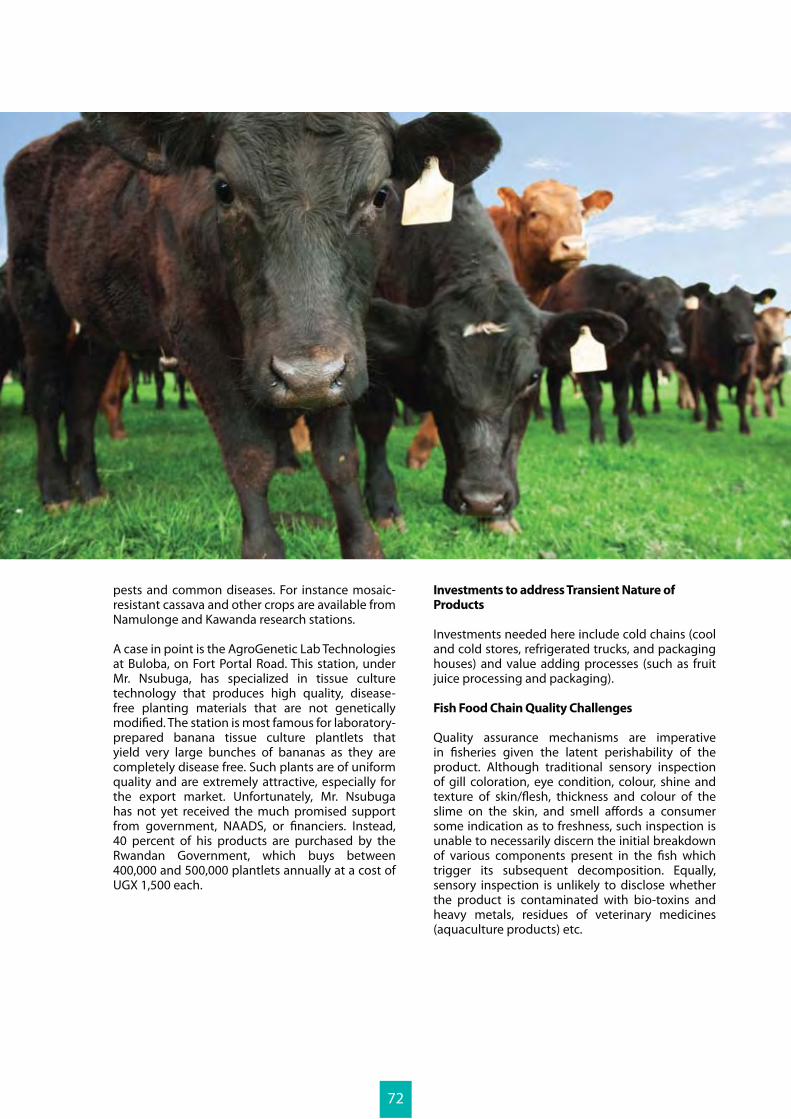
Livestock Products
Livestock products on urban markets in Uganda include dairy products, beef, goats’ meat, pork, chicken and eggs. Like the other food items described above, most of the livestock products produced in the rural villages find their way to the consumers through similar channels to staple foods. Traders and brokers collect the products for bulk transport and distribution to the urban centers. Some of the livestock products such as roast meat and raw milk are sold in small town centers along highways. However, the largest consumers are urban dwellers.
Some meat is processed into sausages and minced meat products that have to be stored chilled or frozen, until they are sold. Processing of milk results in packed milk, butter and ghee. The culture of eating cheese has not yet been established in the country, and so there is little market for it among indigenous people. Hence the production of cheese and cheese byproducts is still very low volume. Neither has the processing of powdered milk been fully embarked on, despite the frequent surpluses of milk and high demand for powdered milk in schools and other institutions. For instance, the World Food Programme (WFP) imports all the powdered milk it distributes in relief programs.
The fish value chain
The fish supply chain in Uganda can be described as a set of interdependent agents (fishers, processors, and distributors) that work together, in a manner with varying organised structure, to convey a fish derived product to the eventual consumer. The path is usually short with the catch being sold fresh, either from the quayside or beach or in an adjacent market.
The fish chain is extended, however, when curing - smoking, pickling, salting, drying or freezing - is undertaken, although the destination of the final transformed product may remain local. Canning affords additional commercial opportunities and has been carried out by some companies that are largely foreign owned. Dispatch of fish to inland or overseas markets further lengthens the chain.
69
Challenges In Enhancing Quality In Food Supply Chains In Uganda For
Urban Consumption
There are a number of cross-cutting issues that affect food supply chains in Uganda. The factors mentioned below need to be considered in value chain financing for enhancing quality:
Small-scale production: Most of the production takes place on a small scale, e.g. 3-4 acres of crops (or less in peri-urban areas), less than 20 heads of cattle for most farmers (3 or 4 heads of cattle in case of zero-grazing), less than 2,000 birds reared by most poultry farmers, etc. The small scale of production implies that individual farmers cannot easily access wide markets, improved inputs or technologies for improving yields and quality.
Seasonality and Uncertainty of Production: Crops are highly dependent on the seasonality and reliability of the rainy seasons. Dairy production drops down during dry seasons due to scarcity of water. Beef production on the other hand increases during the dry seasons when farmers are forced to sell off their animals cheaply due to lack of feed and water.
Lack of awareness and implementation of health standards: Most producers, traders and consumers in Uganda are not aware of the consumer health standards required of food products. Implementation of these standards is beyond the immediate concern of the key actors in the food chains for urban consumers; this will need addressing if produce is to attract supermarket produce buyers.
Crop and livestock thefts: many rural farmers are discouraged from farming because what they produce is easily stolen. The thieves frequently come from distant areas and are usually hard to identify and deal with. The farmers lack the resources to protect their produce. To avoid the thefts, the farmers are forced to sell off their produce pre-maturely and hence at a lower quality and at lower prices.
Weeds, pests, animal and crop diseases: Despite the fact that Uganda is the second largest producer of bananas in the world, producing over 8.6 million tonnes per annum, (30% of the world’s production), unprecedented diseases like the banana bacterial wilt and the black sigatoka disease have been threatening the banana industry for the past five years.
70

Similarly, mosaic and other diseases have been threatening cassava production. Maize and potato production have also been affected by pests and diseases. Replanting with disease-resistant varieties, as these become available, requires investment.
Perishable nature of many food products: Virtually all the food products need to be consumed or processed as soon as they leave the farm, else they will deteriorate very quickly. Coolers are needed to extend the life of milk, meat, vegetables, fish, etc. Some losses have been incurred by farmers and traders when green bananas go ripe, harvested maize is eaten up by pests and moulds, poorly stored eggs go bad, etc.
Domestic vs. international chains: The supply chains generally comprise two separate chains serving two distinct sectors: international and domestic. There is little crossover between the two in terms of service providers and asset usage such as warehouses. Unlike the international chain counterparts, the domestic chains are characterized by low levels of investment, high transaction costs, poor integration, poor technologies, weak vertical linkages, poor organization, high risks and low profit margins. There is little learning and information sharing between corresponding domestic and international chains.
In general, only very modest benefits are reaped by producers attempting to improve quality for the urban markets in Uganda. The average consumer here is more conscious of price than quality. For instance, mature chicken broilers aged above 4 months and selling over UGX 25,000 each at farm gate price have very limited markets (festival seasons, ceremonies and a few luxury hotels). Instead, most farmers find it more profitable to sell off immature birds 5-6 weeks old because there is significant demand from consumers who are willing to buy and eat less mature chicks of lower quality, paying a lower price than would be the case for a higher quality bird. Some producers resort to various procedures to make the chicks grow fast, including treating them with growth hormones and extra vitamins. This alone bars the chicks from some export markets, where returns could be more attractive.
Investing In Quality Enhancing Techniques
With respect to the challenges and constraints identified above, the approaches and investments described below could play a key role in maintaining and enhancing quality along the supply chains of foodstuffs consumed by urban dwellers in Uganda:
Investments to Address Small-Scale Production Constraints
Increasing finance towards start-up activities among the rural poor could greatly increase the scale of production of the various food commodities. The on-farm investments possible here are many and varied, including: inputs such as seeds, walking tractors, pesticides, drugs for livestock etc. In addition, off-farm (i.e. public sector / donor) assistance is needed in the form of more solid field extension work to ensure increased productivity. Their organizational capacities also need to be enhanced to ensure that farmer groups are formalized, effective and sustainable. Such strengths would enable the farmers to access wider markets, negotiate better terms with traders, and maintain quality of produce for greater competitiveness.
Investments to address Seasonality and Unreliability of Production
The key factor here is rainfall. Overcoming the problems of seasonality and unreliability of rainfall would enable producers to plan production and hence even out shortages and excesses that lead to quality deterioration2. In addition, farmers’ groups need to be strengthened so that they can provide adequate storage facilities for the various products of their members. Such storage facilities would also even out fluctuations in produce entering the market..
Increasing Awareness and Implementation of Food Health Standards
Educating the farmers and general public about food health standards is required to create more sensitivity towards quality. Again, this is a public sector responsibility, but can also convey direct benefits, apart from healthier food entering the supply chain. As noted above, investments in this area can also open up access to markets where these considerations are important – for example, supermarkets.
Investments to address Crop and Animal Thefts
This is more a matter for community action, than investment per se, though some growers have invested in fences to delineate their gardens and so discourage theft.
Investments to address Weeds, Pests, Animal and Crop Diseases
Here lies an opportunity for financing investments in provision of herbicides, pesticides, animal vaccines and drugs. Research also needs to be supported. There are already many varieties of improved materials that are resistant to weeds,
2 Editors’ Note: See Article 2.3 Irrigation, in this edition of the Yearbook.
71
pests and common diseases. For instance mosaic-resistant cassava and other crops are available from Namulonge and Kawanda research stations.
A case in point is the AgroGenetic Lab Technologies at Buloba, on Fort Portal Road. This station, under Mr. Nsubuga, has specialized in tissue culture technology that produces high quality, disease-free planting materials that are not genetically modified. The station is most famous for laboratory- prepared banana tissue culture plantlets that yield very large bunches of bananas as they are completely disease free. Such plants are of uniform quality and are extremely attractive, especially for the export market. Unfortunately, Mr. Nsubuga has not yet received the much promised support from government, NAADS, or financiers. Instead, 40 percent of his products are purchased by the Rwandan Government, which buys between 400,000 and 500,000 plantlets annually at a cost of UGX 1,500 each.
Investments to address Transient Nature of Products
Investments needed here include cold chains (cool and cold stores, refrigerated trucks, and packaging houses) and value adding processes (such as fruit juice processing and packaging). Fish Food Chain Quality Challenges
Quality assurance mechanisms are imperative in fisheries given the latent perishability of the product. Although traditional sensory inspection of gill coloration, eye condition, colour, shine and texture of skin/flesh, thickness and colour of the slime on the skin, and smell affords a consumer some indication as to freshness, such inspection is unable to necessarily discern the initial breakdown of various components present in the fish which trigger its subsequent decomposition. Equally, sensory inspection is unlikely to disclose whether the product is contaminated with bio-toxins and heavy metals, residues of veterinary medicines (aquaculture products) etc.
72
Implications For The Financial Sector
To mitigate the constraints and achieve the foregoing actions, banks must open up to the farming sector, despite its perceived risks. As a big employer (70 percent of the citizenry), agriculture presents an opportunity for dramatically transforming the country if the necessary investments and capital are directed to improving productivity, commercialization and competitiveness. Financial investment areas could include the following:
agro-processing businesses
chains
farmers and for investment in infrastructure, especially community access roads and irrigation schemes
In addition, public sector support could be directed to investments in areas such as:
seeds and machinery
dynamics
putting in place venture capital to operationalise innovations and viable agribusiness ventures
73
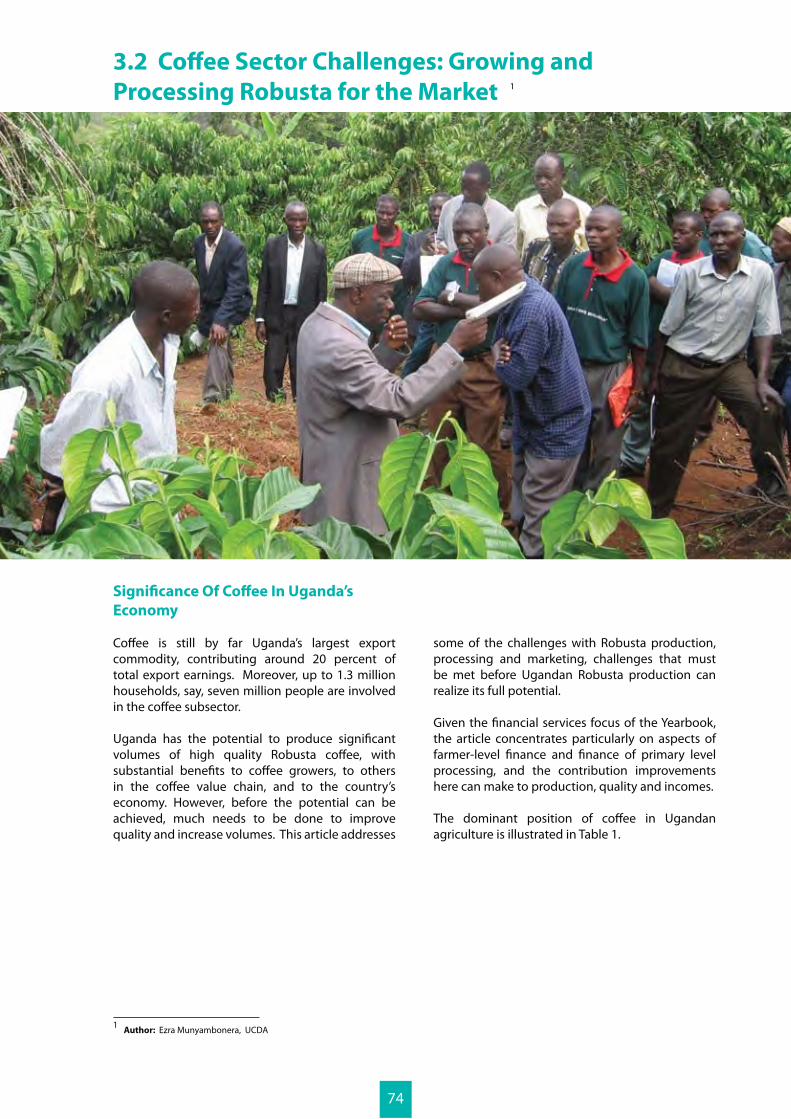
Significance Of Coffee In Uganda’s
Economy
Coffee is still by far Uganda’s largest export commodity, contributing around 20 percent of total export earnings. Moreover, up to 1.3 million households, say, seven million people are involved in the coffee subsector.
Uganda has the potential to produce significant volumes of high quality Robusta coffee, with substantial benefits to coffee growers, to others in the coffee value chain, and to the country’s economy. However, before the potential can be achieved, much needs to be done to improve quality and increase volumes. This article addresses
some of the challenges with Robusta production, processing and marketing, challenges that must be met before Ugandan Robusta production can realize its full potential.
Given the financial services focus of the Yearbook, the article concentrates particularly on aspects of farmer-level finance and finance of primary level processing, and the contribution improvements here can make to production, quality and incomes.
The dominant position of coffee in Ugandan agriculture is illustrated in Table 1.
3.2 Coffee Sector Challenges: Growing and
Processing Robusta for the Market
1 Author: Ezra Munyambonera, UCDA
1
74
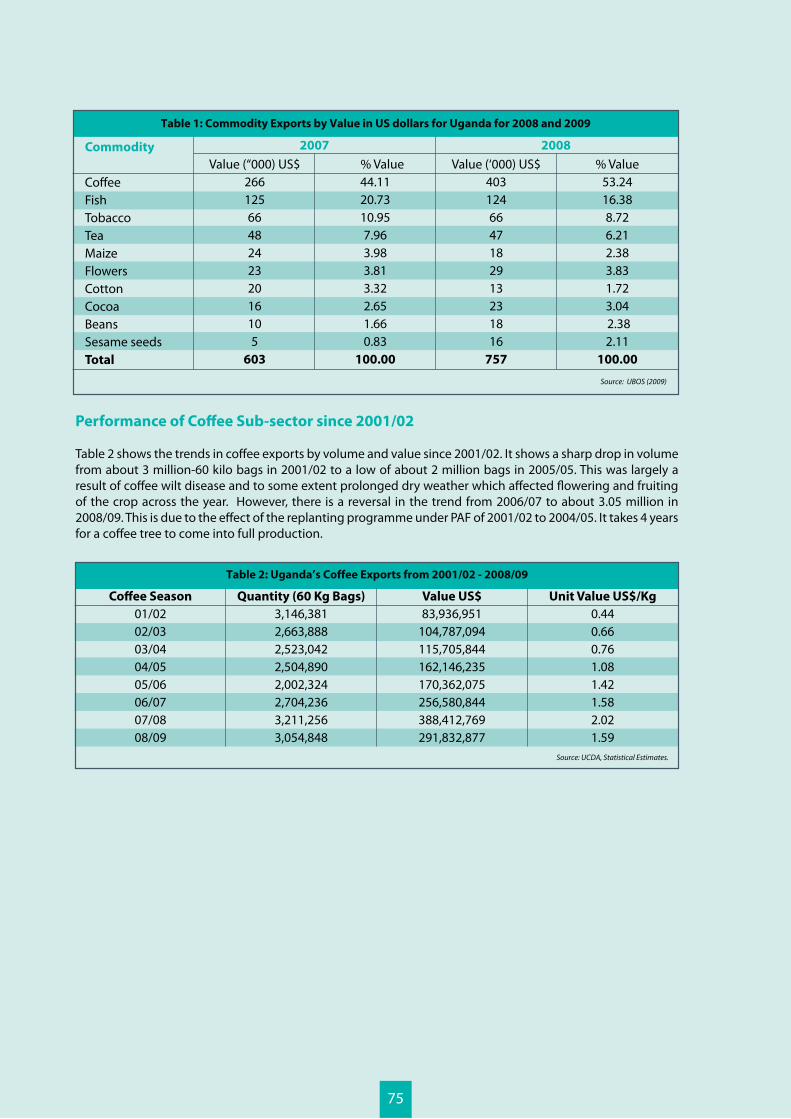
Performance of Coffee Sub-sector since 2001/02
Table 2 shows the trends in coffee exports by volume and value since 2001/02. It shows a sharp drop in volume from about 3 million-60 kilo bags in 2001/02 to a low of about 2 million bags in 2005/05. This was largely a result of coffee wilt disease and to some extent prolonged dry weather which affected flowering and fruiting of the crop across the year. However, there is a reversal in the trend from 2006/07 to about 3.05 million in 2008/09. This is due to the effect of the replanting programme under PAF of 2001/02 to 2004/05. It takes 4 years for a coffee tree to come into full production.
Table 1: Commodity Exports by Value in US dollars for Uganda for 2008 and 2009
2007 2008
Source: UBOS (2009)
Commodity
CoffeeFishTobaccoTeaMaizeFlowersCottonCocoaBeansSesame seedsTotal
Value (“000) US$266125664824232016105
603
% Value44.1120.7310.957.963.983.813.322.651.660.83
100.00
Value (‘000) US$4031246647182913231816
757
% Value53.24 16.38 8.72 6.21 2.38 3.83 1.72 3.04 2.38 2.11
100.00
Table 2: Uganda’s Coffee Exports from 2001/02 - 2008/09
Coffee Season
01/0202/0303/0404/0505/0606/07 07/08 08/09
Quantity (60 Kg Bags)
3,146,3812,663,8882,523,0422,504,890 2,002,324 2,704,2363,211,2563,054,848
Value US$
83,936,951104,787,094115,705,844162,146,235170,362,075256,580,844388,412,769291,832,877
Unit Value US$/Kg
0.440.660.761.081.421.582.021.59
Source: UCDA, Statistical Estimates.
75
Coffee Value Chain Description – Post
Liberalization
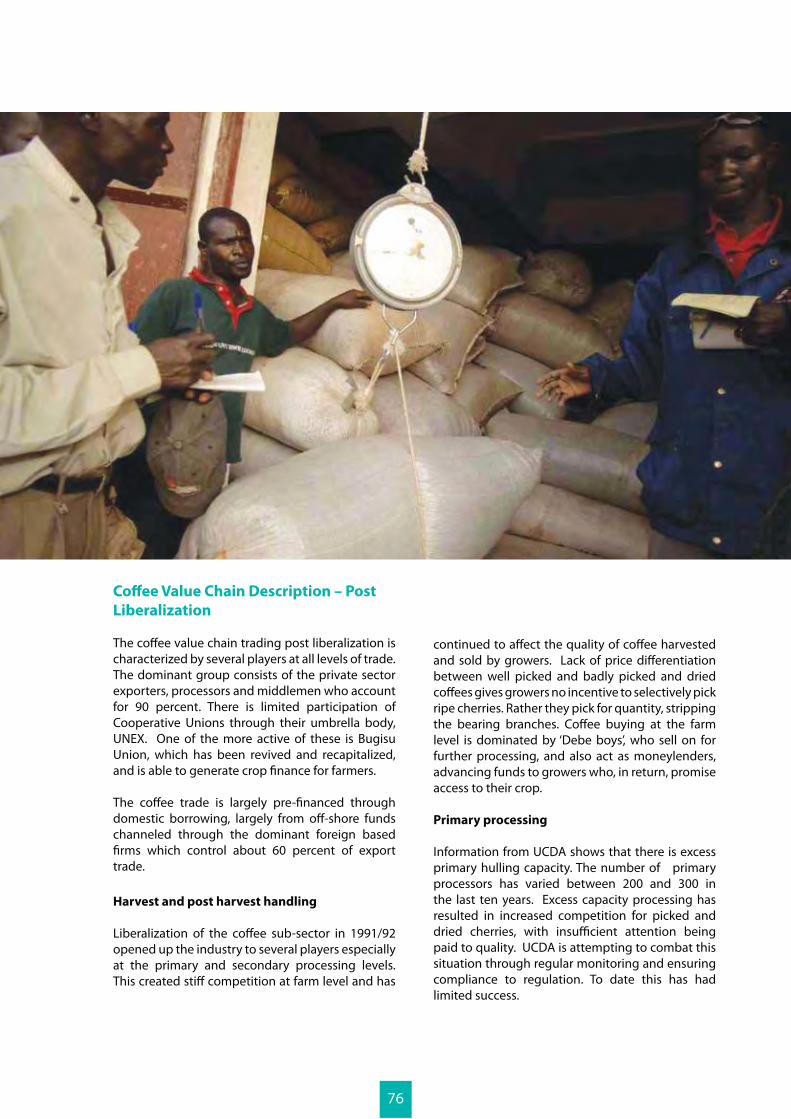
The coffee value chain trading post liberalization is characterized by several players at all levels of trade. The dominant group consists of the private sector exporters, processors and middlemen who account for 90 percent. There is limited participation of Cooperative Unions through their umbrella body, UNEX. One of the more active of these is Bugisu Union, which has been revived and recapitalized, and is able to generate crop finance for farmers. The coffee trade is largely pre-financed through domestic borrowing, largely from off-shore funds channeled through the dominant foreign based firms which control about 60 percent of export trade.
Harvest and post harvest handling
Liberalization of the coffee sub-sector in 1991/92 opened up the industry to several players especially at the primary and secondary processing levels. This created stiff competition at farm level and has
continued to affect the quality of coffee harvested and sold by growers. Lack of price differentiation between well picked and badly picked and dried coffees gives growers no incentive to selectively pick ripe cherries. Rather they pick for quantity, stripping the bearing branches. Coffee buying at the farm level is dominated by ‘Debe boys’, who sell on for further processing, and also act as moneylenders, advancing funds to growers who, in return, promise access to their crop.
Primary processing
Information from UCDA shows that there is excess primary hulling capacity. The number of primary processors has varied between 200 and 300 in the last ten years. Excess capacity processing has resulted in increased competition for picked and dried cherries, with insufficient attention being paid to quality. UCDA is attempting to combat this situation through regular monitoring and ensuring compliance to regulation. To date this has had limited success.
76
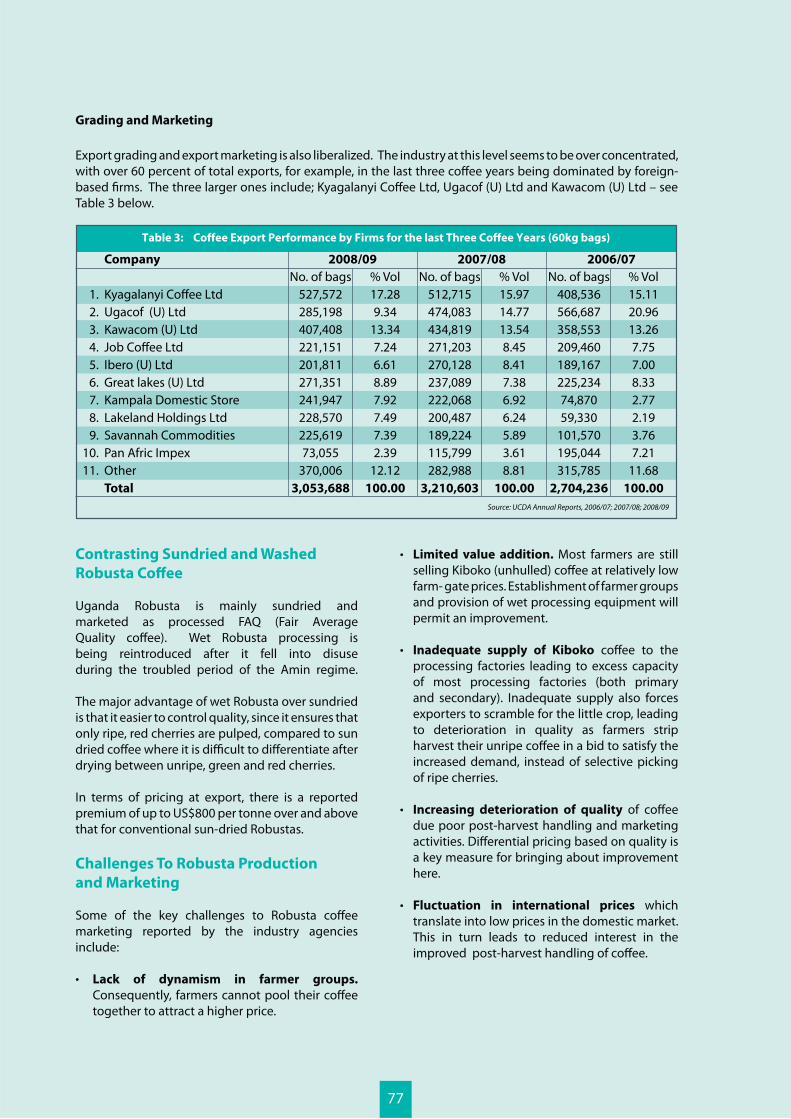
Grading and Marketing
Export grading and export marketing is also liberalized. The industry at this level seems to be over concentrated, with over 60 percent of total exports, for example, in the last three coffee years being dominated by foreign- based firms. The three larger ones include; Kyagalanyi Coffee Ltd, Ugacof (U) Ltd and Kawacom (U) Ltd – see Table 3 below.
Table 3: Coffee Export Performance by Firms for the last Three Coffee Years (60kg bags)
Company
Kyagalanyi Coffee LtdUgacof (U) LtdKawacom (U) LtdJob Coffee LtdIbero (U) LtdGreat lakes (U) LtdKampala Domestic StoreLakeland Holdings LtdSavannah CommoditiesPan Afric ImpexOtherTotal
No. of bags527,572285,198407,408221,151201,811271,351241,947228,570225,61973,055
370,0063,053,688
1.2.3.4.5.6.7.8.9.
10.11.
Source: UCDA Annual Reports, 2006/07; 2007/08; 2008/09
% Vol17.289.34
13.347.246.618.897.927.497.392.39
12.12100.00
No. of bags512,715474,083434,819271,203270,128237,089222,068200,487189,224115,799282,988
3,210,603
% Vol15.9714.7713.548.458.417.386.926.245.893.618.81
100.00
No. of bags408,536566,687358,553209,460189,167225,23474,87059,330
101,570195,044315,785
2,704,236
% Vol15.1120.9613.267.757.008.332.772.193.767.21
11.68100.00
2008/09 2007/08 2006/07
Limited value addition. Most farmers are still selling Kiboko (unhulled) coffee at relatively low farm- gate prices. Establishment of farmer groups and provision of wet processing equipment will permit an improvement.
Inadequate supply of Kiboko coffee to the processing factories leading to excess capacity of most processing factories (both primary and secondary). Inadequate supply also forces exporters to scramble for the little crop, leading to deterioration in quality as farmers strip harvest their unripe coffee in a bid to satisfy the increased demand, instead of selective picking of ripe cherries.
Increasing deterioration of quality of coffee due poor post-harvest handling and marketing activities. Differential pricing based on quality is a key measure for bringing about improvement here.
Fluctuation in international prices which translate into low prices in the domestic market. This in turn leads to reduced interest in the improved post-harvest handling of coffee.
Contrasting Sundried and Washed
Robusta Coffee
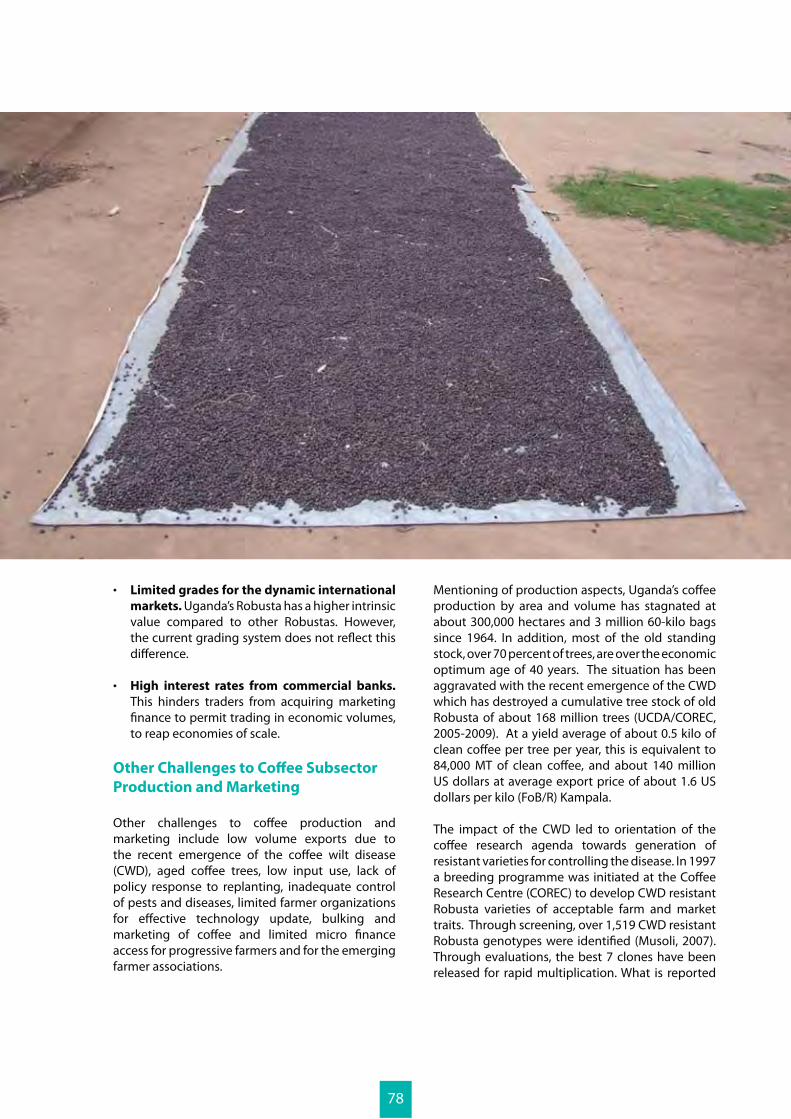
Uganda Robusta is mainly sundried and marketed as processed FAQ (Fair Average Quality coffee). Wet Robusta processing is being reintroduced after it fell into disuse during the troubled period of the Amin regime.
The major advantage of wet Robusta over sundried is that it easier to control quality, since it ensures that only ripe, red cherries are pulped, compared to sun dried coffee where it is difficult to differentiate after drying between unripe, green and red cherries. In terms of pricing at export, there is a reported premium of up to US$800 per tonne over and above that for conventional sun-dried Robustas.
Challenges To Robusta Production
and Marketing
Some of the key challenges to Robusta coffee marketing reported by the industry agencies include:
Lack of dynamism in farmer groups. Consequently, farmers cannot pool their coffee together to attract a higher price.
77
Limited grades for the dynamic international
markets. Uganda’s Robusta has a higher intrinsic value compared to other Robustas. However, the current grading system does not reflect this difference.
High interest rates from commercial banks.
This hinders traders from acquiring marketing finance to permit trading in economic volumes, to reap economies of scale.
Other Challenges to Coffee Subsector
Production and Marketing
Other challenges to coffee production and marketing include low volume exports due to the recent emergence of the coffee wilt disease (CWD), aged coffee trees, low input use, lack of policy response to replanting, inadequate control of pests and diseases, limited farmer organizations for effective technology update, bulking and marketing of coffee and limited micro finance access for progressive farmers and for the emerging farmer associations.
Mentioning of production aspects, Uganda’s coffee production by area and volume has stagnated at about 300,000 hectares and 3 million 60-kilo bags since 1964. In addition, most of the old standing stock, over 70 percent of trees, are over the economic optimum age of 40 years. The situation has been aggravated with the recent emergence of the CWD which has destroyed a cumulative tree stock of old Robusta of about 168 million trees (UCDA/COREC, 2005-2009). At a yield average of about 0.5 kilo of clean coffee per tree per year, this is equivalent to 84,000 MT of clean coffee, and about 140 million US dollars at average export price of about 1.6 US dollars per kilo (FoB/R) Kampala.
The impact of the CWD led to orientation of the coffee research agenda towards generation of resistant varieties for controlling the disease. In 1997 a breeding programme was initiated at the Coffee Research Centre (COREC) to develop CWD resistant Robusta varieties of acceptable farm and market traits. Through screening, over 1,519 CWD resistant Robusta genotypes were identified (Musoli, 2007). Through evaluations, the best 7 clones have been released for rapid multiplication. What is reported
78
by COREC as a challenge is adequate financing for generating sufficient mother stock for farmers and private sector to get access for further propagation. Support in this area is required for future sustainability of Robusta production for Uganda.
Pricing and marketing limitation to quality
improvement at farm level
The solution to the quality problem at farm level – noted above – is not only differential pricing for quality, but also organization of farmers into producer based groups where coffee can be bulked, processed and marketed. Notable examples include the KCA project farmers in Mubende/Mityana, the NUCAFE Association in Masaka and Mpigi, Ankole Growers Association etc. These have demonstrated that it is possible to bulk, process and market coffee as a group. There is evidence of income gains of about UGX. 300 to 400 per kilo of FAQ equivalent.
Increasing The Volume Of Washed
Robusta In the 1960s and 70s, Ugandan Robusta coffee was processed mainly by Indian-owned firms. The proportion of wet Uganda Robusta was about 20 percent. In an attempt to revive wet Robusta processing in Uganda, the Government through UCDA initiated a wet Robusta processing project in 2002. As a result, 16 units of machinery were procured through Government funding.
UCDA field evaluations show that performance is below the expectations. Out of the 16 sets of equipment purchased, only five are installed and operational. Others apparently lack the capital for installation. It is likely that the failure of this project could be the reliance on the wrong target operators – something that could have been avoided had an adequate pre-feasibility assessment been carried out.
Constraints to wet processing of Robusta coffee observed include limited crop finance for wet cherry, together with the difficulty of organizing the delivery of newly-picked cherries, within a few hours (as is required) to the wet processing plant.
Levels of investments and organizational
arrangements
The pilot project, mentioned above, invested in sets of washing machinery and equipment each costing about UGX 100m, with an average capacity of 3.5 MT per hour. Clearly this large investment is more relevant for estate production than for smallholder groups.
On a smaller scale to that mentioned above, equipment that would permit a throughput of 0.5 – 1 tonne per hour would cost in the region of UGX 40m The recent intervention in Bugisu region by exporters in enabling farmers to establish medium-sized wet processing infrastructure on a recovery basis (UCTF, 2009), confirms that this is possible.
Example: The NKG Coffee Alliance And
Kaweri Coffee Farmers Alliance Support
Project
The Neumann Kaffee Group is a German coffee producer and wholesaler that operates internationally - in South America, Africa and Asia. In 2005 NKG initiated coffee estate establishment in Mubende. In order to increase throughput for their processing plant, they initiated a farmer-based project in 2005, called Kaweri Coffee Farmer Alliance Support Project (KCFASP) with EU funding. This followed the NKG interest in establishment of the large scale coffee estate in 2000. The aim of the Kaweri alliance project was to create a farmer-driven extension system among outgrower farmers with a view of supplementing the volume potential of the Kaweri Estate in Buwekula in the long run. In the event the onset of CWD prevented processing of outgrowers’ coffee on the Kaweri Estate, but technical assistance continues.
To date, on the estate, about 2,000 ha of clonal coffee has been established, employing over 700 workers. Services of technical extension for nursery development in the surrounding communities has been provided. Also services like water provision, health care and training of mid- level technicians and extension workers has been rendered by the Kaweri Estate. The NKG Coffee Alliance Support Project is therefore an affiliate to Kaweri Coffee Estate. The initial target area was Mubende but it was later extended to cover Mityana, as Mityana seemed to have more farmers and more young coffee.
79
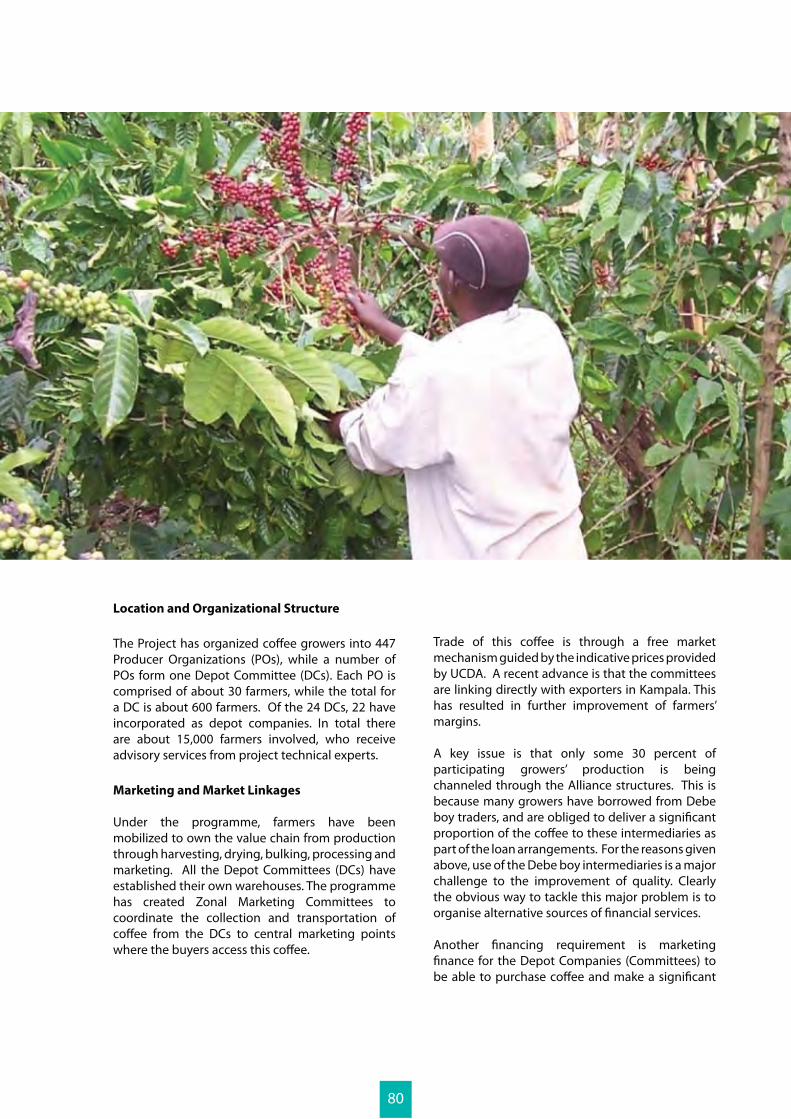
Location and Organizational Structure
The Project has organized coffee growers into 447 Producer Organizations (POs), while a number of POs form one Depot Committee (DCs). Each PO is comprised of about 30 farmers, while the total for a DC is about 600 farmers. Of the 24 DCs, 22 have incorporated as depot companies. In total there are about 15,000 farmers involved, who receive advisory services from project technical experts.
Marketing and Market Linkages
Under the programme, farmers have been mobilized to own the value chain from production through harvesting, drying, bulking, processing and marketing. All the Depot Committees (DCs) have established their own warehouses. The programme has created Zonal Marketing Committees to coordinate the collection and transportation of coffee from the DCs to central marketing points where the buyers access this coffee.
Trade of this coffee is through a free market mechanism guided by the indicative prices provided by UCDA. A recent advance is that the committees are linking directly with exporters in Kampala. This has resulted in further improvement of farmers’ margins.
A key issue is that only some 30 percent of participating growers’ production is being channeled through the Alliance structures. This is because many growers have borrowed from Debe boy traders, and are obliged to deliver a significant proportion of the coffee to these intermediaries as part of the loan arrangements. For the reasons given above, use of the Debe boy intermediaries is a major challenge to the improvement of quality. Clearly the obvious way to tackle this major problem is to organise alternative sources of financial services.
Another financing requirement is marketing finance for the Depot Companies (Committees) to be able to purchase coffee and make a significant
80
partial payment on delivery. The fragile nature of the finances of almost all of the Depot Companies makes it difficult for them to access the short term funds they need for this purpose – which would go a long way to attracting more throughput of coffee. Moreover, if the scale of the businesses were to increase, it will become more feasible for the Depot Companies to attract investment to enable conversion to wet processing.
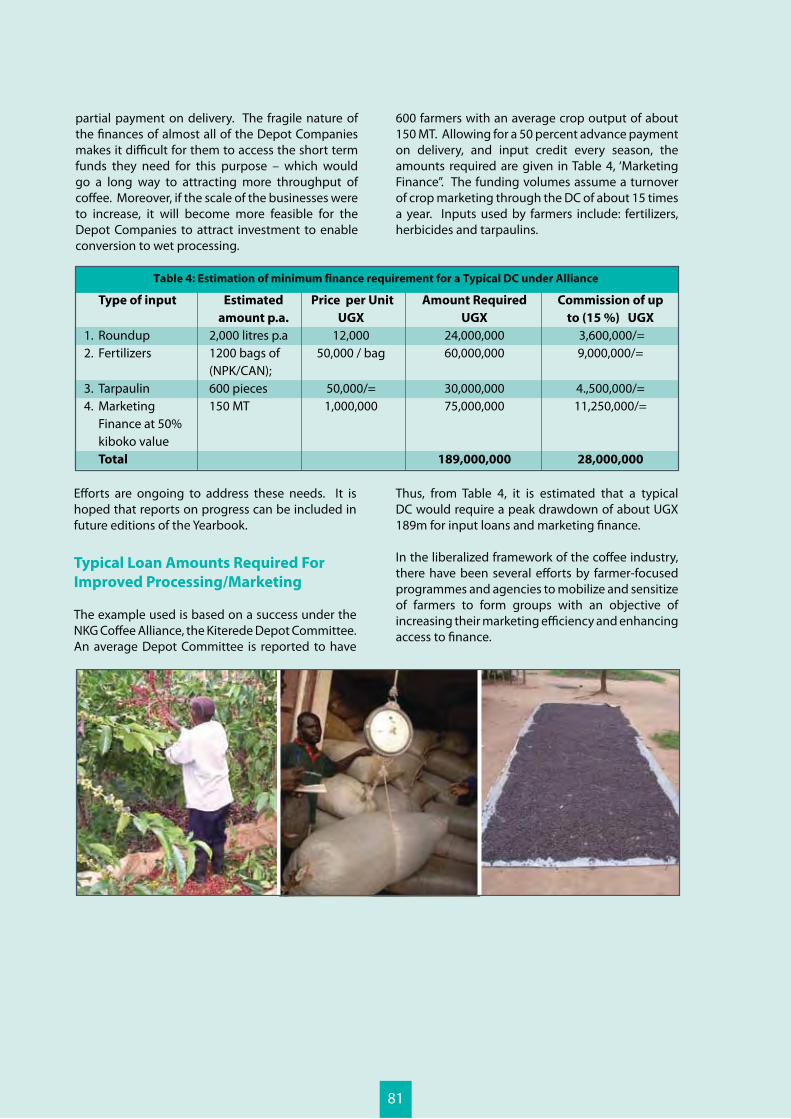
Table 4: Estimation of minimum finance requirement for a Typical DC under Alliance
Type of input
RoundupFertilizers
TarpaulinMarketing Finance at 50% kiboko valueTotal
Price per Unit
UGX
12,00050,000 / bag
50,000/=1,000,000
Estimated
amount p.a.
2,000 litres p.a1200 bags of (NPK/CAN); 600 pieces150 MT
Amount Required
UGX
24,000,00060,000,000
30,000,00075,000,000
189,000,000
Commission of up
to (15 %) UGX
3,600,000/=9,000,000/=
4.,500,000/=11,250,000/=
28,000,000
1.2.
3.4.
Efforts are ongoing to address these needs. It is hoped that reports on progress can be included in future editions of the Yearbook.
Typical Loan Amounts Required For
Improved Processing/Marketing
The example used is based on a success under the NKG Coffee Alliance, the Kiterede Depot Committee. An average Depot Committee is reported to have
600 farmers with an average crop output of about 150 MT. Allowing for a 50 percent advance payment on delivery, and input credit every season, the amounts required are given in Table 4, ‘Marketing Finance”. The funding volumes assume a turnover of crop marketing through the DC of about 15 times a year. Inputs used by farmers include: fertilizers, herbicides and tarpaulins.
Thus, from Table 4, it is estimated that a typical DC would require a peak drawdown of about UGX 189m for input loans and marketing finance.
In the liberalized framework of the coffee industry, there have been several efforts by farmer-focused programmes and agencies to mobilize and sensitize of farmers to form groups with an objective of increasing their marketing efficiency and enhancing access to finance.
81
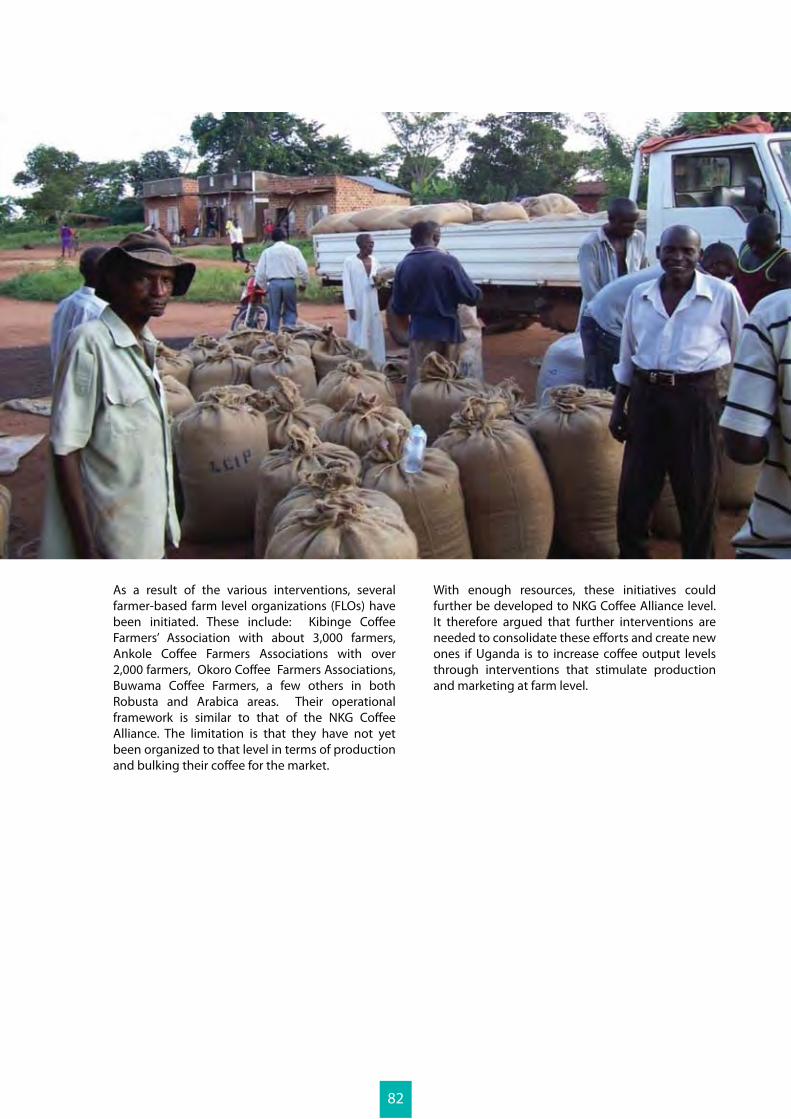
As a result of the various interventions, several farmer-based farm level organizations (FLOs) have been initiated. These include: Kibinge Coffee Farmers’ Association with about 3,000 farmers, Ankole Coffee Farmers Associations with over 2,000 farmers, Okoro Coffee Farmers Associations, Buwama Coffee Farmers, a few others in both Robusta and Arabica areas. Their operational framework is similar to that of the NKG Coffee Alliance. The limitation is that they have not yet been organized to that level in terms of production and bulking their coffee for the market.
With enough resources, these initiatives could further be developed to NKG Coffee Alliance level. It therefore argued that further interventions are needed to consolidate these efforts and create new ones if Uganda is to increase coffee output levels through interventions that stimulate production and marketing at farm level.
82
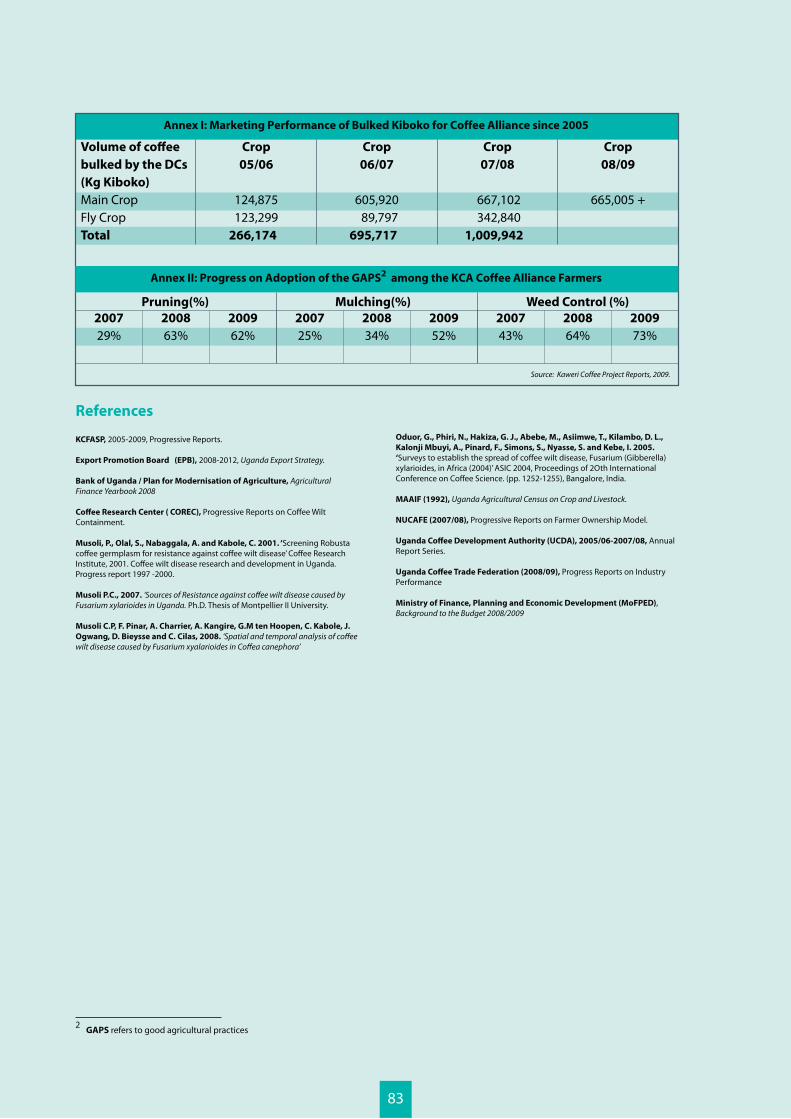
Annex I: Marketing Performance of Bulked Kiboko for Coffee Alliance since 2005
Annex II: Progress on Adoption of the GAPS2 among the KCA Coffee Alliance Farmers
Volume of coffee
bulked by the DCs
(Kg Kiboko)
Main Crop Fly Crop Total
Crop
05/06
124,875 123,299
266,174
Crop
06/07
605,920 89,797
695,717
Crop
07/08
667,102 342,840
1,009,942
Crop
08/09
665,005 +
Pruning(%) Mulching(%) Weed Control (%)
2007
29%2008
63%2009
62%2007
25%2008
34%2009
52%2007
43%2008
64%2009
73%
Source: Kaweri Coffee Project Reports, 2009.
2 GAPS refers to good agricultural practices
References
KCFASP, 2005-2009, Progressive Reports.
Export Promotion Board (EPB), 2008-2012, Uganda Export Strategy.
Bank of Uganda / Plan for Modernisation of Agriculture, Agricultural Finance Yearbook 2008
Coffee Research Center ( COREC), Progressive Reports on Coffee Wilt Containment.
Musoli, P., Olal, S., Nabaggala, A. and Kabole, C. 2001. ‘Screening Robusta coffee germplasm for resistance against coffee wilt disease’ Coffee Research Institute, 2001. Coffee wilt disease research and development in Uganda. Progress report 1997 -2000.
Musoli P.C., 2007. ‘Sources of Resistance against coffee wilt disease caused by Fusarium xylarioides in Uganda. Ph.D. Thesis of Montpellier II University.
Musoli C.P, F. Pinar, A. Charrier, A. Kangire, G.M ten Hoopen, C. Kabole, J.
Ogwang, D. Bieysse and C. Cilas, 2008. ‘Spatial and temporal analysis of coffee wilt disease caused by Fusarium xyalarioides in Coffea canephora’
Oduor, G., Phiri, N., Hakiza, G. J., Abebe, M., Asiimwe, T., Kilambo, D. L.,
Kalonji Mbuyi, A., Pinard, F., Simons, S., Nyasse, S. and Kebe, I. 2005.
‘Surveys to establish the spread of coffee wilt disease, Fusarium (Gibberella) xylarioides, in Africa (2004)’ ASIC 2004, Proceedings of 2Oth International Conference on Coffee Science. (pp. 1252-1255), Bangalore, India.
MAAIF (1992), Uganda Agricultural Census on Crop and Livestock.
NUCAFE (2007/08), Progressive Reports on Farmer Ownership Model.
Uganda Coffee Development Authority (UCDA), 2005/06-2007/08, Annual Report Series.
Uganda Coffee Trade Federation (2008/09), Progress Reports on Industry Performance
Ministry of Finance, Planning and Economic Development (MoFPED), Background to the Budget 2008/2009
83
3.3 Rice Processing and Marketing
Similarly, there has been an increase in the number of processors over the years from the one main processor in Kibimba (now Tilda) to over 10 other medium to large scale processors like Upland Rice Millers (URM) in Jinja. This is in addition to the hundreds of small scale mainly rural based millers.
In Eastern Africa, Tanzania is the largest rice producer averaging over 500,000 MT per annum of unshelled rice. It is also a dominant consumer of rice in the region, with imports of rice into the country growing profoundly during the past decade. In contrast, Kenya is the smallest producer and the largest importer of rice in the region with an average annual demand of about 300,000 MT. As for Rwanda, both rice production and consumption are comparatively low, although it is still a deficit market .
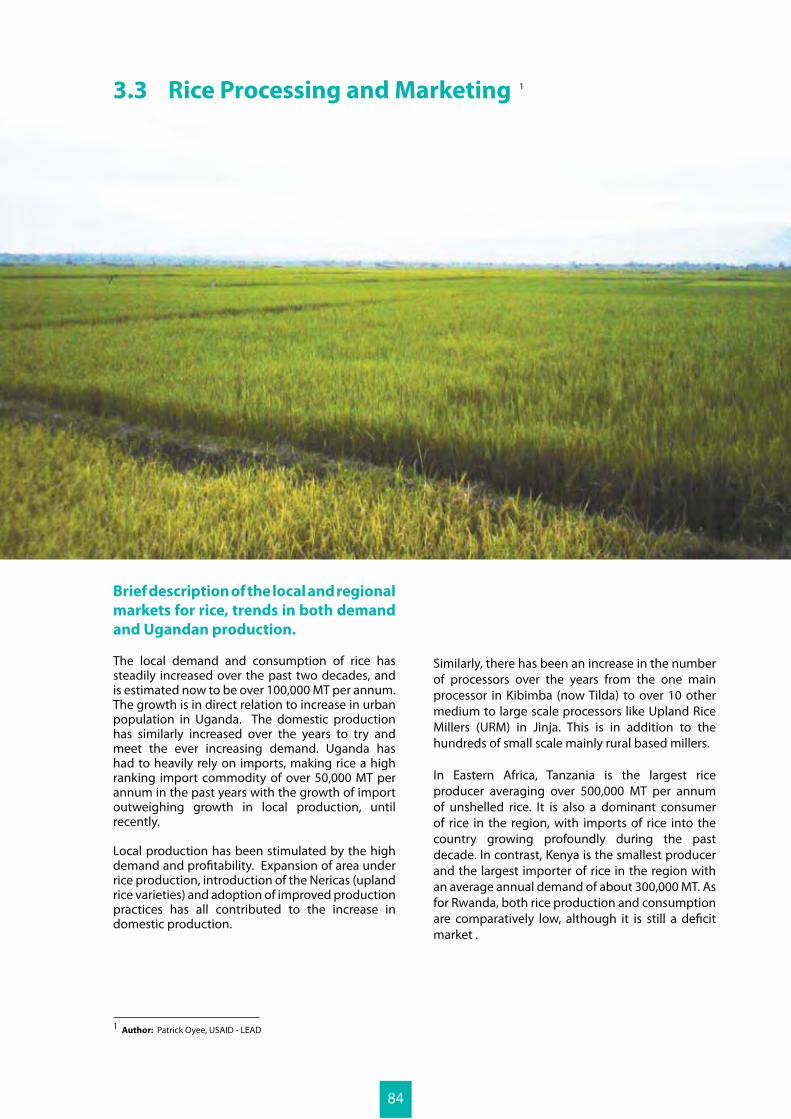
Brief description of the local and regional
markets for rice, trends in both demand
and Ugandan production.
The local demand and consumption of rice has steadily increased over the past two decades, and is estimated now to be over 100,000 MT per annum. The growth is in direct relation to increase in urban population in Uganda. The domestic production has similarly increased over the years to try and meet the ever increasing demand. Uganda has had to heavily rely on imports, making rice a high ranking import commodity of over 50,000 MT per annum in the past years with the growth of import outweighing growth in local production, until recently.
Local production has been stimulated by the high demand and profitability. Expansion of area under rice production, introduction of the Nericas (upland rice varieties) and adoption of improved production practices has all contributed to the increase in domestic production.
1 Author: Patrick Oyee, USAID - LEAD
1
84
Varietal Demand and Supply
Rice is grown by Ugandan farmers mainly as a cashcrop, however, farmers consume the local varieties of rice, which are readily available at home or in the nearby rural shops. In rural areas, quality and variety are not usually the issue that they are in urban areas, due to both lack of choice and lower purchasing power.
The urban dwellers who consume rice are very specific about their choices. When purchasing rice, the qualities or preferences that the urban dwellers look for include aroma, colour, taste, and relative proportions of whole and broken rice. The elite urban consumers are known to prefer premium brands of imported rice such as Basmati rice as well as local brands and varieties, in particular the Tilda brand, Super rice and upland rice.
Kaiso is the most popular and dominant rice variety currently in the market. According to URM, Kaiso makes up about 80 percent of their total milled quantities while the Super and upland rice varieties only make up about 10 percent each. The Kaiso variety is known to be popular with institutions like schools, due to its swelling qualities when cooked. The Super and upland varieties are particularly popular with the elite urban consumers due to their aromatic and non-sticking properties. There is currently an influx of Super rice from Tanzania selling at UGX 1,700, compared to the Ugandan Super currently at UGX 1,900 per kg.
The quality of rice milling also determines the price and demand. Rice from the more sophisticated mills like URM, that produce better quality in terms of grain cleanliness and fewer broken grains, fetch comparatively higher prices.
Current constraints to efficient buying
of crop from growers
There are a number of challenges that affect the efficient purchase of rice from the rural producer, with quality and bulking constraints being the most critical.
The rice quality challenge at producer level is principally due to limited knowledge of quality standards, lack of post-harvest knowledge and shortage of appropriate storage facilities. The bulking process by local, small-scale buyers further aggravates the problem, through aggregation of non-uniform quality rice from various farmers.
The lack of uniformity in quality is principally a result of differences in post handling practices and mixing of varieties, especially Kaiso and Super. It is also known that some sophisticated millers with better machinery can afford to buy any quality of grain from farmers thus further abetting the quality challenge. This is because they have the capacity to process any rice quality with their advanced drying and sorting capacities. In addition, some of the millers have markets for the lower quality broken grains usually required by the breweries.
Other constraints in buying rice from producers include:
undermining bulk purchases and restricting scale economies;
inaccessible road networks, especially during the rainy season;
information, which give rise to market uncertainties. In addition, the cash-based transactions create high security risks i.e. the carrying of huge sums of cash.
Milling and Packaging Constraints
Poor quality paddy received from farmers or local traders gives millers a number of problems, including: increased operational costs in terms of extra cleaning and drying costs, low processing out-turns and equipment damage. In addition, there is the low consumer preference for the inferior quality milled rice.
Power supply is a major constraint in the milling industry. Almost all mills in Uganda have their milling capacities greatly restricted by power irregularities. In the case of URM, irregular power supply accounts for about 70 percent of the milling stoppages.
High cost of improved machinery required to produce high quality products and branding is a further problem. In addition, machine breakdown is, of course, another inevitable and natural constraint but this is sometimes aggravated by the poor quality of paddy that translates into a lot more wear and tear on machinery.
Lack of finance is similarly a critical bottleneck in the rice milling industry. Affordable financing for both working capital and purchase of improved machinery is not easily accessible to many medium-
85
large scale millers in Uganda. As a result, most rice processors are limited to the less lucrative toll milling business (contract milling) as opposed to trade- based milling that involves procurement of rice for milling and marketing. The latter arrangement offers opportunities for earning greater margins.
Other notable challenges experienced by millers include: limited storage facilities at processing plants and lack of investment in value-addition of by-products.
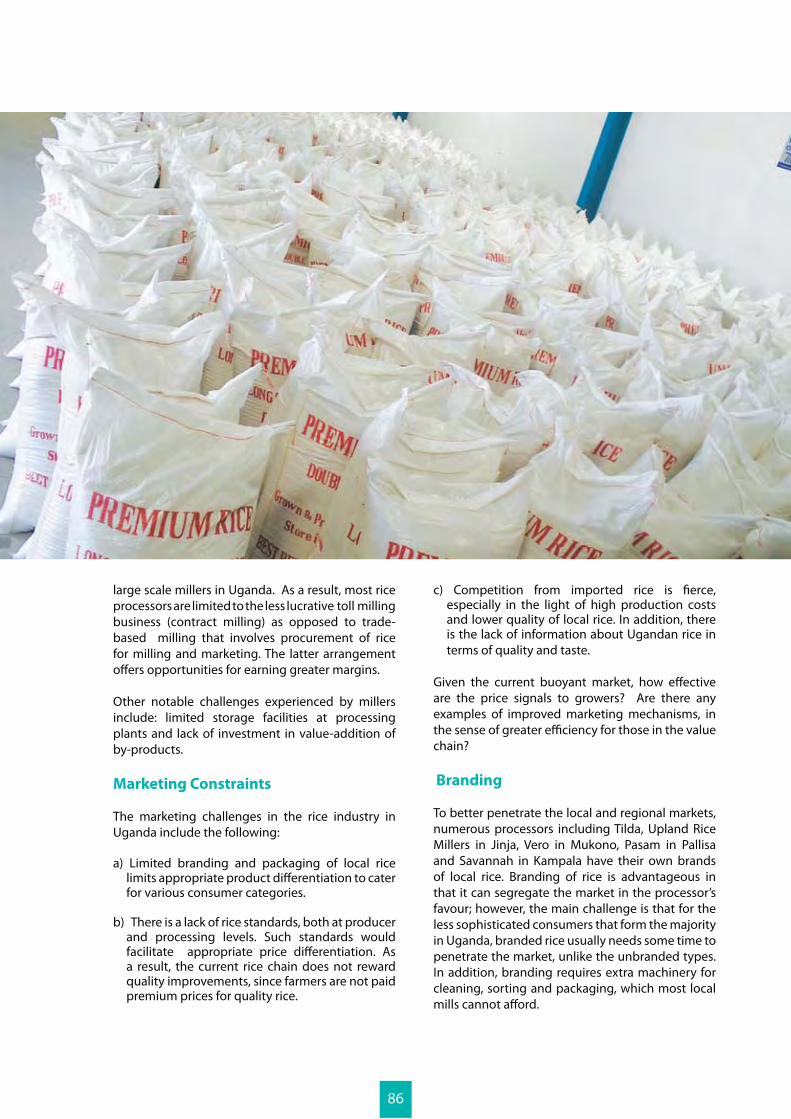
Marketing Constraints
The marketing challenges in the rice industry in Uganda include the following:
a) Limited branding and packaging of local rice limits appropriate product differentiation to cater for various consumer categories.
b) There is a lack of rice standards, both at producer
and processing levels. Such standards would facilitate appropriate price differentiation. As a result, the current rice chain does not reward quality improvements, since farmers are not paid premium prices for quality rice.
c) Competition from imported rice is fierce, especially in the light of high production costs and lower quality of local rice. In addition, there is the lack of information about Ugandan rice in terms of quality and taste.
Given the current buoyant market, how effective are the price signals to growers? Are there any examples of improved marketing mechanisms, in the sense of greater efficiency for those in the value chain? Branding
To better penetrate the local and regional markets, numerous processors including Tilda, Upland Rice Millers in Jinja, Vero in Mukono, Pasam in Pallisa and Savannah in Kampala have their own brands of local rice. Branding of rice is advantageous in that it can segregate the market in the processor’s favour; however, the main challenge is that for the less sophisticated consumers that form the majority in Uganda, branded rice usually needs some time to penetrate the market, unlike the unbranded types. In addition, branding requires extra machinery for cleaning, sorting and packaging, which most local mills cannot afford.
86
Financial services available to investors
in the rice industry
Producers
Production loan products are available with Centenary Bank, an institution that is known to finance rice farmers in Kapchorwa, Bukedea, Butalegya, and Lira. The loans are mainly seasonal, for a maximum of six months, to finance inputs and labour requirements. The major risk involved in rice production lending is drought and to a lesser extent price risk. Unlike other commodities like maize, rice does to have any market risks, as demand still outstrips supply in Uganda.
In regard to the drought risk, lowland rice (grown in swampy areas) similarly furnishes a less risky lending option compared to upland rice that relies entirely on rainfall. It is for this reason that lowland areas of Doho in Butalegya district and Olweny in Lira district have attracted a lot of production financing. It should be noted, however, that despite the lower drought risk, lowland rice unit production costs are higher and also produce lower yields.
Animal traction products by Centenary Bank to finance the purchase of oxen and equipment are also available and are being rolled out in the districts of Soroti, Mbale, Kapchorwa, Lira and Masindi. These can be similarly accessed and used for rice production activities.
For profitability purposes, farmers are encouraged to prioritize borrowing for yield enhancing inputs such as improved seed, fertilizers and herbicides. In this way, the farmer is assured of increased yields that will enable him to make a profit after interest, a message that all extension agents should emphasize.
It should also be noted that numerous farmers in Uganda also utilize microfinance from the various lower tier financial institutions such as SACCOs and MFIs for their farming activities, though such financing may not necessarily be tailored for agricultural production in terms of both loan amounts and repayment tenors.
Processors
Medium and large scale rice processors require term financing for equipment purchase and working capital for procurement of paddy for processing and sale.
Medium and long term financing products are best suited for equipment finance. An example is the Asset Leasing products now available with most commercial banks. Medium and long term loans, available particularly with the development banks, can also be used for the acquisition of rice milling equipment.
A standard modern rice mill (with a pre-cleaner, destoner, huller, paddy separator, whitener, grader and polisher) that produces high quality rice would cost to the tune of USD 150,000. This is in addition to the building and civil works costs estimated at USD 100,000. The latter cost could be higher, depending on the size of the storage facilities. An even more modern mill, with an extra pre-cleaner and whitener, colour sorter and the extra production lines required if branding is carried out on the packaging, would cost USD 50-100,000 more than the standard version.
For financing this substantial level of investment, lease products may well be suitable in that the usually prohibitive collateral requirement is overcome by using the rice mill machinery itself as the security. This is enabled by the Bank retaining full title to the asset, while the customer has use of the asset until fully repaid, after which ownership is relinquished to the customer. The other important advantage of the leasing product is that since it is self collateralized, it frees other assets for securing additional borrowing, such as for working capital.
Short term working capital of USD 200,000-500,000 is sufficient to run a modern processing plant of 15,000 MT installed capacity. Working capital can be accessed from most banks in the form of overdraft loans, however some lenders offer the more creative structured commodity trade finance facilities. These involve the transactional short-term, self-liquidating financing of commodity flows from the point goods have been sold until repayment. Warehouse receipt financing is also a form of structured trade financing. This would suit rice trade finance in Uganda as it allows lending banks to take security against commodity stocks (in this case, rice). The product experiences various operational challenges that are yet to be overcome in Uganda. A functional warehouse receipt system that is based on the Warehouse Receipts Act would allow farmers traders and processors to use stocks as collateral for loan advances.
On the other hand, non-negotiable warehouse
87
receipt financing, which is not based on the Warehouse Receipts Act. Rather it operates on the basis of a tripartite agreement between the lending bank, borrower and an independent collateral manager. The arrangement is offered by several banks and has been successfully practised for over a decade in Uganda to finance agricultural commodity trade. It can also be used to access working capital for rice processing.
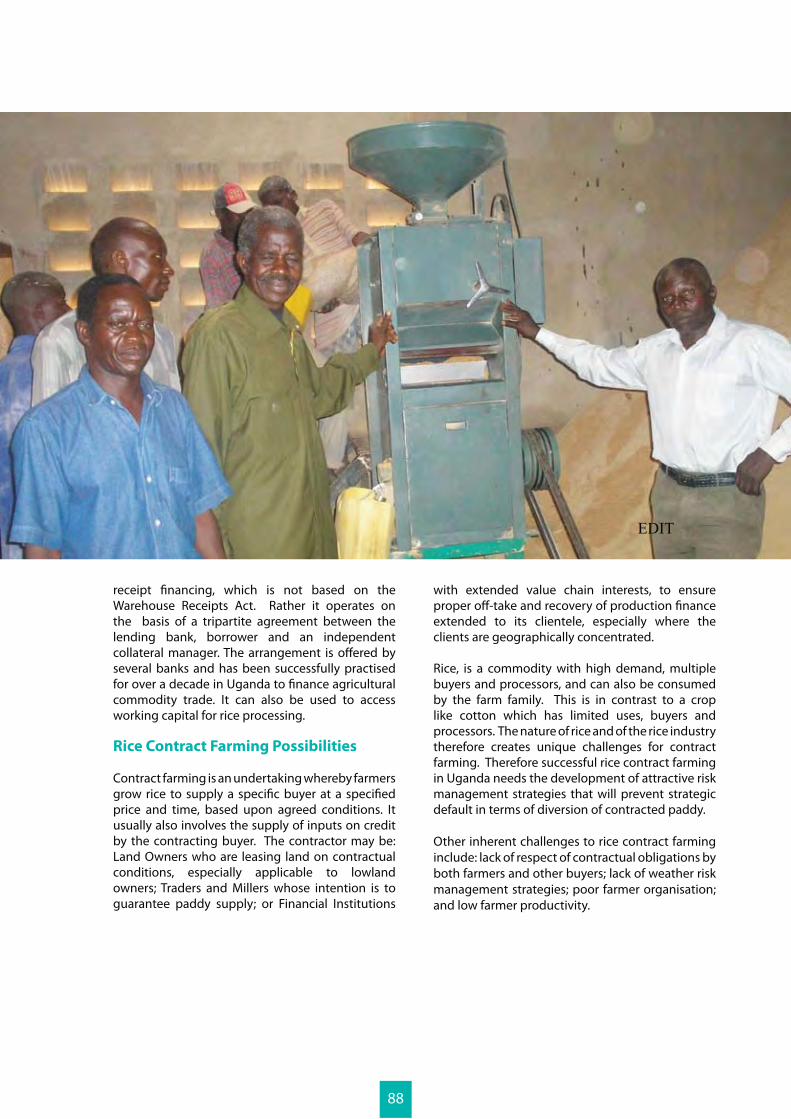
Rice Contract Farming Possibilities
Contract farming is an undertaking whereby farmers grow rice to supply a specific buyer at a specified price and time, based upon agreed conditions. It usually also involves the supply of inputs on credit by the contracting buyer. The contractor may be: Land Owners who are leasing land on contractual conditions, especially applicable to lowland owners; Traders and Millers whose intention is to guarantee paddy supply; or Financial Institutions
with extended value chain interests, to ensure proper off-take and recovery of production finance extended to its clientele, especially where the clients are geographically concentrated.
Rice, is a commodity with high demand, multiple buyers and processors, and can also be consumed by the farm family. This is in contrast to a crop like cotton which has limited uses, buyers and processors. The nature of rice and of the rice industry therefore creates unique challenges for contract farming. Therefore successful rice contract farming in Uganda needs the development of attractive risk management strategies that will prevent strategic default in terms of diversion of contracted paddy.
Other inherent challenges to rice contract farming include: lack of respect of contractual obligations by both farmers and other buyers; lack of weather risk management strategies; poor farmer organisation; and low farmer productivity.
EDIT
88

Despite the various challenges, there are notable situations and areas that present opportunities for successful rice contract farming. These include the following:
proximity with large farmers and mills such as Tilda in Kibimba;
irrigated land in a very organized manner such as Olweny in Lira and Mubuku in Kasese;
and sustainable farmer organisation structure that enables appropriate management, and supervision of contractual obligations.
89
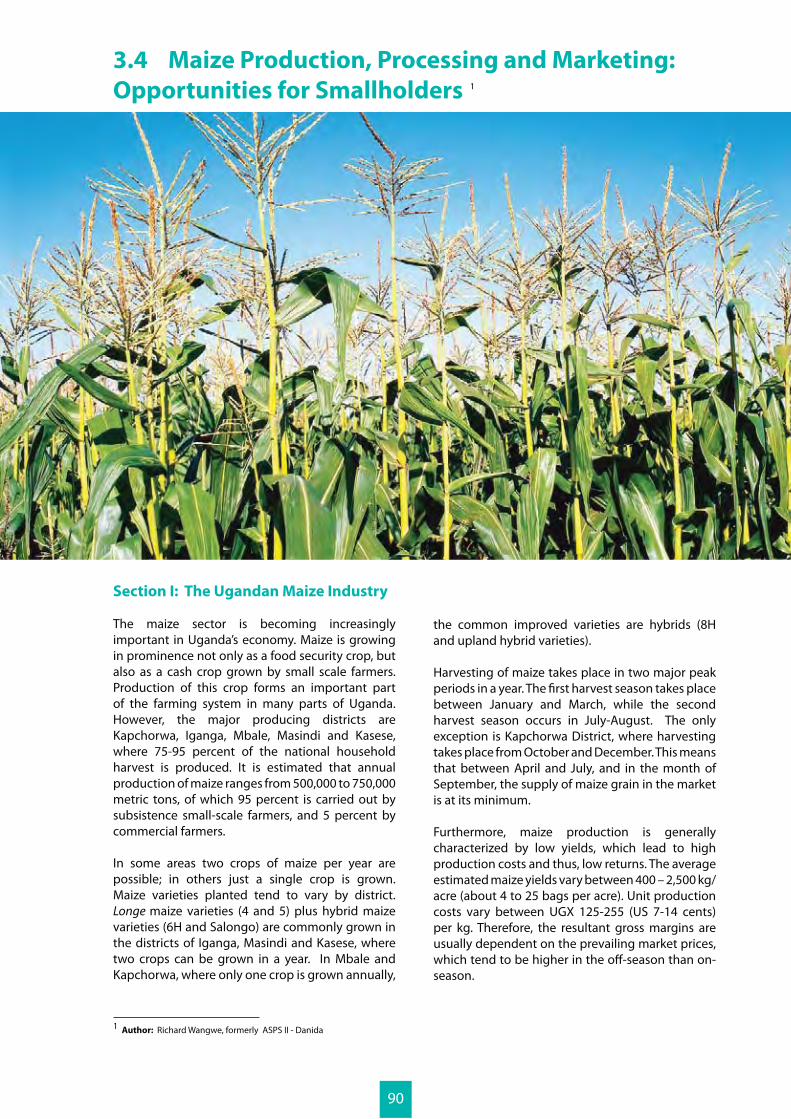
Section I: The Ugandan Maize Industry
The maize sector is becoming increasingly important in Uganda’s economy. Maize is growing in prominence not only as a food security crop, but also as a cash crop grown by small scale farmers. Production of this crop forms an important part of the farming system in many parts of Uganda. However, the major producing districts are Kapchorwa, Iganga, Mbale, Masindi and Kasese, where 75-95 percent of the national household harvest is produced. It is estimated that annual production of maize ranges from 500,000 to 750,000 metric tons, of which 95 percent is carried out by subsistence small-scale farmers, and 5 percent by commercial farmers.
In some areas two crops of maize per year are possible; in others just a single crop is grown. Maize varieties planted tend to vary by district. Longe maize varieties (4 and 5) plus hybrid maize varieties (6H and Salongo) are commonly grown in the districts of Iganga, Masindi and Kasese, where two crops can be grown in a year. In Mbale and Kapchorwa, where only one crop is grown annually,
the common improved varieties are hybrids (8H and upland hybrid varieties).
Harvesting of maize takes place in two major peak periods in a year. The first harvest season takes place between January and March, while the second harvest season occurs in July-August. The only exception is Kapchorwa District, where harvesting takes place from October and December. This means that between April and July, and in the month of September, the supply of maize grain in the market is at its minimum.
Furthermore, maize production is generally characterized by low yields, which lead to high production costs and thus, low returns. The average estimated maize yields vary between 400 – 2,500 kg/acre (about 4 to 25 bags per acre). Unit production costs vary between UGX 125-255 (US 7-14 cents) per kg. Therefore, the resultant gross margins are usually dependent on the prevailing market prices, which tend to be higher in the off-season than on-season.
3.4 Maize Production, Processing and Marketing:
Opportunities for Smallholders
1 Author: Richard Wangwe, formerly ASPS II - Danida
1
90
Maize Production versus Consumption
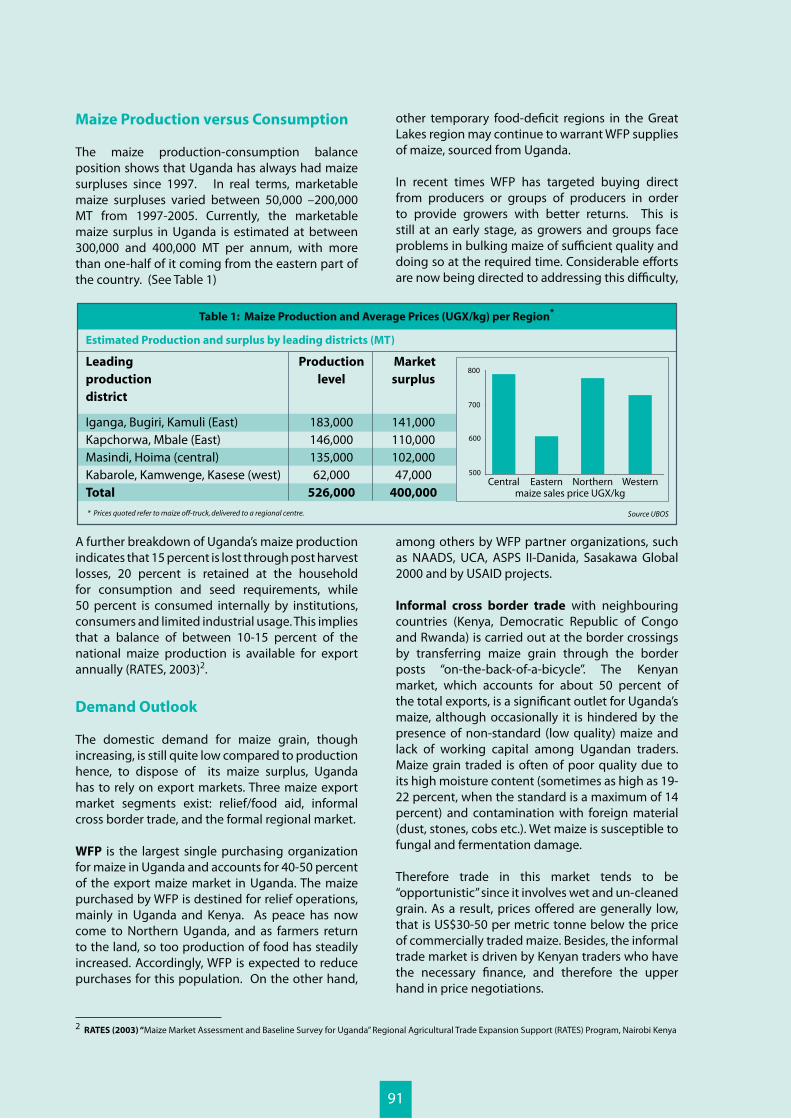
The maize production-consumption balance position shows that Uganda has always had maize surpluses since 1997. In real terms, marketable maize surpluses varied between 50,000 –200,000 MT from 1997-2005. Currently, the marketable maize surplus in Uganda is estimated at between 300,000 and 400,000 MT per annum, with more than one-half of it coming from the eastern part of the country. (See Table 1)
Table 1: Maize Production and Average Prices (UGX/kg) per Region*
Source UBOS
Estimated Production and surplus by leading districts (MT)
Leadingproductiondistrict
Iganga, Bugiri, Kamuli (East)Kapchorwa, Mbale (East)Masindi, Hoima (central)Kabarole, Kamwenge, Kasese (west)Total
Productionlevel
183,000146,000135,00062,000
526,000
Market surplus
141,000110,000102,00047,000
400,000 maize sales price UGX/kg
600
500
700
800
Eastern Northern WesternCentral
* Prices quoted refer to maize off-truck, delivered to a regional centre.
2 RATES (2003) “Maize Market Assessment and Baseline Survey for Uganda” Regional Agricultural Trade Expansion Support (RATES) Program, Nairobi Kenya
A further breakdown of Uganda’s maize production indicates that 15 percent is lost through post harvest losses, 20 percent is retained at the household for consumption and seed requirements, while 50 percent is consumed internally by institutions, consumers and limited industrial usage. This implies that a balance of between 10-15 percent of the national maize production is available for export annually (RATES, 2003)2.
Demand Outlook
The domestic demand for maize grain, though increasing, is still quite low compared to production hence, to dispose of its maize surplus, Uganda has to rely on export markets. Three maize export market segments exist: relief/food aid, informal cross border trade, and the formal regional market.
WFP is the largest single purchasing organization for maize in Uganda and accounts for 40-50 percent of the export maize market in Uganda. The maize purchased by WFP is destined for relief operations, mainly in Uganda and Kenya. As peace has now come to Northern Uganda, and as farmers return to the land, so too production of food has steadily increased. Accordingly, WFP is expected to reduce purchases for this population. On the other hand,
other temporary food-deficit regions in the Great Lakes region may continue to warrant WFP supplies of maize, sourced from Uganda.
In recent times WFP has targeted buying direct from producers or groups of producers in order to provide growers with better returns. This is still at an early stage, as growers and groups face problems in bulking maize of sufficient quality and doing so at the required time. Considerable efforts are now being directed to addressing this difficulty,
among others by WFP partner organizations, such as NAADS, UCA, ASPS II-Danida, Sasakawa Global 2000 and by USAID projects.
Informal cross border trade with neighbouring countries (Kenya, Democratic Republic of Congo and Rwanda) is carried out at the border crossings by transferring maize grain through the border posts “on-the-back-of-a-bicycle”. The Kenyan market, which accounts for about 50 percent of the total exports, is a significant outlet for Uganda’s maize, although occasionally it is hindered by the presence of non-standard (low quality) maize and lack of working capital among Ugandan traders. Maize grain traded is often of poor quality due to its high moisture content (sometimes as high as 19-22 percent, when the standard is a maximum of 14 percent) and contamination with foreign material (dust, stones, cobs etc.). Wet maize is susceptible to fungal and fermentation damage.
Therefore trade in this market tends to be “opportunistic” since it involves wet and un-cleaned grain. As a result, prices offered are generally low, that is US$30-50 per metric tonne below the price of commercially traded maize. Besides, the informal trade market is driven by Kenyan traders who have the necessary finance, and therefore the upper hand in price negotiations.
91
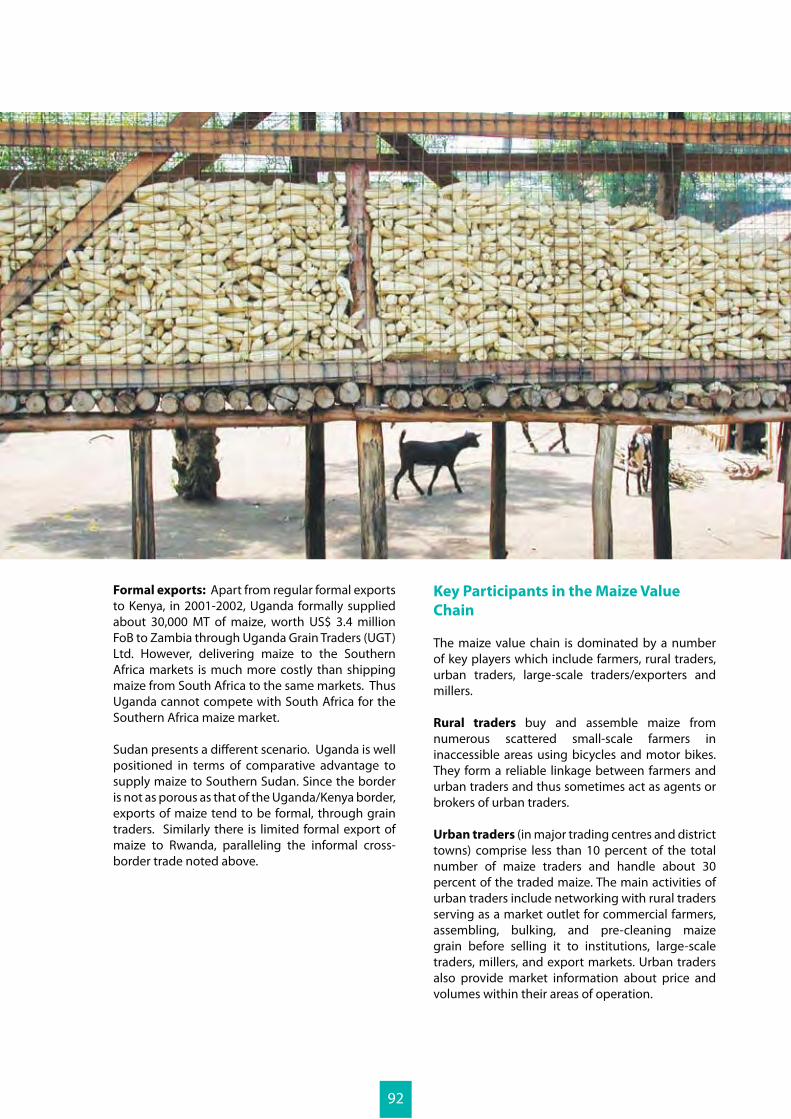
Formal exports: Apart from regular formal exports to Kenya, in 2001-2002, Uganda formally supplied about 30,000 MT of maize, worth US$ 3.4 million FoB to Zambia through Uganda Grain Traders (UGT) Ltd. However, delivering maize to the Southern Africa markets is much more costly than shipping maize from South Africa to the same markets. Thus Uganda cannot compete with South Africa for the Southern Africa maize market.
Sudan presents a different scenario. Uganda is well positioned in terms of comparative advantage to supply maize to Southern Sudan. Since the border is not as porous as that of the Uganda/Kenya border, exports of maize tend to be formal, through grain traders. Similarly there is limited formal export of maize to Rwanda, paralleling the informal cross-border trade noted above.
Key Participants in the Maize Value
Chain
The maize value chain is dominated by a number of key players which include farmers, rural traders, urban traders, large-scale traders/exporters and millers.
Rural traders buy and assemble maize from numerous scattered small-scale farmers in inaccessible areas using bicycles and motor bikes. They form a reliable linkage between farmers and urban traders and thus sometimes act as agents or brokers of urban traders.
Urban traders (in major trading centres and district towns) comprise less than 10 percent of the total number of maize traders and handle about 30 percent of the traded maize. The main activities of urban traders include networking with rural traders serving as a market outlet for commercial farmers, assembling, bulking, and pre-cleaning maize grain before selling it to institutions, large-scale traders, millers, and export markets. Urban traders also provide market information about price and volumes within their areas of operation.
92
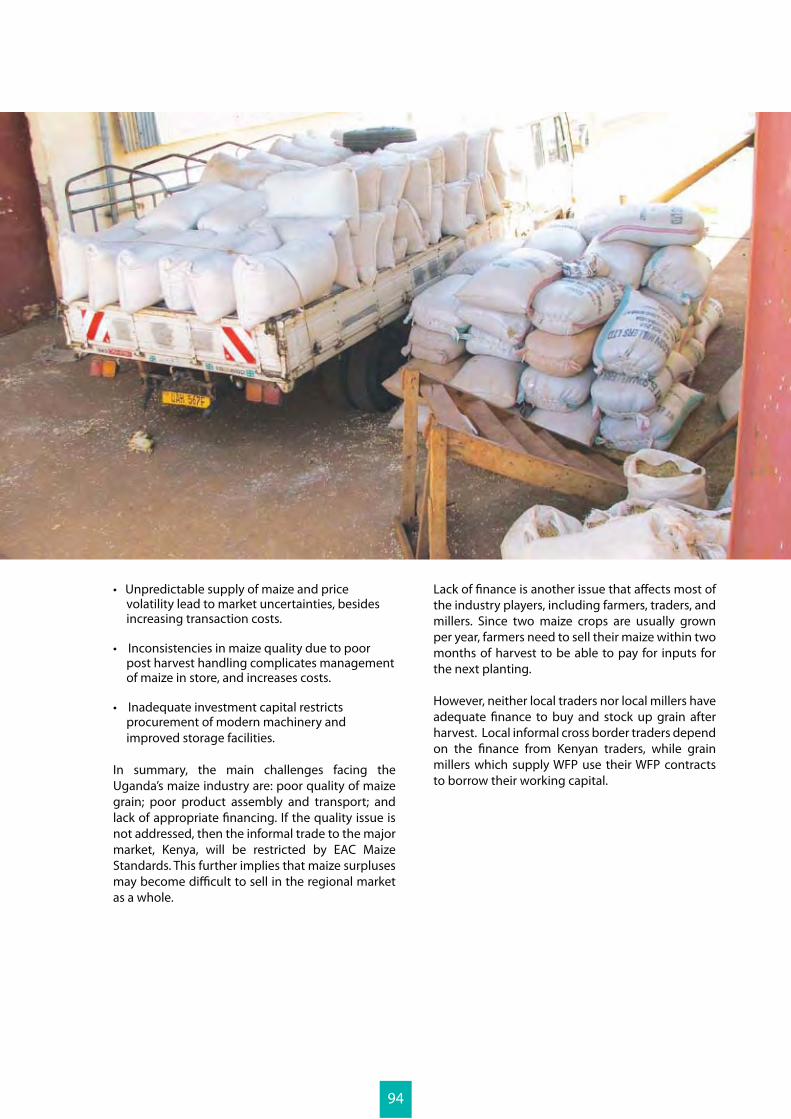
The large-scale traders live mostly in Kampala and comprise less than 1 percent of the maize traders nationally. Nonetheless, these traders handle about 30 percent of the traded maize. Their major roles including networking with urban traders, serving as a market outlet for commercial farmers, pre-cleaning, fumigating and verifying, and re-bagging maize grain before it is exported. Large-scale traders store maize grain between one to two months, depending on the availability of the market and sources of capital. They supply millers in the domestic market as well as international relief agencies and regional markets. Large-scale traders also provide market information to urban traders and commercial farmers, and search for markets for surplus maize.
Uganda Commodity Exchange (UCE) is engaged in maize marketing by bringing together maize sellers (who are mainly urban traders, commercial farmers and a few organized farmer groups) and buyers (local and foreign companies). It encourages sellers to consolidate high quality marketable supplies of maize for offer through the Exchange, and to purchase inputs in large volumes to achieve economies of scale. As part of UCE strategies to facilitate commodity trading in both local and regional markets, the Exchange is encouraging stake holders to take advantage of the warehouse receipt system (WRS) for purposes of accessing finance from banks.
Maize millers are of three types: small-scale, medium-scale, and large-scale. The small and medium sized millers do small domestic milling plus offering both contract and trade based milling services to institutions and urban traders. The large scale millers have modern machinery with large milling capacity, large warehouses and bulk handling systems. They restrict themselves to trade-based milling, and normally supply the flour to institutions and relief agencies. Apart from the profit from value addition in processing, the stocking of maize grain, especially for off-season supply, forms the basis for their profitability.
Section II: Constraints in the Maize Value
Chain
The main constraints faced by the farmers include:
technology, owing to high input prices, poor input delivery systems, poor access to credit, lack of information, and hesitant farmer attitudes towards improved inputs and new technologies.
surpluses result in high product assembly costs.
season, due to individual marketing and limited enterprise diversification at farm level.
stimulant for profits results in fluctuations in volumes between seasons, which create market uncertainty.
results in exploitative tendencies by middlemen.
technologies and practices leads to poor quality product and to sale of produce immediately after harvest. The resulting market glut forces prices to fall.
Indeed, poor post harvest handling and inadequacy of proper on-farm storage facilities results in widespread failure to achieve the gazetted quality standards (especially on moisture content). This can lead to significant increases in costs and high loss percentages.
The main constraints faced by the traders and millers are:
access to relevant testing instruments undermines quality appreciation and enforcement.
facilities result in wastage and a poor quality product.
storage restrict volumes and constrain the extent to which bulk purchases can be made, and scale economies realised.
inaccessible road networks, especially during the rainy season, increase transaction costs and the time spent travelling.
93
volatility lead to market uncertainties, besides increasing transaction costs.
post harvest handling complicates management of maize in store, and increases costs.
procurement of modern machinery and improved storage facilities.
In summary, the main challenges facing the Uganda’s maize industry are: poor quality of maize grain; poor product assembly and transport; and lack of appropriate financing. If the quality issue is not addressed, then the informal trade to the major market, Kenya, will be restricted by EAC Maize Standards. This further implies that maize surpluses may become difficult to sell in the regional market as a whole.
Lack of finance is another issue that affects most of the industry players, including farmers, traders, and millers. Since two maize crops are usually grown per year, farmers need to sell their maize within two months of harvest to be able to pay for inputs for the next planting.
However, neither local traders nor local millers have adequate finance to buy and stock up grain after harvest. Local informal cross border traders depend on the finance from Kenyan traders, while grain millers which supply WFP use their WFP contracts to borrow their working capital.
94
Section III: Addressing Maize Industry
Constraints through Finance
Identifying relationships along the maize value chain, mitigating constraints, exploiting opportunities for value chain finance, and exploring how formal financial institutions can enter the equation, are all vital parts of improving the overall effectiveness and efficiency of the value chain, and the returns enjoyed by value chain participants. Financial services can play a key part in this type of development.
Without access to finance, maize producers get stuck in low investment/low return production cycles. Lack of financing may prevent a producer from planting his or her crop, or reaching the optimal market for his or her maize. Likewise, financial constraints can have negative effects on traders and processors, preventing them from expanding and thus capping the amount of maize they buy from their suppliers.
Demand for Agricultural Finance
As explained in Section II above, maize producers need financing for improved technology and for inputs such as fertilizers, seeds, agro-chemicals, fuel, tools and equipment and labour used to plant, harvest and transport the maize crop to the market. Some growers only need short term working capital, while for others longer term investment funding is important.
Financial services such as deposit facilities (to assist in building up ‘own capital’) short and longer term loans, letters of guarantee, payments/transfers and leasing can help producers make the investments needed to increase their productivity and profitability.
Similarly, other value chain actors (e.g. agro-processors, buyers/traders and input suppliers) require access to working capital on the one hand, and loans/leases for equipment on the other.
Supply of Agricultural Finance
Buyers and processors often supply growers with funding in return for access to the future crop. This can be through formalized contractual agreements, as described above, or much less formal arrangements, often between growers and small-scale itinerant traders. Indeed, these financial flows between value chain actors often take the form of
in- kind transfers. That is, the lender advances inputs such as fertilizer or seed for payment at a later stage. Frequently the lender takes payment in the form of maize grain. Advances may also take the form of cash, for labour and for living expenses, with repayment in the form of grain. These arrangements do not necessarily involve financial institutions, at least not directly.
On the other hand, linking a financial institution to the value chain can be an effective way of augmenting the volume of finance. Examples of this include warehouse receipt lending or bank lending to a maize producer, based on the producer’s relationship with a well-established buyer. When a buyer with a sufficiently strong reputation as a reliable trader is willing to vouch for a producer, even a small producer becomes more attractive to financial institutions as a client.
There are three common types of value chain financing.
i) Trade credit involves short term seasonal loans, generally between maize producers and either input suppliers or produce buyers (processors/millers, traders etc). These relationships between buyers and sellers are often temporary and are price driven. Trade credit allows smallholders to participate in commercial value chains by expanding product sales, both through achieving greater output and by enabling access to more secure market channels.
ii) Contract farming or outgrowers’ schemes are relationships in which buyers of agricultural produce may lend funds (either in kind or in cash) to producers as part of a product purchasing agreement. It is often direct financing, but may be complemented by involvement of a financial institution that recognizes the value of the contract between grower and buyer. Contract farming and outgrowers’ schemes are formal relationships in which the buyer often provides additional services, such as technical assistance.
These schemes allow producers to gain access to high value markets as well as to increase their productivity by providing credit with embedded services such as technical and marketing assistance.
iii) Warehouse receipt lending: This system is an example of indirect value chain finance that requires a financial institution to complete
95
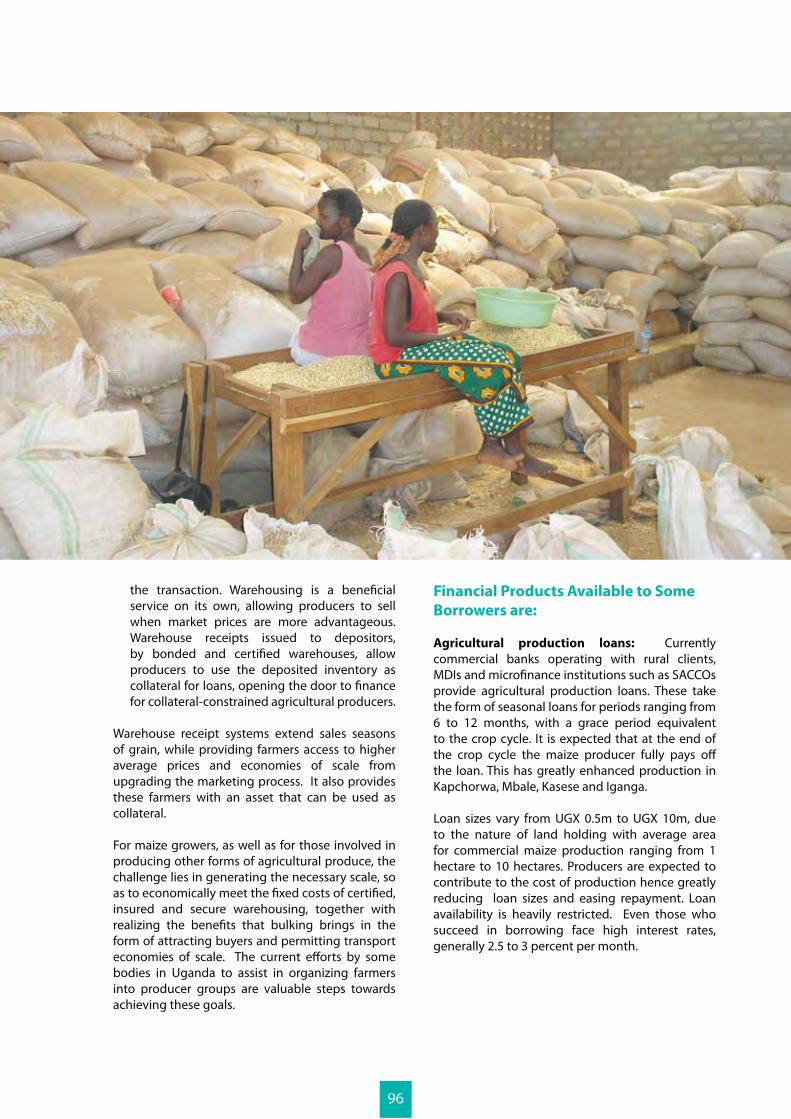
the transaction. Warehousing is a beneficial service on its own, allowing producers to sell when market prices are more advantageous. Warehouse receipts issued to depositors, by bonded and certified warehouses, allow producers to use the deposited inventory as collateral for loans, opening the door to finance for collateral-constrained agricultural producers.
Warehouse receipt systems extend sales seasons of grain, while providing farmers access to higher average prices and economies of scale from upgrading the marketing process. It also provides these farmers with an asset that can be used as collateral.
For maize growers, as well as for those involved in producing other forms of agricultural produce, the challenge lies in generating the necessary scale, so as to economically meet the fixed costs of certified, insured and secure warehousing, together with realizing the benefits that bulking brings in the form of attracting buyers and permitting transport economies of scale. The current efforts by some bodies in Uganda to assist in organizing farmers into producer groups are valuable steps towards achieving these goals.
Financial Products Available to Some
Borrowers are:
Agricultural production loans: Currently commercial banks operating with rural clients, MDIs and microfinance institutions such as SACCOs provide agricultural production loans. These take the form of seasonal loans for periods ranging from 6 to 12 months, with a grace period equivalent to the crop cycle. It is expected that at the end of the crop cycle the maize producer fully pays off the loan. This has greatly enhanced production in Kapchorwa, Mbale, Kasese and Iganga.
Loan sizes vary from UGX 0.5m to UGX 10m, due to the nature of land holding with average area for commercial maize production ranging from 1 hectare to 10 hectares. Producers are expected to contribute to the cost of production hence greatly reducing loan sizes and easing repayment. Loan availability is heavily restricted. Even those who succeed in borrowing face high interest rates, generally 2.5 to 3 percent per month.
96

Processing/trading finance: Finance negotiated for the working capital needs of firms buying, transporting and processing maize is mainly in the form of commercial bank loans and overdrafts. The sizes of loans vary with the size of the business and nature of collateral offered by the traders. The normal range is from UGX 5m to UGX 500m. Currently banks and MDIs offer agricultural SME financing, encouraged as they are by GoU policy, backed up by guarantees offered by donor agencies (e.g. by Danida).
Other forms of financing include vehicle and asset financing (leasing) offered by Stanbic, Barclays, DFCU, Centenary and Equity banks. These products have enabled producers and traders to acquire processing equipment and transport vehicles that have enhanced the trade in maize grain.
In rural areas, however, high transaction costs and risks associated with agricultural production keep financial institutions from playing a leading role. As a result the predominant sources of financing for agricultural production are often SACCOs and agribusiness enterprises with direct links to and vested interest in agricultural producers.
Because of supply constraints this means tight availability of finance at the maize production end of the value chain, a situation that hopefully will improve as greater progress is made with farmer group formation, coupled with a growing knowledge, by lenders, of the potential offered for financing investments in the maize industry.
97
Section 1: The Ugandan Dairy Industry
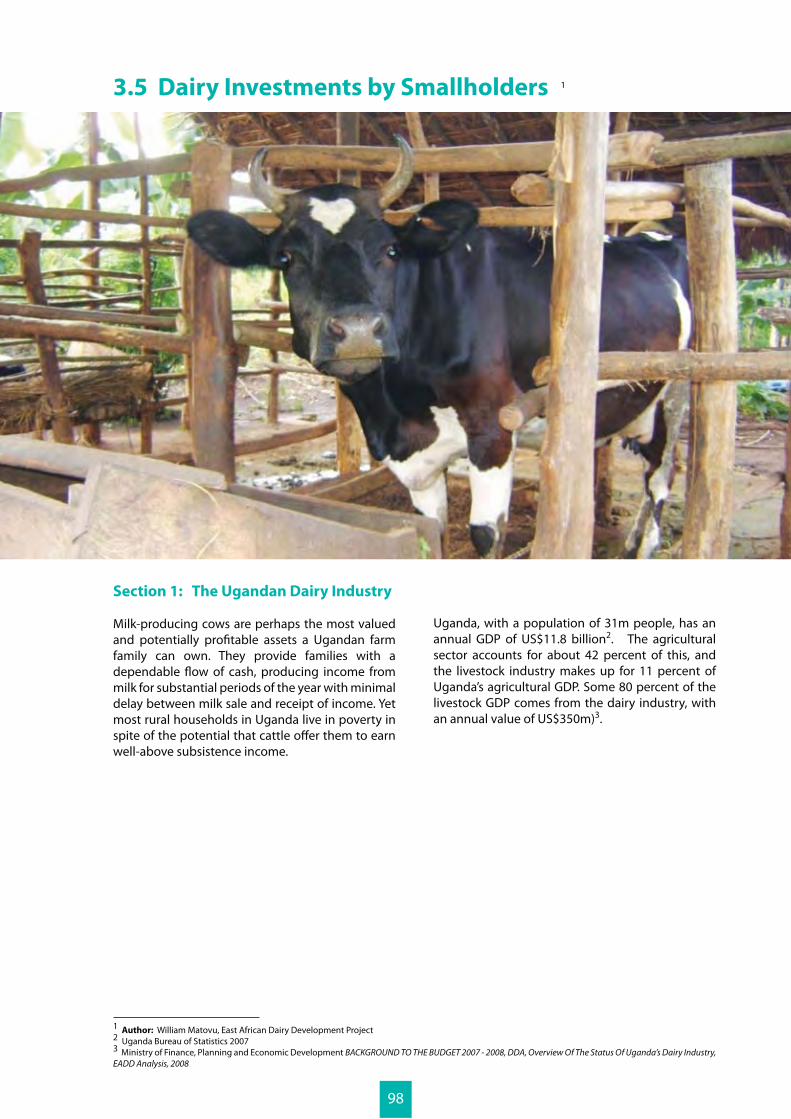
Milk-producing cows are perhaps the most valued and potentially profitable assets a Ugandan farm family can own. They provide families with a dependable flow of cash, producing income from milk for substantial periods of the year with minimal delay between milk sale and receipt of income. Yet most rural households in Uganda live in poverty in spite of the potential that cattle offer them to earn well-above subsistence income.
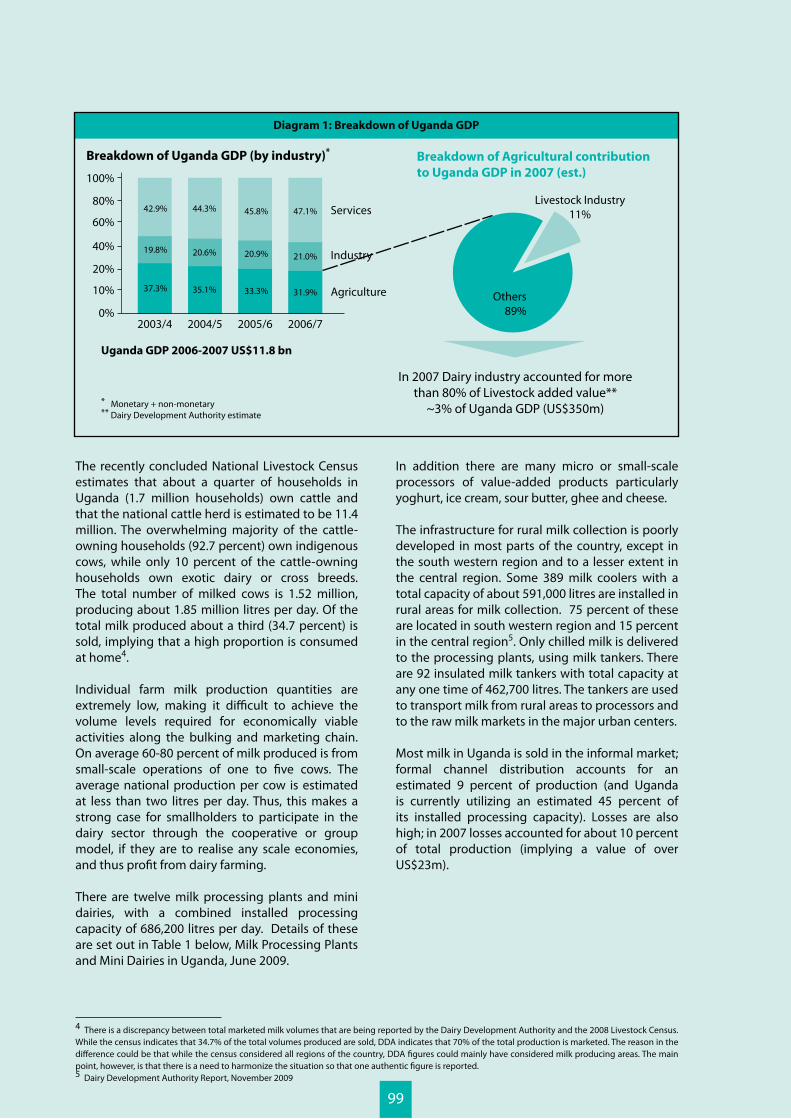
Uganda, with a population of 31m people, has an annual GDP of US$11.8 billion2. The agricultural sector accounts for about 42 percent of this, and the livestock industry makes up for 11 percent of Uganda’s agricultural GDP. Some 80 percent of the livestock GDP comes from the dairy industry, with an annual value of US$350m)3.
3.5 Dairy Investments by Smallholders
1 Author: William Matovu, East African Dairy Development Project2 Uganda Bureau of Statistics 20073 Ministry of Finance, Planning and Economic Development BACKGROUND TO THE BUDGET 2007 - 2008, DDA, Overview Of The Status Of Uganda’s Dairy Industry, EADD Analysis, 2008
1
98
The recently concluded National Livestock Census estimates that about a quarter of households in Uganda (1.7 million households) own cattle and that the national cattle herd is estimated to be 11.4 million. The overwhelming majority of the cattle-owning households (92.7 percent) own indigenous cows, while only 10 percent of the cattle-owning households own exotic dairy or cross breeds. The total number of milked cows is 1.52 million, producing about 1.85 million litres per day. Of the total milk produced about a third (34.7 percent) is sold, implying that a high proportion is consumed at home4.
Individual farm milk production quantities are extremely low, making it difficult to achieve the volume levels required for economically viable activities along the bulking and marketing chain. On average 60-80 percent of milk produced is from small-scale operations of one to five cows. The average national production per cow is estimated at less than two litres per day. Thus, this makes a strong case for smallholders to participate in the dairy sector through the cooperative or group model, if they are to realise any scale economies, and thus profit from dairy farming.
There are twelve milk processing plants and mini dairies, with a combined installed processing capacity of 686,200 litres per day. Details of these are set out in Table 1 below, Milk Processing Plants and Mini Dairies in Uganda, June 2009.
Breakdown of Uganda GDP (by industry)*
Uganda GDP 2006-2007 US$11.8 bn
Services
Industry
Agriculture
In 2007 Dairy industry accounted for morethan 80% of Livestock added value**
~3% of Uganda GDP (US$350m)
Diagram 1: Breakdown of Uganda GDP
2003/4 2004/5 2005/6 2006/70%
10%
20%
40%
60%
80%
100%
42.9%
19.8%
37.3%
44.3%
20.6%
35.1%
45.8%
20.9%
33.3%
47.1%
21.0%
31.9%
Breakdown of Agricultural contribution
to Uganda GDP in 2007 (est.)
Livestock Industry11%
Others89%
* Monetary + non-monetary** Dairy Development Authority estimate
In addition there are many micro or small-scale processors of value-added products particularly yoghurt, ice cream, sour butter, ghee and cheese.
The infrastructure for rural milk collection is poorly developed in most parts of the country, except in the south western region and to a lesser extent in the central region. Some 389 milk coolers with a total capacity of about 591,000 litres are installed in rural areas for milk collection. 75 percent of these are located in south western region and 15 percent in the central region5. Only chilled milk is delivered to the processing plants, using milk tankers. There are 92 insulated milk tankers with total capacity at any one time of 462,700 litres. The tankers are used to transport milk from rural areas to processors and to the raw milk markets in the major urban centers.
Most milk in Uganda is sold in the informal market; formal channel distribution accounts for an estimated 9 percent of production (and Uganda is currently utilizing an estimated 45 percent of its installed processing capacity). Losses are also high; in 2007 losses accounted for about 10 percent of total production (implying a value of over US$23m).
4 There is a discrepancy between total marketed milk volumes that are being reported by the Dairy Development Authority and the 2008 Livestock Census. While the census indicates that 34.7% of the total volumes produced are sold, DDA indicates that 70% of the total production is marketed. The reason in the difference could be that while the census considered all regions of the country, DDA figures could mainly have considered milk producing areas. The main point, however, is that there is a need to harmonize the situation so that one authentic figure is reported. 5 Dairy Development Authority Report, November 2009
99
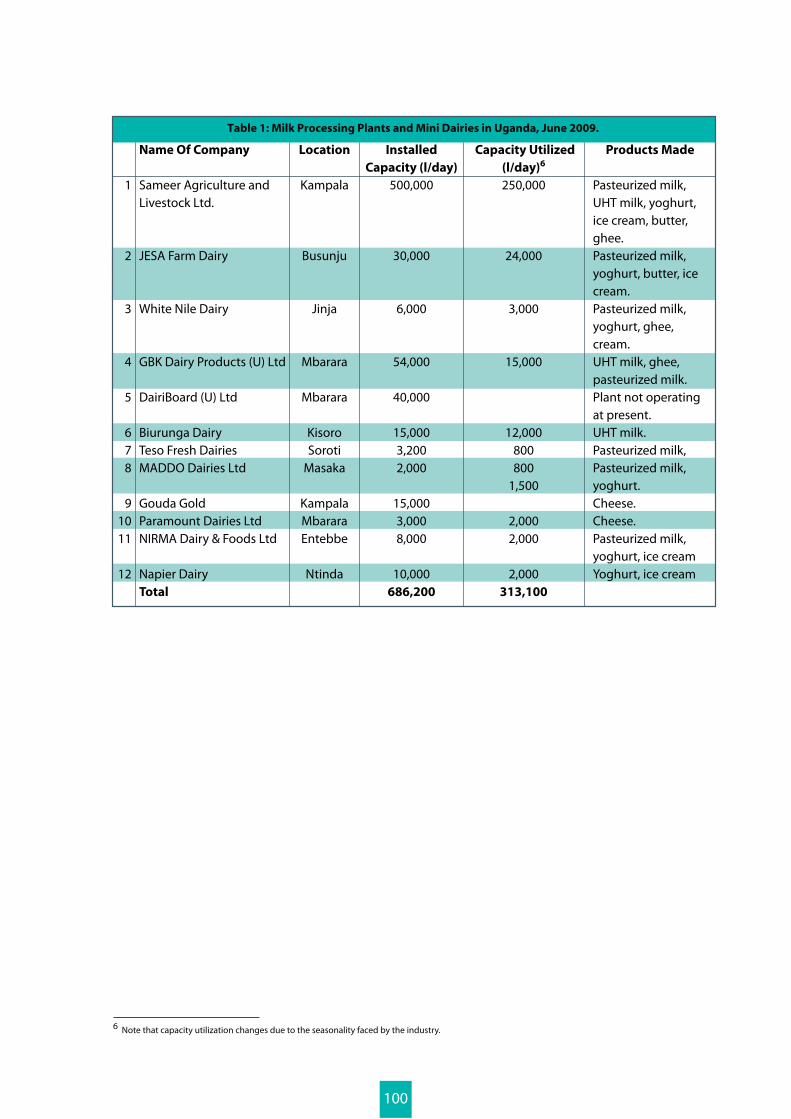
6 Note that capacity utilization changes due to the seasonality faced by the industry.
Table 1: Milk Processing Plants and Mini Dairies in Uganda, June 2009.
1
2
3
4
5
678
91011
12
Name Of Company
Sameer Agriculture and Livestock Ltd.
JESA Farm Dairy
White Nile Dairy
GBK Dairy Products (U) Ltd
DairiBoard (U) Ltd
Biurunga DairyTeso Fresh DairiesMADDO Dairies Ltd
Gouda GoldParamount Dairies LtdNIRMA Dairy & Foods Ltd
Napier DairyTotal
Location
Kampala
Busunju
Jinja
Mbarara
Mbarara
KisoroSoroti
Masaka
KampalaMbararaEntebbe
Ntinda
Installed
Capacity (l/day)
500,000
30,000
6,000
54,000
40,000
15,0003,2002,000
15,0003,0008,000
10,000686,200
Capacity Utilized
(l/day)6
250,000
24,000
3,000
15,000
12,000800800
1,500
2,0002,000
2,000313,100
Products Made
Pasteurized milk, UHT milk, yoghurt, ice cream, butter, ghee.Pasteurized milk, yoghurt, butter, ice cream.Pasteurized milk, yoghurt, ghee, cream.UHT milk, ghee, pasteurized milk.Plant not operating at present.UHT milk.Pasteurized milk,Pasteurized milk, yoghurt.Cheese.Cheese.Pasteurized milk, yoghurt, ice creamYoghurt, ice cream
100
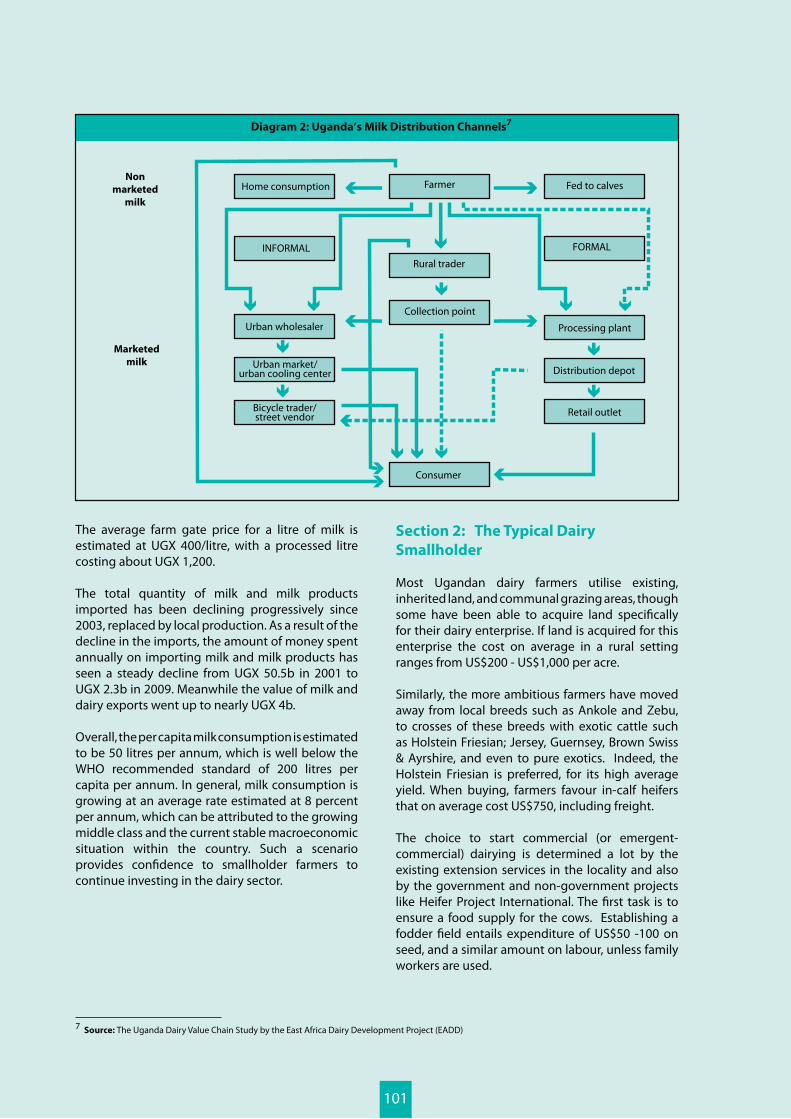
The average farm gate price for a litre of milk is estimated at UGX 400/litre, with a processed litre costing about UGX 1,200.
The total quantity of milk and milk products imported has been declining progressively since 2003, replaced by local production. As a result of the decline in the imports, the amount of money spent annually on importing milk and milk products has seen a steady decline from UGX 50.5b in 2001 to UGX 2.3b in 2009. Meanwhile the value of milk and dairy exports went up to nearly UGX 4b.
Overall, the per capita milk consumption is estimated to be 50 litres per annum, which is well below the WHO recommended standard of 200 litres per capita per annum. In general, milk consumption is growing at an average rate estimated at 8 percent per annum, which can be attributed to the growing middle class and the current stable macroeconomic situation within the country. Such a scenario provides confidence to smallholder farmers to continue investing in the dairy sector.
Section 2: The Typical Dairy
Smallholder
Most Ugandan dairy farmers utilise existing, inherited land, and communal grazing areas, though some have been able to acquire land specifically for their dairy enterprise. If land is acquired for this enterprise the cost on average in a rural setting ranges from US$200 - US$1,000 per acre.
Similarly, the more ambitious farmers have moved away from local breeds such as Ankole and Zebu, to crosses of these breeds with exotic cattle such as Holstein Friesian; Jersey, Guernsey, Brown Swiss & Ayrshire, and even to pure exotics. Indeed, the Holstein Friesian is preferred, for its high average yield. When buying, farmers favour in-calf heifers that on average cost US$750, including freight.
The choice to start commercial (or emergent-commercial) dairying is determined a lot by the existing extension services in the locality and also by the government and non-government projects like Heifer Project International. The first task is to ensure a food supply for the cows. Establishing a fodder field entails expenditure of US$50 -100 on seed, and a similar amount on labour, unless family workers are used.
Diagram 2: Uganda’s Milk Distribution Channels7
Non
marketed
milk
FarmerHome consumption Fed to calves
Marketed
milk
Consumer
FORMALINFORMAL
Urban wholesaler
Urban market/urban cooling center
Bicycle trader/street vendor
Collection point
Rural trader
Processing plant
Distribution depot
Retail outlet
7 Source: The Uganda Dairy Value Chain Study by the East Africa Dairy Development Project (EADD)
101
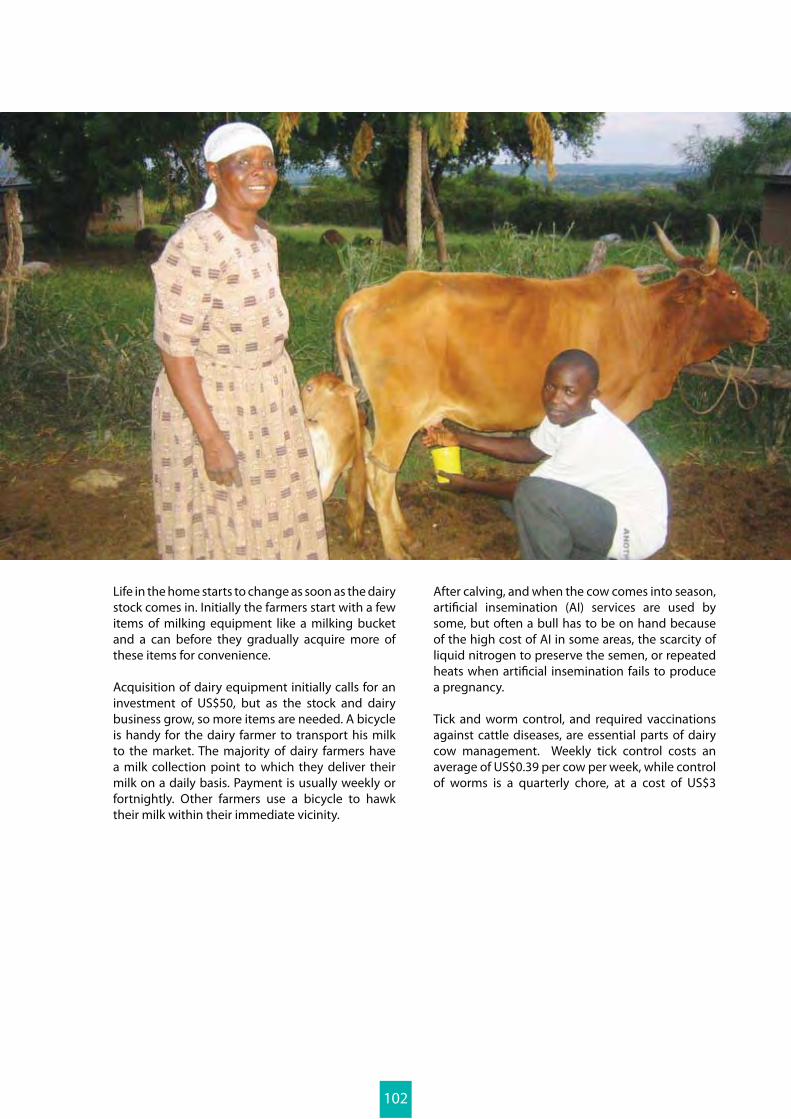
Life in the home starts to change as soon as the dairy stock comes in. Initially the farmers start with a few items of milking equipment like a milking bucket and a can before they gradually acquire more of these items for convenience.
Acquisition of dairy equipment initially calls for an investment of US$50, but as the stock and dairy business grow, so more items are needed. A bicycle is handy for the dairy farmer to transport his milk to the market. The majority of dairy farmers have a milk collection point to which they deliver their milk on a daily basis. Payment is usually weekly or fortnightly. Other farmers use a bicycle to hawk their milk within their immediate vicinity.
After calving, and when the cow comes into season, artificial insemination (AI) services are used by some, but often a bull has to be on hand because of the high cost of AI in some areas, the scarcity of liquid nitrogen to preserve the semen, or repeated heats when artificial insemination fails to produce a pregnancy.
Tick and worm control, and required vaccinations against cattle diseases, are essential parts of dairy cow management. Weekly tick control costs an average of US$0.39 per cow per week, while control of worms is a quarterly chore, at a cost of US$3
102
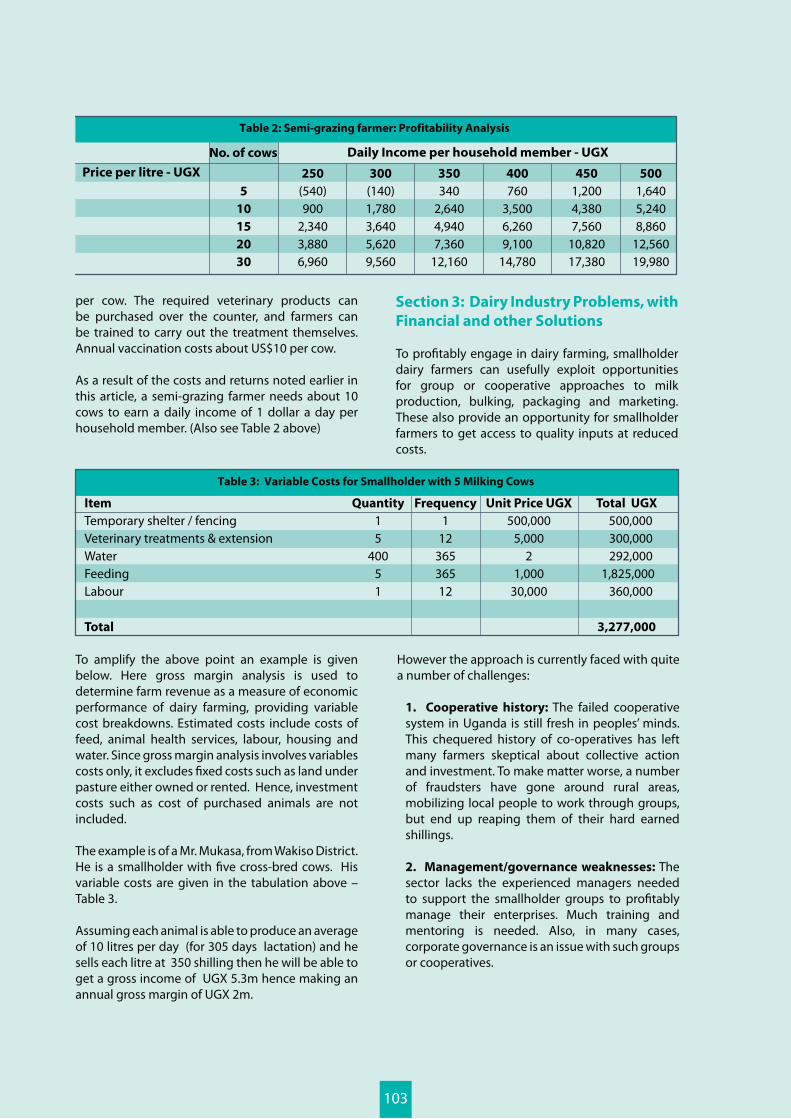
per cow. The required veterinary products can be purchased over the counter, and farmers can be trained to carry out the treatment themselves. Annual vaccination costs about US$10 per cow.
As a result of the costs and returns noted earlier in this article, a semi-grazing farmer needs about 10 cows to earn a daily income of 1 dollar a day per household member. (Also see Table 2 above)
Table 2: Semi-grazing farmer: Profitability Analysis
Daily Income per household member - UGXNo. of cows
Price per litre - UGX
5
10
15
20
30
250
(540)900
2,3403,8806,960
400
7603,5006,2609,100
14,780
300
(140)1,7803,6405,6209,560
350
3402,6404,9407,360
12,160
450
1,2004,3807,560
10,82017,380
500
1,6405,2408,860
12,56019,980
Table 3: Variable Costs for Smallholder with 5 Milking Cows
Item
Temporary shelter / fencingVeterinary treatments & extensionWaterFeedingLabour
Total
Quantity
15
40051
Frequency
112
36536512
Unit Price UGX
500,0005,000
21,000
30,000
Total UGX
500,000 300,000 292,000 1,825,000 360,000
3,277,000
To amplify the above point an example is given below. Here gross margin analysis is used to determine farm revenue as a measure of economic performance of dairy farming, providing variable cost breakdowns. Estimated costs include costs of feed, animal health services, labour, housing and water. Since gross margin analysis involves variables costs only, it excludes fixed costs such as land under pasture either owned or rented. Hence, investment costs such as cost of purchased animals are not included.
The example is of a Mr. Mukasa, from Wakiso District. He is a smallholder with five cross-bred cows. His variable costs are given in the tabulation above – Table 3. Assuming each animal is able to produce an average of 10 litres per day (for 305 days lactation) and he sells each litre at 350 shilling then he will be able to get a gross income of UGX 5.3m hence making an annual gross margin of UGX 2m.
Section 3: Dairy Industry Problems, with
Financial and other Solutions
To profitably engage in dairy farming, smallholder dairy farmers can usefully exploit opportunities for group or cooperative approaches to milk production, bulking, packaging and marketing. These also provide an opportunity for smallholder farmers to get access to quality inputs at reduced costs.
However the approach is currently faced with quite a number of challenges:
1. Cooperative history: The failed cooperative system in Uganda is still fresh in peoples’ minds. This chequered history of co-operatives has left many farmers skeptical about collective action and investment. To make matter worse, a number of fraudsters have gone around rural areas, mobilizing local people to work through groups, but end up reaping them of their hard earned shillings.
2. Management/governance weaknesses: The sector lacks the experienced managers needed to support the smallholder groups to profitably manage their enterprises. Much training and mentoring is needed. Also, in many cases, corporate governance is an issue with such groups or cooperatives.
103
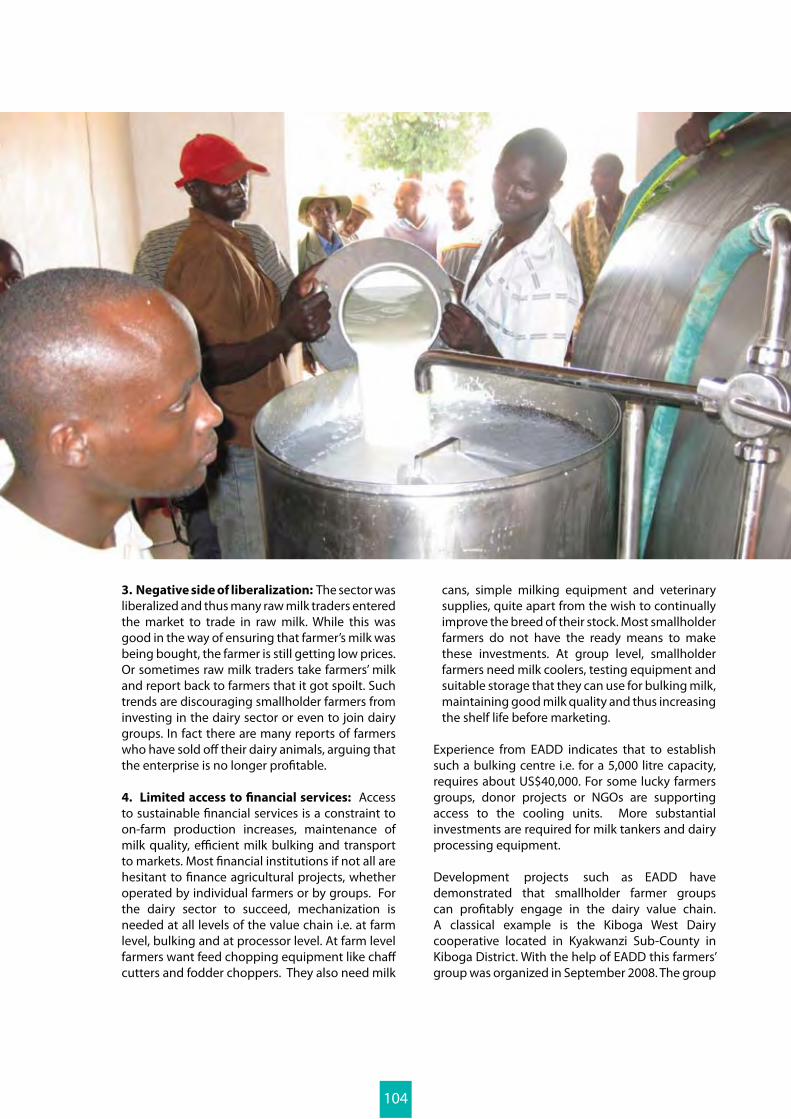
3. Negative side of liberalization: The sector was liberalized and thus many raw milk traders entered the market to trade in raw milk. While this was good in the way of ensuring that farmer’s milk was being bought, the farmer is still getting low prices. Or sometimes raw milk traders take farmers’ milk and report back to farmers that it got spoilt. Such trends are discouraging smallholder farmers from investing in the dairy sector or even to join dairy groups. In fact there are many reports of farmers who have sold off their dairy animals, arguing that the enterprise is no longer profitable.
4. Limited access to financial services: Access to sustainable financial services is a constraint to on-farm production increases, maintenance of milk quality, efficient milk bulking and transport to markets. Most financial institutions if not all are hesitant to finance agricultural projects, whether operated by individual farmers or by groups. For the dairy sector to succeed, mechanization is needed at all levels of the value chain i.e. at farm level, bulking and at processor level. At farm level farmers want feed chopping equipment like chaff cutters and fodder choppers. They also need milk
cans, simple milking equipment and veterinary supplies, quite apart from the wish to continually improve the breed of their stock. Most smallholder farmers do not have the ready means to make these investments. At group level, smallholder farmers need milk coolers, testing equipment and suitable storage that they can use for bulking milk, maintaining good milk quality and thus increasing the shelf life before marketing.
Experience from EADD indicates that to establish such a bulking centre i.e. for a 5,000 litre capacity, requires about US$40,000. For some lucky farmers groups, donor projects or NGOs are supporting access to the cooling units. More substantial investments are required for milk tankers and dairy processing equipment.
Development projects such as EADD have demonstrated that smallholder farmer groups can profitably engage in the dairy value chain. A classical example is the Kiboga West Dairy cooperative located in Kyakwanzi Sub-County in Kiboga District. With the help of EADD this farmers’ group was organized in September 2008. The group
104
started with 100 members and was supported to register as a cooperative. EADD enabled the coop to draw up a business plan for establishing a 5,000 litre capacity collection centre. The project required the coop members to mobilize 10 percent of the total equity needed to invest in the business. The project also supported the coop in mobilizing both this 10 percent and also additional members. EADD then pre-financed the investment with 90 percent equity. The chilling plant thus established will lead to the creation of a hub of services that smallholder farmers need in order to profitably engage in dairy production. The dairy hub will serve as a community anchor for industry knowledge, business services and market access.
Fully functioning, the dairy hub is a dynamic cluster of services and activities that generate greater income for dairy farmers. Through the hubs, the quality of milk passing through the raw milk market will be improved and access to formal markets will be facilitated through farmer owned-and-operated chilling plants.
In Kyakwanzi the cooperative started bulking milk in April 2009. By then a litre of milk was being bought by raw milk traders for UGX 200. Because of the introduction of the chilling plant farmers are now currently enjoying a price of UGX 350 in a flush season and about UGX 500 in a dry season. Smallholder farmers are now assured of sustainable access to markets throughout the year, which was not the case before. Income generated by the Kiboga West Livestock Cooperative Society Limited located in Kyakwanzi, Kiboga district, is shared among 629 supplying farmers. Milk is sold to Sameer Agriculture and Livestock Limited (SALL).
Section 4: Promising Ways to Improve
Financial Services for the Dairy Industry
Dairy farmers utilise both local SACCOs and banks for savings deposit services. The extent to which these are used is not known.
Loans to support investment come from many sources. Within the value chain there is some assistance with investment. For example, the dairy processor Sameer provides milk cans to farmers (those organized in groups and selling milk to Sameer) on credit and they pay in installments.
Generally financial institutions in Uganda are hesitant to finance small holder farmers. While some
financial institutions like ECLOF, and Centenary Bank have designed products that target farmers, the intended clientele are either ignorant of these services or they find the conditions unsuitable and unattractive - especially the interest rates and short term tenor of the loans offered.
To move forward, a number of approaches are suggested that can motivate financial institutions to support dairy farmers in Uganda.
1. Contract farming: As noted, many processors are producing under capacity due to lack of enough milk. The sector has to face problems of seasonality and this causes fluctuating farmer gate and retail prices. To ensure steady supply of raw material throughout the year, it will be strategic for processors to introduce contract farming. This would enable processors to be assured of an adequate supply for their plants. Apart from providing milk cans to farmers, they may consider assisting with finance for upgrading herds in terms of breed, as well as with other on-farm investments. Repayment will be automatic deduction from milk payments.
2. Hub formation: EADD (East African Dairy Development Project – funded by the Gates Foundation) has designed a hub model that focuses the services to dairy farmers around a central facility or hub. Hubs can effectively connect rural farmers with business services, industry knowledge and, most critically, to formal and to improved traditional markets. A chilling-plant hub typically starts with 500 farmers, but can grow to some 5,000 farmers. They are organized as a single dairy farmer business association (DFBA). A DFBA is a legally registered or recognized organization, formed for the purpose of building and operating a chilling plant or major milk collection centre, and/or developing the associated hub services. It is estimated that a minimum throughput of 5,000 litres per day is needed to be self-sustaining and profitable.
Milk cooling using the chilling plant is essential for formal market access by dairying smallholders, as their geographic location does not permit them to sell milk in major markets without bulking, cooling and transportation. Without a chilling plant, farmers have the traditional market as their only option for milk sales, limiting their distribution to neighbours or markets within a two-hour or 60 kilometer radius—the typical range in which un-chilled milk can travel without spoilage.
105
To be efficient and profitable, chilling plant operations require the DFBA and plant management to have business management skills. These two management teams set and maintain milk quality standards that are largely absent or not enforced at the national level. Raising the quality standards of milk will determine the potential for the country’s dairy industries to establish viable national and international markets. Investors in new processing operations can only develop value-added products if quality milk is available.
As the market agent, the plant management must develop skills in negotiating with processors and meeting supply contracts. Using information and communication systems, management can serve farmers with relevant market information. The chilling-plant hub includes dairy enterprise inputs, commercial and financial services required for farmers to grow their business. These business development services (BDS) are attracted or developed by training providers in small-business delivery and management, and by educating farmers in the business advantages of using these services. Service providers may include breeders
and artificial inseminators, agro-vet shops and community animal health providers, feed suppliers, credit and financial institutions, and savings and money management services. Using a BDS model improves service delivery and generates income for the individual farmer, cooperative and service supplier. As a sustainable approach, the hub develops the service sector, promoting commercial transactions between service providers and farmers.
In the baseline survey conducted by EADD in 2008, 253 Ugandan smallholder dairy farmers were interviewed on their borrowing history. Among this group only three had obtained a long term loan for dairy activities, while four indicated that they received finance from projects/NGOs and only one received credit from a microfinance institution. This gives some indication of the extent to which financial institutions are not financing smallholder dairy enterprises.
Though not a lot of work has been done on the loan amounts and loan tenors for which there is effective demand within the industry, based on the costings
106
in Table 3 (variable costs) and the fixed costs which smallholder farmers face in dairying, loan amounts may range between $2,760 to $6,935, for between one and two years. This is for a 1-5 dairy animals smallholder who basically is just starting up dairying. Most times, smallholders just need a real incentive to invest more from their own resources, thus reducing their borrowing needs.
On the other hand smallholders in their associations/cooperatives/groups also desire to invest in milk collection centers. Based on the business plans EADD has been formulating for various farmers’ groups, loan amounts to establish standard milk collection centres range between $32,368 to $134,210, and the repayment period runs between 4 to 6 years. EADD experience working with these farmer groups indicates that running a milk bulking centre is a profitable enterprise and thus farmer groups can ably pay back in time if the centre is well managed.
In conclusion, financing difficulties for dairy ventures is a major barrier to growth. Addressing this issue is critical to the success of the industry. In Uganda, farmers face interest rates of 25 to 30 percent, representing a substantial barrier to industry growth.
There is ample evidence to suggest that smallholder dairy producers are competitive generally. In this respect:
Evidence shows that smallholder producers remain viable, particularly when opportunity costs of labour are low.
Land holding size is demonstrated to not generally form a barrier to smallholder entry into dairying, due to access to fodder cut from public areas or supplied by the market.
There are few economies of scale in milk production in Uganda. Although large scale producers show higher levels of returns overall, unit profitability in milk production is not significantly different between large and small producers.
Infrastructure remains a major constraint to smallholder market participation, particularly poor-quality feeder roads
Note should be taken that dairy income consists of revenues from selling milk, cattle, manure and feeds, together with the imputed value of milk consumed on-farm. Properly managed, the income streams from dairying are a good foundation for dairy smallholders to be satisfactory borrowers from financial institutions.
107

108