Chapter PHYSICOCHEMICAL PROFILING IN DRUG RESEARCH …
59
1 Chapter PHYSICOCHEMICAL PROFILING IN DRUG RESEARCH AND DEVELOPMENT Krisztina Takács‐Novák Contents 1.1. INTRODUCTION ........................................................................................................................................... 3 1.2. THEORETICAL BACKGROUND .............................................................................................................. 6 1.2.1. The physical‐chemistry of drug action ................................................................................ 6 1.2.2. Physicochemical parameters ................................................................................................... 8 1.2.2.1. Ionization (pK a )............................................................................................................. 8 1.2.2.2. Solubility (log S) ........................................................................................................ 17 1.2.2.3. Lipophilicity (log P).................................................................................................. 20 1. 3. METHODS FOR PHYSICOCHEMICAL PROFILING....................................................................... 25 1.3.1. pK a determination ...................................................................................................................... 25 1.3.1.1. Potentiometric method .......................................................................................... 26 1.3.1.2. UV/pH titration .......................................................................................................... 27 1.3.1.3. Other methods............................................................................................................ 28 1.3.1.4. Co‐solvent method.................................................................................................... 30 1.3.1.5. Decision tree for method selection ................................................................... 31
Transcript of Chapter PHYSICOCHEMICAL PROFILING IN DRUG RESEARCH …
1
Chapter
PHYSICOCHEMICALPROFILINGINDRUGRESEARCHANDDEVELOPMENT
KrisztinaTakács‐Novák
Contents
1.1. INTRODUCTION...........................................................................................................................................3
1.2. THEORETICALBACKGROUND..............................................................................................................6 1.2.1. Thephysical‐chemistryofdrugaction................................................................................6 1.2.2. Physicochemicalparameters...................................................................................................8
1.2.2.1. Ionization(pKa).............................................................................................................8 1.2.2.2. Solubility(logS)........................................................................................................17 1.2.2.3. Lipophilicity(logP)..................................................................................................20
1.3. METHODSFORPHYSICOCHEMICALPROFILING.......................................................................25 1.3.1. pKadetermination......................................................................................................................25
1.3.1.1. Potentiometricmethod..........................................................................................26 1.3.1.2. UV/pHtitration..........................................................................................................27 1.3.1.3. Othermethods............................................................................................................28 1.3.1.4. Co‐solventmethod....................................................................................................30 1.3.1.5. Decisiontreeformethodselection...................................................................31

Chapter1
2
1.3.2. logSdetermination....................................................................................................................32 1.3.2.1. Methodsfordeterminationofkineticsolubility..........................................32 1.3.2.2. Methodsfordeterminationofequilibriumsolubility...............................33
1.3.2.2.1. Saturationshake‐flaskmethod(SSF).............................................33 1.3.2.2.2. Potentiometricmethods........................................................................34 1.3.2.2.3. μDISSmethod.............................................................................................35 1.3.2.2.4. Highthroughputmethods....................................................................35
1.3.2.3. Specialapplications..................................................................................................36 1.3.3. logPdetermination....................................................................................................................37
1.3.3.1. Shake‐flask(SF)method........................................................................................37 1.3.3.2. Potentiometricmethod...........................................................................................38 1.3.3.3. IndirectlogPmeasurementmethods..............................................................39 1.3.3.4. Highthroughputmethods.....................................................................................39 1.3.3.5. Decisiontreeformethodselection....................................................................40
1.4. CASESTUDIES............................................................................................................................................41 1.4.1. pKadetermination.......................................................................................................................41 1.4.2. logSdetermination....................................................................................................................44 1.4.3. logPdetermination....................................................................................................................49
1.5. OUTLOOK.....................................................................................................................................................52
Acknowledgement..............................................................................................................................................52
REFERENCES.........................................................................................................................................................52

3
1.1. INTRODUCTION
Thepurposeofdrugresearchistodevelopeffective,safe,andhighqualitynewmedicines to treat diseaseswhere no drugs or otherwise nonoptimal ones areavailable.Thisactivityisverycomplex,lengthy,expensive,andrisky.Sincedrugresearchbecame industrialized, the highest level of scientific and technologicalknowledge has been appliedduring the given era. Fundamentally, the industryusesandputs intothepracticethenewestscientificresultsasearlyaspossiblethusdrugresearch itselfbecomesthedrivingforce forthedevelopmentofnewtheories,technologies,andmethods[1].
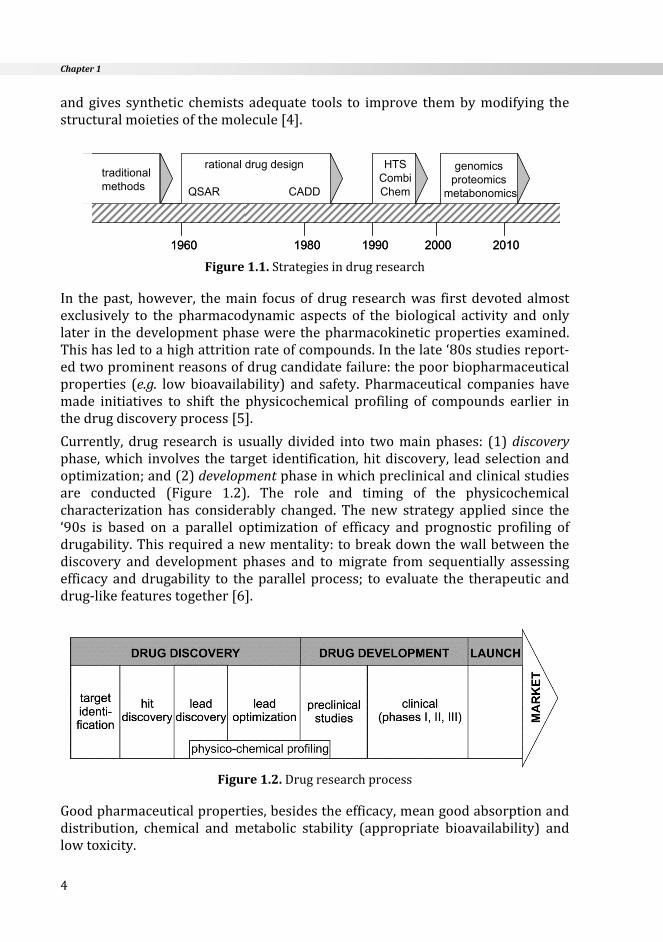
Takingalookbackatthehistoryofdrugresearch,onecanrecognizeonthelongwayof theevolutionof thepresentsystemsomemilestones,paradigm‐changeswhichresultedinconsiderabledevelopmentinitsage(Figure1.1).Inthe‘60softhelastcentury,theformerlyusedtraditionalmethods(suchastheextractionofactivecompoundsfrommedicinalplants;randomscreening,trial‐errormethod;side‐effectobservation; serendipity,etc.)moreor lesshavebeenreplacedoratleast extended by the new strategy of rationaldrugdesign. Its first applicationwastheQuantitativeStructure‐ActivityRelationships(QSAR)analysisintroducedbyC.Hansch[2]andbasedontheaccumulatedknowledgeofstructure‐activityrelationships.Therationaldrugdesignwascompletedwiththeapplicationof3Dmolecularmodeling, theoretical and computational chemistry (ComputerAidedDrugDesign,CADD)andprovedtobeamoreeffectivetoolthanpreviousonesinthediscoveryandoptimizationofnewactivemolecules.Theappearanceandfastexpansionofhighthroughputscreening(HTS)andcombinatorialchemistryinthe‘90shavegreatlyenhancedthenumberofactivecompoundsfound[3].Thelatestparadigm‐changewasprovokedbythehumangenomeprojectandtheincreasednumber of potential targets identified by genomics. However, these changes inthe research strategy did not mean that former methods were completelyneglected,indeedamajorityofthemareaninherentpartofdrugresearch.Eachmethodhasitsappropriateuseandimportanceinit.
Sincethefirstrecognitionsofstructure‐activityrelationships,medicinalchemistsinvolved in drug research have been always paying outstanding attention tothose properties of drugs which determine their pharmacological action. Theknowledge of solubility, ionization ability and lipophilicity of drug candidatesprovides useful information about the expectable pharmacokinetic properties
Chapter1
4
andgives synthetic chemists adequate tools to improve thembymodifying thestructuralmoietiesofthemolecule[4].
Figure1.1.Strategiesindrugresearch
In thepast, however, themain focusofdrug researchwas firstdevotedalmostexclusively to the pharmacodynamic aspects of the biological activity and onlylater inthedevelopmentphasewerethepharmacokineticpropertiesexamined.Thishasledtoahighattritionrateofcompounds.Inthelate‘80sstudiesreport‐edtwoprominentreasonsofdrugcandidatefailure:thepoorbiopharmaceuticalproperties (e.g. lowbioavailability) and safety. Pharmaceutical companies havemade initiatives to shift the physicochemical profiling of compounds earlier inthedrugdiscoveryprocess[5].
Currently, drug research is usuallydivided into twomainphases: (1)discoveryphase,which involves the target identification,hitdiscovery, leadselectionandoptimization;and(2)developmentphaseinwhichpreclinicalandclinicalstudiesare conducted (Figure 1.2). The role and timing of the physicochemicalcharacterization has considerably changed. The new strategy applied since the‘90s is based on a parallel optimization of efficacy and prognostic profiling ofdrugability.Thisrequiredanewmentality:tobreakdownthewallbetweenthediscovery and development phases and tomigrate from sequentially assessingefficacyanddrugability to theparallelprocess; to evaluate the therapeutic anddrug‐likefeaturestogether[6].
Figure1.2.Drugresearchprocess
Goodpharmaceuticalproperties,besidestheefficacy,meangoodabsorptionanddistribution, chemical and metabolic stability (appropriate bioavailability) andlowtoxicity.
1960 1980 1990 2000 2010
traditionalmethods
rational drug design
QSAR CADD
HTSCombiChem
genomicsproteomics
metabonomics
1960 1980 1990 2000 2010
traditionalmethods
rational drug design
QSAR CADD
HTSCombiChem
genomicsproteomics
metabonomics
Physicochemicalprofilingindrugresearchanddevelopment
5
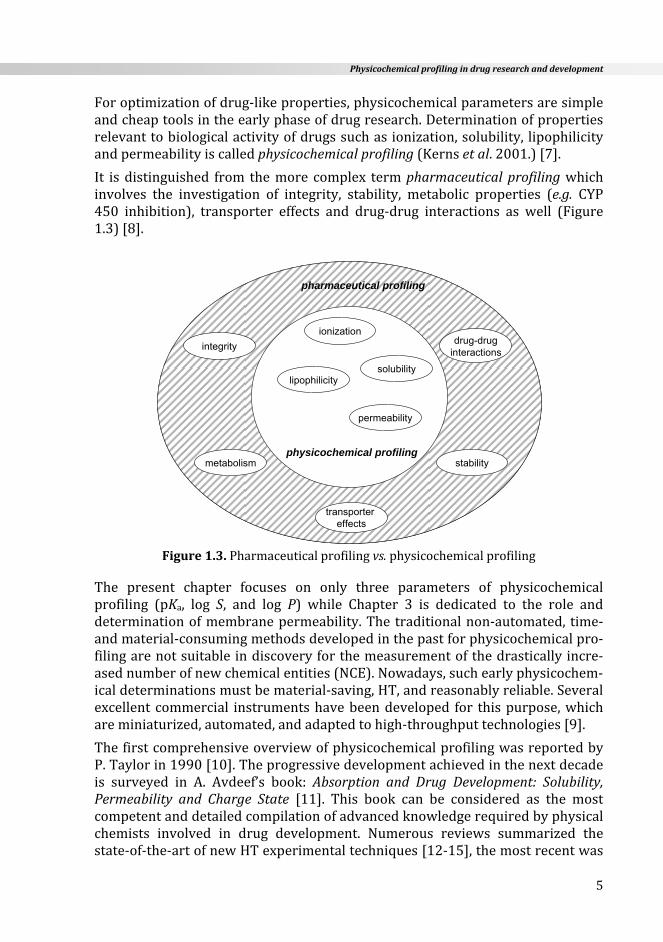
Foroptimizationofdrug‐likeproperties,physicochemicalparametersaresimpleandcheaptoolsintheearlyphaseofdrugresearch.Determinationofpropertiesrelevanttobiologicalactivityofdrugssuchasionization,solubility, lipophilicityandpermeabilityiscalledphysicochemicalprofiling(Kernsetal.2001.)[7].
It isdistinguished from themore complex termpharmaceuticalprofilingwhichinvolves the investigation of integrity, stability, metabolic properties (e.g. CYP450 inhibition), transporter effects and drug‐drug interactions as well (Figure1.3)[8].
Figure1.3.Pharmaceuticalprofilingvs.physicochemicalprofiling
The present chapter focuses on only three parameters of physicochemicalprofiling (pKa, log S, and log P) while Chapter 3 is dedicated to the role anddeterminationofmembranepermeability.Thetraditionalnon‐automated, time‐andmaterial‐consumingmethodsdevelopedinthepastforphysicochemicalpro‐filingarenotsuitableindiscoveryforthemeasurementofthedrastically incre‐asednumberofnewchemicalentities(NCE).Nowadays,suchearlyphysicochem‐icaldeterminationsmustbematerial‐saving,HT,andreasonablyreliable.Severalexcellentcommercial instrumentshavebeendeveloped for thispurpose,whichareminiaturized,automated,andadaptedtohigh‐throughputtechnologies[9].
ThefirstcomprehensiveoverviewofphysicochemicalprofilingwasreportedbyP.Taylorin1990[10].Theprogressivedevelopmentachievedinthenextdecadeis surveyed in A. Avdeef’s book: Absorption and Drug Development: Solubility,Permeability and Charge State [11]. This book can be considered as the mostcompetentanddetailedcompilationofadvancedknowledgerequiredbyphysicalchemists involved in drug development. Numerous reviews summarized thestate‐of‐the‐artofnewHTexperimentaltechniques[12‐15],themostrecentwas
ionization
lipophilicitysolubility
permeability
physicochemical profiling
pharmaceutical profiling
integrity
metabolism
transportereffects
stability
drug-druginteractions
ionization
lipophilicitysolubility
permeability
physicochemical profiling
pharmaceutical profiling
integrity
metabolism
transportereffects
stability
drug-druginteractions

Chapter1
6
publishedbyY.Henchozetal.[16].So,variousliteraturesourcesareavailableforall who would expand their understanding of physicochemical profilingaccordingtotheirneed.
Theaimofthischapteristoprovide:(i)aconcisesummaryoftheoreticalback‐ground; (ii) a comparison of different experimental methods and approaches;(iii) an introduction to ample, useful, and practical examples. The case studiestaken from more than 30 years of experiences of the author are intended toprovidehelptophysicalchemistsintherightmethodselectionandmeasurementofdifficultmolecules.
1.2. THEORETICALBACKGROUND
1.2.1. Thephysicalchemistryofdrugaction
Drug action is a consequence of several chemical and biological processes inwhichbindingtothereceptor(pharmacodynamicphase)isessential.Besidesthishowever, the pharmacokinetic processes have also fundamental importance inthe biological activity. The active ingredient of a drugmust separate from theappliedpharmaceuticaldosageform,mustdissolveinbodyfluidsandpermeatethroughbiologicalmembranestoreachthereceptorsite.Followingthereceptorresponse, the active compound dissociating from the binding site generallyundergoesmetabolismand isexcreted fromthebody.These liberation,absorp‐tion, distribution, metabolism, excretion (LADME) features are mainly deter‐mined by the physicochemical properties of drugs, namely by ionization, solu‐bilityandlipophilicity.
Biological membranes are the main physiological permeation barriers to becrossedbydrugs.Structurally,theyhavealipidbilayerresultingfromtheorien‐tation of amphiprotic lipids (phospholipids, glycolipids, sphyngomyelin) andcholesterolintheaqueousmedium.Thisbilayerhassomeofthepropertiesofatwo‐dimensional fluid(fluid‐mosaicmembranemodel) inwhich individual lipidmolecules candiffuse rapidly in theplaneof theirmonolayer (lateralmobility)butcannoteasilypasstotheothermonolayer.Animportantobservationisthatphospholipids are asymmetrically distributed in the membrane. Generally, theouter (extracellular) half of the bilayer comprises mainly zwitterionic lipids(phosphatidylcholineandphosphatidylethanolamine),whereasthe inner(intra‐cellular) part contains negatively charged lipids (e.g., phosphatidylserine). Dif‐ferent proteins that induce transporter, signal transduction, ormetabolic func‐tionsareintegratedintothelipidbilayer[17,18].Thebiologicalmembranesareapolarbarriers,wheretherelativepermittivityinsideisextremelylow(ε~2).Ithas long been assumed that most drugs use transcellular transport and passthese barriers by passive diffusion which is favorable only for unionized,lipophiliccompounds.Thereareseveralothermechanismsofpermeation.Activetransport is ligand‐mediated by different transporters for compounds. Paracel‐lular permeation exists between the cells for smaller, more polar compounds.

Physicochemicalprofilingindrugresearchanddevelopment
7
Some compounds are transported by endocytosis, when the molecules areengulfed by the membrane and move through the cell in these membrane‐enclosedvesicles.For furtherdetailed information, the reader is encouraged toreviewspecializedresources[18,19].
ThepH‐partitionhypothesis[20]providesagoodmodelforthepassivetransportofionizablemoleculeswithsufficientlipophilicity.Figure1.4showsaschematicrepresentationof the transport of a basic (B) (e.g. papaverine, chlorpromazine,etc.)andanacidic(HA)(e.g.acetylsalicylicacid,ibuprofen,etc.)molecule.Intheextracellularaqueousmedium,theratioofionized([BH+]or[A‐])andunionized([B]or[HA])formsisdependentontheactualpHofthegivencompartmentandthe pKa of the compound. The uncharged, neutral species has much higherlipophilicitythanitscharged(ionic)form,thusitcanpermeatethroughthelipidmembraneevenifbeingpresentasaminorcomponent. Inmedicinalchemistrythisspeciesiscalledthe“transportform”.Enteringintotheintracellularaqueousphase,anotherionizationprocesstakesplaceresultingintheionizedformagainwhichgenerallyinteractswiththetargetandisreferredtoasthe“receptorform”.Theamountofthetransportformpresentatthemembranesurfacedependsonitssolubility.Moleculesmustbeinsolutioninordertodiffuseintothemembra‐nes,howeverlowsolubilitycanbea limitingfactorofpermeation.PermeabilityasadeterminantkineticparameteroftransportisdiscussedinChapter3.
Figure1.4.Transportandreceptorformsofanacidandabase
The conceptderived from thepH‐partition theory that “only neutralmoleculespermeatemembranes”startedtobequestionedfromthemid‘90sbecauseofanincreasing body of experimental evidence supporting ion‐partitioning intoartificialmembraneslikeliposomes[21].Thiswasinterpretedwithelectrostaticinteractions and hydrogen bonding between the charged group of compounds
AH A- + H+ BH+B + H+
AH A- + H+ BH+B + H+
receptor
pKa
pKaextracellular
intracellular
AH A- + H+ BH+B + H+
AH A- + H+ BH+B + H+
receptor
pKa
pKaextracellular
intracellular
Chapter1
8
and ionizedpolar head groupof phospholipids in the “pHpristonmodel” [22].Recently, S. Krämer and coworkers [23] reviewed the mechanisms underlyinglipid bilayer permeation. They proposed a kinetic “flip‐flopmodel” based on athree‐stepmechanism,namelythepartitioningintoonelipidlayer,translocation(flip‐flop) to the opposite lipid layer and partitioning into the aqueous phase.Accordingtothismodel,thepermeationofachargedspeciescouldbetheresultofoccasionallyoccurring trans‐membrane translocationofchargedcompounds.It was concluded that membrane permeation is more complex than expectedfromasimplediffusionmodelandpH‐partitionhypothesis.
Anotherpossiblemechanismoftransportforionized,hydrophiliccompoundsiscarrier‐mediated active transport. The increasing number of different uptaketransportersdiscoveredinthepast15yearshighlightstheimportanceoftheroleof active transport in membrane permeation of drugs which may be under‐estimated.Theirphysiological functionistodeliverthenecessarynutrientsandother endogenous biochemical compounds having low lipophilicity for passivediffusion to the cell. Several drugs were found to be the substrate of differentspecific transporters like oligopeptide (PEPT1: captopril, enalapril, ampicillin,acyclovir),organicanion(OATP1:fexofenadine,enalapril,temocaprilat),organiccation (OCT1: metformin, famotidin), or nucleoside, etc. [18,24]. The effluxtransporters (P‐glycoprotein, P‐gp; breast cancer resistance protein, BCRP;multidrugresistanceprotein,MRP2)assistinthemovementofcompoundsoutofthecellastheyprotect thecell frompotentially toxicxenobiotics.Thisoutwardtransporthasanegativeeffectonthepharmacokineticsofsomecompounds.Theactivity of efflux transporters is very intensive in the blood‐brain barrier andsometumorcellsresultinginmultidrugresistance.Bindingtothetransportersisdetermined by the chemical structure of compound. Similar moieties to thenatural substrate,a largenumberofH‐bondacceptors (N+Oatoms),andhighmolecularweight(Mw>400)appeartoincreasethelikelihoodofP‐gpefflux[25].
Physicochemical properties influencing the fate of a drug in the body aredescribed by the thermodynamic equilibrium constants. Below, we summarizethefundamentalsofpKa,logS,andlogPterms.
1.2.2. Physicochemicalparameters
1.2.2.1. Ionization(pKa)
Drugs aremultifunctional compounds.A greatmajority of themcontainoneormoreionizable(acidicorbasic)functionalgroups.Inaqueoussolutions,ionizablecompoundsexistindifferentionization(chargedoruncharged)statesdependingontheirstrengthofacidityorbasicityandthepHofthesolution.
Definitions,termsTheionizationconstant(oraciddissociationconstant),Ka,isusedtocharacterizethe acid‐base chemistry of a molecule generally expressed as a negative loga‐rithm:‐logKa=pKa.Inmedicinalchemistry,itiscommontousepKaforbothacids

Physicochemicalprofilingindrugresearchanddevelopment
9
andbases. Inaqueoussolutions, thepKascalespans from0to14.Thestrongertheacid, the lower is itspKa value.Theopposite is true forbases; ahigherpKavaluemeansstrongerbasicity[26].
Figure1.5.ThepKascaleinaqueousmedium
Some examples for the most frequently occurring acidic and basic functionalgroupsindrugsarelistedinTables1.1and1.2.
Equations1.1‐1.4showtheionizationequilibriaandtherelevantthermodynamicionization constants using general symbols: HA for acid, B for base, XH fordiproticampholytemolecule.
‐ +HA A +H
[A ][H ]
HAaK (1.1a,1.1b)
a
[HA]p pH log
[A ]K (1.1c)
+BH B+H
a
[B][H ]
[BH ]K (1.2a,1.2b)
0 14
0 14
CF3COOH
0.23
salicylicacid
2.88
diclofenac
3.99
phenobarbital
7.49
acetaminophen
9.63
increasing acidity
increasing basicity
caffeine
0.60
benzocaine
2.39
aminophenazone
5.06
papaverine
6.39
amlodipine 9.26propranolol 9.54ephedrine 9.60atropine 9.84
debrisoquine
13.01
0 14
0 14
0 140 14
0 140 14
CF3COOH
0.23
salicylicacid
2.88
diclofenac
3.99
phenobarbital
7.49
acetaminophen
9.63
increasing acidity
increasing basicity
caffeine
0.60
benzocaine
2.39
aminophenazone
5.06
papaverine
6.39
amlodipine 9.26propranolol 9.54ephedrine 9.60atropine 9.84
debrisoquine
13.01

Chapter1
10
Table1.1.Someimportantacidicfunctionalgroupsindrugsgroup name pKa example(pKa)
S
O
O
OH
sulphonicacid 0‐1 NNO
N CH3
CH3
CH3
HO3SCH2
metamizole
CO
OH
carboxyl 2‐7 COH
O
benzoicacid(3.98)
C COH
enol 2‐6 C
N
C
S
CNH
OOH
CH3
N
OO
piroxicam(2.33)
NNN
N
H
tetrazole 4‐5
N N
NH
N
N
HOOCO
H3C
CH3
CH3
valsartan(4.8)
S
O
NHO
CO
sulphonimide 5‐6SH3C N
HC
O
O O
NH
C4
tolbutamide(5.3)
S
O
NH
O
N‐aryl‐‐sulphonamide 6‐8
S
O
H2N
O
NH N
NCH3
CH3
sulfadimidine(7.49)
NH
O
lactam 7‐8HN
CNH
CO
O
O
CH3
CH3
barbital(7.9)
OH
phenol 9‐11OHHN
COCH3
acetaminophen(9.63)
SH
thiol 8‐11N
OHS
COOH
CH3
captopril(9.8)

Physicochemicalprofilingindrugresearchanddevelopment
11
Table1.2.Someimportantbasicfunctionalgroupsindrugsgroup name pKa example(pKa)
HN CNH
HN
guanidine 13‐14
N NH
NH2 debrisoquine(13.0)
NH2
aliphaticprimaryamine
8‐11
NH2
OH
HO
HO
noradrenaline(8.5)
NH
aliphaticsecondaryamine
NH
OH
CH3
CH3
ephedrine(9.6)
N
aliphatictertiaryamine
CH3
CH3
C
O
N
CH3
CH3NH
lidocaine(7.9)
NH2
aromaticprimaryamine
2‐5
CO
CH3
OH2N
benzocaine(2.4)
NH
R
aromaticsecondaryamine
CO
OHN
CH3N
CH3
CH3 tetracaine(2.4)
N R
R'
aromatictertiaryamine
N
N
Cl
N
CH3
CH3
chloropyramine(2.0)

Chapter1
12
a
[BH ]p pH log
[B]K (1.2c)
+2XH XH+H
a1
2
[XH][H ]
[XH ]K (1.3a,1.3b)
‐ +XH X +H
2‐[X ][H ]XH aK (1.4a,1.4b)
2a1
[XH ]p pH log
[XH]K a2
[XH]p pH log
[X ]K (1.3c,1.4c)
Incertainresearcharticles,preferenceisgiventotheuseoftheionizationratherthan the proton association process and the term protonation constant, Kp,particularly in coordination chemistry [27]. The relationship between them isreciprocal where Ka= 1/Kp, or pKa = log Kp. For a monoprotic compound thisrelationshipisevident,butmaynotbeclearregardingmoleculeswithmorethanone ionizable group. Below,we describe the ionization processes of a triproticcompound (like amoxicillin) from both points of view: dissociation (moleculereleasestheproton)andassociation(moleculegainstheproton).
N
S
HOOC O
H3C
H3CNH
OOH
NH2
log Kp1= 9.6log Kp2= 7.4log Kp3= 2.4
Dissociation Protonation
a1K+ +
3 2XH XH +H p12‐ + ‐X +H XHK (1.5a,1.5b)
a2K +
2XH XH +H p2‐ +2XH +H XH
K (1.6a,1.6b)
a3K‐ 2‐ +XH X +H p3+ +2 3XH +H XH
K (1.7a,1.7b)
a1
p3
1K
K a2
p2
1K
K a3
p1
1K
K (1.8a,1.8b,1.8c)
pKa1=logKp3pKa2=logKp2pKa3=logKp1 (1.9a,1.9b,1.9c)
Physicochemicalprofilingindrugresearchanddevelopment
13
Ionizationmicroconstants
Theequilibriaabovecharacterizethedissociation/protonationof themoleculeatthemolecular level, socalledmacroscopic level,using ionizationmacroconstants.Ionizationmacroconstantsquantitate theoverallacidity/basicityof themolecule,butcannotbeassignedtoindividualprotonbindingsitesofmultiproticmolecules.IonizationmicroconstantsarethetermswhichdescribetheprotonbindingabilityoftheindividualfunctionalgroupsandareusefulincalculatingthepH‐dependentconcentrationsofmicrospecies(namedmicrospeciation)[28].Inthepastdecade,themicrospeciationofseveraldrugmoleculeswaspublished[e.g.29‐31].
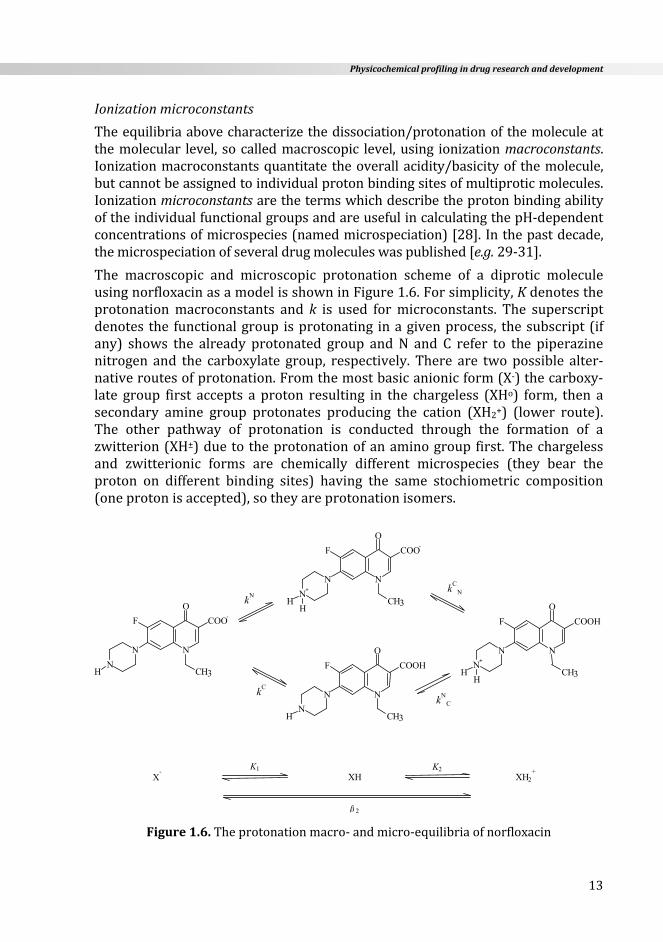
The macroscopic and microscopic protonation scheme of a diprotic moleculeusingnorfloxacinasamodelisshowninFigure1.6.Forsimplicity,Kdenotestheprotonationmacroconstants and k is used formicroconstants. The superscriptdenotes the functionalgroup isprotonating inagivenprocess, thesubscript (ifany) shows the already protonated group andN and C refer to the piperazinenitrogen and the carboxylate group, respectively. There are twopossible alter‐nativeroutesofprotonation.Fromthemostbasicanionicform(X‐)thecarboxy‐late group first accepts a proton resulting in the chargeless (XHo) form, then asecondary amine group protonates producing the cation (XH2+) (lower route).The other pathway of protonation is conducted through the formation of azwitterion(XH±)duetotheprotonationofanaminogroupfirst.Thechargelessand zwitterionic forms are chemically different microspecies (they bear theproton on different binding sites) having the same stochiometric composition(oneprotonisaccepted),sotheyareprotonationisomers.
Figure1.6.Theprotonationmacro‐andmicro‐equilibriaofnorfloxacin
N
COO-
O
CH3
NN
F
H
N
COO-
O
CH3
N
N+
F
HH
N
COOH
O
CH3
N
N
F
H
N
COOH
O
CH3
NN
+
F
HH
kC
kNk
CN
kN
C
X- XH XH2+K1 K2
ß 2

Chapter1
14
Therelationshipsbetweenthemacro‐andmicroconstantsarethefollowing:
K1=kC+kNK1K2= C NCk k = N C
Nk k (1.10a,1.10b)
N C
2 C N
1 1 1
K k k (1.10c)
Oncemacro‐ andmicroconstants are known, themole fraction of each speciescan readily be calculated and the pH‐dependent distribution of macro‐ andmicrospecies canbe constructed. Figure1.7 shows thedistribution of differentprotonationformsofnorfloxacinagainstthepHandindicatesthepredominanceof the zwitterionic form over the chargeless microspecies. However, it is alsovisiblethattheirconcentrationattheiso‐electricpointpHiscommensurableandbothformsarepresentinasignificantamount.
Figure1.7.Distributioncurveofthe4microspeciesofnorfloxacinasafunctionofpH
Themicrospeciationofa triproticmolecule [32,33] ismorecomplicated,conta‐ining8microspecies.Thetotalprotonationprocesscanbedepictedby12micro‐constantsasdemonstratedincaseofamoxicillininFigure1.8.TheO,N,Csub‐orsuperscripts of the k microconstant refer to the three proton binding sites,namelyphenolate,amino,andcarboxylategroups,respectively.Therelationshipsbetweenthemacro‐andmicroconstantsarethefollowing:
O N1 CK k k k (1.11)
O N O C N C N O C O C N1 2 O O N N C C K K k k k k k k k k k k k k (1.12)
O N C N O C1 2 3 O O,N N O,N ........K K K k k k k k k (1.13)
2 4 6 8 10 12
pH
0
20
40
60
80
100
%

Physicochemicalprofilingindrugresearchanddevelopment
15
The theory and practice of protonmicrospeciation based on NMR‐pH titrationanddataintheliteratureoncompletemicrospeciationofsmallligandsincludingdrugshaverecentlybeensurveyed[34].
Figure1.8.Protonationmacro‐andmicro‐equilibriaoftriproticamoxicillin
TemperatureandionicstrengthThe ionization constant as a thermodynamic parameter is temperature‐dependent.FortheprecisedeterminationofpKa,experimentsmustbeconductedundercontrolledconstanttemperature.Inpractice,thecommonreferencevalueis 25 °C andonly fewdata are availablemeasured at 37 °C.The change in pKauponanincreaseoftemperaturefrom25°Cuptothephysiologicaltemperatureof37°C isdependentonthegivenmolecule.Generallythechange inthepKaofacids is less, while bases are more sensitive to temperature change [26]. Theapproximate average value of temperature dependence is known as δpKa/δT:0.02‐0.03,whichmeans0.24‐0.36ΔpKavaluesbetween25and37°C.IfthepKaofacompoundfallsintothepHrange1.5‐8(thepHgradientpresentinthehumangastrointestinaltract),thenevenarelativelysmalldifferencemayleadtopoorin
NS-
OOC
O
H3C CH3
NHO
-O
NH2
NS-
OOC
O
H3C CH3
NHO
HO
NH2
NS-
OOC
O
H3C CH3
NHO
-O
NH3
NS
HOOC
O
H3C CH3
NHO
-O
NH2
NS
HOOC
O
H3C CH3
NHO
-O
NH3
NS
HOOC
O
H3C CH3
NHO
HO
NH2
NS-
OOC
O
H3C CH3
NHO
HO
NH3
NS
HOOC
O
H3C CH3
NHO
HO
NH3
kO
kN
kC
kN
kN
kON
kOC
kC
kCO
N
kCN,O
kON,C
kN
O,C
XH-
O
C
X2- XH2 XH3+
Chapter1
16
vitro‐in vivo correlations. For a better interpretation of the cellular transportmechanismofsuchmolecules,thebiorelevantpKavalueisparticularlyuseful.Apredictionmethod for thisvaluebasedona2DstructureandpKaat25 °Cwasproposedveryrecently[35].
The ionic strength of the medium also affects the pKa value. It is common tomeasure at constant ionicmedium, generally at I = 0.15M adjusted by KCl orNaCl corresponding to the physiological level. Frequently, a different ionicmediumisusedordatacalculatedtozeroionicstrengthusingtheDebye‐Hückeltheoryarealsopublished,thusitisalwaysnecessarytoreporttheionicstrengthandtemperatureofapKameasurement.
ImportanceofpKainmedicinalchemistryThedegreeofionizationatagivenpHcanbecalculatedoncethepKaisknown.Asaruleofthumb,atpH=pKa50%ofthecompoundisionizedand50%isintheunionizedform,whileatpH=pKa±2predominanceofonespeciesbecomes99%.Forexample,anacidispresentin99%atpH=pKa‐2asunionized(HA)andatpH=pKa+2asionized(A−)(theoppositecaseappliestoabase).
The ionization state determines the transport properties, thus its precisecalculation allows the estimationofADME features.With theknowledgeof thepKa value, the proportion of the transport form can be calculated at anyphysiologically important pH values. Regarding ampholyte compounds, the pKavaluesareusefultocalculatetheiso‐electricpointorthepHatwhichamoleculehas the lowest solubility and highest lipophilicity. Since solubility, lipophilicity,andpermeabilityarepH‐dependentproperties,thepKavalueofanewmoleculemustbedeterminedinadvancetothelogS,logPandpermeabilitymeasurement.
Ionic interactions play a fundamental role in the receptor binding of ionizablemolecules. An ionic bond is the strongest non‐covalent binding type. Theelectrostaticattractionofoppositechargesdirects themolecule to thereceptorsurfaceandelectrostaticcomplementaritywiththereceptor isaprerequisiteofanydrugaction.
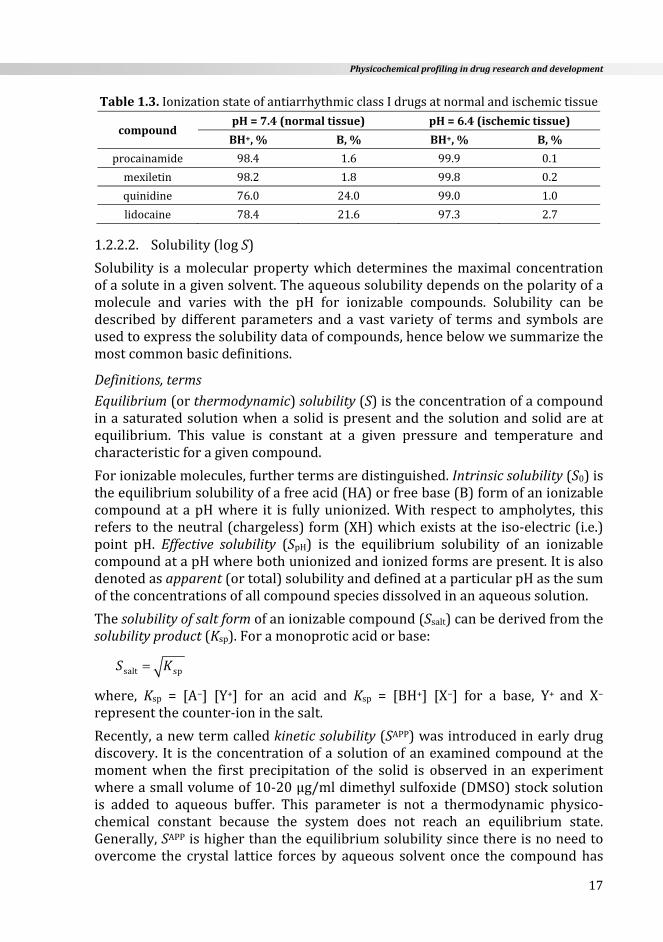
Antiarrhythmicdrugs(classI:Na+‐channelantagonists)serveasagoodexampleofhowpKaaffectsdrugaction.ThesedrugsareweakbaseswithmosthavingpKavalues ranging from 7.5 ‐ 9.5. At the physiological pH of 7.4 they exist in anequilibriummixture consisting of both the free base (B) and protonated (BH+)cationicform.IncompoundswiththepKa>9(likeprocainamide,mexiletine,pro‐pafenone),thepresenceofthereceptorformexceeds90%whichisfavorableforthebindingtothesodium‐channel.However,forcompoundsinwhichthepKa<8(likequinidine,lidocaine)thisratioismuchlessfavorable(Table1.3).Lidocaine(pKa = 7.96) has a stronger electrophysiologic effect in ischemic than normalmyocardialtissue.Thispotentiationhas, inpart,beenattributedtotheincreaseinH+concentration (lowerpH)within the ischemicareasof theheart.Acidosisincreasestheportionofreceptorformofthedrug(Table1.3)andconsequentlytheproportionofNa+‐channelsoccupiedbytheBH+oflidocaine[36].
Physicochemicalprofilingindrugresearchanddevelopment
17
Table1.3.IonizationstateofantiarrhythmicclassIdrugsatnormalandischemictissue
compoundpH=7.4(normaltissue) pH=6.4(ischemictissue)
BH+,% B,% BH+,% B,%
procainamide 98.4 1.6 99.9 0.1
mexiletin 98.2 1.8 99.8 0.2
quinidine 76.0 24.0 99.0 1.0
lidocaine 78.4 21.6 97.3 2.7
1.2.2.2. Solubility(logS)
Solubility isamolecularpropertywhichdetermines themaximalconcentrationofasoluteinagivensolvent.Theaqueoussolubilitydependsonthepolarityofamolecule and varies with the pH for ionizable compounds. Solubility can bedescribedbydifferentparameters anda vast varietyof termsand symbols areusedtoexpressthesolubilitydataofcompounds,hencebelowwesummarizethemostcommonbasicdefinitions.
Definitions,termsEquilibrium(orthermodynamic)solubility(S)istheconcentrationofacompoundinasaturatedsolutionwhenasolidispresentandthesolutionandsolidareatequilibrium. This value is constant at a given pressure and temperature andcharacteristicforagivencompound.
Forionizablemolecules,furthertermsaredistinguished.Intrinsicsolubility(S0)istheequilibriumsolubilityofafreeacid(HA)orfreebase(B)formofanionizablecompoundatapHwhere it is fullyunionized.With respect toampholytes, thisreferstotheneutral(chargeless)form(XH)whichexistsattheiso‐electric(i.e.)point pH. Effective solubility (SpH) is the equilibrium solubility of an ionizablecompoundatapHwherebothunionizedandionizedformsarepresent.Itisalsodenotedasapparent(ortotal)solubilityanddefinedataparticularpHasthesumoftheconcentrationsofallcompoundspeciesdissolvedinanaqueoussolution.
Thesolubilityofsaltformofanionizablecompound(Ssalt)canbederivedfromthesolubilityproduct(Ksp).Foramonoproticacidorbase:
salt spS K
where, Ksp = [A−] [Y+] for an acid and Ksp = [BH+] [X−] for a base, Y+ and X−representthecounter‐ioninthesalt.
Recently,anewtermcalledkineticsolubility(SAPP)wasintroducedinearlydrugdiscovery. It is theconcentrationofasolutionofanexaminedcompoundatthemomentwhen the first precipitation of the solid is observed in an experimentwhereasmallvolumeof10‐20μg/mldimethylsulfoxide(DMSO)stocksolutionis added to aqueous buffer. This parameter is not a thermodynamic physico‐chemical constant because the system does not reach an equilibrium state.Generally,SAPPishigherthantheequilibriumsolubilitysincethereisnoneedtoovercome the crystal lattice forces by aqueous solvent once the compoundhas

Chapter1
18
beendissolved inDMSO.Kineticsolubilitydataaremainlyused forrankingthemoleculesintheearlystagesofdiscoveryandcannotreplacethedeterminationofthetrueequilibriumconstantlaterinthedevelopmentphase.
Theabovesolubilityparameterscanbeexpressedinvariousconcentrationtermslike:g/100ml;g/ml;mg/ml;μg/mlormol/L(M);mmol/L(mM);μmol/L(μM),etc.Forbettercomparability,thelogarithmofsolubilityterm(logS)isfrequentlyusedandcanbeobtainedfromMorμMconcentration.Preferenceforthe–logSterm is found in the literature in order to avoid negative numbers for lowsolubility compounds. However, it may be somewhat confusing because theaforementionedtermyieldshighervaluesmeaninglowersolubility.
Solubility is affected bymany factors, such as temperature, pressure, pH, ionicstrengthof aqueousmedia, purity of a sample, crystal form, particle size, poly‐morphism,etc.Theeffectofthesefactorshavebeencomprehensivelydiscussedinclassic[37,38]andnewbooks[11,18].Here,wefocusonlyonthepHdepen‐dencyofsolubility.
Solubility‐pHprofileThesolubilityofionizablecompoundsvarieswiththepH.Theyaremoresolublein the charged than in the unionized form.When amolecule exists only in themonomer state, its pH‐dependent equilibrium solubility is derived from theHenderson‐Hasselbalch (HH) equations (Equations 1.1c‐1.4c). TheHH relation‐shipforamonovalentacid,base,and(diprotic)ampholytemoleculecanbederi‐ved from solubility and ionization equilibria as follows where, by convention[HA(s)]=[B(s)]=[XH(s)]=1, and [A−], [BH+], [X−], [XH2+] are expressed usingEquations1.1b,1.2b,1.3b.
acid:
HA(s)⇌HA (1.14)
0[HA]
HA[HA(s)]
S (1.15)
pH= A + HAS (1.16)
apH
K [HA]HA
[H ]S (1.17)
a
pH HA 1[H ]
KS (1.18)
a(‐p pH)pH 0 10 1KS S (1.19)
a(pH‐p )pH 0log log log(1 10 )KS S (1.20)

Physicochemicalprofilingindrugresearchanddevelopment
19
base:
(S)B B (1.21)
0[B]
B[B(s)]
S (1.22)
...
a(p ‐pH)pH 0log log log(1 10 )KS S (1.23)
diproticampholyte:
HX(s) HX (1.24)
0[XH]
XH[XH(s)]
S (1.25)
+
pH 2= X + XH + XHS
...
a1 a2(p ‐pH) (pH‐p )pH 0log log log(1 10 10 )K KS S (1.26)
Figure1.9showsthecharacteristicsolubility‐pHprofile(aplotoflogSpHvs.pH)foranacid(a),base(b),anddiproticampholyte(c).
Figure1.9.Solubility‐pHprofileof(a)anacid,(b)abaseandc)adiproticampholyte

Chapter1
20
The HH relationship can be used to predict the pH‐dependent equilibriumsolubilityofdrugswhenthepKaandlogS0valuesofacompoundareknown.Itisa frequent practice in drug research to convert the experimentally measuredintrinsicsolubilityvaluetoequilibriumsolubilityataphysiologicalrelevantpHinordertoestimateitsexpectedbehavior.
The validity of the HH relationship has been widely investigated and certaindeviations were found [39,40]. They were interpreted with the influence ofdifferent molecular interactions such as aggregation and micelle formation[39,41]. Recently, a revisit of the HH relationship concerning organic basesconfirmedthevalidityprovidedifhighlyprecisepKaandlogS0valueswereusedforitsgeneration[42](seealsoSection1.4.2).
ImportanceoflogSinmedicinalchemistryThe aqueous solubility of compounds receives considerable attention in drugdevelopment, because this is a keymolecular property for the gastrointestinalabsorption of orally administered drugs. Further on, in biological activity testscompoundsmustbeinsolutionotherwisefalse,erroneousdatacanbeobtained.Lowsolubilityisdetrimentalfrombothpharmacokineticandpharmacodynamicpoints of view. Determination of aqueous solubility is an inevitable part ofphysicochemicalprofiling indrug research. Its importancehasgrownsince theBiopharmaceuticalClassificationSystem(BCS)wasfirstproposedbyG.Amidonin 1995 [43]. This classification uses four classes to categorize drugs based ontheir solubility and intestinal permeability (class 1: high solubility + high per‐meability;class2:lowsolubility+highpermeability;class3:highsolubility+lowpermeability; class4: lowsolubility+ lowpermeability). For class1molecules,the rate‐limiting factor of intestinal absorption is the rate of dissolution, lowsolubilityinclass2molecules,whilelowpermeabilityinclass3israte‐limiting.In class 4, both properties are unfavorable for oral administration, and no invitro‐invivocorrelationcanbeexpected.
To improve the in vitro‐in vivo correlation, the measurement of solubility isrecommended forbiomimeticmedia aswell. There is growing evidence that intheintestine,thepresenceofbileacidsandothercomponentssuchaslipidscanalter (usually increase) the intrinsic solubility of (lipophilic) compounds. Twophysiologically relevant media developed by Dressmann et al. [44] are used.These are the fasted‐state simulated intestinal fluid (FaSSIF) and the fed‐statesimulated intestinal fluid (FeSSIF) having pH 6.5 and 5.0, respectively, andcontaindifferentamountsofsodiumtaurocholate,lecithineandsalts[44].
1.2.2.3. Lipophilicity(logP)
Themorefundamentalpropertygoverningthefateofadruginthebodyisundo‐ubtedlythelipophilicity.Thismolecularpropertyrepresentstheaffinityofamo‐leculeforalipophilicenvironment.Itismostcommonlydescribedbythelogari‐thmofpartitioncoefficient(logP)betweentwoimmisciblesolvents,oneisanor‐ganicapolar(e.g.octanol)andtheotheranaqueouspolar(buffersolution)[45].

Physicochemicalprofilingindrugresearchanddevelopment
21
BesidesP,othersymbolshavebeenusedintheliteraturesuchasPow,Kow,Kp,PC,etc.,however,weusetheterminologywidelyacceptedinmedicinalchemistry.
Two types of partition parameters are distinguished: the true partition coef‐ficient (P) and the distribution coefficient (D or in older literature Papp). Theirdefinitionandrelationshiparebrieflysummarizedbelow.
Definitions,termsThetruepartitioncoefficient(accordingtotheNernstlaw)referstothepartitionof a single electrical species, and is expressed as an equilibrium concentrationratioofthesamemolecularforminbothphasesofthesolventsystem.Thisvalueis constant at a given temperature and pressure, independent of the pH andcharacteristicforthemolecule.Itcanbederivedfortheneutral,monomericformofacompound(logPN)(Equation1.27)andtheoreticallycanbealsodefinedforthe partition of an ionic form (log PI) (Equation 1.28), but later the value hasordersofmagnitudelowerandinmostofcasescanbepracticallyneglected.
N octanol
water
[unionizedform][unionizedform]
P (1.27)
N o
w
[HA][HA]
P N o
w
[B][B]
P N o
w
[XH][XH]
P (1.27a-c)
I octanol
water
[chargedspecies][chargedspecies]
P (1.28)
‐
I o‐w
[A ]
[A ]P
I o
w
[BH ]
[BH ]P
‐I o
‐w
[X ]
[X ]P
I 2 o
2 w
[XH ]
[XH ]P (1.28a-d)
The distribution coefficient of an ionizable compound refers to all species thatarepresentinthesolution(Equation1.29).SinceitisapH‐dependentterm,thepHmustbespecifiedasDpH.
pH octanol
water
[unionized ionizedspecies][unionized ionizedspecies]
D (1.29)
For monoprotic acid and base:
pH o o
w w
[HA] [A ]
[HA] [A ]D
pH o o
w w
[B] [BH ]
[B] [BH ]D (1.29a‐b)
Fordiproticampholyte:
pH o o 2 o
w w 2 w
[X ] [XH] [XH ]
[X ] [XH] [XH ]D (1.29c)

Chapter1
22
with the assumption that the concentration of the ionic forms in the organicphase is much less than that of the neutral forms (e.g., [A−]o << [HA]o and[BH+]o<< [B]o, etc.) and upon substituting the aqueous equilibrium concentra‐tionsfromEquations1.1b,1.2b,and1.3b,therelationshipsbetweenPandDcanbe obtained. For simple molecules, these relationships are given below(Equations 1.30a‐c) while interactions between more complicated multiproticcompoundscanbefoundintheliterature[46].
Formonoproticacid:
a(pH p )N pHlog log log(1 10 )KP D (1.30a)
Formonoproticbase:
a(p pH)N pHlog log log(1 10 )KP D (1.30b)
Fordiproticampholyte:
a1 a2(p pH) (pH‐p )N pHlog log log(1 10 10 )K KP D (1.30c)
PartitionmicroconstantsSimilarlytoionizationmicroconstants,micro‐logP(denotedaslogp)ofagivenmicrospecies of multiprotic compounds can also be defined [46]. This hasparticular significance in the case of ampholyte compounds where the mostlipophilicspecies,theneutral(XH)form, isacompositefromzwitterionic(XH±)andchargeless(XH0)microspecies.If theyarepresentinsolutioninacommen‐surableamount(e.g.,norfloxacininFigure1.7)thentheexclusivepartitioningofthechargelessformcanbeexpectedintothelipophilicphaseandmicro‐logPofXH0 microspecies may be the relevant lipophilicity parameter. Its calculationrequires knowledge of the log D at iso‐electric pH value, log Di.e.pH, and theprotonationmicroconstants(kC, N
Ck , CNk )aspreviouslypublished[47].
N0 i.e.pH N +C
CCC +N
1log log log 1 H
H
kp D k
kk (1.31)
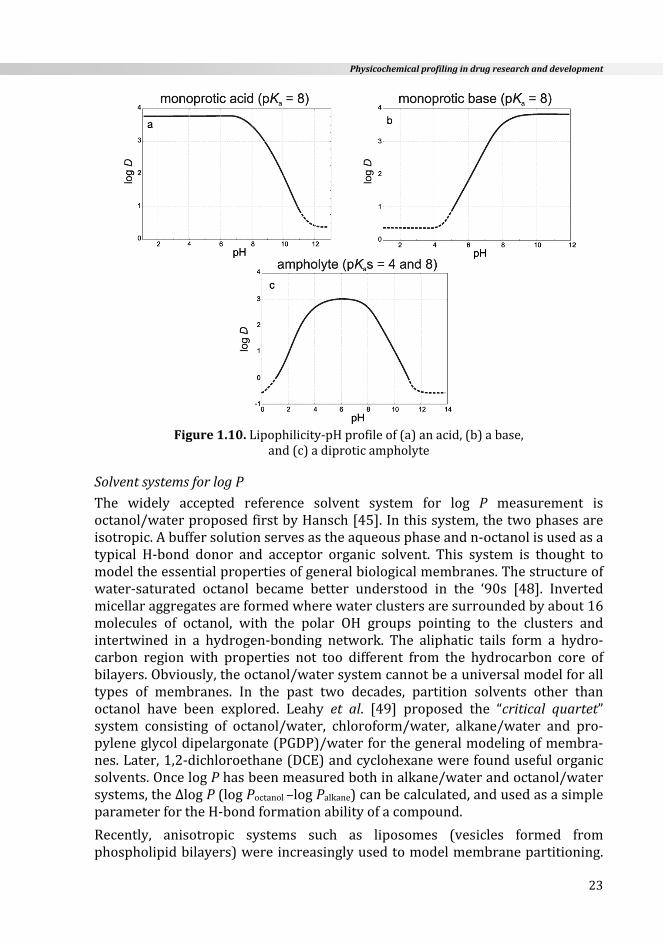
Lipophilicity‐pHprofileThe plot of log DpH against the pH (lipophilicity‐pH profile) of a compound(Equations1.30a‐c) can be derived from the HH relationships (Equations 1.1c‐1.4c),providedthatthereisnoion‐pairpartitioninvolvedintheprocess.Ifsuchion‐pairpartitionexists,theprofilesshowaplateauatlogDofvalues3‐4orderslower(foracidsathighpH,forbasesatlowpH)thanasindicatedinFigure1.10.
Thelipophilicity‐pHprofilesareusefultoestimatetheeffectivelipophilicityofacompound at physiologically relevant pH values and widely used in medicinalchemistry.
Physicochemicalprofilingindrugresearchanddevelopment
23
Figure1.10.Lipophilicity‐pHprofileof(a)anacid,(b)abase,
and(c)adiproticampholyte
SolventsystemsforlogPThe widely accepted reference solvent system for log P measurement isoctanol/waterproposedfirstbyHansch[45].Inthissystem,thetwophasesareisotropic.Abuffersolutionservesastheaqueousphaseandn‐octanolisusedasatypical H‐bond donor and acceptor organic solvent. This system is thought tomodeltheessentialpropertiesofgeneralbiologicalmembranes.Thestructureofwater‐saturated octanol became better understood in the ‘90s [48]. Invertedmicellaraggregatesareformedwherewaterclustersaresurroundedbyabout16molecules of octanol, with the polar OH groups pointing to the clusters andintertwined in a hydrogen‐bonding network. The aliphatic tails form a hydro‐carbon region with properties not too different from the hydrocarbon core ofbilayers.Obviously,theoctanol/watersystemcannotbeauniversalmodelforalltypes of membranes. In the past two decades, partition solvents other thanoctanol have been explored. Leahy et al. [49] proposed the “critical quartet”system consisting of octanol/water, chloroform/water, alkane/water and pro‐pyleneglycoldipelargonate(PGDP)/waterforthegeneralmodelingofmembra‐nes.Later,1,2‐dichloroethane(DCE)andcyclohexanewerefoundusefulorganicsolvents.OncelogPhasbeenmeasuredbothinalkane/waterandoctanol/watersystems,theΔlogP(logPoctanol–logPalkane)canbecalculated,andusedasasimpleparameterfortheH‐bondformationabilityofacompound.
Recently, anisotropic systems such as liposomes (vesicles formed fromphospholipidbilayers)wereincreasinglyusedtomodelmembranepartitioning.

Chapter1
24
Liposome/water logP valuesare consideredas logPmem (membranepartition).AnaccumulationoflogPmemdatashowasignificantlyhigherpartitioningofionicforms. Generally, charged species partition into membranes about 100 timesmore strongly than into octanol. The theory and practice of liposome/waterlipophilicitywerereviewed[5,50,51].
ImportanceoflogPinmedicinalchemistryThe logP is theoldestandmost traditionalphysicochemicalparameterused inmedicinal chemistry. Lipophilicity is implicated in numerous biological events(such as transport, receptor binding via hydrophobic interactions, metabolicprocesses, storage in fat tissues, etc.). The log P value – concerning its infor‐mationcontent‐ismuchmorethanasimplenumber,becausethesamemolecul‐ar interactionswhich exist between the compound and the biological environ‐ment results in this value. At the same time, log P is very easy to handle bychemistsforcomparisonofmoleculeswithdifferentlipophilicityandestimatingtheexpectedtransportbehaviorinthebody.
Among the properties suggested by Lipinski, (known as “ruleof5”) one of thecriteria fordrug‐likeness is that logP shouldbebelow5 [52]. It seems tobeareasonableconceptsince90%ofmarketeddrugshavealogPvalueintherangeof 0 – 5 (see Figure 1.11). From hydrophilic compounds (log P < 0) goodsolubility,butpoorabsorptionfromtheGItractcanbeexpectedexceptforthosewhichhaveactivetransport(suchasforexampleascorbicacid).Compoundswithmoderate lipophilicity (log P between 0 and 3) are optimal for oraladministration due to a good balance of solubility and permeability. For goodblood‐brainbarrier(BBB)penetration,theoptimallogPvalueisabout2.
Figure1.11.ThelogPscaleofdrugs
Highly lipophilic compounds (logP>5) are sparingly soluble in aqueouscompartments,tendtoaccumulateinlipoidalpartsandarealsomoresensitiveto
N
S
Cl
N
CH3
CH3
log P scale
-2 0 2 4 6 8
… …
drugs 90%
NCH3 CH3
O
O
OH
+ Br -
methylhomatropine -bromide
log P: -1.68no absorptionno BBB penetration
O OOH
OH
OH OH
ascorbicacid
log P: -1.85absorbsby activetransport
chlorpromazine
log P: 5.34good oral absorptiongood BBB penetration
O
O
ON CH
3
CH3
I
I
CH3
amiodarone
log P: 7.57storaget1/2: 25-30 days
N
S
Cl
N
CH3
CH3
log P scale
-2 0 2 4 6 8
… …
drugs 90%
NCH3 CH3
O
O
OH
+ Br -
methylhomatropine -bromide
log P: -1.68no absorptionno BBB penetration
O OOH
OH
OH OH
ascorbicacid
log P: -1.85absorbsby activetransport
chlorpromazine
log P: 5.34good oral absorptiongood BBB penetration
O
O
ON CH
3
CH3
I
I
CH3
amiodarone
log P: 7.57storaget1/2: 25-30 days

Physicochemicalprofilingindrugresearchanddevelopment
25
metabolism.Extremelyhigh lipophilicitymay lead tostrangepharmacokinetics,for example, amiodarone has log P=7.37 and half‐life t1/2: 25‐30 days(!)(Figure1.11).First,in1987Hanschcalledattentiontothedangerofexceedinglyhigh lipophilic drug candidates and proposed the “minimal hydrophobicity”concept for the design of new compounds [53]. Since then, the unfavorabletendencyofhighlylipophilicdrugproductionhasnotstopped,asnewmoleculesindrugresearcharegettingmorelipophilicandlesswater‐soluble[54].
1.3. METHODSFORPHYSICOCHEMICALPROFILING
Demands set up to the methods for physicochemical profiling are different invariousphasesofdrugresearch.Inthediscoveryphase,thedrasticallyincreasednumberofNCEsproducedbycombinatorialchemistryrequireshighthroughput(HT),material saving, automated approaches,while less emphasis is placed onprecision. A method for physicochemical profiling is considered HT when itscapacity exceeds the measurement of 50 compounds/day [7]. Later, in thedevelopment phase reliable, precise data are neededwhich iswhy accuracy ismoreimportantandnotthespeedofthemethod.
ThissubchapterisdedicatedtoexperimentalmethodsusedforthemeasurementofpKa, logP, and logS valuesandcomparisonof their capacity,accuracy, time,andmaterialdemand(seeTables1.4‐1.6).Wefocusheremainlyonthepracticalaspects of their application, while the detailed theoretical background of themethodsisoutofthescopeofthisreview.Forthispurpose,excellentbasicbooksarerecommendedtoreaders[11,18,26,37].
1.3.1. pKadetermination
PotentiometryandUVspectroscopyarethecommonlyusedstandardmethodsofpKa determination. Due to its simplicity and precision, potentiometry is themethodofchoiceoncetheaqueoussolubilityofacompoundreachesaminimumof0.5mMconcentration intheentirepHrangeof thetitration.For lesssolublecompounds, a good alternative tool is the UV/pH titration provided that themoleculehasapH‐dependentUVspectrum.Inthismethod,itisgenerallyenoughif the compound dissolves in a concentration of 10‐500 μM depending on itsmolar absorptivity, ε. Both potentiometric and UV/pH titration methods arestronglysupportedcommercially,andtheavailableautomatedinstrumentssuchastheGLpKaanditsfollowuptheSiriusT3automatedanalyzers(SiriusUK)arewidelyused.Intherecentyears,capillaryelectrophoresis(CE)hasprovedtobeaverypowerfulpKadeterminationmethod,beingmoresensitiveand lesssampleconsuming[11,16].SomeothermethodssuchasNMR/pHtitration[55],CD/pHtitration [56], and chromatographic technique [57] have also been applied forspecialcases,butsofarhavenotbecomeroutinetechniques.
Chapter1
26
1.3.1.1. Potentiometricmethod
Procedure.Inpotentiometrictitration,thepHofa1‐5mMsolutionofasampleispreciously measured with a carefully standardized combined glass electrodeupon addition of small volumes of a strong acid (e.g. HCl) or base (e.g. KOH)volumetricsolution.Themeasurementisperformedinastirringsolution,underan inert gas atmosphere (argon or nitrogen) while the ionic strength of thesolutioniskeptconstantusinganinorganicsalt(e.g.0.15MKCl),andthetitrationcellisthermostatedusuallyat25.0±0.1°C.Typicalsamplevolumefortitrationis5‐15ml,butmeasurementinaslessas1mlsolutionhasbeenreported[58].Theconcentration of the titrant is generally 0.5 M in order to avoid considerabledilution upon titration. The potentiometric titration can be used as a directapproach for pKa measurement, when the tested compound is a (relatively)strongacid/basetoproduceenoughpotentialchange(bigjump)inthetitrationcurve. Otherwise, the “Calvin‐Δml” difference‐titration is a useful and widelyappliedmethod.Here,thepKavalueisobtainedfromthedifferencebetweenthetitration curve of a tested compound and a “blank” titration (see below). ThisapproachisabuiltinfunctioninpKaanalyzers.
Calculation. The pKa value can be calculated according to the HH equations(Equations1.1c‐1.4c).ThepHismeasuredandthetermlog([protonated]/[non‐protonated]) is obtained from the mass balance of the titration data. Inautomatedanalyzersbuiltinprograms(e.g.,Refinement‐ProTM)calculatethepKa.First,thetitrationcurveisconvertedtotheBjerrumplot(theaveragenumberofboundprotons/molecule, n vs.pH),wherethepKavalueisequaltothepHat n =0.5(foramultiproticcompound:secondpKaat n =1.5,thirdat n =2.5,etc.).Theobtained raw values are then further refined by a nonlinear least squaresmethod. The adjustable parameters are the concentration of the material,acid/baseerrorofpHmeasurement,carbondioxidecontent,etc.
Accuracy. This method with the above experimental parameters allows themeasurement of precise pKa values in a range from 2 to 12 with a standarddeviation SD = ± 0.01‐0.03. By using a glass electrode of excellent quality,performing proper electrode calibration, excluding the presence of ambientcarbondioxideasmuchaspossible,andaccuratelydispensingverysmalltitrantvolumes (0.01 ml or even smaller) potentiometry in aqueous solution can beappliedtoaconcentrationaslowas0.1mM(accordingtosomeauthorsaslowas0.01mM).Ofcourse,theaccuracyandreproducibilityoftitrationsinsuchdilutedsolutionsismuchless(SD=±0.10‐0.15).Similarly,theprecisionofthemeasure‐mentdecreasesoutofthepHrangeof2‐12.
Calibration. Electrode calibration is a fundamental step in pH‐metric pKadetermination.Astandardized“Four‐parameterprocedure”developedbyAvdeefet al. [59] is widely used. A known concentration of HCl is titrated with KOH(frompH1.8to12.2)understandardexperimentalconditions(seeabove).Datafrom this “blank” titration are used to convert the operational pH scale to theconcentrationscale(pcH=−log[H+])byamulti‐parametricequation.

Physicochemicalprofilingindrugresearchanddevelopment
27
pH=α+SpcH+jH[H+]+jOHKw/[H+] (1.32)
The parameters are determined by a weighted nonlinear least‐squaresprocedure.TheinterceptparameterαinaqueoussolutionmainlycorrespondstothenegativelogarithmoftheactivitycoefficientofH+attheworkingtemperatureand ionic strength. The jH term corrects pH readings for the nonlinear pHresponse due to the liquid junction and asymmetric potentials in moderatelyacidicsolutions,whilethejOHtermcorrectsthehigh‐pHnonlineareffect.FactorSaccounts for the fact thataparticularelectrodemaynothave100%Nernstian‐slope andKw is the ionization constant ofwater.Typical aqueous valuesof theadjustableparametersat25°Cand0.15Mionicstrengthare:α=0.08±0.01,S=1.001±0.001,jH=1.0±0.2,andjOH=−0.6±0.2.
Advantages/drawbacks. Potentiometry is a simple, fast, and precisemethod forpKa determination. The smallest practical volume of sample solution is about5ml.Thisrequires1.5mgofsampleforacompoundwithMw300toachievethe1mM concentration which is ideal for titration. For reliable pKa, 2–3 parallelmeasurements are necessary, so the sample consumption reaches 3–4.5mg. Atitration between pH 2–12 typically takes 20‐40 min to perform. With anautomated instrument (e.g.GLpKa)30‐40 titrations couldbeperformedduringone 24‐h day [60]. So, themaximum capacity is about 10‐12 compounds/day.Thisisarelativelylowthroughput.Themainlimitationoftheapplicationofthistechnique is the poor solubility of compounds. In such cases, the co‐solventmethod canbeapplied (seeSection1.3.1.4). Furtheron, it isdifficult tohandleimpureorunstablecompounds(e.g.,certainesters,diphenols,etc.).
1.3.1.2. UV/pHtitration
Procedure. In spectrophotometric pKa determinationmethod the change in theUVspectrumuponionizationisregistered.SuchapHdependentUV‐spectrumisobtained if the ionizable group is near to the chromophore of themolecule. Intraditional UV/pH titration two aliquots of typically 10‐50 μM solutions of asamplearepreparedineither0.01(or0.001)MHClor0.01(or0.001)MNaOH,with the total ionic strength of 0.15 M. In one solution the molecule is fullyionized while in the other fully unionized. By mixing the two stock solutionsunderprecisepHcontrol,5‐6solutionsarepreparedinarathernarrowpHrange(± 0.6 unit) around the expected pKa. Their absorbance is measured at awavelength where the difference in the absorbance between the ionized andunionized form is the largest. Recently, this time‐consuming process has beenautomated (GLpKawith aD‐PASattachment). In a titration cell, the solutionofthesampleistitratedacrossapHrangethatincludesthepKavalue(s)andmulti‐wavelengthUVspectraregisteredateachpHwiththehelpofa fiberopticsdipprobeimmersedintothetitrationcell[60,61].
Calculation. In traditionalUV/pHtitration, thepKavaluecanbecalculated fromthepHofthesolutionandtheabsorptiondatameasuredatasinglewavelengthusing the HH Equations 1.1c‐1.4c. The pKa of a compound is obtained as an
Chapter1
28
averagevaluecalculated fromthesolutionseries.Thismethod isapplicable forthedeterminationofasinglepKa,ormultiplepKavaluesiftheyarewellseparated(>1.5pHunits). In theD‐PAS technique, target factor analysis (TFA) is used todeduce the pKa value(s) of a sample from an absorbance matrix [60]. Thistechniqueisabletohandlemultiproticmoleculeswithoverlappingprotonation.
Accuracy.TheprecisionofpKadeterminationbytraditionalUV/pHtitrationdoesnot reach that of pH‐metry, where the standard deviation can vary between± 0.05‐0.10. However, according to a recent validation study, the D‐PAS tech‐niquewithaSD=±0.02hassimilarprecisiontopotentiometry[62].
Advantages/drawbacks. The spectrophotometric method is usually moresensitive than potentiometry. The measurements can be performed at lowersampleconcentrationallowingthepKadeterminationoflesssolublecompoundsdirectly in aqueousmedium,while forwater‐insolublematerials the co‐solventmethodcanbeeasilyapplied.TheD‐PASisafasttechnique,onetitrationtakesup30 min and is sample conserving, usually 1‐2 mg of sample is enough for 3parallel measurements. One limitation of spectrophotometry is that if thedistance between the ionization and the chromophore center is greater thanthree sigma bonds then the pH‐dependent spectral shift will be too small formeasurement.Another limitation is if the absorptionmaximaof the compoundoccurs at a low wavelength (< 230 nm) then background noise disruptionincreases considerably. Traditional UV/pH titration is a very slow, time‐consuming process, while the capacity of the D‐PAS technique is similar topotentiometry(10‐12compounds/day).UV/pHtitrationwasusedfordetermina‐tionofmicroconstants inseveralcases(e.g. repaglinide[63],moxifloxacin[64])whentheshift in theUVspectrumisdueto the ionizationofagiven functionalgroup.
1.3.1.3. Othermethods
NMR/pHtitration.NMR/pHtitrationcanalsobeusedforpKameasurementbasedonthefactthatthechemicalshiftofNMR‐activenucleiisgoverned(amongotherfactors)bytheprotonationstateofionizablegroups.Sinceprotonationdecreasesthe localelectrondensity,aselectednucleus in thevicinityof the ionizablesiteexhibitsadifferentshiftintheionizedandunionizedstates.Aplotδobsvs.pHhasasigmoidalshapewithaninflectionpointatpH=pKa.
Generally,NMR/pH titrationshavebeencarriedout inaqueous solutionsusingD2Oasasolvent.AlthoughglasselectrodesoperateproperlyinD2O,acorrectionfactorof0.40has tobeadded to themeasuredpH toget the truepDvalue.Toavoidthiscorrection,NMR/pHtitrationmaybeconductedinasolventmixtureofH2O/D2O(90/10v/v)andthewaterpeakhastobesuppressedbyanappropriatemethod.Frequently, thewhole titration isperformed in a singleNMR‐tubeandthe pH is measured with a long, thin glass electrode. This method has beenextendedfor themeasurementof lowpKavalues(between0and2),wherepo‐tentiometry is no longer applicable. Since at such lowpH a glass electrodehas

Physicochemicalprofilingindrugresearchanddevelopment
29
significantacidityerror,dichloroaceticacidwasproposedasanNMR“indicatormolecule”forinsitumonitoringofthepHinstrongacidicsolutions[55].ThepKavaluesofindividualgroupsoflargebiopolymershavebeenreportedasmeasuredbyNMRtechnique[65].
Themain advantage of this technique compared to potentiometry is the capa‐bilityof selectivemonitoringof ionizationof a given functional group inmulti‐protic molecules with overlapping protonation. Thus, this methodology hasbecome the chief approach of microspeciation as reviewed recently [34]. Theacid/base profiling of imatinib [66] and cetirizine [33], measured by NMR/pHtitrationwasreported.
CapillaryElectrophoresis (CE).The application of CE for pKa determination hasbeen intensively growing in the past decade as reviewed [7,16,67,68]. Themethod utilizes the change in electrophoretic mobility of a compound withchange inpH.Theeffectivemobility(μeff) ismeasuredatvariouspHvaluesandpKaisobtainedfromtheplotofμeffvs.pH.TheexperimentalconditionseffectthepKa determination such as buffer type and ionic strength, applied voltage,detectionmethod,etc.arediscussedasdetailedbyHenchozetal.[16].
Inthistechnique,thesampleconsumptionissmall(ng),andimpuresamplescanbehandleddueto theseparationupontheanalysis. It isratheruniversal,sincedifferent detection methods can be coupled to CE [69]. The precision is goodenoughandagreementwithothermethodsisacceptable,about±0.2pKaunitsinarangefrom2to10,butcanbemuchweaker(±0.5)outofthispKarange.Themethod is sensitive for several factors, among them temperature which iscardinal.
Today, CE is a good tool for high throughput pKa measurement. The instru‐mentationisfullyautomatedusingamultiplex96‐channelCEwithUVdetection(CombiSep,Ames,USA)andmorethan150samples/daycanbemeasured[70].
Spectral Gradient Analysis (SGA). To further increase the throughput ofphysicochemicalprofiling,arapidpKadeterminationmethodwasdevelopedandreported first as “pH‐gradient titration” [71]. Later, after the launch of a com‐mercial instrument(ProfilerSGA,Sirius) it isreferredtointheliteratureastheSGA method. In this technique, a pH gradient flow – very linear in time – iscreated bymixing appropriate acidic and basic buffers. The sample is injectedinto this pH gradient flow which passes through a diode array UV spectro‐photometerandthespectraareregistered.ThepHisnotmeasuredbutestimatedfromthetimeelapsedsincethestartofthegradientgeneration.ThepKavaluesaredeterminedfromchangesinabsorptionasafunctionofpH.Thecalculationisbasedoneitherthefirstderivativeplotof theabsorptionspectrumforsampleswithonlyasinglepKa(orwellseparatedpKavalues)orontheTFAapproachforcompounds with weak spectral change or overlapping ionization [60]. Theprecisionofthemethodisevidentlylowerthanthatofothermethods,butresultsof a comprehensivevalidationstudyshowgoodagreementwith literaturedata[72]. The SGA method allows pKa measurement within 4 min leading to high

Chapter1
30
throughput capacity. The present available automated instrument (Sirius T3)containinganautoloadermodule(roboticarm)utilizesfour48‐positionvialtraysforsamples.Itenablesthemeasurementof240compounds/day.LowsolubilityandlowmolarabsorptivitymaybelimitationsoftheSGAmethod.
1.3.1.4. Co‐solventmethod
DeterminationofpKausingtheabovediscussedmethodsisoftenhinderedbythelowwatersolubilityofthesamples.Itisafrequentproblemtodaysincethenewmoleculesindrugresearcharelesswater‐solubleandmorelipophilic.Forwaterinsoluble compounds, the co‐solventmethodcanbeused. In thisapproach, theapparent ionization constants, psKa values, are measured in different ratios oforganic solvent/water mixtures. The aqueous pKa value is obtained by extra‐polationtozeroorganiccontent.Theco‐solventmethodisprimarilyusedinpH‐metry,butitcanbeappliedinUV‐spectroscopyandCEtechniquesaswell.
Manywatermiscibleorganicsolventshavebeenusedsuchasmethanol(MeOH),ethanol (EtOH), propanol, DMSO, dimehtylformamide (DMF), acetone, andtetrahydrofurane(THF).SincemostliteraturedatahavebeenaccumulatedforaMeOH/water solvent mixture and it is generally accepted that MeOH shows asolvationeffectclosesttowater,MeOHisnormallychosenasanorganicsolventofchoice[11,16,68].
Different extrapolation methods are known, but the Yasuda‐Shedlovky (YS)extrapolation has proven to be the most reliable. Here, a linear correlation isestablishedinaplotofpsKa+ log[H2O]vs.a/ε+b,wherelog[H2O]isthemolarwater concentrationof thegivensolventmixture,ε is thedielectric constantofthemixture,andaandbare theslopeand intercept,respectively.TheaqueouspKavaluescanbeobtainedforlog55.5and1/78.3,themolarconcentrationanddielectric constant of pure water, correspondingly. The dielectric constant ofMeOH/watermixturesislowerthanthatofwaterandtheextentofionizationissuppressed, thuspKavaluesofacidsareshiftedhigherwhile thoseofbasesaretoward lower values. The slope of the YS relationship is positive for acids andnegative for bases. The YS procedure offersmany benefits over the traditionalplotofpsKavs.Rw(wt%oforganicsolvent)whichoftenshowsa“hockey‐stick”or“bow”shape,sometimesatRw>60wt%anS‐shapecurve.Properelectrodecali‐brationusingfourparameterproceduresinthesolventmixtureiscrucial[73].
Accordingtoacomprehensivevalidationstudy,thereproducibilityandprecisionof the method, based on 431 separate titrations in the interval of 15‐65 wt%MeOHcontentusing25modelcompounds,wasfoundtobegood(SD=±0.05).Extrapolationfromamethanol‐richregion(Rw:40‐60wt%)givesanerrorinpKanotgreaterthan±0.2forweakacidsand±0.1forweakbases[74].
Sincenotallcompoundsdissolveinasingleorganicsolvent(e.g.methanol),anewmulticomponent co‐solvent system significantly improving the solubility ofpharmaceuticalcompoundswasrecentlydevelopedforpKadetermination[75,76].The mixture consists of an equal volume of MeOH, dioxane, and acetonitrile

Physicochemicalprofilingindrugresearchanddevelopment
31
(referredtoasMDM)dilutedinwatertoobtaintherequiredco‐solventsystem.This system enables pKa measurements by potentiometry (and also by UV/pHtitration) for a wide range of poorly soluble compounds. Since solubilityconsiderablyincreasesintheMDMsystem,measurementscanbeperformedinalowerproportionoforganicsolvent,thusthelong‐distanceextrapolationcanbeavoided.ThelinearityoftheYSrelationshipisvalidupto55wt%MDMcontent.Validation based on 50 compounds showed good reproducibility(SD=±0.01‐0.08)andtheagreementofpKavaluesextrapolatedbythismethodwithvaluesmeasuredbyothermethodsisverygood(<0.10unit).
The SGA method has been extended with measurements in 20 wt % MDMcontent, and general calibration equations were set up for acids and bases(pKa(aqueous)=apsKa (20%MDM)+b),soasinglepointestimationmayproviderapidaqueous pKa values for water‐insoluble compounds in the early phase of drugresearch[76].
1.3.1.5. Decisiontreeformethodselection
The selection of a suitable method must be based on the properties of thecompoundtested.Figure1.12showsasimpledecisiontreeformethodselectionusedinthelaboratoryoftheauthor[4].
Figure1.12.DecisiontreeformethodselectionofpKameasurement
compound
0.5 mM solubilityin water
pH-metry
Co-solvent methodpH-metry
pH sensitiveUV spectrum
Single point estimation80% DMSOpH-metry
0.5 mM solubilityin MDM/water
1-5 µM solubilityin MDM/water
1-5 µM solubilityin water
UV/pH titration
0.5 mM solubilityin 80% DMSO Co-solvent method
UV/pH titration
pKa prediction
YES
NO
NO
NO NO
YES
YES
YES
YES
YES
NO
NO

Chapter1
32
Table1.4.MethodsforpKadetermination
Method
Sample Throughput
PrecisionInstrumen‐tationamount,
mg
solu‐bility,mM
highpurity
speed1capa‐city2
potentiometry 3‐5 >0.5 necessary 20‐30 10‐12 highGLpKa,SiriusT3(Sirius,UK)
UV/pHtitration
traditional 1‐2 >0.01 necessary6‐8hours
1 mediumpH‐meter+
spectrophotometer
automated 1‐2 >0.01 necessary 30 10‐12 highGLpKa+D‐PAS,
SiriusT3(Sirius,UK)
NMR/pHtitration
1‐2 >0.5not
necessary2‐3hours
2‐3 high NMRspectrometer
CE*
singlechannel <<1 >0.01not
necessary30 20 medium CE
multiplexed <<1 >0.01 notnecessary
30 150 acceptable CePro9600(CombiSep)
SGA† 1 >0.01 necessary 4 240 acceptable Profiler‐SGA,SiriusT3(Sirius,UK)
*CapillaryElectrophoresis 1min/comp.†SpectralGradientAnalysis 2sample/day
1.3.2. logSdetermination
Severalmethodshavebeendevelopedforthemeasurementofbothequilibriumandkinetic solubility including traditional andhigh throughput techniques. Ex‐cellent reviews [7,16,39,41] have surveyed the state‐of‐the‐art techniques.Below,afterashortsummaryofkineticsolubilitymethods,approachesforequili‐brium solubility measurement are discussed focusing on good laboratorypractice(GLP).
1.3.2.1. Methodsfordeterminationofkineticsolubility
Concerning the large number but small content, samples in the early phase ofdrug discovery are subjected to compound‐saving and HT methods which aresuitable for themeasurement of kinetic solubility. In the turbidimetricmethodintroducedbyLipinskietal. [77]smallaliquots(0.5μl)ofDMSOstocksolutionareaddedat1min.intervalstoaqueousbuffers(originally,2.5mlofpH7phos‐phate buffer) until the compound precipitates from the solution reaching themaximal (but not yet the equilibrium) solubility. The turbidity caused by theprecipitationismeasuredbylightscatteringinthe620‐820nmrangewithaUVdetector. In nephelometric [78], direct UV [79] and ultrafiltration‐LC/MS [80]methodstheaboveprincipleisadaptedto96‐wellplateusingdifferentdetectors(nephelometer,diodearrayUVandMS,respectively). Inthetwolatermethods,
Physicochemicalprofilingindrugresearchanddevelopment
33
the precipitate is separated from the solution by filtration (or centrifugation)beforetheconcentrationmeasurement.Theultrafiltration‐LC/MStechniquehastheadvantageofhighsensitivityandthecapabilityofhandlingimpuresamples.Commercially available instruments (Nephelostar, BMG; Nepheskan Ascent,ThermoLabsystem,μSOL,pION)use fullyautomated liquiddispensing systemsand provide high capacity (measurement of 200‐300 compounds/day). ThepresenceofDMSO in thekinetic solubilityexperimentsmayconsiderablyaffecttheresultsinahighlycompound‐dependentway,thusitispracticaltokeeptheDMSOataminimumlevel(lessthan0.5%).
Themaindisadvantagesofkineticsolubilitymeasurementsarethelackofstan‐dardization,poorreproducibility,anddifficultiesinthecomparabilityofresults.
1.3.2.2. Methodsfordeterminationofequilibriumsolubility
1.3.2.2.1. Saturationshake‐flaskmethod(SSF)
TheSSFmethod is the standardapproach for thedeterminationof equilibriumsolubility which when properly performed provides high quality data. It is asimple but very time‐consuming procedure and requires lots of manual work.The solution of the tested compound containing excess solid is prepared inaqueous buffer using a small (2‐5ml) glass vial. The heterogeneous system iscappedandvigorouslystirredatachosentemperature(usually25°Cor37°C)foraspecifiedtime(24,48horlonger)untiltheequilibriumhasbeenreached.After that, the two phases (solid and liquid) are separated by sedimentation,centrifugation, or filtration. Upon diluting sample aliquots with the solvent, ifnecessary, the concentration of the saturated solution is measured by anappropriatemethod,most frequentlybyUV spectroscopyorHPLC.Despite thelongevityofSSFuse,thereinnoacceptedstandardwaytocarryoutthismethod.Published solubility studies show great differences in the experimentalconditionsused,particularlyconcerningthetimeofequilibration,themethodofphaseseparation,andthecontrolofpHduringthemeasurement[37,38,41].
Recently, in a comprehensive study published by Baka et al. [81] the mostimportant experimental factors influencing themeasuredequilibriumsolubilitybytheSSFwereinvestigated(seesomeresultsinSection1.4.2)andastandardizedprotocolwasproposedforGLP[82].Thefollowingconditionsaresuggested:
themeasurementmustbecarriedoutatcontrolledtemperaturewithprecision±0.1°C, SörensenphosphatebuffercanbeusedbetweenpH3‐7,whileBritton‐RobinsonbuffercanbeusedinawiderpHrangefrom2.5to11.5.HClofappropriateconcentrationcanbeusedbelowpH2.5,
thepHofthesolutionmustbecarefullycontrolledduringthemeasurement,advisablybeforeandaftertheequilibration,
to avoid the difficulties in sampling, only a small (~ 5‐10mg/5ml) excess of solidshouldbepresent,
aminimumof24hisnecessarytoreachtheequilibrium,thistimeshouldconsistof6hofstirringand18hofsedimentation,butincaseofverysparinglysolublecompoundslonger stirring time may be necessary for equilibrium, so in the most rigorous
Chapter1
34
application of SSF, the required time of equilibration must be determined fromcompoundtocompound,
the safest technique of phase separation is sedimentation which assures a hetero‐geneous system until equilibrium has been achieved; if an opalescent solution isformed then the phase separation can be done by centrifugation while the mosterroneousfiltrationshouldbeavoided(seeresultsinSection1.4.2below),
acompoundexistinginameta‐stablepolymorphformcanbetransformedintoamorestableoneduringthedurationofsolubilitymeasurement,thustheanalysisofthesolidphase(byX‐raypowderdiffractionorthermo‐gravimetricmethods)attheendoftheexperimentishighlyrecommended.
Using theabove listed conditions theequilibriumsolubilityofmore than50 com‐poundswasdeterminedwithastandarddeviationoflessthan4%inourlaboratory.
1.3.2.2.2. Potentiometricmethods
Theprincipleofthepotentiometricmethodsisbasedonthatcharacteristicshiftofthetitrationcurvecausedbytheprecipitationoftheunionizedformofacom‐pound froma solution.Potentiometric titrationwas introduced for equilibriumsolubility measurement by Avdeef et al. [83‐85]. The dissolution template tit‐ration(DTT)methodusespKaandlogPvaluesasinputparameters.LogPisusedto estimate the intrinsic solubilitybasedonaHansch‐Yalkowsky typeequation(logSo=1.17–1.38 logP).UsingthepKaandtheestimated intrinsicsolubility,theDTTproceduresimulates theentire titrationcurvebefore theassaybegins.Thiscurveservesasatitrationtemplate(theoptimalquantityofthetestedcom‐poundforthetitrationissuggestedbythesimulation)andalsoasaguidefortherighttitrationprotocol(howtheinstrumentdispensesthetitrantandcollectsthepHdata)inthecourseofthetitration.ThetitrationstartsatpHvalues,wherethecompoundisunionizedandformsasuspension(solidmaterialispresentinthesolution).Thetitrantisdispensedaccuratelyandslowlyintotheslurry,todrivethepHof thesolution inthedirectionofdissolution.Typically,a3‐10h(some‐timeslonger)timeframeisrequiredfortheentireequilibriumsolubilitydatacol‐lection(20‐50pHpoints)[41].Themethod,whenperformedwiththepSOLtit‐rator(pION,US),providesaprecisesolubility‐pHprofilewithoutassumingaHHrelationship and is much faster than the SSF method but still has a very lowthroughput.
Thenovelpotentiometricprocedure (CheqSol)hasbeendevelopedrecently forrapidmeasurement of solubility using the instrument called the GLpKa‐D‐PAS(Sirius, UK). In this method, the equilibrium solubility is actively sought bychanging the concentration of the neutral (unionized) form of a compound byaddingacidorbasetitrantsandmonitoringtherateofthechangeofpH,duetoprecipitation or dissolution in a process called “Chasing Equilibrium”. In thismethod,thetitrationisstartedatpHvalue,wherethecompoundisfullyionizedand dissolved and performed toward the direction of pHwhere the unionizedform precipitates. The turbidity of the solution caused by the precipitation isdetectedwithafiberopticdipprobe.Withthismethodboththekineticsolubilityandtheequilibriumsolubilitycanbedetermined.Thekineticsolubilityvalue is
Physicochemicalprofilingindrugresearchanddevelopment
35
obtained from the concentration when the first precipitation of the unionizedform appears in the solution,while the equilibrium solubility is obtained fromactively seeking the equilibrium pH where an equal amount of the sample isprecipitatinganddissolvingperunitof time[86].TheCheqSolmethod is faster(typically 30–60min/compound) because the intrinsic solubility is determinedinstead of the entire solubility‐pH profile. Then HH equation is used for thecalculationoftheapproximatelogS/pHprofile.ItwasvalidatedagainsttheSSFmethodandexcellentagreementofsolubilityresultswasfound[87].
1.3.2.2.3. μDISSmethod
Aminiaturized rotating disk dissolution instrument, called μDISS ProfilerPLUS(pION,US)hasbeendevelopedforcharacterizingtheintrinsicdissolutionrateinearly preformulation. This apparatus is also suitable for the measurement ofequilibriumsolubilityofsparinglysolublecompounds,providedenoughmaterialisusedtomaintainthesaturation[41,88,89].Inthisprocedure,5mgofdrugarecompressed into pellets and inserted into a rotating disk carrier containing anembeddedmagnetic stir bar at its bottom.This assembly is placed into a glassvialfilledwithasmallvolume(1‐3ml)ofaqueousbufferasthedissolutionmedi‐um.TheconcentrationismeasuredwitharapidinsitufiberopticUV(diodear‐ray)detector.The instrumentemployssixparalleldissolutionvesselsandeightchannels ofUVdetectorswhichprovidebetter capacity above the SSFmethod.Overthehighprecision,furtheradvantagesofthismethodare:(i)anypolymorphchangesduringdissolutioncanberecognizedand(ii)thelongerincubationtimeneededtoestablishthetrueequilibriumofthemoststableformofasolidmaybeevidentinthedissolutioncurve[39].
1.3.2.2.4. Highthroughputmethods
SomemethodssuitableformediumorhighthroughputdeterminationoflogSwerealsodescribed.Theminiaturisedshake‐flask(MSF)methoddevelopedbyGlommeetal. [90,91] isa compoundsavingand fastmethod, thus it is frequentlyused inpharmaceutical companies.Typically, 0.1‐0.2mg solidpowder is introduced to aspeciallydesignedfilterchamberandasmall(e.g.2ml)volumeofaqueousbufferisadded.Purpose‐built filtercapsare firmlyattachedandthevialsareshakenatconstant temperature for 24 h. The filter‐containing cap compartments are thendepressedtoeffectseparationofthesolidandthetopcompartmentsolutionsareanalyzed by fast gradient RP‐HPLC. The throughput is just medium, as 20compounds/week canbemeasured.TheMSFmethodwas furtherdeveloped forHTmeasurementsbyZhouetal.[92]wherea96‐wellplateisusedasthesourceofthesamplesandDMSOstockswereevaporatedviaaGeneVacevaporator.
Those96‐wellplatebasedHTmethods(originallydevelopedforkineticsolubilitymeasurement),wheretheincubationtimeislongenough(e.g.μSOLmethod,[39])and the effect of DMSO content is eliminated, are also suitable for equilibriumsolubility determination. Generally, in these modified‐microplate methods the24h incubation time is adequate to reach the solubility equilibrium [39].
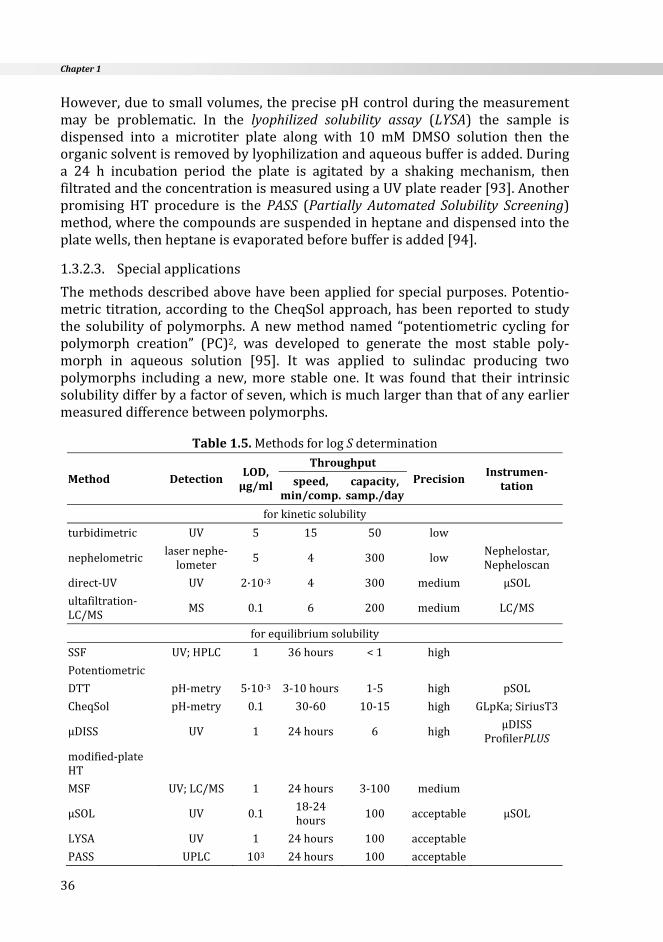
Chapter1
36
However,duetosmallvolumes,theprecisepHcontrolduringthemeasurementmay be problematic. In the lyophilized solubility assay (LYSA) the sample isdispensed into a microtiter plate along with 10 mM DMSO solution then theorganicsolventisremovedbylyophilizationandaqueousbufferisadded.Duringa 24 h incubation period the plate is agitated by a shaking mechanism, thenfiltratedandtheconcentrationismeasuredusingaUVplatereader[93].Anotherpromising HT procedure is thePASS (PartiallyAutomated Solubility Screening)method,wherethecompoundsaresuspendedinheptaneanddispensedintotheplatewells,thenheptaneisevaporatedbeforebufferisadded[94].
1.3.2.3. Specialapplications
Themethodsdescribedabovehavebeenappliedforspecialpurposes.Potentio‐metric titration,accordingto theCheqSolapproach,hasbeenreportedtostudythe solubility of polymorphs.A newmethodnamed “potentiometric cycling forpolymorph creation” (PC)2, was developed to generate the most stable poly‐morph in aqueous solution [95]. It was applied to sulindac producing twopolymorphs including a new,more stable one. Itwas found that their intrinsicsolubilitydifferbyafactorofseven,whichismuchlargerthanthatofanyearliermeasureddifferencebetweenpolymorphs.
Table1.5.MethodsforlogSdetermination
Method DetectionLOD,μg/ml
ThroughputPrecision
Instrumen‐tationspeed,
min/comp.capacity,samp./day
forkineticsolubility
turbidimetric UV 5 15 50 low
nephelometriclasernephe‐lometer
5 4 300 lowNephelostar,Nepheloscan
direct‐UV UV 2·10‐3 4 300 medium μSOL
ultafiltration‐LC/MS
MS 0.1 6 200 medium LC/MS
forequilibriumsolubility
SSF UV;HPLC 1 36hours <1 high
Potentiometric
DTT pH‐metry 5·10‐3 3‐10hours 1‐5 high pSOL
CheqSol pH‐metry 0.1 30‐60 10‐15 high GLpKa;SiriusT3
μDISS UV 1 24hours 6 highμDISS
ProfilerPLUS
modified‐plateHT
MSF UV;LC/MS 1 24hours 3‐100 medium
μSOL UV 0.118‐24hours
100 acceptable μSOL
LYSA UV 1 24hours 100 acceptable
PASS UPLC 103 24hours 100 acceptable

Physicochemicalprofilingindrugresearchanddevelopment
37
Thebiorelevantsolubilityvaluesaremoreandmorerequiredindrugdiscoveryand development (DD&D). An optimized 96‐well HTUV solubilitymethodwasadaptedtomeasuresolubilityofdrugsinbiorelevantmediasuchasFaSSIFandFeSSIF solutions [96]. The method provides reliable data using a very smallamount of sample and small volumes of the expensive FaSSIF/FeSSIF compo‐nents.TheμDISSmethodwasalsofounduseful formeasurementinbiorelevantmedia and temperature [97]. The study has revealed that the majority of thetesteddrugsexhibitedhighersolubilityinthesemediathaninpurebuffers.
1.3.3. logPdetermination
Since log P is the oldest parameter in physicochemical profiling, several well‐established experimental methods are available for its determination. Vastamountsofliteraturehavedescribedthetheoryandpracticeoftheusedmethods[e.g.11,46,98‐101].AspectsfromtheGLPguideforlogPmeasurementshavealsobeen published [98,101,102]. The recent reviews provide a comprehensivesurveyaboutthelatestdevelopmentsinHTtechniques[6,9,14‐16].
TwotypesofmethodscanbedistinguishedforlogPdetermination:(i)thedirectapproaches, where log P is directly obtained from the measured data (shake‐‐flask,stir‐flask, filterchamber,dual‐phasepotentiometric,etc.)and(ii) indirect(chromatographic, CE) techniques,where themeasuredparameterhas a linearrelationshipwithlogPandlogPiscalculatedusingcalibrationequations.Inthischapter,thedirectmethodsareoverviewed,outoftheindirectmethodsonlyTLCispresented,whileotherslikeHPLC,MECK,etc.usedforlogPmeasurementarediscussedelsewhereinthebook.
Inordertofacilitatethecomparisonoftheircapacity,Table1.6summarizesbothtypesofmethods.
1.3.3.1. Shake‐flask(SF)method
The traditional SFmethod is the reference andmost widely used approach oflogPdetermination.
Procedure.Inadvance,thetwophases(n‐octanolorotherusefulpartitionorganicsolvent that is immiscible with water and aqueous buffer) must be mutuallysaturated with vigorous agitation then filtered or centrifuged. The testedsubstanceisdissolvedintheaqueousphaseandintroducedintoanappropriateglassvial.Octanol(orotherorganicsolvent) isaddedinarequiredvolumeandthe system is shaken at a constant temperature for a period long enough forequilibrium to be achieved (generally 1 h). After separation of the phases bycentrifugation, the concentration is measured using an appropriate method,mostlyUVspectroscopy.Concerningthedifficultiesofthepreciseanalyticalworkwithoctanol, it isa commonpractice tomeasure theconcentrationdecrease intheaqueousphasebydetectingtheabsorbancebeforeandafterthepartition.
Accuracy, sourcesof the experimentalerror.The SFmethod is suitable for logPmeasurementintherangefrom–2to5havingaSD<0.05,providedthatoptimal

Chapter1
38
experimentalconditionsaremaintained.Manyfactorscanaffectthereliabilityofthe measured log P values increasing the experimental error. One of them isundoubtedly theappliedextremephaserationecessary in thecaseof lipophiliccompounds(logP>3).Accordingtoourexperiences,thehighestphaseratiothatcan be used without a considerable increase in error is R = 500 (e.g. 50mlaqueousbuffer:0.1mloctanol).However, intheoppositecasewithhydrophiliccompounds, when more octanol has to be used, the sampling from the loweraqueous phase may be problematic, thus it is advisable to remove the upperoctanol layerbeforealiquotsaretaken.Glassandsurfaceadsorption, formationof stable emulsions, and the presence of impurities in the sample have ofteninfluencedtheresults.
Advantages/drawbacks. Themain advantage of the SFmethod is its simplicity,sufficient accuracy, and applicability to non‐ionizable compounds. But it hassome well‐known shortcomings, such as being tedious and time‐consuming,difficultieswithmaintainingaconstanttemperatureduringthewholeprocedure,requiringrelativelyhighamountsofsampleandsolvent.TheSFmethodcannotbe used for UV inactive compounds unless alternative detection methods areemployed,andsoon.
1.3.3.2. Potentiometricmethod
Dualphasepotentiometrictitrationusingautomatedinstrumentshasbecomethe“goldstandard”oflogPdetermination(forionizablecompounds)inthepasttenyears [11,60,100]. It consists of two titrations of the tested compound. One isperformedwithoutthepartitionsolventandprovidestheaqueouspKavalue.Thesecond is done using the same conditions but in the presence of a partitionsolvent(e.g.octanol)withintensivestirringupontitrantaddition,whilestoppingitwhen the pH ismeasured. If the unionized formof the compoundpartitionsintooctanolthenthetwotitrationcurveswillbedifferent,duetoashift(similarto what was discussed in the co‐solvent pKa method). From the dual‐phasetitration, the apparent poKa value is obtained. Log P is calculated from thedifferences in pKa values and the phase ratio. A large shift indicates highlipophilicity(seealsoinSection1.4.3).
Thismethod allows the logP determination in a range from ‐2 to 6,with veryhigh precision (SD = ± 0.01). The agreement with the SF method is excellentaccording to validation studies [103,104].However, it has limited capacity andcannot be used for compoundswith pKa out of the establishedmeasurable pHrange.Afurtherdrawbackisthatonlyalimitedphaseratiocanbeapplied(inourpracticewithGLpKa:20mlwater:0.05mloctanolforlipophiliccompoundsand5mlofwater:15mlofoctanolforhydrophiliccompounds).Anewlydevelopedinstrument(SiriusT3)hasfurtherincreasedefficacyandmeasurementispossibleinaslowas1mlaqueousphase.

Physicochemicalprofilingindrugresearchanddevelopment
39
1.3.3.3. IndirectlogPmeasurementmethods
Because of the drawbacks and limitations of direct methods, numerousalternative procedures have been developed and applied. Several micellar,microemulsion, vesicle electrokinetic chromatographic systems, and reversed‐phase chromatographic methods (RP‐TLC, RP‐HPLC) can be used to estimatelipophilicity. Some excellent reviews on the use of separation methods forindirectlogPdeterminationhavebeenpublished[e.g.105‐106].
AlthoughRP‐HPLCismorewidelyusedtechniqueforlogPestimation[105],RP‐TLC undoubtedly has some unique advantages, including use of less expensivelaboratoryequipmentandbeingeasytoperform.Simultaneousrunningof15‐20compounds on one plate can significantly reduce the analysis time per com‐pound.Themethod isbasedonthe linearrelationshipbetween logPmeasuredbytheSFmethodandthelogarithmofchromatographicretentionexpressedasthe RM value. RP‐TLC has been successfully applied for logP measurement ofhighlylipophilicmoleculesusingcalibrationequationsobtainedwithstructurallyrelated compounds [e.g. 107‐109]. Recently, a validated RP‐TLC method wasproposedforparallelestimationofthelipophilicityofchemicallydiverseneutralcompoundsorweakacidsandbases[110].Tocoverawiderangeoflipophilicity,two optimized RP‐TLC systems were used: one for moderate lipophilic com‐pounds(logP=0‐3)andanotherforhighlylipophilicmolecules(logP=3‐6).Two chemicallydiverse sets of compoundswere selected to set up the generalcalibrationequations.Themethodwas testedwith20randomlyselecteddrugsand good agreement with SF results were found (SD < 0.15).With automatedsamplingand imagingdetectionof thecompoundsthemethodcanberegardedas a possible alternative for rapid and acceptable accurate estimation of lipo‐philicityofdrugcandidatesintheearlyphaseofDD&D.
1.3.3.4. Highthroughputmethods
Attempts have been done to miniaturize the traditional SF method into amicrotiter plate platform with robotic liquid handling and HPLC/UV [111] orLC/MS [112] detection. In these techniques the partitioning process istransferred to 96‐deep well plates and after equilibration, the detector signalproducedbya sample fromtheoctanolphase isdividedby thesignal fromtheaqueousphase. InareviewbyKerns[7], thecriticalelementsofthesemethodsarediscussed.AcommerciallyavailableautomatedplatebasedinstrumentforHTlogPdeterminationiscalledtheAlogP(Analiza,US).
Regarding indirect (HPLC and MECK) log P methods, additional successfulstrategieswere applied to increase the throughput and speed up the determi‐nationtime[16].Forexample, theuseofshortcolumnsandahigh flowrate inHPLC,usageofUPLC,andmultiplexedMECKhavebeenreported.ThesemethodsaresurveyedintheChapter2ofthisbook.

Chapter1
40
1.3.3.5. Decisiontreeformethodselection
ThemethodselectionstrategyfollowedinthelaboratoryoftheauthorisshowninFigure1.13.
Figure1.13.DecisiontreeformethodselectionoflogPmeasurement
Table1.6.MethodsforlogPdetermination
MethodlogPrange
sampleamount,mg
ThroughputPrecision Instrumentationspeed,
min/comp.capacity,samp./day
direct methods
shake-flask
traditional -2 ↔ 5 2-10 180-360 2 high
automated (96-well plate
platform) -2 ↔ 5 1-5 10 100 acceptable
AlogP (Analiza Inc.)
potentiometric -2 ↔ 6 1-5 60 20 high GLpKa, SiriusT3
indirect methods
RP-TLC 0 ↔ 6 1-3 120 50 medium
RP-HPLC -1 ↔ 6 0.01 15 100 acceptable
MEEKC -1 ↔ 7 << 1 15 150 acceptable CePro 9600, MCE 2000
log P prediction
Shake-flask
pH-metric
expected log P-2 5
solubility >1mM
RP-TLCRP-HPLC
chromophore
ionizable
compound
YESYES
YESYES
NO
NONO
NO
log P prediction
Shake-flask
pH-metric
expected log P-2 5
solubility >1mM
RP-TLCRP-HPLC
chromophore
ionizable
compound
YESYES
YESYES
NO
NONO
NO
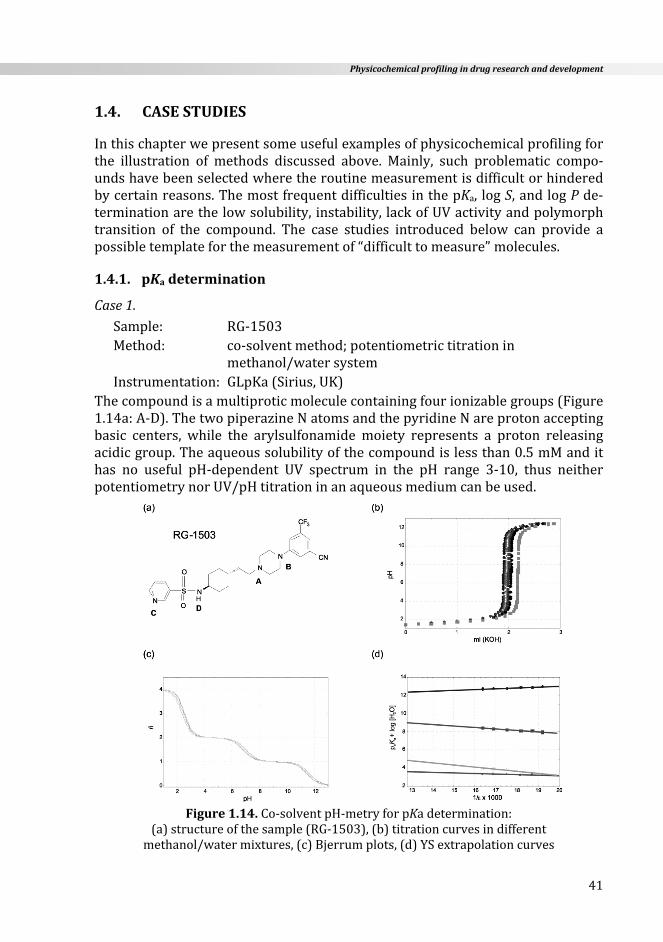
Physicochemicalprofilingindrugresearchanddevelopment
41
1.4. CASESTUDIES
Inthischapterwepresentsomeusefulexamplesofphysicochemicalprofilingforthe illustration of methods discussed above. Mainly, such problematic compo‐undshavebeenselectedwheretheroutinemeasurementisdifficultorhinderedbycertainreasons.ThemostfrequentdifficultiesinthepKa, logS,andlogPde‐terminationarethelowsolubility,instability,lackofUVactivityandpolymorphtransition of the compound. The case studies introduced below can provide apossibletemplateforthemeasurementof“difficulttomeasure”molecules.
1.4.1. pKadetermination
Case1.Sample: RG‐1503Method: co‐solventmethod;potentiometrictitrationin
methanol/watersystemInstrumentation:GLpKa(Sirius,UK)
Thecompoundisamultiproticmoleculecontainingfourionizablegroups(Figure1.14a:A‐D).ThetwopiperazineNatomsandthepyridineNareprotonacceptingbasic centers, while the arylsulfonamide moiety represents a proton releasingacidicgroup.Theaqueoussolubilityofthecompoundislessthan0.5mMandithas no useful pH‐dependent UV spectrum in the pH range 3‐10, thus neitherpotentiometrynorUV/pHtitrationinanaqueousmediumcanbeused.
Figure1.14.Co‐solventpH‐metryforpKadetermination:
(a)structureofthesample(RG‐1503),(b)titrationcurvesindifferentmethanol/watermixtures,(c)Bjerrumplots,(d)YSextrapolationcurves

Chapter1
42
The pKa values weremeasured by potentiometry using the co‐solventmethod(seeSection1.3.1.4).Sixtitrationswereperformedinmethanol/watermixtures(40‐60wt%)betweenpH1.5 ‐12.5 in~1mMconcentrationof thesample,at0.15M(KCl) ionicstrength,at25.0±0.1°C temperature,underN2atmosphere(Figure 1.14.b). From the obtained psKa values, the aqueous pKa values werecalculatedbyYSextrapolation(Figure1.14d).
Results:pKa1=2.02±0.22(Bgroup);pKa2=3.03±0.09(Cgroup);pKa3=7.35±0.03(Agroup);pKa4=11.40±0.09(Dgroup).
Case2.Sample: nitrofurantoinMethod: co‐solventmethod;UV/pHtitrationinMDM/watersystemInstrumentation: GLpKa+D‐PAS(Sirius,UK)
Nitrofurantoinisawater‐insolublecompoundwhichhasoneacidicgroupandex‐hibits a pH‐dependent UV spectrum. The pKa value was measured in anMDM/watersystembecauseitssolubilityishighenoughinthissolventmixturefor the spectroscopic determination. A stock solution was prepared in 10mMconcentrationwithMDM,50μlofthisstocksolutionwasusedforthetitrationin15mlof20‐50wt%MDM/watermixturesbetweenpH3‐10,at0.15M(KCl)ionicstrength,at25.0±0.1°Ctemperature,underN2atmosphere.Figure1.15.cshowsthepsKavaluesusedforYSextrapolation.TheextrapolatedaqueouspKavalueis:6.87 ± 0.01 (R2= 0.9958), which is in good agreement with literature datameasuredbyothermethods[76].
Figure1.15.Co‐solventUV/pHtitrationforpKadetermination:
(a)structureofthesample(nitrofurantoin),(b)pH‐dependentUVspectra,(c)apparentpKavaluesindifferentMDM/watermixtures,(d)YSextrapolation
(a) nitrofurantoin
N
ON
O2N
ONH
O
R(wt%) psKa± SD
17.6
25.4
36.6
43.4
48.8
7.05 ± 0.05
7.16 ± 0.05
7.33 ± 0.05
7.46 ± 0.05
7.58 ± 0.05
(c)
(b)
(d)
250 300 350 400 450 500Wavelength (nm)
0,0
0,2
0,4
0,6
0,8
1,0
Absorbance
psKa + log[H2O] = 60.4/?+ 7.837
(a) nitrofurantoin
N
ON
O2N
ONH
O
R(wt%) psKa± SD
17.6
25.4
36.6
43.4
48.8
7.05 ± 0.05
7.16 ± 0.05
7.33 ± 0.05
7.46 ± 0.05
7.58 ± 0.05
(c)
(b)
(d)
250 300 350 400 450 500Wavelength (nm)
0.0
0.2
0.4
0.6
0.8
1.0
Abs
orba
nce
13 14 15 16
1/ x 1000
8.6
8.7
8.8
8.9
9.0
9.1
psK
a +
log[
H2O
]
psKa + log[H2O] = 60.4/ε + 7.837

Physicochemicalprofilingindrugresearchanddevelopment
43
Case3.
Sample: lisinoprilMethod: potentiometrictitrationinaqueoussolutionandin
methanol/watersystem;NMR/pHtitrationInstrumentation: GLpKa+D‐PAS(Sirius,UK);VarianInova600MHz
spectrometer(PaloAlto,CA)Lisinopril isatetraproticcompoundhavingtwoacidic(carboxyl)andtwobasic(a primary and a secondary amine) groups. Figure 1.16a shows the ionizationprocessesofthemolecule.Thedissociationofthetwocarboxylgroupsishighlyoverlapping.Thesolubilityoflisinopril(0.22M)allowsthedeterminationofpKavaluesbythestandardpotentiometricmethodinaqueousmedium.However,thefirst dissociation constant falls into the low pH range which may causeuncertaintyofthemeasurement.
For the characterization of the acid/base property of the molecule, threeindependentmethodswereapplied:potentiometryinaqueoussolutionandinamethanol/watersystem,aswellasNMR/pHtitration.Inaqueousmedium,threetitrationswerecarriedoutina2mMconcentrationsolution,betweenpH1.8‐12,at 0.15 M (KCl) ionic strength, at 25.0 ± 0.1 °C temperatures, under N2atmosphere.SincepKa1valuefallsbelowthelowerapplicabilitylimit(<2)ofpH‐metrictitration,thepKavalueswerealsomeasuredusingtheco‐solventmethod.
Figure1.16.Protonationschemeof(a)tetraproticlisinopril,
(b)distributionofmacrospecies
(a)
(b)
2 4 6 8 10 12
pH
0
20
40
60
80
100
% Species
H4Lis2+
H3Lis+
H2Lis HLis-
Lis2-
N
O
NH COO
NH2
COO
N
O
NH COO
NH3
COO
NO
NH2 COO
NH3
COO
NO
NH2 COOH
NH3
COO
N
O
NH2 COOH
NH3
COOH+ H+
+ H+ +
H+ +
H+
H4Lis2+H3Lis+
H2LisHLis-Lis2-
(a)
(b)
2 4 6 8 10 12
pH
0
20
40
60
80
100
% S
peci
es
H4Lis2+
H3Lis+
H2Lis HLis-
Lis2-
H4Lis2+
H3Lis+
H2Lis HLis-
Lis2-
N
O
NH COO
NH2
COO
N
O
NH COO
NH3
COO
NO
NH2 COO
NH3
COO
NO
NH2 COOH
NH3
COO
N
O
NH2 COOH
NH3
COOH+ H+
+ H+ +
H+ +
H+
H4Lis2+H3Lis+
H2LisHLis-Lis2-

Chapter1
44
The apparent pKa values of the COOH groups obtained in 14‐44 wt% metha‐nol/water mixtures shifted up to the established measurable pH range, and areliableaqueouspKa1valuecouldbeobtainedbyYSextrapolation.
Fortheexactprotonspeciationoflisinopril,1HNMR/pHtitrationswithinsitupHmeasurementswerecarriedout,usingthemostsimilarexperimentalconditionsaspossible inpotentiometry.Thismethodwasuseful toassigntheconstantstothefunctionalgroups:pKa1andpKa2belongtotheCOOHgroups,pKa3referstothesecondary amine (–NH–), and pKa4 shows the basicity of the primary amine(–NH2)function.
The highly precise pKa values were calculated as an average of the best twovaluesobtainedbyindependentmethods(Table1.7).Thesevalueswereusedtocalculate the distribution curve of different protonated species of lisinoprilagainstthepH(Figure1.16b).
Table1.7.ThepKavaluesoflisinoprilmeasuredbydifferentmethods
methodionizationconstants
pKa1±SD pKa2±SD pKa3±SD pKa4±SD
potentiometry 1.54±0.05 3.10±0.01 7.14±0.01 10.74±0.01
potentiometryinsolventmixtures 1.62±0.01 3.21±0.02 7.22±0.03 10.75±0.01
NMR/pHtitration 1.63±0.01 3.15±0.01 7.12±0.01 10.53±0.03
averageofthebesttwovalues 1.63±0.01 3.13±0.01 7.13±0.01 10.75±0.01
1.4.2. logSdetermination
Case4.Sample: hydrochlorothiazideMethod: SSFInstrumentation:RadiometerPH220pHmeter;LAUDAM20Sthermostat;
HeidolphMR1000magneticstirrer;JASCOV‐550UV/VISspectrophotometer
HydrochlorothiazideisabivalentacidwithpKavalues:8.75and9.88.Itsintrinsicsolubility(So)valuewasmeasuredatpH6.0usingtheSSFmethod[81].
First the So of the sample was measured according to a standard (literature)protocol with the following conditions. Buffer: Britton‐Robinson (BR); solidexcess:smallamount;temperature:25.0±0.1°C;equilibrationtime:48hstirringplus 24 h sedimentation; phase separation technique: sedimentation; concen‐tration measurement: UV spectroscopy (λ=271 nm, A1%1cm: 696); number ofparallels:6.Result:So=556±13.2μg/ml.
Next,differentparametersofthisprotocolwereexamined,alwaysoneofthesixparameters(bufferchoice,amountofsolidexcess,temperature,timeofstirring,timeof sedimentation, phase separation technique)was variedwhile theotherconditionswerekeptunchanged.
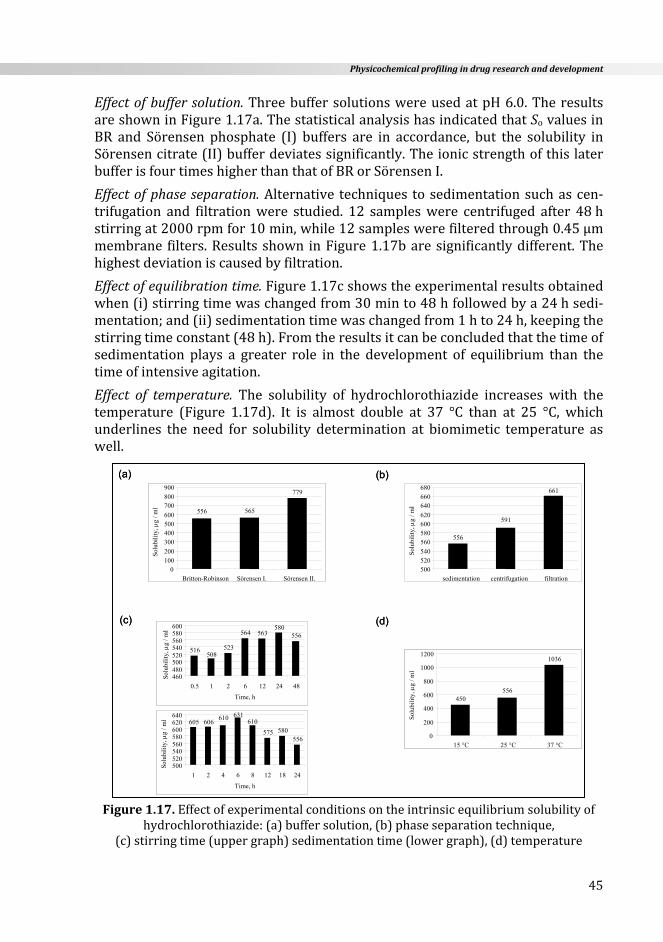
Physicochemicalprofilingindrugresearchanddevelopment
45
Effectofbuffersolution.ThreebuffersolutionswereusedatpH6.0.TheresultsareshowninFigure1.17a.ThestatisticalanalysishasindicatedthatSovaluesinBR and Sörensen phosphate (I) buffers are in accordance, but the solubility inSörensencitrate(II)bufferdeviatessignificantly.TheionicstrengthofthislaterbufferisfourtimeshigherthanthatofBRorSörensenI.
Effectofphaseseparation.Alternative techniques tosedimentationsuchascen‐trifugation and filtrationwere studied. 12 sampleswere centrifuged after 48hstirringat2000rpmfor10min,while12sampleswerefilteredthrough0.45μmmembrane filters.Resultsshown inFigure1.17baresignificantlydifferent.Thehighestdeviationiscausedbyfiltration.
Effectofequilibrationtime.Figure1.17cshowstheexperimentalresultsobtainedwhen(i)stirringtimewaschangedfrom30minto48hfollowedbya24hsedi‐mentation;and(ii)sedimentationtimewaschangedfrom1hto24h,keepingthestirringtimeconstant(48h).Fromtheresultsitcanbeconcludedthatthetimeofsedimentation plays a greater role in the development of equilibrium than thetimeofintensiveagitation.
Effect of temperature. The solubility of hydrochlorothiazide increases with thetemperature (Figure 1.17d). It is almost double at 37 °C than at 25 °C, whichunderlines the need for solubility determination at biomimetic temperature aswell.
Figure1.17.Effectofexperimentalconditionsontheintrinsicequilibriumsolubilityof
hydrochlorothiazide:(a)buffersolution,(b)phaseseparationtechnique,(c)stirringtime(uppergraph)sedimentationtime(lowergraph),(d)temperature
(a)
(c)
(b)
(d)
779
565556
0100200
300400500600
700800900
Britton-Robinson Sörensen I. Sörensen II.
Solubility ,
g / ml
556
661
591
500520540
560580600620
640660680
sedimentation centrifugation filtration
Sol
ubil
ity,
g / m
l
516 523
564 563580
556
508
460480500520540560580600
0.5 1 2 6 12 24 48
Time [h]
Solubility , g / ml
575 580556
610631610606605
500520540560580600620640
1 2 4 6 8 12 18 24
Time [h]
Solubility ,
g / ml
450
1036
556
0
200
400
600
800
1000
1200
15 °C 25 °C 37 °C
Solubility ,
g / ml
(a)
(c)
(b)
(d)
779
565556
0100200
300400500600
700800900
Britton-Robinson Sörensen I. Sörensen II.
Sol
ubil
ity,
g / m
l
516 523
564 563580
556
508
460480500520540560580600
0.5 1 2 6 12 24 48
Time, h
Sol
ubil
ity,
g / m
l
575 580556
610631610
606605
500520540560580600620640
1 2 4 6 8 12 18 24
Time, h
Sol
ubil
ity,
g / m
l
450
1036
556
0
200
400
600
800
1000
1200
15 °C 25 °C 37 °C
Sol
ubil
ity,
g / m
l
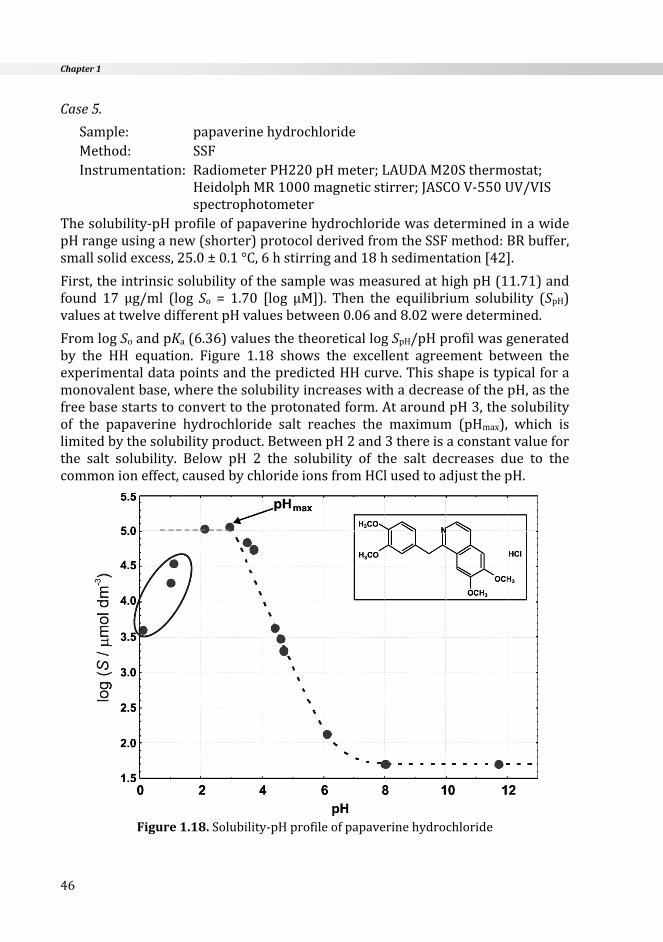
Chapter1
46
Case5.
Sample: papaverinehydrochlorideMethod: SSFInstrumentation: RadiometerPH220pHmeter;LAUDAM20Sthermostat;
HeidolphMR1000magneticstirrer;JASCOV‐550UV/VISspectrophotometer
Thesolubility‐pHprofileofpapaverinehydrochloridewasdeterminedinawidepHrangeusinganew(shorter)protocolderivedfromtheSSFmethod:BRbuffer,smallsolidexcess,25.0±0.1°C,6hstirringand18hsedimentation[42].
First,theintrinsicsolubilityofthesamplewasmeasuredathighpH(11.71)andfound 17 μg/ml (log So = 1.70 [log μM]). Then the equilibrium solubility (SpH)valuesattwelvedifferentpHvaluesbetween0.06and8.02weredetermined.
FromlogSoandpKa(6.36)valuesthetheoreticallogSpH/pHprofilwasgeneratedby the HH equation. Figure 1.18 shows the excellent agreement between theexperimentaldatapointsandthepredictedHHcurve.Thisshapeistypicalforamonovalentbase,wherethesolubilityincreaseswithadecreaseofthepH,asthefreebasestartstoconverttotheprotonatedform.AtaroundpH3,thesolubilityof the papaverine hydrochloride salt reaches the maximum (pHmax), which islimitedbythesolubilityproduct.BetweenpH2and3thereisaconstantvalueforthe salt solubility. Below pH 2 the solubility of the salt decreases due to thecommonioneffect,causedbychlorideionsfromHClusedtoadjustthepH.
Figure1.18.Solubility‐pHprofileofpapaverinehydrochloride

Physicochemicalprofilingindrugresearchanddevelopment
47
This example proves that the HH equation can be used for the calculation ofsolubility at physiological importantpHvaluesonce the intrinsic solubility andthepKavaluehavebeenpreciouslydetermined[42].
Case6.Sample: telmisartanMethod: SSFInstrumentation: RadiometerPH220pHmeter;LAUDAthermostat;Heidolph
MR1000magneticstirrer;JASCOV‐550UV/VISspectrophotometer
Thesolubilityoftelmisartanwasmeasuredindistilledwater(ordinarilypH~6)andat37±0.1°Ctemperature(oneoftheconditionswheresolubilityisrequiredbytheregistrationauthorities).Solidmaterialat0.01gwasaddedto20mlfresh‐lyboiledandcooledwaterandthenthenew(shorter)protocolderivedfromtheSSFmethodwasfollowed.Aliquotsweretakenoutfromthesupernatantandtheabsorbancewasmeasuredwithoutdilutionatλ=295nm, inacellwitha5cmpathlength.TheconcentrationwascalculatedusingA1%1cm=510measuredsepa‐rately prior to solubility measurement. From three parallel experiments, thesolubilityof telmisartanwas foundas lowasSpH=0.50±0.09μg/ml.The relati‐velyhigherror(SD=±18%)isduetotheverylowsolubility(thelowestvaluewecouldevermeasurebytheSSFmethod)andtheoccasionallyformedsupersa‐turated solution, fromwhich small (invisible) particles precipitated in the celluponabsorbancemeasurement.
Case7.Sample: maprotilineMethod: SSFandCheqSolInstrumentation: RadiometerPH220pHmeter;LAUDAthermostat;Heidolph
MR1000magneticstirrer;JASCOV‐550UV/VISspectrophotometerandGLpKa+D‐PAS
Theprecise intrinsic solubility ofmaprotiline base (pKa= 10.33) ‐ another verysparinglysolublecompound‐couldnotbedeterminedby theSSFmethod.Theresultobtainedfromthreeseparatemeasurements inBRbufferatpH11.5wasSo=8.05±3μg/ml. The reason for the extremely high experimental error(SD=±37%) is that a colloid, slightly opalescent solution (perhaps due to re‐crystallization or supersaturation) was formed upon equilibration. This opale‐scence could be eliminated by neither filtration nor centrifugation. So, the SSFsolubility resultmust be considered as an approximate value. Thus, the poten‐tiometricmethod,namelytheChasingEquilibriumSolubility(CheqSol)wasalsoapplied.Maprotilinewasadded(2mg)to10mlof0.15MKClsolutionthenpre‐acidifiedwith0.5MHCl topH2wherethecompoundwas fullydissolved.Thissolutionwas titratedwith 0.5M KOH until the solution became cloudy,whichindicatedtheprecipitationofthefreebaseform.Theoccurrenceofprecipitationwas detected using a spectroscopic dip probe then the solution was quickly
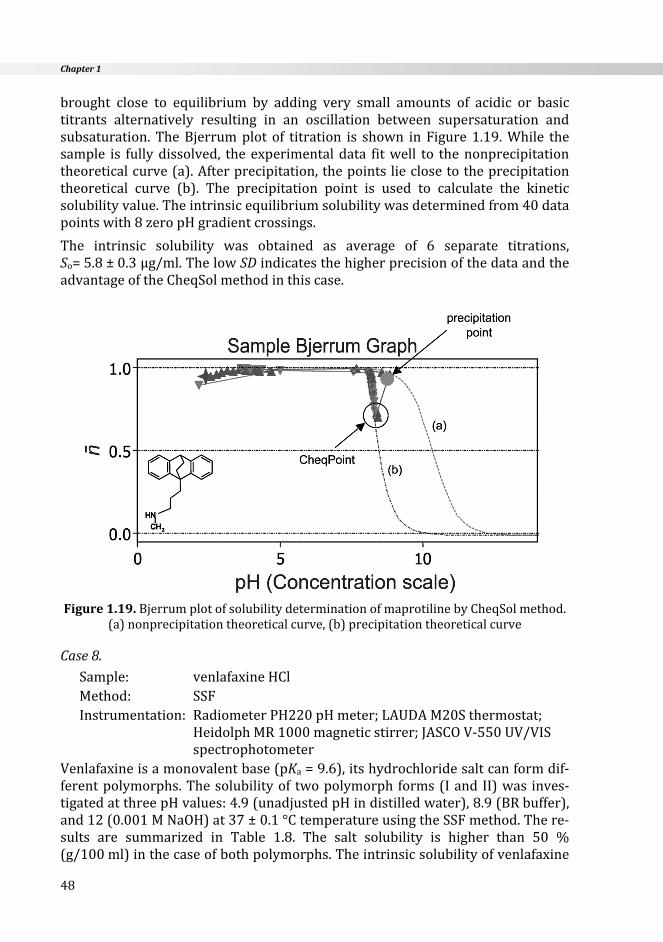
Chapter1
48
brought close to equilibrium by adding very small amounts of acidic or basictitrants alternatively resulting in an oscillation between supersaturation andsubsaturation. TheBjerrumplot of titration is shown in Figure1.19.While thesample is fullydissolved, theexperimentaldata fitwell to thenonprecipitationtheoreticalcurve(a).Afterprecipitation,thepointslieclosetotheprecipitationtheoretical curve (b). The precipitation point is used to calculate the kineticsolubilityvalue.Theintrinsicequilibriumsolubilitywasdeterminedfrom40datapointswith8zeropHgradientcrossings.
The intrinsic solubility was obtained as average of 6 separate titrations,So=5.8±0.3μg/ml.ThelowSDindicatesthehigherprecisionofthedataandtheadvantageoftheCheqSolmethodinthiscase.
Figure1.19.BjerrumplotofsolubilitydeterminationofmaprotilinebyCheqSolmethod.
(a)nonprecipitationtheoreticalcurve,(b)precipitationtheoreticalcurve
Case8.Sample: venlafaxineHClMethod: SSFInstrumentation: RadiometerPH220pHmeter;LAUDAM20Sthermostat;
HeidolphMR1000magneticstirrer;JASCOV‐550UV/VISspectrophotometer
Venlafaxineisamonovalentbase(pKa=9.6),itshydrochloridesaltcanformdif‐ferentpolymorphs.Thesolubilityof twopolymorphforms(IandII)was inves‐tigatedatthreepHvalues:4.9(unadjustedpHindistilledwater),8.9(BRbuffer),and12(0.001MNaOH)at37±0.1°CtemperatureusingtheSSFmethod.There‐sults are summarized in Table 1.8. The salt solubility is higher than 50 %(g/100ml)inthecaseofbothpolymorphs.Theintrinsicsolubilityofvenlafaxine

Physicochemicalprofilingindrugresearchanddevelopment
49
measured at pH 12 was also found to be the same for both I and II forms(So=460±10μg/ml).
Thediffractionanalysisofthesolidphasefilteredoutattheendofthesolubilitymeasurement revealed thatpolymorphs I and II equally converted to the samecrystal formof freebasevenlafaxine.Thisexperienceunderscores theneed foranalysisofthesolidphaseaftertheequilibriumstatehasbeenreached.
Table1.8.Solubility(g/100ml)oftwopolymorphformsofvenlafaxinehydrochlorideatthreepHvaluesandat37°Ctemperature
venlafaxinehydrochloride SpH(pH4.9) SpH(pH8.9) So(pH12.0)
FormI >50 0.180 0.046
FormII >50 0.208 0.046
1.4.3. logPdetermination
Case9.Sample: chlorpromazineMethod: SSFInstrumentation: LAUDAM20Sthermostat;Hawlett‐Packard8452AUV/VIS
spectro‐photometerChlorpromazine isavery lipophilicmonovalentbase(pKa:9.24).The true logPvaluecannotbemeasuredathighpHvalues(>11.5)directlybytheSFmethodbecauseofthelowsolubilityofthefreebaseformofthecompoundathighpH.Insuchcases(whichistypicalamongdrugs),thelogDpHismeasuredatdifferentpHvaluesatwhichthemoleculepartiallyionizesanddissolvesbetterandthenitisconverted to the true log P using Equation 1.30b. The log DpH values ofchlorpromazineweremeasuredatthreepHvalues(7.4,8.0and8.5)inBRbufferastheaqueousphase,usinganR=200and100phaseratios(50mlbuffer:0.25mloctanoland25mlbuffer:0.25mloctanol).WefollowedthestandardprotocoloftheSFmethod:1hintensiveshakinginashakingthermostat;phaseseparationbycentrifugation(730gfor10min).Theabsorbanceoftheaqueousphasebefore(Ao) and after (A1) thepartitionwasmeasuredby spectroscopy atλ = 254nm.Theapparentpartitioncoefficient iscalculatedaccording toDpH= [(Ao‐A1)/A1]R[104].Thelipopilicity‐pHprofileisshowninFigure1.20.
Result:logP=5.13±0.10(n=18)
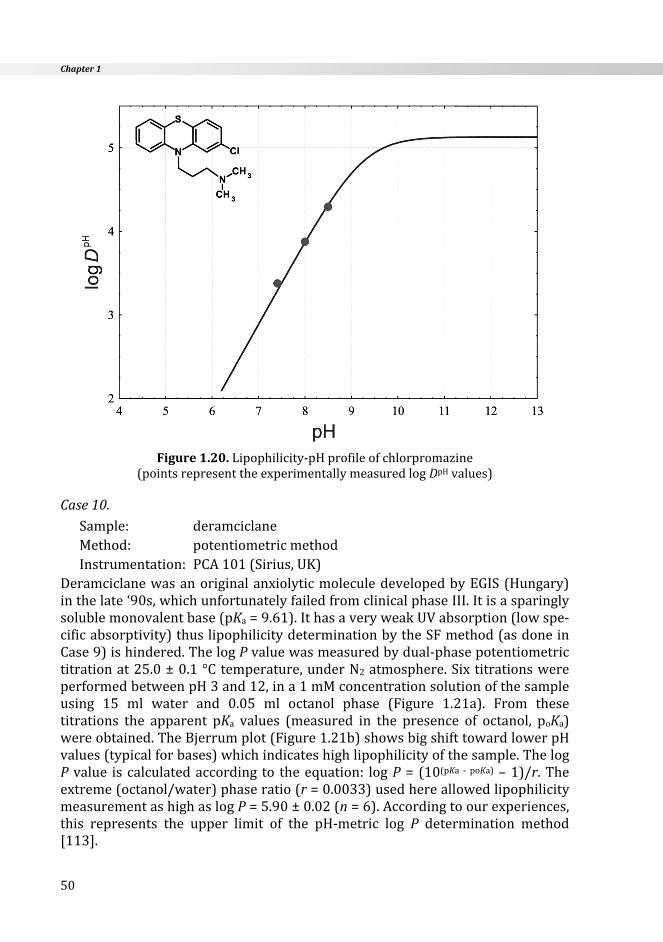
Chapter1
50
Figure1.20.Lipophilicity‐pHprofileofchlorpromazine
(pointsrepresenttheexperimentallymeasuredlogDpHvalues)
Case10.Sample: deramciclaneMethod: potentiometricmethodInstrumentation: PCA101(Sirius,UK)
DeramciclanewasanoriginalanxiolyticmoleculedevelopedbyEGIS(Hungary)inthelate‘90s,whichunfortunatelyfailedfromclinicalphaseIII.Itisasparinglysolublemonovalentbase(pKa=9.61).IthasaveryweakUVabsorption(lowspe‐cificabsorptivity)thuslipophilicitydeterminationbytheSFmethod(asdoneinCase9)ishindered.ThelogPvaluewasmeasuredbydual‐phasepotentiometrictitrationat25.0±0.1°C temperature,underN2atmosphere.SixtitrationswereperformedbetweenpH3and12,ina1mMconcentrationsolutionofthesampleusing 15 ml water and 0.05 ml octanol phase (Figure 1.21a). From thesetitrations the apparent pKa values (measured in the presence of octanol, poKa)wereobtained.TheBjerrumplot(Figure1.21b)showsbigshifttowardlowerpHvalues(typicalforbases)whichindicateshighlipophilicityofthesample.ThelogP value is calculatedaccording to theequation: logP= (10(pKa ‐ poKa) –1)/r.Theextreme(octanol/water)phaseratio(r=0.0033)usedhereallowedlipophilicitymeasurementashighaslogP=5.90±0.02(n=6).Accordingtoourexperiences,this represents the upper limit of the pH‐metric log P determination method[113].

Physicochemicalprofilingindrugresearchanddevelopment
51
Figure1.21.pH‐metriclogPdeterminationofderamciclane:
(a)titrationcurvesinthepresenceofdifferentamountsofoctanol,(b)Bjerrumplot
Case11.Sample: prostaglandinE1‐ethylester(PGEE)Method: RP‐TLCInstrumentation: RP‐diC1silanizedplates,Merck#5747;Camag
microsampler;ShimadzuCS‐9301CPdensitometerPGEE isanexample formoleculeswhereclassical, standardmethodscannotbeapplied. Due to the lack of useful UV absorption (above λ > 230 nm) or anionizablegroup,neithertheSFnorpH‐metrycanbeused.LogPwasdeterminedbyavalidatedRP‐TLCmethod.
Measurementwasperformedon20cmx20cmplatesprecoatedwithsilanizedsilicagelGF254asthestationaryphaseandmethanol/water(55:45)asthemobilephase. Before use, the plates were washed with methanol (ascending deve‐lopment), thendriedandheatedat160°Cfor1h.Thesamples(PGEEandcali‐bration set)weredissolved in a 1 : 1methanol/chloroformmixture (2mg/ml)and2μlwasspottedon theplate.Thechamberwassaturatedwith themobilephase for 30 min before use. After development the plates were dried andevaluatedbydensitometry.
The calibration curve was set up using seven compounds [114] and obtainedfromthreeparallelruns:logP=3.508RM+0.968(r=0.995,n=21).ThelogPofPGEEwascalculatedwiththehelpofthisequation.
Result:logPTLC=4.02±0.05(n=3).
CH3OH
COOC2H5
O
OH
Chapter1
52
1.5. OUTLOOK
Concerning theroleofphysicochemicalprofiling in the future,wecancertainlypredict that it remains an integrated part of drug research providing a simple,cheap,andfasttoolfortheestimationofADMETparametersintheearlystageofDD&D.
A higher level of automation (e.g. integration of several robotic platforms) andhighersensitivityofdetectionmethodscanbeexpectedleadingtotheincreaseofthe HT feature of the applied methods, but it must be synchronous with theimprovement of the reliability of the data determined. Next to this, the cost‐effectivenesswillbethecritical factor intheselectionbetweenmethodshavingthesamecapacity.
We can anticipate the increasing application of biorelevant experimentalconditions inphysicochemicalprofiling.Standardizationandvalidationof thesebiomimeticsystemsareobviouslynecessaryinthenearfuture.
The use of in silico methods will be growing if further development ofcomputational approaches results in even more reliable data. For the in silicomethodsbasedonbigdatabasesthequalityof the inputofexperimentalvaluesmustbefurtherimproved.
Finally,moreeffectiveusageofphysicochemicalprofilingindrugresearchcanbepromotedby including informative coursesor seminars, for example, in highereducationtostrengthenthisspecialfieldofmedicinalchemistryinacademia.
Acknowledgement
Iwould liketothankmycolleagueGergelyVölgyi,PhDforhisexperimentalwork,valuablesuggestions,andhelpinpreparingthefigures.IalsothanktheHungarianNationalScienceFoundation(GrantNo.:OTKAK78102)forfinancialsupport.
REFERENCES
1. J. Wang, L. Urban. The impact of early ADME profiling on drug discovery anddevelopmentstrategy.DrugDiscoveryWorldFall(2004)73‐86.
2. C. Hansch, P.P. Maloney, T. Fujita, R. Muir. Correlation of biological activity ofphenoxyacetic acids with Hammett substituent constants and partitioncoefficients.Nature194(1962)178‐180.
3. G.K.Dixon, J.P.Major,M.J.Rice. ,HighThroughputScreening:TheNextGenerationBios,Oxford,2000.
4. K. Takács‐Novák, G. Völgyi. Physicochemical profiling in drug research.MagyarKémiaiFolyóirat111(2005)169‐176(Hungrian).
5. B.Testa,H.vandeWaterbeemd,G.Folkers,R.Guy.,PharmacokineticOptimizationinDrugResearch.Biological,Physicochemical,andComputationalStrategies,Wiley‐VHCA,Zürich,2001.

Physicochemicalprofilingindrugresearchanddevelopment
53
6. L.Di,E.H.Kerns,G.T.Carter.Drug‐likepropertyconceptsinpharmaceuticaldesign.CurrentPharmaceuticalDesign15(2009)2184‐2194.
7. E.H.Kerns.Highthroughputphysicochemicalprofilingfordrugdiscovery.JournalofPharmaceuticalSciences90(2001)1838‐1858.
8. L.Di,E.H.Kerns.Applicationofpharmaceuticalprofilingassaysforoptimizationofdrug‐likeproperties.CurrentOpinioninDrugDiscoveryandDevelopment8(2005)495‐504.
9. E.H.Kerns,L.Di.Automationinpharmaceuticalprofiling.JournaloftheAssociationforLaboratoryAutomation10(2005)114‐123.
10. P.J.Taylor.Hydrophobicpropertiesofdrugs.InC.Hansch,P.G.Sammes,J.B.Taylor,H.Lennernäs.(Eds.),ComprehensiveMedicinalChemistryVol.4,Pergamon,Oxford,1990,pp241‐294.
11. A. Avdeef.AbsorptionandDrugDevelopment: Solubility,PermeabilityandChargeState.Wiley,NewYork,2003.
12. A.Avdeef, B.Testa. Physicochemical profiling in drug research: abrief survey ofthestate‐of‐the‐artofexperimentaltechniques.CellularandMolecularLifeSciences59(2002)1681‐1689.
13. E.H. Kerns, L. Di. Physicochemical profiling: overview of the screens. DrugDiscoveryToday:Technologies1(2004)343‐348.
14. H. Wan, A.G. Holmén. High throughput screening of physicochemical propertiesand invitroADMEprofiling indrugdiscovery.CombinatorialChemistryandHighThroughputScreening12(2009)315‐329.
15. J.Wang, S. Skolnik. Recent advances in physicochemical andADMETprofiling indrugdiscovery.ChemistryandBiodiversity6(2009)1887‐1899.
16. Y.Henchoz,B.Bard,D.Guillarme,P‐A.Carrupt, J‐L.Veuthey,S.Martel.Analyticaltools for the physicochemical profiling of drug candidates to predictabsorption/distribution.Analytical andBioanalytical Chemistry394 (2009) 707‐729.
17. A.Pagliara,M.Reist,S.Geinoz,P‐A.Carrupt,B.Testa.Evaluationandpredictionofdrugpermeation.JournalofPharmacyandPharmacology51(1999)1339‐1357.
18. E.Kerns, L. Li.Drug‐likeproperties: concepts, structuredesignandmethods: fromADMEtotoxicityoptimization.Elsevier,SanDiego,2008.
19. J.K. Seydel, M. Wiese. Drug‐membrane interactions. Analysis, drug distribution,modeling.In:R.Mannhold,H.Kubinyi,G.Folkers.(Eds),MethodsandPrinciplesinMedicinalChemistry.Wiley‐VCH,Weinheim,2002.
20. P.A. Shore, B.B. Brodie, C.A.M. Hogben. The gastric secretion of drugs: a pHpartitionhypothesis.JournalofPharmacologyandExperimentalTherapeutics119(1957)361‐369.
21. R.P.Austin,A.M.Davis, C.N.Manners.Partitioningof ionizingmoleculesbetweenaqueousbuffersandphospholipidvesicles. JournalofPharmaceuticalSciences84(1995)1180‐1183.
22. A. Avdeef, K. Box, J.E. Comer, C. Hibbert, K.Y. Tam. pH‐metric logP. 10.Determinationofvesiclemembrane‐waterpartitioncoefficientsofionizabledrugs.PharmaceuticalResearch15(1998)209‐215.

Chapter1
54
23. S.D.Krämer,D.Lombardi,A.Primorac,A.V.Thomae,H.Wunderli‐Allenspach.Lipidbilayer permeationof drug‐like compounds.ChemistryandBiodiversity6 (2009)1900‐1916.
24. Y. Sai, A. Tsuji. Transporter‐mediated drug delivery: recent progress andexperimentalapproaches.DrugDiscoveryToday9(2004)712‐720.
25. R. Didziapertis, P. Japertas, A. Avdeef, A. Petrauskas. Classification analysis of P‐glycoproteinsubstratespecificity.JournalofDrugTargeting11(2003)391‐406.
26. A.Albert,E.P.Serjeant.TheDeterminationofIonizationConstants.3rded.Chapman&Hall,London,1984.
27. B.Noszál. Acid‐base properties of bioligands. InK. Burger, (Ed):BiocoordinationEquilibriainBiologicallyActiveSystems.EllisHorwood,Chichester,1990,pp18‐55.
28. K. Takács‐Novák, B. Noszál, I. Hermecz, G. Keresztúri, B. Podányi, G. Szász.Protonation equilibria of quinolone antibacterials. Journal of PharmaceuticalSciences79(1990)1023‐1028.
29. K.Mazák,S.Hosztafi,Á.Rácz,B.Noszál.Structuralandphysicochemicalprofilingofmorphine and related compounds of therapeutic interest. Mini‐Reviews inMedicinalChemistry9(2009)984‐995.
30. K. Kóczián, G. Völgyi, J. Kökösi, B. Noszál. Site‐specific acid‐base properties oftenoxicam.HelveticaChimicaActa90(2007)1681‐1690.
31. A.Dogan,E.Kilic.Tautomeric andmicroscopicprotonationequilibriaof someα‐aminoacids.AnalyticalBiochemistry365(2007)7‐13.
32. K. Takács‐Novák, B. Noszál, M. Tőkés‐Kövesdi, G. Szász. Acid‐base properties ofterbutaline in terms of protonation macro‐ and microconstants. Journal ofPharmacyandPharmacology47(1995)431‐435.
33. A. Marosi, Z. Kovács, S. Béni, J. Kökösi, B. Noszál. Triprotic acid‐basemicroequilibria and pharmacokinetic sequelae of cetirizine. European Journal ofPharmaceuticalSciences37(2009)321‐328.
34. Z. Szakács, M. Kraszni, B. Noszál. Determination of microscopic acid‐baseparameters from NMR‐pH titrations. Analytical and Bioanalytical Chemistry 378(2004)1428‐1448.
35. N.Sum,A.Avdeef.BiorelevantpKa(37°C)predictedfromthe2DstructureofthemoleculeanditspKaat25°C.JournalofPharmaceuticalandBiomedicalAnalysis56(2011)173‐182.
36. H.H.Cocolas.Antiarrhythmicdrugs.InJ.N.Delgado,W.A.Remers.(Eds),WilsonandGisvold’sTextbookofOrganicMedicinalandPharmaceuticalChemistry.9thedition,Lippincott,NewYork,1991pp.546‐555.
37. S.H.Yalkowsky,S.Banerjee.AqueousSolubility:MethodsofEstimation forOrganicCompounds.MarcelDekker,NewYork,1992.
38. D.J.W.Gant,T.Higuchi.SolubilityBehaviorofOrganicCompounds.Wiley,NewYork,1990.
39. A.Avdeef.Solubilityof sparingly‐soluble ionizabledrugs.AdvancedDrugDeliveryReviews59(2007)568‐590.
40. C.A.S.Bergström,K.Luthman,P.Artursson.AccuracyofcalculatedpH‐dependentaqueous drug solubility.European Journal ofPharmaceutical Sciences22 (2004)387‐398.
Physicochemicalprofilingindrugresearchanddevelopment
55
41. A. Avdeef, D. Voloboy, A. Foreman. Dissolution‐solubility: pH, buffer, salt, dual‐solid, and aggregation effects. In B.Testa, H. van de Waterbeemd. (Eds):Comprehensive Medicinal Chemistry II. Vol. 5. ADME‐TOX Approaches, Elsevier,Oxford,2007pp.399‐423.
42. G. Völgyi, E. Baka, K. Box, J.E. Comer, K. Takács‐Novák. Study of pH‐dependentsolubility of organic bases. Revisit of Henderson‐Hasselbalch relationship.AnalyticaChimicaActa673(2010)40‐46.
43. G.L. Amidon, H. Lennernäs, V.P. Shah, J.R. Crison. A theoretical bases for abiopharmaceutic drug classification: The correlation of in vitro drug productdissolution and in vivo bioavailability. Pharmaceutical Research 12 (1995) 413‐420.
44. J.B.Dressmann,M.Vertzoni,K.Goumas,C.Reppas.Estimatingdrugsolubilityinthegastrointestinaltract.AdvancedDrugDeliveryReviews59(2007)591‐602.
45. A. Leo, C. Hansch, D. Elkins. The partition coefficients and their uses. ChemicalReviews71(1971)525‐616.
46. A.Avdeef.Assessmentofdistribution‐pHprofiles. InV.Pliska,B.Testa,H.vandeWaterbeemd. (Eds),Methods and Principles inMedicinal Chemistry. Vol. 4. CVH,Weinheim,1996pp.109‐139.
47. K. Takács‐Novák, M. Józan, G. Szász. Lipophilicity of amphoteric moleculesexpressedbythetruepartitioncoefficient. International JournalofPharmaceutics113(1995)47‐55.
48. N.P.Franks,M.H.Abraham,W.R.Lieb.Molecularorganizationof liquidn‐octanol:An X‐ray diffraction analysis. JournalofPharmaceutical Sciences82 (1993) 466‐470.
49. D.E. Leahy, P.J. Taylor, A.R.Wait. Model solvent systems for QSAR. 1. Propyleneglycol dipelargonate (PGDP). A new standard for use in partition coefficientdetermination.QuantitativeStructure‐ActivityRelationships8(1989)17‐31.
50. G.P.van Balen, C.A.M. Martinet, G. Caron, G. Bouchard, M. Reist, P‐A. Carrupt, R.Fruttero, A. Gasco, B. Testa. Liposome/water lipophilicity: Methods, informationcontent,andpharmaceuticalapplication.MedicalResearchReviews24(2004)299‐324.
51. S. Krämer. Liposome/water partitioning: theory and applications. In B. Testa, H.van de Waterbeemd, G. Folkers, R. Guy. (Eds), Pharmacokinetic Optimization inDrug Research. Biological, Physicochemical, and Computational Strategies, Wiley‐VHCA,Zürich,2001.
52. C.A. Lipinski, F. Lombardo B.W. Dominy, P.J. Feeney. Experimental andcomputational approaches to estimate solubility and permeability in drugdiscoveryanddevelopmentsettings.AdvancedDrugDeliveryReviews23(1997)3‐25.
53. C. Hansch, J.P. Björkroth, A. Leo. Hydrophobicity and central nervous systemagents: On the principle of minimal hydrophobicity in drug design. Journal ofPharmaceuticalSciences76(1987)663‐687.
54. G. Ferenczy, G.M. Keserű. Thermodynamics guided lead discovery andoptimization.DrugDiscoveryToday15(2010)919‐932.
55. Z.Szakács,G.Hägele.AccuratedeterminationoflowpKvaluesby1HNMRtitration.Talanta,62(2004)819‐825.

Chapter1
56
56. H. Hegedűs, A. Gergely, P. Horváth, B. Noszál. Acid‐base properties of biologicalphenyl‐alkyl‐amines, characterized by CD‐pH titration. Journal of ChemicalResearchSynopses(1999)306‐307.
57. F.Z. Oumada, C. Ràfols, M. Rosés, E. Bosch. Chromatographic determination ofaqueous dissociation constants of some water‐insoluble nonsteroidal anti‐inflammatorydrugs.JournalofPharmaceutialSciences91(2002)991‐999.
58. K. Box, J.E. Comer. Using measured pKa, logP and solubility to investigatesupersaturationandpredictBCSclass.CurrentDrugMetabolism9(2008)869‐878.
59. A.Avdeef,J.J.Bucher.Accuratemeasurementoftheconcentrationofhydrogenionswithaglasselectrode:CalibrationsusingthePrideauxandotheruniversalbuffersolutions and a computer‐controlled automatic titrator. Analytical Chemistry 50(1978)2137‐2142.
60. J.E.Comer. High‐throughput measurement of logD and pKa. In P. Artursson, H.Lennernäs, H. van de Warterbeemd. (Eds),Methods and Principles inMedicinalChemistry.Vol.18.Wiley‐CVH,Weinheim,2003pp.21‐45.
61. R.I. Allen, K. Box, J.E. Comer, C. Peake, K.Y. Tam. Multiwavelengthspectrophotometric determination of acid dissociation constants of ionisabledrugs.JournalofPharmaceuticalandBiomedicalAnalysis17(1998)699‐712.
62. K.Y.Tam,K.Takács‐Novák.Multiwavelengthspectrophotometricdeterminationofaciddissociationconstants:avalidationstudy.AnalyticaChimicaActa434(2001)157‐167.
63. Z. Mandić, V. Gabelica. Ionization, lipophilicity and solubility properties ofrepaglinide.JournalofPharmaceuticalandBiomedicalAnalysis41(2006)866‐871.
64. M‐H. Langlois, M. Montagut, J‐P. Dubost, J. Grellet, M‐C. Saux. Protonationequilibrium and lipophilicity of moxifloxacin. Journal of Pharmaceutical andBiomedicalAnalysis37(2005)389‐393.
65. M. Tollinger, J.D. Forman‐Kay, L.E. Kay.Measurement of side‐chain carboxyl pKavaluesofglutamateandaspartateresiduesinanunfoldedproteinbymultinuclearNMRspectroscopy.JournalofAmericanChemicalSociety124(2002)5714‐5717.
66. Z. Szakács, S. Béni, Z. Varga, L. Őrfi, G. Kéri, B. Noszál. Acid‐base profiling ofimatinibanditsfragments.JournalofMedicinalChemistry48(2005)249‐255.
67. Z. Jia. Physicochemical profiling by capillary electrophoresis. CurrentPharmaceuticalAnalysis1(2005)41‐56.
68. S.Babić,A.J.M.Horvat,D.MutavdžićPavlović,M.Kaštelan‐Macan.DeterminationofpKavaluesofactivepharmaceuticalingredients.TrendsinAnalyticalChemistry26(2007)1043‐1061.
69. S.K. Poole, S. Patel, K. Dehring, H. Workman, C.F. Poole. Determination of aciddissociation constants by capillary electrophoresis. JournalofChromatographyA1037(2004)445‐454.
70. S. Pang, J. Kenseth, S. Coldiron. High throughput multiplexed capillaryelectrophoresisindrugdiscovery.DrugDiscoveryToday9(2004)1072‐1080.
71. K. Box, J.E. Comer, P. Hosking, K.Y. Tam, L. Trowbridge, A. Hill. Rapidphysicochemicalprofilingasanaidtodrugcandidateselection. InG.K.Dixon, J.S.Major, M.J. Rice (Eds), High Throughput Screening: The Next Generation. Bios,Oxford,2000,pp.67‐74.
Physicochemicalprofilingindrugresearchanddevelopment
57
72. K. Box, C. Bevan, J.E. Comer, A. Hill, R. Allen, D. Reynolds. High‐throughputmeasurementofpKavaluesinamixed‐bufferlinearpHgradientsystem.AnalyticalChemistry75(2003)883‐892.
73. A.Avdeef,J.E.Comer,S.J.Thomson.pH‐metriclogP.3.Glasselectrodecalibrationinmethanol/water, applied to pKa determination of water‐insoluble substances.AnalyticalChemistry65(1993)42‐49.
74. K. Takács‐Novák, K.Box, A. Avdeef. Potentiometric pKa determination of water‐insolublecompounds:validationstudyinmethanol/watermixtures.InternationalJournalofPharmaceutics151(1997)235‐248.
75. K.Box,G.Völgyi,R.Ruiz,J.E.Comer,K.Takács‐Novák,E.Bosch,C.Ràfols,M.Rosés.PhysicochemicalpropertiesofanewmulticomponentcosolventsystemforthepKadetermination of poorly soluble pharmaceutical compounds. Helvetica ChimicaActa90(2007)1538‐1553.
76. G.Völgyi,R.Ruiz,K.Box,J.E.Comer,E.Bosch,K.Takács‐Novák.PotentiometricandspectrophotometricpKadeterminationofwater‐insoluble compounds:Validationstudyinanewcosolventsystem.AnalyticaChimicaActa583(2007)418‐428.
77. C.Lipinski.Computationalandexperimentalapproachestoavoidingsolubilityandoralabsorptionproblemsinearlydiscovery.InR.Borchard(Ed),DesigningDrugswithOptimalinVivoActivityafterOraladministration.DrewUniversityResidentialSchoolonMedicinalChemistry,Madison,NJ.2000.
78. C.Bevan,R.S.Lloyd.Ahighthroughputscreeningmethodforthedeterminationofaqueoussolubilitybylasernephelometryinmicrotitreplates.AnalyticalChemistry72(2000)1781‐1787.
79. A.Avdeef.High‐throughputmeasurementsofsolubilityprofiles.InB.Testa,H.vandeWaterbeemd, G. Folkers, R. Guy (Eds), PharmacokineticOptimization inDrugResearch.Biological, Physicochemical, and Computational Strategies,Wiley‐VHCA,Zürich,2001.pp.305‐326.
80. T. Yamashita, Y. Dohta, T. Nakamura, T. Fukami. High‐speed solubility screeningassayusingultra‐performanceliquidchromatography/massspectrometryindrugdiscovery.JournalofChromatographyA1182(2008)72‐76.
81. E.Baka,J.E.Comer,K.Takács‐Novák.Studyofequilibriumsolubilitymeasuredbysaturation shake‐flask method using hydrochlorothiazide as model compound.JournalofPharmaceuticalandBiomedicalAnalysis46(2008)335‐341.
82. E. Baka. Good laboratory practice of equilibrium solubility measurements. ActaPharmaceuticaHungarica81(2011)18‐28(Hungarian).
83. A.Avdeef.pH‐metricsolubility.1.SolubilitypHprofilesfromBjerrumplots.GibbsbufferandpKa in thesolid state.PharmacyandPharmacologyCommunications4(1998)165‐178.
84. A. Avdeef, C.M. Berger, C. Brownell. pH‐metric solubility. 2. Correlation betweenthe acid‐base titration and the saturation shake‐flask solubility‐pH methods.PharmaceuticalResearch17(2000)85‐89.
85. A. Avdeef, C.M. Berger. pH‐metric solubility. 3. Dissolution titration templatemethodforsolubilitydetermination.European JournalofPharmaceuticalSciences14(2001)281‐291.
86. M.Stuart,K.Box.Chasingequilibrium:measuringoftheintrinsicsolubilityofweakacidsandbases.AnalyticalChemistry77(2005)983‐990.
Chapter1
58
87. K. Box, G. Völgyi, E. Baka, M. Stuart, K. Takács‐Novák, J.E. Comer. Equilibriumversuskineticmeasurementsofaqueoussolubilityandtheabilityofcompoundstosupersaturateinsolution.Avalidationstudy.JournalofPharmaceuticalSciences95(2006)1298‐1307.
88. A. Avdeef, O. Tsinman. Miniaturized rotating disk intrinsic dissolution ratemeasurement: Effect of buffer capacity in comparisons to traditional Wood’sapparatus.PharmaceuticalResearch25(2008)2613‐2627.
89. K. Tsinman, A. Avdeef , O. Tsinman, D. Voloboy. Powder dissolutionmethod forestimating rotating disk intrinsic dissolution rates of low solubility drugs.PharmaceuticalResearch26(2009)2093‐2100.
90. A. Glomme, J. März, J.B. Dressman. Comparison of a miniaturized shake‐flasksolubility method with automated potentiometric acid/base titrations andcalculatedsolubilities.JournalofPharmaceuticalSciences94(2005)1‐16.
91. A. Glomme, J. März, J.B. Dressman. Predicting the intestinal solubility of poorlysoluble molecules. In B. Testa, S.D. Krämer, H. Wunderli‐Allenspach, G. Folkers(Eds),PharmacokineticProfilinginDrugResearch:Biological,PhysicochemicalandComputationalStrategies,Wiley‐VCH,Weinheim,2006.pp259‐280.
92. L. Zhou, L. Yang, L., S. Tilton, J. Wang. Development of a high throughputequilibriumsolubility assayusingminiaturized shake‐flaskmethod inearlydrugdiscovery.JournalofPharmaceuticalSciences96(2007)3052‐3071.
93. A.T.Serajuddin.Saltformationtoimprovedrugsolubility.AdvancedDrugDeliveryReviews59(2007)603‐616.
94. J. Alsenz, E. Meister, E. Haenel. Development of a partially automated solubilityscreening (PASS) assay for early drug development. Journal of PharmaceuticalSciences96(2007)1748‐1762.
95. A.Llinàs,K.Box,J.Burley,R.Glen,J.Goodman.Anewmethodforthereproduciblegenerationofpolymorphs: two formsof sulindacwith verydifferent solubilities.JournalofAppliedCrystallography40(2007)379‐381.
96. B.Bard,S.Martel,P‐A.Carrupt.HighthroughputUVmethodfortheestimationofthermodynamic solubility and the determination of the solubility in biorelevantmedia.EuropeanJournalofPharmaceuticalSciences33(2008)230‐240.
97. J.Fagenberg,O.Tsinman,N.Sun,K.Tsinman,A.Avdeef,C.Bergström.Dissolutionrate and apparent solubility of poorly soluble drugs in biorelevant dissolutionmedia.MolecularPharmaceutics7(2010)1419‐1430.
98. A. Hersey, A. Hill, R. Hyde, D. Livingstone. Principles of method selection inpartitionstudies.QuantitativeStructure‐ActivityRelationships8(1989)288‐296.
99. L‐G. Danielsson, Y‐H. Zhang. Methods for determining n‐octanol‐water partitionconstants.TrendsinAnalyticalChemistry15(1996)188‐196.
100. J.E.Comer,K.Tam.Lipophilicityprofiles:theoryandmeasurement.InB.Testa,B.,H.vandeWaterbeemd,G.Folkers,R.Guy(Eds),PharmacokineticOptimization inDrug Research. Biological, Physicochemical, and Computational Strategies, Wiley‐VHCA,Zürich,2001.pp.275‐304.
101. J.C.Dearden,G.M.Bresnen.Themeasurementofpartitioncoefficient.QuantitativeStructure‐ActivityRelationships7(1988)133‐144.
Physicochemicalprofilingindrugresearchanddevelopment
59
102. K. Takács‐Novák. Practical aspects of determination of partition coefficientaccording to GLP rules. Acta Pharmaceutica Hungarica 67 (1997) 179‐191(Hungarian).
103. B. Slater, A.McCormack, A. Avdeef, J.E. Comer. pH‐metric logP. 4. Comparisonofpartition coefficients determined by shake‐flask, HPLC and potentiometricmethods.JournalofPharmaceuticalSciences83(1994)1280‐1283.
104. K.Takács‐Novák,A.Avdeef.InterlaboratorystudyoflogPdeterminationbyshake‐flask and potentiometric methods. Journal of Pharmaceutical and BiomedicalAnalysis14(1996)1405‐1413.
105. K. Valkó. Application of high‐performance liquid chromatography basedmeasurements of lipophilicity to model biological distribution. Journal ofChromatographyA1037(2004)299‐310.
106. R. Kaliszan. QSRR: Quantitative structure‐(chromatographic) retentionrelationships.ChemicalReviews107(2007)3212‐3246.
107. G.L.Biagi,A.M.Barbaro,A.Sapone,M.Recenatini.Determinationoflipophilicitybymeans of reversed‐phase thin‐layer chromatography. I. Basic aspects andrelationship between slope and intercept in TLC equations. Journal ofChromatographyA662(1994)341‐361.
108. A.Pyka,M.Babuska.Lipophilicityofselectedsteroidcompounds.I.InvestigationsonRP18WstationaryphasebyRP‐HPTLC. JournalofLiquidChromatographyandRelatedTechnologies29(2006)1891‐1903.
109. Z. Rozmer, P. Perjési, K. Takács‐Novák. Use of RP‐TLC for logP determination ofisomeric chalcones and cyclic chalcone analogues. Journal of PlanarChromatography19(2006)124‐128.
110. G. Völgyi, K. Deák, J. Vámos, K. Valkó, K. Takács‐Novák. RPTLC determination oflogPofstructurallydiverseneutralcompounds.JournalofPlanarChromatography21(2008)143‐149.
111. L. Hitzel, A.P. Watt, K.L. Locker. An increased throughput method for thedeterminationofpartitioncoefficients.PharmaceuticalResearch17(2000)1389‐1395.
112. D.M.Wilson,X.Wang,E.Walsh,R.A.Rourick.HighthroughputlogDdeterminationusing liquid chromatography‐mass spectrometry. Combinatorial Chemistry andHighThroughputScreening4(2001)511‐519.
113. K. Takács‐Novák. Investigation of physicochemical properties of deramciclane(EGIS‐3886), a new anxiolytic compound. Acta Pharmaceutica Hungarica 69(1999)123‐127(Hungarian).
114. K.Takács‐Novák,P.Perjési,J.Vámos.DeterminationoflogPforbiologicallyactivechalconesand chalconeanalogsbyRPTLC. JournalofPlanarChromatography14(2001)42‐46.