Physicochemical Profiling (Solubility, Permeability and Charge State)
75
Current Topics in Medicinal Chemistry 2001, 1, 277-351 277 1568-0266/01 $28.00+.00 © 2001 Bentham Science Publishers Ltd. Physicochemical Profiling (Solubility, Permeability and Charge State) Alex Avdeef* pION INC, 5 Constitution Way, Woburn, MA 01801, USA Abstract: About 30% of drug candidate molecules are rejected due to pharmacokinetic- related failures. When poor pharmaceutical properties are discovered in development, the costs of bringing a potent but poorly absorbable molecule to a product stage by "formulation" can become very high. Fast and reliable in vitro prediction strategies are needed to filter out problematic molecules at the earliest stages of discovery. This review will consider recent developments in physicochemical profiling used to identify candidate molecules with physical properties related to good oral absorption. Poor solubility and poor permeability account for many PK failures. FDA's Biopharmaceutics Classification System (BCS) is an attempt to rationalize the critical components related to oral absorption. The core idea in the BCS is an in vitro transport model, centrally embracing permeability and solubility, with qualifications related to pH and dissolution. The objective of the BCS is to predict in vivo performance of drug products from in vitro measurements of permeability and solubility. In principle, the framework of the BCS could serve the interests of the earliest stages of discovery research. The BCS can be rationalized by considering Fick's first law, applied to membranes. When molecules are introduced on one side of a lipid membrane barrier (e.g., epithelial cell wall) and no such molecules are on the other side, passive diffusion will drive the molecules across the membrane. When certain simplifying assumptions are made, the flux equation in Fick's law reduces simply to a product of permeability and solubility. Many other measurable properties are closely related to permeability and solubility. Permeability (P e ) is a kinetic parameter related to lipophilicity (as indicated by the partition and distribution coefficients, log P and log D). Retention (R) of lipophilic molecules by the membrane (which is related to lipophilicity and may predict PK volumes of distribution) influences the characterization of permeability. Furthermore, strong drug interactions with serum proteins can influence permeability. The unstirred water layer on both sides of the membrane barrier can impose limits on permeability. Solubility (S) is a thermodynamic parameter, and is closely related to dissolution, a kinetic parameter. The unstirred water layer on the surfaces of suspended solids imposes limits on dissolution. Bile acids effect both solubility and dissolution, by a micellization effect. For ionizable molecules, pH plays a crucial role. The charge state that a molecule exhibits at a particular pH is characterized by the ionization constant (pK a ) of the molecule. Buffers effect pH gradients in the unstirred water layers, which can dramatically affect both permeability and dissolution of ionizable molecules. In this review, we will focus on the emerging instrumental methods for the measurement of the physicochemical parameters P e , S, pK a , R, log P, and log D (and their pH-profiles). These physicochemical profiles can be valuable tools for the medicinal chemists, aiding in the prediction of in vivo oral absorption. 1 GENERAL BACKGROUND "It is now almost a century since Overton and Meyer first demonstrated the existence of a relationship between the biological activity of a series of compounds and some simple physical property common to its members. In the intervening years the germ of their discovery has grown into an understanding whose ramifications extend into medicinal chemistry, agrochemical and pesticide research, environmental pollution and even, by a curious re-invention of familiar territory, some areas basic to the science of chemistry itself. Yet its further exploitation was long delayed. It was 40 years later that Ferguson at ICI applied similar principles to a rationalization of the comparative activity of gaseous anaesthetics, and 20 more were to pass before the next crucial step was formulated in the mind of *Address correspondence to this author at the pION INC, 5 Constitution Way, Woburn, MA 01801, USA; Tel: +1 781 935 8939; Fax: +1 781 935 8938; E-mail: [email protected] Hansch. ... Without any doubt, one major factor [for delay] was compartmentalism. The various branches of science were much more separate then than now. It has become almost trite to claim that the major advances in science take place along the borders between its disciplines, but in truth this happened in the case of what we now call Hansch analysis, combining as it did aspects of pharmacy, pharmacology, statistics and physical organic chemistry. Yet there was another feature that is not so often remarked, and one with a much more direct contemporary implication. The physical and physical organic chemistry of equilibrium processes – solubility, partitioning, hydrogen bonding, etc. – is not a glamorous subject. It seems too simple. Even though the specialist may detect an enormous information content in an assemblage of such numbers, to synthetic chemists used to thinking in three-dimensional terms they appear structureless, with no immediate meaning that they can visually grasp. Fifty years ago it was the siren call of Ehrlich's lock-and-key theory that deflected medicinal chemists from a physical understanding that might otherwise
Transcript of Physicochemical Profiling (Solubility, Permeability and Charge State)

Current Topics in Medicinal Chemistry 2001, 1, 277-351 277
1568-0266/01 $28.00+.00 © 2001 Bentham Science Publishers Ltd.
Physicochemical Profiling (Solubility, Permeability and Charge State)
Alex Avdeef*
pION INC, 5 Constitution Way, Woburn, MA 01801, USA
Abstract: About 30% of drug candidate molecules are rejected due to pharmacokinetic-related failures. When poor pharmaceutical properties are discovered in development, thecosts of bringing a potent but poorly absorbable molecule to a product stage by"formulation" can become very high. Fast and reliable in vitro prediction strategies areneeded to filter out problematic molecules at the earliest stages of discovery. This review willconsider recent developments in physicochemical profiling used to identify candidatemolecules with physical properties related to good oral absorption. Poor solubility and poorpermeability account for many PK failures. FDA's Biopharmaceutics Classification System (BCS) is an attempt torationalize the critical components related to oral absorption. The core idea in the BCS is an in vitro transportmodel, centrally embracing permeability and solubility, with qualifications related to pH and dissolution. Theobjective of the BCS is to predict in vivo performance of drug products from in vitro measurements of permeabilityand solubility. In principle, the framework of the BCS could serve the interests of the earliest stages of discoveryresearch. The BCS can be rationalized by considering Fick's first law, applied to membranes. When molecules areintroduced on one side of a lipid membrane barrier (e.g., epithelial cell wall) and no such molecules are on the otherside, passive diffusion will drive the molecules across the membrane. When certain simplifying assumptions aremade, the flux equation in Fick's law reduces simply to a product of permeability and solubility. Many othermeasurable properties are closely related to permeability and solubility. Permeability (Pe) is a kinetic parameterrelated to lipophilicity (as indicated by the partition and distribution coefficients, log P and log D). Retention (R)of lipophilic molecules by the membrane (which is related to lipophilicity and may predict PK volumes ofdistribution) influences the characterization of permeability. Furthermore, strong drug interactions with serumproteins can influence permeability. The unstirred water layer on both sides of the membrane barrier can imposelimits on permeability. Solubility (S) is a thermodynamic parameter, and is closely related to dissolution, a kineticparameter. The unstirred water layer on the surfaces of suspended solids imposes limits on dissolution. Bile acidseffect both solubility and dissolution, by a micellization effect. For ionizable molecules, pH plays a crucial role.The charge state that a molecule exhibits at a particular pH is characterized by the ionization constant (pKa) of themolecule. Buffers effect pH gradients in the unstirred water layers, which can dramatically affect both permeabilityand dissolution of ionizable molecules. In this review, we will focus on the emerging instrumental methods for themeasurement of the physicochemical parameters Pe, S, pKa, R, log P, and log D (and their pH-profiles). Thesephysicochemical profiles can be valuable tools for the medicinal chemists, aiding in the prediction of in vivo oralabsorption.
1 GENERAL BACKGROUND
"It is now almost a century since Overton and Meyer firstdemonstrated the existence of a relationship between thebiological activity of a series of compounds and somesimple physical property common to its members. In theintervening years the germ of their discovery has grown intoan understanding whose ramifications extend into medicinalchemistry, agrochemical and pesticide research,environmental pollution and even, by a curious re-inventionof familiar territory, some areas basic to the science ofchemistry itself. Yet its further exploitation was longdelayed. It was 40 years later that Ferguson at ICI appliedsimilar principles to a rationalization of the comparativeactivity of gaseous anaesthetics, and 20 more were to passbefore the next crucial step was formulated in the mind of
*Address correspondence to this author at the pION INC, 5 ConstitutionWay, Woburn, MA 01801, USA; Tel: +1 781 935 8939; Fax: +1 781 9358938; E-mail: [email protected]
Hansch. ... Without any doubt, one major factor [for delay]was compartmentalism. The various branches of science weremuch more separate then than now. It has become almosttrite to claim that the major advances in science take placealong the borders between its disciplines, but in truth thishappened in the case of what we now call Hansch analysis,combining as it did aspects of pharmacy, pharmacology,statistics and physical organic chemistry. Yet there wasanother feature that is not so often remarked, and one with amuch more direct contemporary implication. The physicaland physical organic chemistry of equilibrium processes –solubility, partitioning, hydrogen bonding, etc. – is not aglamorous subject. It seems too simple. Even though thespecialist may detect an enormous information content in anassemblage of such numbers, to synthetic chemists used tothinking in three-dimensional terms they appearstructureless, with no immediate meaning that they canvisually grasp. Fifty years ago it was the siren call ofEhrlich's lock-and-key theory that deflected medicinalchemists from a physical understanding that might otherwise

278 Current Topics in Medicinal Chemistry, 2001, Vol. 1, No. 4 Alex Avdeef
have been attained much earlier. Today it is glamour of thetelevision screen. No matter that what is on display maysometimes possess all the profundity of a five-fingerexercise. It is visual and therefore more comfortable andeasier to assimilate. Similarly, MO theory in its resurgentphase combines the exotic appeal of a mystery religion witha new-found instinct for three-dimensional colour projectionwhich really can give the ingenue the impression that heunderstands what it is all about. There are great advances andgreat opportunities in all this, but nevertheless a concomitantdanger that medicinal chemists may forget or pay insufficientattention to hurdles the drug molecule will face if it isactually to perform the clever docking routine they have justtried out: hurdles of solubilization, penetration, distribution,metabolism and finally of its non-specific interactions in thevicinity of the active site, all of them the result of physicalprinciples on which computer graphics has nothing to say.Such a tendency has been sharply exacerbated by the recenttrend, for reasons of cost as much as of humanity, to throwthe emphasis upon in vitro testing. All too often, chemistsare disconcerted to discover that the activity they are sopleased with in vitro entirely fails to translate to the in vivosituation. Very often, a simple appreciation of basic physicalprinciples would have spared them this disappointment;better, could have suggested in advance how they mightavoid it. We are still not so far down the path of thisenlightenment as we ought to be. What is more, there seemsa risk that some of it may fade if the balance between aburgeoning receptor science and these more down-to-earthphysical principles is not properly kept." – P. J. Taylor,1990 [1].
Taylor [1] reviewed physicochemical profiling in acomprehensive and compelling way, but enough hashappened since 1990 to warrant a revisit. Then, combichem,HTS, Caco-2, IAM, CE were in a pre-ingenuic state; studiesof drug-partitioning into liposomes were arcane; instrumentcompanies took no visible interest in making pKa, log P, orsolubility analyzers; there was no BCS; it did not occur toanyone to do PAMPA. With all that is new, now is a goodtime to take stock of what we can learn from the work of thelast decade. In this review, measurement of solubility,permeability, and charge state of drug molecules will bereexamined. Fick's law of diffusion in predicting drugabsorption will be reexplored.
1.1. Developability Attrition at a Time of DiscoveryOverload (Cost Matters)
A pressing challenge in the pharmaceutical industry is toreduce the high attrition rate of development compounds.Today a drug product may cost more than $500M to bringout. It has been estimated that about 30% of the moleculesthat reach development are eventually rejected due topharmacokinetics-related failures. Much more money is spenton compounds that fail than those that succeed [2,3]. Theindustry has started to respond by attempting to screen outthose molecules with inappropriate ADME (absorption,distribution, metabolism, excretion) and toxicity propertiesbefore the molecules reach development. However, that hasled to another challenge: how to do the increased screeningquickly enough [4]. The emergence of combinatorial
methods in the 1990s has lead to enormous numbers ofNCEs [5]. A large pharmaceutical company may screen 3million molecules for biological activity each year. Some30,000 hits are made. Most of these molecules, howeverpotent, do not have the right physical, metabolic, and safetyproperties. Large pharmaceutical companies can cope withabout 30 molecules taken to development each year. A goodyear sees 3 molecules reach the product stage. These are justrough numbers, recited at various conferences. Furtherexacerbated is the challenge of selection by the new targetopportunities identified by human genomics-basedtechnologies [6]. Currently, the NCEs are directed to screenfor about 500 targets. The list of opportunities is expected togrow to several thousands in the next few years. Today'sscreening methods cannot cope with the staggering numbersof anticipated assays. In silico property prediction is neededmore than ever to cope with the screening overload.Improved prediction technologies are continuing to emerge[7]. However, reliably measured physicochemical propertiesto use as "training sets" for new target applications have notkept pace with the in silico methodologies.
1.2 The 'A' in ADME
In this review we will focus on physicochemical profilingin support of improved prediction methods for absorption,the 'A' in ADME. Metabolism and other components ofADME will be beyond the scope of this review.Furthermore, we will focus on properties related to passiveabsorption, and not directly consider active transportmechanisms. The most important physicochemicalparameters associated with passive absorption are acid/basecharacter (which determines the charge state of a molecule ina solution of a particular pH), lipophilicity (whichdetermines distribution of a molecule between the aqueousand the lipid environments in the body), solubility (whichlimits the concentration that a dosage form of a molecule canpresent to the solution and the rate at which the moleculedissolves from the solid form), and membrane permeability(which determines how quickly molecules can crossmembrane barriers separating compartments in the body).Current state-of-the-art in measurement of these properties, asa function of pH, will be reviewed.
1.3 It is Not Just a Number
Drugs exert their therapeutic effects through reactionswith specific receptors. Drug-receptor binding depends on theconcentration of the drug near the receptor. Its form andconcentration near the receptor depend on its physicalproperties. Orally-administered drugs need to be dissolved atthe site of absorption in the gastrointestinal (GI) tract, andneed to traverse several membrane barriers before receptorinteractions can commence. As the drug distributes into thevarious compartments of the body, a certain (small) portionfinds itself in the receptor site. Transport and distribution ofmost drugs are affected by passive diffusion, which dependson lipophilicity, since lipid barriers need to be crossed [8-13]. Passive transport is well described by the principles ofphysical chemistry.

Physicochemical Profiling (Solubility, Permeability and Charge State) Current Topics in Medicinal Chemistry, 2001, Vol. 1, No. 4 279
The pKa of a molecule, a charge-state related parameter, isa descriptor of an acid-base equilibrium reaction [14,15].Lipophilicity, often represented by the octanol-waterpartition coefficient, Kp, is a descriptor of a two-phasedistribution equilibrium reaction [16]. So is solubility[17,18]. These three parameters are thermodynamicconstants. On the other hand, permeability, Pe, is a ratecoefficient, a kinetics parameter, most often posed in a first-order distribution reaction [19-21].
In high-throughput screening (HTS) these parameters aresometimes viewed simply as numbers, "quickly androughly" determined, to be used to rank molecules into"good" and "bad" classes. We will attempt to review thisimportant aspect. In addition, we will examine howfundamental, molecular-level, interpretations of the physicalmeasurements can help to improve the design of theprofiling assays, and promote the data fodder of HTS to ahigher level of quality, without compromising the need forhigh speed. Quality measurements in high quantities willlead to improved in silico methods. Simple rules (presentedin visually appealing ways), in the spirit of Lipinski's rule offives, will be sought, of use not only to medicinal chemistsbut also to preformulators [4,22].
2 TRANSPORT MODEL
2.1 Permeability-Solubility-Charge State and the pH-Partition Hypothesis
Fick’s first law applied to a membrane [19-21] showsthat passive diffusion of a solute is the product of thediffusivity and the concentration gradient of the solute insidethe membrane. The membrane/water apparent partitioncoefficient relates the latter internal gradient to the externalbulk-water concentration difference between the twosolutions separated by the membrane. For an ionizablemolecule to permeate by passive diffusion most efficiently,the molecule needs to be in its uncharged form at themembrane surface. This is the essence of the pH-partitionhypothesis [23]. The amount of the uncharged form presentat a given pH, which directly contributes to the flux,depends on several important factors, such as pH, binding toindigenous carriers (proteins and bile acids), self-binding(aggregate or micelle formation), and solubility (a solid-stateform of self-binding). Low solubility enters the transportconsideration as a thermodynamic “speed attenuator,” as acondition that lowers the opportunity for transport. In thisway, permeability and solubility are the linked kinetic andthermodynamic parts of transport across a membrane.
Consider a vessel divided into two chambers, separatedby a homogeneous lipid membrane. (Fig. 1) is a cartoon ofsuch an arrangement. The left side is the donor compartment,where the sample molecules are first introduced; the rightside is the acceptor compartment, which at the start has nosample molecules. Fick’s first law applied to homogeneousmembranes at steady state is a transport equation,*
J = Dm dCm/dx = Dm [ Cm0 - Cm
h ] / h (1)
* Commonly, there is a negative sign in the flux expression (e.g., eqs. 1, 2, 4, 5).For simplicity, we dropped it, given the clear understanding that the flux vector isin the direction of decreasing concentration (that is, from the donor to the acceptorcompartments).
where J is the flux, in units of mol cm-2 s -1, where Cm0 and
Cmh are the concentrations, in mol cm-3 units, of the
uncharged form of the solute within the membrane at thetwo water- membrane boundaries (at positions x = 0 and x =h in (Fig. 1), where h is the thickness of the membrane incm units), and where Dm is the diffusivity of the solutewithin the membrane, in units of cm2 s -1. At steady state, theconcentration gradient, dCm/dx, within the membrane islinear, so the difference may be used in the right side of eq.1. Steady state takes about 3 min to be established in amembrane of thickness 125 µm [20], assuming the solutionis very well stirred.
The limitation of eq. 1 is that measurement ofconcentrations of solute within different parts of themembrane is very inconvenient. However, since we canestimate (or possibly measure) the distribution coefficientsbetween bulk water and the membrane, log Kd (the pH-dependent apparent partition coefficient), we can convert eq.1 into a more accessible form,
J = Dm Kd (CD - CA) / h (2)
where the substitution of Kd allows us to use bulk waterconcentrations in the donor and acceptor compartments, CD
and CA, respectively. (With ionizable molecules, CA and CD
refer to the concentrations of the solute summed over allforms of charge state.) These concentrations may be readilymeasured by standard techniques. Eq. 2 is still notsufficiently convenient, since we need to estimate Dm andKd. It is a common practice to lump these parameters and thethickness of the membrane into a composite parameter,called “effective permeability,” Pe,
Pe = Dm Kd / h (3)
The relevance of eq. 2 (which predicts how quicklymolecules pass through simple membranes) to solubilitycomes in the concentration terms. Consider “sink”conditions, where CA is essentially zero. Eq. 2 reduces to thefollowing flux equation
J = Pe CD (4)
Flux depends on the product of effective permeability ofthe solute times the concentration of the solute (summedover all charge state forms) at the water-side of the donorsurface of the membrane. This concentration ideally may beequal to the dose of the drug, unless the dose exceeds thesolubility limit, in which case it is equal to the solubility.Since the uncharged molecular species is the permeant, eq. 4may be restated as
J = Po Co < P o S o (5)
where Po and Co are the intrinsic permeability andconcentration of the uncharged species, respectively. Theintrinsic permeability does not depend on pH, but itscofactor in the flux equation, Co, does. The concentration ofthe uncharged species is always equal to or less than theintrinsic solubility of the species, So.
Note that for the uncharged species, eq. 3 takes on the form

280 Current Topics in Medicinal Chemistry, 2001, Vol. 1, No. 4 Alex Avdeef
Po = Dm Kp / h (6)
where Kp = Cm(0) / CDo; also, Kp = Cm(h) / CAo; CDo and CAo
are the aqueous solution concentrations of the unchargedspecies in the donor and acceptor sides, respectively.
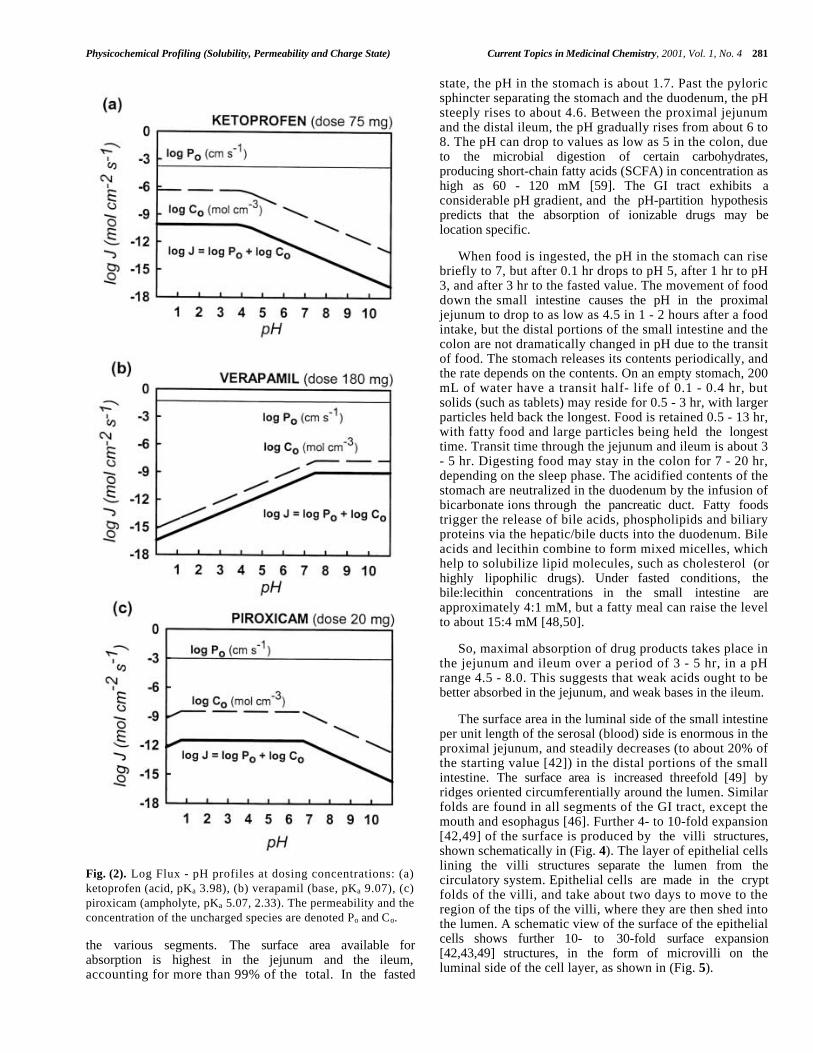
In solutions saturated (i.e., excess solid present) at somepH, the plot of log Co. versus pH for an ionizable moleculeis extraordinary simple in form: it is a combination ofstraight segments, joined at points of discontinuityindicating the boundary between the saturated state and thestate of complete dissolution. The pH of these junctionpoints is dependent on the dose used in the calculation, andthe maximum value of log Co is always equal to log So in asaturated solution [24].
(Fig. 2) illustrates this idea using ketoprofen as anexample of an acid, verapamil as a base, and piroxicam as anampholyte. In the three cases the assumed concentrations inthe calculation were set to the respective doses [24]. For anacid, log Co (dashed curve in Fig. 2a) is a horizontal line(log Co = log So) in the saturated solution (at low pH), anddecreases with a slope of -1 in the pH domain where the
solute is completely dissolved. For a base (Fig. 2b) the plotof log Co versus pH is also a horizontal line at high pH in asaturated solution and is a line with a slope of +1 for pHvalues less than the pH of the onset of precipitation.
We have called the plot of log Co versus pH the “fluxfactor” profile, with the idea that such a plot when combinedwith intrinsic permeability, can be the basis of an in vitroclassification scheme to predict passive oral absorption as afunction of pH. This will be discussed later.
Figs. 1 and 2 represent the basic model that will be usedto discuss the literature related to the measurement of thephysicochemical parameters and the interpretation of theirrole in the oral absorption process [8,9,12,25-41].
2.2 Properties of the Gastrointestinal Tract
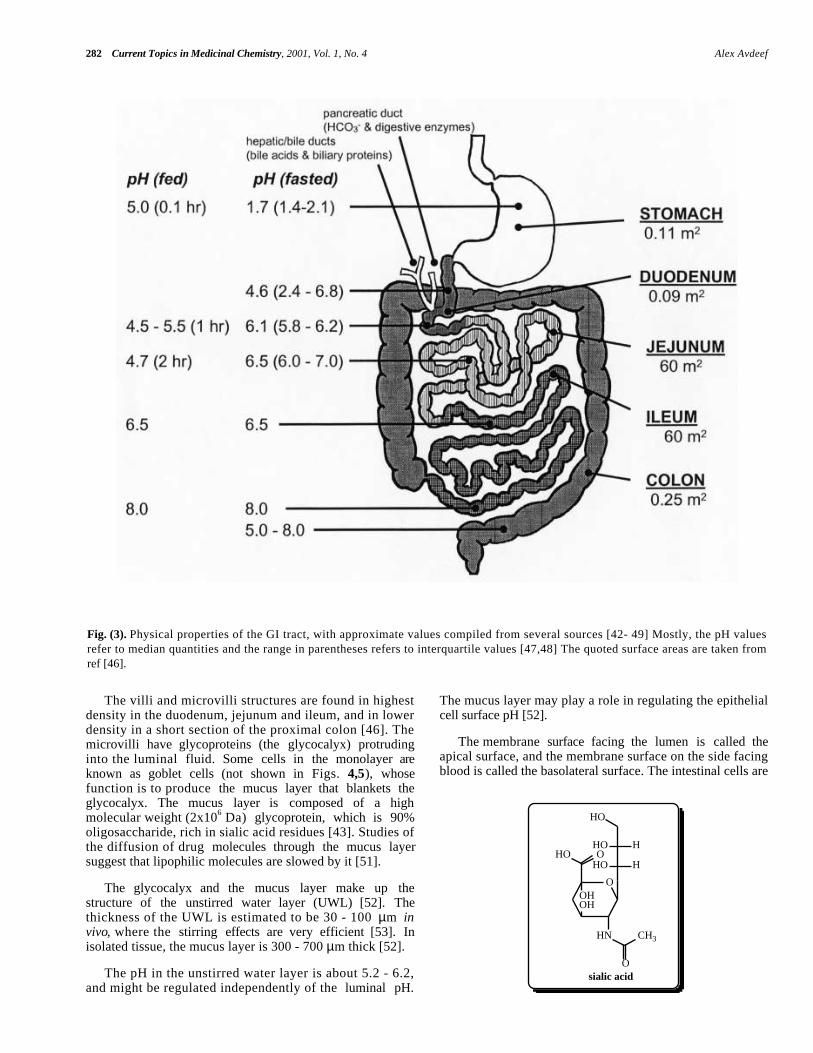
The properties of the human GI tract that are relevant tothe absorption of drug products have been collected fromseveral sources [42-49]. (Fig. 3) shows a cartoon of the GItract, indicating surface area and pH (fasted and fed state) in
Fig. (1). Transport model diagram, depicting two aqueous cells separated by a membrane barrier. The drug molecules are introduced inthe donor cell. The concentration gradient in the membrane drives the molecules in the direction of the acceptor compartment. Theapparent partition coefficient, Kd = 2.
Physicochemical Profiling (Solubility, Permeability and Charge State) Current Topics in Medicinal Chemistry, 2001, Vol. 1, No. 4 281
the various segments. The surface area available forabsorption is highest in the jejunum and the ileum,accounting for more than 99% of the total. In the fasted
state, the pH in the stomach is about 1.7. Past the pyloricsphincter separating the stomach and the duodenum, the pHsteeply rises to about 4.6. Between the proximal jejunumand the distal ileum, the pH gradually rises from about 6 to8. The pH can drop to values as low as 5 in the colon, dueto the microbial digestion of certain carbohydrates,producing short-chain fatty acids (SCFA) in concentration ashigh as 60 - 120 mM [59]. The GI tract exhibits aconsiderable pH gradient, and the pH-partition hypothesispredicts that the absorption of ionizable drugs may belocation specific.
When food is ingested, the pH in the stomach can risebriefly to 7, but after 0.1 hr drops to pH 5, after 1 hr to pH3, and after 3 hr to the fasted value. The movement of fooddown the small intestine causes the pH in the proximaljejunum to drop to as low as 4.5 in 1 - 2 hours after a foodintake, but the distal portions of the small intestine and thecolon are not dramatically changed in pH due to the transitof food. The stomach releases its contents periodically, andthe rate depends on the contents. On an empty stomach, 200mL of water have a transit half- life of 0.1 - 0.4 hr, butsolids (such as tablets) may reside for 0.5 - 3 hr, with largerparticles held back the longest. Food is retained 0.5 - 13 hr,with fatty food and large particles being held the longesttime. Transit time through the jejunum and ileum is about 3- 5 hr. Digesting food may stay in the colon for 7 - 20 hr,depending on the sleep phase. The acidified contents of thestomach are neutralized in the duodenum by the infusion ofbicarbonate ions through the pancreatic duct. Fatty foodstrigger the release of bile acids, phospholipids and biliaryproteins via the hepatic/bile ducts into the duodenum. Bileacids and lecithin combine to form mixed micelles, whichhelp to solubilize lipid molecules, such as cholesterol (orhighly lipophilic drugs). Under fasted conditions, thebile:lecithin concentrations in the small intestine areapproximately 4:1 mM, but a fatty meal can raise the levelto about 15:4 mM [48,50].
So, maximal absorption of drug products takes place inthe jejunum and ileum over a period of 3 - 5 hr, in a pHrange 4.5 - 8.0. This suggests that weak acids ought to bebetter absorbed in the jejunum, and weak bases in the ileum.
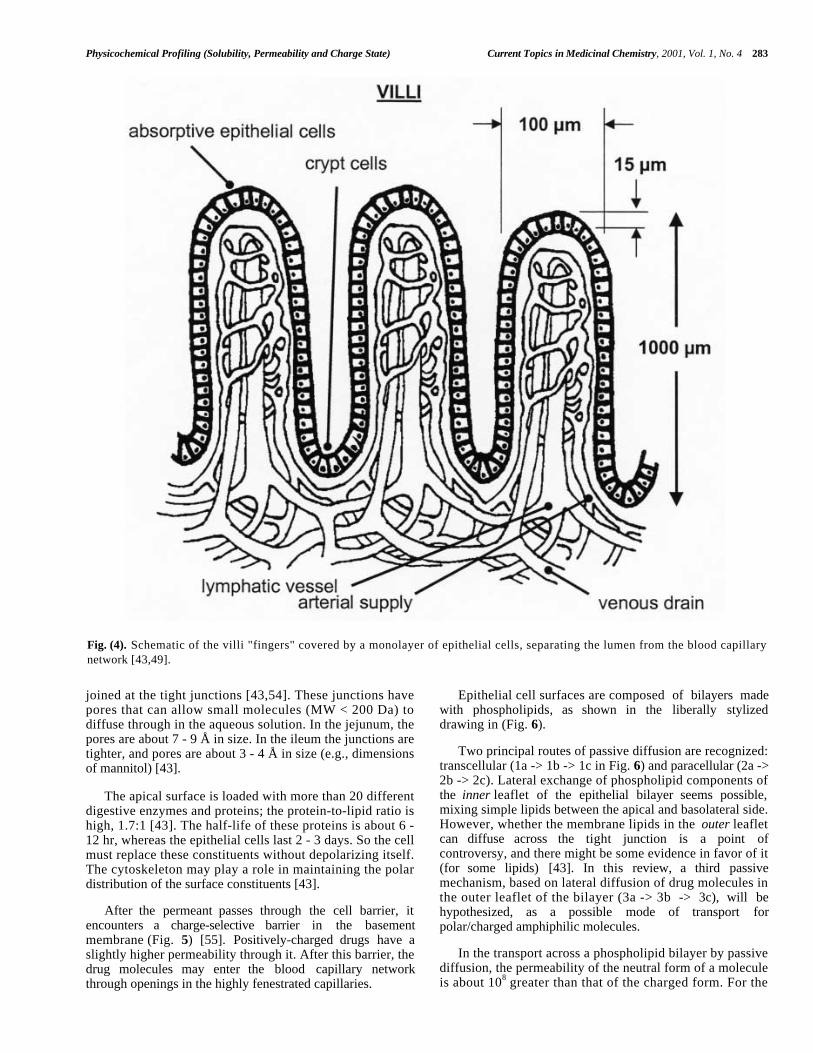
The surface area in the luminal side of the small intestineper unit length of the serosal (blood) side is enormous in theproximal jejunum, and steadily decreases (to about 20% ofthe starting value [42]) in the distal portions of the smallintestine. The surface area is increased threefold [49] byridges oriented circumferentially around the lumen. Similarfolds are found in all segments of the GI tract, except themouth and esophagus [46]. Further 4- to 10-fold expansion[42,49] of the surface is produced by the villi structures,shown schematically in (Fig. 4). The layer of epithelial cellslining the villi structures separate the lumen from thecirculatory system. Epithelial cells are made in the cryptfolds of the villi, and take about two days to move to theregion of the tips of the villi, where they are then shed intothe lumen. A schematic view of the surface of the epithelialcells shows further 10- to 30-fold surface expansion[42,43,49] structures, in the form of microvilli on theluminal side of the cell layer, as shown in (Fig. 5).
Fig. (2). Log Flux - pH profiles at dosing concentrations: (a)ketoprofen (acid, pKa 3.98), (b) verapamil (base, pKa 9.07), (c)piroxicam (ampholyte, pKa 5.07, 2.33). The permeability and theconcentration of the uncharged species are denoted Po and Co.
282 Current Topics in Medicinal Chemistry, 2001, Vol. 1, No. 4 Alex Avdeef
The villi and microvilli structures are found in highestdensity in the duodenum, jejunum and ileum, and in lowerdensity in a short section of the proximal colon [46]. Themicrovilli have glycoproteins (the glycocalyx) protrudinginto the luminal fluid. Some cells in the monolayer areknown as goblet cells (not shown in Figs. 4,5), whosefunction is to produce the mucus layer that blankets theglycocalyx. The mucus layer is composed of a highmolecular weight (2x10⁶ Da) glycoprotein, which is 90%oligosaccharide, rich in sialic acid residues [43]. Studies ofthe diffusion of drug molecules through the mucus layersuggest that lipophilic molecules are slowed by it [51].
The glycocalyx and the mucus layer make up thestructure of the unstirred water layer (UWL) [52]. Thethickness of the UWL is estimated to be 30 - 100 µm invivo, where the stirring effects are very efficient [53]. Inisolated tissue, the mucus layer is 300 - 700 µm thick [52].
The pH in the unstirred water layer is about 5.2 - 6.2,and might be regulated independently of the luminal pH.
The mucus layer may play a role in regulating the epithelialcell surface pH [52].
The membrane surface facing the lumen is called theapical surface, and the membrane surface on the side facingblood is called the basolateral surface. The intestinal cells are
Fig. (3). Physical properties of the GI tract, with approximate values compiled from several sources [42- 49] Mostly, the pH valuesrefer to median quantities and the range in parentheses refers to interquartile values [47,48] The quoted surface areas are taken fromref [46].
O
OHOH
OHO
HN CH3
O
HO H
HO H
HO
sialic acid
Physicochemical Profiling (Solubility, Permeability and Charge State) Current Topics in Medicinal Chemistry, 2001, Vol. 1, No. 4 283
joined at the tight junctions [43,54]. These junctions havepores that can allow small molecules (MW < 200 Da) todiffuse through in the aqueous solution. In the jejunum, thepores are about 7 - 9 Å in size. In the ileum the junctions aretighter, and pores are about 3 - 4 Å in size (e.g., dimensionsof mannitol) [43].
The apical surface is loaded with more than 20 differentdigestive enzymes and proteins; the protein-to-lipid ratio ishigh, 1.7:1 [43]. The half-life of these proteins is about 6 -12 hr, whereas the epithelial cells last 2 - 3 days. So the cellmust replace these constituents without depolarizing itself.The cytoskeleton may play a role in maintaining the polardistribution of the surface constituents [43].
After the permeant passes through the cell barrier, itencounters a charge-selective barrier in the basementmembrane (Fig. 5) [55]. Positively-charged drugs have aslightly higher permeability through it. After this barrier, thedrug molecules may enter the blood capillary networkthrough openings in the highly fenestrated capillaries.
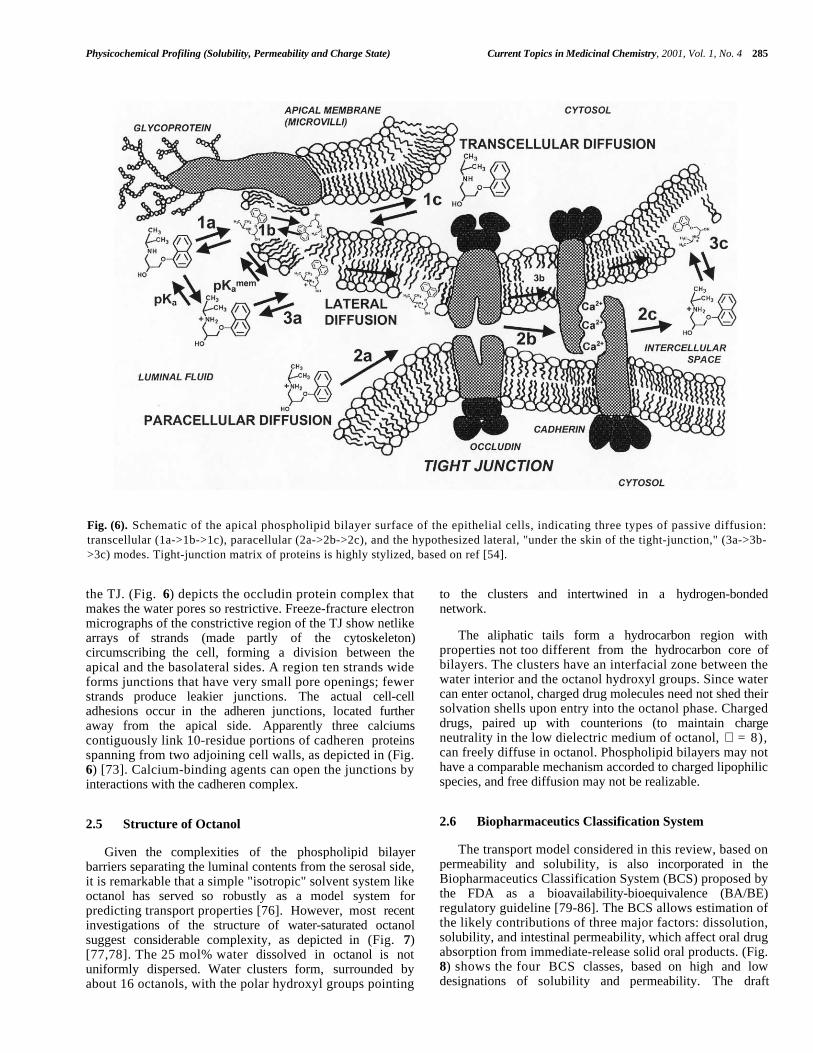
Epithelial cell surfaces are composed of bilayers madewith phospholipids, as shown in the liberally stylizeddrawing in (Fig. 6).
Two principal routes of passive diffusion are recognized:transcellular (1a -> 1b -> 1c in Fig. 6) and paracellular (2a ->2b -> 2c). Lateral exchange of phospholipid components ofthe inner leaflet of the epithelial bilayer seems possible,mixing simple lipids between the apical and basolateral side.However, whether the membrane lipids in the outer leafletcan diffuse across the tight junction is a point ofcontroversy, and there might be some evidence in favor of it(for some lipids) [43]. In this review, a third passivemechanism, based on lateral diffusion of drug molecules inthe outer leaflet of the bilayer (3a -> 3b -> 3c), will behypothesized, as a possible mode of transport forpolar/charged amphiphilic molecules.
In the transport across a phospholipid bilayer by passivediffusion, the permeability of the neutral form of a moleculeis about 108 greater than that of the charged form. For the
Fig. (4). Schematic of the villi "fingers" covered by a monolayer of epithelial cells, separating the lumen from the blood capillarynetwork [43,49].

284 Current Topics in Medicinal Chemistry, 2001, Vol. 1, No. 4 Alex Avdeef
epithelium, the discrimination factor is 10 5 . The basementmembrane (Fig. 5) allows passage of uncharged moleculesmore readily than charged species by a factor of 10 [55].
2.3 pH Microclimate
The absorption of short-chain weak acids in the ratintestine, as a function of pH, appears not to conform to thepH-partition hypothesis [23]. Similar anomalies were foundwith weak bases [56]. The apparent pKa values observed inthe absorption-pH curve were shifted to higher values foracids and to lower values for bases, compared with the truepKa values. Such deviations could be explained by the effectof an acid layer on the apical side of cells, the so-called acidpH microclimate [23,52,55-62].
Shiau et al [52] directly measured the microclimate pH,pHm, to be 5.2 - 6.7 in different sections of the intestine(very reproducible values in a given segment) covered withthe normal mucus layer, as the luminal (bulk) pH, pHb, waskept at 7.2. Good controls ruled out pH electrode artifacts.With the mucus layer washed off, pHm rose from 5.4 to 7.2.Values of pHb as low as 3 and as high as 10 remarkably didnot affect values of pHm. Glucose did not affect pHm whenthe microclimate was established. However, when the mucuslayer had been washed off and pHm was allowed to rise topHb, the addition of 28 mM glucose caused the original lowpHm to be reestablished after 5 min. Shiau et al [52]hypothesized that the mucus layer was an ampholyte (of
considerable pH buffer capacity) which created the pH acidmicroclimate.
Said et al [57] measured pHm in rat intestine under invitro and in vivo conditions. As pHb was kept constant at7.4, pHm values varied 6.4 - 6.3 (proximal to distalduodenum), 6.0 - 6.4 (proximal to distal jejunum), 6.6 - 6.9(proximal to distal ileum), and was 6.9 in the colon. Serosalsurface had normal pH. When glucose or sodium wasremoved from the bathing solutions, the pHm values beganto rise. Metabolic inhibitors (1 mM iodoacetate or 2,4-dinitrophenol) also caused the pHm values to rise. Said et al[57] hypothesized that a Na+/H+ antiporter mechanism,dependent on cellular metabolism, was responsible for theacid pH microclimate.
The tips of villi have the lowest pHm values, whereas thecrypt regions have pHm > 8 values [59]. Most remarkablewas that an alkaline microclimate (pHm 8) was observed inthe human stomach, whose bulk pHb is generally about 1.7.In the stomach and duodenum, the near- neutral microclimatepH was attributed to the secretion of HCO3
- from the
epithelium [59].
2.4 Tight Junction Complex
Many structural components of the tight junctions (TJ)have been defined in the last ten years [63-75]. Lutz andSiahaan [73] reviewed the protein structural components of
Fig. (5). Schematic of the structure of epithelial cells, based on several literature sources [35,43,49,52,53,55,57,58] The tightjunctions and the basement membrane appear to be slightly ion- selective (lined with some negatively-charged groups) [54,55,58].
Physicochemical Profiling (Solubility, Permeability and Charge State) Current Topics in Medicinal Chemistry, 2001, Vol. 1, No. 4 285
the TJ. (Fig. 6) depicts the occludin protein complex thatmakes the water pores so restrictive. Freeze-fracture electronmicrographs of the constrictive region of the TJ show netlikearrays of strands (made partly of the cytoskeleton)circumscribing the cell, forming a division between theapical and the basolateral sides. A region ten strands wideforms junctions that have very small pore openings; fewerstrands produce leakier junctions. The actual cell-celladhesions occur in the adheren junctions, located furtheraway from the apical side. Apparently three calciumscontiguously link 10-residue portions of cadheren proteinsspanning from two adjoining cell walls, as depicted in (Fig.6) [73]. Calcium-binding agents can open the junctions byinteractions with the cadheren complex.
2.5 Structure of Octanol
Given the complexities of the phospholipid bilayerbarriers separating the luminal contents from the serosal side,it is remarkable that a simple "isotropic" solvent system likeoctanol has served so robustly as a model system forpredicting transport properties [76]. However, most recentinvestigations of the structure of water-saturated octanolsuggest considerable complexity, as depicted in (Fig. 7)[77,78]. The 25 mol% water dissolved in octanol is notuniformly dispersed. Water clusters form, surrounded byabout 16 octanols, with the polar hydroxyl groups pointing
to the clusters and intertwined in a hydrogen-bondednetwork.
The aliphatic tails form a hydrocarbon region withproperties not too different from the hydrocarbon core ofbilayers. The clusters have an interfacial zone between thewater interior and the octanol hydroxyl groups. Since watercan enter octanol, charged drug molecules need not shed theirsolvation shells upon entry into the octanol phase. Chargeddrugs, paired up with counterions (to maintain chargeneutrality in the low dielectric medium of octanol, ∈ = 8),can freely diffuse in octanol. Phospholipid bilayers may nothave a comparable mechanism accorded to charged lipophilicspecies, and free diffusion may not be realizable.
2.6 Biopharmaceutics Classification System
The transport model considered in this review, based onpermeability and solubility, is also incorporated in theBiopharmaceutics Classification System (BCS) proposed bythe FDA as a bioavailability-bioequivalence (BA/BE)regulatory guideline [79-86]. The BCS allows estimation ofthe likely contributions of three major factors: dissolution,solubility, and intestinal permeability, which affect oral drugabsorption from immediate-release solid oral products. (Fig.8) shows the four BCS classes, based on high and lowdesignations of solubility and permeability. The draft
Fig. (6). Schematic of the apical phospholipid bilayer surface of the epithelial cells, indicating three types of passive diffusion:transcellular (1a->1b->1c), paracellular (2a->2b->2c), and the hypothesized lateral, "under the skin of the tight-junction," (3a->3b->3c) modes. Tight-junction matrix of proteins is highly stylized, based on ref [54].

286 Current Topics in Medicinal Chemistry, 2001, Vol. 1, No. 4 Alex Avdeef
Fig. (7). Modern structure of wet octanol, based on a low-angle X-ray diffraction study.[78] The four black circles at the center of eachcluster represent water molecules. The four hydrogen-bonded water molecules are in turn surrounded by about sixteen octanolmolecules (only 12 are shown), H-bonded mutually and to the water molecules. The aliphatic tails of the octanol molecules form ahydrocarbon region largely free of water molecules. It is thought that ion-paired drug molecules are located in the water-octanolclusters, and thus can readily diffuse through the "isotropic" medium. E.g., filters impregnated with octanol show substantialpermeability of charged drug species. However, permeabilities of charged drugs in filters impregnated with phospholipid-alkanesolutions are extremely low.
Fig. (8). Biopharmaceutics Classification System [79-86] Examples are from refs [80,82].
Physicochemical Profiling (Solubility, Permeability and Charge State) Current Topics in Medicinal Chemistry, 2001, Vol. 1, No. 4 287
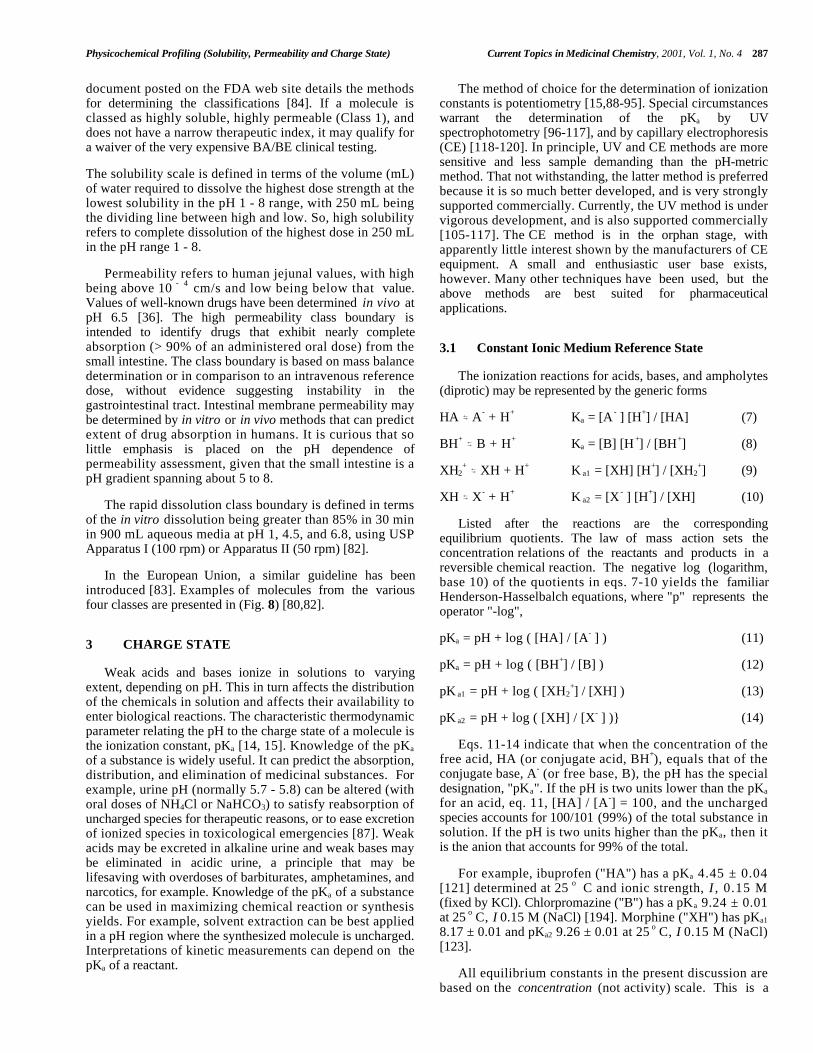
document posted on the FDA web site details the methodsfor determining the classifications [84]. If a molecule isclassed as highly soluble, highly permeable (Class 1), anddoes not have a narrow therapeutic index, it may qualify fora waiver of the very expensive BA/BE clinical testing.
The solubility scale is defined in terms of the volume (mL)of water required to dissolve the highest dose strength at thelowest solubility in the pH 1 - 8 range, with 250 mL beingthe dividing line between high and low. So, high solubilityrefers to complete dissolution of the highest dose in 250 mLin the pH range 1 - 8.
Permeability refers to human jejunal values, with highbeing above 10 - 4 cm/s and low being below that value.Values of well-known drugs have been determined in vivo atpH 6.5 [36]. The high permeability class boundary isintended to identify drugs that exhibit nearly completeabsorption (> 90% of an administered oral dose) from thesmall intestine. The class boundary is based on mass balancedetermination or in comparison to an intravenous referencedose, without evidence suggesting instability in thegastrointestinal tract. Intestinal membrane permeability maybe determined by in vitro or in vivo methods that can predictextent of drug absorption in humans. It is curious that solittle emphasis is placed on the pH dependence ofpermeability assessment, given that the small intestine is apH gradient spanning about 5 to 8.
The rapid dissolution class boundary is defined in termsof the in vitro dissolution being greater than 85% in 30 minin 900 mL aqueous media at pH 1, 4.5, and 6.8, using USPApparatus I (100 rpm) or Apparatus II (50 rpm) [82].
In the European Union, a similar guideline has beenintroduced [83]. Examples of molecules from the variousfour classes are presented in (Fig. 8) [80,82].
3 CHARGE STATE
Weak acids and bases ionize in solutions to varyingextent, depending on pH. This in turn affects the distributionof the chemicals in solution and affects their availability toenter biological reactions. The characteristic thermodynamicparameter relating the pH to the charge state of a molecule isthe ionization constant, pKa [14, 15]. Knowledge of the pKa
of a substance is widely useful. It can predict the absorption,distribution, and elimination of medicinal substances. Forexample, urine pH (normally 5.7 - 5.8) can be altered (withoral doses of NH4Cl or NaHCO3) to satisfy reabsorption ofuncharged species for therapeutic reasons, or to ease excretionof ionized species in toxicological emergencies [87]. Weakacids may be excreted in alkaline urine and weak bases maybe eliminated in acidic urine, a principle that may belifesaving with overdoses of barbiturates, amphetamines, andnarcotics, for example. Knowledge of the pKa of a substancecan be used in maximizing chemical reaction or synthesisyields. For example, solvent extraction can be best appliedin a pH region where the synthesized molecule is uncharged.Interpretations of kinetic measurements can depend on thepKa of a reactant.
The method of choice for the determination of ionizationconstants is potentiometry [15,88-95]. Special circumstanceswarrant the determination of the pKa by UVspectrophotometry [96-117], and by capillary electrophoresis(CE) [118-120]. In principle, UV and CE methods are moresensitive and less sample demanding than the pH-metricmethod. That not withstanding, the latter method is preferredbecause it is so much better developed, and is very stronglysupported commercially. Currently, the UV method is undervigorous development, and is also supported commercially[105-117]. The CE method is in the orphan stage, withapparently little interest shown by the manufacturers of CEequipment. A small and enthusiastic user base exists,however. Many other techniques have been used, but theabove methods are best suited for pharmaceuticalapplications.
3.1 Constant Ionic Medium Reference State
The ionization reactions for acids, bases, and ampholytes(diprotic) may be represented by the generic forms
HA →← A- + H+ Ka = [A - ] [H+] / [HA] (7)
BH+ →← B + H+ Ka = [B] [H+] / [BH+] (8)
XH2+ →← XH + H+ K a1 = [XH] [H+] / [XH2
+] (9)
XH →← X- + H+ K a2 = [X - ] [H+] / [XH] (10)
Listed after the reactions are the correspondingequilibrium quotients. The law of mass action sets theconcentration relations of the reactants and products in areversible chemical reaction. The negative log (logarithm,base 10) of the quotients in eqs. 7-10 yields the familiarHenderson-Hasselbalch equations, where "p" represents theoperator "-log",
pKa = pH + log ( [HA] / [A- ] ) (11)
pKa = pH + log ( [BH+] / [B] ) (12)
pK a1 = pH + log ( [XH2+] / [XH] ) (13)
pK a2 = pH + log ( [XH] / [X- ] )} (14)
Eqs. 11-14 indicate that when the concentration of thefree acid, HA (or conjugate acid, BH+), equals that of theconjugate base, A- (or free base, B), the pH has the specialdesignation, "pKa". If the pH is two units lower than the pKa
for an acid, eq. 11, [HA] / [A-] = 100, and the unchargedspecies accounts for 100/101 (99%) of the total substance insolution. If the pH is two units higher than the pKa, then itis the anion that accounts for 99% of the total.
For example, ibuprofen ("HA") has a pKa 4.45 ± 0.04[121] determined at 25 o C and ionic strength, I , 0.15 M(fixed by KCl). Chlorpromazine ("B") has a pKa 9.24 ± 0.01at 25 o C, I 0.15 M (NaCl) [194]. Morphine ("XH") has pKa1
8.17 ± 0.01 and pKa2 9.26 ± 0.01 at 25 o C, I 0.15 M (NaCl)[123].
All equilibrium constants in the present discussion arebased on the concentration (not activity) scale. This is a

288 Current Topics in Medicinal Chemistry, 2001, Vol. 1, No. 4 Alex Avdeef
perfectly fine thermodynamic scale, provided the ionicstrength of the solvent medium is kept fixed at a "reference"level (therefore, sufficiently higher than the concentration ofthe species assayed). This is known as the "constant ionicmedium" thermodynamic state. Most of the results reportedthese days are determined in 0.15 M KCl or NaCl, thephysiological level, because of standardization in theavailable commercial instruments. If the ionic strength ischanged, the ionization constant may be affected. Forexample, at ionic strength of 0.001 M, morphine pKas weredetermined to be 8.13 ± 0.01 and 9.46 ± 0.01 [123]. Thechange in the second constant (see previous paragraph)illustrates the need to report the ionic strength (and thetemperature, since constants also depend on it) [14,15].
The ionic-strength dependence of ionization constants canbe predicted by the Debye-Hückel theory [14,15]. In theolder literature, values were reported most often at "zerosample and ionic strength" and were called the"thermodynamic" constants. The constants reported at 0.15M ionic medium are no less thermodynamic. Nevertheless, aresult determined at 0.15 M KCl background, can becorrected to another background salt concentration, providedthe ionic strength is within the limitations of the theory ( <0.5 M for the Davies [124] variant of the Debye-Hückelexpression). It is sometimes convenient to convert constantsto "zero ionic strength" to compare values to those reportedin older literature. A general ionic-strength correctionequation is described in the literature [88,94,125].
3.2 pKa Databases
The "blue book" compilations [126-130] are probably themost comprehensive sources of ionization constants collectedfrom the literature (up to the end of 1970s). These arerecommended for experts in the field. On the other hand, the"red books" contain critically selected values [131].Recently, the six-volume set has been put into electronicform in cooperation with NIST (Natl. Inst. Stds. Technol.),and is available at a very reasonable price [132]. A two-volume set of critically-determined constants is availablefrom Sirius Analytical Instruments Ltd., and coversmolecules of particular interest to the pharmaceuticalcommunity [122,133].
3.3 Potentiometric Determinations
In pH-metric titration, precisely known volumes of astandardized strong acid (e.g., HCl) or base (e.g., KOH orNaOH) are added to a vigorously-stirred solution of aprotogenic substance, during which pH is continuouslymeasured with a precision combination glass electrode, in aprocedure confined to the interval pH 1.5 to 12.5. Thesubstance (50 - 500 µM or higher) being assayed isdissolved in 2 - 20 mL of water or in a mixed solventconsisting of water plus an organic water-miscible cosolvent(e.g., methanol, DMSO, acetonitrile, or 1,4-dioxane). Aninert water-soluble salt (0.15 M KCl or NaCl) is added tothe solution to improve the measurement precision, and tomimic the physiological state. Usually, the reaction vessel isthermostated at 25 o C and a blanket of a heavy inert gas(argon, but not helium) bathes the solution surface.
The plot of pH against titrant volume added is called apotentiometric titration curve. (Fig. 9a) shows severalexamples. The shape of such a curve can suggest the amountof substance present and its characteristic acid-base ionizationproperties. The left curve in (Fig. 9a) represents a strongacid-base titration, containing no sample species. The curveon the right side of (Fig. 9a) is that of morphine-6-glucuronide (M6G), which has three pKas (XH3
+ →← XH2± →←
XH- →← X 2- ) [123]. The inflection points corresponding towhere the slope in such plots is maximum in size are calledendpoints (pH 7 in the left curve, pH 5.5 and 10 in the rightcurve). At the endpoint the sample is almost completely inone state of ionization (XH2
± zwitterion at pH 5.5 and X2- atpH 10) . The inflection points where the slope is at aminimum size designate regions of maximum buffering (pH8.8 in the morphine metabolite curve). At such a point themolecule is present in two states of protonation of equalconcentration (pH = pKa), unless two or more overlappingpKas are in the buffer region. So by inspection of (Fig. 9a),one can say that a pKa of M6G may be about 8.8. (We willsee in the next section that such a simple interpretation ofthe titration curve can lead to the wrong conclusion, becauseM6G has two overlapping pKas centered about pH 8.8.)Where are the other pKas of M6G? Unfortunately, a titrationcurve does not always reveal all the pKas that a moleculemay have. To reveal the other two pKas of M6G and to testfor overlapping pKas, it is necessary to transform thetitration curves into Bjerrum plots [88,92,94,125,134-136].
3.3.1 Bjerrum Plots
The Bjerrum plots are probably the most importantgraphical tools in the initial stages of titration data analysis.Since one knows how much strong acid and strong base havebeen added to the solution at any point and since one knowshow many dissociable protons the sample substance bringsto the solution, one knows the total hydrogen ionconcentration in solution, despite what equilibrium reactionsare taking place. By measuring the pH (and after convertingit into pcH = -log[H+] ), one knows the free hydrogen ionconcentration, [H+]. The difference between the total and thefree concentrations is equal to the concentration of the boundhydrogen ions. The latter concentration divided by that ofthe sample gives the average number of bound hydrogenatoms per molecule of substance, H. The Bjerrum curve is aplot of H vs. pcH.
Operationally, such a plot can be obtained by subtractinga titration curve containing no sample ("blank" titration, leftcurve in Fig. 9a) from a titration curve with sample (rightcurve in Fig. 9a) at fixed values of pH. The resultantdifference plot is shown in (Fig. 9b). The plot is thenrotated (Fig. 9d), to emphasize that H is the dependentvariable and pH is the independent variable [134]. Thevolume differences can be converted to proton counts asdescribed in the preceding paragraph, to obtain the finalform, shown in (Fig. 9d).
The Bjerrum plot in (Fig. 9d) reveals all the pK as as pcHvalues at half-integral H positions. The three pKas of M6Gare evident: 2.8, 8.2, and 9.4. In contrast to this, deducingthe constants by simple inspection of the titration curves isnot possible (Fig. 9a). First, the low pKa is obscured in
nn
n
n

Physicochemical Profiling (Solubility, Permeability and Charge State) Current Topics in Medicinal Chemistry, 2001, Vol. 1, No. 4 289
(Fig. 9a) by the buffering action of water. Secondly, theapparent pKa at pH 8.8 is misleading. M6G has twooverlapping pKas, whose average value is 8.8. M6G nicelyillustrates the value of Bjerrum analysis.
With Bjerrum analysis, overlapping pKas pose nodifficulty. (Fig. 10a) shows an example of a 6-pKa molecule,vancomycin [133,137]. (Fig. 10b) shows an example of a30-pKa molecule, metallothionein, a small heavy metal-
Fig. (10). Example of (a) 6-pKa molecule Bjerrum plot(vancomycin, ref [137]), and (b) 30-pKa molecule plot(apometallothionein, ref [138]).
Fig. (9). Four-step construction of the Bjerrum difference plot fora three-pKa molecule, whose constants are obscured in the simpletitration curve (see text).
290 Current Topics in Medicinal Chemistry, 2001, Vol. 1, No. 4 Alex Avdeef
binding protein, rich in sulfhydryl groups [138]. (The readeris invited to identify the six ionization sites of vancomycin.)
3.3.2 pH Definitions and Electrode Standardization
To establish the operational pH scale, [139-141] the pHelectrode can be calibrated with a single aqueous pH 7phosphate buffer, with the ideal Nernst slope assumed.Because the H calculation requires the "free" hydrogen ionconcentration (as described in the preceding section) andbecause the concentration scale is employed for theionization constants, an additional electrode standardizationstep is necessary. That is where the operational scale isconverted to the concentration scale pcH (=-log[H+]) usingthe four-parameter equation [92,95,142,143],
pH = α + Sr pcH + jH [H+] + jOH Kw/[H+] (15)
where Kw is the ionization constant of water [144]. The fourparameters are empirically determined by a weightednonlinear least-squares procedure using data fromalkalimetric titrations of known concentrations of HCl (frompH 1.7 to 12.3) or standard buffers [92,145- 151]. Typicalaqueous values of the adjustable parameters at 25oC and 0.15M ionic strength are α = 0.08 ± 0.01, Sr = 1.001 ± 0.001, jH
= 1.0 ± 0.2 and jOH = -0.6 ± 0.2. Such a scheme extends therange of accurate pH measurements and allows pKas to bedetermined as low as 0.6 (caffeine [122]) and as high as 13.0(debrisoquine [133]).
3.3.3 The "Solubility Problem" and CosolventMethods
Since many new substances of interest are very poorlysoluble in water, the determination of the pKa in aqueoussolution can be difficult and problematic. Potentiometry canbe a quick technique for such determination, provided thesolubility of the substance is at least 100 µM. (Solutions asdilute as 10 µM can still be analyzed, but special attentionmust be given to electrode calibration, and ambient carbondioxide must be excluded.) If the substance is only solubleto 1 - 10 µM and possesses a pH-sensitive UV chromophore,then spectrophotometry can be applied. CE methods mayalso be useful since very small sample quantities arerequired, and detection methods are generally quite sensitive.
If the compound is virtually insoluble (< 1 µM), then apH-metric mixed solvent approach can be tried [88]. Forexample, the pKa of the antiarrhythmic amiodarone, 9.06 ±0.14, was determined from water-methanol mixtures, thoughthe intrinsic solubility of the molecule is about 0.008 µM (6ng/mL) [197, Avdeef (unpublished data)].
The most explored solvent systems are based on water-alcohol mixtures [95,135,137,152-181]. DMSO-water [182-186], dioxane-water [187-191], and other systems [192-193]have been explored. Where possible, methanol is the solventof choice, because its general effect on pKas has been studiedso extensively. It is thought to be the least "error-prone" ofthe common solvents.
Mixed-solvent solutions of various cosolvent-waterproportions are titrated and psKa (the apparent pKa) isdetermined in each mixture. The aqueous pKa is deduced by
extrapolation of the psKa values to zero cosolvent. Thistechnique was first used by Mizutani in 1925 [152- 154].Many examples may be cited of pKas determined byextrapolation in mixtures of methanol [95,122,133,162,163,167, 171], ethanol [155,159-161,164], propanol[180], DMSO [183,186], dimethylformamide [193], acetone[192], and dioxane [187]. Plots of psKa versus weight percentorganic solvent, Rw = 0 - 60 wt%, at times show either a"hockey-stick" shape, or a "bow" shape [95]. For Rw > 60wt%, "S" shaped curves are sometimes observed. (Generally,psKa values from titrations with Rw > 60 wt% are notsuitable for extrapolation to zero cosolvent because KCl andother ion-pairing interfere significantly in the reduceddielectric medium [214])
For values of Rw < 60 wt%, the nonlinearity in psKa
plots can be ascribed partly to electrostatic long-range ion-ion interactions. Extensions of the Born electrostatic model,drawing on Bjerrum's theory of ion association, [214] wereintroduced by Yasuda [165] and Shedlovsky [172]. It wasrecognized that equilibrium quotients in mixed solvents ofvarying proportions ought explicitly to incorporate theconcentration of water, since constancy in water activitycannot be expected in cosolvent mixtures. It was thusproposed that the plot of psKa + log[H2O] versus 1/∈ shouldproduce a straight line for solutions with dielectric constant,∈, greater than 50, which for methanol at 25oC means Rw <60 wt%. The slope in such a plot is expected to be inverselyproportional to the average ionic diameter of the solvatedmolecule [172]. The Yasuda-Shedlovsky procedure is nowwidely used to determine pKas of very sparingly solublepharmaceutical compounds [95,137,143,194-196].
3.3.4 Use of Cosolvents for Water-Soluble Molecules
As the dielectric constant of the solvent mixturedecreases, the pKa of an acid increases and the pKa of a basedecreases. In a multiprotic molecule, this can be a usefulproperty in identifying the ionization groups. (Fig. 11)shows how the pK as of vancomycin are affected by changingdielectric constant [133,137]. The psKa vs R w curves withpositive slopes were assigned to the carboxylic group and thephenolic residues (structure in Fig. 10a), and the tworemaining curves, one with a distinct negative slope, wereassigned to bases (primary amine on the saccharide moietyand the secondary amine on the right side of the moleculepictured in Fig. 10a). The nonlinear appearance of thehighest pKa in (Fig. 11) is notably improved in a Yasuda-Shedlovsky plot [133].
It is conceivable that the lowest descending pKa and thelowest ascending pKa may cross as Rw approaches 100%[133]. It is interesting that the dielectric constant for puremethanol is about 32, the same value associated with thesurface of phospholipid bilayers (in the region of thephosphate groups). This will be further explored later.
3.4 Spectrophotometric Determinations
The most effective spectrophotometric procedures for pKa
determination are based on the processing of wholeabsorption curves over a broad range of wavelengths, withdata collected over a suitable range of pH. Most of the
n

Physicochemical Profiling (Solubility, Permeability and Charge State) Current Topics in Medicinal Chemistry, 2001, Vol. 1, No. 4 291
approaches are based on mass balance equationsincorporating absorbance data (of solutions adjusted tovarious pH values) as dependent variables and equilibriumconstants as parameters, determined by nonlinear least-squares refinement, using Gauss-Newton, Marquardt, orSimplex procedures [96-102,198].
For an ionizable molecule, the refinement model can beposed as
Aik = ∑ jspecies cij ∈jk (16)
where Aik is the calculated absorbance at the k wavelength inthe i spectrum. Different values of i denote spectra collectedat different pH. The molar absorptivity of the j species at thek wavelength is denoted by ∈jk, and the concentration of thej species at the i pH is cij. Species here refers to the differentcharge-state forms of a molecule. The values of cij arefunctions of the total sample concentration and the ionizationconstants; these are calculated as in procedures for the pH-metric refinement of constants [94]. One can estimate pKas,intelligently guess the values of ∈jk and use these tocalculate values of Aik. In the calculation, the objective is tominimize the sum of the residuals between the calculated andobserved absorbances,
R = ∑kspecies ∑i
spectra(pH) (Aikobs - Aik
calc)2 / σik2 (17)
where σik are the estimated uncertainties in the measuredvalues of absorbances. Mathematically-imposed constraintsprevent the calculation of negative values of absorbances[215]. The "best" set of refined pKa constants are thosewhich minimizes R.
In complicated equilibria, uninformed guessing of pKasand ∈jk can be unsettling. Elegant mathematical methodshave evolved to help this process of supervised calculation.Since not all species in a multiprotic compound possessdetectible UV chromophores or sometimes more than onespecies have nearly identical molar absorptivity curves,methods had to be devised to determine the number ofspectrally-active components [97]. With ill-conditionedequations, damping procedures are required [98]. Gampp andcoworkers [103] considered principal component analysis(PCA) and evolving factor analysis (EFA) methods indeciding the presence and stoichiometries of the absorbingspecies.
Tam and coworkers [105-111,114-117,216] developed avery effective generalized method for the determination ofionization constants and molar absorptivity curves ofindividual species, using diode-array UV spectrophotometry,coupled to an automated pH titrator. Species selection waseffected by target factor analysis (TFA), and EFA methodswere used. Multiprotic compounds with overlapping pKaswere investigated. Binary mixtures of ionizable compoundswere considered [115]. Determination of microconstants hasbeen reported [111,114]. The use of cosolvents allowed thedeconvolutions of twelve microconstants of cetirizine, athree-pKa molecule [116]. Validation studies, comparing theTFA method to the first derivative technique, were reported[106,110].
A 96-well microtitre plate high-throughput method,called spectral gradient analysis (SGA), based on a pH-gradient flow technique with diode-array UV detection wasreported recently [109,113]. A universal buffer, consisting ofcitric acid, phosphate, tris(hydroxymethyl)- aminomethane,and n-butylamine, was developed in an acidified and analkaline form [113]. Mixture of the two forms in a flowingstream produced a pH gradient very linear in time.Apparently similar flow-stream universal buffers have beendeveloped by Alibrandi and coworkers [104,112] fordetermining kinetic parameters. The SGA method wassuccessfully validated using 110 structurally unrelatedcompounds [109].
In our own analytical services laboratory, we prefer tomeasure the pKa of a molecule (whose structure may not beknown to us) first by the TFA method, because very littlesample is consumed. (We sometimes have not much morethan 1 mg of sample with which to work.) Only when theanalysis of the data proves problematic do we repeat thedetermination, the second time using potentiometry, wheremore sample is required. If any indication of precipitation isevident, either DMSO or methanol is added to the titratedsolution and the titration is repeated three times (using thesame sample), with additional water added between therepeats, to effect different Rw values of the mixed solvent
Fig. (11). The six apparent ionization constants of vancomycinplotted as a function of weight% methanol. Unfilled circlesdenote acid groups and filled circles denote basic groups. Acidsusually are indicated by positive slopes, and bases by negativeslopes.

292 Current Topics in Medicinal Chemistry, 2001, Vol. 1, No. 4 Alex Avdeef
solutions. It has been our experience that if the TFA methodfails and more sample is available, the follow-up pH- metricmethod always works.
3.5 Capillary Electrophoresis Determinations
CE determination of pKas is new, compared to the othertechniques [118-120]. It has the advantage of being a ratheruniversal method since different detection systems can becoupled to CE. Because it is a separation technique, sampleimpurities are not generally a problem. A fused-silicacapillary, with an inner diameter of 50 - 75 µm, and 27 - 70cm in length is filled with a dilute aqueous buffer solution(ionic strength 0.01 - 0.05 M) [118]. About 10 nL of asample solution, whose concentration is about 50 µM, isgathered at one end of the capillary, and a 20 - 30 kVpotential is applied between the ends of the capillary dippedinto each of two beakers. Sample consumption is roughly0.2 ng per injection. Sample species migrate according totheir charge and fluid drag. Apparent electrophoretic mobilityis determined, which is related to the migration time, thelength of the capillary, and the applied voltage. The mobilityof ionizable compounds is dependent on the fraction of thecompound in the charged form. This in turn depends on thepKa. The plot of the apparent mobility vs. pH has asigmoidal shape, with the midpoint pH equal to the pKa.The practical range for buffer pH in CE is between 2 - 3 atthe low end and 11 - 12 at the high end. When UV detectionis used, the limit of detection for a molecule having the
molar absorptivity of benzoic acid at 220 nm is about 2 µM[118]. Ishihama and coworkers [119] were able to determinethe pKas of multiprotic molecules by CE, one moleculehaving seven ionization groups. They reported a 10 µMlimit of detection for verapamil. Its reported pKa, 8.89,compares well to that determined by potentiometry, 9.07[unpublished data].
3.6 pKa Microconstants
In certain types of multiprotic molecules it is possiblethat chemically different species of the same stoichiometriccomposition are formed [116,199-213]. The pH-metrictitration technique cannot distinguish between suchtautomeric species. In such cases the determined pKa is acomposite constant, a macroconstant. The thermodynamicexperiment is a proton counting technique. It cannot identifythe site in the molecule from which the proton comes. It canonly be said that a proton emerges from somewhere in themolecule. On the other hand, microconstants arecharacteristic of individual species, of which there may bemore than one with the same composition.
Various relationships between macro- and microconstantshave been derived in the cited literature. The microspeciesand microconstants of cetirizine (triprotic molecule withmacroconstant pKas 2.12, 2.90, and 7.98) are shown in (Fig.12), based on the impressive work of Tam and Quéré [116].The microspecies denoted by an astrisk in (Fig. 12) are the
Fig. (12). Microspeciation of cetirizine, a three-pKa molecule, based on the study in ref [116]. The values refer to micro-pKas. Theasterisks denote the principle species at various pH states.

Physicochemical Profiling (Solubility, Permeability and Charge State) Current Topics in Medicinal Chemistry, 2001, Vol. 1, No. 4 293
principal species present in solution. As pH increases, theprotonated nitrogen nearest the phenyl groups is the firstcenter to shed charge. The corresponding dication →← mono-cation reaction has the micro-pKa 2.32. The next principalcenter to shed a proton is the carboxylic group, leading tothe formation of a zwitterion (micro-pKa 2.70). The highest-pH principal deprotonation consists of the protonatednitrogen nearest the carboxylate group losing its proton(micro-pKa 7.98) to form the anionic species on the rightside of (Fig. 12).
In cetirizine, the carboxylic group has four differentmicro-pKas, 2.70 - 5.47, depending on the neighboring-group charge state. The nitrogen nearest the phenyl groupshas the micro-pKas in the range 2.02 - 7.33. The othernitrogen has the values in the range 2.77 - 7.98. Withoutknowledge of the microconstants, it behooves one to assignpKas obtained from a potentiometric titration: is pKa 2.12due to one of the nitrogens or the carboxylic group?
4 PARTITIONING INTO OCTANOL
In all other sections of this review, we use the term Kp torepresent the partition coefficient, and Kd to represent theapparent partition coefficient. These terms were chosen toavoid symbol conflict when discussing permeability anddiffusivity. Since this section is devoted primarily topartition coefficients, we will use the most commonterminology: P for partition coefficients and D for apparent(pH-dependent) partition coefficients. (Other symbols forthese parameters have been used in the literature, includingPOW, KOW, PC, APC.)
Central to the Hansch analysis [1,76] is the use of log Por log D to predict biological activity. Much has been saidabout the measurement and applications of these parameters[1,12,13,37,76-78,195,196,212,217-236]. Two recentconferences were dedicated to the topic [237,238].
Dearden and Bresnen [217], Hersey et al [218], andKrämer and coworkers [323] described how to measure log P/ log D: which techniques to use, what pitfalls to look outfor, what lipid:water volumes to consider, the value of GLP– in other words, how to do it right. The structure of octanolbecame better understood [77,78]. Issues of water drag wereinvestigated [219,220]. Partition solvents other than octanol(CHCl3, various alkanes, PGDP, and 1,2- dichloroethane)were explored for the effect of their hydrogen bondingdonor/acceptor properties [1,123,221,233,327]. Seiler's [222]concept of ∆ log P was further tested [223,224,229]. Methodsto predict H-bond factors from two-dimensional structureswere expanded [226-232]. H-bonding was prodded as "thelast mystery in drug design." [225]. The concept of"molecular chameleons," proposed by Testa and coworkers,was applied to the study of intramolecular effects inmorphine glucuronide conformational-sensitive partitioning[123, 234,235]. A case was made for the return of olive oil,as a model solvent in the prediction of partitioning intoadipose tissue [236].
Today almost every practicing pharmaceutical scientistknows the difference between log P and log D [239-246].Better understanding of the partitioning behavior of
ampholytes and charged species emerged [247-261]. Theconcept of the micro-log P was formalized [195,212,242,244]. Rapid HPLC methods for determining log P werefine-tuned [262-265]. IAM (immobilized artificial mem-brane) [27,266-278] and liposome chromatography [279-283]and capillary electrophoresis [284,285] evoked considerableinterest. Potentiometric methods of log P determinationmatured and achieved recognition [88,121-123,125,133,137,143,194-196,222,244,286-327]. Some remarkable newinsights were gained about the membrane interactions ofcharged amphiphilic species from the study of drugpartitioning into liposomes [344-416]. The need for high-throughput measurements led to the scaling down of severaltechniques to the 96-well microtitre plate format [264].
4.1 Tetrad of Equilibria
The topic of drug partitioning between water and lipidsconcerns chemical equilibria. For a monoprotic weak acid(and base), the partitioning equilibria may be represented as
HA →← HA(ORG) ( B →← B (ORG) ) (18)
As mentioned before, the law of mass action sets theconcentration relations of the reactants and products. So, theequilibrium constants, termed the partition coefficients, arethe quotients
P HA = [HA(ORG)] / [HA] ( P B = [B(ORG)] / [B] ) (19)
where [HA] ([B]) is the free acid (free base) aqueousconcentration, moles/liter aqueous solution, and the ORG-subscripted term is the concentration in the oil phase,moles/liter of organic solvent [309]. When the partitioncoefficient is determined directly, usually the aqueousconcentration is determined analytically (UV or HPLC), andthe oil-phase counter part is inferred through mass balance[217].
Not only the neutral species, but the charged species canpartition into the organic phase (such as octanol), althoughusually to a much lesser extent,
A- →← A- (ORG) ( BH+ →← BH+
(ORG) ) (20)
P A = [A - (ORG)] / [A
-] ( P BH = [BH+(ORG)] / [BH+] ) (21)
To distinguish partition coefficients of neutral speciesfrom ionized species, the notation log P N and log P I may beused, respectively, or the symbol "C" or "A" may be used asa substitute for superscript "I", denoting a cation or anion,respectively [325].
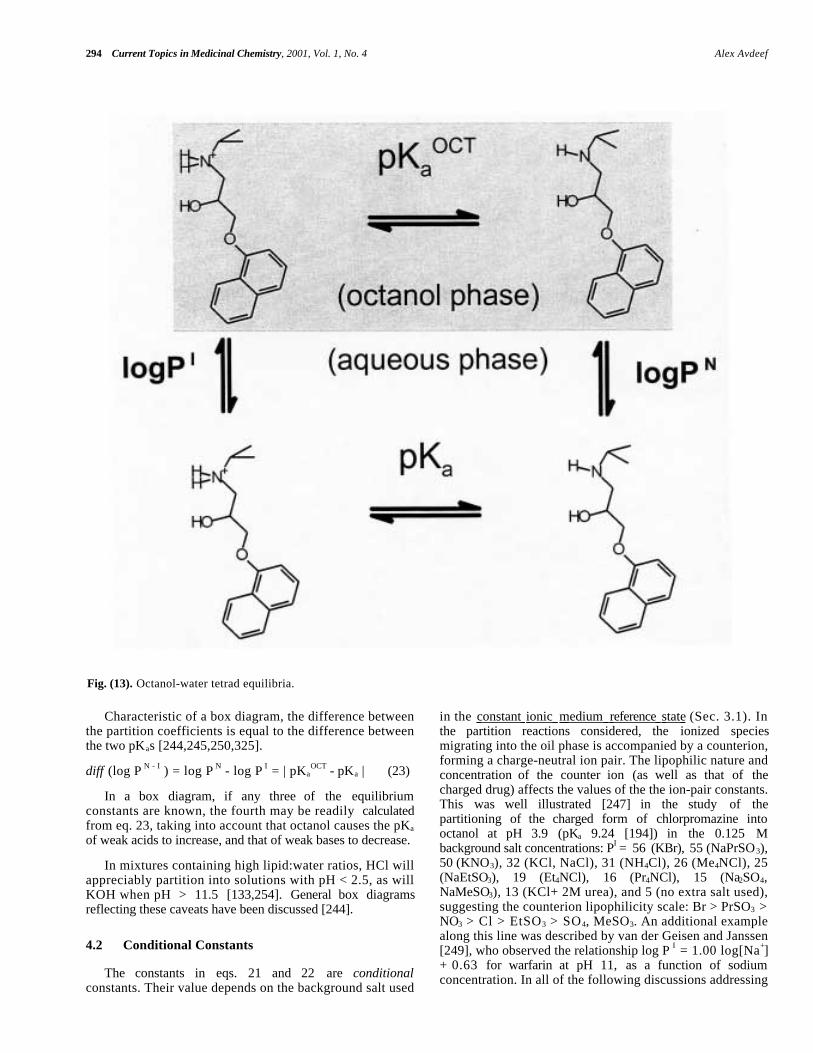
It is convenient to summarize the various reactions in thebox diagram, (Fig. 13), [1,244,250] illustrated with theequilibria of the weak base, propranolol. In (Fig. 13) is anequation labeled pKa
OCT. This constant refers to the "octanol"pKa, a term first used by Scherrer [250]. When theconcentrations of the uncharged and the charged species inoctanol are equal, the aqueous pH at that point definespKa
OCT, which is indicated for a weak acid as
HA(ORG) →← A- (ORG) + H+ Ka
OCT = [A -(ORG)] [H
+] / [HA(ORG) ]
(22)
294 Current Topics in Medicinal Chemistry, 2001, Vol. 1, No. 4 Alex Avdeef
Characteristic of a box diagram, the difference betweenthe partition coefficients is equal to the difference betweenthe two pKas [244,245,250,325].
diff (log P N - I ) = log P N - log P I = | pKaOCT - pKa | (23)
In a box diagram, if any three of the equilibriumconstants are known, the fourth may be readily calculatedfrom eq. 23, taking into account that octanol causes the pKa
of weak acids to increase, and that of weak bases to decrease.
In mixtures containing high lipid:water ratios, HCl willappreciably partition into solutions with pH < 2.5, as willKOH when pH > 11.5 [133,254]. General box diagramsreflecting these caveats have been discussed [244].
4.2 Conditional Constants
The constants in eqs. 21 and 22 are conditionalconstants. Their value depends on the background salt used
in the constant ionic medium reference state (Sec. 3.1). Inthe partition reactions considered, the ionized speciesmigrating into the oil phase is accompanied by a counterion,forming a charge-neutral ion pair. The lipophilic nature andconcentration of the counter ion (as well as that of thecharged drug) affects the values of the the ion-pair constants.This was well illustrated [247] in the study of thepartitioning of the charged form of chlorpromazine intooctanol at pH 3.9 (pKa 9.24 [194]) in the 0.125 Mbackground salt concentrations: PI = 56 (KBr), 55 (NaPrSO3),50 (KNO3), 32 (KCl, NaCl), 31 (NH4Cl), 26 (Me4NCl), 25(NaEtSO3), 19 (Et4NCl), 16 (Pr4NCl), 15 (Na2SO4,NaMeSO3), 13 (KCl+ 2M urea), and 5 (no extra salt used),suggesting the counterion lipophilicity scale: Br > PrSO3 >NO3 > Cl > EtSO3 > SO4, MeSO3. An additional examplealong this line was described by van der Geisen and Janssen[249], who observed the relationship log P I = 1.00 log[Na+]+ 0.63 for warfarin at pH 11, as a function of sodiumconcentration. In all of the following discussions addressing
Fig. (13). Octanol-water tetrad equilibria.
Physicochemical Profiling (Solubility, Permeability and Charge State) Current Topics in Medicinal Chemistry, 2001, Vol. 1, No. 4 295
ion pairs, it will be assumed that 0.15 M KCl or NaCl is thebackground salt, unless otherwise indicated.
4.3 log P Databases
A large list of log P values has been tabulated by Leo etal. in a 1971 review [328]. Commercial databases areavailable [329-331]. The best known is the Pomona CollegeMedChem Database, [331] containing 53,000 log P values,with 11,000 confirmed to be of high quality, the "log P-star"list. (No comparably extensive listing of log D values hasbeen reported.)
4.4 log D
The distribution ratio, D, is only used in the context ofionizable molecules [239-246]. Otherwise, D and P are thesame. The partition coefficient, P, defined in eqs. 19, refersto the concentration ratio of a single species. In contrast, thedistribution coefficient, D, can refer to a collection of speciesand can depend on pH. In the most general sense, D isdefined as the sum of the concentrations of all charge-stateforms of a substance dissolved in the lipid phase divided bythe sum of those dissolved in water. For a simplemultiprotic molecule, X, the distribution ratio is defined as
D = { ([X(ORG)]'+[XH(ORG)]'+[XH2(ORG)]'+...) /
([X]+ [XH]+[XH2]+...) } / r (24)
where r is the lipid-water volume ratio, v(ORG)/v(H2O). Theprimed quantity is defined in concentration units of moles ofspecies dissolved in the organic phase per liter of aqueousphase. Assuming a diprotic molecule and substituting eqs.13, 14, 19 and 21 into eq. 24 yields
D = {PA + PHA 10 +(pKa2 - pH )+ PH2A 10 +(pKa2 + pKa1 - 2 pH ) } /
{ 1 + 10 +(pKa2 - pH )+ 10 +(pKa2 + pKa1 - 2 pH ) } (25)
Here, PA refers to the ion-pair partition coefficient of thedianion, PHA to that of the anion, and PH2A refers to thepartition coefficient of the neutral species. If no ion-pairpartitioning takes place, then eq. 25 further simplifies to
log D = log P N - log { 1 + 10 - (pKa2 + pKa1 - 2 pH ) +
10 - (pKa1 - pH ) } (26)
Note that the distribution coefficient depends only onpH, pKas, and P (not on concentration of sample species).Eq. 24 is applicable to all lipophilicity calculations. Specialcases, such as eq. 26, have been tabulated [244].
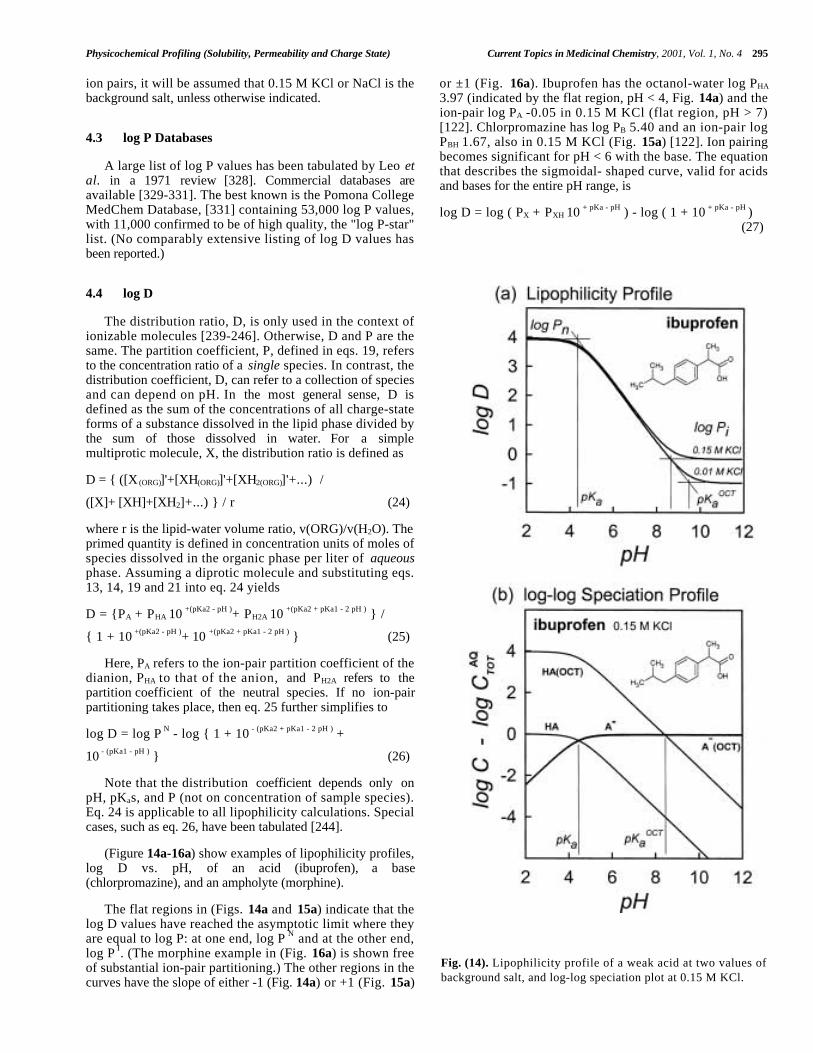
(Figure 14a-16a) show examples of lipophilicity profiles,log D vs. pH, of an acid (ibuprofen), a base(chlorpromazine), and an ampholyte (morphine).
The flat regions in (Figs. 14a and 15a) indicate that thelog D values have reached the asymptotic limit where theyare equal to log P: at one end, log P N and at the other end,log P I. (The morphine example in (Fig. 16a) is shown freeof substantial ion-pair partitioning.) The other regions in thecurves have the slope of either -1 (Fig. 14a) or +1 (Fig. 15a)
or ±1 (Fig. 16a). Ibuprofen has the octanol-water log PHA
3.97 (indicated by the flat region, pH < 4, Fig. 14a) and theion-pair log PA -0.05 in 0.15 M KCl (flat region, pH > 7)[122]. Chlorpromazine has log PB 5.40 and an ion-pair logPBH 1.67, also in 0.15 M KCl (Fig. 15a) [122]. Ion pairingbecomes significant for pH < 6 with the base. The equationthat describes the sigmoidal- shaped curve, valid for acidsand bases for the entire pH range, is
log D = log ( PX + PXH 10 + pKa - pH ) - log ( 1 + 10 + pKa - pH )(27)
Fig. (14). Lipophilicity profile of a weak acid at two values ofbackground salt, and log-log speciation plot at 0.15 M KCl.

296 Current Topics in Medicinal Chemistry, 2001, Vol. 1, No. 4 Alex Avdeef
For a weak acid, PXH > PX and the log D curve decreaseswith pH; for a weak base, PX > P XH, and the log D curveincreases with pH, according to the above equation.
An additional and useful property of lipophilicity profilesis that the pKas are indicated at the points where thehorizontal asymptote lines intersect the diagonal lines (wheredlogD/dpH = 0.5 [244]). In (Fig. 14a), the pKa and pKa
OCT
(cf. Fig. 13) values are 4.45 and 8.47, respectively; in (Fig.15a), the two values are 9.24 and 5.51, respectively. SincepKa
OCT is associated with ion pairing, its value depends onthe ionic strength, as discussed above. This is clearly evidentin (Figs. 14a and 15a).
It may surprise some that for a diprotic molecule withoverlapping pKas, the region of maximum log D (0.76 inFig. 16a) does not equal log P; a displaced horizontal line in(Fig. 16a) indicates the log P to be 0.89 [123,133].
(Figs. 14b, 15b, and 16b) are log-log speciation plots,indicating the concentrations of species in units of the totalaqueous sample concentration. (Similar plots were describedby Scherrer [250].) The uppermost curve in (Fig. 14b) showsthe concentration of the uncharged species in octanol, as afunction of pH. If only uncharged species permeate acrosslipid membranes, as the pH-partition hypothesis purports,
Fig. (16). Lipophilicity profile of an ampholyte at two values ofbackground salt, and log-log speciation plot at 0.15 M KCl.
Fig. (15). Lipophilicity profile of a weak base at two values ofbackground salt, and log-log speciation plot at 0.15 M KCl.

Physicochemical Profiling (Solubility, Permeability and Charge State) Current Topics in Medicinal Chemistry, 2001, Vol. 1, No. 4 297
then this curve deserves attention, perhaps more so than thelog D curve (unless the active site is in the apical membraneouter leaflet of the epithelial cell surface). This curve is likethat of the log D curve, but with ion-pair componentremoved.
4.5 Partitioning of Quaternary Drugs
The octanol-water partitioning behavior of orally-activequaternary ammonium drugs (which are always charged inthe physiological pH range), such as propantheline,trantheline, homidium, and neostigmine, was recentlyreported by Takács-Novák and Szász [261]. Propanethelinehas 10% oral absorption, whereas neostigmine is very poorlyabsorbed from the GI tract [335]. Consistent with this, theoctanol-water log P of the bromide salts range from -1.1 to <-3 [261]. However, in the presence of a 50-fold excess of thebile salt deoxycholate, the homidium apparent partitioncoefficient, log P, elevates to +2.18. Similarly heightenednumbers were seen when the quaternary drugs were combinedwith prostaglandin anions, suggesting a possible role ofendogenous lipophilic counterions in the GI absorption ofthe quaternary ammonium drugs. This topic is under activeexploration.
4.6 log D of Multiprotic Drugs and the Common-IonEffect
Ion-pair partitioning effects with simple salts should nolonger be surprising, given our examples. Partitioning ofmultiprotic molecules, however, warrant additionalconsideration. The partitioning behavior of chargedmolecules, including zwitterions (peptide and other kind)
and ordinary ampholytes, has been intriguing[245,246,248,252,253,255-259,334]. These molecules aresometimes charged over the physiological pH range. Scherrerproposed a classification system for ampholytes based ontheir pKa - pKa
OCT relationships [246]. It is an importanttopic to understand, since the oral absorption of suchmolecules can be poor, and methods to overcome that are thefocus of many efforts.
When the log D vs pH measurement of a peptide isperformed by the shake-flask or the partition chromatographymethod (using buffers to control pH), usually the shape ofthe curve is that of a parabola ([334], (Fig. 1) in ref [252]),with the maximum log D value corresponding to the pH atthe isoelectric point (near pH 5 - 6).
As an eye opener, when the potentiometric method isused to characterize the same peptide, [244] the curveproduced is a step function, as indicated by the thick line in(Fig. 17)for dipeptide Trp-Phe. Both results are correct, eventhough there is a big difference in the profiles. Theexplanation for the difference lies in charged-speciespartitioning: the counterion (from background salt or buffer)plays an ineluctable role. In the potentiometric method, pHis controlled by adding HCl or KOH, to a solution that has a0.15 M physiological level of salt. So, the partitioningmedium always has 0.15 M K+ and Cl- with which toassociate into ion pairs. The effect of buffers in shake flaskor HPLC assays is not always taken into account in thediscussions of results. We can see in (Figs. 14a and 15a),that the log D profiles take on different values when thebackground salt is reduced from 0.15 to 0.001 - 0.01 M. In(Fig. 17), we indicate what happens to the log D curve whenthree different levels of salt are used. Very good match to the"anomalous" values, indicated by open and closed symbols,
Fig. (17). Potentiometrically-determined [133] lipophilicity profiles of a dipeptide, showing the effect of background saltconcentrations. The unfilled symbols are based on shake-flask measurements reported in ref [252], and the filled symbols are resultsreported in ref [334].

298 Current Topics in Medicinal Chemistry, 2001, Vol. 1, No. 4 Alex Avdeef
is found [252,334]. The upward turns in the dashed curve in(Fig. 17) for pH > 11.5 and pH < 2.5 are due to thecommon-ion effect of the salt introduced by the titrant: K+
(from KOH) and Cl- (from HCl), respectively.
In the studies of the salt dependence of peptides, [133]we tried to look for evidence of ion- triplet formation, assuggested by the work of Tomlinson and Davis [248]. Weused Phe-Phe-Phe as a test tripeptide, and reasoned that byperforming the octanol-water partitioning in an aqueoussolution containing different levels of salt (0.02 - 0.50 MKCl), we might see the zwitterion log P show the saltdependence that is to be expected of an ion-triplet formation.We saw none (other than for the cation at low pH and theanion at high pH, as expected of simple ion-extractionreactions) [133]. An interesting explanation offered to us byDr. Milon Tichy [1995, unpublished], based on hisconformational analysis of the structure of the tripeptide in
water, was that Phe-Phe-Phe can form a cyclic structure, withan intramolecular ("internally-compensated") electrostaticbond, (– CO2
–...+NH3 –), formed between the two ends of themolecule. A highly-stabilized ring structure may be morestable than a K+...–O2C )—-( NH3
+...Cl– ion-triplet.
The next example, shown in (Fig. 18a), is the amusingconsequence of continually increasing the concentration ofbackground salt (beyond its aqueous solubility – just tomake the point) to the shape of log D vs pH profile foracebutolol (whose normal 0.15 M curve [325] is indicated bythe thick line in Fig. 18a). The base-like (cf. Fig. 15a)lipophilicity curve shape at low levels of salt can become anacid-like shape (cf. Fig. 14a) at high levels of salt! An actualexample of a dramatic reversal of character is the ionophoremonensin, which has a log P I (in a background of Na+) 0.5greater than log P N [246,251].
Fig. (18). Hypothetical lipophilicity profiles. (a) Fixed extraction constant with differing salt concentrations. (b) Fixed saltconcentration with differing extraction constants.
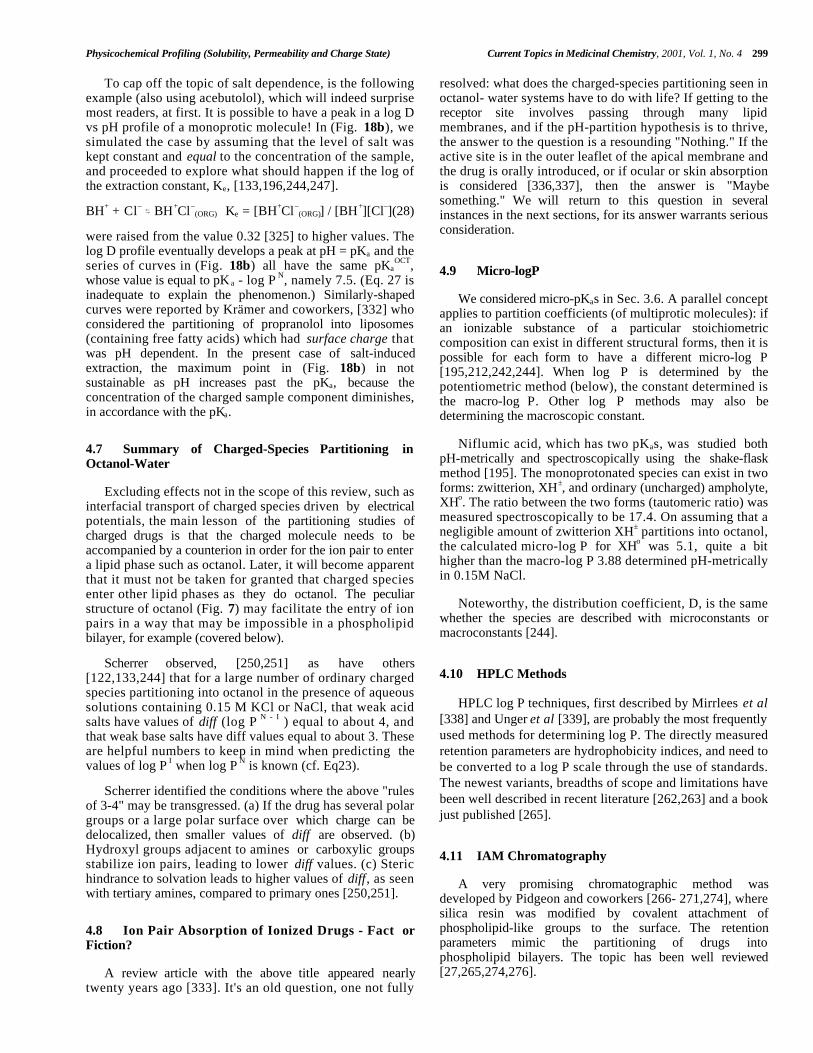
Physicochemical Profiling (Solubility, Permeability and Charge State) Current Topics in Medicinal Chemistry, 2001, Vol. 1, No. 4 299
To cap off the topic of salt dependence, is the followingexample (also using acebutolol), which will indeed surprisemost readers, at first. It is possible to have a peak in a log Dvs pH profile of a monoprotic molecule! In (Fig. 18b), wesimulated the case by assuming that the level of salt waskept constant and equal to the concentration of the sample,and proceeded to explore what should happen if the log ofthe extraction constant, Ke, [133,196,244,247].
BH+ + Cl– →← BH+Cl–
(ORG) Ke = [BH+Cl–(ORG)] / [BH+][Cl–](28)
were raised from the value 0.32 [325] to higher values. Thelog D profile eventually develops a peak at pH = pKa and theseries of curves in (Fig. 18b) all have the same pKa
OCT,whose value is equal to pK a - log P N, namely 7.5. (Eq. 27 isinadequate to explain the phenomenon.) Similarly-shapedcurves were reported by Krämer and coworkers, [332] whoconsidered the partitioning of propranolol into liposomes(containing free fatty acids) which had surface charge thatwas pH dependent. In the present case of salt-inducedextraction, the maximum point in (Fig. 18b) in notsustainable as pH increases past the pKa, because theconcentration of the charged sample component diminishes,in accordance with the pKa.
4.7 Summary of Charged-Species Partitioning inOctanol-Water
Excluding effects not in the scope of this review, such asinterfacial transport of charged species driven by electricalpotentials, the main lesson of the partitioning studies ofcharged drugs is that the charged molecule needs to beaccompanied by a counterion in order for the ion pair to entera lipid phase such as octanol. Later, it will become apparentthat it must not be taken for granted that charged speciesenter other lipid phases as they do octanol. The peculiarstructure of octanol (Fig. 7) may facilitate the entry of ionpairs in a way that may be impossible in a phospholipidbilayer, for example (covered below).
Scherrer observed, [250,251] as have others[122,133,244] that for a large number of ordinary chargedspecies partitioning into octanol in the presence of aqueoussolutions containing 0.15 M KCl or NaCl, that weak acidsalts have values of diff (log P N - I ) equal to about 4, andthat weak base salts have diff values equal to about 3. Theseare helpful numbers to keep in mind when predicting thevalues of log P I when log P N is known (cf. Eq23).
Scherrer identified the conditions where the above "rulesof 3-4" may be transgressed. (a) If the drug has several polargroups or a large polar surface over which charge can bedelocalized, then smaller values of diff are observed. (b)Hydroxyl groups adjacent to amines or carboxylic groupsstabilize ion pairs, leading to lower diff values. (c) Sterichindrance to solvation leads to higher values of diff, as seenwith tertiary amines, compared to primary ones [250,251].
4.8 Ion Pair Absorption of Ionized Drugs - Fact orFiction?
A review article with the above title appeared nearlytwenty years ago [333]. It's an old question, one not fully
resolved: what does the charged-species partitioning seen inoctanol- water systems have to do with life? If getting to thereceptor site involves passing through many lipidmembranes, and if the pH-partition hypothesis is to thrive,the answer to the question is a resounding "Nothing." If theactive site is in the outer leaflet of the apical membrane andthe drug is orally introduced, or if ocular or skin absorptionis considered [336,337], then the answer is "Maybesomething." We will return to this question in severalinstances in the next sections, for its answer warrants seriousconsideration.
4.9 Micro-logP
We considered micro-pKas in Sec. 3.6. A parallel conceptapplies to partition coefficients (of multiprotic molecules): ifan ionizable substance of a particular stoichiometriccomposition can exist in different structural forms, then it ispossible for each form to have a different micro-log P[195,212,242,244]. When log P is determined by thepotentiometric method (below), the constant determined isthe macro-log P. Other log P methods may also bedetermining the macroscopic constant.
Niflumic acid, which has two pKas, was studied bothpH-metrically and spectroscopically using the shake-flaskmethod [195]. The monoprotonated species can exist in twoforms: zwitterion, XH±, and ordinary (uncharged) ampholyte,XHo. The ratio between the two forms (tautomeric ratio) wasmeasured spectroscopically to be 17.4. On assuming that anegligible amount of zwitterion XH± partitions into octanol,the calculated micro-log P for XHo was 5.1, quite a bithigher than the macro-log P 3.88 determined pH-metricallyin 0.15M NaCl.
Noteworthy, the distribution coefficient, D, is the samewhether the species are described with microconstants ormacroconstants [244].
4.10 HPLC Methods
HPLC log P techniques, first described by Mirrlees et al[338] and Unger et al [339], are probably the most frequentlyused methods for determining log P. The directly measuredretention parameters are hydrophobicity indices, and need tobe converted to a log P scale through the use of standards.The newest variants, breadths of scope and limitations havebeen well described in recent literature [262,263] and a bookjust published [265].
4.11 IAM Chromatography
A very promising chromatographic method wasdeveloped by Pidgeon and coworkers [266- 271,274], wheresilica resin was modified by covalent attachment ofphospholipid-like groups to the surface. The retentionparameters mimic the partitioning of drugs intophospholipid bilayers. The topic has been well reviewed[27,265,274,276].
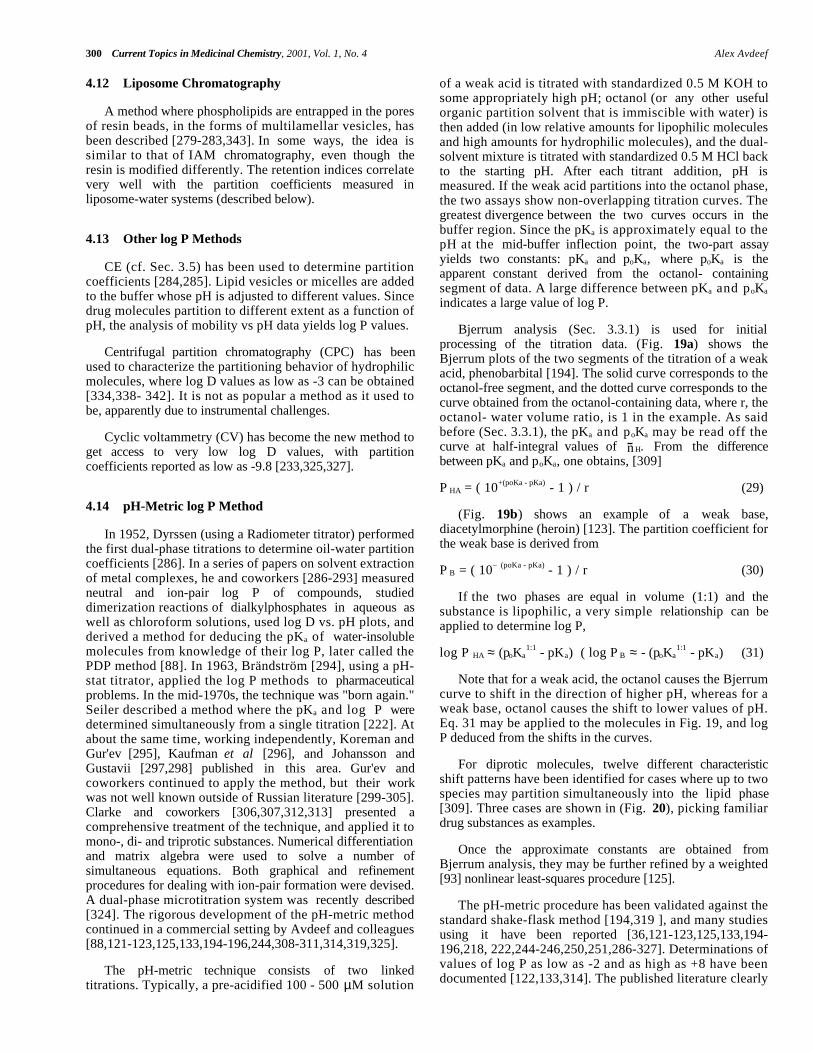
300 Current Topics in Medicinal Chemistry, 2001, Vol. 1, No. 4 Alex Avdeef
4.12 Liposome Chromatography
A method where phospholipids are entrapped in the poresof resin beads, in the forms of multilamellar vesicles, hasbeen described [279-283,343]. In some ways, the idea issimilar to that of IAM chromatography, even though theresin is modified differently. The retention indices correlatevery well with the partition coefficients measured inliposome-water systems (described below).
4.13 Other log P Methods
CE (cf. Sec. 3.5) has been used to determine partitioncoefficients [284,285]. Lipid vesicles or micelles are addedto the buffer whose pH is adjusted to different values. Sincedrug molecules partition to different extent as a function ofpH, the analysis of mobility vs pH data yields log P values.
Centrifugal partition chromatography (CPC) has beenused to characterize the partitioning behavior of hydrophilicmolecules, where log D values as low as -3 can be obtained[334,338- 342]. It is not as popular a method as it used tobe, apparently due to instrumental challenges.
Cyclic voltammetry (CV) has become the new method toget access to very low log D values, with partitioncoefficients reported as low as -9.8 [233,325,327].
4.14 pH-Metric log P Method
In 1952, Dyrssen (using a Radiometer titrator) performedthe first dual-phase titrations to determine oil-water partitioncoefficients [286]. In a series of papers on solvent extractionof metal complexes, he and coworkers [286-293] measuredneutral and ion-pair log P of compounds, studieddimerization reactions of dialkylphosphates in aqueous aswell as chloroform solutions, used log D vs. pH plots, andderived a method for deducing the pKa of water-insolublemolecules from knowledge of their log P, later called thePDP method [88]. In 1963, Brändström [294], using a pH-stat titrator, applied the log P methods to pharmaceuticalproblems. In the mid-1970s, the technique was "born again."Seiler described a method where the pKa and log P weredetermined simultaneously from a single titration [222]. Atabout the same time, working independently, Koreman andGur'ev [295], Kaufman et al [296], and Johansson andGustavii [297,298] published in this area. Gur'ev andcoworkers continued to apply the method, but their workwas not well known outside of Russian literature [299-305].Clarke and coworkers [306,307,312,313] presented acomprehensive treatment of the technique, and applied it tomono-, di- and triprotic substances. Numerical differentiationand matrix algebra were used to solve a number ofsimultaneous equations. Both graphical and refinementprocedures for dealing with ion-pair formation were devised.A dual-phase microtitration system was recently described[324]. The rigorous development of the pH-metric methodcontinued in a commercial setting by Avdeef and colleagues[88,121-123,125,133,194-196,244,308-311,314,319,325].
The pH-metric technique consists of two linkedtitrations. Typically, a pre-acidified 100 - 500 µM solution
of a weak acid is titrated with standardized 0.5 M KOH tosome appropriately high pH; octanol (or any other usefulorganic partition solvent that is immiscible with water) isthen added (in low relative amounts for lipophilic moleculesand high amounts for hydrophilic molecules), and the dual-solvent mixture is titrated with standardized 0.5 M HCl backto the starting pH. After each titrant addition, pH ismeasured. If the weak acid partitions into the octanol phase,the two assays show non-overlapping titration curves. Thegreatest divergence between the two curves occurs in thebuffer region. Since the pKa is approximately equal to thepH at the mid-buffer inflection point, the two-part assayyields two constants: pKa and poKa, where poKa is theapparent constant derived from the octanol- containingsegment of data. A large difference between pKa and poKa
indicates a large value of log P.
Bjerrum analysis (Sec. 3.3.1) is used for initialprocessing of the titration data. (Fig. 19a) shows theBjerrum plots of the two segments of the titration of a weakacid, phenobarbital [194]. The solid curve corresponds to theoctanol-free segment, and the dotted curve corresponds to thecurve obtained from the octanol-containing data, where r, theoctanol- water volume ratio, is 1 in the example. As saidbefore (Sec. 3.3.1), the pKa and poKa may be read off thecurve at half-integral values of H. From the differencebetween pKa and poKa, one obtains, [309]
P HA = ( 10+(poKa - pKa) - 1 ) / r (29)
(Fig. 19b) shows an example of a weak base,diacetylmorphine (heroin) [123]. The partition coefficient forthe weak base is derived from
P B = ( 10– (poKa - pKa) - 1 ) / r (30)
If the two phases are equal in volume (1:1) and thesubstance is lipophilic, a very simple relationship can beapplied to determine log P,
log P HA ≈ (poKa1:1 - pKa) ( log P B ≈ - (poKa
1:1 - pKa) (31)
Note that for a weak acid, the octanol causes the Bjerrumcurve to shift in the direction of higher pH, whereas for aweak base, octanol causes the shift to lower values of pH.Eq. 31 may be applied to the molecules in Fig. 19, and logP deduced from the shifts in the curves.
For diprotic molecules, twelve different characteristicshift patterns have been identified for cases where up to twospecies may partition simultaneously into the lipid phase[309]. Three cases are shown in (Fig. 20), picking familiardrug substances as examples.
Once the approximate constants are obtained fromBjerrum analysis, they may be further refined by a weighted[93] nonlinear least-squares procedure [125].
The pH-metric procedure has been validated against thestandard shake-flask method [194,319 ], and many studiesusing it have been reported [36,121-123,125,133,194-196,218, 222,244-246,250,251,286-327]. Determinations ofvalues of log P as low as -2 and as high as +8 have beendocumented [122,133,314]. The published literature clearly
n

Physicochemical Profiling (Solubility, Permeability and Charge State) Current Topics in Medicinal Chemistry, 2001, Vol. 1, No. 4 301
indicates that the Dyrssen technique is a reliable, versatile,dynamic, and accurate method for measuring log P. It maylack the speed of HPLC methods, and it cannot go as low inlog P as the CV method, but all in all, it is well positionedto replace the shake-flask procedure as the primary validationmethod for ionizable molecules. What keeps it from beingthe "gold standard," its Achilles heel, is that the samplemolecules must be ionizable and have a pKa in themeasurable pH range.
4.15 High-Throughput log P Methods
Several efforts have been made to increase the throughputof the traditional log P methods, by scaling down to a 96-well microtitre plate format [264]. The generic fast-gradientHPLC methods look promising (cf. Sec. 4.10).Immobilized-liposome and IAM chromatography methodscan also be fast. (cf. Secs. 4.11, 4.12) All the chromato-graphy methods suffer from being essentially serial-based
Fig. (19). Octanol-water Bjerrum plots for a monoprotic (a) acid and (b) base. The volumes of octanol and water are equal, so that thedifference between the apparent pKa and the true pKa is about equal to the log of the partition coefficient.
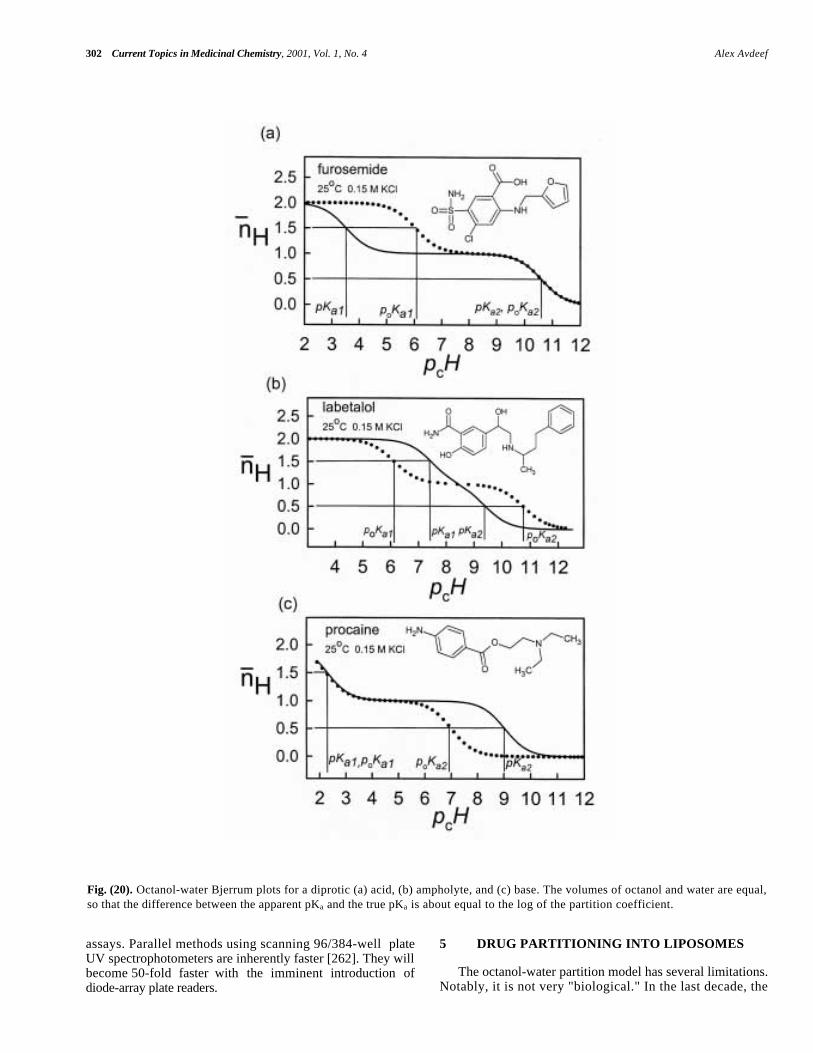
302 Current Topics in Medicinal Chemistry, 2001, Vol. 1, No. 4 Alex Avdeef
assays. Parallel methods using scanning 96/384-well plateUV spectrophotometers are inherently faster [262]. They willbecome 50-fold faster with the imminent introduction ofdiode-array plate readers.
5 DRUG PARTITIONING INTO LIPOSOMES
The octanol-water partition model has several limitations.Notably, it is not very "biological." In the last decade, the
Fig. (20). Octanol-water Bjerrum plots for a diprotic (a) acid, (b) ampholyte, and (c) base. The volumes of octanol and water are equal,so that the difference between the apparent pKa and the true pKa is about equal to the log of the partition coefficient.

Physicochemical Profiling (Solubility, Permeability and Charge State) Current Topics in Medicinal Chemistry, 2001, Vol. 1, No. 4 303
alternative use of liposomes (which are vesicles with wallsmade of a phospholipid bilayer) has become morewidespread [121,133,244,344-406]. Notably, liposomes aremade of the main ingredients found in all biologicalmembranes.
5.1 Tetrad of Equilibria and Surface Ion-Pairing(SIP)
Fig. 21 shows a tetrad of equilibrium reactions related tothe partitioning of a drug between an aqueous environmentand that of the bilayer formed from phospholipids. (Onlyhalf of the bilayer is shown in Fig. 21.) By now, thesereaction types might be quite familiar to the reader. Thesubscript "mem" designates the partitioning medium to be
that of a vesicle formed from a phospholipid bilayer. Eqs.18-21 apply.
The pKamem in (Fig. 21) refers to the "membrane" pKa. Its
meaning is similar to that of pKaOCT : when the
concentrations of the uncharged and the charged species inthe membrane phase are equal, the aqueous pH at that pointdefines pKa
mem, which is described for a weak base as
BH+(mem) →← B(mem) + H+ Ka
mem = [B(mem)] [H+] / [BH+
(mem)]
(32)
The salt dependency of constants discussed in Sec. 4.2also applies to the pKa
mem and log PmemSIP constants.
Although they are conditional, the dependence on ionic
Fig. (21). Phospholipid membrane-water tetrad equilibria. Only half of a bilayer is shown.
Dr. Mansoor Alam

304 Current Topics in Medicinal Chemistry, 2001, Vol. 1, No. 4 Alex Avdeef
strength is subtle [395,404]. It is thought that when acharged drug migrates into the lipid environment of aliposome, the counterion which at first accompanies it maybe exchanged with the zwitterionic phosphatidylcholine headgroups, as suggested in (Fig. 21). As the nature of the ionpair may be different with liposome partitioning, the term"surface ion pair" (SIP) will be used to denote it. We willuse the term diffmem to designate the difference between theneutral species partitioning and the surface ion-pairpartitioning (cf. eq. 23).
5.2 Databases
There are no convenient databases for liposome log Pvalues. Most measured quantities need to be ferreted fromoriginal publications [121,133,343,345-351,405]. Thehandbook edited by Cevc [344] is a comprehensivecollection of properties of phospholipids, includingextensive compilations of structural data from X-raycrystallographic studies. Lipid-type distributions in variousbiological membranes have been reported [344,352,395].
5.3 Location of Drugs Partitioned into Bilayers
Based on the observed nuclear Overhauser effect in a31P{1H} nmr study of egg phosphatidylcholine (eggPC)bilayers, Yeagle et al [363] concluded that the N-methylhydrogens were in close proximity to phosphate oxygens inneighboring phospholipids, suggesting that the surface of thebilayer was a "shell" of interlocking (intermolecular)electrostatic associations. Added cholesterol bound below thepolar head groups, and did not interact with them directly.However, its presence indirectly broke up some of the surfacestructure, making the surface more polar and open tohydration.
Boulanger et al [382,383] studied the interactions of thelocal anesthetics procaine and tetracaine with eggPCmultilamellar vesicles (MLV, 52 - 650 mM), as a functionof pH, using deuterium nmr as a structural probe. Theyproposed a three-site model, similar to that in (Fig. 21),except that the membrane-bound species (both charged anduncharged) had two different locations, one a weakly-boundsurface site (occupied at pH 5.5), and the other a strongly-bound deeper site (occupied at pH 9.5). Membrane partitioncoefficients were estimated for both sites. Westman et al[384] further elaborated the model by applying the Gouy-Chapman theory. When a charged drug partitions into thebilayer, a Cl– is likely bound to the surface, to maintaincharge neutrality. They found unexpected low values of
diffmem of 0.77 for tetracaine and 1.64 for procaine (cf. Sec.4.7). Kelusky and Smith [385], also using deuterium nmr,proposed that at pH 5.5, there was an electrostatic bondformed between the protonated drug and the phosphategroups, (≡P–O–... +H3N–), and a hydrogen bond formedbetween the aminobenzene proton and the acyl carbonyloxygen. At pH 9.5, the electrostatic bond breaks as thesecondary amine moves deeper into the interior of thebilayer; however, the aminobenzene H-bond, (=CO ... HN=),continues to be an anchoring point.
Bäuerle and Seelig [359] studied the structural aspects ofamlodipine (weak base, primary amine pKa 9.26 [133]) andnimodipine (nonionizable) binding to phospholipid bilayers,using nmr, microcalorimetry, and zeta-potentialmeasurements. They were able to see evidence of interactionsof amlodipine with the cis double bond in the acyl chains.They saw no clear evidence for (≡P–O–... +H3N–) electrostaticinteractions.
Herbette and coworkers [387-390,408] studied thestructures of drugs bound in liposomes using a low-angle X-ray diffraction technique. Although the structural details werecoarse, it was apparent that different drugs position indifferent locations of the bilayer. For example, amlodipine ischarged when it partitions into a bilayer at physiological pH:the aromatic dihydropyridine ring is buried in the vicinity ofthe carbonyl groups of the acyl chains, while the –NH3
+ endpoints toward the aqueous phase, with the positive chargelocated near the phosphate negatively-charged oxygen atoms[388-390]. A much more lipophilic molecule, amiodarone(weak base with pKa 9.1 [197]), positioned itself closer tothe center of the hydrocarbon interior [387].
5.4 Thermodynamics of Partitioning: Entropy- orEnthalpy-Driven?
Davis et al [358] studied the thermodynamics of thepartitioning process of substituted phenols and anisoles inoctanol, cyclohexane, and dimyristoylphosphatidylcholine(DMPC), below its gel-liquid transition temperature. (Table1) shows the results for 4-methylphenol.
Partitioning was generally entropy driven, but thecomponents of the free energy of transfer were greatlydifferent in the three lipid systems (Table 1). Octanol wasthe only lipid to have an exothermic heat of transfer(negative enthalpy), due to H-bond stabilization of thetransferred solute, not found in cyclohexane. The free energyof transfer into DMPC at 22oC was greater than into octanolor cyclohexane. Although ∆Htr in the DMPC system is a
Table 1. Energy of Transfer (kJ mol-1) into Lipid Phase for 4-Methylphenol
Component DMPC Octanol Cyclohexane
∆Htr +92.0 -7.3 +18.6
T ∆Str +114.1 +9.2 +22.2
∆Gtr -22.1 -16.5 -3.6
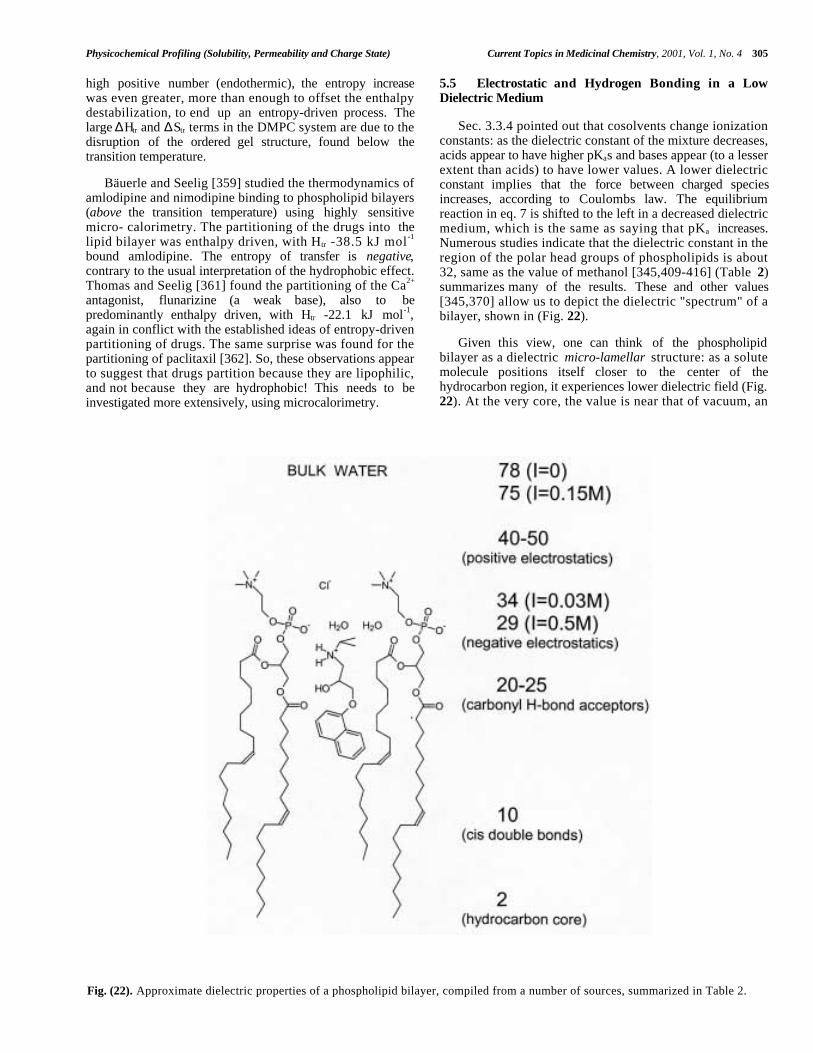
Physicochemical Profiling (Solubility, Permeability and Charge State) Current Topics in Medicinal Chemistry, 2001, Vol. 1, No. 4 305
high positive number (endothermic), the entropy increasewas even greater, more than enough to offset the enthalpydestabilization, to end up an entropy-driven process. Thelarge ∆Htr and ∆Str terms in the DMPC system are due to thedisruption of the ordered gel structure, found below thetransition temperature.
Bäuerle and Seelig [359] studied the thermodynamics ofamlodipine and nimodipine binding to phospholipid bilayers(above the transition temperature) using highly sensitivemicro- calorimetry. The partitioning of the drugs into thelipid bilayer was enthalpy driven, with Htr -38.5 kJ mol-1
bound amlodipine. The entropy of transfer is negative,contrary to the usual interpretation of the hydrophobic effect.Thomas and Seelig [361] found the partitioning of the Ca2+
antagonist, flunarizine (a weak base), also to bepredominantly enthalpy driven, with Htr -22.1 kJ mol-1,again in conflict with the established ideas of entropy-drivenpartitioning of drugs. The same surprise was found for thepartitioning of paclitaxil [362]. So, these observations appearto suggest that drugs partition because they are lipophilic,and not because they are hydrophobic! This needs to beinvestigated more extensively, using microcalorimetry.
5.5 Electrostatic and Hydrogen Bonding in a LowDielectric Medium
Sec. 3.3.4 pointed out that cosolvents change ionizationconstants: as the dielectric constant of the mixture decreases,acids appear to have higher pKas and bases appear (to a lesserextent than acids) to have lower values. A lower dielectricconstant implies that the force between charged speciesincreases, according to Coulombs law. The equilibriumreaction in eq. 7 is shifted to the left in a decreased dielectricmedium, which is the same as saying that pKa increases.Numerous studies indicate that the dielectric constant in theregion of the polar head groups of phospholipids is about32, same as the value of methanol [345,409-416] (Table 2)summarizes many of the results. These and other values[345,370] allow us to depict the dielectric "spectrum" of abilayer, shown in (Fig. 22).
Given this view, one can think of the phospholipidbilayer as a dielectric micro-lamellar structure: as a solutemolecule positions itself closer to the center of thehydrocarbon region, it experiences lower dielectric field (Fig.22). At the very core, the value is near that of vacuum, an
Fig. (22). Approximate dielectric properties of a phospholipid bilayer, compiled from a number of sources, summarized in Table 2.

306 Current Topics in Medicinal Chemistry, 2001, Vol. 1, No. 4 Alex Avdeef
environment of outer space! A diatomic molecule of Na+Cl-
would require more energy to separate into two distinct ionsthan that required to break a single carbon-carbon bond.
All this means that ions will not easily enter the interiorof bilayers without first forming contact ion pairs. It isreasonable to imagine that simple drug-counterion pairs,such as (BH+...Cl–) will undergo exchange of charge pairs onentering the head group region, to form, for example,(≡PO–...+HB), as depicted in (Fig. 21). We called such animagined pairing SIP in Sec. 5.1 [121].
An interesting hypothesis may be put forward. Theinterfacial pKa
mem (Fig. 21) that a solute exhibits depends onthe dielectric environment of its location in the bilayer.Simple isotropic water-miscible solvents may be used toapproximate pKa
mem. Pure methanol (∈ 32), may do well forthe bilayer zone containing the phosphate groups; pure 1,4-dioxane (∈ 2) may mimic some of the dielectric properties ofthe hydrocarbon region. It appears that psKa values of severalweak bases, when extrapolated to 100% cosolvent, doapproximate pKa
mem values [133]. Fernández and Fromherzmade favorable comparisons using dioxane [411]. This ideais of considerable practical use, and has been largelyneglected in the literature.
Hence the molecular view of the interactions of drugmolecules with phospholipid bilayers, suggested graphicallyin (Fig. 21), has (1) an electrostatic component of bindingwith the head groups, which depends on the dielectricconstant, (2) a hydrogen bonding component, since thephospholipids are loaded with strong H-bond acceptors readyto interact with solutes having strong H-bond donor groups,
and (3) a hydrophobic component. Interactions betweendrugs and bilayers are like that of a solute and a "fuzzy,delocalized" receptor with the micro- lamellar zones dielectric: H-bond : hydrophobic (Fig. 22). It is useful to explore thisidea, and we will do so below.
5.6 Water Wires and H+/OH– Currents
The stability of vesicular pH gradients (between the innerand outer aqueous solutions) depends on processes which canallow protons to permeate across phospholipid barriers.Phospholipid bilayers are thought not to be permeable tocharged species (cf. pH-partition hypothesis). However,recent studies suggest H+/OH–permeability to be surprisinglyhigh, as high as 10-4 cm/s, greatly exceeding that of about10-12 cm/s for Na+ [373-381]. Biegel and Gould [381] rapidlychanged the pH ("acid pulse measurements") of a suspensionof SUV (small unilamellar vesicles, soybean PC) from theequilibrated pH 8.2 to the external pH 6.65, and monitoredthe rate of influx of H+ into the vesicles. (The pH inside ofvesicles can be measured by fluorescent probes [373,381].) Ittook several minutes for the internal pH to drop from pH 8.2to 7.4. This time was long because charge transfer led tobuild-up of a potential difference across the membrane(Donnan potential), which was slow to dissipate. The timewas dropped to about 300 ms in the presence of a K+
ionophore, valinomycin, an antiporter type of effect. Theproton ionophore, bis(hexafluoroacetonyl)acetone, droppedthe re-equilibration time down to < 1 ms.
Discussions of the possible mechanisms of H+ transportensued. It was pointed out that the solubility of water in n-
Table 2. Dielectric Constants of Water-Lipid Interfaces (Expanded from Ref. 416)
Type Site Method ∈ Ref
unilamellar vesicles (PC, αT)a polar head/acyl core chemical reaction, αT-DPPH 26 409
unilamellar vesicles PC polar head/acyl core fluorescence polarization (DSHA) 33 345
unilamellar vesicles PC+10% cholesterol polar head/acyl core fluorescence polarization (DSHA) 40 345
unilamellar vesicles PC+20% stearylamine polar head/acyl core fluorescence polarization (DSHA) 43 345
unilamellar vesicles PC+20% cardiolipin polar head/acyl core fluorescence polarization (DSHA) 52 345
unilamellar vesicles, PC hydrocarbon core fluorescence polarization (AS) 2 345
multilamellar PC polar head/bulk water fluoresecence polarization (ANS) 32 410
multilamellar PC polar head/acyl core fluorescence polarization (NnN'- DOC) 25 410
unilamellar vesicles (PC,DPPC) polar head/acyl core fluorescence depolarization (DSHA) 32 413
unilamellar vesicles (PC,αT) polar head/acyl core chemical reaction, αT-DPPH 29-36 416
GMO bilayers polar head/acyl core electrical time constant 30-37 414
micelles (CTAB, SDS,Triton- X100) aqueous surface fluorescence (HC, AC) 32 411
micelles (various types) aqueous surface fluorescence (p-CHO) 35-45 412
micelles (SDES, SDS,STS) aqueous surface absorption wavelength max 29-33 415
a Abbreviations: αT=_α-tocopherol, AC=aminocoumarin, ANS=1-anilino-8-naphthalenesulfonic acid, CTAB=cetyltrimethylammonium bromide, DPPC=dipalmitoylphos-phatidyl-choline, DPPH=1,1-diphenyl-2- picrylhydrazyl, DSHA=N-dansylhexadecylamine, GMO=glycerol monooleate, HC=hydrocoumarin, N,N'- DOC=N,N'-di(octadecyl)oxacarbocyanine, PC = phosphatidylcholine, p-CHO=pyrene caroboxaldehyde, SDES=sodium decyl sulfate, SDS=sodium dodecyl sulfate, STS=sodium tetradecyl sulfate.
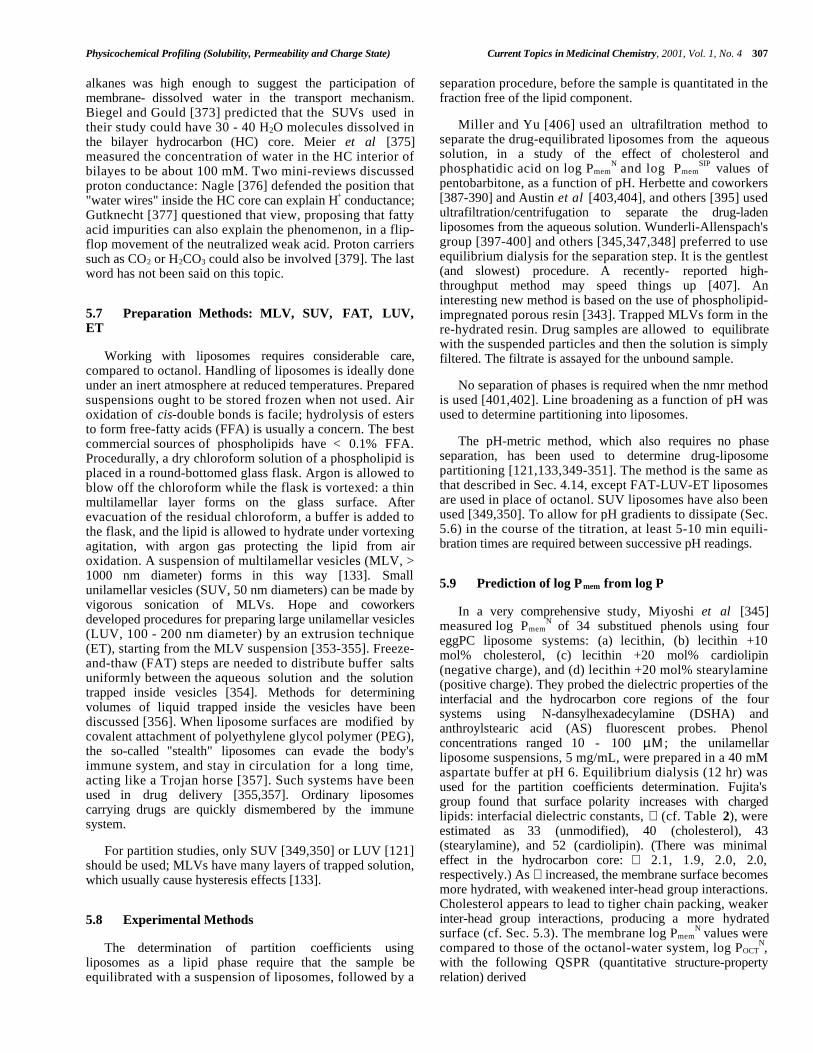
Physicochemical Profiling (Solubility, Permeability and Charge State) Current Topics in Medicinal Chemistry, 2001, Vol. 1, No. 4 307
alkanes was high enough to suggest the participation ofmembrane- dissolved water in the transport mechanism.Biegel and Gould [373] predicted that the SUVs used intheir study could have 30 - 40 H2O molecules dissolved inthe bilayer hydrocarbon (HC) core. Meier et al [375]measured the concentration of water in the HC interior ofbilayes to be about 100 mM. Two mini-reviews discussedproton conductance: Nagle [376] defended the position that"water wires" inside the HC core can explain H+ conductance;Gutknecht [377] questioned that view, proposing that fattyacid impurities can also explain the phenomenon, in a flip-flop movement of the neutralized weak acid. Proton carrierssuch as CO2 or H2CO3 could also be involved [379]. The lastword has not been said on this topic.
5.7 Preparation Methods: MLV, SUV, FAT, LUV,ET
Working with liposomes requires considerable care,compared to octanol. Handling of liposomes is ideally doneunder an inert atmosphere at reduced temperatures. Preparedsuspensions ought to be stored frozen when not used. Airoxidation of cis-double bonds is facile; hydrolysis of estersto form free-fatty acids (FFA) is usually a concern. The bestcommercial sources of phospholipids have < 0.1% FFA.Procedurally, a dry chloroform solution of a phospholipid isplaced in a round-bottomed glass flask. Argon is allowed toblow off the chloroform while the flask is vortexed: a thinmultilamellar layer forms on the glass surface. Afterevacuation of the residual chloroform, a buffer is added tothe flask, and the lipid is allowed to hydrate under vortexingagitation, with argon gas protecting the lipid from airoxidation. A suspension of multilamellar vesicles (MLV, >1000 nm diameter) forms in this way [133]. Smallunilamellar vesicles (SUV, 50 nm diameters) can be made byvigorous sonication of MLVs. Hope and coworkersdeveloped procedures for preparing large unilamellar vesicles(LUV, 100 - 200 nm diameter) by an extrusion technique(ET), starting from the MLV suspension [353-355]. Freeze-and-thaw (FAT) steps are needed to distribute buffer saltsuniformly between the aqueous solution and the solutiontrapped inside vesicles [354]. Methods for determiningvolumes of liquid trapped inside the vesicles have beendiscussed [356]. When liposome surfaces are modified bycovalent attachment of polyethylene glycol polymer (PEG),the so-called "stealth" liposomes can evade the body'simmune system, and stay in circulation for a long time,acting like a Trojan horse [357]. Such systems have beenused in drug delivery [355,357]. Ordinary liposomescarrying drugs are quickly dismembered by the immunesystem.
For partition studies, only SUV [349,350] or LUV [121]should be used; MLVs have many layers of trapped solution,which usually cause hysteresis effects [133].
5.8 Experimental Methods
The determination of partition coefficients usingliposomes as a lipid phase require that the sample beequilibrated with a suspension of liposomes, followed by a
separation procedure, before the sample is quantitated in thefraction free of the lipid component.
Miller and Yu [406] used an ultrafiltration method toseparate the drug-equilibrated liposomes from the aqueoussolution, in a study of the effect of cholesterol andphosphatidic acid on log Pmem
N and log PmemSIP
values ofpentobarbitone, as a function of pH. Herbette and coworkers[387-390] and Austin et al [403,404], and others [395] usedultrafiltration/centrifugation to separate the drug-ladenliposomes from the aqueous solution. Wunderli-Allenspach'sgroup [397-400] and others [345,347,348] preferred to useequilibrium dialysis for the separation step. It is the gentlest(and slowest) procedure. A recently- reported high-throughput method may speed things up [407]. Aninteresting new method is based on the use of phospholipid-impregnated porous resin [343]. Trapped MLVs form in there-hydrated resin. Drug samples are allowed to equilibratewith the suspended particles and then the solution is simplyfiltered. The filtrate is assayed for the unbound sample.
No separation of phases is required when the nmr methodis used [401,402]. Line broadening as a function of pH wasused to determine partitioning into liposomes.
The pH-metric method, which also requires no phaseseparation, has been used to determine drug-liposomepartitioning [121,133,349-351]. The method is the same asthat described in Sec. 4.14, except FAT-LUV-ET liposomesare used in place of octanol. SUV liposomes have also beenused [349,350]. To allow for pH gradients to dissipate (Sec.5.6) in the course of the titration, at least 5-10 min equili-bration times are required between successive pH readings.
5.9 Prediction of log Pmem from log P
In a very comprehensive study, Miyoshi et al [345]measured log Pmem
N of 34 substitued phenols using foureggPC liposome systems: (a) lecithin, (b) lecithin +10mol% cholesterol, (c) lecithin +20 mol% cardiolipin(negative charge), and (d) lecithin +20 mol% stearylamine(positive charge). They probed the dielectric properties of theinterfacial and the hydrocarbon core regions of the foursystems using N-dansylhexadecylamine (DSHA) andanthroylstearic acid (AS) fluorescent probes. Phenolconcentrations ranged 10 - 100 µΜ; the unilamellarliposome suspensions, 5 mg/mL, were prepared in a 40 mMaspartate buffer at pH 6. Equilibrium dialysis (12 hr) wasused for the partition coefficients determination. Fujita'sgroup found that surface polarity increases with chargedlipids: interfacial dielectric constants, ∈ (cf. Table 2), wereestimated as 33 (unmodified), 40 (cholesterol), 43(stearylamine), and 52 (cardiolipin). (There was minimaleffect in the hydrocarbon core: ∈ 2.1, 1.9, 2.0, 2.0,respectively.) As ∈ increased, the membrane surface becomesmore hydrated, with weakened inter-head group interactions.Cholesterol appears to lead to tigher chain packing, weakerinter-head group interactions, producing a more hydratedsurface (cf. Sec. 5.3). The membrane log Pmem
N values werecompared to those of the octanol-water system, log POCT
N,with the following QSPR (quantitative structure-propertyrelation) derived

308 Current Topics in Medicinal Chemistry, 2001, Vol. 1, No. 4 Alex Avdeef
δ = log PmemN - log POCT
N = 0.82 - 0.18 log POCTN +
0.08 HB - 0.12 VOL (33)
where HB refers to H-bond donor strength (HB=pKaH - pKa
R,where pKa
H is the reference phenol value) , and VOL isrelated to a steric effect. For a substituted phenol with a logPOCT
N near zero, the log PmemN value is about 0.82. This
"membrane advantage" factor is sensitive to ionic strengtheffects, and may be indicative of an electrostatic interactionbasis. As the octanol log P value increases, the factordecreases from 0.82, as the negative coefficient -0.18suggests, which can be interpreted to mean that themembrane is less lipophilic than octanol (more alkane like).The H-bonding coefficient, +0.08, indicates that the H-bondacceptor property in membranes is greater than that ofoctanol, and strong H-bond donor phenols will show highermembrane partitioning, compared to octanol. The last termin eq. 33 indicates that membranes do not tolerate sterichindrance as well as octanol; bulky di-ortho substituentsproduces higher VOL values.
(Fig. 23) illustrates the key features of the Fujita study.In relation to the reference phenol in frame (a), frames (b),and (c) illustrate the effect of H-bonding, and frames (d) and(e) illustrate steric hindrance. Given that the H-bond donorstrength of (b) is greater than that of (c), since pKa (b) < pKa
(c),the relative membrane partitioning, δ, increases in (b) anddecreases in (c), relative to (a). Similarly, steric hindrance in(d) produces negative δ, compared to (e).
A plot of δ vs. log POCTN of 55 substituted phenols,
combining the data from Fujita's group [345] with those ofEscher et al [346,347], is shown in (Fig. 24). The slope-intercept parameters listed in the figure are close the thevalues in eq. 33.
The homologous series of (p-methylbenzyl)alkylamines[351] indicates an interesting plot of vs. log POCT
N, shown in(Fig. 25). The slope factor of the smaller members of theseries, -1.02, is larger than that of the phenol series. Thevalue being near 1 indicates that log Pmem
N is invariant withthe octanol partition constant – the membrane partitioningdoes not change for n = 0 to 3 in the series. For n = 4 to 6the octanol and membrane partition coefficients change atabout the same rate. For longer-chain members of the series,the partitioning in both solvent systems expresseshydrophobicity (entropy-driven). However, for the short-chain members, various electrostatic and polar interactionsplay a role, and partitioning in the membrane system is notsensitive to the length of the chain (enthalpy-driven). Itwould be illuminating to subject this series to a precisionmicrocalorimetric investigation.
Fig. (23). The effect of hydrogen bonding and steric hindrance on the difference between liposome-water and octanol-water partitioncoefficients. Increased H-bond donor strength and decreased steric hindrance favor membrane partitioning in the substituted phenols[345].

Physicochemical Profiling (Solubility, Permeability and Charge State) Current Topics in Medicinal Chemistry, 2001, Vol. 1, No. 4 309
Fig. (24). Comparing liposome to octanol partition coefficients of a series of uncharged substituted phenols, with data collected fromrefs [345-347].
Fig. (25). Comparing liposome to octanol partition coefficients of a series of uncharged substituted benzylalkylamines [351]. Themembrane partitioning of the smaller members of the series (n=0 to 3) is thought to be dominated by electrostatic and H-bondingeffects (enthalpy-driven), whereas the partitioning of the larger members is thought to be directed by hydrophobic forces (entropy-driven) [351].

310 Current Topics in Medicinal Chemistry, 2001, Vol. 1, No. 4 Alex Avdeef
When unrelated compounds are examined, [121,133,349,350,391] exluding the phenols and the amines just consi-dered, the variance of the relationship is considerably higher,but the general trend is evident, as seen in (Fig. 26): thehigher the octanol-water partition coefficient, the smaller isthe δ difference between membrane and octanol partitioning.
The slope of the relationship is (Fig. 26) is about twicethat found for phenols. For molecules with log POCT
N
between 2 and 4, δ values are close to zero, indicating thatthe partition coefficients for many drug molecules are aboutthe same in octanol as in phospholipid bilayers [121].However, outside this interval, the differences can besubstantial, as the next examples show. For hydrophilicmolecules, the membrane partition coefficient is surprisinglyhigh, in comparison to that of octanol. For example,acyclovir has log PN = -1.8 in octanol- water but +1.7 inliposome-water, indicating a δ of +3.5 log units. Similartrends are found for other hydrophilic molecules, such asfamotidine or zidovudine (Fig. 26). Atenolol and xamoterolalso have notably high log Pmem
N values [395]. At theopposite extreme is the example of amiodarone. The logoctanol partition coefficient is 7.8, [133] whereas themembrane constant is reported as 6.0, [391] surprisingly,almost two orders of magnitude smaller (δ = -1.8).
Although the relationship in (Fig. 26) is somewhatcoarse, it is still useful in predictions. Since octanol-waterlog P prediction programs are omnipresent and adequatelyreliable, it can now be said that they can predict membrane-water partitioning, by using the equation in (Fig. 26)! Better
yet, if one measures the value of log POCTN, one can estimate
the membrane partition coefficient with the confidence of thevariance expressed in (Fig. 26).
5.10 log Dmem, diff mem, and the Prediction of log PmemSIP
from log P I
In the preceding section, we explored the relationshipbetween log POCT
N and log PmemN. We will now direct our
focus on the nature of partitioning of the charged species intophospholipid bilayer phases. More surprises are in store.
Fig. 27 shows lipophilicity profiles (log D vs. pH) for anacid (warfarin), a base (tetracaine), and an ampholyte(morphine). The dashed curves correspond to the valuesdetermined in octanol-water, and the solid curves to valuesin liposome-water. As is readily apparent, the biggestdifferences between octanol and liposomes occur in the pHregions where charged- species partitioning takes place. InSec. 4.7 we noted that octanol-water diff(log P N - I ) valuesfor simple acids were about 4 and for simple bases about 3.When it comes to liposome-water partitioning, the "diff 3-4"rule appears to slip to the "diff 1-2" rule. This is evident in(Fig. 27a and 27b). The smaller diffmem values in membranesystems have been noted for some time, for example, withreported diffmem = 0 for tetracaine, 1 for procaine andlidocaine [417], and diffmem = 1.45 for tetracaine [386].Miyazaki et al [360] considered diffmem values of 2.2 foracids and 0.9 for bases in their study of dimyristoyl-phosphatidylcholine (DMPC) bilayer dispersions. Other
Fig. (26). The difference between membrane and octanol partitioning as a function of the octanol-water partition coefficient for aseries of unrelated structures [121,349,350,391]. For example, acyclovir partitions into liposomes over 3000 times more stronglythan into octanol, and amiodarone partitions into liposomes 100 times more weakly than into octanol.
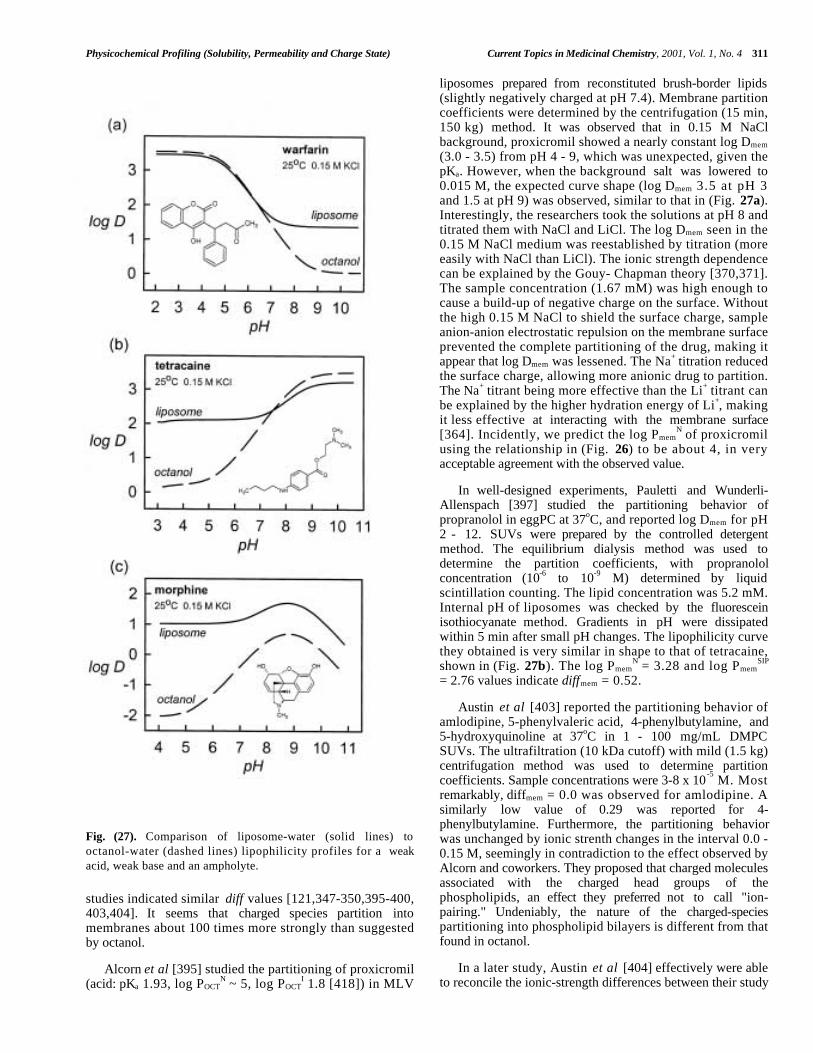
Physicochemical Profiling (Solubility, Permeability and Charge State) Current Topics in Medicinal Chemistry, 2001, Vol. 1, No. 4 311
studies indicated similar diff values [121,347-350,395-400,403,404]. It seems that charged species partition intomembranes about 100 times more strongly than suggestedby octanol.
Alcorn et al [395] studied the partitioning of proxicromil(acid: pKa 1.93, log POCT
N ~ 5, log POCTI 1.8 [418]) in MLV
liposomes prepared from reconstituted brush-border lipids(slightly negatively charged at pH 7.4). Membrane partitioncoefficients were determined by the centrifugation (15 min,150 kg) method. It was observed that in 0.15 M NaClbackground, proxicromil showed a nearly constant log Dmem
(3.0 - 3.5) from pH 4 - 9, which was unexpected, given thepKa. However, when the background salt was lowered to0.015 M, the expected curve shape (log Dmem 3.5 at pH 3and 1.5 at pH 9) was observed, similar to that in (Fig. 27a).Interestingly, the researchers took the solutions at pH 8 andtitrated them with NaCl and LiCl. The log Dmem seen in the0.15 M NaCl medium was reestablished by titration (moreeasily with NaCl than LiCl). The ionic strength dependencecan be explained by the Gouy- Chapman theory [370,371].The sample concentration (1.67 mM) was high enough tocause a build-up of negative charge on the surface. Withoutthe high 0.15 M NaCl to shield the surface charge, sampleanion-anion electrostatic repulsion on the membrane surfaceprevented the complete partitioning of the drug, making itappear that log Dmem was lessened. The Na+ titration reducedthe surface charge, allowing more anionic drug to partition.The Na+ titrant being more effective than the Li+ titrant canbe explained by the higher hydration energy of Li+, makingit less effective at interacting with the membrane surface[364]. Incidently, we predict the log Pmem
N of proxicromilusing the relationship in (Fig. 26) to be about 4, in veryacceptable agreement with the observed value.
In well-designed experiments, Pauletti and Wunderli-Allenspach [397] studied the partitioning behavior ofpropranolol in eggPC at 37oC, and reported log Dmem for pH2 - 12. SUVs were prepared by the controlled detergentmethod. The equilibrium dialysis method was used todetermine the partition coefficients, with propranololconcentration (10-6 to 10-9 M) determined by liquidscintillation counting. The lipid concentration was 5.2 mM.Internal pH of liposomes was checked by the fluoresceinisothiocyanate method. Gradients in pH were dissipatedwithin 5 min after small pH changes. The lipophilicity curvethey obtained is very similar in shape to that of tetracaine,shown in (Fig. 27b). The log Pmem
N = 3.28 and log PmemSIP
= 2.76 values indicate diffmem = 0.52.
Austin et al [403] reported the partitioning behavior ofamlodipine, 5-phenylvaleric acid, 4-phenylbutylamine, and5-hydroxyquinoline at 37oC in 1 - 100 mg/mL DMPCSUVs. The ultrafiltration (10 kDa cutoff) with mild (1.5 kg)centrifugation method was used to determine partitioncoefficients. Sample concentrations were 3-8 x 10
-5 M. Most
remarkably, diffmem = 0.0 was observed for amlodipine. Asimilarly low value of 0.29 was reported for 4-phenylbutylamine. Furthermore, the partitioning behaviorwas unchanged by ionic strenth changes in the interval 0.0 -0.15 M, seemingly in contradiction to the effect observed byAlcorn and coworkers. They proposed that charged moleculesassociated with the charged head groups of thephospholipids, an effect they preferred not to call "ion-pairing." Undeniably, the nature of the charged-speciespartitioning into phospholipid bilayers is different from thatfound in octanol.
In a later study, Austin et al [404] effectively were ableto reconcile the ionic-strength differences between their study
Fig. (27). Comparison of liposome-water (solid lines) tooctanol-water (dashed lines) lipophilicity profiles for a weakacid, weak base and an ampholyte.
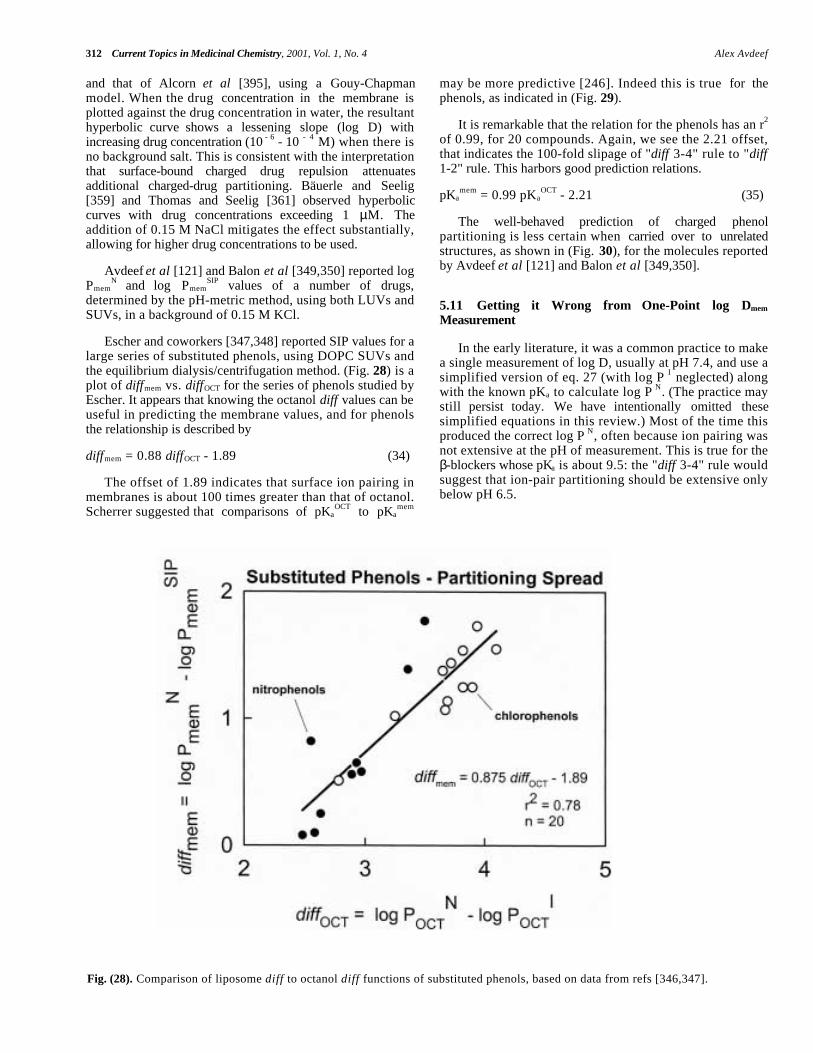
312 Current Topics in Medicinal Chemistry, 2001, Vol. 1, No. 4 Alex Avdeef
and that of Alcorn et al [395], using a Gouy-Chapmanmodel. When the drug concentration in the membrane isplotted against the drug concentration in water, the resultanthyperbolic curve shows a lessening slope (log D) withincreasing drug concentration (10 - 6 - 10 - 4 M) when there isno background salt. This is consistent with the interpretationthat surface-bound charged drug repulsion attenuatesadditional charged-drug partitioning. Bäuerle and Seelig[359] and Thomas and Seelig [361] observed hyperboliccurves with drug concentrations exceeding 1 µM. Theaddition of 0.15 M NaCl mitigates the effect substantially,allowing for higher drug concentrations to be used.
Avdeef et al [121] and Balon et al [349,350] reported logPmem
N and log PmemSIP values of a number of drugs,
determined by the pH-metric method, using both LUVs andSUVs, in a background of 0.15 M KCl.
Escher and coworkers [347,348] reported SIP values for alarge series of substituted phenols, using DOPC SUVs andthe equilibrium dialysis/centrifugation method. (Fig. 28) is aplot of diffmem vs. diffOCT for the series of phenols studied byEscher. It appears that knowing the octanol diff values can beuseful in predicting the membrane values, and for phenolsthe relationship is described by
diffmem = 0.88 diffOCT - 1.89 (34)
The offset of 1.89 indicates that surface ion pairing inmembranes is about 100 times greater than that of octanol.Scherrer suggested that comparisons of pKa
OCT to pKamem
may be more predictive [246]. Indeed this is true for thephenols, as indicated in (Fig. 29).
It is remarkable that the relation for the phenols has an r2
of 0.99, for 20 compounds. Again, we see the 2.21 offset,that indicates the 100-fold slipage of "diff 3-4" rule to "diff1-2" rule. This harbors good prediction relations.
pKamem = 0.99 pKa
OCT - 2.21 (35)
The well-behaved prediction of charged phenolpartitioning is less certain when carried over to unrelatedstructures, as shown in (Fig. 30), for the molecules reportedby Avdeef et al [121] and Balon et al [349,350].
5.11 Getting it Wrong from One-Point log Dmem
Measurement
In the early literature, it was a common practice to makea single measurement of log D, usually at pH 7.4, and use asimplified version of eq. 27 (with log P I neglected) alongwith the known pKa to calculate log P N. (The practice maystill persist today. We have intentionally omitted thesesimplified equations in this review.) Most of the time thisproduced the correct log P N, often because ion pairing wasnot extensive at the pH of measurement. This is true for theβ-blockers whose pKa is about 9.5: the "diff 3-4" rule wouldsuggest that ion-pair partitioning should be extensive onlybelow pH 6.5.
Fig. (28). Comparison of liposome diff to octanol diff functions of substituted phenols, based on data from refs [346,347].

Physicochemical Profiling (Solubility, Permeability and Charge State) Current Topics in Medicinal Chemistry, 2001, Vol. 1, No. 4 313
But with liposome partitioning, the rule slips to "diff 1-2." This means SIP partitioning starts at about pH 8.5 forweak bases whose pKas are near 9.5 (e.g., Figs. 27b, 31).
So, all who published "anomalous" values of log PmemN may
need to get out their slide rules! [391-394] (What we knownow was not known then.)
Fig. (29). The remarkable relationship between the octanol and the membrane pKas of a series of substituted phenols, based on data inrefs [346,347].
Fig. (30).The comparison of membrane to octanol pKas of compounds with unrelated structures [121,349,350].

314 Current Topics in Medicinal Chemistry, 2001, Vol. 1, No. 4 Alex Avdeef
5.12 Partitioning into Charged Liposomes
Wunderli-Allenspach's group reported several partitionstudies where drugs interacted with liposomes which werecharged [332,398-400]. Although not entirely surprising, itwas quite remarkable that propranolol partitions intonegatively charged liposomes with log Pmem
N = 3.49 and logPmem
SIP = 4.24, [400] compared to values determined withneutral liposome values log Pmem
N = 3.27 and log PmemSIP =
2.76 [397]. Negatively-charged liposomes can enhance thesurface ion-pair partitioning (SIP) of positively chargedpropranolol by a factor of 30. The unusually-shapedlipophilicity profile is shown in (Fig. 31), for the systemwhere negative charge is imparted by 24 mol% oleic acid inthe eggPC. Since the FFA is an anion above pH 7 andpropranolol a cation below pH 9, there is a window ofopportunity between pH 7 - 9 for electrostatic attraction ofpropranolol into the membrane phase, as indicated in (Fig.31). Note how similar the curve shapes in Fig. 31 are tosome of the curves in Fig. 18b.
5.13 pKamem Shifts in Charged Liposomes and Micelles
Ionizable molecules imbedded in the surfaces of lipids,such as octanol (cf., Fig. 7), liposomes (cf., Fig. 22), ormicelles, will have their apparent pKas shifted. With neutrallipids, the pKa of an acid increases and the pKa of a basedecreases. This is due to the effect of the decreased dielectricconstant in the interfacial zone, as we have already discussedin various sections.
An additional (electrostatic) shift occurs if the lipidvesicles or micelles have a charged surface, according to theexpression suitable for monoprotic acids and bases,
pKamem = pKa ± diffmem – Fφ/2.3RT (36)
where the terms have their usual meanings, with ± being +sign for acids, - sign for bases [360,368,370,371,411,419,420]. At 25oC and using mV units to express the surfacepotential, φ, the right-most term in eq. 36 becomes φ/59.16.The rationale for the electrostatic term goes like this: if thesurface is negatively charged, then it will attract protons intothe interfacial zone, such that the interfacial pH will be lowerthan the bulk pH, by the amount of |φ/59.16|. A proton fogenvelops the negatively-charged vesicle. Since the protonconcentration is in the pKa expression (eq. 7), the apparentpKa changes accordingly.
Consider negatively charged liposomes made from amixture of phosphatidylcholine (PC) and phosphatidylserine(PS). Unlike the zwitterionic head group of PC (invariantcharge state, pH > 3), the head group of PS has twoionizable functions for pH > 3: the amine and the carboxylicacid. In physiologically neutral solution, the PS groupimparts a negative charge to the liposome (from thephosphate). Titrations of PS-containing liposomes reveal thepKas of 5.5 for the carboxylic acid group and 11.5 for theamine group [367]. When the head group molecule itself(free of the acyl HC chains), phosphoserine, is titrated, theobserved pKas for the two sites are 2.13 and 9.75,respectively [133]. According to our helpful "diff 1-2" rule,we should have expected to see the pKas 4.13 (carboxylate)
Fig. (31). Lipophilicity profiles of propranolol in liposome-water (dashed curve) and in liposome-water where the liposome phasehad 24 mol% FFA, imparting a negative charge to the surface above pH 6 [398].

Physicochemical Profiling (Solubility, Permeability and Charge State) Current Topics in Medicinal Chemistry, 2001, Vol. 1, No. 4 315
and 8.75 (amine), but the liposome titration showssomething else. Instead, we have an "anomalous" additionalshift of +1.37 for the carboxylic group and a +2.75 for theamine group. These extra shifts are due to the negativelycharged surface of the liposomes! We can estimate, using eq.36, that when the carboxylic group is titrated in the PSliposome, the surface charge is -81 mV (pH 5.5), and whenthe amine group is titrated, the surface charge drops to -163mV (pH 11.5). Conversely, if we had a way of estimatingsurface charge, say by zeta-potential measurements,[359,361,362] then we could predict what pKa
mem should be.This is an important consideration, since membranes oftenbear (negative) surface charge.
5.14 Prediction of Absorption from Liposome PartitionStudies?
We now need to pull in some questions arising from theobservations of the partitioning of drugs into liposomes. Itis clear that charged species partition more strongly intoliposomes than anticipated based on octanol behavior (Figs.27, 31). As useful as octanol has been, it has very little tosay about electrostatic forces. In addition, it is apparent thatcertain hydrophilic species like acyclovir, famotidine,atenolol, and morphine partition into liposomes morestrongly than suggested by octanol measurements (Fig. 26).This is a more subtle difference between the lipophilicity-hydrophobicity balance (cf. Sec. 5.4) offered by octanolcompared to phospholipid bilayers. H-bonding is certain tobe a part of this. If amphiphilic charged or H-bondingspecies have such a strong affinity for membranes, can wepredict that passive absorption of charged species should bepossible? What does it mean that acyclovir indicates a logPmem 3.5 units higher than log POCT? We will revisit theseprovocative questions at the end of the review.
6 SOLUBILITY
The treatise by Grant and Higuchi [17] comprehensivelycovers pre-1990 solubility literature. In this section of thereview, we will present a concise solubility equilibriummodel ("not just a number") and stress what is new since1990; we will also cite some important classic works. Manyprotocols have been described in the literature for measuringsolubility-pH profiles, using various detection systems[4,18,24,421-462]. Classical approaches are based on thesaturation shake-flask method [17,18]. New rigorousmethods are usually validated against it. The classicaltechniques are slow and not easily adapted to the high-throughput needs of modern drug discovery research. At theearly stages of research, candidate compounds are stored asDMSO solutions, and solubility measurements need to be
performed on samples introduced in DMSO, often as 10 mMsolutions. It is known that even small quantities of DMSO(<5%) in water can increase the apparent solubility ofmolecules, and that it is a challenge to determine the trueaqueous solubility of compounds when DMSO is present.To this end, a new method has been developed whichextracts true aqueous solubility from DMSO-elevated values[24].
6.1 Solubility-pH Profiles
The basic relationships between solubility and pH can bederived for any given equilibrium model. In this sectionsimple monoprotic and diprotic molecules will be considered[24,432- 443,456].
6.1.1 Monoprotic Weak Acid, HA (or Base, B)
The protonation reactions for ionizable molecules havebeen defined in Sec. 3.1. When a solute molecule, HA (orB), is in equilibrium with its precipitated form, HA(s) (orB(s)), we usually denote the process by the equilibriumexpression
HA(s) →← HA (or B(s) →← B) (37)
and the corresponding equilibrium constant is defined as
S0 = [HA]/[HA(s)] = [HA] (or S0 = [B]/[B(s)] = [B]) (38)
By convention, [HA(s)] = [B(s)] = 1. Eqs. 37 representthe precipitation equilibria of the uncharged species, and arecharacterized by the intrinsic solubility equilibrium constant,S0. The zero subscript denotes the zero charge of theprecipitating species. In a saturated solution, the effectivesolubility, S, at a particular pH is defined as the sum of theconcentrations of all of the compound species dissolved inthe aqueous solution:
S = [A-] + [HA] (or S = [B] + [BH+] ) (39)
In eq. 39, [HA] is a constant (intrinsic solubility), but[A- ] is a variable. It's convenient to restate the equation interms of only constants and with pH as the only variable.Substitution of eqs. 7 (or 8) into 39 produces the desiredequation.
S = [HA] K a / [H+] + [HA] (or S = [B] + [B][H+] / Ka )
= [HA] ( Ka / [H+] + 1 ) (or = [B] { [H+] / Ka + 1 } )
= S0 ( 10 - pKa + pH + 1 ) (or = S0{ 10 + p K a - p H + 1} )(40)
Figure 32a shows a plot of log S versus pH for the weak-acid case (indomethacin, pKa 4.42, log S0 -5.58, log mol/L[pION]) and (Fig. 33a) shows that of a weak base(miconazole, pKa 6.07, log S0 -5.85 [pION]). As is evidentfrom the acid curve, for pH << pKa (i.e., 10 - pKa + pH << 1 ineq. 40), the function reduces to the horizontal line log S =log S0. For pH >> pKa (i.e., 10–pKa + pH >> 1), log S is astraight line as a function of pH, exhibiting a slope of +1.The base shows a slope of -1. The pH at which the slope ishalf-integral equals the pKa. Note the mirror relationshipbetween the curve for an acid (Fig. 32a) and the curve for abase (Fig. 33a).
HO P O
O
OH
NH2
HO
O
Phosphoserine

316 Current Topics in Medicinal Chemistry, 2001, Vol. 1, No. 4 Alex Avdeef
6.1.2 Diprotic Ampholyte, XH2+
In a saturated solution, the three relevant equilibria forthe case of a diprotic ampholyte are eqs. 9 and 10, plus
XH(s) →← XH S0 = [XH] / [XH(s)] = [XH] (41)
Note that [XH(s)] by convention is defined as unity. Forsuch a case, effective solubility is
S = [X–] + [XH] + [XH2+] (42)
In eq. 42, [HX] is a constant (intrinsic solubility), but [X–]and [XH2
+] are variables. As before, the next step involvesconversions of all variables into expressions containing onlyconstants and pH.
S = S0 ( 1 + 10 - pKa2 + pH + 10 + pKa1 - pH ) (43)
Fig. (33). Solubility-pH profile and a log-log speciation plot fora weak base (miconazole, pKa 6.07, log So - 5.85 [pION]).
Fig. (32). Solubility-pH profile and a log-log speciation plot fora weak acid (indomethacin, pKa 4.42, log So -5.58 [pION]).
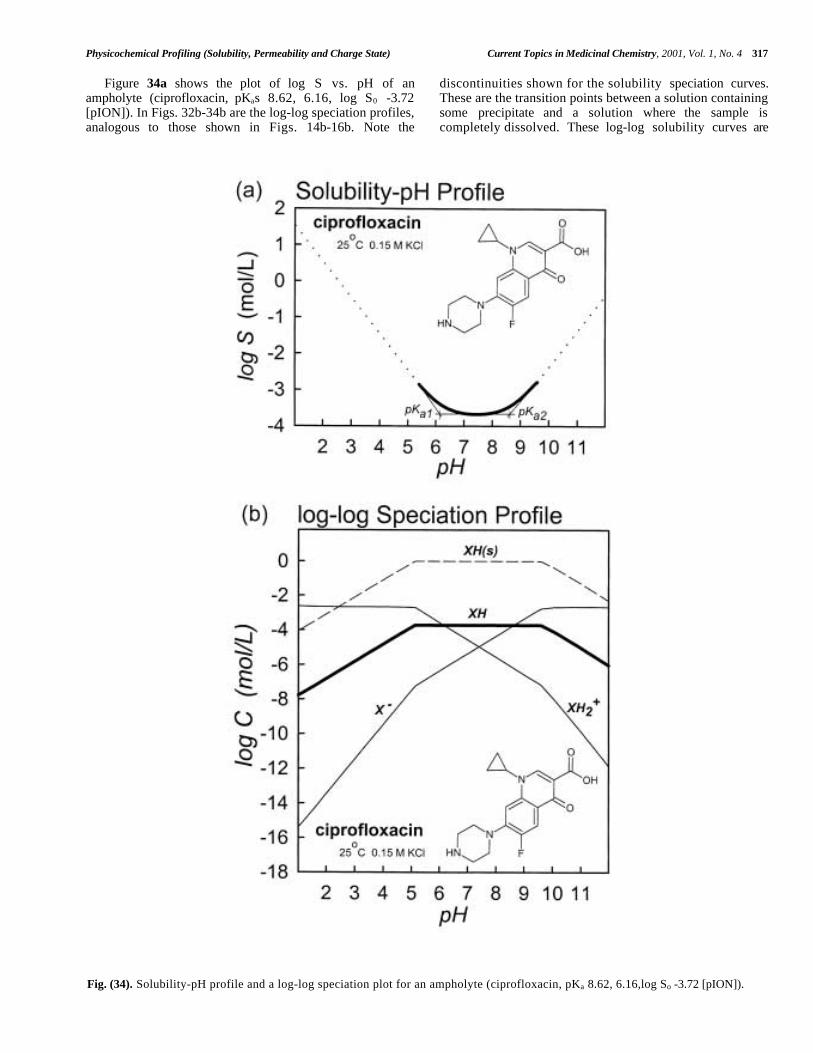
Physicochemical Profiling (Solubility, Permeability and Charge State) Current Topics in Medicinal Chemistry, 2001, Vol. 1, No. 4 317
Figure 34a shows the plot of log S vs. pH of anampholyte (ciprofloxacin, pKas 8.62, 6.16, log S0 -3.72[pION]). In Figs. 32b-34b are the log-log speciation profiles,analogous to those shown in Figs. 14b-16b. Note the
discontinuities shown for the solubility speciation curves.These are the transition points between a solution containingsome precipitate and a solution where the sample iscompletely dissolved. These log-log solubility curves are
Fig. (34). Solubility-pH profile and a log-log speciation plot for an ampholyte (ciprofloxacin, pKa 8.62, 6.16,log So -3.72 [pION]).

318 Current Topics in Medicinal Chemistry, 2001, Vol. 1, No. 4 Alex Avdeef
important components of the absorption model described inSec. 2.1 and illustrated in (Fig. 2).
6.1.3 Gibbs pKa
Although (Figs. 32a-34a) properly convey the shapes ofsolubility-pH curves in saturated solutions of unchargedspecies, the indefinite ascendency (dotted line) in the plotscan be misleading. It is not possible to maintain saturatedsolutions over 10 orders of magnitude in concentration! Atsome point long before the solubilities reach such highvalues, salts will precipitate, limiting further increases.Although precipitation of salts is not covered in detail inthis review, it is nevertheless worthwhile to consider itsformation in this limiting sense. As the pH change raises thesolubility, at some value of pH the solubility product of thesalt will be reached, causing the shape of the solubility-pHcurve to change from that in (Fig. 32a) to that in (Fig. 35),an example of a weak acid exhibiting salt precipitation.
As a new “rule of thumb” [433], in 0.15M NaCl (or KCl)solutions titrated with NaOH (or KOH), acids start toprecipitate as salts above log (S/So) = 4 and bases above log(S/So) = 3. It is exactly analogous to the "diff 3-4" rule; letus call the solubility equivalent the "sdiff 3-4" rule.Consider the case of the monoprotic acid, HA, which formsthe sodium salt (in saline solutions) when the solubilityproduct, Ksp, is exceeded. In additions to eqs. 7 and 37, oneneeds to add the following equation to treat the case.
Na+A-(s) →← Na+ + A- Ksp = [Na+][A-]/[Na+A-(s)] = [Na+][A-].
(44)
Effective solubility is still defined by eq. 39. However,eq. 39 is now solved under three limiting conditions withreference to a special pH value. (a) If the solution pH isbelow the conditions leading to salt formation, thesolubility-pH curve has the shape described by eq. 40 (curvein Fig. 32a). (b) If pH is above the characteristic value wheresalt starts to form (given high enough a sampleconcentration), eq. 39 is solved differently. Under thiscircumstance, [A-] becomes the constant term and [HA]becomes variable.
S = [A–] + [H+][A–] / Ka
= [A–] ( 1 + [H+] / Ka )
= Ksp / [Na+] ( 1 + 10 +pKa - pH )
= Si ( 1 + 10 +pKa - pH ) (45)
where Si refers to the solubility of the conjugate base of theacid, which depends on the value of [Na+] and is hence aconditional constant. Since pH >> pKa and [Na+] may beassumed to be constant, eq. 45 reduces to that of a horizontalline in (Fig. 35) : log S = log Si for pH > 8. (c) If the pH isexactly at the special point marking the onset of saltprecipitation, the equation describing the solubility-pHrelationship may be obtained by recognizing that both termsin eq. 39 become constant, so that
S = So + Si (46)
Consider the case of a very concentrated solution of theacid hypothetically titrated from low pH (below pKa) to thepoint where the solubility product is first reached (high pH).At the start, the saturated solution can only have theuncharged species precipitated. As pH is raised past the pKa,the solubility increases, as more of the free acid ionizes andsome of the solid HA dissolves, as indicated by the solidcurve in (Fig. 32a). When the solubility reaches thesolubility product, at a particular elevated pH, salt starts toprecipitate, but at the same time there may be remaining freeacid precipitate. The simultaneous presence of the solid freeacid and its solid conjugate base invokes the Gibbs’ PhaseRule constraint, forcing the pH and the solubility toconstancy, as long as the two interconverting solids arepresent. In the course of the thought-experiment titration, thealkali titrant is used to convert the remaining free acid solidinto the solid salt of the conjugate base. During this process,pH is absolutely constant (a “perfect” buffer system). Thisspecial pH point has been designated the Gibbs’ pKa, that is,pKa
GIBBS [432,433]. The equilibrium equation associated withthis phenomenon is
HA(s) →← A-(s) + H+ KaGIBBS = [H+][A-(s)] / [HA(s)] = [H+]
(47)
Note that pKaGIBBS is the conceptual equivalent of pKa
OCT
and pKamem (cf. eq. 32). We should not be surprised that this
is a conditional constant, depending on the value of thebackground salt.
At this point we bring in the now familiar tetraddiagram, (Fig. 36), and conclude.Fig. (35). Solubility-pH profile of a weak acid, with salt
precipitation taken into account.
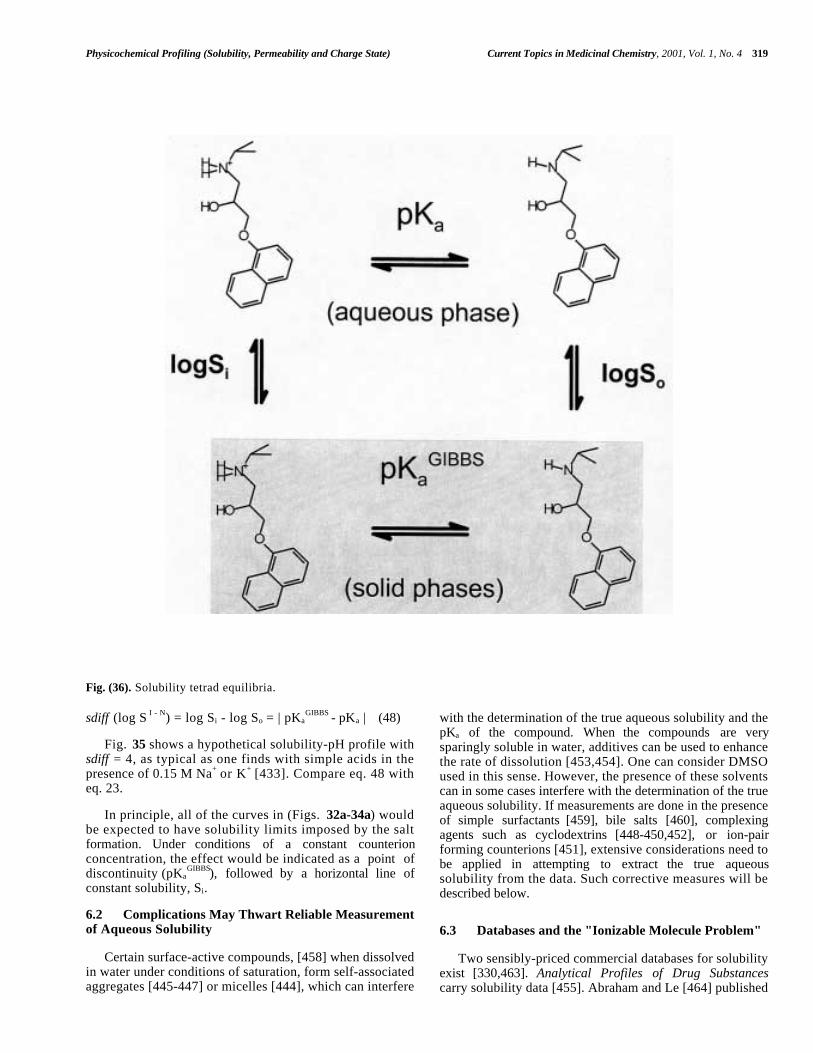
Physicochemical Profiling (Solubility, Permeability and Charge State) Current Topics in Medicinal Chemistry, 2001, Vol. 1, No. 4 319
Fig. (36). Solubility tetrad equilibria.
sdiff (log S I - N) = log Si - log So = | pKaGIBBS - pKa | (48)
Fig. 35 shows a hypothetical solubility-pH profile withsdiff = 4, as typical as one finds with simple acids in thepresence of 0.15 M Na+ or K+ [433]. Compare eq. 48 witheq. 23.
In principle, all of the curves in (Figs. 32a-34a) wouldbe expected to have solubility limits imposed by the saltformation. Under conditions of a constant counterionconcentration, the effect would be indicated as a point ofdiscontinuity (pKa
GIBBS), followed by a horizontal line ofconstant solubility, Si.
6.2 Complications May Thwart Reliable Measurementof Aqueous Solubility
Certain surface-active compounds, [458] when dissolvedin water under conditions of saturation, form self-associatedaggregates [445-447] or micelles [444], which can interfere
with the determination of the true aqueous solubility and thepKa of the compound. When the compounds are verysparingly soluble in water, additives can be used to enhancethe rate of dissolution [453,454]. One can consider DMSOused in this sense. However, the presence of these solventscan in some cases interfere with the determination of the trueaqueous solubility. If measurements are done in the presenceof simple surfactants [459], bile salts [460], complexingagents such as cyclodextrins [448-450,452], or ion-pairforming counterions [451], extensive considerations need tobe applied in attempting to extract the true aqueoussolubility from the data. Such corrective measures will bedescribed below.
6.3 Databases and the "Ionizable Molecule Problem"
Two sensibly-priced commercial databases for solubilityexist [330,463]. Analytical Profiles of Drug Substancescarry solubility data [455]. Abraham and Le [464] published

320 Current Topics in Medicinal Chemistry, 2001, Vol. 1, No. 4 Alex Avdeef
a list of intrinsic aqueous solubilities of 665 compounds,with many ionizable molecules. It is difficult to tell frompublished lists what the quality of the data for ionizablemolecules is. Sometimes, it is not clear what the listednumber stands for. For example, Sw, "water solubility," canmean several different things: either intrinsic value, or valuedetermined at a particular pH (using buffers), or valuemeasured by saturating distilled water with excesscompound. In the most critical applications using ionizablemolecules, it may be necessary to scour the originalpublications in order to be confident of the quality ofreported values.
6.4 Experimental Methods
Lipinski et al [4] and Pan et al [425] compared severalcommonly used methods of solubility measurement in earlydiscovery, where samples are introduced as 10 mM DMSOsolutions. Turbidity-based and UV plate scanner-baseddetections systems were found to be useful. The methodsmost often used in discovery and in preformulation will bebriefly summarized below.
6.4.1 Saturation Shake-Flask Methods
Solubility measurement at a single pH [17,18] underequilibrium conditions is largely a manually intensiveprocedure, requiring long equilibration times (12 hr - 7days). It’s a simple procedure. The drug is added to astandard buffer solution (in a flask) until saturation occurs,indicated by undissolved excess drug. The thermostatedsaturated solution is shaken as equilibration between the twophases establishes. After microfiltration or centrifugation, theconcentration of the substance in the supernatant solution isthen determined using HPLC, usually with UV detection. Ifa solubility-pH profile is required, then the measurementneeds to be performed in parallel in several different pHbuffers.
6.4.2 Turbidimetric Ranking Assays
Turbidity detection-based methods, [4,421-425] popular-ized by Lipinski and others, in part have met some high-throughput needs of drug discovery research. The approach,although not thermodynamically rigorous, is an attempt torank molecules according to expected solubilities. Usually,the measurements are done at one pH. Various implemen-tations of the basic method are practiced at severalpharmaceutical companies, using custom-built equipment.Detection systems based on 96-well microtitre platenephelometers are well established. An automated solubilityanalyzer incorporating such a detector usually requires theuser to develop an appropriate chemistry procedure and tointegrate a robotic fluidic system in a customized way. It isimportant that turbidity methods using an analate additionstrategy be designed to keep the DMSO concentration in thebuffer solution constant in the course of the additions. Theshortcomings of the turbidity methodology are (a) poorreproducibility for very-sparingly water soluble compounds,(b) use of excessive amounts (>1% v/v) of DMSO in theanalate addition step, and (c) lack of standardization ofpractice.
6.4.3 HPLC-Based Assays
In an effort to increase throughput, several pharmaceuticalcompanies have transferred the classical saturation shake-flask method to 96-well plate technology using a roboticliquid dispensing system [425]. Analyses are performed withfast generic gradient reverse-phase HPLC. In somecompanies, the DMSO is eliminated by a freeze-dryingprocedure before aqueous buffers are added. This adds to theassay time and can be problematic with volatile samples(e.g., coumarin). Still, the serial chromatographic detectionsystems are inherently slow. Data handling and reportgeneration are often the rate-limiting steps in the operations.
6.4.4 Potentiometric Methods
Potentiometric methods for solubility measurement havebeen reported in the literature [197,427-433]. A novelapproach, called the dissolution template titration (DTT), hasbeen recently introduced [432,433]. One publication called itthe "gold standard." [197]. The procedure takes as inputparameters the measured (or calculated) pKa and the measured(or calculated) octanol/water partition coefficient, log P. Thelatter parameter is used to estimate the intrinsic solubility,So, using the Hansch-type expression [18], log So = 1.17 -1.38 log P, or an improved version for ionizable moleculesof moderate lipophilicity (Fig. 37),
log So = -2.17 - 0.0082 log P - 0.134 (log P)2 (49)
Using the pKa and the estimated So, the DTT proceduresimulates the entire titration curve before the assay. Thesimulated curve serves as a template for the instrument tocollect individual pH measurements in the course of thetitration. The pH domain containing precipitation is apparentfrom the simulation. Titration of the sample suspension isdone in the direction of dissolution, eventually well past thepoint of complete dissolution. The rate of dissolution of thesolid, described by the classical Noyes-Whitney expression[17], depends on a number of factors, which the instrumenttakes into account. For example, the instrument slows downthe rate of pH data taking as the point of completedissolution approaches, where the time needed to dissolveadditional solid substantially increases. Only after theprecipitate completely dissolves, does the instrument collectthe remainder of the data rapidly. Typically, 3 - 10 hours arerequired for the entire equilibrium solubility data taking. Themore insoluble the compound is anticipated to be (based onthe template) the longer the assay time. An entire solubility-pH profile is deduced from the assay.
A graphical analysis follows, based on Bjerrum plots(cf., Secs. 3.3.1 and 4.14). The presence of precipitate causesthe apparent pKa, pKa
APP, to shift, to higher values for acidsand to lower values for bases, just as with octanol (Sec. 4)and liposomes (Sec. 5). The intrinsic solubility can bededuced by inspection of the curves, applying therelationship [432].
log S0 = log (C/2) - |pKaAPP - pKa | (50)
where C is the sample concentration. (Fig. 38) showscharacteristic Bjerrum plots of an acid (ketoprofen, log S0
-3.33[433]), a base (propranolol, log S0 -3.62[433]), and an

Physicochemical Profiling (Solubility, Permeability and Charge State) Current Topics in Medicinal Chemistry, 2001, Vol. 1, No. 4 321
ampholyte (enalapril maleate, log S0 -1.36 [pION]). In thefigure, all examples are illustrated with C = 2 M, so that thedifference between true pKa and the apparent pKa is directlyread off as the log S0 value.
These graphically deduced constants are subsequentlyrefined by a weighted nonlinear least squares procedure[432]. Although the potentiometric method can be used indiscovery settings to calibrate high-throughput solubilitymethods and computational procedures, it is too slow forHTS applications. It is more at home in a preformulationlab.
6.4.5 Fast UV Plate Spectrophotometer Method
A high-throughput method using a 96-well microtitreplate format and plate UV spectrophotometry was recentlydescribed [24]. Solubilities at a single pH, or at up to 12 pHvalues can be determined, using one of two methods.
6.4.5.1 Aqueous Dilution Method
A known quantity of sample is added to a known volumeof a universal buffer solution of known pH. The amount ofsample must be sufficient to cause precipitation to occur inthe formed saturated solution. After waiting a period of timeto allow the saturated solution to reach a desired steady state,the solution is filtered to remove the solid and obtain a clear
solution, whose spectrum is then taken by the UVspectrophotometer. Mathematical treatment of the spectraldata yields the area-under-the-curve of the filtered samplesolution, AUCS.
A reference solution is prepared by a dilution method. Aknown quantity of sample is dissolved in a known volumeof the system buffer of known pH, the amount of samplebeing X-times less than in the above case in order to avoidprecipitation in the formed solution. The spectrum isimmediately taken by the UV spectrophotometer, to takeadvantage of the possibility that solution may be"supersaturated" (that is, solid should have precipitated, butbecause not enough time was allowed for the solid toprecipitate, the solution was temporarily clear and free ofsolid). Mathematical treatment of the spectral data yields thearea-under-the-curve of the reference sample solution, AUCR.The ratio, R = AUCR / AUCS, is used to automaticallyrecognize the right conditions for solubility determination:the reference has no precipitate, and the sample solution issaturated with precipitate. Under these conditions, solubilityis determined from the expression
S = CR / R (51)
where CR is the calculated concentration of the referencesolution. Some results are presented in (Table 3). The
Fig. (37). Empirical relationship between intrinsic solubility of ionizable molecules and their octanol- water log P [pION].

322 Current Topics in Medicinal Chemistry, 2001, Vol. 1, No. 4 Alex Avdeef
apparent intrinsic solubilities, S0APP, determined in this way
(eq. 51) are listed in column 3, for the compounds used inone study. All the S0
APP values reported in (Table 3) weredetermined in the presence of 0.5% v/v DMSO, except forphenazopyridine, where 0.26% was used.
The results of a pH 4 - 9.5 solubility assay ofchlorpromazine are shown in (Fig. 39).
The horizontal line represents the upper limit ofmeasurable solubility (e.g., 125 µg/mL), which can be setby the instrument according to the requirements of the assay.When the measured concentration reaches the line, thesample is completely dissolved, and solubility cannot bedetermined. This is automatically determined by theinstrument, based on the calculated value of R. Whenmeasured points fall below the line, the concentrationcorresponds to the apparent solubility, S APP.
6.4.5.2 Cosolvent Method
The sample plate is prepared as in the preceding method.But before the spectra are taken, a volume Y of a water-miscible cosolvent is added to a volume Z of samplesolution to produce a new solution, in which the compoundis now diluted by Z/(Y+Z). Suitable cosolvents are oneswith the lowest vapor pressure, the greatest capability indissolving a solute (i.e., highest solubilizing power), and thelowest UV absorption. The spectrum of the solution is thenimmediately taken by the UV spectrophotometer.Mathematical treatment of the spectral data yields the area-under-the-curve of the filtered cosolvent sample solution,AUCS
COS.
The reference plate is prepared differently. A knownquantity of sample is added to a known volume of systemsolution of known pH with the amount of sample beingcomparable to that found in the sample plate, and no effortis made in this step to suppress precipitation in the formedsolution. A volume Y of the cosolvent is then added to avolume Z of reference solution to produce a new solution, inwhich the compound is now diluted by Z/(Y+Z). Thespectrum of the solution is then immediately taken by theUV spectrophotometer. Mathematical treatment of thespectral data yields the area-under-the-curve of the filteredcosolvent reference solution, AUCR
COS. Define RCOS =AUCR
COS/ AUCSCOS.. The solubility of the sample compound
then is
S = ( 1 + Y/Z ) CRCOS / RCOS (52)
where CRCOS is the calculated concentration of the compound
in the reference solution.
Figure 40 shows the measured absorption spectra ofmiconazole (reference and sample). As precipitation takesplace to varying degrees at different pH values, the spectra ofthe sample solutions change in optical densities, accordingto Beer's law. This can be clearly seen in (Fig. 40) for thesample spectra, where the sample spectra have the lowest ODvalues at pH 9.0 and systematically show higher OD valuesas pH is lowered, a pattern consistent with that of an weakbase. The changing OD values indicate that solubilitychanges with pH.
6.5 Correction for the "DMSO" Effect by the " ∆-Shift" Method
6.5.1 DMSO Binding to the Uncharged Form of aCompound
It was found that the log S vs. pH curves were altered inthe presence of as little as 0.5% v/v DMSO, in that the
Fig. (38). Simulated Bjerrum plots of saturated solutions of anacid, a base and an ampholyte. The sample concentration waschosen as 2 M, a special condition where the difference betweenthe true pKa and the apparent pKa is equal to -log So.
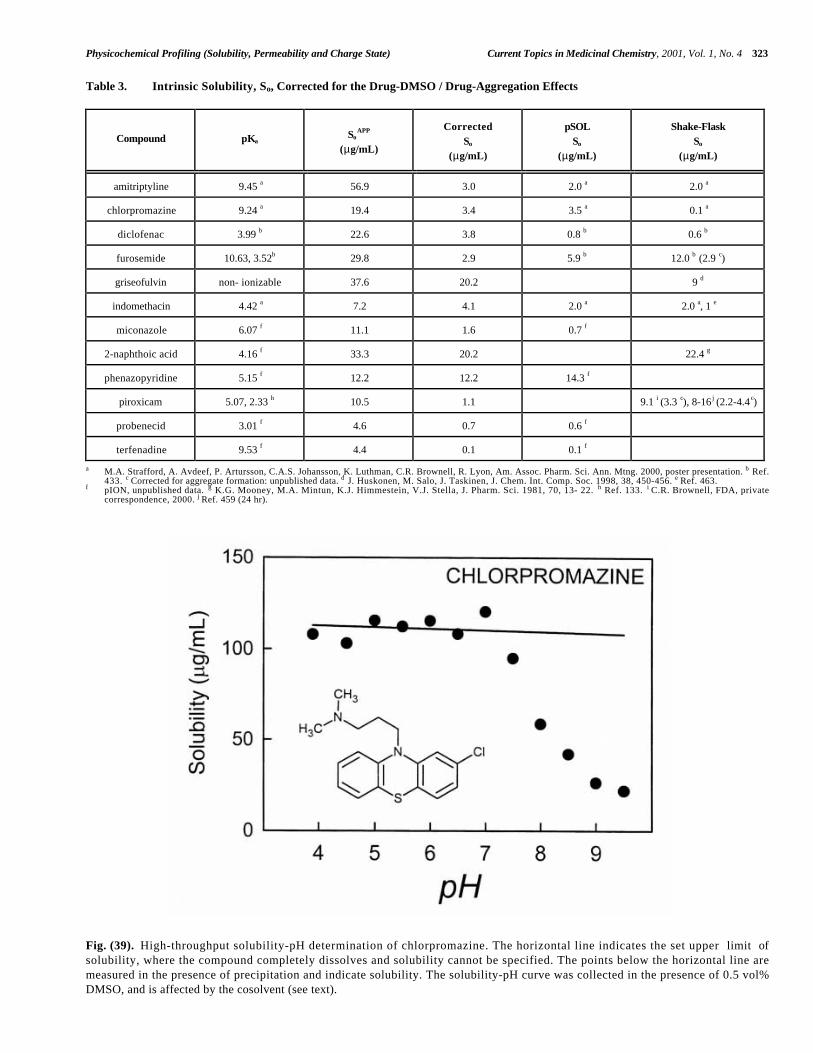
Physicochemical Profiling (Solubility, Permeability and Charge State) Current Topics in Medicinal Chemistry, 2001, Vol. 1, No. 4 323
Table 3. Intrinsic Solubility, So, Corrected for the Drug-DMSO / Drug-Aggregation Effects
Compound pKaSo
APP
(µg/mL)
CorrectedSo
(µg/mL)
pSOLSo
(µg/mL)
Shake-FlaskSo
(µg/mL)
amitriptyline 9.45 a 56.9 3.0 2.0 a 2.0 a
chlorpromazine 9.24 a 19.4 3.4 3.5 a 0.1 a
diclofenac 3.99 b 22.6 3.8 0.8 b 0.6 b
furosemide 10.63, 3.52b 29.8 2.9 5.9 b 12.0 b (2.9 c)
griseofulvin non- ionizable 37.6 20.2 9 d
indomethacin 4.42 a 7.2 4.1 2.0 a 2.0 a, 1 e
miconazole 6.07 f 11.1 1.6 0.7 f
2-naphthoic acid 4.16 f 33.3 20.2 22.4 g
phenazopyridine 5.15 f 12.2 12.2 14.3 f
piroxicam 5.07, 2.33 h 10.5 1.1 9.1 i (3.3 c), 8-16j (2.2-4.4c)
probenecid 3.01 f 4.6 0.7 0.6 f
terfenadine 9.53 f 4.4 0.1 0.1 f
a M.A. Strafford, A. Avdeef, P. Artursson, C.A.S. Johansson, K. Luthman, C.R. Brownell, R. Lyon, Am. Assoc. Pharm. Sci. Ann. Mtng. 2000, poster presentation. b Ref.433. c Corrected for aggregate formation: unpublished data. d J. Huskonen, M. Salo, J. Taskinen, J. Chem. Int. Comp. Soc. 1998, 38, 450-456. e Ref. 463.
f pION, unpublished data. g K.G. Mooney, M.A. Mintun, K.J. Himmestein, V.J. Stella, J. Pharm. Sci. 1981, 70, 13- 22. h Ref. 133. i C.R. Brownell, FDA, privatecorrespondence, 2000. j Ref. 459 (24 hr).
Fig. (39). High-throughput solubility-pH determination of chlorpromazine. The horizontal line indicates the set upper limit ofsolubility, where the compound completely dissolves and solubility cannot be specified. The points below the horizontal line aremeasured in the presence of precipitation and indicate solubility. The solubility-pH curve was collected in the presence of 0.5 vol%DMSO, and is affected by the cosolvent (see text).
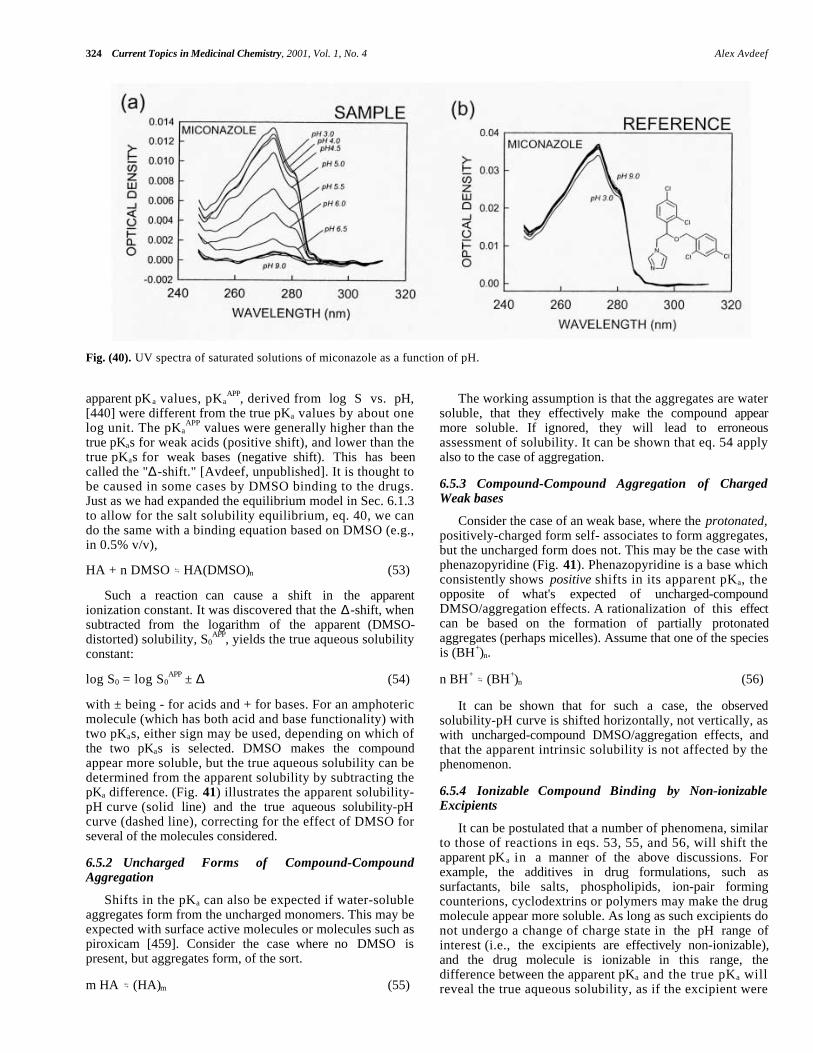
324 Current Topics in Medicinal Chemistry, 2001, Vol. 1, No. 4 Alex Avdeef
Fig. (40). UV spectra of saturated solutions of miconazole as a function of pH.
apparent pKa values, pKaAPP, derived from log S vs. pH,
[440] were different from the true pKa values by about onelog unit. The pKa
APP values were generally higher than thetrue pKas for weak acids (positive shift), and lower than thetrue pKas for weak bases (negative shift). This has beencalled the "∆-shift." [Avdeef, unpublished]. It is thought tobe caused in some cases by DMSO binding to the drugs.Just as we had expanded the equilibrium model in Sec. 6.1.3to allow for the salt solubility equilibrium, eq. 40, we cando the same with a binding equation based on DMSO (e.g.,in 0.5% v/v),
HA + n DMSO →← HA(DMSO)n (53)
Such a reaction can cause a shift in the apparentionization constant. It was discovered that the ∆-shift, whensubtracted from the logarithm of the apparent (DMSO-distorted) solubility, S0
APP, yields the true aqueous solubilityconstant:
log S0 = log S0APP ± ∆ (54)
with ± being - for acids and + for bases. For an amphotericmolecule (which has both acid and base functionality) withtwo pKas, either sign may be used, depending on which ofthe two pKas is selected. DMSO makes the compoundappear more soluble, but the true aqueous solubility can bedetermined from the apparent solubility by subtracting thepKa difference. (Fig. 41) illustrates the apparent solubility-pH curve (solid line) and the true aqueous solubility-pHcurve (dashed line), correcting for the effect of DMSO forseveral of the molecules considered.
6.5.2 Uncharged Forms of Compound-CompoundAggregation
Shifts in the pKa can also be expected if water-solubleaggregates form from the uncharged monomers. This may beexpected with surface active molecules or molecules such aspiroxicam [459]. Consider the case where no DMSO ispresent, but aggregates form, of the sort.
m HA →← (HA)m (55)
The working assumption is that the aggregates are watersoluble, that they effectively make the compound appearmore soluble. If ignored, they will lead to erroneousassessment of solubility. It can be shown that eq. 54 applyalso to the case of aggregation.
6.5.3 Compound-Compound Aggregation of ChargedWeak bases
Consider the case of an weak base, where the protonated,positively-charged form self- associates to form aggregates,but the uncharged form does not. This may be the case withphenazopyridine (Fig. 41). Phenazopyridine is a base whichconsistently shows positive shifts in its apparent pKa, theopposite of what's expected of uncharged-compoundDMSO/aggregation effects. A rationalization of this effectcan be based on the formation of partially protonatedaggregates (perhaps micelles). Assume that one of the speciesis (BH+)n.
n BH+ →← (BH+)n (56)
It can be shown that for such a case, the observedsolubility-pH curve is shifted horizontally, not vertically, aswith uncharged-compound DMSO/aggregation effects, andthat the apparent intrinsic solubility is not affected by thephenomenon.
6.5.4 Ionizable Compound Binding by Non-ionizableExcipients
It can be postulated that a number of phenomena, similarto those of reactions in eqs. 53, 55, and 56, will shift theapparent pKa in a manner of the above discussions. Forexample, the additives in drug formulations, such assurfactants, bile salts, phospholipids, ion-pair formingcounterions, cyclodextrins or polymers may make the drugmolecule appear more soluble. As long as such excipients donot undergo a change of charge state in the pH range ofinterest (i.e., the excipients are effectively non-ionizable),and the drug molecule is ionizable in this range, thedifference between the apparent pKa and the true pKa willreveal the true aqueous solubility, as if the excipient were

Physicochemical Profiling (Solubility, Permeability and Charge State) Current Topics in Medicinal Chemistry, 2001, Vol. 1, No. 4 325
not present. (Table 4) summarizes some of the relationshipsdeveloped between solubility, pKa, and pKa
APP.
6.5.5 Results of Aqueous Solubility DeterminedFrom the ∆-Shifts
Since the pKas of the studied compounds are reliablyknown (Table 3), it was possible to calculate the ∆-shifts(Table 3). These shifts were used to calculate the correctedaqueous intrinsic solubilities, S0, also listed in (Table 3).
6.6 Limits of Detection
The HTS method of Sec. 6.4.5 can go down to 0.1µg/mL. Turbidity-based methods have sensitivities wellabove 1 µg/mL. The pH-metric method can go down to 5ng/mL [Avdeef, unpublished]. Reports of such a low limitof detection can be found in the literature [454].
7 PERMEABILITY
This section will consider the transport of molecules bypassive diffusion through phospholipid bilayers (not justpartitioning into them). The established in vitro assay toassess the permeability coefficients is based on the use ofCaco-2 cultured cell monolayers [28,465-467]. Since this iscovered in another chapter, we will focus in our review onthe rapidly emerging new in vitro technology based on theuse of immobilized artificial membranes, constructed ofphospholipid bilayers supported on filters. Our objective isto complete the coverage of the components of the transportmodel explored in the review, Sec.2, by considering themethod for determining the top curve (horizontal line) in theplots in (Fig. 2) (i.e., intrinsic permeabilities, PO, of drugs).
We will again use the Kp and Kd symbols to represent thepartition coefficient and the apparent partition coefficient,
Fig. (41). Correction of the apparent solubility-pH profile (solid curves) for the effect of DMSO and/or aggregation.

326 Current Topics in Medicinal Chemistry, 2001, Vol. 1, No. 4 Alex Avdeef
respectively. The effective permeability constant will bedenoted Pe and D will refer to the diffusivity of molecules.
7.1 Black Lipid Membranes (BLM)
Mueller et al [468] discovered in 1962 that when a smallquantity of a phospholipid (2% wt/vol alkane solution) wascarefully placed over a small hole (0.5 mm) in a thin sheet ofteflon or polyethylene (10 - 25 µm thick), a thin filmgradually forms at the center of the hole, with excess lipidflowing towards the perimeter (forming a “Plateau-Gibbsborder”). Eventually, the central film turns optically black asa single (5 nm thick) bilayer lipid membrane (BLM) formsover the hole. Suitable lipids for the formation of a BLM aremostly isolated from natural sources, e.g., phospholipidssuch as phosphatidylcholine (PC), phosphatidylethanolamine(PE), phosphatidylserine (PS), and others. Such membraneshave been viewed as useful models of the more complexnatural membranes [468-474].
A serious drawback in using BLMs as a model system isthat they are sluggish, extremely fragile (requiring avibration-damping platform and a Faraday cage), and tediousto make [469-472]. Using such delicate apparatus, Walterand Gutknecht [471] studied the permeation of a series ofsimple carboxylic acids across eggPC/dodecane BLMs.Permeability coefficients were calculated from tracer fluxes.A straight line relationship was observed between log Pe andhexadecane-water log Kp for all but the smallest carboxylicacid (formic): log Pe = 0.90 log Kp + 0.87. Using the sameBLM system, Xiang and Anderson [472] studied the pH-dependent transport of a series of α-methylene-substitutedhomologs of p-toluic acid. They compared the permeabilitiesto partition coefficients determined in octanol-, hexadecane-,hexadecene-, and 1,9-decadiene-water systems. The worstcorrelation was found with octanol. With the hexadecane-water system, log Pe = 0.85 log Kp - 0.64 (r2 0.998), andwith decadiene-water system, log Pe = 0.99 log Kp - 0.17 (r2
0.996). Corrections for the unstirred water layer were key tothese analyses.
7.2 Microfilters as Supports
Efforts to overcome the limitations of the fragile mem-branes (perhaps as delicate as soap bubbles) have evolvedwith the use of membrane supports, e.g., usin g polycar-bonate filters or other more porous microfilters [473,474].
Cools and Janssen [475] studied the effect of backgroundsalt on the permeability of warfarin through octanol-impregnated membranes (Millipore ultrafiltration filters,VSWP, 0.025 µm pores). At a pH where warfarin was in itsionized form, it was found that increasing background saltincreased permeability. This observation was thought tosupport an ion-pair mechanism of transport of charged drugsacross real biological membranes. However, currentunderstanding of the structure of wet octanol (Fig. 7),suggests that this isotropic solvent system may not be asuitable model for passive diffusion of charged drugs acrossphospholipid bilayers.
Camenisch et al [476] measured the pH 7.4permeabilities of a diverse group of drugs across octanol- andisopropylmyristate-impregnated artificial membranes(Millipore GVHP mixed cellulose ester filters, 0.22 µmpores), and compared them to permeabilities of the Caco-2system, and octanol-water apparent partition coefficients, logKd(7.4). It is reasonably clear that the uncharged drug specieswere the passive-diffusion permeants. (When the GVHPmembrane was not impregnated with a lipid, thepermeabilities of all the tested drugs were high and largelyundifferentiated, indicating only the unstirred water layerresistance.) Over the range of lipophilicities, the curverelating log Pe to log Kd(7.4) was seen as sigmoidal in shape,and only linear in the mid range. Between log Kd(7.4) -2 and0, log Pe values correlated with the apparent partitioncoefficients. However, outside that range, there was nocorrelation between permeabilities and the octanol-waterpartition coefficients. At the high end, the permeabilities ofvery lipophilic molecules are limited by the unstirred waterlayer and not the membrane per se. At the other extreme,very hydrophilic molecules were observed to be morepermeant than predicted by octanol, due to an uncertainmechanism.
7.3 PAMPA
Kansy et al [477] roused the pharmaceutical researchcommunity with a compelling study of the permeation ofdrugs across phospholipid-coated filters. Their report couldnot have come at a better time – just when the paradigm wasshifting into screening for biopharmaceutic properties at highspeeds, along side the biological screening (cf., Sec. 1.1).Their PAMPA (parallel artificial membrane permeabilityassay) method has attracted a lot of favorable attention in thepharmaceutical community, and has spurred the development
Table 4. True Aqueous Solubility Determined from pKa Shifts of Monoprotic Compounds
Ionizable CompoundType
∆ = pKaAPP - pKa
true aqueouslog S0
Examples
acid ∆ > 0 log S0APP - ∆ diclofenac, furosemide, indomethacin, probenecid, naphthoic
acid
acid ∆ < 0 log S0APP prostaglandin F2a [444]
base ∆ > 0 log S0APP phenazopyridine
base ∆ < 0 log S0APP + ∆ amitriptyline, chlorpromazine, miconazole, terfenadine
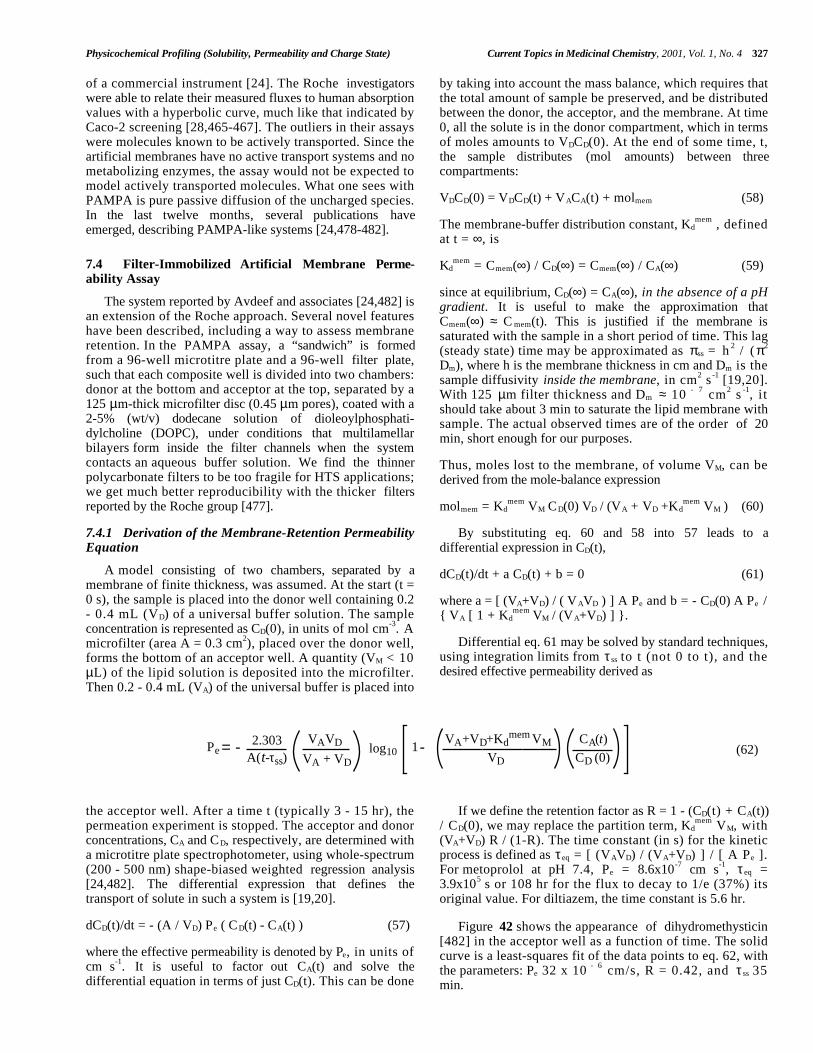
Physicochemical Profiling (Solubility, Permeability and Charge State) Current Topics in Medicinal Chemistry, 2001, Vol. 1, No. 4 327
of a commercial instrument [24]. The Roche investigatorswere able to relate their measured fluxes to human absorptionvalues with a hyperbolic curve, much like that indicated byCaco-2 screening [28,465-467]. The outliers in their assayswere molecules known to be actively transported. Since theartificial membranes have no active transport systems and nometabolizing enzymes, the assay would not be expected tomodel actively transported molecules. What one sees withPAMPA is pure passive diffusion of the uncharged species.In the last twelve months, several publications haveemerged, describing PAMPA-like systems [24,478-482].
7.4 Filter-Immobilized Artificial Membrane Perme-ability Assay
The system reported by Avdeef and associates [24,482] isan extension of the Roche approach. Several novel featureshave been described, including a way to assess membraneretention. In the PAMPA assay, a “sandwich” is formedfrom a 96-well microtitre plate and a 96-well filter plate,such that each composite well is divided into two chambers:donor at the bottom and acceptor at the top, separated by a125 µm-thick microfilter disc (0.45 µm pores), coated with a2-5% (wt/v) dodecane solution of dioleoylphosphati-dylcholine (DOPC), under conditions that multilamellarbilayers form inside the filter channels when the systemcontacts an aqueous buffer solution. We find the thinnerpolycarbonate filters to be too fragile for HTS applications;we get much better reproducibility with the thicker filtersreported by the Roche group [477].
7.4.1 Derivation of the Membrane-Retention PermeabilityEquation
A model consisting of two chambers, separated by amembrane of finite thickness, was assumed. At the start (t =0 s), the sample is placed into the donor well containing 0.2- 0.4 mL (VD) of a universal buffer solution. The sampleconcentration is represented as CD(0), in units of mol cm-3. Amicrofilter (area A = 0.3 cm2), placed over the donor well,forms the bottom of an acceptor well. A quantity (VM < 10µL) of the lipid solution is deposited into the microfilter.Then 0.2 - 0.4 mL (VA) of the universal buffer is placed into
the acceptor well. After a time t (typically 3 - 15 hr), thepermeation experiment is stopped. The acceptor and donorconcentrations, CA and CD, respectively, are determined witha microtitre plate spectrophotometer, using whole-spectrum(200 - 500 nm) shape-biased weighted regression analysis[24,482]. The differential expression that defines thetransport of solute in such a system is [19,20].
dCD(t)/dt = - (A / VD) Pe ( CD(t) - CA(t) ) (57)
where the effective permeability is denoted by Pe, in units ofcm s-1. It is useful to factor out CA(t) and solve thedifferential equation in terms of just CD(t). This can be done
by taking into account the mass balance, which requires thatthe total amount of sample be preserved, and be distributedbetween the donor, the acceptor, and the membrane. At time0, all the solute is in the donor compartment, which in termsof moles amounts to VDCD(0). At the end of some time, t,the sample distributes (mol amounts) between threecompartments:
VDCD(0) = VDCD(t) + VACA(t) + molmem (58)
The membrane-buffer distribution constant, Kdmem , defined
at t = ∞, is
Kdmem = Cmem(∞) / CD(∞) = Cmem(∞) / CA(∞) (59)
since at equilibrium, CD(∞) = CA(∞), in the absence of a pHgradient. It is useful to make the approximation thatCmem(∞) ≈ C mem(t). This is justified if the membrane issaturated with the sample in a short period of time. This lag(steady state) time may be approximated as πss = h 2 / (π2
Dm), where h is the membrane thickness in cm and Dm is thesample diffusivity inside the membrane, in cm2 s -1 [19,20].With 125 µm filter thickness and Dm ≈ 10 - 7 cm2 s -1, i tshould take about 3 min to saturate the lipid membrane withsample. The actual observed times are of the order of 20min, short enough for our purposes.
Thus, moles lost to the membrane, of volume VM, can bederived from the mole-balance expression
molmem = Kdmem VM CD(0) VD / (VA + VD +Kd
mem VM ) (60)
By substituting eq. 60 and 58 into 57 leads to adifferential expression in CD(t),
dCD(t)/dt + a CD(t) + b = 0 (61)
where a = [ (VA+VD) / ( VAVD ) ] A Pe and b = - CD(0) A Pe /{ VA [ 1 + Kd
mem VM / (VA+VD) ] }.
Differential eq. 61 may be solved by standard techniques,using integration limits from τss to t (not 0 to t), and thedesired effective permeability derived as
If we define the retention factor as R = 1 - (CD(t) + CA(t))/ CD(0), we may replace the partition term, Kd
mem VM, with(VA+VD) R / (1-R). The time constant (in s) for the kineticprocess is defined as τeq = [ (VAVD) / (VA+VD) ] / [ A Pe ].For metoprolol at pH 7.4, Pe = 8.6x10⁻⁷ cm s-1, τeq =3.9x10⁵ s or 108 hr for the flux to decay to 1/e (37%) itsoriginal value. For diltiazem, the time constant is 5.6 hr.
Figure 42 shows the appearance of dihydromethysticin[482] in the acceptor well as a function of time. The solidcurve is a least-squares fit of the data points to eq. 62, withthe parameters: Pe 32 x 10 - 6 cm/s, R = 0.42, and τss 35min.
(62)Pe2.303 VAVD log10 1
VA+VD+Kdmem VM CA(t)
A(t-τss) VA + VD VD CD (0)= - -

328 Current Topics in Medicinal Chemistry, 2001, Vol. 1, No. 4 Alex Avdeef
7.4.2 Membrane Retention during Permeation
The membrane retention, R, is often stated as a molarpercentage of the sample. Its value can at times be very high,as high as 90% for chlorpromazine and 70% forphenazopyridine. (Fig. 43) shows a plot of log %R vs. logKd(7.4), the octanol-water apparent partition coefficient. Itappears that retention is due to the lipophilicity ofmolecules. Culture-cell assays also are subject to sampleretention by the monolayer. Wils et al [483] reportedretentions as high as 44%, while Sawada et al [484] citedvalues as high as 89%. It is undoubtedly a commonphenomenon with research compounds, which are often verylipophilic. Yet in most reported assays, the effect is ignored,it appears. It may be a good predictor of the PK volume ofdistribution or of protein binding.
7.4.3 Determination of the Intrinsic Permeabilities ofMolecules
It may be assumed that the total resistance to permeationis the sum of the resistances of the membrane and theunstirred water layers on each side of it. Resistance is theinverse of permeability. So,
1/Pe = 1/Pm + 1/Pu (63)
where Pe refers to the measured effective permeability, Pu
refers to the unstirred water layer permeability, and Pm isthe permeability of the membrane, which would be measured
if the unstirred water layer were made vanishingly thin. Theunstirred water layer permeability is nearly the same fordrugs of comparable size, and is due to the water diffusivity(Dw) of the drug divided by twice the thickness of the layer(hw), Pu = Dw / (2 hw). The unstirred water layer permeabilitycan be determined experimentally in a number of ways [469-472].
The membrane permeabilities, logPm, may be convertedto intrinsic permeabilities, logPO, when the pKa is known.The intrinsic permeability is that which an ionizablemolecule exhibits when it is in its uncharged form and thereis no unstirred water layer resistance. The formulas used forthe conversion depend on whether the drug is an acid, a base,or an ampholyte. These three simplest cases have theequations
PO = Pm ( 1 + 10 -pKa + pH ) (weak acid) (64)
PO = Pm ( 1 + 10 pKa - pH ) (weak base) (65)
PO = Pm ( 1 + 10 pKa1 - pH + 10-pKa2 + pH ) (ampholyte) (66)
In the absence of knowledge of pKas, the intrinsic PO canbe deduced from the pH dependence of Pe measurements ofionizable molecules, as clearly demonstrated by Gutknecht[471]. (Fig. 44) shows the pH-dependence of the effectivepermeability of ketoprofen, a weak acid with pKa 3.98. (Fig.44a) shows that the effective permeability curve has a flatregion for pH < pKa and a region with a slope of -1 for pH >
Fig. (42). Kinetics of transport across a filter-immobilized artificial membrane.
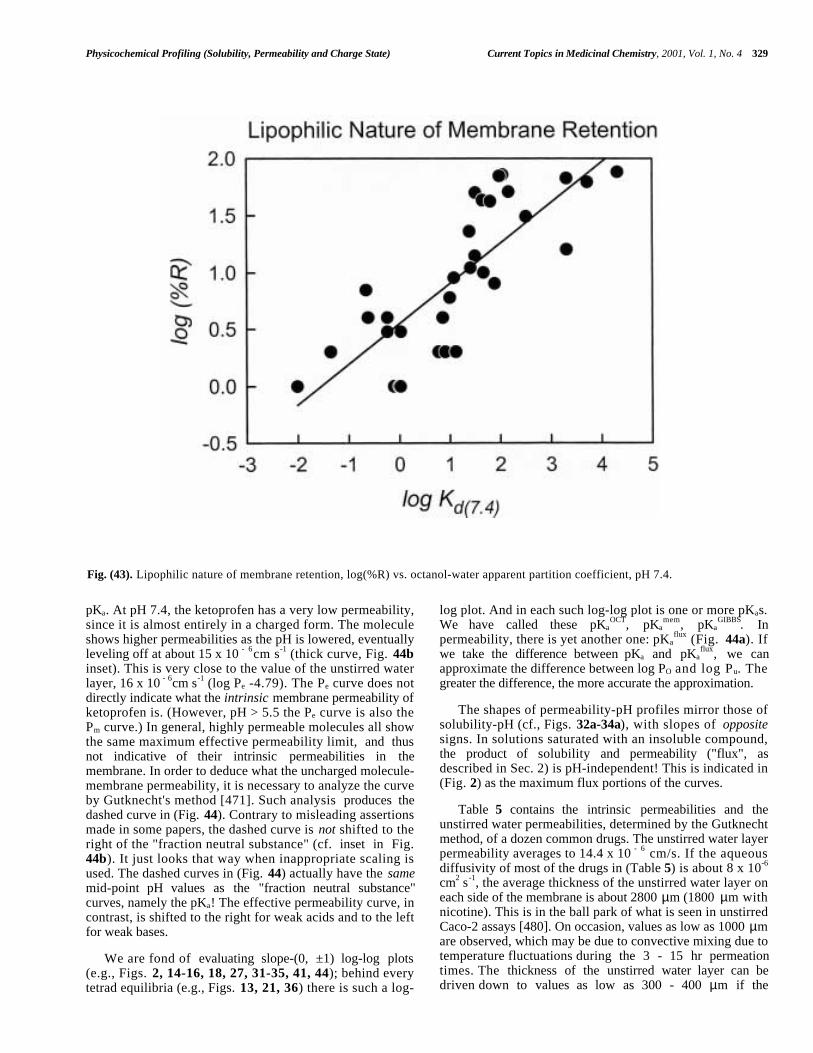
Physicochemical Profiling (Solubility, Permeability and Charge State) Current Topics in Medicinal Chemistry, 2001, Vol. 1, No. 4 329
pKa. At pH 7.4, the ketoprofen has a very low permeability,since it is almost entirely in a charged form. The moleculeshows higher permeabilities as the pH is lowered, eventuallyleveling off at about 15 x 10 - 6cm s-1 (thick curve, Fig. 44binset). This is very close to the value of the unstirred waterlayer, 16 x 10 - 6cm s-1 (log Pe -4.79). The Pe curve does notdirectly indicate what the intrinsic membrane permeability ofketoprofen is. (However, pH > 5.5 the Pe curve is also thePm curve.) In general, highly permeable molecules all showthe same maximum effective permeability limit, and thusnot indicative of their intrinsic permeabilities in themembrane. In order to deduce what the uncharged molecule-membrane permeability, it is necessary to analyze the curveby Gutknecht's method [471]. Such analysis produces thedashed curve in (Fig. 44). Contrary to misleading assertionsmade in some papers, the dashed curve is not shifted to theright of the "fraction neutral substance" (cf. inset in Fig.44b). It just looks that way when inappropriate scaling isused. The dashed curves in (Fig. 44) actually have the samemid-point pH values as the "fraction neutral substance"curves, namely the pKa! The effective permeability curve, incontrast, is shifted to the right for weak acids and to the leftfor weak bases.
We are fond of evaluating slope-(0, ±1) log-log plots(e.g., Figs. 2, 14-16, 18, 27, 31-35, 41, 44); behind everytetrad equilibria (e.g., Figs. 13, 21, 36) there is such a log-
log plot. And in each such log-log plot is one or more pKas.We have called these pKa
OCT, pKamem, pKa
GIBBS. Inpermeability, there is yet another one: pKa
flux (Fig. 44a). Ifwe take the difference between pKa and pKa
flux, we canapproximate the difference between log PO and log Pu. Thegreater the difference, the more accurate the approximation.
The shapes of permeability-pH profiles mirror those ofsolubility-pH (cf., Figs. 32a-34a), with slopes of oppositesigns. In solutions saturated with an insoluble compound,the product of solubility and permeability ("flux", asdescribed in Sec. 2) is pH-independent! This is indicated in(Fig. 2) as the maximum flux portions of the curves.
Table 5 contains the intrinsic permeabilities and theunstirred water permeabilities, determined by the Gutknechtmethod, of a dozen common drugs. The unstirred water layerpermeability averages to 14.4 x 10 - 6 cm/s. If the aqueousdiffusivity of most of the drugs in (Table 5) is about 8 x 10⁻⁶
cm2 s-1, the average thickness of the unstirred water layer oneach side of the membrane is about 2800 µm (1800 µm withnicotine). This is in the ball park of what is seen in unstirredCaco-2 assays [480]. On occasion, values as low as 1000 µmare observed, which may be due to convective mixing due totemperature fluctuations during the 3 - 15 hr permeationtimes. The thickness of the unstirred water layer can bedriven down to values as low as 300 - 400 µm if the
Fig. (43). Lipophilic nature of membrane retention, log(%R) vs. octanol-water apparent partition coefficient, pH 7.4.

330 Current Topics in Medicinal Chemistry, 2001, Vol. 1, No. 4 Alex Avdeef
microtitre plate is vigorously agitated during permeation[480,482].
The true membrane permeabilities in (Table 5) span aboutfive orders of magnitude. Since the in vivo unstirred water
Fig. (44). Permeability-pH profiles of ketoprofen. (a) Log-log plot: solid curve represents effective permeability and the dashed curveis the membrane permeability, calculated by eq. 63. The latter curve levels of at the intrinsic permeability, Po. The effective curvelevels of to approximately the unstirred water layer permeability, Pu. (b) Direct plot. The inset curve for the fraction neutral substancelevels of at 100% (scale not shown).
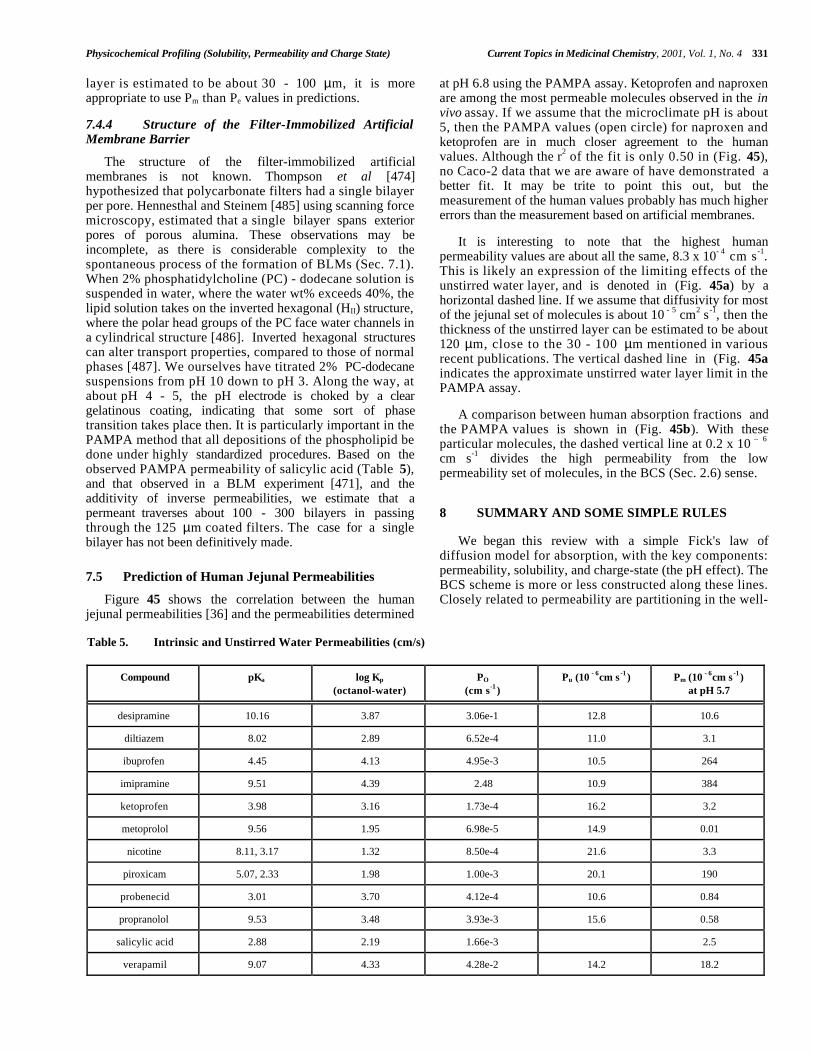
Physicochemical Profiling (Solubility, Permeability and Charge State) Current Topics in Medicinal Chemistry, 2001, Vol. 1, No. 4 331
layer is estimated to be about 30 - 100 µm, it is moreappropriate to use Pm than Pe values in predictions.
7.4.4 Structure of the Filter-Immobilized ArtificialMembrane Barrier
The structure of the filter-immobilized artificialmembranes is not known. Thompson et al [474]hypothesized that polycarbonate filters had a single bilayerper pore. Hennesthal and Steinem [485] using scanning forcemicroscopy, estimated that a single bilayer spans exteriorpores of porous alumina. These observations may beincomplete, as there is considerable complexity to thespontaneous process of the formation of BLMs (Sec. 7.1).When 2% phosphatidylcholine (PC) - dodecane solution issuspended in water, where the water wt% exceeds 40%, thelipid solution takes on the inverted hexagonal (HII) structure,where the polar head groups of the PC face water channels ina cylindrical structure [486]. Inverted hexagonal structurescan alter transport properties, compared to those of normalphases [487]. We ourselves have titrated 2% PC-dodecanesuspensions from pH 10 down to pH 3. Along the way, atabout pH 4 - 5, the pH electrode is choked by a cleargelatinous coating, indicating that some sort of phasetransition takes place then. It is particularly important in thePAMPA method that all depositions of the phospholipid bedone under highly standardized procedures. Based on theobserved PAMPA permeability of salicylic acid (Table 5),and that observed in a BLM experiment [471], and theadditivity of inverse permeabilities, we estimate that apermeant traverses about 100 - 300 bilayers in passingthrough the 125 µm coated filters. The case for a singlebilayer has not been definitively made.
7.5 Prediction of Human Jejunal Permeabilities
Figure 45 shows the correlation between the humanjejunal permeabilities [36] and the permeabilities determined
at pH 6.8 using the PAMPA assay. Ketoprofen and naproxenare among the most permeable molecules observed in the invivo assay. If we assume that the microclimate pH is about5, then the PAMPA values (open circle) for naproxen andketoprofen are in much closer agreement to the humanvalues. Although the r2 of the fit is only 0.50 in (Fig. 45),no Caco-2 data that we are aware of have demonstrated abetter fit. It may be trite to point this out, but themeasurement of the human values probably has much highererrors than the measurement based on artificial membranes.
It is interesting to note that the highest humanpermeability values are about all the same, 8.3 x 10- 4 cm s-1.This is likely an expression of the limiting effects of theunstirred water layer, and is denoted in (Fig. 45a) by ahorizontal dashed line. If we assume that diffusivity for mostof the jejunal set of molecules is about 10 - 5 cm2 s -1, then thethickness of the unstirred layer can be estimated to be about120 µm, close to the 30 - 100 µm mentioned in variousrecent publications. The vertical dashed line in (Fig. 45aindicates the approximate unstirred water layer limit in thePAMPA assay.
A comparison between human absorption fractions andthe PAMPA values is shown in (Fig. 45b). With theseparticular molecules, the dashed vertical line at 0.2 x 10 – 6
cm s-1 divides the high permeability from the lowpermeability set of molecules, in the BCS (Sec. 2.6) sense.
8 SUMMARY AND SOME SIMPLE RULES
We began this review with a simple Fick's law ofdiffusion model for absorption, with the key components:permeability, solubility, and charge-state (the pH effect). TheBCS scheme is more or less constructed along these lines.Closely related to permeability are partitioning in the well-
Table 5. Intrinsic and Unstirred Water Permeabilities (cm/s)
Compound pKa log Kp
(octanol-water)PO
(cm s-1 )Pu (10 - 6cm s -1 ) Pm (10 - 6cm s -1 )
at pH 5.7
desipramine 10.16 3.87 3.06e-1 12.8 10.6
diltiazem 8.02 2.89 6.52e-4 11.0 3.1
ibuprofen 4.45 4.13 4.95e-3 10.5 264
imipramine 9.51 4.39 2.48 10.9 384
ketoprofen 3.98 3.16 1.73e-4 16.2 3.2
metoprolol 9.56 1.95 6.98e-5 14.9 0.01
nicotine 8.11, 3.17 1.32 8.50e-4 21.6 3.3
piroxicam 5.07, 2.33 1.98 1.00e-3 20.1 190
probenecid 3.01 3.70 4.12e-4 10.6 0.84
propranolol 9.53 3.48 3.93e-3 15.6 0.58
salicylic acid 2.88 2.19 1.66e-3 2.5
verapamil 9.07 4.33 4.28e-2 14.2 18.2

332 Current Topics in Medicinal Chemistry, 2001, Vol. 1, No. 4 Alex Avdeef
Fig. (45). Relationship between (a) human jejunal permeability coefficients, (b) human absorption, and the filter-immobilizedartificial membrane permeability coefficients.

Physicochemical Profiling (Solubility, Permeability and Charge State) Current Topics in Medicinal Chemistry, 2001, Vol. 1, No. 4 333
trodden octanol-water and in the lesser-traveled liposome-water systems. We carefully examined the recent literature,with a focus on describing experimental methods which canyield high-quality results, not to the exclusion of fastmethods. Sometimes- forgotten classic works were alsorevisited. The "it is not just a number" idea was drilledthoroughly with the tetrad-equilibria speciation diagrams foroctanol, liposomes, and solubility. The log-log plots having(0,±1) slopes were evoked in many places, to relate the truepKa to the apparent pKa and learn something about the"apparency." Out of these efforts emerged the practicalconcepts underlying pKa
OCT, pKamem, pKa
GIBBS, and pK aflux.
The charge-state section hammered in the value ofBjerrum plots, with applications to a 6- and a 30-pKa
molecule. We used water-miscible cosolvents to identifyacids and bases by the slope in the apparent pKa vs. wt%cosolvent plots. Additionally, extrapolation of the apparentconstants to 100% methanol could indicate the pKa values ofamphiphilic molecules embedded in phospholipid bilayers, away to estimate pKa
mem using the dielectric effect.
Using such dielectric-based predictions, when themethanol-apparent solubility, log SO
∈ vs. wt% methanol is
extrapolated to 0% cosolvent, we estimate the aqueoussolubility, log SO; when log SO
∈ is extrapolated to 100%cosolvent, we estimate the membrane solubility, log SO
mem.The membrane partition coefficient is the estimateddifference between the two solubilities: log Pmem
N = logSO
mem - log SO. We propose to call this the "solubility-partition unification" hypothesis. Very little of this kind ofprediction has been reported.
Ion-pair partitioning in octanol-water was carefullyreviewed. The "parabola vs. step" shape log D plots ofpeptides should no longer be subjects of controversy. But"ion-pairing, fact or fiction?" still needs to be prodded. Thesignificance of the partitioning behavior of quaternaryammonium drugs in octanol-water is still unresolved. Forexample, when we attempt to measure the permeability ofwarfarin across phospholipid-impregnated filters at high pH,we see no evidence of warfarin in the acceptor compartment.Given the modern notion of the structure of octanol andobservations of the sodium-dependence of the permeabilityof warfarin at high pH through octanol-impregnated filterssuggests that such permeability is more a characteristic ofoctanol than "real" biological membranes. A postulate thatorally- administered amphiphilic molecules, even chargedones, can enter the blood stream by going across theepithelial cell barrier "under the skin of the tight junction,"as depicted in scheme 3a –> 3b –> 3c in (Fig. 6) is worthyof exploration [488]. Not enough is really know of hownsuch molecules can cross the tight junction.
The study of octanol-water ion-pair partitioning hastaught us the "diff 3-4" rule. With it we can predict ion-pairpartition coefficients from knowledge of just the neutral-species log P . With liposome-water systems and theirelectrostatic forces, the rule slips to "diffmem 1-2." Knowingthese rules will prevent ill-guided use of equations to convertsingle-point log D values to log P values. We proposed ananalogous "sdiff 3-4" rule for solubility. This may help to
predict effects of salts in the background of a physiologicalconcentration of NaCl or KCl. The study of drugpartitioning into liposomes has revealed some puzzlingobservations, in terms of the "δ" parameter. Why doesacyclovir have such a high membrane log P and such a lowoctanol-water log P? Are such anomalies observed in IAMchromatography? The review of the literature hints that thehigh membrane log P values indicate a surface phenomenon(H-bonding, enthalpy-driven) that goes against effectivepermeability. Sometimes, high membrane log P or longretention times in IAM chromatography just mean that themolecule is stuck on the membrane, and does not permeate.This idea needs to be further explored.
The concept of the "∆-shift" in HTS solubilitymeasurements is quite exciting. It means that we can useDMSO in solubility measurements and not be concernedwith its effect on solubility, since there is now a way tocorrect for it. So we can have speed and quality at the sametime! This brings us back to quality and speed. Thepharmaceutical industry needs it now, and will need it morein the future. In silico methods are no better than the dataused to train them.
Based on the review of the physiology of the GI tract, wepostulate that the following in vitro model is a justifiedextension to the BCS. (1) The solubility (and dissolution)are processes which take place in the gastric and the luminalfluids, not on the surface of epithelial cells. Measurement ofsolubility ideally needs to take place at pH 1.7 (stomach)and pH 5 - 8 (small intestinal tract). Ideally, the screenmedia should have bile acid-lecithin mixed micelles. Fastand reliable techniques for assessing solubility are available.(2) However, permeability is a phenomenon of the epithelialsurface. There is little point in measuring permeability at pH1.7, if the microclimate barrier has pH no lower than 5.2 andno higher than 8.0, averaging about 5.7. An in vitropermeability screen based on donor pH 5.7 and acceptor pH7.4 seems about right. Just a single permeability assessmentper molecule will do. It will be useful to correct the data forthe unstirred water layer effect, using computationalmethods. (3) Acids and bases can be better assessed if theshapes of the flux-pH profiles were considered, as far aspredicting the outcome of a particular choice of assay pH. AsTaylor suggested in the opening paragraph, "There are greatadvances and great opportunities in all this, ..."
ACKNOWLEDGMENTS
Special thanks go to Per Nielsen and Cynthia Berger(pION) for critically reading and commenting on themanuscript. The helpful discussion with many colleagues,particularly Manfred Kansy at Roche, and those at pION andSirius Analytical Instruments are gratefully acknowledged. Iam in debt to Prof. Anatoli A. Belyustin (St. PetersburgUniversity) for pointing out some very relevant Russianliterature. Lasting thanks go to Prof. David Dyrssen and thelate Jannik Bjerrum for planting the seeds of mostinteresting and resilient pH-metric methodologies, and toProf. Bernard Testa for tirelessly fostering the white light ofphysicoche-mical profiling.
334 Current Topics in Medicinal Chemistry, 2001, Vol. 1, No. 4 Alex Avdeef
LIST OF ABBREVIATIONS
ADME = Absorption, distribution, metabolism,excretion
CE = Capillary electrophoresis
CA, CD = Aqueous solute concentration on the acceptorand donor sides of a membrane, respectively(mol cm-3)
CO = Aqueous concentration of the unchargedspecies (mol cm-3)
Cmx = Solute concentration inside a membrane, at
position x (mol cm-3)
δ = Difference between the liposome-water andoctanol-water log P for the uncharged species
diff = Difference between the log partition coefficientof the uncharged and the charged species (cfeq. 23)
∆-shift = The difference between the true pKa and theapparent pKa observed in a solubility-pHprofile, due to DMSO-drug binding, or drug-drug aggregation binding
Dm = Diffusivity of a solute inside a membrane (cm2
s-1)
DOPC = Dioleylphosphatidylcholine
eggPC = Egg phosphatidylcholine
ET = Extrusion technique for making LUV
FAT = Freeze-and-thaw step in the making of LUV
h = Membrane thickness (cm)
hit = A molecule with confirmed activity from aprimary assay, a good profile in secondaryassays, and with a confirmed structure
J = Flux across a membrane (mol cm-2 s -1)
Ksp = Solubility product, e.g., [Na+][A-], [BH+][Cl-].
lead = A hit series for which the structure-activityrelationship is shown and activitydemonstrated in vivo
Kd or D = Lipid-water distribution pH-dependentfunction (also called the apparent partitioncoefficient)
Kp or P = Lipid-water pH-independent partitioncoefficient (also called P)
Ke = Extraction constant
LUV = Large unilamellar vesicle
MLV = Multilamellar vesicle
nH = Bjerrum function: average number of boundprotons on a molecule at a particular pH
NCE = New chemical entity
PAMPA = Parallel artificial membrane permeability assay
Pe = Effective artificial-membrane permeability(cm s-1)
PO = Intrinsic artificial membrane permeability(cm s-1)
pH = Operational pH scale
pcH = pH scale based on hydrogen ion concentration
pKa = Ionization constant (negative log form)
poKa = Apparent ionization constant in an octanol-water titration
pKaOCT = Octanol pKa (the limiting poKa in titrations
with very high octanol-water volume ratios)
pKamem = Membrane pKa
pKaGIBBS = Ionization constant corresponding to the pH at
which both the uncharged and the salt form ofa substance co-precipitate
SUV = Small unilamellar vesicle
S = Solubility in molar, µg/mL, or mg/mL units
Si = Solubility of the ionized species (salt), aconditional constant, depending on theconcentration of the counterion in solution
So = Intrinsic solubility, that is, the solubility ofthe uncharged species
REFERENCES
[1] Taylor, P.J. Hydrophobic properties of drugs. In: Hansch,C.; Sammes, P.G.; Taylor, J.B. (Eds.) ComprehensiveMedicinal Chemistry, Vol. 4, Pergamon: Oxford, 1990, p.241-294.
[2] Halliday, R.G.; Drasco, A.L.; Lumley, C.E.; Walker, S.R.The Allocation of Resources for R&D in the World'sLeading Pharmaceutical Companies. Res. Develop.Management, 1997, 27 , 63-77.
[3] Gaviraghi, G.; Barnaby, R.J.; Pellegatti, M.Pharmacokinetic challenges in lead optimization. In:Testa, B., van de Waterbeemd, H., Folkers, G., Guy, R.(Eds.). Pharmacokinetic Optimization in Drug Research,Verlag Helvetica Chimica Acta: Zürich and Wiley - VCH:Weinheim, 2001, pp. 3-14.
[4] Lipinski, C.A.; Lombardo, F.; Dominy, B.W.; Feeney, P.J..Experimental and computational approaches to estimatesolubility and permeability in drug discovery anddevelopment settings. Adv. Drug Delivery Rev., 1997, 23 ,3-25.
Physicochemical Profiling (Solubility, Permeability and Charge State) Current Topics in Medicinal Chemistry, 2001, Vol. 1, No. 4 335
[5] Baum, R.M. Combinatorial approaches provide freshleads for medicinal chemistry. Chem. Eng. News, 1994, 7Feb., 20-26.
[6] Pickering, L. Developing drugs to counter disease. DrugDiscov. Dev., 2001, Feb., 44-47.
[7] Pickering, L. ADME/Tox models can speed development.Drug Discov. Dev., 2001, Jan., 34-36.
[8] Artursson, P. Application of Physicochemical Propertiesof Molecules to Predict Intestinal Permeability. AAPSWorkshop on Permeability Definitions and RegulatoryStandards, Arlington, VA, 17-19 Aug. 1998.
[9] van de Waterbeemd, H. Intestinal Permeability:Prediction from Theory. In: Dressman, J.B.; Lennernäs, H.(Eds.), Oral Drug Absorption – Prediction andAssessment. Marcel Dekker: New York, 2000, pp. 31-49.
[10] McFarland, J.W. On the parabolic relationship betweendrug potency and hydrophobicity. J. Med. Chem., 1970,13 , 1192-1196.
[11] Dearden, J.C.; Townsend, M.S. Digital computersimulation of the drug transport process. In:Proceedings of the Second Symposium on ChemicalStructure-Biological Activity Relationships:Quantitative Approaches, Suhl. Akademie-Verlag:Berlin, 1978, pp. 387-393.
[12] Kubinyi, H. Lipophilicity and biological activity.Arzneim.-Forsch./Drug Res., 1979, 29 , 1067-1080.
[13] Kubinyi, H. Strategies and recent technologies in drugdiscovery. Pharmazie, 1995, 50 , 647-662.
[14] Perrin, D.D.; Dempsey, B.; Serjeant, E.P. pKa Predictionfor Organic Acids and Bases. Chapman and Hall:London, 1981.
[15] Albert, A.; Serjeant, E.P. The Determination of IonizationConstants, 3rd ed., Chapman and Hall, London, 1984.
[16] Sangster, J. Octanol-Water Partition Coefficients:Fundamentals and Physical Chemistry. Wiley Series inSolution Chemistry, Volume 2; John Wiley & Sons:Chichester, 1997.
[17] D.J.W. Grant; T. Higuchi. Solutility Behavior of OrganicCompounds. John Wiley & Sons: New York, 1990.
[18] Yalkowsky, S.H.; Banerjee, S. Aqueous Solubility:Methods of Estimation for Organic Compounds. MarcelDekker: New York, 1992.
[19] Flynn, G.L.; Yalkowsky, S.H.; Roseman, T.J. MassTransport Phenomena and Models: TheoreticalConcepts. J. Pharm. Sci., 1974, 63 , 479-510.
[20] Weiss, T.F. Cellular Biophysics. Volume I: Transport.The MIT Press: Cambridge, MA, 1996.
[21] Dawson, D.C. Principles of membrane transport. In:Field, M.; Frizzell, R.A. (Eds.), Handbook of Physiology,Sect. 6: The Gastrointestinal System, Vol. IV, IntestinalAbsorption and Secretion, Amer. Physiol. Soc., Bethesda,MD, 1991, pp. 1-44.
[22] Wells, J.I. Pharmaceutical Preformulation: ThePhysicochemical Properties of Drug Substances. EllisHorwood Ltd.: Chichester, 1988.
[23] Schanker, L.S.; Tocco, D.J.; Brodie, B.B.; Hogben, C.A.M.Absorption of drugs from the rat small intestine. J. Amer.Chem. Soc., 1958, 123, 81-88.
[24] Avdeef, A. High-throughput measurements of solubilityprofiles. In: Testa, B., van de Waterbeemd, H., Folkers, G.,Guy, R. (Eds.), Pharmacokinetic Optimization in DrugResearch, Verlag Helvetica Chimica Acta: Zürich andWiley - VCH: Weinheim, 2001, pp. 305-326.
[25] Dressman, J.B.; Amidon, G.L.; Fleisher, D. Absorptionpotential: estimating the fraction absorbed for orallyadministered compounds. J. Pharm. Sci., 1985, 74 , 588-589.
[26] Seydel, J.K.; Coats, E.A.; Cordes, H.P.; Weise, M. Drugmembrane interactions and the importance for drugtransport, distribution, accumulation, efficacy andresistance. Arch. Pharm. (Weinheim), 1994, 327, 601-610.
[27] Chan, O.H.; Stewart, B.H. Physicochemical and drug-delivery considerations for oral drug bioavailability.Drug Discov. Today, 1996, 1, 461-465.
[28] Borchardt, R.T.; Smith, P.L.; Wilson, G. Models forAssessing Drug Absorption and Metabolism. PlenumPress: New York, 1996.
[29] Camenisch, G.; Folkers, G.; van de Waterbeemd, H.Review of theoretical passive drug absorption models:historical background, recent developments andlimitations. Pharm. Acta Helv., 1996, 71 , 309- 327.
[30] Grass, G.M. Simulation models to predict oral drugabsorption from in vitro data. Adv. Drug. Del. Rev., 1997,23 , 199-219.
[31] Stewart, B.H.; Chan, O.H.; Jezyk, N.; Fleisher, D.Discrimination between drug candidates using modelsfrom evaluation of intestinal absorption. Adv. Drug Del.Rev., 1997, 23 , 27-45.
[32] Dowty, M.E.; Dietsch, C.R. Improved Prediction of InVivo Peroral Absorption from In Vitro IntestinalPermeability Using an Internal Standard to Control forIntra- & Inter-Rat Variability. Pharm. Res., 1997, 14 ,1792-1797.
[33] Curatolo, W. Physical chemical properties of oral drugcandidates in the discovery and exploratory settings.Pharm. Sci. Tech. Today, 1998, 1, 387-393.
[34] Camenisch, G.; Folkers, G.; van de Waterbeemd, H.Shapes of membrane permeability-lipophilicity curves:Extension of theoretical models with an aqueous porepathway. Eur. J. Pharm. Sci., 1998, 6, 321-329.
[35] Ungell, A.-L.; Nylander, S.; Bergstrand, S.; Sjöberg, Å.;Lennernäs, H. Membrane transport of drugs in differentregions of the intestinal tract of the rat. J. Pharm. Sci.,1998, 87 , 360-366.
[36] Winiwarter, S.; Bonham, N.M.; Ax, F.; Hallberg, A.;Lennernas, H.; Karlen, A. Correlation of Human JejunalPermeability (in Vivo) of Drugs with Experimentally andTheoretically Derived Parameters. A Multivariate DataAnalysis Approach. J. Med. Chem., 1998, 41 , 4939-4949.
[37] Kristl, A.; Tukker, J.J. Negative Correlation of n-octanol/water partition coefficient and transport of some
336 Current Topics in Medicinal Chemistry, 2001, Vol. 1, No. 4 Alex Avdeef
guanine derivatives through rat jejunum in vitro. Pharm.Res., 1998, 15 , 499-501.
[38] Krämer, S.D. Absorption prediction from physico-chemical parameters. Pharm. Sci. Tech. Today, 1999, 2,373-380.
[39] Barthe, L.; Woodley, J.; Houin, G. Gastrointestinalabsorption of drugs: methods and studies. Fundam.Clin. Pharmacol., 1999, 13 , 154-168.
[40] Raevsky, O.A., Fetisov, V.I., Trepalina, E.P., McFarland,J.W., Schaper, K.-J. Quantitative estimation of drugabsorption in humans for passively transportedcompounds on the basis of their physico-chemicalparameters. Quant. Struct.-Act. Relat., 2000, 19 , 366-374.
[41] Dressman, J.B.; Lennernäs, H. (Eds.), Oral DrugAbsorption – Prediction and Assessment, MarcelDekker: New York, 2000.
[42] Wilson, J.P. Surface area of the small intestine in man.Gut, 1967, 8, 618-621.
[43] Madara, J.L. Functional morphology of epithelium of thesmall intestine. In: Field, M.; Frizzell, R.A. (Eds.),Handbook of Physiology, Sect. 6: The GastrointestinalSystem, Vol. IV, Intestinal Absorption and Secretion,Amer. Physiol. Soc., Bethesda, MD, 1991, pp. 83-120.
[44] Dressman, J.B.; Bass, P.; Ritschel, W.A.; Friend, D.R.;Rubinstein, A.; Ziv, E. Gastrointestinal parameters thatinfluence oral medications. J. Pharm. Sci., 1993, 82 , 857-872.
[45] Gray, V.A.; Dressman, J.B.; Pharm. Forum, 1996, 22 ,1943-1945.
[46] Kararli, T.T. Comparative Models for StudyingAbsorption. AAPS Workshop on PermeabilityDefinitions and Regulatory Standards for Bio-equivalence. Arlington, 17-19 Aug. 1998.
[47] Charman, W.N.; Porter, C.J.; Mithani, S.D.; Dressman, J.B.The effect of food on drug absorption – a physico-chemical and predictive rationale for the role of lipidsand pH. J. Pharm. Sci., 1997, 86 , 269- 282.
[48] Dressman, J.B.; Amidon, G.L.; Reppas, C.; Shah, V.Dissolution Testing as a Prognostic Tool for Oral DrugAbsorption: Immediate Release Dosage Forms. Pharm.Res., 1998, 15 , 11-22.
[49] Berne, R.M.; Levy, M.N. Physiology, 4th Ed. MosbyYearbook: St. Louis, 1998, pp. 654-661.
[50] Dressman, J.B.; Reppas, C. In vitro - in vivo correlationsfor lipophilic, poorly water-soluble drugs. Eur. J. Pharm.Sci., 2000, 11, Suppl 2, S73-S80.
[51] Larhed, A.W.; Artursson, P.; Grasjo, J.; Bjork, E.Diffusion of Drugs in Native and PurifiedGastrointestinal Mucus. J. Pharm. Sci., 1997, 86 , 660-665.
[52] Shiau, Y.-F.; Fernandez, P.; Jackson, M.J.; McMonagle, S.Mechanisms maintaining a low-pH microclimate in theintestine. Am. J. Physiol., 1985, 248, G608-G617.
[53] Lennernäs, H. Human Intestinal Permeability. J. Pharm.Sci., 1998, 87 , 403-410.
[54] Lutz, K.L.; Siahaan, T.J. Molecular structure of the apicaljunction complex and its contributions to theparacellular barrier. J. Pharm. Sci., 1997, 86 , 977-984.
[55] Jackson, M.J.; Tai, C.-Y. Morphological correlates ofweak electrolyte transport in the small intestine. In:Dinno, M.A. (Ed.), Structure and Function in Epitheliaand Membrane Biophysics; Alan R. Liss: New York,1981, pp 83-96.
[56] Winne, D. Shift of pH-absorption curves. J.Pharmacokinet. Biopharm., 1977, 5, 53-94.
[57] Said, H.M.; Blair, J.A.; Lucas, M.L.; Hilburn, M.E.Intestinal surface acid microclimate in vitro and in vivoin the rat. J. Lab Clin. Med., 1986, 107, 420-424.
[58] Jackson. M.J. Drug transport across gastrointestinalepithelia. In: Johnson, L.R. (Ed.) Physiology of theGastrointestinal Tract, 2nd ed., Raven Press: New York,1987, pp. 1597-1621.
[59] Rechkemmer, G. Transport of weak electrolytes. In: Field,M.; Frizzell, R.A. (Eds.), Handbook of Physiology, Sect.6: The Gastrointestinal System, Vol. IV, IntestinalAbsorption and Secretion, Amer. Physiol. Soc., Bethesda,MD, 1991, pp. 371-388.
[60] Takagi,M.; Taki,Y.; Sakane, T.; Nadai, T.; Sezaki, H.;Oku,N.; Yamashita,S. A New Interpretation of SalicylicAcid Transport across the Lipid Bilayer: Implication ofpH-Dependence but not Carrier-Mediated Absorptionfrom the GI Tract. J. Pharmacol. Exp. Therapeut., 1998,285, 1175-1180.
[61] Kimura, Y.; Hosoda, Y.; Shima, M.; Adachi, S.; Matsuno,R. Physicochemical properties of fatty acids forassessing the threshold concentration to enhance theabsorption of a hydrophilic substance. Biosci.Biotechnol. Biochem., 1998, 62 , 443-447.
[62] Yamashita, S.; Furubayashi, T.; Kataoka, M.; Sakane, T.;Sezaki, H.; Tokuda, H. Optimized Conditions forPrediction of Intestinal Drug Permeability using Caco-2Cells. Eur. J. Pharm. Sci., 2000, 10 , 109-204.
[63] Rojanasakul, Y.; Robinson, J.R. The cytoskeleton of thecornea and its role in tight junction permeability. Int. J.Pharm., 1991, 68 , 135-149.
[64] Schneeberger, E.E.; Lynch, R.D. Structure, function, andregulation of cellular tight junctions. Am. J. Physiol.,1992, 262, L647-L661.
[65] Anderberg, E.K.; Lindmark, T.; Artursson, P. Sodiumcaprate elicits dilations in human intestinal tightjunctions and enhances drug absorption by theparacellular route. Pharm. Res., 1993, 10 , 857-864.
[66] Bhat, M.; Toledo-Velasquez, D.; Wang, L. Y.; Malanga,C.J.; Ma, J.K.H.; Rojanasakul, Y. Regulation of tightjunction permeability by calcium mediators and cellcytoskeleton in rabbit tracheal epithelium. Pharm. Res.,1993, 10 , 991-997.
[67] Noach, A.B.J. Enhancement of paracellular drug transportacross epithelia – in vitro and in vivo studies. Pharm.World Sci., 1995, 17 , 58-60.
[68] Lutz, K.L.; Jois, S.D.S.; Siahaan, T.J. Secondary structureof the HAV peptide which regulates cadherin-cadherin

Physicochemical Profiling (Solubility, Permeability and Charge State) Current Topics in Medicinal Chemistry, 2001, Vol. 1, No. 4 337
interaction. J. Biomolec. Struct. Dynam., 1995, 13 , 447-455.
[69] Tanaka, Y.; Taki, Y.; Sakane, T.; Nadai, T.; Sezaki, H.;Yamashita, S. Characterization of drug transport throughtight-junctional pathway in Caco-2 monolayer:comparison with isolated rat jejunum and colon. Pharm.Res., 1995, 12 , 523-528.
[70] Brayden, D.J.; Creed, E.; Meehan, E.; O'Malley, K.E.Passive transepithelial diltiazem absorption acrossintestinal tissue leading to tight junction openings. J.Control. Rel., 1996, 38 , 193-203.
[71] Lutz, K.L.; Szabo, L.A.; Thompson, D.L.; Siahaan, T.J.Antibody recognition of peptide sequence from the cell-cell adhesion proteins: N- and E-cadherins. Peptide Res.,1996, 9, 233-239.
[72] Borchard, G.; Lueßen, H.L.; de Boer, A.G.; Verhoef, J.C.;Lehr, C.-M.; Junginger, H.E. The potential ofmucoadhesive polymers in enhancing intestinal peptidedrug absorption. III: effects of chitosan- glutamate andcarbomer on epithelial tight junctions in vitro. J.Control. Rel., 1996, 39 , 131-138.
[73] Lutz, K.L.; Siahaan, T.J. Molecular structure of the apicaljunction complex and its contributions to theparacellular barrier. J. Pharm. Sci., 1997, 86 , 977-984.(review, 127 refs.).
[74] Pal, D.; Audus, K.L.; Siahaan, T.J. Modulation of cellularadhesion in bovine brain microvessel endothelial cellsby a decapeptide. Brain Res., 1997, 747, 103-113.
[75] Gan, L.-S.L.; Yanni, S.; Thakker, D.R. Modulation of theTight Junctions of the Caco-2 Cell Monolayers by H2-antagonists. Pharm. Res., 1998, 15 , 53-57.
[76] Hansch, C., Leo, A. Substituent Constants for CorrelationAnalysis in Chemistry and Biology, Wiley-Interscience,New York, N.Y., 1979.
[77] Iwahashi, M.; Hayashi, Y.; Hachiya, N.; Matsuzawa, H.;Kobayashi, H. Self-association of octan-1- ol in the pureliquid state and in decane solutions as observed byviscosity, self-diffusion, nuclear magnetic resonanceand near-infrared spectroscopy measurements. J. Chem.Soc. Faraday Trans., 1993, 89 , 707-712.
[78] Franks, N.P.; Abraham, M.H.; Lieb, W.R. Molecularorganization of liquid n-octanol: an X-ray diffractionanalysis. J. Pharm. Sci., 1993, 82 , 466-470.
[79] Amidon, G.L.; Lennernäs, H.; Shah, V.P.; Crison, J.R., ATheoretical Basis for a Biopharmaceutic DrugClassification: The Correlation of in Vitro Drug ProductDissolution and in Vivo Bioavailability. Pharm. Res.,1995, 12 , 413-420.
[80] Amidon, G.L. The rationale for a biopharmaceutics drugclassification. In: Biopharmaceutics Drug Classificationand International Drug Regulation, Capsugel Library,1995, pp.179-194.
[81] Amidon, G.L.; Walgreen, C.R. Rationale andImplementation of a Biopharmaceutics ClassificationSystem (BCS) for New Drug Regulation. In:Biopharmaceutics Drug Classification and InternationalDrug Regulation, Capsugel Library, 1998, pp.13-27.
[82] Hussain, A.S. Methods for permeability determination: aregulatory perspective. AAPS Workshop on PermeabilityDefinitions and Regulatory Standards for Bio-equivalence. Arlington, 17-19 Aug. 1998.
[83] CPMP Note for Guidance on the Investigation ofBioavailability and Bioequivalence. (CPMP/EWP/QWP/1401/98 Draft), Dec. 1998.
[84] FDA Guidance for Industry Waiver of In VivoBioavailability and Bioequivalence Studies forImmediate Release Solid Oral Dosage Forms ContainingCertain Active Moieties/Active Ingredients Based on aBiopharmaceutics Classification System. CDERGUID\2062dft.wpd Draft, Jan. 1999.
[85] Blume, H.H.; Schug, B.S. The biopharmaceiticsclassification system (BCS): Class III drugs - bettercandidates for BA/BE waiver? Eur. J. Pharm. Sci., 1999,9, 117-121.
[86] Lentz, K.A.; Hayashi, J.; Lucisano, L.J.; Polli, J.E.Development of a more rapid, reduced serum culturesystem for Caco-2 monolayers and application to thebiopharmaceutics classification system. Int. J. Pharm.,2000, 200, 41-51.
[87] Ritschel, W.A. In: Fraske, D.E.; Whitney, H.A.K., Jr. (Eds.)Perspectives in Clinical Pharmacy, 1st Ed., DrugIntelligence Publications: Hamilton, IL, 1972, pp. 325-367.
[88] Avdeef, A. Applications and Theory Guide to pH-MetricpKa and log P Measurement. Sirius AnalyticalInstruments Lts.: Forest Row, UK, 1993.
[89] Levy, R.H.;Rowland, M. Dissociation constants ofsparingly soluble substances: nonlogarithmic lineartitration curves. J. Pharm. Sci., 1971, 60 , 1155-1159.
[90] Purdie, N.; Thomson, M.B.; Riemann, N. Thethermodynamics of ionization of polycarboxylic acids.J. Solut. Chem., 1972, 1, 465-476.
[91] Streng, W.H.; Steward, D.L. Jr. Ionization constants of anamino acid as a function of temperature. Int. J. Pharm.,1990, 61 , 265-266.
[92] Avdeef, A., Bucher, J.J., Accurate measurements of theconcentration of hydrogen ions with a glass electrode:calibrations using the Prideaux and other universalbuffer solutions and a computer- controlled automatictitrator. Anal. Chem., 1978, 50 , 2137-2142.
[93] Avdeef, A. Weighting scheme for regression analysisusing pH data from acid-base titrations. Anal. Chim.Acta, 1983, 148, 237-244.
[94] Avdeef, A. STBLTY: methods for construction andrefinement of equilibrium models. In: Leggett, D.J. (Ed.),Computational Methods for the Determination ofFormation Constants, Plenum: New York, 1985, pp. 355-473.
[95] Avdeef, A.; Comer, J.E.A.; Thomson, S.J. pH-metric logP.3. Glass electrode calibration in methanol- water, appliedto pKa determination of water-insoluble substances.Anal. Chem., 1993, 65 , 42-49.
[96] Lingane, P.J.; Hugus, Z.Z., Jr. Normal Equations for theGaussian Least-Squares Refinement of FormationConstants with Simultaneous Adjustment of the Spectra
338 Current Topics in Medicinal Chemistry, 2001, Vol. 1, No. 4 Alex Avdeef
of the Absorbing Species. Inorg. Chem., 1970, 9, 757-762.
[97] Hugus, Z.Z., Jr.; El-Awady, A.A. The Determination of theNumber of Species Present in a System: a New MatrixRank Treatment of Spectrophotometric Data. J. Phys.Chem., 1971, 75 , 2954-2957.
[98] Alcock, R.M.; Hartley, F.R.; Rogers, D.E. A Damped Non-linear Least-Squares Computer Program (DALSFEK) forthe Evaluation of Equilibrium Constants fromSpectrophotometric and Potentiometric Data. J. Chem.Soc. Dalton Trans., 1978, 115-123. – Marquardtalgorithm
[99] Maeder, M.; Gampp, H. Spectrophotometric DataReduction by Eigenvector Analysis for Equilibrium andKinetic Studies and a New Method of FittingExponentials. Anal. Chim. Acta., 1980, 122, 303-313. –Basic code; matrix rank analysis, Marquardt
[100] Gampp, H.; Maeder, M.; Zuberbühler, A.D. General Non-linear Least-squares Program for the NumericalTreatment of Spectrophotometric Data on a Single-Precision Game Computer. Talanta, 1980, 27 , 1037-1045. — Basic code
[101] Kralj, Z.l Simeon, V. Estimation of Spectra of IndividualSpecies in a Multisolute Solution. Anal. Chim. Acta.,1982, 129, 191-198.
[102] Gampp, H.; Maeder, M.; Meyer, C.J.; Zuberbühler, A.D.;Calculation of Equilibrium Constants fromMultiwavelength Spectroscopic Data. I. MathematicalConsiderations. Talanta, 1985, 32 , 95-101. SPECFIT inFortran 77, Marquardt
[103] Gampp, H.; Maeder, M.; Meyer, C.J.; Zuberbühler, A.D.Calculation of Equilibrium Constants from Multi-wavelength Spectroscopic Data. III. Model-Free Analysisof Spectrophotometric and ESR Titrations. Talanta,1985, 32 , 1133-1139.
[104] Alibrandi, G. Variable-concentration kinetics. J. Chem.Soc., Chem. Commun., 1994, 2709-2710.
[105] Allen , R.I.; Box, K.J.; Comer, J.E.A.; Peake, C.; Tam, K.Y.Multiwavelength spectrophotometric determination ofacid dissociation constants of ionizable drugs. J. Pharm.Biomed. Anal., 1998, 17 , 699-712.
[106] Tam, K.Y.; Takács-Novák, K. Multiwavelengthspectrophotometric determination of acid dissociationconstants part II. First derivative vs. target factoranalysis. Pharm. Research, 1999, 16 , 374-381.
[107] Mitchell, R.C.; Salter, C.J.; Tam, K.Y. Multiwavelengthspectrophotometric determination of acid dissociationconstants part III. Resolution of multi-protic ionizationsystems. J. Pharm. Biomed. Anal., 1999, 20 , 289-295.
[108] Tam, K.Y.; Hadley, M.; Patterson, W. Multiwavelengthspectrophotometric determination of acid dissociationconstants part IV. Water-insoluble pyridine derivatives.Talanta, 1999, 49 , 539-546.
[109] Box, K.J.; Comer, J.E.A.; Hosking, P.; Tam, K.Y.;Trowbridge, L.; Hill, A. Rapid Physicochemical Profilingas an Aid to Drug Candidate Selection. In: Dixon, G.K.;Major, J.S.; Rice, M.J. (Eds.) High Throughput
Screening: The Next Generation. Bios ScientificPublishers Ltd.: Oxford, 2000, pp. 67-74.
[110] Tam, K.Y.; Takács-Novák, K. Multi-wavelengthspectroscopic determination of acid dissociationconstants: a validation study. Anal. Chim. Acta., 2001(in press).
[111] Tam, K.Y. Multiwavelength spectrophotometricresolution of the micro-equilibria of a triproticamphoteric drug: methacycline. Mikrochim. Acta., 2001(in press).
[112] Alibrandi, G.; Coppolino, S.; Micali, N.; Villari, A.Variable pH kinetics: an easy determination of pH-rateprofile. J. Pharm. Sci., 2001, 90 , 270-274.
[113] C.D. Bevan, A.P. Hill, D.P. Reynolds, Patent CooperationTreaty, WO 99/13328, 18 March 1999.
[114] Takács-Novák, K.; Tam, K.Y. Multiwavelengthspectrophotometric determination of acid dissociationconstants part V. Microconstants and tautomeric ratiosof diprotic amphoteric drugs. Analyst, (submitted)
[115] Tam, K.Y. Multiwavelength spectrophotometricdetermination of acid dissociation constants Part VI.Deconvolution of binary mixtures of ionizablecompounds. Analytical Letters, (submitted)
[116] Tam, K.Y.; Quéré, L. Multiwavelength spectro-photometric resolution of the micro-equilibria ofcetirizine. (submitted)
[117] Hendriksen, B.A.; Sanchez-Felix, M.V.; Tam, K.Y. A newmultiwavelength spectrophotometric method for thedetermination of the molar absorption coefficients ofionizable drugs. (submitted)
[118] Cleveland, J.A. Jr.; Benko, M.H.; Gluck, S.J.; Walbroehl,Y.M. Automated pKa determination at low soluteconcentrations by capillary electrophoresis. J.Chromatogr., A 1993, 652, 301-308.
[119] Ishihama, Y.; Oda, Y.; Asakawa, N. MicroscaleDetermination of Dissociation Constants of MultivalentPharmaceuticals by Capillary Electrophoresis. J. Pharm.Sci., 1994, 83 , 1500-1507.
[120] Jia, Z.; Ramstad, T.; Zhong, M. Medium-throughput pKascreening of pharmaceuticals by pressure-assistedcapillary electrophoresis. (submitted)
[121] Avdeef, A.; Box, K.J.; Comer, J.E.A.; Hibbert, C.; Tam,K.Y. pH-metric logP. 10. Determination of vesiclemembrane - water partition coefficients of ionizabledrugs. Pharm. Res., 1997, 15 , 208-214.
[122] Avdeef, A. Sirius Technical Application Notes (STAN).Vol. 1. Sirius Analytical Instruments Ltd.: Forest Row,UK, 1994.
[123] Avdeef, A.; Barrett, D.A.; Shaw, P.N.; Knaggs, R.D.; Davis,S.S. Octanol-, chloroform-, and pgdp-water partitioningof morphine-6-glucuronide and other related opiates. J.Med. Chem., 1996, 39 , 4377-4381.
[124] Davies, C.W. Ion Association, Butterworths: London,1962, p.41.
Physicochemical Profiling (Solubility, Permeability and Charge State) Current Topics in Medicinal Chemistry, 2001, Vol. 1, No. 4 339
[125] Avdeef, A. pH-Metric logP. 2. Refinement of PartitionCoefficients and Ionization Constants of MultiproticSubstances. J. Pharm. Sci., 1993, 82 , 183-190.
[126] Kortnum, G.; Vogel, W.; Andrussow, K. DissociationConstants of Organic Acids in Aqueous Solution,Butterworths: London, 1961.
[127] [127 Sillén, L.G., Martell, A.E. Stability Constants ofMetal-Ion Complexes, Special Public. No. 17, ChemicalSociety: London, 1964.
[128] Perrin, D.D. Dissociation Constants of Organic Bases inAqueous Solution, Butterworths: London, 1965.
[129] Sillén, L.G., Martell, A.E. Stability Constants of Metal-Ion Complexes, Special Public. No. 25, ChemicalSociety: London, 1971.
[130] Serjeant, E.P.; Dempsey, B. Ionization Constants ofOrganic Acids in Aqueous Solution, Pergamon: Oxford,1979.
[131] Smith, R.M., and Martell, A.E., Critical StabilityConstants, Vols. 1-6, Plenum Press, New York, 1974.
[132] Smith, R.M.; Martell, A.E.; Motekaitis, R.J. NISTCritically Selected Stability Constants of MetalComplexes Database, Ver. 5, NIST Standards ReferenceDatabase 46, U.S. Dept. Commerce, Gaithersburg, 1998.
[133] Avdeef, A.; Box,K.J. Sirius Technical Application Notes(STAN). Vol. 2. Sirius Analytical Instruments Ltd.:Forest Row, UK, 1995.
[134] Bjerrum, J. Metal-Ammine Formation in AqueousSolution, Haase: Copenhagen, 1941.
[135] Irving, H.M.; Rossotti, H.S. The calculation of formationcurves of metal complexes from pH titration curves inmixed solvents. J. Chem. Soc., 1954, 2904-2910.
[136] Avdeef, A.; Kearney, D.L.; Brown, J.A.; Chemotti, A.R. Jr.Bjerrum Plots for the Determination of SystematicConcentration Errors in Ttitration Data. Anal. Chem.,1982, 54 , 2322-2326.
[137] Takács-Novák, K.; Box, K.J.; Avdeef, A. PotentiometricpKa Determination of Water-Insoluble Compounds.Validation Study in Methanol/Water Mixtures. Int. J.Pharm., 1997, 151, 235-248.
[138] Avdeef, A.; Zelazowski, A.J.; Garvey, J.S. Cadmiumbinding by biological ligands. 3. Five- and seven-cadmium binding in metallothionein: a detailedthermodynamic study. Inorg. Chem., 1985, 24 , 1928-1933.
[139] Dunsmore, H.S.; Midgley, D. The calibration of glasselectrodes in cells with liquid junction. Anal. Chim.Acta., 1972, 61 , 115-122.
[140] Bates, R.G. The modern meaning of pH. CRC Crit. Rev.Anal. Chem., 1981, 10 , 247-278.
[141] Sprokholt, R.; Maas, A.H.J.; Rebelo, M.J.; Covington,A.K. Determination of the performance of glasselectrodes in aqueous solutions in the physiological pHrange and at the physiological sodium ionconcentration. Anal. Chim. Acta., 1982, 129, 53-59.
[142] Comer, J.E.A.; Hibbert, C. pH electrode performanceunder automatic management conditions. J. Auto. Chem.1997, 19 , 213-224.
[143] Avdeef, A.; Box, K.J.; Comer, J.E.A.; Gilges, M.; Hadley,M.; Hibbert, C.; Patterson, W.;Tam, K.Y. pH-metric logP.11. pKa determination of water-insoluble drugs inorganic solvent-water mixtures. J. Pharm. Biomed. Anal.,1999, 20 , 631-641.
[144] Sweeton, F.H.; Mesmer, R.E.; Baes, C.F., jr. Aciditymeasurements at elevated temperatures. 7. Dissociationof water. J. Solut. Chem., 1974, 3, 191-214.
[145] Good, N.E.; Wingert, G.D.; Winter, W.; Connolly, T.N.;Izawa, S.; Singh, R.M.M. Hydrogen ion buffers forbiological research. Biochemistry, 1966, 5, 467-477.
[146] Vega, C.A.; Bates, R.G. Buffers for the physiological pHrange: thermodynamic constants of four substitutedaminoethanesulfonic acids from 5 to 50%C Anal. Chem.,1976, 48 , 1293-1296.
[147] Bates, R.G.; Vega, C.A.; White, D.R. Jr. Standards for pHmeasurements in isotonic saline media of ionic strengthI = 0.16. Anal. Chem., 1978, 50 , 1295-1300.
[148] Sankar, M.; Bates, R.G. Buffers for the physiological pHrange: thermodynamic constants of 3-(N- morpholino)propanesulfonic acid from 5 to 50%C. Anal. Chem.,1978, 50 , 1922-1924.
[149] Roy, R.N.; Gibbons, J.J.; Padron, J.L.; Moeller, J. Second-stage dissociation constants of piperazine-N,N'-bis(2-ethanesulfonic acid) monosodium monohydrate andrelated thermodynamic functions in water from 5 to55%C. Anal. Chem., 1980, 52 , 2409-2412.
[150] Feng, D.; Koch, W.F.; Wu, Y.C. Second dissociationconstant and pH of N-(2- hydroxyethyl)piperazine-N'-2-ethanesulfonic acid from 0 to 50%C. Anal. Chem., 1989,61 , 1400-1405.
[151] Feng, D.; Koch, W.F.; Wu, Y.C. Investigation of theinteraction of HCl and three amino acids, HEPES,MOPSO and glycine, by EMF measurements. J. Solut.Chem., 1992, 21 , 311-321.
[152] Mizutani, M. Z. Physik. Chem., 1925, 116, 350-358.
[153] Mizutani, M. Z. Physik. Chem., 1925, 118, 318-326.
[154] Mizutani, M. Z. Physik. Chem., 1925, 118, 327-341.
[155] Hall, N.F.; Sprinkle, M.R. Relations between the structureand strength of certain organic bases in aqueoussolution J. Amer. Chem. Soc., 1932, 54 , 3469-3485.
[156] Kolthoff, I.M.; Lingane, J.J.; Larson, W.D. The relationbetween equilibrium constants in water and othersolvents. J. Amer. Chem. Soc., 1938, 60 , 2512-2515.
[157] Kolthoff, I.M.; Guss, L.S. Ionization constants of acid-base indicators in methanol. J. Amer. Chem. Soc., 1938,60 , 2516-2522.
[158] Albright, P.S.; Gosting, L.J. J. Amer. Chem. Soc., 1946,68 , 1061-1063.
[159] Grunwald, E.; Berkowitz, B.J. The measurement andcorrelation of acid dissociation constants for carboxylicacids in the system ethanol-water. Activity coefficients

340 Current Topics in Medicinal Chemistry, 2001, Vol. 1, No. 4 Alex Avdeef
and empirical activity functions. J. Amer. Chem. Soc.,1951, 73 , 4939-4944.
[160] Gutbezahl, B.; Grunwald, E. The acidity and basicityscale in the system ethanol-water. The evaluation ofdegenrate activity coefficients for single ions. J. Amer.Chem. Soc., 1953, 75 , 565-574.
[161] Marshall, P. B. Some chemical and physical propertiesassociated with histamine antogonism. Brit. J.Pharmacol., 1955, 10 , 270-278.
[162] Bacarella, A.L.; Grunwald, E.; Marshall, H.P.; Purlee, E.L.The potentiometric measurement of acid dissociationconstants and pH in the system methanol-water. pKavalues for carboxylic acids and anilinium ions. J. Org.Chem., 1955, 20 ,747-762.
[163] Shedlovsky, T; Kay, R.L. The ionization constant ofacetic acid in water-methanol mixtures at 25%C fromconductance measurements. J. Amer. Chem. Soc., 1956,60 , 151-155.
[164] Edmonson, T.D.; Goyan, J.E. The effect of hydrogen ionand alcohol concentration on the solubility ofphenobarbital. J. Amer. Pharm. Assoc., Sci. Ed., 1958, 47 ,810-812.
[165] Yasuda, M. Dissociation constants of some carboxylicacids in mixed aqueous solvents. Bull. Chem. Soc. Jpn.,1959, 32 , 429-432.
[166] de Ligny, C.L.; Rehbach, M. The liquid-liquid-junctionpotentials between some buffer solutions in methanoland methanol-water mixtures and a saturated KClsolution in water at 25%C. Recl. Trav. Chim. Pays-Bas,1960, 79 , 727-730.
[167] de Ligny, C.L. The dissociation constants of somealiphatic amines in water and methanol-water mixtures at25%C Recl. Trav. Chim. Pays-Bas, 1960, 79 , 731-736.
[168] de Ligny, C.L.; Luykx, P.F.M.; Rehbach, M.; Wienecke,A.A. The pH of some standard solutions in methanol andmethanol-water mixtures at 25%C. 1. Theoretical part.Recl. Trav. Chim. Pays-Bas, 1960, 79 , 699-712.
[169] de Ligny, C.L.; Luykx, P.F.M.; Rehbach, M.; Wienecke,A.A. The pH of some standard solutions in methanol andmethanol-water mixtures at 25%C. 2. Experimental part.Recl. Trav. Chim. Pays-Bas, 1960, 79 , 713-726.
[170] Yasuda, M.; Yamsaki, K.; Ohtaki, H. Bull. Chem. Soc.Japan, 1960, 23 , 1067.
[171] de Ligny, C.L.; Loriaux, H.; Ruiter, A. The application ofHammett's acidity function Ho to solutions in methanol-water mixtures. Recl. Trav. Chim. Pays-Bas, 1961, 80 ,725-739.
[172] Shedlovsky, T. The behaviour of carboxylic acids inmixed solvents. In Pesce, B. (Ed.), Electrolytes,Pergamon Press, New York, 1962, pp.146-151.
[173] Long, F.A.; Ballinger, P. Acid ionization constants ofalcohols in the solvents water and deuterium oxide. InPesce, B. (Ed.), Electrolytes, Pergamon Press, New York,1962, pp. 152-164.
[174] Bates, R.G.; Paabo, M.; Robinson, R.A. Interpretation ofpH measurements in alcohol-water solvents. J. Phys.Chem., 1963, 67 , 1833-1838.
[175] Gelsema, W.J.; de Ligny, C.L.; Remijnse, A.G.; Blijleven,H.A. pH-measurements in alcohol-water mixtures, usingaqueous standard buffer solutions for calibration. Recl.Trav. Chim. Pays-Bas, 1966, 85 , 647-660.
[176] Woolley, E.M.; Hurkot, D.G.; Hepler, L.G. Ionizationconstants for water in aqueous organic mixtures J. Phys.Chem., 1970, 74 , 3908-3913.
[177] Wooley, E.M.; Tomkins, J.; Hepler, L.G. IonizationConstants for very weak organic acids in aqueoussolution and apparent ionization constants for water inaqueous organic mixtures. J. Solut. Chem., 1972, 1, 341-351.
[178] Fisicaro, E.; Braibanti, A. Potentiometric titrations inmethanol/water medium: intertitration variability.Talanta, 1988, 35 , 769-774.
[179] Esteso, M.A.; Gonzalez-Diaz, O.M.; Hernandez-Luis, F.F.;Fernandez-Merida, L. Activity coefficients for NaCl inethanol-water mixtures at 25%C. J. Solut. Chem., 1989,18 , 277-288.
[180] Papadopoulos, N.; Avranas, A. Dissociation of salicylicacid, 2,4-, 2,5- and 2,6-dihydroxybenzoic acids in 1-propanol-water mixtures at 25%C. J. Solut. Chem., 1991,20 , 293-300.
[181] Li, A.; Yalkowsky, S. Solubility of organic solutes inethanol/water mixtures. J. Pharm. Sci., 1994, 83 , 1735-1740.
[182] Halle, J.-C.; Garboriaud, R.; Schaal, R. Etudeelectrochimique des melanges d'eau et de dimethyl-sulfoxyde. Produit ionique apparent et niveau d'acidite.Bull. Soc. Chim., 1969, 1851-1857.
[183] Halle, J.-C.; Garboriaud, R.; Schaal, R. Sur la realizationde melanges tampons dans les milieux eau-DMSO.Application a l'etude de nitrodephenylamines. Bull. Soc.Chim., 1970, 2047-2053.
[184] Woolley, E.M.; Hepler, L.G. Apparent ionizationconstants of water in aqueous organic mixtures and aciddissociation constants of protonated co-solvents inaqueous solution Anal. Chem., 1972, 44 , 1520-1523.
[185] Yakolev, Y.B; Kul'ba, F.Y.; Zenchenko, D.A.Potentiometric measurement of the ionic products ofwater in water-dimetylsulphoxide, water-acetonitrile andwater-dioxane mixtures. Russ. J. Inorg. Chem., 1975, 20 ,975-976.
[186] Siow, K.-S.; Ang, K.-P.Thermodynamic of ionization of2,4-dinitrophenol in water- dimethylsulfoxide solvents.J. Solut. Chem., 1989, 18 , 937-947.
[187] Van Uitert, L.G.; Haas, C.G. Studies on coordinationcompounds. 1. A method for determiningthermodynamic equilibrium constants in mixedsolvents. J. Amer. Chem. Soc., 1953, 75 , 451-455.
[188] Grunwald, E. Solvation of electrolytes in dioxane-watermixtures. In Pesce, B. (Ed.), Electrolytes, Pergamon Press,New York, 1962, pp. 62-76.
[189] Marshall, W.L. Complete equilibrium constants,electrolyte equilibria, and reaction rates. J. Phys. Chem.,1970, 74 , 346-355.
Physicochemical Profiling (Solubility, Permeability and Charge State) Current Topics in Medicinal Chemistry, 2001, Vol. 1, No. 4 341
[190] Sigvartsen, T.; Songstadt, J.; Gestblom, B.; Noreland, E.Dielectric properties of solutions of tetra- iso-pentylammonium nitrate in dioxane-water mixtures. J.Solut. Chem., 1991, 20 , 565-582.
[191] Casassas, E.; Fonrodona, G.; de Juan, A. Solvatochromicparameters for binary mixtures and a correlation withequilibrium constants. 1. Dioxane-water mixtures. J.Solut. Chem., 1992, 21 , 147-162.
[192] Cavill, G.W.K.; Gibson, N.A.; Nyholm, R.S. J. Chem. Soc.,1949, 2466-2470.
[193] Garrett, E.R. Variation of pKa'-values of tetracyclines indimethylformamide-water solvents. J. Pharm. Sci., 1963,52 , 797-799.
[194] Slater, B.; McCormack, A.; Avdeef, A.; Comer, J.E.A. pH-Metric logP. 4. Comparison of Partition CoefficientsDetermined by Shake-Flask, HPLC and PotentiometricMethods. J. Pharm. Sci., 1994, 83 , 1280-1283.
[195] Takács-Novák, K.; Avdeef, A.; Podányi, B.; Szász, G.Determination of protonation macro- andmicroconstants and octanol/water partition coefficientof anti-inflammatory niflumic acid. J. Pharm. Biomed.Anal., 1994, 12 , 1369-1377.
[196] Avdeef, A.; Takács-Novák, K.; Box, K.J. pH-metric logP.6. Effects of sodium, potassium, and N-CH3-d-glucamineon the octanol-water partitioning with prostaglandinsE1 and E2. J. Pharmceut. Sci., 1995, 84 , 523-529.
[197] Faller, B.; Wohnsland, F. Physicochemical parameters astools in drug discovery and lead optimization. In: Testa,B., van de Waterbeemd, H., Folkers, G., Guy, R. (Eds.).Pharmacokinetic Optimization in Drug Research, VerlagHelvetica Chimica Acta: Zürich and Wiley - VCH:Weinheim, 2001, pp. 257-274.
[198] Leggett, D.J. SQUAD: Stability Quotients fromAbsorbance Data. In: Leggett, D.J. (Ed.), ComputationalMethods for the Determination of Formation Constants,Plenum: New York, 1985, pp. 158-217.
[199] Niebergall, P.J.; Schnaare, R.L.; Sugita, E.T. Spectraldetermination of microdissociation constants. J. Pharm.Sci., 1972, 61 , 232-234.
[200] Streng, W.H. Microionization constants of commercialcephalosporins. J. Pharm. Sci., 1978, 67 , 666-669.
[201] Noszál, B.. Microspeciation of polypeptides J. Phys.Chem., 1986, 90 , 6345-6349.
[202] Noszál, B. Group constant: a measure of submolecularbasicity. J. Phys. Chem., 1986, 90 , 4104- 4110.
[203] Noszál, B.; Osztás, E. Acid-base properties for eachprotonation site of six corticotropin fragments. Int. J.Peptide Protein Res., 1988, 33 , 162-166.
[204] Noszál, B.; Sándor, P. Rota-microspeciation of asparticacid and asparagine. Anal. Chem., 1989, 61 , 2631-2637.
[205] Nyéki, O.; Osztás, E.; Noszál, B.; Burger, K. Acid-baseproperties and microspeciation of six angiotensin-typeoctapeptides. Int. J. Peptide Protein Res., 1990, 35 , 424-427.
[206] Takács-Novák, K.; Noszál, B.; Hermecz, I.; Keresztúri, G.;Podányi, B.; Szász, G. Protonation equilibria of
quinolone antibacterials. J. Pharm. Sci., 1990, 79 , 1023-1028.
[207] Noszàl, B.; Guo, W.; Rabenstein, D.L. Rota-microspeciation of serine, cysteine and selenocysteine.J. Phys. Chem., 1991, 95 , 9609-9614.
[208] Noszàl, B.; Rabenstein, D.L. Nitrogen-ProtenationMicroequilibria and C(2)-Deprotenation Microkineticsof Histidine, Histamine and Related Compounds. J. Phys.Chem., 1991, 95 , 4761-4765.
[209] Noszàl, B.; Kassai-Tanczos, R. Microscopic Acid-BaseEquilibria of Arginine. Talanta, 1991, 38 , 1439-1444.
[210] Takács-Novák, K.; Józan, M.; Hermecz, I.; Szász,G.Lipophilicity of antibacterial fluoroquinolones. Int. J.Pharm., 1992, 79 , 89-96.
[211] Noszàl, B.; Guo, W.; Rabenstein, D.L. .Characterizationofthe Macroscopic and Microscopic Acid- BaseChemistry of the Native Disulfide and Reduced DithiolForms of Oxytocin, Arginine-Vasopressin and RelatedPeptides. J. Org. Chem., 1992, 57 , 2327-2334.
[212] Takács-Novák, K.; Józan, M.; Szász, G. Lipophilicity ofamphoteric molecules expressed by the true partitioncoefficient. Int. J. Pharm., 1995, 113, 47.
[213] Cannon, J.B.; Krill, S.L.; Porter, W.R. Physicochemicalproperties of A-75998, an antagonist of luteinizinghormone releasing hormone. J. Pharm. Sci., 1995, 84 ,953-958.
[214] Hawes, J.L.; Kay, R.L. Ionic association of potassium andcesium chloride in ethanol-water mixtures fromconductance measurements at 25o. J. Phys. Chem., 1965,69 , 2420-2431.
[215] Lawson, C.L.; Hanson, R.J. Solving Least SquaresProblems. Prentice-Hall: Englewood Cliffs, NJ, 1974.
[216] Tam, K.Y. BUFMAKE: a computer program to calculatethe compositions of buffers of defined buffer capacityand ionic strength for ultra-violet spectrophotometry.Comp. Chem., 1999, 23 , 415-419.
[217] Dearden, J.C., Bresnen, G.M. The measurement ofpartition coefficients. Quant. Struct.-Act. Relat., 1988, 7,133-144.
[218] Hersey, A.; Hill, A.P.; Hyde, R.M.; Livingstone, D.J.Principles of method selection in partition studies.Quant. Struct.-Act. Relat., 1989, 8, 288-296.
[219] Tsai, R.-S.; Fan, W.; El Tayar, N.; Carrupt, P.-A.; Testa, B.;Kier, L.B. Solute-Water Interactions in the OraganicPhase of a Biphasic System. 1. Structural Influence ofOrganic Solutes on the ‘Water- Dragging’ Effect. J. Amer.Chem. Soc., 1993, 115, 9632-9639.
[220] Fan, W.; Tsai, R.S.; El Tayar, N.; Carrupt, P.-A.; Testa, B.Solute-water interactions in the organic phase of abiphasic system. 2. Effects of organic phase andtemperature on the ‘water-dragging’ effect. J. Phys.Chem., 1994, 98 , 329-333, 98.
[221] Leahy, D.E.; Taylor, P.J.; Wait, A.R. Model solventsystems for QSAR. 1. Propylene glycol dipelargonate(PGDP). A new standard for use in partition coefficientdetermination. Quant. Struct.- Act. Relat., 1989, 8, 17-31.

342 Current Topics in Medicinal Chemistry, 2001, Vol. 1, No. 4 Alex Avdeef
[222] Seiler, P. The simultaneous determination of partitioncoefficients and acidity constant of a substance. Eur. J.Med. Chem. -Chim. Therapeut., 1974, 9, 665-666.
[223] van de Waterbeemd, H.; Kansy, M. Hydrogen-bondingcapacity and brain penetration. Chimia, 1992, 46 , 299-303.
[224] von Geldern, T.W.; Hoffman, D.J.; Kester, J.A.; Nellans,H.N.; Dayton, B.D.; Calzadilla, S.V.; Marsh, K.C.;Hernandez, L.; Chiou, W.; Dixon, D.B.; Wu-wong, J.R.;Opgenorth, T.J. Azole endothelin antagonists. 3. UsinglogP as a tool to improve absorption. J. Med. Chem.,1996, 39 , 982-991.
[225] Kubinyi, H. Hydrogen bonding: the last mystery in drugdesign? In: Testa, B., van de Waterbeemd, H., Folkers, G.,Guy, R. (Eds.). Pharmacokinetic Optimization in DrugResearch, Verlag Helvetica Chimica Acta: Zürich andWiley - VCH: Weinheim, 2001, pp. 513-524.
[226] Raevsky; O.; Grigor’ev; V.Y.; Kireev; D.; Zefirov, N.Complete thermodynamic description of H- bonding inthe framework of multiplicative approach. Quant.Struct.-Act. Relat., 1992, 11 , 49-63.
[227] El Tayar; N.; Testa, B.; Carrupt, P.-A. Polar intermolecularinteractions encoded in partition coefficients: anindirect estimation of hydrogen-bond parameters ofpolyfunctional solutes. J. Phys. Chem., 1992, 96 , 1455-1459.
[228] Chikhale, E.G.; Ng, K.Y.; Burton, P.S.; Borchardt, R.T.Hydrogen bonding potential as a determinant of the invitro and in situ blood-brain barrier permeability ofpeptides. Pharm. Res., 1994, 11 , 412-19.
[229] Abraham, M.; Chadha, H.; Whiting, G.; Mitchell, R.Hydrogen bonding. 32. An analysis of water- octanoland water-alkane partitioning and the ÉlogP parameter ofSeiler. J. Pharm. Sci., 1994, 83 , 1085- 1100.
[230] ter Laak, A.M.; Tsai, R.-S.; den Kelder, G.M. D.-O.;Carrupt, P.-A.;Testa, B. Lipophilicity and hydrogen-bonding capacity of H1-antihistaminic agents in relationto their central sedative side effects. Eur. J. Pharm. Sci.,1994, 2, 373-384.
[231] Potts, R.O.; Guy, R.H. A predictive algorithm for skinpermeability: the effects of molecular size and hydrogenbonding. Pharm. Res., 1995, 12 , 1628-1633.
[232] Abraham, M.H.; Martins, F.; Mitchell, R.C. Algorithmsfor skin permeability using hydrogen bond descriptors:the problems of steroids. J. Pharm. Pharmacol., 1997,49 , 858-865.
[233] Reymond, F.; Steyaert, G.; Carrupt, P.-A.; Morin, D.;Tillement, J.P.; Girault, H.; Testa, B. The pH-partitionprofile of the anti-ischemic drug trimetazidine mayexplain its reduction of intracellular acidosis. Pharm.Research, 1999, 16 , 616-624.
[234] Carrupt, P.-A.; Testa, B.; Bechalany, A.; El Tayar, N.;Descas, P.; Perrissoud, D. Morphine 6- glucuronide andmorphine 3-glucuronide as molecular chameleons withunexpectedly high lipophilicity. J. Med. Chem., 1991,34 , 1272-1275.
[235] Gaillard, P.; Carrupt, P.-A.; Testa, B. The Conformation-Dependent Lipophilicity of Morphine Glucuronides as
Calculated from the Molecular Lipophilicity Potential.Bioorg. Med. Chem. Lett., 1994, 4, 737-742.
[236] Poulin, P.; Schoenlein, K.; Theil, F.-P. Prediction ofadipose tissue : plasma partition coefficients forstructurally unrelated drugs. J. Pharm. Sci., 2001, 90 ,436-447.
[237] Pliska, V.; Testa, B.; van de Waterbeemd, H. (Eds.).Methods and Principles in Medicinal Chemistry, Vol.4,VCH Publishers: Weinheim, Germany, 1996.
[238] Testa, B., van de Waterbeemd, H., Folkers, G., Guy, R.(Eds.). Pharmacokinetic Optimization in Drug Research,Verlag Helvetica Chimica Acta: Zürich and Wiley - VCH:Weinheim, 2001.
[239] Scherrer, R.A.; Howard, S.M. Use of distributioncoefficients in quantitative structure-activityrelationships. J. Med. Chem., 1977, 20 , 53-58.
[240] Schaper, K.-J. Simultaneous determination of electronicand lipophilic properties [pKa, P(ion), P(neutral)] foracids and bases by nonlinear regression analysis of pH-dependent partittion measurements. J. Chem. Res., (S)1979, 357.
[241] Taylor, P.J.; Cruickshank, J.M. Distribution coefficientsof atenolol and sotalol. J. Pharm. Pharmacol., 1984, 36 ,118-119.
[242] Taylor, P.J.; Cruickshank, J.M. Distribution coefficientsof atenolol and sotalol. J. Pharm. Pharmacol., 1985, 37 ,143-144.
[243] Manners, C.N.; Payling, D.W.; Smith, D.A. Distributioncoefficient, a convenient term for the relation ofpredictable physico-chemical properties to metabolicprocesses. Xenobiotica, 1988, 18 , 331- 350.
[244] Avdeef, A. Assessment of Distribution - pH Profiles. InPliska, V.; Testa, B.; van de Waterbeemd, H. (Eds.).Methods and Principles in Medicinal Chemistry, Vol.4,VCH Publishers: Weinheim, Germany, 1996, pp.109-139.
[245] Comer, J.; Tam, K. Lipophilicity profiles: theory andmeasurement. In: Testa, B., van de Waterbeemd, H.,Folkers, G., Guy, R. (Eds.). PharmacokineticOptimization in Drug Research, Verlag HelveticaChimica Acta: Zürich and Wiley - VCH: Weinheim, 2001,pp. 275-304.
[246] Scherrer, R.A. Biolipid pKa values in the lipophilicity ofampholytes and ion pairs. In: Testa, B., van deWaterbeemd, H., Folkers, G., Guy, R. (Eds.).Pharmacokinetic Optimization in Drug Research, VerlagHelvetica Chimica Acta: Zürich and Wiley - VCH:Weinheim, 2001, pp. 351-381.
[247] Murthy. K.S.; Zografi, G. Oil-water partitioning ofchlorpromazine and other phenothiazine derivativesusing dodecane and n-octanol. J. Pharm. Sci., 1970, 59 ,1281-1285.
[248] Tomlinson, E.; Davis, S.S. Interactions between largeorganic ions of opposite and unequal charge. II. Ion pairand ion triplet formation. J. Colloid Interface Sci., 1980,74 , 349-357.
[249] van der Giesen, W.F.; Janssen, L.H.M. Int. J. Pharm.,1982, 12 , 231-249.
Physicochemical Profiling (Solubility, Permeability and Charge State) Current Topics in Medicinal Chemistry, 2001, Vol. 1, No. 4 343
[250] Scherrer, R.A. The treatment of ionizable compounds inquantitative structure-activity studies with specialconsideration of ion partitioning. In: Magee, P.S.; Kohn,G.K.; Menn, J.J. (Eds.). Pesticide Syntheses troughRational Approaches. ACS Symposium Series 225, Amer.Chem. Soc.: Washington, DC, 1984, pp. 225-246.
[251] Scherrer, R.A.; Crooks, S.L. Titrations in water-saturatedoctanol: a guide to partition coefficients of ion pairs andreceptor-site interactions. Quant. Struct.-Activ. Rel.,1989, 8, 59-62.
[252] Akamatsu, M.; Yoshida, Y.; Nakamura, H.; Asao, M.;Iwamura, H.; Fujita, T. Hydrophobicity of di- andtripeptides having unionizable side chains andcorrelation with substituent and structural parameters.Quant. Struc. -Act. Relat., 1989, 8, 195-203.
[253] Manners, C.N.; Payling, D.W.;Smith, D.A. Lipophilicityof zwitterionic suphate conjugates of tiaramide,propanolol and 4'-hydroxypropranolol. Xenobiotica,1989, 19 , 1387-1397.
[254] Westall, J.C.; Johnson, C.A.; Zhang, W. Distribution ofLiCl, NaCl, KCl, HCl, MgCl2, and CaCl2 between octanoland water. Environ. Sci. Technol., 1990, 24 , 1803-1810.
[255] Chmelík, J.; Hude_ek, J.; Putyera, K.; Makovi_ka, J.;Kalous, V.; Chmelíková, J. Characterization of thehydrophobic properties of amino acids on the basis oftheir partition and distribution coefficients in the 1-octanol-water system. Collect. Czech. Chem. Commum.,1991, 56 , 2030-2040.
[256] Tsai, R.-S.; Testa, B.; El Tayar, N.; Carrupt, P.-A.Structure-Lipophilicity relationships of zwitterionicamino acids J. Chem. Soc. Perkin Trans., 2 1991, 1797-1802.
[257] Akamatsu, M.; Fujita, T. Quantitative Analysis ofHydorphobicity of Di- to Pentapeptides Having un-ionizable Side Chains with Substituent and StructuralParameters. J. Pharm. Sci., 1992, 81 , 164-174.
[258] Akamatsu, M.; Katayama, T.; Kishimoto, D.; Kurokawa,Y.; Shibata, H. Quantitative analysis of the structure-hydophibicity relationships for N-Acetyl Di- andTripeptide Amides. J. Pharm. Sci., 1994, 83 , 1026-1033.
[259] Abraham, M.H.; Takács-Novák, K.; Mitchell, R.C. On thepartition of ampholytes: application to blood-braindistribution. J. Pharm. Sci., 1997, 86 , 310-315.
[260] Bierer, D.E.; Fort, D.M.; Mendez, C.D.; Luo, J.; Imbach,P.A.; Dubenko, L.G.; Jolad, S.D.; Gerber, R.E.; Litvak, J.;Lu, Q.; Zhang, P.; Reed, M.J.; Waldeck, N.; Bruening,R.C.; Noamesi, B.K.; Hector, R.F.; Carlson, T.J.; King,S.R. Ethnobotanical-directed discovery of the antihyper-glycemic properties of cryptolepine: its isolation fromCryptolepis sanguinolenta, synthesis, and in vitro andin vivo activities. J. Med. Chem., 1998, 41 , 894-901.
[261] Takács-Novák, K.; Szász, G.; Ion-pair partition ofquaternary ammonium drugs: the influence of counterions of different lipophilicity, size, and flexibility.Pharm. Res., 1999, 16, 1633-1638.
[262] Valkó, K.; Slégel, P. New ChromotographicHydrophobicity Index (φ0) Based on the Slope and theIntercept of the log K’ Versus Organic PhaseConcentration Plot. J. Chromotogr., 1993, 631, 49-61.
[263] Valkó, K.; Bevan, C.; Reynolds, D. Chromatographichydrophobicity index by fast-gradient RP- HPLC: ahigh-thorughput alternative to logP/logD. Anal. Chem.,1997, 69 , 2022-2029.
[264] Hitzel, L.; Watt, A.P.; Locker, K.L. An increasedthroughput method for the determination of partitioncoefficients. Pharm. Res., 2000, 17 , 1389-1395.
[265] Valkó, K. Measurements of physical properties for drugdesign in industry. In: Valkó, K. (Ed.) SeparationMethods in Drug Synthesis and Purification. Elsevier:Amsterdam, 2001, Ch.12.
[266] Pidgeon, C.; Venkataram, U.V. Immobilized artificialmembrane chromatography: supports composed ofmembrane lipids. Anal. Biochem., 1989, 176, 36-47.
[267] Pidgeon, C.; Ong, S.; Choi, H.; Liu, H. Preparation ofmixed ligand immobilized artificial membranes forpredicting drug binding to membranes. Anal. Chem.,1994, 66 , 2701-2709.
[268] Pidgeon, C.; Ong, S.; Liu, H.; Qui, X.; Pidgeon, M.;Dantzig, A.H.; Munroe, J.; Hornback, W.J.; Kasher, J.S.;Glunz, L.; Szczerba, T. IAM chromatography: an in vitroscreen for predicting drug membrane permeability. J.Med. Chem., 1995, 38 , 590-594.
[269] Ong, S.; Liu, H.; Qiu, X.; Bhat, G.; Pidgeon, C. Membranepartition coefficients chromatographically measuredusing immobilized artificial membrane surfaces. Anal.Chem., 1995, 67 , 755-762.
[270] Ong, S., Pidgeon, C. Thermodynamics of solutepartitioning into immobilized artificial membranes.Anal. Chem., 1995, 67 , 2119-2128.
[271] Ong, S.; Liu, H.; Pidgeon, C. Immobilized-artificial-membrane chromatography: measurements of membranepartition coefficient and predicting drug membranepermeability. J. Chromatogr., A 1996, 728, 113-128.
[272] Barton, P.; Davis, A.M.; McCarthy, D.J.; Webborn, P.J.H.Drug-phospholipid interactions. 2. Predicting the sitesof drug distribution using n-octanol/water andmembrane/water distribution coefficients. J. Pharm. Sci.,1997, 86 , 1034-1039.
[273] Barbato, F.; La Rotonda, M.I.; Quaglia, F. Interactions ofnonsteroidal antiinflammatory drugs with phospho-lipids: comparison between octanol/buffer partitioncoefficients and chromatographic indexes onimmobilized artificial membranes. J. Pharm. Sci., 1997,86 , 225-229.
[274] Yang, C.Y.; Cai, S.J.; Liu, H.; Pidgeon, C. Immobilizedartificial membranes - screens for drug- membraneinteractions. Adv. Drug Delivery Rev., 1997, 23 , 229-256.
[275] Stewart, B.H.; Chung, F.Y.; Tait, B.; John, C.; Chan, O.H.Hydrophobicity of HIV protease inhibitors byimmobilized artificial membrane chromatography.Pharm. Res., 1998, 15 , 1401-1406.
[276] Stewart, B.H.; Chan, O.H. Use of immobilized artificialmembrane chromatography for drug transportapplications. J. Pharm. Sci., 1998, 87 , 1471-1478.
[277] Ottiger, C.; Wunderli-Allenspach, H. immobilizedartificial membrane (IAM)-HPLC for partition studies ofneutral and ionized acids and bases in comparison with
344 Current Topics in Medicinal Chemistry, 2001, Vol. 1, No. 4 Alex Avdeef
the liposomal partition system. Pharm. Research, 1999,16 , 643-650.
[278] Genty, M.; González, G.; Clere, C.; Desangle-Gouty, V.;Legendre, J.-Y. Determination of the passive absorptionthrough the rate intestine using chromatographicindices and molar volume. Eur. J. Pharm. Sci., 2001, 12 ,223-229.
[279] Miyake, K.; Kitaura, F.; Mizuno, N.Phosphatidylcholine-coated silica as a useful stationaryphase for high-performance liquid chromatographicdetermination of partition coefficients between octanoland water . J. Chromatogr., 1987, 389, 47-56.
[280] Yang, Q.; Lundahl, P. Binding of lysozyme on thesurface of entrapped phosphatidylserine-phosphatidylcholine vesicles and an example of high-performance lipid vesicle surface chromatography. J.Chromatogr., 1990, 512, 377-386.
[281] Zhang, Y.; Zeng, C.-M.; Li, Y.-M.; Stellan, H.; Lundahl, P.Immobilized liposome chromatography of drugs oncalillary continuous beds for model analysis of drug-membrane interactions. J. Chromatogr., A 1996, 749, 13-18.
[282] Lundahl, P.; Beigi, F. Immobilized liposomechromatography fo drugs for model analysis of drug-membrane interactions. Adv. Drug Delivery Rev., 1997,23 , 221-227.
[283] Österberg, T.; Svensson, M.; Lundahl, P. Chromato-graphic retention of drug molecules on immobilizedliposomes prepared from egg phospholipids and fromchemically pure phospholipids. Eur. J. Pharm. Sci.,2001, 12 , 427-439.
[284] Ishihama, Y.; Oda, Y.; Uchikawa, K.; Asakawa, N.Evaluation of solute hydrophobicity by microemulsionelectrokinetic chromatography. Anal. Chem., 1995, 67 ,1588-1595.
[285] Razak, J.L.; Cutak, B.J.; Larive, C.K.; Lunte, C.E.Correlation of the capacity factor in vesicularelectrokinetic chromatography with the octanol:waterpartition coefficient for charged and neutral analytes.Pharm. Res., 2001, 18 , 104-111.
[286] Dyrssen, D. studies on the extraction of metalcomplexes. Iv. The dissociation constants and partitioncoefficients of 8-quinolinol (oxine) and n-nitroso-n-phenylhydroxylamine (cupferron). Sv. Kem. Tidsks.,1952, 64 , 213-224.
[287] Rydberg, J. Studies on the extraction of metalcomplexes. IX. The distribution of acetylacetonebetween chloroform or hexone and water. Sv. Kem.Tidskr., 1953, 65 , 37-43.
[288] Hök, B. Studies on the extraction of metal complexes.XV. The dissociation constants of salicylic acid, 3,5-dinitrobenzoic acid, and cinnamic acid and thedistribution between chloroform-water and methylisobutyl ketone (hexone)-water. Sv. Kem. Tidskr., 1953,65 , 182-194.
[289] Dyrssen, D. Studies on the extraction of metalcomplexes. XVIII. The dissociation constant andpartition coefficient of tropolone. Acta Chem. Scand.,1954, 8, 1394-1397.
[290] Dyrssen, D.; Dyrssen, M.; Johansson, E. Studies on theextraction of metal complexes. XXXI. Investigation withsome 5,7-dihalogen derivatives of 8-quinolinol. ActaChem. Scand., 1956, 10 , 341- 352.
[291] Hök-Bernström, B. Studies on the extraction of metalcomplexes. XXIII. On the complex formation of thoriumwith salicylic acid, methoxybenzoic acid and cinnamicacid. Acta Chem. Scand., 1956, 10 , 174-186.
[292] Dyrssen, D. Studies on the extraction of metalcomplexes. XXXII. N-phenylbenzohydroxamic acid. ActaChem. Scand., 1957, 10 , 353-359.
[293] Dyrssen, D. Studies on the extraction of metalcomplexes. XXX. The dissociation, distribution, anddimerization of di-n-buty phosphate (DBP). Acta Chem.Scand., 1957, 11 , 1771-1786.
[294] Brändström, A. A rapid method for the determination ofdistribution coefficinet of bases for biological purposes.Acta Chem. Scand., 1963, 17 , 1218-1224.
[295] Korenman, I.M.; Gur'ev, I.A. Acid-base titration in thepresence of extractants. J. Anal. Chem. USSR, 1975, 30 ,1601-1604 (Eng.)
[296] Kaufman, J.J.; Semo, N.M.; Koski, W.S. Micro-electrometric titration measurement of the pKa's andpartition and drug distribution coefficients of narcoticsand narcotic antagonists and their pH and temperaturedependence. J. Med. Chem., 1975, 18 , 647-655.
[297] Johansson, P.-A.; Gustavii, K. Potentiometric titration ofionizable compounds in two phase systems. 2.Determination of partition coefficients of organic acidsand bases. Acta Pharm. Suecica, 1976, 13 , 407-420.
[298] Johansson, P.-A. ; Gustavii, K. Potentiometric titrationof ionizable compounds in two phase systems. 3.Determination of extraction constants. Acta Pharm.Suecica, 1977, 14 , 1-20.
[299] Gur'ev, I.A.; Korenman, I.M.; Aleksandrova, T.G.;Kutsovskaya, V.V. Dual-phase titration of strong acids.J. Anal. Chem. USSR, 1977, 32 , 192-195 (Eng).
[300] Gur'ev, I.A.; Gur'eva, Z.M. Dual-phase titration ofaromatic acids. J. Anal. Chem. USSR, 1977, 32 , 1933-1935 (Eng.)
[301] Gur'ev, I.A.; Kiseleva, L.V. Dual-phase titration ofaliphatic acids in the presence of neutral salts. J. Anal.Chem. USSR, 1978, 33 , 427-430 (Eng.).
[302] Gur'ev, I.A.; Zinina, O.B. Improving conditions fortitrating acids by using dual-phase systems. J. Anal.Chem. USSR, 1978, 33 , 1100-1102 (Eng.).
[303] Gur'ev, I.A.; Gushchina, E.A.; Mitina, E.N. Dual-phasetitration of phenols with an ion selectrive electrode. J.Anal. Chem. USSR, 1979, 34 , 913-916 (Eng.).
[304] Gur'ev, I.A.; Gushchina, E.A.; Gadashevich, M.Z. Dual-phase potentiometric titration of aromatic carboxylicacids with liquid ion selective electrodes. J. Anal. Chem.USSR, 1981, 36 , 803-810(Eng.).
[305] Gur'ev, I.A.; Gushchina, E.A. Use of Extractionparameters to predict the results of the dual-phasetitration of phenolate ions with a liquid ion-slective
Physicochemical Profiling (Solubility, Permeability and Charge State) Current Topics in Medicinal Chemistry, 2001, Vol. 1, No. 4 345
electrode. J. Anal. Chem. USSR, 1982, 37 , 1297-1301(Eng.).
[306] Clarke, F.H. Ionization constants by curve fitting.Application to the determination of partitioncoefficients. J. Pharm. Sci., 1984, 73 , 226-230.
[307] Clarke, F.H.; Cahoon, N.M. Ionization constants by curvefitting: determination of partition and distributioncoefficients of acids and bases and their ions. J. Pharm.Sci., 1987, 76 , 611-620.
[308] Avdeef, A. Fast simultaneous determination of logP andpKa by potentiometry: para-alkoxyphenol series(methoxy to pentoxy). In: Silipo, C.; Vittoria, A. (Eds.).QSAR: Rational Approaches to the Design of BioactiveCompounds, Elsevier: Amsterdam, 1991, pp.119-122.
[309] Avdeef, A. pH-Metric logP. 1. Difference plots fordetermining ion-pair octanol-water partition coefficientsof multiprotic substances. Quant Struct.- Act. Relat.,1992, 11 , 510-517.
[310] Avdeef, A.; Comer, J.E.A. Measurement of pKa and logPof water-insoluble substances by potentiometrictitration. In: Wermuth, C.G. (Ed.). QSAR and MolecularModelling, Escom: Leiden, 1993, pp. 386-387.
[311] Comer, J.E.A. The acid test; ionization and lipophilicityof drugs; influence on biological activity. Chemistry inBritain, 1994, 30 , 983-986.
[312] Clarke, F.H.; Cahoon, N.M. ionization constants by curvefitting: determination of partition and distributioncoefficients of acids and bases and their ions. J. Pharm.Sci., 1994, 83 , 1524. – corrections
[313] Clarke, F.H.; Cahoon, N.M. Potentiametric determinationof the partition and distribution coefficients ofdianionic compounds. J. Pharm. Sci., 1995, 84 , 53-54.
[314] Comer, J.E.A.; Avdeef, A.; Box, K.J. Limits for successfulmeasurement of pKa and logP by pH-metric titration.Amer. Lab., 1995, 4, 36c-36i.
[315] Herbette, L.G.; Vecchiarelli, M.; Trumlitz, G. NSAIDmechanism of action: membrane interactions in the roleof intracellular pharmacokinetics. Eds. Vane, Botting,Botting, 1995, 85-102.
[316] Karajiannis, H.; van de Waterbeemd, H. The Prediction ofthe Lipophilicity of Peptidomimetics. A Comparisonbetween Experimental and Theoretical LipophilicityValues of Renin Inhibitors and the Building Blocks.Pharmaceut. Acta Helv., 1995, 70 , 67-77.
[317] Danielsson, L.-G.; Zhang, Y.-H. Methods for determiningn-octanol-water partition constants. Trends Analyt.Chem., 1996, 15 , 188-196.
[318] Caron, G.; Pagliara, A.; Gaillard, P.; Carrupt, P-A.; Testa,B. Ionization and partitioning profiles of zwitterions:the case of the anti-inflammatory drug azapropazone.Helv. Chim. Acta., 1996, 79 , 1683-1695.
[319] Takács-Novák, K.; Avdeef, A. Interlaboratory study oflogP determination by shake-flask and potentiometricmethods. J. Pharmaceut. Biomed. Anal., 1996, 14 , 1405-1413.
[320] McFarland, J.W.; Berger, C.M.; Froshauer, S.A.; Hayashi,S.F.; Hecker, S.J.; Jaynes, B.H.; Jefson, M.R.; Kamicker,
B.J.; Lipinski, C.A.; Lundy, K.M.; Reese, C.P.; Vu, C.B.Quantitative Structure-Activity Relationships amongMacrolide Antibacterial Agents: In Vitro and in VivoPotency against Pasteurella multocida. J. Med. Chem.,1997, 40 , 1340-1346.
[321] Caron, G.; P. Gaillard, P.;.Carrupt, P.-A.; Testa, B.Lipophilicity behavior of model and medicinalcompounds containing a sulfide, sulfoxide, or sulfonemoiety. Helv. Chim, Acta., 1997, 80 , 449-462.
[322] Herbette, L.G.; Vecchiarelli, M.; Leonardi, A.Lercanidipine: short plasma half-life, long duration ofaction. J. Cardiovasc. Pharmacol., 1997, 29 (Suppl. 1),S19-S24.
[323] Krämer, S.D.; Gautier, J.-C.; Saudemon, P. Considerationson the potentiometric log P determination. Pharm. Res.,1998, 15 , 1310-1313.
[324] Morgan, M.E.; Liu, K.; Anderson, B.D. Microscaletitrimetric and spectrophotometric methods fordetermination of ionization constants and partitioncoefficients of new drug candidates. J. Pharm. Sci., 1998,87 , 238-245.
[325] Caron, G.; Steyaert, G.; Pagliara, A.; Reymond, F.;Crivori, P.; Gaillard, P.; Carrupt, P.-A.; .Avdeef, A.;Comer, J.; Box, K.J.; Girault, H.H.; Testa, B. Structure-lipophilicity realtionships of neutral and protonated _-blockers, part I: intra and intermolecular effects inisotropic solvent systems. Helv. Chim. Acta, 1999, 82 ,1211-1222.
[326] Franke, U.; Munk, A.; Wiese, M. Ionization constants anddistribution coefficients of phenothiazines and calciumchannel antagonists determined by a pH-metric methodand correlation with calculated partition coefficients. J.Pharm. Sci., 1999, 88 , 89-95.
[327] Bouchard, G.; Pagliara, A.; van Balen, G.P.; Carrupt, P.-A.; Testa, B.; Gobry, V.; Girault, H.H.; Caron, G.;Ermondi, G.; Fruttero, R. Ionic partition diagram of thezwitterionic antihistamine cetirizine. Helv. Chim. Acta.,2001, 84 , 375-387.
[328] Leo, A.; Hansch, C.; Elkins, D. Partition coefficients andtheir uses. Chem. Rev., 1971, 71 , 525-616.
[329] Sangster, J. Log KOW Databank. Montreal, Quebec,Canada, Sangster Research Laboratories, 1994.
[330] Howard, P.H.; Meylan, W. PHYSPROP Database, SyracuseResearch Corp.: Syracuse, 2000.
[331] Physicochemical Parameter Database, MedicinalChemisry Project, Pomona College, Claremont, CA, USA.www.biobyte.com/bb/prod/cqsar.html
[332] Krämer, S.D.; Jakits-Deiser, C.; Wunderli-Allenspach, H.Free-fatty acids cause pH-dependent changes in thedrug-lipid membrane interations around thephysiological pH. Pharm. Sci., 1997, 14 , 827-832.
[333] Jonkman, J.H.G.; Hunt, C.A. Ion pair absorption ofionized drugs - fact or fiction? Pharm. Weekblad Sci. Ed.,1983, 5, 41-47.
[334] El Tayar, N.; Tsai, R.-S.; Carrupt, P.-A.; Testa, B. Octan-1-ol-water partition coefficinets of zwitterionic _-aminoacids. Determination by centrifugal partitionchromatography and factorization into steric/

346 Current Topics in Medicinal Chemistry, 2001, Vol. 1, No. 4 Alex Avdeef
hydrophobic and polar components. J. Chem. Soc. PerkinTrans., 1992, 2, 79-84.
[335] Dollery, C. (Ed.). Therapeutic Drugs, 2nd Ed., Vol. 1 & 2,Churchill Livingstone: Edinburgh, 1999.
[336] Wilson, C.G.; Tomlinson, E.; Davis, S.S.; Olejnik, O.Altered ocular absorption and disposition of sodiumcromoglycate upon ion-pair and complex coacervateformation with dodecylbenzyldimethyl- ammoniumchloride. J. Pharm. Pharmacol., 1981, 31 , 749-753.
[337] Megwa, S.A.; Cross, S.E.; Benson, H.A.E.; Roberts, M.S.Ion-pair formation as a strategy to enhance topicaldelivery of salicylic acid. J. Pharm. Pharmacol., 2000,52 , 919-928.
[338] M.S. Mirrlees, M.S.; S.J. Moulton, S.J.; C.T. Murphy;C.T.; P.J. Taylor, P.J. Direct measurement of octanol-water partiton coefficients by high-pressure liquidchromatography. J. Med. Chem., 1976, 19 , 615-619.
[339] Unger, S.H.; Cook, J.R.; Hollenberg, J.S. Simpleprocedure for determining octanol-aqueous partition,distribution, and ionization coefficients by reverse-phase high-pressure liquid chromatography. J. Pharm.Sci., 1978, 67 , 1364-1366.
[340] Terada, H.; Murayama, W.; Nakaya, N.; Nunogaki, Y.;Nunogaki, K.-I. Correlation of hydrophobic parametersof organic compounds determined by centrifugalpartition chromatography with partiotion coefficientsbetween octanol and water. J. Chromatog., 1987, 400,343-351.
[341] El Tayar, N.; Tsai, R.-S.; Vallat, P.; Altomare, C.; Testa, B.Measurement of partition coefficients by variouscentrifugal partition chromatographic techniques. Acomparative evaluation. J. Chromatogr., 1991, 556, 181-194.
[342] Tsai, R.-S.; El Tayar; N.; Carrupt, P.-A.; Testa, B.Physicochemical properties and transport behavior ofpiribedil: considerations on its membrane-crossingpotential Int. J. Pharm., 1992, 80 , 39-49.
[343] Loidl-Stahlhofen, A.; Eckert, A.; Hartmann, T.; Schöttner,M. Solid-supported lipid membranes as a tool fordetermination of membrane affinitity: high-throughputscreening of a physicochemical parameter. J. Pharm. Sci.,2001, 90 , 599-606.
[344] Cevc, G. (Ed.), Phospholipid Handbook, Marcel Dekker,Inc.: New York, 1993.
[345] Miyoshi, H.; Maeda, H.; Tokutake, N.; Fujita, T.Quantitative analysis of partition behavior ofsubstituted phenols from aqueous phase into liposomesmade of lecithin and various lipids. Bull. Chem. Soc.Jpn., 1987, 60 , 4357-4362.
[346] Escher, B.I.; Schwarzenbach, R.P. Partitioning ofsubstituted phenols in liposome-water, biomembrane-water, and octanol-water systems. Environ. Sci. Tech.,1996, 30 , 260-270.
[347] Escher, B.I.; Snozzi, M.; Schwarzenbach, R.P. Uptake,Speciation, and Uncoupling Activity of SubstitutedPhenols in Energy Trasducing Membranes. Environ. Sci.Technol., 1996, 30 , 3071-3079.
[348] Escher, B.I.; Hunziker, R.; Schwarzenbach, R.P.; Westall,J.C. Kinetic Model to Describe the Intrinsic UncouplingActivity of Substituted Phenols in Energy TransducingMembranes. Environ. Sci. Technol., 1999, 33 , 560-570.
[349] Balon,K.; Mueller, B.W.; Riebesehl, B.U. Determinationof Liposome Partitioning of Ionizable Drugs byTitration. Pharm. Res., 1999, 16 , 802-806.
[350] Balon,K.; Mueller, B.W.; Riebesehl, B.U. Drug LiposomePartitioning as a Tool for the Prediction of HumanPassive Intestinal Absorption. Pharm. Res., 1999, 16 ,882-888.
[351] Fruttero, R.; Caron, G.; Fornatto, E.; Boschi, D.; Ermondi,G.; Gasco, A.; Carrupt, P.-A.; Testa, B. Mechanism ofliposome/water partitioning of (p-methylbenzyl)alkylamines. Pharm. Res., 1998, 15 , 1407-1413.
[352] Allan, D. Mapping the lipid distribution in themembranes of BHK cells. Molec. Mem. Biol., 1996, 13 ,81-84.
[353] Hope, M.J.; Bally, M.B.; Webb, G.; Cullis, P.R.Production of large unilamellar vesicles by a rapidextrusion procedure. Characterization of sizedistribution, trapped volume and ability to maintain amembrane potential. Biochim. Biophys. Acta., 1985, 812,55-65.
[354] Mayer, L.D.; Hope, M.J.; Cullis, P.R.; Janoff, A.S. Solutedistributions and trapping efficiencies observed infreeze-thawed multilamellar vesicles. Biochim. Biophys.Acta., 1985, 817, 193-196.
[355] Mayer, L.D.; Bally, M.B.; Hope, M.J.; Cullis, P.R.Techniques for encapsulating bioactive agents intoliposomes. Chem. Phys. Lipids, 1986, 40 , 333-345.
[356] Perkins, W.R.; Minchey, S.R.; Ahl, P.H.; Janoff, A.S. Thedetermination of liposome captured volume. Chem. Phys.Lipids, 1993, 64 , 197-217.
[357] Lasic, D.D.; Needham, D. The "stealth" liposome. Aprototypical biomaterial. Chem. Rev., 1995, 95 , 2601-2628.
[358] Davis, S.S.; James, M.J.; Anderson,N.H. The distributionof substituted phenols in lipid vescles. Faraday Discuss.Chem. Soc., 1986, 81 , 313-327.
[359] Bäuerle, H.-D.; Seelig, J. Interaction of charged anduncharged calcium channel antagoninsts withphospholipid membranes. Binding equilibrium, bindingenthalpy, and membrane location. Biochemistry, 1991,30 , 7203-7211.
[360] Miyazaki, J.; Hideg, K.; Marsh, D. Inerfacial ionizationand partitioning of membrane-bound local anesthetics.Biochim. Biophys. Acta, 1992, 1103, 62-68.
[361] Thomas, P.G.; Seelig, J. Binding of the calciumantagonist flunarizine to phosphatidylcholine bilayers:charge effects and thermodynamics. Biochem. J., 1993,291, 397-402.
[362] Wenk, M.R.; Fahr, A.; Reszka, R.; Seelig, J. Paclitaxelpartitioning into lipid bilayers. J. Pharm. Sci., 1996, 85 ,228-231.
[363] Yeagle, P.L.; Hutton, W.C.; Huang, C.-H.; Martin, R.B.Headgroup conformation and lipid- cholesterol

Physicochemical Profiling (Solubility, Permeability and Charge State) Current Topics in Medicinal Chemistry, 2001, Vol. 1, No. 4 347
association in phosphatidylcholine vesicles: a 31P{1H}nuclear Overhauser effect study. Proc. Nat. Acad. Sci.,1975, 72 , 3477-3481.
[364] Gur, Y.; Ravina, I.; Babchin, A.J. On the electrical doublelayer theory. II. The Poisson-Boltzman equationincluding hydration forces. J. Colloid Inter. Sci., 1978,64 , 333-341.
[365] Brown, M.F.; Seelig, J. Influence of cholesterol on thepolar region of phosphatidylcholine and phos-phatidylethanolamine bilayers. Biochemistry, 1978, 17 ,381-384.
[366] Eisenberg, M.; Gresalfi, T.; Riccio, T.; McLaughlin, S.Adsorption of monovalent cations to bilayer membranescontaining negative phospholipids. Biochemistry, 1979,18 , 5213-5223.
[367] Cevc, G.; Watts, A.; Marsh, D. Titration of the phasetransition of phosphatidylserine bilayer membranes.Effects of pH, surface electrostatics, ion binding, andhead group hydration. Biochemistry, 1981, 20 , 4955-4965.
[368] Rooney, E.K.; Lee, A.G. Binding of hydrophobic drugs tolipid bilayers and to the (Ca2+ + Mg2+)- ATPase. Biochim.Biophys. Acta., 1983, 732, 428-440.
[369] Cevc, G.; Marsh, D. Properties of the electrical doublelayer near the interface between a charged bilayermembrane and electrolyte solution: experiment vs.theory. J. Phys. Chem., 1983, 87 , 376-379.
[370] Cevc, G. Membrane Electrostatics. Biochim. Biophys.Acta., 1990, 1031, 311-382.
[371] McLaughlin, S. Electrostatic potentials at membrane-solution interfaces. Curr. Top. Membr. Transport., 1977,9, 71-144.
[372] Shinitzky, M. (Ed.), Biomembranes: Physical Aspects,VCH: Weinheim, 1993.
[373] Biegel, C.M.; Gould, J.M. Kinetics of hydrogen iondiffusion across phospholipid vesicle membranes.Biochemistry, 1981, 20 , 3474-3479.
[374] Perkins, W.R.; Cafiso, D.S. An electrical and structuralcharacterization of H+/OH- currents in phospholipidvesicles. Biochemistry, 1986, 25 , 2270-2276.
[375] Meier, E.M.; Schummer, D.; Sandhoff, K. Evidence for thepresence of water within the hydrophobic core ofmembranes. Chem. Phys. Lipids., 1990, 55 , 103-113.
[376] Nagle, J.F. Theory of passive proton conductance inlipid bilayers. J. Bioenerg. Biomem., 1987, 19 , 413-426.
[377] Gutknecht, J. Proton conductance through phospholipidbilayers: water wires or weak acids. J. Bioenerg. Biomem.,1987, 19 , 427-442.
[378] Redelmeier, T.E.; Mayer, L.D.; Wong, K.F.; Bally, M.B.;Cullis, P.R. Proton flux in large unilamellar vesicles inresponse to membrane potentials and pH gradients.Biophys. J., 1989, 56 , 385- 393.
[379] Norris, F.A.; Powell, G.L. The apparent permeabilitycoefficient for proton flux through phosphatidylcholinevesicles is dependent on the direction of flux. Biochim.Biophys. Acta., 1990, 1030, 165-171.
[380] Madden, T.D.; Harrigan, P.R.; Tai, L.C.L.; Bally, M.B.;Mayer, L.D.; Redelmeier, T.E.; Loughrey, H.C.; Tilcock,C.P.S.; Reinish, L.W.; Cullis, P.R. The accumulation ofdrugs within large unilamellar vesicles exhibiting aproton gradient: a survey. Chem. Phys. Lipids., 1990, 53 ,37-46.
[381] Lee, R.J.; Wang, S.; Low, P.S. Measurement of endosomepH following folate receptor-mediated endocytosis.Biochim. Biophys. Acta., 1996, 1312, 237-242.
[382] Boulanger, Y.; Schreier, S.; Leitch, L.C.; Smith, I.C.P.Multiple binding sites for local anesthetics inmembranes: characterization of the sites and theirequilibria by deuterium NMR of specifically deuteratedprocaine and tetracaine. Can. J. Biochem., 1980, 58 , 986-995.
[383] Boulanger, Y.; Schreier, S.; Smith, I.C.P. Moleculardetails of anesthetic-lipid interaction as seen bydeuterium and phosphorus-31 nuclear magneticresonance. Biochemistry, 1981, 20 , 6824-6830.
[384] Westman, J.; Boulanger, Y.; Ehrenberg, A.; Smith, I.C.P.Charge and pH dependent drug binding to modelmembranes: a 2H-NMR and light absorption study.Biochim. Biophys. Acta., 1982, 685, 315- 328.
[385] Kelusky, E.C.; Smith, I.C.P. Anethetic-membraneinteraction: a 2H nuclear magnetic resonance study of thebinding of specifically deuterated tetracaine andprocaine to phosphatidylcholine. Can. J. Biochem. CellBiol., 1984, 62 , 178-184.
[386] Schreier, S.; Frezzatti, W.A. Jr.; Araujo, P.S.; Chaimovich,H.; Cuccovia, I.M. Effect of lipid membranes on theapparent pK of the local anesthetic tetracaine: spin labeland titration studies. Biochim. Biophys. Acta., 1984, 769,231-237.
[387] Trumbore, M.; Chester, D.W.; Moring, J.; Rhodes, D.;Herbette, L.G. Structure and location of amiodarone in amembrane bilayer as determined by molecular mechanicsand quantitative X-ray diffraction. Biophys. J., 1988, 54 ,535-543.
[388] Mason, R.P.; Campbell, S.F.; Wang, S.-D.; Herbette, L.G.Comparison of location and binding for the positivelycharged 1,4-dihydropyridine calcium channelantagonist amlopidine with uncharged drugs of thisclass in cardiac membranes. Molec. Pharmacol., 1989,36 , 634-640.
[389] Mason, R.P.; Rhodes, D.G.; Herbette, L.G. Reevaluatingequilibrium and kinetic binding parameters forlipophilic drugs based on a structural model for druginteraction with bilogical membranes. J. Med. Chem.,1991, 34 , 869-877.
[390] Herbette, L.G.; Rhodes, D.R.; Mason, R.P. Newapproaches to drug design and delivery based on drug-membrane interactions. Drug Design and Delivery, 1991,7, 75-118.
[391] Chatelain, P.; Laruel, R. Amiodarone partitioning withphospholipid bilayers and erythrocyte membranes. J.Pharm. Sci., 1985, 74 , 783-784.
[392] Betageri, G.V.; Rogers, J.A. Thermodynamics ofpartitioning of ß-blockers in the n-octanol buffer andliposome systems. Int. J. Pharm., 1987, 36 , 165-173.

348 Current Topics in Medicinal Chemistry, 2001, Vol. 1, No. 4 Alex Avdeef
[393] Choi, Y.W.; Rogers, J.A. The liposome as a modelmembrane in correlations of partitioning with α-adrenoreceptor against activities. Pharm. Res., 1990, 7,508-512.
[394] Rogers, J.A.; Choi, Y.W. The liposome partitioningsystem for correlating biological activities forimidazolidine derivatives. Pharm. Res., 1993, 10 , 913-917.
[395] Alcorn, C.J.; Simpson, R.J.; Leahy, D.E.; Peters, T.J.Partition and distribution coefficients of solutes anddrugs in Brush Border membrane vesicles. Biochem.Pharmacol., 1993, 45 , 1775-1782.
[396] Smejtek, P.; Wang, S. Distribution of hydrophobicionizable xenobiotics between water and lipidmembrane: pentachlorophenol and pentachlorophenate.A comparison with octanol-water partition. Arch.Environ. Contamination Toxicol., 1993, 25 , 394-404.
[397] Pauletti, G.M.; Wunderli-Allenspach, H. Partitioncoefficients in vitro : artificial membranes as astandardized distribution model. Eur. J. Pharm. Sci.,1994, 1, 273-281.
[398] Krämer, S.D.; Jakits-Dieser, C.; Wunderli-Allenspach, H.Free fatty acids cause pH-dependent changes in drug-lipid membrane interactions around physiological pH.Pharm. Res., 1997, 14 , 827-832.
[399] Ottiger, C.; Wunderli-Allenspach, H. Partition behaviorof acids and bases in a phosphatidylcholine liposome-buffer equilibrium dialysis system. Eur. J. Pharm. Sci.,1997, 5, 223-231.
[400] Krämer, S.D.; Braun, A.; Jakits-Dieser, C.; Wunderli-Allenspach, H. Towards the predictability of drug-lipidmembrane interactions: the pH-dependent affinity ofpropranolol to phosphatidyliniositol containingliposomes. Pharm. Rev., 1998, 15 , 739-744.
[401] Xiang, T.-X.; Anderson, B.D. Phospholipid surfacedensity determines the partitioning and permeability ofacetic acid in DMPC:cholesterol bilayers. J. MembraneBiol., 1995, 148, 157-167.
[402] Xiang, T.-X.; Anderson, B.D. Development of a combinedNMR paramagnetic ion-induced line- broadeningdynamic light scattering method for permeabilitymeasurements across lipid bilayer membranes. J. Pharm.Sci., 1995, 84 , 1308-1315.
[403] Austin, R.P.; Davis, A.M.; Manners, C.N. Partitioning ofionized molecules between aqueous buffers andphospholipid vesicles. J. Pharm. Sci., 1995, 54 , 1180-1183.
[404] Austin, R.P.; Barton, P.; Davis, A.D.; Manners, C.N.;Stansfield, M.C. The effect of ionic strength onliposome-buffer and 1-octanol-buffer distributioncoefficients. J. Pharm. Sci., 1998, 87 , 599-607.
[405] Tatulian, S.A. Ionization and ion binding. In: Cevc, G.(Ed.), Phospholipid Handbook, Marcel Dekker, Inc.: NewYork, 1993, pp. 511-550.
[406] [406 ] Miller, K.W.; Yu, S.-C.T. The dependence of thelipid bilayer membrane: buffer partition coefficient ofpentobarbitone on pH and lipid composition. Br. J.Pharmac., 1977, 61 , 57-63.
[407] Kariv, I.; Cao, H.; Oldenburg, K.R. Development of ahigh-throughput equilibrium dialysis method. J. Pharm.Sci., 2001, 90 , 580-587.
[408] Herbette, L.G. 'Pharmacokinetic' and 'pharmacodynamic'design of lipophilic drugs based on a structural modelfor drug interactions with biological membranes. Pestic.Sci., 1992, 35 , 363-368.
[409] Bellemare, F.; Fragata, M. J. Colloid Inter. Sci., 1980, 77 ,243.
[410] Colbow, K.; Chong, C.S. In: Colbow, K. (Ed.). BiologicalMembranes. Simon Fraser Univ.: Burnaby, 1975, p.145.
[411] Fernández, M.S.; Fromherz, P. Lipoid pH indicators asprobes of electrical potential and polarity in micelles. J.Phys. Chem., 1977, 81 , 1755-1761.
[412] Thomas, J.K. Chem. Rev., 1980, 80 , 283.
[413] Iwamoto, K.; Sunamoto, J. Bull. Chem. Soc. Jpn., 1981,54 , 399.
[414] Laver, D.R.; Smith, J.R.; Coster, H.G.L. Biochim. Biophys.Acta., 1984, 772, 1.
[415] Kanashina, S.; Kamaya, H.; Ueda, I. Biochim. Biophys.Acta., 1984, 777, 75.
[416] Lessard, J.G.; Fragata, M. Micropolarities of lipidbilayers and micelles. 3. Effect of monovalent ions onthe dielectric constant of the water-membrane interfaceof unilamellar phosphatidylcholine vesicles. J. Phys.Chem., 1986, 90 , 811-817.
[417] Lee, A.G. Effects of charged drugs on the phase transitiontemperature of phospholipid bilayers. Biochim. Biophys.Acta., 1978, 514, 95-104.
[418] Davis, M.G.; Manners, C.N.; Payling, D.W.; Smith, D.A.;Wilson, C.A. GI absorption for the strongly acidic drugproxicromil. J. Pharm. Sci., 1984, 73 , 949-953.
[419] Bunton, C.A.; Ohmenzetter, K.; Sepulvida, L. Binding ofhydrogen ions to anionic micelles. J. Phys. Chem., 1977,81 , 2000-2004.
[420] Garcia-Soto, J.; Fernández, M.S. The effect of neutral andcharged micelles on the acid-base dissociation of thelocal anesthetic tetracaine. Biochim. Biophys. Acta, 1983,731, 275-281.
[421] Saad, H.Y.; Higuchi, T. Water solubility of cholesterol. J.Pharm. Sci., 1965, 54 , 1205-1206.
[422] Mosharraf, M.; Nyström, C. Solubility characterizationof practically insoluble drugs using the coulter counterprinciple. Int. J. Pharm., 1995, 122, 57-67.
[423] Quartermain, C.P.; Bonham, N.M.;Irwin, A.K. Improvingthe odds – high-throughput techniques in new drugselection. Eur. Pharm. Rev., 1998, 18 , 27-32.
[424] Bevan, C.D.; Lloyd, R.S. A high-throughput screeningmethod for the determination of aqueous drug solubilityusing laser nephelometry in microtitre plates. Anal.Chem., 2000, 72 , 1781-1787.
[425] Pan, L.; Ho, Q.; Tsutsui, K.; Takahashi, L. Comparison ofchromatographic and spectroscopic methods used to

Physicochemical Profiling (Solubility, Permeability and Charge State) Current Topics in Medicinal Chemistry, 2001, Vol. 1, No. 4 349
rank compounds for aqueous solubility. J. Pharm. Sci.,2001, 90 , 521-529.
[426] Hancock, B.C., Zografi, G. Characterization andSignificance of the Amorphous State in PharmaceuticalSystems. J. Pharm. Sci., 1997, 86, 1-12.
[427] Levy, R.H.; Rowland, M., Dissociation Constants ofSparingly Soluble Substances: Nonlogarithmic LinearTitration Curves. J. Pharm. Sci., 1971, 60 , 1155-1159.
[428] Charykov, A.K.; Tal’nikova, T.V., pH-Metric Method ofDetermining the Solubility and Distribution Ratios ofSome Organic Compounds in Extraction Systems. J.Anal. Chem. USSR, 1974, 29 , 818- 822 (Eng.).
[429] Kaufman, J.J.; Semo, N.M.; Koski, W.S.,Microelectrometric Titration Measurement of the pKasand Partition and Drug Distribution Coefficients ofNarcotics and Narcotic Antagonists and their pH andTemperature Dependence. J. Med. Chem., 1975, 18 , 647-655.
[430] W.H. Streng and M.A. Zoglio. Determination of theIonization Constants of Compounds which PrecipitateDuring Potentiometric Titration Using ExtrapolationTechniques. J. Pharm. Sci., 1984, 73, 1410- 1414.
[431] Todd, D.; Winnike, R.A., A rapid method for generatingpH-solubility profiles for new chemical entities. Abstr.9th Ann. Mtng., Amer. Assoc. Pharm. Sci., 1994. SanDiego.
[432] Avdeef, A., pH-Metric Solubility. 1. Solubility-pHProfiles from Bjerrum Plots. Gibbs Buffer and pKa in theSolid State. Pharm. Pharmacol. Commun., 1998, 4, 165-178.
[433] Avdeef, A.; Berger, C.M.; Brownell, C., pH-MetricSolubility. 2. Correlation Between the Acid-BaseTitration and the Saturation Shake-Flask Solubility-pHMethods. Pharm. Res., 2000, 17 , 85-89.
[434] Chowhan, Z.T. pH-Solubility Profiles of OrganicCarboxylic Acids and Their Salts. J. Pharm. Sci., 1978,67, 1257-1260.
[435] Bogardus, J.B.; Blackwood, R.K., Jr., Solubility ofDoxycycline in Aqueous Solution. J. Pharm. Sci., 1979,68 , 188-194.
[436] Ahmed, B.M.; Jee, R.D. The acidity and solubilityconstants of tetracyclines in aqueous solution. Anal.Chim. Acta., 1984, 166, 329-333.
[437] Chiarini, A.; Tartarini, A.; Fini, A. pH-solubilityrelationship and partition coefficients for some anti-inflammatory arylaliphatic acids. Arch. Pharm., 1984,317, 268-273.
[438] Anderson, B.D., Conradi, R.A. Predictive Relationshipsin the Water Solubility of Salts of a Nonsteroidal Anti-Inflammatory Drug. J. Pharm. Sci., 1985, 74, 815-820.
[439] Streng, W.H.; Tan, H.G.H. General treatment of pHsolubility profiles of weak acids and bases. II.Evaluation of thermodynamic parameters from thetemperature dependence of solubility profiles applied toa zwitterionic compound. Int. J. Pharm. 1985, 25, 135-145.
[440] Zimmermann, I. Determination of overlapping pKavalues from solubility data. Int. J. Pharm., 1986, 31 , 69-74.
[441] Garren, K.W., Pyter, R.A. Aqueous solubility propertiesof a dibasic peptide-like compound. Int. J. Pharmaceut.,1990, 63, 167-172.
[442] Islam, M.H.; Narurkar, M.M. Solubility, stability andionization behavior of famotidine. J. Pharm. Pharmacol.,1993, 45 , 682-686.
[443] Streng, W.H.; Yu, D.H.-S. Precision tests of a pH-solubility profile computer program. Int. J. Pharm.,1998, 164, 139-145.
[444] Roseman, T.J.; Yalkowsky, S.H. Physical properties ofprostaglandin F2_(tromethamine salt): solubilitybehavior, surface properties, and ionization constants. J.Pharm. Sci., 1973, 62 , 1680-1685.
[445] Attwood, D.; Gibson, J., Aggregation of AntidepressantDrugs in Aqueous Solution. J. Pharm. Pharmacol., 1978,30 , 176-180.
[446] Streng, W.H.; Yu, D.H.-S.; Zhu, C., Determination ofSolution Aggregation using Solubility, Conductivity,Calorimetry, and pH Measurements. Int. J. Pharm., 1996,135, 43-52.
[447] Zhu, C.; Streng, W.H. Investigation of drug self-association in aqueous solution using calorimetry,conductivity, and osmometry. Int. J. Pharm., 1996, 130,159-168.
[448] Ritschel, W.A.; Alcorn, G.C.; Streng, W.H.; Zoglio, M.A.,Cimetidine-Theophylline Complex Formation. Meth.and Find. Exptl. Clin. Pharmacol., 1983, 5, 55-58.
[449] Li, P.; Tabibi, S.E.; Yalkowsky, S.H. Combined effect ofcomplexation and pH on solubilization. J. Pharm. Sci.,1998, 87 , 1535-1537.
[450] Nuñez, F.A.A.; Yalkowsky, S.H. Solubilization ofdiazepam. J. Pharm. Sci. Tech., 1997, 33-36.
[451] Meyer, J.D. Manning, M.C. Hydrophobic ion pairing:altering the solubility properties of biomolecules.Pharm. Res., 1998, 15 , 188-193.
[452] Narisawa, S.; Stella, V.J. Increased shelf-life offosphenytoin: solubilization of a degradant, phenytoin,through complexation with (SBE)7m-β-CD. J. Pharm. Sci.,1998, 87 , 926-930.
[453] Higuchi, T.; Shih, F.-M.L.; MKimura, T.; Rytting, J.H.,Solubility Determination of Barely Aqueous SolubleOrganic Solids. J. Pharm. Sci., 1979, 68 , 1267-1272.
[454] Venkatesh, S.; Li, J.; Xu, Y.; Vishnuvajjala, R.; Anderson,B.D. Intrinsic Solubility Estimation and pH-SolubilityBehavior of Cosalane (NSC 658586), and ExtremelyHydrophobic Diprotic Acid. Pharm. Res., 1996, 13 ,1453-1459.
[455] Badwan, A.A.; Alkaysi, H.N.; Owais, L.B.; Salem, M.S.;Arafat, T.A. Terfenadine. Anal. Profiles Drug Subst.,1990, 19 , 627-662.
[456] Streng, W.H., Hsi, S.K., Helms, P.E., Tan, H.G.H. GeneralTreatment of pH-Solubility Profiles of Weak Acids and
350 Current Topics in Medicinal Chemistry, 2001, Vol. 1, No. 4 Alex Avdeef
Bases and the Effect of Different Acids on the Solubilityof a Weak Base. J. Pharm. Sci., 1984, 73 , 1679-1684.
[457] Miyazaki, S.; Oshiba, M.; Nadai, T. Precaution on use ofhydrochloride salts in pharmaceutical formulation. J.Pharm. Sci., 1981, 70 , 594-596.
[458] Ledwidge, M.T.; Corrigan, O.I. Effects of Surface ActiveCharacteristics and Solid State Forms on the pHSolubility Profiles of Drug-Salt Systems. Int. J. Pharm.,1998, 174, 187-200.
[459] Jinno, J.; Oh, D.-M.; Crison, J.R.; Amidon, G.L.Dissolution of ionizable water-insoluble drugs: thecombined effect of pH and surfactant. J. Pharm. Sci.,2000, 89 , 268-274.
[460] Mithani, S.D.; Bakatselou, V.; TenHoor,C.N.; Dressman,J.B. Estimation of the increase in solubility of drugs as afunction of bile salt concentration. Pharm. Res., 1996,13 , 163-167.
[461] Anderson, B.D., Flora, K.P. Preparation of water-solublecompounds through salt formation. In: Wermuth, C.G.(Ed.), The Practice of Medicinal Chemistry. AcademicPress, London, 1996, pp. 739-754.
[462] Engel, G.L.; Farid, N.A.; Faul, M.M.; Richardson, L.A.;Winneroski, L.L. Salt selection and characterization ofLY333531 mesylate monohydrate. Int. J. Pharm., 2000,198, 239-247.
[463] S.H. Yalkowsky, R.-M. Dannenfelser (Eds.), “AQUASOLdATAbASE of Aqueous Solubility”, 5th ed., 1998,College of Pharmacy, Univ. of Arizona, Tucson, AZ85721.
[464] Abraham, M.H.; Le, J. The correlation and prediction ofthe solubility of compounds in water using an amendedsolvation energy relationship. J. Pharm. Sci., 1999, 88 ,868-880.
[465] Hidalgo, I.J.; Kato, A.; Borchardt, R.T. Binding ofepidermal growth factor by human colon carcinoma cell(Caco-2) monolayers. Biochem. Biophys. Res. Commun.,1989, 160, 317-324.
[466] Artursson, P. J. Epithelial transport of drugs in cellculture. I: a model for studying the passive diffusion ofdrugs over intestinal absorptive (Caco-2) cells. Pharm.Sci., 1990, 79 , 476-482.
[467] Hilgers, A.R.; Conradi, R.A.; Burton, P.S. Caco-2 cellmonolayers as a model for drug transport across theintestinal mucosa. Pharm. Res., 1990, 7, 902-910.
[468] Mueller, P.; Rudin, D.O.; Tien, H.T.; Westcott, W.C.Reconstitution of cell membrane structure in vitro andits transformation into an excitable system. Nature,1962, 194, 979-980.
[469] Gutknecht, J.; Tosteson, D.C. Diffusion of weak acidsacross lipid membranes: effects of chemical reactions inthe unstirred layers. Science, 1973, 182, 1258-1261.
[470] Gutknecht, J.; Bisson, M.A.; Tosteson, F.C. diffusion ofcarbon dioxide through lipid bilayer membranes. Effectsof carbonic anhydrase, bicarbonate, and unstirred layers.J.Gen.Physiol., 1977, 69 , 779-794.
[471] Walter, A.; Gutknecht, J. J. Mem. Biol., 1984, 77 , 255-264. Monocarboxylic Acid Permeation Through Lipid
Bilayer Membranes. carboxylic acids, UWL from pHdependence
[472] Xiang, T.-X.; Anderson, B.D. Substituent contributionsto the transport of substituted p-toluic acids across lipidbilayer membranes. J. Pharm. Sci., 1994, 83 , 1511-1518.
[473] Mountz, J.M.; Tien, H.T. Photoeffects of pigmented lipidmembranes in a micropourous filter. Photochem.Photobiol., 1978, 28 , 395-400. polycarbonate filters,stabilized
[474] Thompson, M.; Lennox, R.B.; McClelland, R.A. Structureand Electrochemical Properties of Microfiltration Filter-Lipid Membrane Systems. Anal. Chem., 1982, 54 , 76-81.
[475] Cools, A.A.; Janssen, L.H.M. Influence of sodium ion-pair formation on transport kinetics of warfarin throughoctanol-impregnated membranes. J. Pharm. Pharmacol.,1983, 35 , 689-691.
[476] Camenisch, G.; Folkers, G.; van de Waterbeemd, H.Comparison of Passive Drug Transport through Caco-2Cells and Artificial Membranes. Int. J. Pharmaceut.,1997, 147, 61-70.
[477] Kansy, M.; Senner, F.; Gubernator, K. PhysicochemicalHigh Throughput Screening: Parallel ArtificialMembrane Permeability Assay in the Description ofPassive Absorption Processes. J. Med. Chem., 1998, 41 ,1007-1010.
[478] Zhu, C.; Chen, T.-M.; Hwang, K. A comparative study ofparallel artificial membrane permeability assay forpassive absorption screening. In: CPSA2000: TheSymposium on Chemical and Pharmaceutical StructureAnalysis. Milestone Development Services. Princeton,NJ, 26-28 Sept. 2000.
[479] Kansy, M.; Fischer, H.; Kratzat, K.; Senner, F.; Wagner,B.; Parrilla, I. High-throughput aritificial membranepermeability studies in early lead discovery anddevelopment. In: Testa, B., van de Waterbeemd, H.,Folkers, G., Guy, R. (Eds.), PharmacokineticOptimization in Drug Research, Verlag HelveticaChimica Acta: Zürich and Wiley - VCH: Weinheim, 2001,pp. 447-464.
[480] Wohnsland, F.; Faller, B. High-throughput permeabilitypH profile and high-throughput alkane/water log P withartificial membranes. J. Med. Chem., 2001, 44 , 923-930.
[481] Hwang, K. Predictive artificial membrane technology forhigh throughput screening. In: New Technologies toIncrease Drug Candidate Survivability Conference. SRInstiture. 17-18 May 2001, Somerset, NJ.
[482] Avdeef, A.; Strafford, M.; Block, E.; Balogh, M.P.;Chambliss, W.; Khan, I. Drug Absorption In VitroModel: Filter-Immobilized Artificial Membranes. 2.Studies of the Permeability Properties of Lactones inPiper methysticum Forst. (submitted).
[483] Wils, P.; Warnery, A.; Phung-Ba, V.; Legrain, S.;Scherman, D. high lipophilicity decreases drug transportacross intestinal epithelial cells. J. Pharmacol. Exp.Ther., 1994, 269, 654-658.
[484] Sawada, G.A., Barsuhn, C.L., Lutzke, B.S., Houghton,M.E., Padbury, G.E., Ho, N.F.H., Raub, T.J. Increasedlipophilicity and subsequent cell partitioning decrease
Physicochemical Profiling (Solubility, Permeability and Charge State) Current Topics in Medicinal Chemistry, 2001, Vol. 1, No. 4 351
passive transcellular diffusion of novel, highlylipophilic antioxidants. J. Pharmacol. Exp. Ther., 1999,288, 1317-1326.
[485] Hennesthal, C.; Steinem, C. Pore-Spanning LipidBilayers Visualized by Scanning Force Microscopy. J.Amer. Chem. Soc., 2000, 122, 8085-8086. bilayersspanning the pores of porous alumina substrate
[486] Lichtenberg, D. Micelles and Liposomes. In: Shinitzky,M. (Ed.), Biomembranes: Physical Aspects, VCH:Weinheim, 1993, pp. 63-96.
[487] Lamson, M.J.; Herbette, L.G.; Peters, K.R.; Carson, J.H.;Morgan, F.; Chester, D.C.; Kramer, P.A. Effects ofhexagonal phase induction by dolichol onphospholipid membrane permeability and morphology.Int. J. Pharm., 1994, 105, 259-272.
[488] Henis, Y.I. Lateral and Rotational Diffusion inBiological Membranes. In: Shinitzky, M. (Ed.),Biomembranes: Physical Aspects, VCH: Weinheim,1993, pp. 279-340.