Chapter IV -...
84
Chapter IV
Transcript of Chapter IV -...

Chapter IV

4.0 INTRODUCTION
This chapter has two sections:-Section A and Section B. Section A gives
a ~ ' ~ n ~ e p t ~ a l frame-work of public distribution system (PDS) in India covering
a gamut of issues namely role and importance of PDS, its essential features, PDS
food access to poor, its impdct on poverty, relative shares of different food items
in PDS sales, diversion of PDS commodities and changing role of PDS. Section
B confines to PDS in Andhra pradesh covering its various dimensions like
procurement and distribution of commodities through PDS, its effectiveness and
views of fair price shop dealers on functioning of fair price shops.
SECTION - A : PDS IN INDIA
4.1 PUBLIC DISTRIBUTION SYSTEM (PDS) : CONCEPTUAL FRAME
WORK
PDS can be distingllished from private distribution in terms of control
exercised by public authority and the motive predominantly being social welfare
in contrast to private gain. Broadly, the system includes all the agencics rhat are
inv01ved from procurement stage to the final delivery of the goods to the
consumer. The agencies that are involved in the process of procurement,
transportation, storage and distribution are Food Corporation of India, state level
Civil Supply Departments 1 Corporations and fair price shops. The Fair Price
Shops (FPS) are the last link in this process which are mostly owned by privare
individuals. Hence, the most important aspect that distinguishes PDS is the
involvement of government agencies and government control over the entire
distribution In its narrow connutitlio~l, PDS is identilied with fair price

shops. Dholakia and Khurana defined il as "a retailing system supervid and
guided by the state'I2. Programme Evaluation Organisation ((301% 1985) defmes
PDS as a set-up under which specified commodities of everyday use are pmcunad
and made available to consumers through a network of FPS in urban as well as
rural areas".
Procurement of cereal is undertaken by Food Corporation of India (FCI)
on behalf of central government. Some state government agencies also procure
grain for the central as well as on their own account. Allocation to deficit
states are made by the central government. The state level civil supply
organisations undertake the responsibility of allotment of FPS and supervising the
functioning of FPS. Pair price shops are subject to government control. FPS are
not allowed to sell other than government supplied essential commodities.
Specified quantities are allotted to each FPS depending upon the number of ration
cards attached to the FPS. The prices of these essential commodities are fixed by
the government. The FPS dealer has to procure a license to operate a shop and
is required to maintain proper records, accounting for the stocks lifted by the
dealer . 3
The PDS, as it is known now in India, has evolved over a long time. When
government intervention was introduced in 1940, the distribution wra effected
through ration shops. In urban areas statutory rationing was implemented in some
years. Otherwise, the system is informal rationing in rural and urban areas without
any commitment on the part of the government as to the minimum per capita
supply (ration entitlement) or regularity of supply. At the beginning of Fourth
Five-Year Plan the system of supplying cereals through ration shops or fair price
shops came to be called PDS. In recent years [he scope and coverage of PDS hu
increased.

4.2 THE ROLE OF PDS
The role assigned to PDS in the management of food economy determines
the nature of PDS operations. Tracing b e evolution of foodgrains policy and
various measures used by the government to achieve the foodgrains policy
objectives, Gupta, (1977) points out that PDS lacks clarity in so far as
government failed to delhiit the relative roles of PDS and buffer stocks. He
points out that PDS may be used as an "Operational arm" of buffer stocks policy
or "PDS as a mother policy to play a broader role defined for itself but at the
same time maintaining its operational links with the buffer s~herne".~
The role of PDS is allowed to overlap with the role of buffer scheme. The
buffer scheme is classified under three headings :
(1) Producer-oriented buffer scheme (POBS)
(2) Consumer-oriented buffer scheme (COBS)
(3) Dual-oriented buffer scheme (DOBS)
From the analysis of the buffer scheme, it is concluded that buffer stocks
policy cannot deliver the desired results in terms of the twin objectives of farm
income stabilization and foodgrain prices and consumption stabilization; that
without imports, prices and consumption cannot be stabilized, and that buffer
stocks are more advantageous lo the richer sections of the population. Thus, thcre
are proposed two broad approaches to PDS:
(1) To nisurr sutficienr supply through impor~s, if necessary, to maintain
stable prices; and
(2) To provide a statutory protective umbrella to the most vulnerable sections
of the population.
Conceptually, the objectives and functions of PDS and buffer stocks are
entirely independent of e a h other. One of them can be operated without the
other. Moreover, whether government used PDS as an operational arm of buffer
stocks or as a 'mother policy' cannot be established with any certainty. This is
because all the relevant magnitudes are allowed to change haphazardly which may
be the result of 'ad-hocism' and 'administrative decision making'. On the basis
of the assigned role of PDS, its viability has been ascertained through an
economic model. The results indicate the impossibility of achieving its assigned
role and hence, suggests a 'compromise approach' of extending a statutory
rationing scheme for the urban areas.
4.3 IMPORTANCE OF PDS
Despite a comfortable foodgrain production in the country through the
introduction of 'modem agricultural technology, one finds the persistence of
poverty and a sizeable proportion of people are still malnourished. In such a
situation, where the production levels are growing but the existence of poverty is
unabated, a proper distribution of the available fwdgrains plays e crucial role to
ease-out the poverty situation reasonably.

The consideration of equitable distribu~iun has bern h e major ohjwcde of
the planning in our country: This has also been one of the major considerations
for all the less developed countries. Despite the continuous efforts made during
the post-independence period, our di$tribution system has remained inequities. In
a country like ours, where the incidence of poverty is very high, the distribution
of the basic goods is of permanent importance. The system of distribution of
essential commodities in various f o w to the vulnerable sections of tbe society
had been in vogue even before the independence. Due to the lack of efficiency
in the distribution system, the stated goals have not been fully achieved.
Prevalence of hunger and malnourishment in the country have betn
common phenomena. Hence, there is a need for the government to protect the
poor from the hunger by means of providing the main staple foods (rice, wheat,
etc.) and the other essential goods. If there is no intervention by the state in
providing these essential goods, only a few people (rich) can afford to purchase
from the open market and the others are forced to have either no food or less than
subsistence level. Therefore, proper distribution of basic goods of food and other
essential goods is an important objective of the Public Distribution S~stern.~
"A PDS is the whole or part of the distribution system in principle owned
and controlled by the public authorities on behalf of the g e m ! public and run
by them for the good of the general public of specific group there of".Vb
public distribut~on system is an important feature of allnost all the developing
countries. The concept of public distribution system in India has some sptcifu:
connotations. It is not a system of distribution under public ownership as in the
case of many socialist countries, nor it is an independent system of consumer co-
operation of the type found in the Scandinavian countries. The public distribution
system in India is a retailing system supervised md guided by the state.

4.4 ESSENTIAL FEATURES OF PDS
The main features of the public distribution system in India have been as
follows7.
( 1 ) It is a system of distribution of selected essential goods through the fair price shops (commonly known as ration shops) or co-operatives which are
operated by private dealers under the government's control and direction.
(2) Rice, wheat and sugar have continued to occupy a predominant position throughout period. The other impartant items are kerosene, edible oil, etc.
(3) The working of the PDS does not in any way hinder the functioning of the
free market mechanism exc&t in the limited statutory rationing areas but
works along with it. Hence, this can be viewed as a 'mixed economy' in the essential commodities. Consumers are left free either to purchase
through FPSs or in the open market.
(4) The required amounts of food grains and other items are obtained by the government through internal procurement andlor through imports and r buffer stock is maintained with a view to meet scarcity situation, The government feeds the PDS with supplies, bears the cost of subsidy, decides as to which goods to supply, at what rates, what is amount to be sold pf3 head or per family, etc.
(5 ) The aim is to provide at least a basic minimum quantity of essential items at reasonable price specialty to the more 'vulnerable sections' of
population and also to sfabilise their o p n market prices or at least lo
prevent an undue rise in such prices under conditions of shortage. The prices charged are usually lower than market prices and also lower rhaa the procurement and o$er costs incurred by the government.

(6) 11 has been prin;arily an urban oriented system. "Its genesis as well as growth has been in those sensitive urban areas where shortages of foodgrains and other essential commodities could become a politiical
liability for the government. The initial urban bias of the PDS has been
somewhat mitigated in recent years, but it continues to determine a dominant character of the commodity mix as well as distribution points of
the PDS8.
The public distribution policy has been designed and implemented by both
the central and state governments. Central govenunent mainly deals with the
buffer stocking operation (through FCI) and also c~ntrols the external and internal
trade of foodgrains. The central government through its procurement activity tries
to even out the differences of surplus and deficit foodgrains producing states.
Though the union government procures some amount from surplus states and in
turn gives a lesser amount to them from the quantity collected for the central pool
as per the public distribution requirements, the states are not restricted from
procuring additional quantities, either from the farmers or from rice millers etc.,
to fulfil their own additional cornmi~ents. Andhra Pradesh is an example in this
regard which procures simultaneously along with the FCI's procurement ha the
rice millers at negotiated prices. The distribution through the fair price shops L
left for the stategovernments and the Department of Food or Department of Civil
Supplies which will take care of the distribution process. Andhra Pradesb is one
of the few to extend the PDS coverage extensively t the lllral areas. It has beell
efftrctively implemented in the state in the reccnt period. Hence, it is interesting
to see the case of Andhm Pradesh which is a rice surplus state, in compari~n
with the other states in 1ndG.
232

4.5 FOOD TRENDS AND PUBLIC DISTRIBUTION SYSTEM
The rate of expansion of household demand far fbod items in the next
fifteen years will vary across the food items. While the annual growdl wauM nut be more than 2.5 per cent for cereals, it will be 4 per cent for milk and milk
products, and around 3.5 per cent for meat and fish and gur, fruits and
vegetables (see table 4.1).It is clear from the table that contribution of population
to increase in cereal demand is very significant and it accounts for more than
three-fourths of the increase. In general, the rate of growth of c e d demand
tends to decline aad stabilises at the level of population growth
Source: Radhakrishna and Ravi, Public Distriburion:, A National and International Perspective, World Bank Dixussion Paper No.200, 1990.
Table 4.1 Compound Annual Growth Rates in
Household Demand Projections for All India 1Rr ccni)
Commodity Groups Per capita Demand I Aggregate Lhand ,
1995-2000 1 2000.2010 1 1995-2000 1 2000.201Q *

The other demand sources for cereals are seed, feed and iJldusuial wes;
these together accounted for about 12.5 per cent of cereal production in 1993.
Since the area under cereals is likely to remain constant, growth of cereal demand
for seeds, which formed about 3 per cmt of cereal distribution, will be
insignificant. Feed demand which constituted about 6 per cent of the cereal
production is likely to be influenced by the growth rate of consumption of milk
and milk products and meat, eggs and fish (i.e., 3-4 per cent per annum). Since
cereals may replace other types of feed, the demand for cereals for feed may grow
at a higher rate than that of the total feed demand. Taking into consideration all
aspects, a maximum growth rate of 3.5 per cent can be assumed for non-
household cereals demand, while the growth rate of national demand (household
+non-household) can be assumed at 2.45 per cent during 1995-2000 and at 2.24
per cent during 2000-2010. Even if growth is more successful in reducing
poverty, the growth of cereal demand may not exceed the above rates to any
degree.9
4.6 PDS SUPPLIES IN INDIA
PDS supplies have increased rapidly since the mid-sixties; the annual
average supply increased from 6.5 million tonnes during 1961 -65 to 18.4 million
tonnes during 1990-92 and accounted for about 13 per cent of ;he averngs annual
net availability during 1986-89. A noteworthy feature is the rt?spoIUPe of
government supply to fluctuations in production; it is higlttr in drought years thlrn
in normal ones. For instance, in 1979-80 and 1987-88, the years associated with
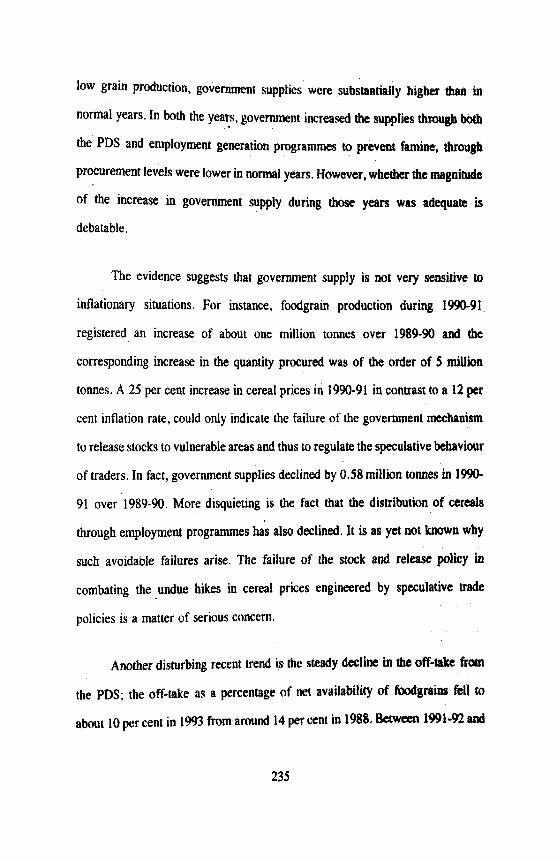
low grain production, government supplies were substantially higher thaa in
normal Years. In both the years, government increased the supplies through boQ
the PDS and employment generation programmes to prevent famine, through
procurement levels were lower in normal years. However, whetha the magnitude
of the increase in government supply during those yean was dbquatt is
debatable.
The evidence suggests that government supply is not very sensitive to
inflationary situations. For instance, foodgrain production during 1990-93
registered an increase of about one million tonnes over 1989-90 and the
corresponding increase in the quantity procured was of the order of 5 million
tonnes. A 25 per cent increase in cereal prices in 1990-91 in contrast to a 12 per
cent inflation rate, could only indicate the failure of the government mechanism
to release stocks to vulnerable areas and thus to regulate the speculative bchaviour
of traders. In fact, government supplies declined by 0.58 million tonnes in 1890-
91 over 1989-90. More disquieting is the fact that the distribution of cereals
through employment programmes ha; also declined. It is as yet not known why
such avoidable failures arise. The failure of the stock and release policy in
combating the undue hikes in cereal prices engineered by speculative trade
policies is a matter of serious concern.
Another disturbing recent wend is the steady decline in the off-uike from
the PDS; the off-take as a percentage of net availability of foodgrains Fell to
about 10 per cent in 1993 fiom around 14 per cent in 1988. Between 1991-92 and

1993-94, the off-take of ricedeclined from 9.9 to 8.8 million tonnes and of wheat
from 8.8 to less than 6 million tonnes inspite of the vamped PDS inrmducod in
1,752 blocks covering a population of 165 million including the p r c s t in the
tribal and dryland areas. This phenomenot~, though widely recognised, has not
been analysed. However, some economists argue that the abnormal increase in the
issue prices of rice and wheat between December 1991 and February 1994 caused
by an increase in the procurement prices of rice and wheat, has reduced the
differential between the issue price and the open market price, which in aun
resulted in a shift of consumers from the PDS to the open market.
4.7 PDS : FOOD ACCESS TO THE POOR
It is important to ask whether with the increased tempo of the PDS
operations the poor have benefitted and what is the efficiency of the PDS in
distributing food to the poor. Many empirical studies have shown serve biases in
the inter-regional distribution of the PDS supplies--states with high incidence of
poverty such as Bihar, Orissa and Madhya Pradesh receive a lower share, and the
PDS supplies are universal in character in regard to its distribution between
classes. Empirical evidence for the urban bias Beems to be week (see table 4.2).
Out of the eight states (Andhra Pradesh, Gujant, Jammu and Kashmir, KamtaLa,
Kerala, Maharashtra, Tamil Nadu and West Bengal) in which the PDS networlt:
has spread, only in Jammu and Kashrnir, Karnataka, MaharashIra and West
Bengal, were the per capita purchases from the PDS as well as their share in the
marker purchases of cereals higher in the urban areas. However, among these

states, the urban bias wai emefne in Ja~nmu and Kashmir and West Benpal. What
seems to be a major issue in addition to inter-regional inequality, is the universal
character of the PDS. These findings are based on slightly outdated information
(52" NSS round, 1998-99) needs to be notedia. How far the above features still
persist? Based on the results of some selected village studies an the PDS in 1999
in four states carried out as a part of UNDP Research Project on Smtegies and
Financing for Human Developmeot (Centre for Development Studies,
Thiruvanthapuram), one can provide a crude answer to the above questiaD by
comparing the class-specific purchases of cereals from the PDS estimated from
the National Sample Survey Organisation (see table 4.2) with those of more
recent village-level data (see table 4.3).
The evidence clearly shows that even now the efficacy of the PDS in
distributing food to the poor seems to be bad as in 1998-99 and sow of the
disquieting features persist : the virtual exclusion of the backward states such as
Bihar and Uttar Pradesh from the PDS networks and the universal character of dte
PDS in states in which supplies from the PDS were signif~ant. it is an t o r n
that none of the four villages surveyed in Bihar received any PDS sypplim, aor
did three out of four villages surveyed in Uttar Pradah.
The crux of the issue is how to improve the efficacy of tfbe PDS In
transferring food to the poor and achieve cost e f f e c t i v w at the same time. Thc
policy initiatives should distinguish between pmr and moderately poor, who are
severely exposed to the risk of uncertainty both in the food and labour marketa,
and attempt at improving the efficacy of the PDS insecurity.

Monthly per Capita Purchase of Certplp f~om PDS and their lkmmhge to Total Cereals (paS+OpenMarket) Purchases: 199849
htcs. I Flgurca In par- arc p- from PDS ta cnul (PDS + Opn Mark@ pl~~hm wf cecab.
2 tbverty l~lcs wcd in the c h ~ f u ~ m n d h o u r b k ) 8 arc tbc waprKs pwcny (Iw POopl#l by the Expen Gmup on lh1ma11011 of Proponan and Number of M r . appohled by hc Omnnmrm oflndii (1999). HoulrdnIdr bzvcng per crpb expnJ)nm k i ~ thin lbte~qwnrrr of pnvmy Im arc cbmfrml m very poor

Table 4 3
Per Capita Monthly Consuniptioa of Rice ham PDS in Andbra Pradesh aMt Kerala and of Cereals from PDS In Bihrw end Uttar Pmdesh, 1W
Expenditure Class (Rs.Jmonthl~r
capita)
(1) Less than 175
176-225
226-275
276-350
351-500
501-1000
Abovc 1000
All classes
Karala : Rkc
VIthge 4 P~~&ooT
(5) 5.00 ( l w 5.18 (68.07)
3.81 (44.82)
village I Anand
(2) 3.40
(46.01)
3.17 (46.55)
4.11 (53.03)
5.01 (44.49)
6.39 (58.46)
4.74 (40.83)
7.43 (79.89) 4.77
(48.47)
Village 2 WWo
(3) l .Ol
(14.45)
195 (28.89)
2.12 (2 1 .20)
Village 3 Edavaka
(4) 6.17
(80.33)
4.28 (69.59)
4.78 (53.95)
3.12 (29 46)
4.08 (36.82)
3.86 (42.37)
3.86 (26.62)
5.63 (66.47) 4.52
(54.19)
6.13 (M. r o) 0.80
4.73 (55.52)
3 89 (23.50)
0.00
2.70 (26.06)
3.75 (38.38)
0.00
4.21 (4 1.35)
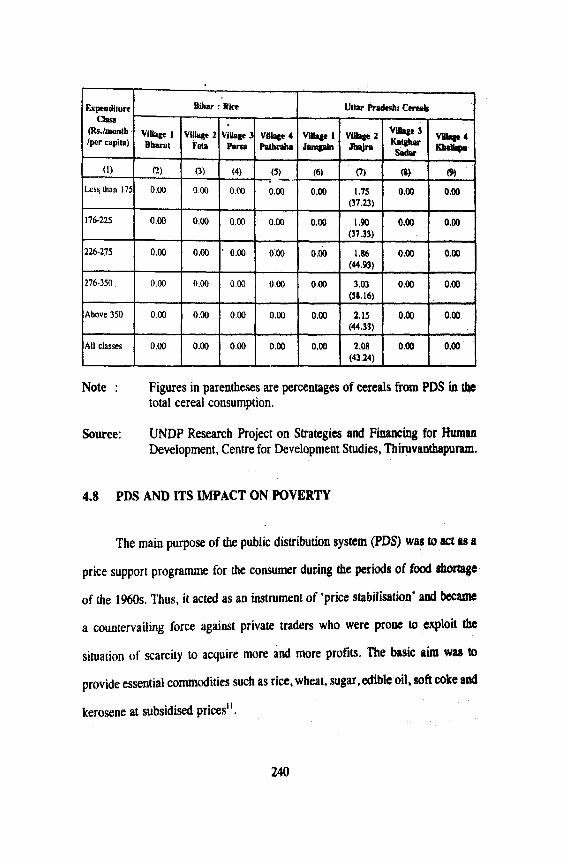
Note : Figures in parentheses are percentages of cereals from PDS in the total cereal consumption.
Above 350
All classes .
Source: UNDP Research Project on Strategies and Financing for Human Development, Centre for Development Studies, Thimvanthapuram.
4.8 PDS AND ITS IMPACT ON POVERTY
0 00
0.00
The main purpose of the public distribution system (PDS) was to act as a
price support programme for the consumer during the periods of food shor$gc
of the 1960s. Thus, it acted as an instrument of 'price stabitisation' and became
a countervailing force against private traders who were prone LQ exploit the
situation of scarcity to acquire more and more profits. The basic aim wes to
provide essential commodities such as rice. wheat, sugar, able oil, soft coke and
kerosene at subsidised prices".
0.00
0.00
0.00
0 00
0.00
0.00
0.00
0.00
2.15 (44.33)
2.08 (43.24)
0.00
0.00
0.M)
0.00

Since the mid- 1980s the coverage of the PDS was extended lo rural areas
in some states. Thus. it acquirtd the status of a welfare progranjme. An effort was
made to extend subsidisat fmdgrains in 1985 in all rhe tribal blocks covering
about 57 million persons. The revamped PDS was later expanded to cover 1,752
blocks with a high incidence of po&-ty covering 164 million persons. The
number of fair price shops (FPS) was increased in rural areas to provide agencies
for distribution of subsidised fuodgrains. In several employment generation
programmes, subsidised foodgrains were distributed as a part of wages.
The food subsidy component of the Central Government is given in
table 4.4. It may be noted that there has been a continuous increase in PDS
expenditure, which rose from Rs.650 crores in 1980-81 (at current prices) to
Rs.2,8OOcrores in 1992-93. But there was a big jump in expenditureduring 1993-
94 to Rs.5,537crores. Thereafter, in 1994-95 the expenditure registered a small
decline to Rs.5,lOOcrores. As a proportion of Central Government expenditure,
it was in the range of 2.9 to 3.1 per cent during 1974-75 to 1985-86.
Subsequently it declined to a low level of 2.22 per cent during the first phase of
economic reforms. but responding to popular pressure to continue the scheme as
a welfare measure along with a 'price stabilisation' instrument, it went up sharply
to 3.8 per cent in 1993-94 but was reduced to a level of 3.0per cent in 1994-95.
Even during 1995-96 and 1996-97, it remained between 2.8 to 2.9 per cent. In
1997-98, it was 3.23 per cent but declined again to 2.86 per cent in 1998-99.
As a priprtion of GNP, PDS expenditure was 0.53 per cent in 1980-81
(at current prices) and reached a level of 0.71 per cent in 1985-86, but gradualJy
declined to 0.45 per cent in 1992-93, It went up sharply to 0.70 per c a t in 1%-
94, but faH to 0.55 per cent in 1994-95 and it further decHned to 0.48 per clent
in 19%-97 and, thereafter, raised to 0.54 per cml in 1998-99. An sffon bas been
made in the Budget (1m2000) to reduce food whidies to 0.47 per cent of
GNP.
24 1

Table 4.4 Central Government Expenditure on Food Subsidy
11999-2000 (BE) 1 -
8,200 I 0.47 I 2.42 I Note : Includes sugar
Sources: 1 . R.Radhakrishna, et al., (1997), India's Public Distribution System : A National and 1ntr:mzionaI Pmpwtive, World Bank 'Discussion Paper No. 380
2. Government of India, Economic Survey, 199P2000.
4.9 RELATIVE SHARES OF DIFFERENT ITEMS lN PDS SALES
Although rice, wheat, sugar, edible oil, soft coke and k o x n e are sold
through PDS outlets, but of these, 4 items viz., rice, wheat, sugar and kcmcne account for 86 per cent of total PDS sales. Sugar alone accounts for 35 per cent,
followed by rice (27 per cent). wheat (10 per cent) and kemene (15 pa cent)).
Coarse cereals (bajra, jowar and other coarse grains), which are largely consumed
by the poor, account for less lhan one per cent of total sales. The share of pulses, the main source of protein for the par, is less than 0.2 per cent of total PDS
sales (see table 4.5). .
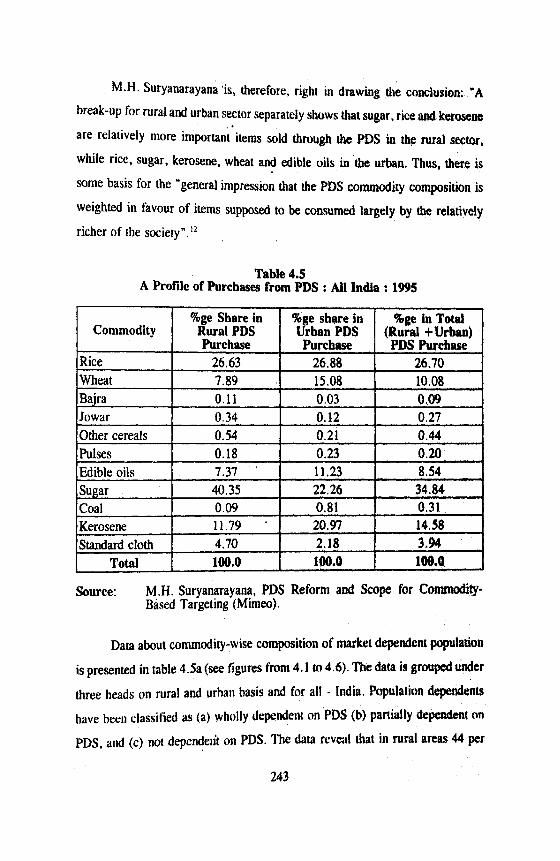
M.H. Suryanarayana 'is, therefore, righl in drawing the conclusion: "A
break-up for rural and urban sector separatciy shows that sugar, rice and kement
are relatively more important items sold through the PDS in the rural sector,
while rice, sugar, kerosene, wheat and edible oils in the urban. Thus, there is
some basis for the "general impression that the PDS commodity composition is
weighted in favour of items supposed to be consumed largely by tbe relatively
richer of the societyn.'*
Table 4.5 A Profie of Purchases from PDS : All India : 1995
Source: M.H. Suryanarayana, PDS Reform and Scope for Commodity- Based Targeting (Mimeo).
Data about cammodity-wise cornpasition of market dependent population
is presented in table 4.5a (see figures from 4.1 a 4.6). The data is groupod under
three heads on rural and urh;m basis and for all - India. Population dependents
have bm.11 classified as (a) wholly dependent rm PDS (b) partially tkpcndent on
PDS, and (c) not dependelit on PDS. I l e data reveal that in rural areas 44 per

cent of the population is dependent on PDS for k e r w x ~ , 36 per ceut for sugar,
26 per cent for wheal and I4 per cent for rice. Obviously, i t implies that this
relates ro px,r who would like to purchase subsidised sugar and kerosene, Since
the poor are themselves producers of rice and wheat and get part of their wages
in kind (landless labourers). their dependence on wheat ud rice is rslatively less.
But if we take wholly and partially market dependents, then PDS purchases
account for 68 per cent in the case of sagar, 51 per cent for kerosene, 40 per cent
for rice and 31 per cent for wheat in rural areas. This implies that the wn-poor
also take advantage of PDS purchases, more especially in sugar and keroaene.
Table 4.513 Composition of Commodity Wise
Market Dependent Population : All India : 1995
Kerosene 1 44.09 1 6.91 1 51.00 1 49.00 1 56.20 1 8.24 1 64.44 1 35.55 1 Source: Compiled from M.H. Suryanarayana, PDS Reform and Scape for
Comn~tdity Based Targeting.
244

Fig. 4.1 Sources of Supplies of Rice in Rural : 1 995 ,
- , . . . . * > , ,. , , , ,,., :,.>.<, ,. , , m , , - , - , , . , , . - , . , . , . . - > .. ' ' , , -.: ' ' . . , - > ' .. - < , J . ,.. , '." > , , r,, , , ;;,: ;:, : >:, . ,
I . . . , .
. , , . I . , - ., . ; ., m.,, .'.. ! , '[ ;,.. ' ; .L ,' .. , , ' . .,,. , "' ;.r ' 8 . - , - , ,
, , : . . . . . . : , ' " . . . . . , , . , . - - , : , "
> ' . . . . . , I . ' . , - , , , , :, , , > ;, , -, , 8 , , , ,, : . ." 4. . , , . . . . . . . . . . . . . . . . . . . . , ' : . . , . , , , ,. ' . , , , , , , , . ,
,:':,:; ;, < ' , , ,, , ,, .. , , . , , - - - : ' . I - ,- , ,; ! ',
; ' . , ' , . , , ,, > . .: I . . . . . . . . I . ' . , . . :-. ' ".. . . . . . . . . , , , , ,
, .; . , : I
. ., .,.; , < - ', - .- . ,',': ,- ......... > , , , , ,!' - , ., ? : , ' - > ' . . L . , .; . , , .,,., . , , , . . : ' - .:,/. ::., .:.. :;::.;,I:, . : . .:: . . ...: ,,-/ -., , ' : . . ' .
, . . . . . I : , .: : . . . . , - . . . . - . . : . ..-;,: ' I I:.:.:. . : ..,... . . . . . : - -. , , m ; : - , . , , ',;. - .: , " '
' ., '. ,,, , , , ,r , ;- ,-:!:,
, ., - . ' . . , , , : .,', ,. ',.: , ' , ' - ' , , b : ' , . . . . . . . . . . . .
I . - . , , <,',. ,. , , . > , , ',
: , . .- . '. " , , - , l . . . . . . - i : : .. i ! Fig. 4.2 Sources of Supplies of Rice in Ubran : 1995 ':;. :: ::,:::.. .'. ; .-:.,.;;::. ., .'
, , ,. ; ' - - , . .- . . . . . . " . . . . , ,,. :,: ,, ' . , ':,' ' , , , , , . , , r , ,'; -, ., ,
' 1
,: .: ,:; ,',i ;,, . . - .,,, ->:, - , , :':",: y: , . , , :,j, < -,L:.; .,, . , ,
, . ,. , , 0 1
\ , .;.'-.:..;'.:. , : ? .,,. - ' . . ,' . ' m
'.',' ::,,.,;:: :, ', > , , ,"., ' " ' ' - ' . . . . . . . :,. ,. I m , -
8 . . - . : . . . . . ..... ,,;;,. . . . . . :.,>. ..:.. . a , : . .::.....:. . , . . ;,.! . ;,, . . . . . . . - - . : - -. . . . ." . . I" :. . > ' I . . : . I . -
, , ' , , , , . ' . . "' . . < , . : . , . : ',.' "
,. %, >., ,, , :::: ,, , , . , ' L . . . . . . . , , , .- , >, , ,\,- ,,,' ,
, , . , : , . .. , .. - . , . I , . > . : . . ., , - . .i. . ., .
I , i , . : . : . , 4 ' . ,. , ,: , - , , ,, . ; ::." ,', ,
I' . . i. :: . ' - , , , . . , I ,
. I . , , . , . , I ! . . , , . . , , > . .,
' I . . , ,
< , : - ., , ,, . ,<* , ' . - , . ',.. , " ..- . - . . : , : , . ,
- , - . .

, - - , . '
. . . . . . . . . . . , , , , , ,
. ' "L - '. , , , : .
. , , . . . . . . . . . . . . . . . . . " ., ,- ' I .
. - , ,. . ' . - , , , , :> - . ,,,, ,
, ,. . . , , : . . , . . ,
, , , , . , , ,
' . , , ,
. . , , . . , ,
, - , , , . ,;. . . I . . , . . . . . . .
5. - - I - , , , ! ' , - / ' I . , .-,. . . ' , , ' , ' , . - . . . . , , . . . . . . . . . . . . .... , , .- ..;, : -, . , . - . . , . - , .:; , .
. . . . " . - , , ,, . . , I '
48 1
, , , , .- .
,. , , : , . - .,. :.. : ' . - - , . ; --. A : , , . ,.' , . " . . . . . , , ,': , .: ,':-*:-
, , . . . ',,, :;' -, - .. . , . - . - i
' '..1 . ' ' ,
; , , : Fig. 4.4 Sources of Supplies of Wheat in Urban : 1995 , , , . . . . . . . . . . . . . . , , , , ,
, . , ,< . ,,

1 DOnIy Other Souram ' m .A , .,, ,, . . - .."... I
Fig. 4.6 Sources of Supplies of Edible Oils in Urban : 2995 ' I
, , . 1 , , , - , .;; , ,,-. ,,..,,
, ,$ !:, . :, -.. .,;. -, . , , m .
, . . . " :B Only PDS , , ,- - ' i I''.:*
TJ Only OLhnr S o u r n I ,..- . . , y * . . . ... =XI-
' ?:: .- ' - " , >," , ',
,. . , , , , .. 1 ',.,' '- '-, ,- :' : . , . , -. - , <.-.
, , , ,

Nearly a similar situaiion prevails in urban areas where the share of wholly
and partially dependents in PDS purchases was 76 per cent in the case of sugar,
64 per cent in the case of kerosene, 39 per cent in rice anid about 37 per cent in
wheat as shown in table 4.5a. It may pe noted that about 27 per cent of market
dependents were either wholly or partially dependent on PDS purchases for edible
oils, and for pulses this percentage was 23 per cent. If it is conceded that sugar
and edible oils are not consumed by the poor, then it becomes obvious that bulk
of the PDS purchases of these commodities go to benefit the non-poor.
4.10 PDS SUPPLIES AND OFF-TAKE
PDS supplies have rapidly increased since the mid sixties. During drought
years, PDS supplies were greater than during normal years. PDS supplies
increased from 6.5 million tonnes during 196165 to 18.4 million bnnes during
1990-92 - nearly three-fold increase. During years of low foodgrains production,
the government increased PDS supplies by enlarging the employment programme5
in distressed areas.
A recent trend is the decline in off-take of cereals from PDS. Between
1991-92 and 1994-95, wheat off-take for PDS fell from 8.78 to 4.83 million
tonnes and rice off-take from 9.94 to 8.0 million tomes. The major factor
respo~lsible for decline in off-take was the abnormal increase io the issue price of
wheat in recent years. The upward revision of issue prices has reduced the
difference between issue price and open market price. Moreover, the consumer
has to accept whatever be the quality of wheat and rice sold at fair p r h shw,
but he has the option to make a choice about the quality of rice and wheat in the
open market sales. Both these factors have contribuled lo the shill of CONTUMCSTS
from PDS to the open market. though li1c reduction of price differential between
issue price and open markit price has been a dominant factor.

During 1990-91 and 1995-96, minimum support prices were substantially
raised (69 per cent for wheat and 44 per cent for rice). As a c o ~ W # ~ , the
Food Corporation of India (FCI) had to buy more foodgrains than it could
manage since off-take from PDS has also declined due to upward revis*- of
issue prices. Central Buffer Stocks reached uneconwnical levels of 35.6 million
t o m in juiy I995 as against the r&ommended stock of 22.3 million tames.
Since the carrying cost of one tonne of foodgrains was Rs. 1,447 in 1994-99. the
additional cost of carrying higher than the recommended levels of buffer stocks
to the central government was of the order of Rs. 969 crores. Although the
government has permitted the FCI to off-load foodgrains, still the FCI has not
been able to reduce the losses due to excess holding of stocks entirely. This is
evident from the data given in table 4.6 about minimum norm and actual bllffer
stocks held during the last four years.
It may be noted that the stock of wheat and rice in January 1995 was ~bou
97 per cent above the minimum norm for buffer stocks. During January 1997 the
buffer stock was ody 30 per cent above the minimum norm, but again in Janauuy
1998 excess stock was 45 per cent of minimum norm. During fa- 20QO,
excess stocks reached a very high level of 87.5 per cent over the minimum norm.
Obviously the government should not keep a much larpr margin rbove the
minimum norm.

Tabk 4.6 Central Foodgrains Stocks and Minimum Buffer Stwk Norms
4.1 1 THE CHANGING ROLE OF THE PDS AND SOME POSSIBIL-
OF IMPROVEMENT
(MnUon tonne&
The PDS in India works along side a Free market. It makes available fixed
quotas of fndgrains through ration shopr at subsidized 'luion' or *Ir p h .
The role and working of PDS hag undergone several changa since its k@thn. Initially, its objective was a 'stabilh pica' and 'rn~rmpioa' in the li#ht of
Of Ihe Month
January - 1994 Apr~l
Source: Compiled and computed form Economic Swey (1999-2000),
Wbaetend Rlcc Minimum A d d Norm. stock ErCC%s Sloc)l
(3) =(2-1) 6.6 6.0
(1) 15.4 14.5
3 am pmnt of 1
(4) 42.9 41.4
(2) 22.0 20.5

fluctuations in food grain oitplt. Later on. it also assumed importance as one
the governmenl's anti-poverty programs. The changes in the last decade wen a
result of the liberalisation process and the structural adjuslme~lt program
undertaken by the government since.1991, the year of economic crisis. The
reforms in the systems focussed on removing existing ineff~iencies, p a r h l ~ ~ l y
in costs. The costs of operation of the PDS consist of two major cornporn;
subsidy costs and administration costs. The subsidy costs occur mainly due ta
price at which foodgrains procured being higher than the price at which they are
sold in the PDS. In addition there are procurement, storage, transport and other
administrative costs involved in the procurement and distribution of grain. Theft
and other kinds of losses in storage and transit add to these costs. In spite of
incurring these costs the effectiveness of PDS in providing food security to the
poor is low due to the universal or untargetted provision of food subsidies. A
large proportion of food subsidy thus goes to the non-poor. In addition to this r
large amount grain leaks into the open market due to ~ormption.'~
There has been a significant chnge in the food distribution system in Imf
few years as captured in table 4.7 Riddled with problems such as low incomo
support and ineffective target of subsidies to the poor and subsmntiai leakage
from the untargeted or universal PDS (UPDS), the Indian government initiated
a new scheme in June 1997, the targeted PDS (TPDS), to directly WgCt W
subsidy to the poorI4. This scheme is meant to serve families below the poverty
line (BpL). Under this schenle the slates are required lo identify these families
and provide Lern 10 kgs of findgrains per family per month. 81 50% of the FCI's

~ ~ o n o m i c cost. Supply of gniin to the state for his purpose is guaranteed by he
central gowmnent. The states' jn free lo provide higher quotadprice subsides by
adding from their own resources. The papulation above thf poverty line (APL)
would continue to receive foodgrains-as per the wnnal UPDS. For the BPL
population, an amount of 7.2 million tonnes of grain, targeted to 60 mmim
people, is provided by the central govepnent. For the APL familiics, an amount
of 10.3 million tonnes has been earmarked for distribution at a price cqull to 90
per cent of FCI's economic cost. In addition, the propmid to slowly pbam out
APL families from this program could increase both inclusion aM1 exclushll
errors.
Table - 4.7
The Changing Face of the Food Distribution System
Notes : Quantities and prices under UPDS relate to 1996-97 and under TPDS to April-December 1999. The prescribed CIP under WDS in 50% of economic cost for BPL and 90% for APL families, though the actuals were lower,
Un~veml or untargeted
YDS(UPDS)
TPDS
Source : Economic Survey : 1999-2000.
Efle~tivc h e
Upto l'N6 97
F~~ 1997.98
From ,999
Pop~lPtloll Covemi
All
yz Ep'F Abuvc mvcny 1.m IAPL)
Faody.b, Sluppl*d (Muuno Tamrs)
C m L * u M # (Ilrrlp)
t"PY=
10
61bul&
2588
7 20
10 9
Obr
5Y)
3s (eonunoa)
700 mlnno@
905 (Gndc A)
C D w % d ~~
0m.h
1916
8 15
W*.(
402
221
691
Ua
$05
nu
82%
Wbr(
1561)
w r
ua%

Table 4.7 shows that in the UPDS regime, the off-take by states was lower
than the foo$pins allocated to them by 20 per cent due to various reasons.
Under TPDS, the total allocation itself has been reduced to about 17 million
tomes consisting of about 7 million t o m s for BPL and 10 for APL population.
With persisting distribtional problem's, it is not clear as to wheth and b w this
entire amount would be lifted by the states and then by the corns. In addition, while the central issue price (CIP) have been frozen Tor the BPL families, there is a substantial annual krease for APL families (see &Me 4.8and
figures 4.7 and 4.8). Moreover,even though FCI's sales realisation show a down-
trend on an average, the budget estimates for 1999-2000 are much higher than the
previous year's realisation: the average for rice be@g Rs. 6911q compand to Rs. 601lq last year and that for wheat being Rs. 5131q against Rs. 3Wq.
Table - 4.8 Prices under the TPDS Regime .- . .
Notes : 1 . FCl's sales realisation for APL familirr; excludes the Md~1 from
3'? ial category states of J&K. HP,NEatatw, Sikkim and hilly of
2 The Levy price of rice is an averap for the corrPmon vafiet f ~ n ti ht state, YIZ. AP. Haryana. MP. Orlssa. Rajathan, Funjab, & and dsl Bengal.
Source: Economrc Survey,1999-2000 and World Bank (1W)), Annex Table 2.2a.


.,..., m . . . . . 1 1 . 1 . . 1 1 , . . . 1 . 1 .,.. n . . . , 1 1 m . 1 . 1 1 . .
I . . . . r . . . . , . . , l r r l " . , , . , . . , r + + + " . , r . r . r r - ~ ' I . , r . l . r . . . r r l r ~ . . . . h b h . b + - F . . ~ ~ . . . + ? - I . ~ . ~ . . ~

T h e ~ w trends in the various components of costs of foodgrain p m m t
and the public distribution system indicate hat the p m u w e n t i m i d e a md
costs form a very large haction of the price at which grain is procured. In effect, the cost-benefit ratio of the system turns out to be very bigh
( 9 table 4.9), part of the reason for the low benefit cost ratio is the Fact that in
addition to the costs incurred by the government, producers also su&r losses
when the procurement price is lower than the prevailing market price. There is,
however, a possibility that 'loss to is overestimated since the market
price in the absence of procurement policy could have been at a lower kvcl.
Moreover, several indirect benefits go unaccounted for. The current functioning
of the system is such that PDS serves a dual purpose.
Table 4.9 Benefit - Cost Calculations for Intervention in Grain Markets
Nocar : I . C-mr bem(ic r & dtfi- betwan WM ~ r h W h * 2. moducer hn the dtflcrcux ktwrcn mark* prm and rocurnmu P& Siw in
,,mu, u*. ,,,r*n. p d - n ik. * * fr* 6 m f i w w* 3 ~~~~r,,,,,,.m cmt .tr ~h sum of p r o u r m ~ . WrOr a* *mwrMrvc minun ub
reAii\alnn hurw : jha a d Sr~ntvawn 62000)
It not only provides subsidy to consumers but also hdps in the pmem of
providing price support to the farmers. The PDS and fmdgrhn pm-
policy of the government has also brought about stability in the p&w~ of fmd
grains, which in turn contributed to macro economic stability. The h s a d
demand for foodgrains resulting from food subsidies leads to multiplier effects,
thus raising the overall growth of the econ~my.'~
There are also other benefits from PDS, which may not be readily
quantifiable. For example, PDS stabilises aggregate consumption of foodgraina
and aggregate producer revenue in the face of year-to-year fluctuations in
production. It reduces the probabilities of consumption and producer revenue
falling below different levels, and at all levels. The presence of PDS is also found
to reduce the government's price stabilisation costs. Thus, the presence of various
indirect benefits to the operation of PDS implies that PDS reform induced by
fiscal adjustment needs to explore alternative means of rm'Ioving cost
inefficiencies rather than aim to reduce the size of the distribution system.
Although the food subsidy has been growing over the years in real tern, it ha$
remained stable as a percentage of GNP, ranging between 0.5 and 0.8 per c a t .
Several studies have pointed out a large scope for reduction in inefticiencies both
in terms of preventing leakage and improving the reach of the paor and the recent
reforms should concentrate on these issues. The widespread poverty and lack of
purcllasing power inlplics f imitd market demand for hxdgrains. ~WR%*S in faOd
257

supply without adequate incrhse in demand would mean lower prices for farmers,
which in turn would require piice support for farmers from the government. P r h
support operations can result in excessive stocks with the government in the
absence of a food subsidy program. Food subsidy to consumers and price support
to fanners, are therefore complementary to each other.
4.12 DIVERSION OF PDS COMMODITIES
A study was conducted by the Tata Economic Consultancy Services to
ascertain the extent of diversion of commodities supplied under PDS fram the
system. At the national level, it is assessed that there is 36 per cent diversion of
wheat, 31 per cent diversion of rice and 23 per cent diversion of sugar. These are
most likely estimates of diversion based on sample survey conducted. Statistically
at 90 per cent confidence level, the actual diversion of wheat would fall in the
range of 32-40 per cent, rice in 27-35 per cent and sugar 20-26 per US. Table
4.10 shows the extent of diversion in various states and union territories of India.

Table 4.10 Levels of Diversions from PDS in States : IW
Source : Tata Economic ~onsultanc~ Scrviceri (TECS), 1997.
259


The table 4.10 shows that diversion is more in the Northern, Esgtern and
North-Eastern regions (see figure 4.9). Diversion is comparatively less is tbe
Southern and Western Regions. As extreme cases, 64 per cent diversion of ricc
is estimated in Bihar and Assam. In the case of wheat 100 per cent diversion is
estimated in Nagaland and 69 per cent in Punjab. The huge extent of leakages as
brought out in the report has been disputed by several srate governments. A view
has also been expressed that the sample size used in the study was small and
therefore was not truly representative.
It is significant to note that less diversion is estimated in the case of sugar
as compared to rice and wheat. In this connection, it has to be noted that sugar
is a commodity where even the well-to-do section buys from the PDS outlets.
Greater diversion in the case of rice and wheat is perhaps an indication that a
large amount of the quota meant to be distributed among the well-to-do is actually
diverted to the open market. This again strengthens the argument for excluding
the population above the poverty line from the PDS.'"
The report also examines the effectiveness of Essential Comrnoditia Act,
1995 and prevention of Black - Marketing and Maintenance of bentid
Commodities Act, 1980 in checking diversion. The report says that no cwrelarioa
was observed between the frequency of use of Enforcement Acts in particular
states and extent of diversion in these states. In the Northern Region, Uuar
Pradesh has more diversion of rice and sugar than Punjab despite hi&r number
of raids a d convictions. Similarly, in the Western Region, Gujarat docs noi
appear to be very n~uch betrr rnanagd than Madhya Pradesh ad kjwlhu
despite having the highen number of detentions in [he cc~ulltry undcr these ilCk3.

A done by IS1 researchers using NSS data fbr 11993-94 along with
other for two states (Andhra Pradesh & Maharashtra)estimatd both tbe extent of . leakage as well as the economic inefficiency of the public food p m u m m t
system relative to the open market. The study shows that oaly 56 to 58.5 per cent
of 'the total food subsidy (i.e center and state) reaches the PDS cansumtrs.
Leakages can range from 15 per cent to 28 per cent of the subsidy while 16 to
26.5 per cent of the subsidy is eaten up by the inefficiency of the government
procurement and distribution system (FCI plus state level) relative to the market.
4.13 RECENT POLICY CHANGES : BUDGET 2000-2001
In his budget speech, the Finance Minister has announcad sttep price
increases for rice and wheat supplied through fair-price shops. Specifically, central
issue prices - that is, prices at which the food corporation of India (FCI) stlls
grain for the PDS to state governments --- will be set at half the 'Economic Cost'
incurred by the FCI for BPL households and at the fuB 'Economic Cost' for APL
households. In effect, wheat will now be available at Rs. 8.40 (against Rs, 6.82)
a kilogram and rice at Rs: 1 1.70 (against Rs. 9 -05) per kg for APL families. BPL
families will be charged Rs. 4.20 (against Rs. 2.50) per kg of wheat and Rs. 5.85
(against Rs. 3.50) per kg of rice. These are the new central issue prices, and thc
impact on consumers will depend on the retail prices set by stare g a v m & .
In the following paragraphs, there is the possible effects of the new prOptBls on
the welfare of the poor and undernourished."
In the first place, the increase in prices of basic foodgrain will reduce
substantially the real income of minion of consumers. For BPL families the prices
of rice and wheat have been hiked by as much as 68 per cent. For APL families,
the prices of wheat has increased by 23 y r cent and that of rice, by 29 pn eat .

Secondly, the new poiicy has introduced an in-built mechanism h r mi-
prices. Every rime procuremtint prices are raised, issue prices of grain h r the
will be raised. It bears emphasis that procurement prices have risen regulariy wch
year and in recent years the inmases have achlally been above those
recommended by the Commission on Agricultural Costs and Prices. The
inflationary effects of the new policy can hardly be ove~stated,
Thirdly, this measure, in effect, removes APL families from the PDS. A
comparison of the economic costs of the FCI with wholesale prices and nut3
prices in different states shows a steady deterioration of the price advantage of the
FCI in 1990s compared with the 1980s. In situations where the economic cost is
higher than the market price, APL consumers will have to pay more for grain in
the ration shop than in the open market. This applies especially to several noab
Indian States. The exclusion of APL households from the PDS has implications
for the consumption and nutrition of a large part of the population, for the quality
of the programme and for stocks of foodgrain and ironically, for the central
government's food subsidy bill.
Fourthly, for BPL families allocations have been doubled. The inma~e in
allocations, from 10 to 20 kg per family per month, for BPL h o d & , is n
long-overdue, though still inadequate measure. However, as prices have ken
raised steeply, genuinely poor families will have to spend more now on acquiring
the same quantity of grains. This will compound an existing hardship. In the PDS
system as it works in many parts of the country. the BPL famay is rtq~brd to
buy the total monthly allocation in one or a besl two inrtn~hnents.

Fifthly, millions of undernourished persans and persans vulnerable to
undernutrition have already been excluded from the BPL category by means of
income targeting under the proposed dispensation. The excluded population no
longer has even the limited benefits ayailahle to it as a possible part of the APL
category.
Sixthly, by restricting the PDS to BPL household, the new scheme is iikely
to leave the FCI with even iarger stocks of p i n than at praacnt. st&* of rim
and wheat with the FCI have been growing steadily in recent year, and amounted
to 3.15 million tonnes in January 2000; Current BPL allacations are around 7.2
million tonnes. Even if BPL offtake rises to around 13 million tonnes, the PC1
will be left with 18.5 million tonnes. If APL offtake falls sharply as is likely,
given the new prices, then the central government will be left holding huge
stocks. It is irrational that stocks are amassed by the central government while
millions go to bed hungry.
Finally, the central government is abdicating its responsibility witb respect
to the provision of a minimum quantity of cheap food to consumers in all parts
of the country. It has decided to vansfer the cost of the food subsidy to stare
governments. Of course, the current &icy affwrs different states differentially.
but it targets and penalises states that have performed better. State gov-
that have shown some commitment to the PDS in the past and wish to continuo
to provide a sufficient quantity of foodgrain to vulnerable sections of the
population at low prices will have to now pay the bill themselves. On the
otherhand, in states such as Bihar, where the delivery network and administratior
are already weak and fail notoriously to reach the poor, the .new sdmm is l h l y
to increase the incentive and scope for diverting grain meant for BPL households
to the open market.

4.14 CONCLUSION
PDS can be distinguished from private distribution in t m s of conml
exercised by public authority and motives underlying its operation. Growth in
demand for cereals was 2.4 per cent per annum during 1995 - 2000 and will be
2.2 per cent during 2000-2010. Disquieting feature of PDS is exclusion of
backward states like Bihar ind U.P. fkm its networks. Urban bias scerns to be
there in PDS operation. Supply of food to poor through PDS was bad. Food
subsidy by central government as percentage of GNP and total government
expenditure has been declining over a period of t i e . Percentage shares of sugar,
rice, Kerosene, wheat and edible oils in total value of purchases from PDS were
in that descending order. Dependent population on PDS Vis-a-vis market
dependence was more in the case of sugar and kerosene in rural areas, whereas
this ratio was high for sugar in urban areas. In recent years percentage of excess
of actual foodgrain stocks over minimum stock norms has been increasing, which
is not a welcome trend. With regard to offtake of foodgrains by slates from
universal PDS it has been declining. Under targeted PDS, central issue rice for
BPL families is frozen whereas it has been substantially increased for APL
families. Benefit-cost ratio of PDS was low. There was more than one-fourth of
diversion of PDS commodities. In Andhra Pradesh nearly 60 per cent of rural
consumers depend on PDS for rice, the corresponding per cent for urban being
47. Extent of food security provided by PDS was 18.06 per cent as far as cereals
were concerned in 1996-97.

SECTION - B PRICE STABILMTI~N MEASURE : A C R ~ C A L ANALYSIS
OF PUBLIC DISTRIBUTION SYSTEM
4.15 CASE FOR PUBLIC DISTRIBUTION SYSTEM
A Public Distribution. System (PDS) makes support and stock - building
operations viable; it could, at the same, time serve some welfare goals. However,
the welfare orientation of the distribution of foodgrains at prices lowu than
market prices is slow to emerge. Till about 1960s the supply of food^ at
subsidised rates through various forms of rationing was mainly restricted to large
urban areas in India. It was a system designed to cope with the periodic severe
scarcities in markets, resulting from droughts and poor crops. The scarcities had
a greater negative impact on supplies and prices in urban markets then in rural
ones. Intervention by the government in the foodgrain markets was necessary at
such times of scarcity to control price rises within limits and to prevent food riots.
The organised urban workers and the vocal middle classes were always perceived
as potential source of trouble for any government, move so in times of f00d
scarcity. One can perceive the PDS in essence a political instrument, In re~pnoe
to fears about the adverse effects of liberalisation polices on the levels of living
anlong the poor, that the PDS in recent years is being !EriouSlY cc.ms*rtd a
means for providing food security to the poor all over India. However, #is
thinking still has to be translated inta action. Even today the PDS is v i m l l y
absent where it is needed nlmt - in the rural areas of Bihar, Madya Pradcah,
Orism, l(ljastan. Utur P r a h and Y, on, whcrc the mohity of h e pmr live."

In 1965, Government'of 1ndia set up F t d Corporation of India (FCI) to
procure foodgrains and make'fithem available to the people at reasonable rates and
also to have a buffer to meet any contingency to counter the attempts of the
traders to exploit the situations like ~ n r r a l calamities by hiking the pries in the
open market. l9
In Hyderabad also there was statutory raiioning till 19'70. With tha
improvement of availability of foodgrains the govenunent discanti& tho
statutory rationing system. However, to make available essential commodities to
the consumers at affordable prices, the Public Distribution System was imwhmd
throughout the state of Andhra Pradesh from 1973." The state of Andhra Pradesh
is sparing no effort to supply essential commodities to the people of every nook
and comer of the state. No, wonder with 40,006 fair price shops the state today
has the largest Public Distiibution System in the country. Out of 40,006 fair price
shops 32,839 are in rural areas and the rest 7,167 are in the urban areas. But the
government is working with utmost conviction to open new fair price shops at the
rate of one shop for every 1,650 persons.
The first step in market intervention is the procurement of identified
essential commodities required for PDS. The most important amongst these item
is rice which is a staple food of the common man in India, more particularly in
South. Hence, an attempt is made fist to havc an idea of production of rice and
subsequently other aspects'sueh as prtsurenreltt, distribution of clrc rice.

4.17 PRODUCTiON AND PROCUREMENT OF RICE IN A.P.
Andhra Pradesh has achieved significant growtb in rice production over the
last two decades. While during 1980-81, the praduction of rice had stood at 70
lakh tonnes, it reached the level of 114 lakh tonnes (which h lerms of paddy
would be 171 lakh tonnes) during 1998-99. This is due to inuoduction of high
yielding strains, resulting ifi high yields. Yield of rice per hectare increased from
2,156 Kgs, in 1982-83 to 2,780Kgs. in 1998-99. This achievement enabled the
state not only to attain self-sufficiency in its requirement of rice but also to mbcd
requirements of other states, particularly of the southern states. The varieties of
paddy grown in Kharif season are more suitable for converting them into raw
rice, while most of the varieties produced in Rabi season are fit for preparing
boiled rice.
Most of the farmers tend to raise paddy in their fields as they are sure of its
disposal. Coastal districts viz. Guntur, Krishna, East Wavari , West Godavarian
the major rice producing districts in Andhra Pradesh and are dso called the rice
bowl of state. While there is bump& production of rice in the state, production
of some varieties like Tella-masuri, Sona-masuri, Vijaya-masuri, BPT, etC. Which
are preferred varieties, are not commensurate with the requirements of the
population. Due to this, sometimes shortage of this rice is felt and the prim ad
to slightly increase. It is high time that the Agriculture Depamem gives thought
to encourage the farmers to grow move of these varieties bsad on need to c m w
adequate of rice in the markel and thereby control their price rig."

Rice is procured fro& the rice millers and traders who purchase paddy and
mill ir for trading purpose, under statutory order called "The Andbra Pradesh
Rice Procurement (Levy) order, 1984". Accordii to this order every miller or
trader has to deliver 50 per cent of the rice precessed by him in mill towards levy
to FCI at the procurement price fixed by the government. Afier delivering levy,
the millerltrader is entitled to sell the remaining part of 50 per cent of rice
available with him. They are not at liberty to dispose of this rice without the
release certificate (permit) issued by the collector. Pre.mtly, the rnillcrsltraders
are required to sell half of the levy free rice within the state and the remaiRing
half they can sell outside of the state. Out of the quantity permitted for sale
outside the state, the millers can export a part of that quantity, as per the
percentage fixed by the government. In respect of levy free rice, there is no price
control. However, there is no levy on farmers and they are at liberty to dispose
of their paddy in the open market.
Central Government announces every year the Minimum Support Price
(MSP) for paddy and other foodgrains based on the recommendations of tlte
Commission of Agricultural Costs and Prices, which takes into consideration rhar
various components of costs involved in their pr~duction.~~Table 4.11 shows the
MSP fixed by, the Government of India since 1991-92 for paddy.
Procurement of rice is necessary in order to implement the PDS. The rice
procured by FCI in surplus states like Punjab, Andhra Fradd, etc. are moved
and distributed in deficit states like Kerala, Tatnilnadu, etc. Andhn Pradesh
procures raw rice for its PDS and boiled rice to mwt the requirements of PDS of
other states.

Notes : 1 .* Effective 1997-98, MSP is fixed for only two varieties of padby, . Common and Grade-A.
2. Figures in brackets are percenlage increases over the previous years.
T a b 4.11 Minimum SupportlPracur~ent Rice of Rddy : Fronr 1991-92 to MOM)1
Source : Civil Supplies Department, Government of Andhra Pradesh. The Hindu, Daily News Paper, Sunday, June 17,2001, p. 14,
Year
1991-92
1992-93
1993-94
1994-95
1995-96
1996-97
1997-98
1998-99
1999-00
2000-0 1
Common
230
270 (17.39)
310 (14.81)
340 (9.68)
360 (5.88)
380 (5.55)
415 (9.21)
440 (6.02)
490 (1 1.36)
510 (4.08)
Fine
240
280 (16.67)
330 (17.86)
360 (9.09)
375 (4.17)
395 (5.33)
--
--
-.
--
Super Fine
250
290 (16.00)
350 (20.69)
380 (8.57)
395 (3.95)
415 (5.06)
--
--
.-
em
(Rs* per
Grade A -- --
*-
r-
-.
--
455*
470* (3.30)
5U)* (10.64)
540 (3.85)
Under the provisions of AP rice procurement (Levy) order, 1984 (Rice Levy
Order) and the provisions or'rhe AP Scheduled Commodities Dealers (Licensing
and Distribution) order, 1982, no millerltradcr shall purchase paddy at a price kss
than the MSP and any such attemptlaction leads to prosecution of tkc
dealerlmiller concerned. Inspite of such a stringent provision, some times it so
happens that the farmers are forced to dispose of their paddy at less than MSP for
various reasons. In such a situation, the Food Corporation of India (XI) accepts
paddy of Fair Average Quality (FAQ) from the farmers by paying ihe MSP.
These are called the price support operations which provide succor to the f a m r s
in distress situation. The delivery of paddy by the farmers under the price support
operations is normally very negligible as most of the paddy is b e i i purchased by
the millers and traders at prices over and above the MSP.
Till 1979, Government of Andhra Pradesh was procuring rice on its own a1
the procurement rates fixed by the Government of India thmu@ Food
Corporation of Indial AP State Civil Supplies Corporation Limited and drawing
rice to the extent required for PDS. ?be balance was offered to the Cemal Pod.
Procureme~t of rice by the State Government, incurring carrying costs, ctc. was
costing more and Government of Andhra Pradesh, lhwgh it is eco~)r&d to
aUow procurement by FCI for Central Pool and dawn the required quantity far
PDS from the central pool at the FCI issue prim. The central pool issue price wlra
subsidised and applicable throughout the country and the distribution year wichoet
changing from month to month.

4.17.1 lmpact af Procurement on Prices
There was a feeling that due to heavy p r o e m n t of rice the prices in the
open market would be high. This was bssed on the gssumpdon that the ndUer8
lob in delivering levy and they make good this loss by hiking up the ~ K B market
prices. This is proved to be totally incorrect as the procuremeat price is fixed
taking into consideration all the expenses incurred by the millers, taxes paid by
them, etc. Even the open market prices also are under control due to reasonable
procurement price, and insistence on selling a pan of the levy free eligibility
portion within the state.
The prices in the open market generally go up to a reasonable level due to
incense in MSP of paddy fried by the Government of India. Based on the
increase in the MSP of paddy, the rice prices also should rise to the corresponding
level. Whenever any unhealthy trend in the prices is noticed, the govenunent
immediately plunges into action, assesses the reasons for price hike and rake8
remedial action to control the prices. If the analysis reveals that the price rbe was
artificially created by the traders, and the millers had not supplied rice in tftc
marked with the expectation of reaping the riches in the days to came, she
government immediately ensures that they release rice in the market to derive &be
desired impact on open market prices. Thus, on the whole, PDS not only ensures
adequate availability of essential commodities at affordable prices but also
guarantees food security, assured market to the foodgrains growers, acts as m
antidote against inflation besides mating a healthy competition in the glolnal
market.

4.8 7.2 Stock Limits
Government imposes resuictions on stock limits of rice to be held by tbc
rice millers and traders to prevent hoarding of rice by the millers. Till 1997-98,
there was no restriction on stock limits by levy delivering rice mills. As this
unrestricted limits resulted in storing of unlimited stacks by the rice millers
without pumping of supplies into open market, the government hsd to m R to
imposing restrictions on stock limits.
4.18 IDENTIFICATION OF TARGET GROUPS UNDER PDS
The PDS is meant to enable the vulnerable sections of the society to get
essential commodities in adequate quantities at reasonable rates. Till 1997, each
state was adopting its own norms for deciding the vulnerable sections, adequate
quantities and the reasonable rates, So Edr as foodgrain distribution is coocenrdl,
Government of India took a decision in 1997 to estimate Below Poverty Line
(BPL) families on the basis of Dr.Lakdawala Committee and also to fix a uniform
rate and scale for supply to these BPL families. Those who are not having access
to the minimum per day energy requirement of 2,100 calories per individual in
rural areas, and 2400 calories per individual in urban areas are lrermted ad pcapk:
living under BPL. Accordingly, the Government of India identified 35.97ptrtent
of the population in India as BPL families and decided that they shnrCd be
provided foodgrains at affordable prices in adequate quantities. Based on the
projectd households of 1995, Gover~lent of India declared that 22.19% of the
poplatian in Andhra ~rade& cow under BPL. Thi percentage of BPL

@ a t h was dkputed by'he Government of Andhn PRdesh !&tin# W *.
BPL should be decided baseb on the open market prier as per the data coktcd
by the Labour Bureau, Simia, as the prices adopted by the Government af India
for arriving at the BPL percentage were the state specific prices which took into
account the supply of rice at subsidised rates. After detailed consideration and
recommendation of the plaping commission, Government of India revised the
estimate of percentage of BPL families to 25.68 percent. The total number of
families falling within the category of BPL is 37.78 lakhs in Andhra Pradtsb.
Government of India had designated this scheme as "Targeted PDS" (TPDS), and
launched it with effect from 1.7.1997. According to this scheme all the families
identified by the Government of India as BPL families are entitled to 10 Kg. of
Rice per family per month. Government of India releases rice to the Government
of Andhra Pradesh at Rs.350 per quintal for supplying to these BPL fPtnilies st
a price not exceeding RS.4.00per Kg. Those covered under this scheme include:
(1) Landless agricultural labourers;
(2) Marginal farmers;
(3) Rural artisanslcraftsmen such as potters, tappers, weavers, blacksmiths,
carpenters, etc. in rural areas; and
(4) Slum dwellers and persons earning their livelihood on a daily hi$ in the informal sector like porters, coolies, rickshaw pulietr; andbudcart pullas, fruit and flower sdlers on the pavement, etc. in urban areas,

4.19 RICE DIS'I'RIBUT~UN TO BPL, FAWLIES IN ANDHRA PRADESH
Andhra Pradesh has been distributing rice to the BPL families at the
subsidised rates since 1982-83 crop year. Enumeration of howholds was done
in 1983 to identify the families eligible for supply of rice at the subsidised rate
of Rs.2.00 per Kg. This enumeration resulted in identification of 108.54 lsldn
families as the poorest of tbe poor for supply of rice at the subsiiised rate of
Rs.2.00per Kg. so as to improve their calorie intake. These BPL fgmilies w m
earlier given green cards and all others (Above Poverty Line) yellow cards.
The subsidised rice scheme was introduced in 14.4.1983 with the following
objects :
(i) To eradicate hunger, deprivation and want from the poorest of the
poor of the society and to provide a guarantee of a conlinued and
sustained supply of rice at subsidised rate;
(ii) To alleviate poverty; .
(iii) To provide two square meals a day; and
(iv) T; raise the living standards of these sections by enabling (hem to
spend the amount saved in the cost of rice on other es,,nthI$.
The number of households under the scheme had over rhe years undergone
so many changes as indicated below.

Table 4.12 Number of Families.Covered Under Subsidisd Rice Sebeme :
-From 1983 to 1999
Ndes: 1. Figures in brackets are percenrage changes over the pmvious year numbers.
2. NS : Not Significant at 5% kvel. 3 . ** : Significant at 1 % level. 4. * : Significant at 5% level.
Year 1983 1984 1985 1986 . 1987 1988 1989 1990 1991 1992 1993 1994 1995 1996 1997 1998 1999 Mean SD
cv(%) CGR %
(CGR %) t-value r-value
S w c e : Civil Supplies ~e~artment: Govermnmc of A n d h Pradeh.
Lakh FamiUes 108.5
96.48 (-1 I . 11) 101.30 (4.72) 104.32 (3.26) 95.14 (-8.80) %.25 (1.17) 99.22 (3.09) 99 45 (0.23)
107.16 (7.75) 101.07 (-5.68) 100.71 (-0.98) 99.03 (-1.67) 99.26 (-0.23)
112.66 (13.50) 112.66 (00.00) 113.03 (0.33) 113.05 (0.02)
103 '4877
6.3825 6.17 0.69
(0.67) 2.65'
0.5652

Number of families kvered under subeidisrd rice h in A.P. for a
period from 1983 to 1999, & shown in table 4.12. Yearly average aumbcr of
beneficiary families during the period under review is 103.497 l a b hmilies,
Small magnitude of C. V. value of 6. i7 per cent. indicates that the rna@ude of
deviations around mean is not much. Annual LGR and CGR of farnilies cover&
are 0.69 and 0.67 per cent rqspectively..t-value of LGR growth rate is 2.65 which
is statistically significant at 5 per cent level. r-value of beneficiary fimilies has
registered a value of 0.565.
Year-to-year fluctuations in the number of families covered under
subsidised rice were due to the weeding out of bogus cards, conversion of
ineligible greedwhite cards into yellowlpink and also issue of new cards, based
on policy of the Government from time to time.
The families given green cards and yellow cards were given white and pink
respectively in 1992-93. There may be families still eligible for issue of white
cards but are outside the PDS net. c here fore, it is imperative for the Government
to provide cards to these eligible families duly weeding out the bogus cards.
The fact hat 70 per cent of the total population have white cards indicates
that there are bogus white cards and ineligible cards. Bogus cards mean that the
existence of cards in the names of the persons not slaying at the places indicated
on the cards or cards in the names of hose who are 1101 existing. Some of such
cards may be available with the FP shop drdnlers. Ineligible cards man white
cards obtained by the families who arc not eligible for such cards n pr the

norms prescribed for such cards. Though their annual iilcame is morc lh
Rs. 1 1,000, they obtained white cards suppressing their income. S h e white CpFd
holders are entitled to benefits olher than subsidised rice, families acquired thcs
cards without using them for drawing subsidised rice From four shops. These
cards remain with FP shops dealers who draw the rice and divert it to the black
market.
4.19.1 Three - Tier System of PDS
PDS is a tier - system with the following agencies each dealing with the
commodities indicated against them.
1 . Supplier: 1. Foodgrains - FCI 2. Edible oils - State Trading Corporations of India. 3. Sugar - Sugar Factories. 4. Kerosene - Oil Depots.
2. Wholesaler: 1. Foodgrains - AP State Civil Supplies Edible Oils Corporation Limited and Sugar .
2. Kerosene - Wholesalers,
3. Retailer : 1. All the commodities, including kerosene FP shop. 2. For kerosene where FP shops are not dealing in
kerosene - nominated retailers 1 hawkers.
Allotment of essential commodities is made by the Oovetnmeet of India
every month for PDS. The Commissioner of Civil Supplies (CCS) allot8 these
commodities district - wise, based on the number of cards. The collectnrs in tfre
districts reallot to the FP ship dealers.

The AP State Civil Supplies Corporation Limited is the agency for liftiqg
the commodities lifts foodgtains From the FCI, sugar from sugar factories and
palmolien oil fram the State Trading Corporation (STC). This is transported to
the MLS points numbing 430 and &red there. From rhen they are transported
to the FP shops for onward distribution to the ultimate consumers. The MLS
points cover 2 to 3 mandals.
The wholesales, who are the dealers of the oil companies and licensees of
the Government; lift kerosene from the oil depots in the state as per the allomnt
given by the collectors, transport and deliver to the FP shop dealers and others as
per the allotment ~ r d e r . ~ '
4.19.2 Commodities Distributed Through PDS in A.P.
The following commodities are distributed through PDS in A.P.
4.19.3 Door Delivery
Commodity Rice Wheat Sugar Palmolein oil Kerosene
The unique feature of PDS in Andhra Pradesh is the sywm of delivery of
stocks at the FP shops points in all areas outside the metroplilati cities ils per a
mute programme. Stocks are lifted in one ~wnlhly irWslmcnt to ihe extent
possible and in exccptiolwl ca r s in two iin~talin~tltfi, lo eWre cmtinuw
availability of the cownadities lo the c~llSUillC~S lhr~ugh Out the IlWnL.
279
Average Quantity Distributed per Montb 1,91,7MMTs. 13,000 MTs. 28,267 MTs. 7,000 MTs.
72,288 KLs.

Wheat is allowed upto 30 Kgs. per month uniformly for all the cardholder
at Rs.7.50per Kg. White cardholder ate pmnitted to take wheat in 4 installments.
In cities, sugar is supplied upto a quantity of 3 Kgs, per white card and 5
Kgs. per pink card. In urban areas, sugar is supplied at 1 to 3 Kgs. per white card
and 3 to 5 Kgs. per pink card. In rural areas, sugar is distributed at 1 lo 2 Kgs.
per white card and 2 to 5 Kgs. per pink card. All the cardholder are charged a
uniform rate of Rs. 12 per Kg.
(3) Palmolein Oil
All the cardholder are supplied Palmolein oil at 2 Ks per white and pink
cards, subject to allotme~t by centnl government at Rs.26.00per IitrdKg.
(4) Kerosene
Kerosene is supplied upto 3 litres per card in rural areas and uplo 10 litm
in urban areas. In Hyderabad city a white cardholder can draw uplo 23 lltres af
Kerosene per card and pink cardholder upto 10 litres. CardhoMns WJI LW
connections are eligible to draw upto 3 lirres per card, provided they have only
single LPG cylinder. All the cardholders are charged R 5 . 3 . w ~ liur.

4.19.4 Margins to FP $hop Dealers
FP shop dealers are allowed the following margins :
Rice : a. In rural areas Rs. 12.92 per Qtl +gunny b. In cities RS. 17.1'1 per Qtl+gunny.
Wheat : a. In rural areas Rs.10.00per Qtl+gunny
b. In cities Rs.15.00per Qtl+gunny
Sugar : a. In rural areas Rs. 8.50 per Qtl +gunny
b. In cities Rs. 15.28 per Qtl +gunny I
P.oil : Rs. 1001- per quintal1100 pouches
Kerosene : 12 paise per litre.
4.20 LOOPHOLES IN PUBLIC DISTRIBUTION SYSTEM
The following leakages in PDS can take place at various levels and in
various forms.
(1) The leakages may take place right at the godown level and food
may not reach the village or the town.
(2) The leakage may take place at villageltown level. The foodgrains
may reach the village but the fair price shop dealer may divert a part of allotted quota to the open market. He may collude with
higher authorities in this operation.
(3) The leakage may also take place at household level. The
card-holders ma)! purchase from ration but sell it in open market at higher prices. -

The extent and form of leakages depends upon the coverage and the
manner in which foodgrain is distributed. Needless to say, the extent and h of
leakages is likely to vary from one state to another.
Due to the existing PDS network the leakages at the fust level, i.e.,at FCI
godown level is minimal. The system of delivering the foodgrains at the doorstep
of the Fair Price Shop (FPS) appears to be working reasonably well in most of
the parts of the state of A.P. In states like Uttar Pradesh and Bihar, rhe FPS
dealers have to lift their allotment from FCI godowns and transport it to their
shops at their own expenses. Consequently, leakages at first level are high and
many times the foodgrains do not reach the villages. The leakages at the second
stage; i.e.,village or town level in Andhra Pradesh are likely to be substantial.
The income of FPS dealers is very low. The dealers gross margins per month
vary village to village. It is but natural for the FPS dealer to increase his income
by resorting to malpractices which take various forms. The dealer may possess
bogus cards and the quota obtained on'such cards may be diverted to the open
market. The state government is aware of this problem and has taken half-hearted
measures to weed them out. In the process some of the deserving households lost
their entitlement to subsidised rice. It was found that in 1992 the number of ration
cards in circulation (139 Lakhs) exceeded the estimated number of households
(121 Lakhs) by about 15 % or by 18 Lakhs.

In rice surplus districts some of the white card-holders may have their own
home-grown stock and hence they may not buy from ration shop. Such quota may
also be diverted to the market. Some of the poor households may not buy their
full quota of sugar which may also be diverted to the market. Very poor
households may hypothecate their cards with the money lender. The FPS dealer
in collusion with the money lepder may divert the quota to the market.
The leakages at the third level, i.e, household level are not likely to be
much, because the price of rice in the FPS is much lower than the open market
price of coarse cereals. However, it is possible that some of non-poor households
having white card may use the rice obtained from ration to feed their cattle
National Sample Survey Organisation (NSSO) in its 42nd round (1986-87)
collected information on utilisation of Public Distribution System (PDS). The
r e d t s of the survey reveal that in case. of rice and sugar, nearly 60 per cant of
the rural households depend partialIy or wholly on PDS. In case of kerosene, the
percentage is slightly higher at 65 per cent.25
From table 4.13 it is clear that PDS in the least source of supply of wheat
both in rural and urban areas. With respect to other commodities dependence an
FDS ranged from 66 per cent for kerosene to 47 per cent for edible oil in rural
areas, and from 86. I5 per cent for sugar to 47 per cent for rice in urban arm$.
For those using PDS, it supplb the their requirements to more than 50 per cent.
283

Table 4.13 Monthly Percapita Purchases from PDS in Andhra Pradesh
Note : Figures in brackets indicate percentages of per capita quantities to per user quantities.
Source: ' NSSO Report No.362.
In urban area, half of the households purchase rice and kerosene from fair
price shops and 70 per cent visit FPS to purchase sugar. A rural household with
a ration card, on an average, buys slightly over 4 Kgs. of rice, about 0.5 Kg, of
sugar per person per month. If the total population is considered, then the per
capita quantity of rice distributed through PDS and quantity purchased per user
arises because of incomplete coverage of PDS. Similar pattern is observed in
urban area, On the whole, PDS rice forms about 18 per cent of cereal
consumption per household in Andhra Pradesh.
About of the households in rural area could not buy rice because
either they have no entitlement or no ration card (table 4.14). For Similar reasons,
about 17 per cent of the households could not buy sugar. The corresponding
figure for kerosene is much higher i.e. over 40 per cent. In urban area one-half
of the households could not buy from ration because they have no entitlement or
no ration card.

Table 4.14
Percentage of Persods Having No Entitlemend No Ration ~ a r d l i in Andhra Pradesh
Source: NSSO Report Nos.355 and 362.
Item
Rice
Sugar
Kerosene
In short, on account of various reasons in the backward villages a large
percentage of poor households are excluded from the scheme while a sizeable
percentage of beneficiaries of the scheme belong to the non-poor category. In
developed villages, the scheme has provided access to food to most of the poor.
However, a large percentage of beneficiaries are non-poor households. Leakages
at second level. i.e.,at village level, are likely to be substantial.
4.20.1 Utilit ion of PDS in A.P.
Rtiral
24.14
17.53
41.60
The information furnished in the National Sample Survey Organisation
(NSSO) report on utilisation of PDS (Report No. 362) and consumer expenditure
Urban
44.83
53.82
53.42
patterns (Report No. 35511 and 35512) can be put togefher to obtain interesting
insights on the utilisation of PDS in Andhra Pradesh. The results are summarised
in table 4.15 through 4.17.

Table 4.15
Percentage Distribution of Persons by Purcbase code in Andtrra Pmdesh : 1996-97
Notes: 1. Purchase code : Purchasing only from PDS. 2. Purchase code : Purchasing only from Market. 3. Purchase code : Purchasing from both PDS and Market. 4. Purchase code : Those who do not purchase.
Source: NSSO Report No. 362 and 35512.
Around 80 per cent of rural population in Andhra Pradesh purchase rice
from one source or the other. Nearly 60 per cent of consumers depend either
partly or wholly on the PDS:On the otherhand, 22 per cent of the population are
compelled, for various reasons, to make purchase from the open market. Nearly
20 percent of consumers do not purchase mainly because they have home-grown
stock. The consumption of wheat is not popular in rural areas and only less than
5 per cent of rural population purchase wheat.
In urban areas, over 93 per cent of the population purchase rice and nearly
47 per cent of them buy exclusively ftnm the open market. Anather 47 per cent
buy either partly or wholly from the FPS. The percentage of people buying
exclusively from the PDS is below 5 per cent, indicating that the quantity of rice
supplied through the PDS 1s much below their requiremat.

Unlike in rural areas, a sizable percentage of urban population that is, 28
per cent, purchase wheat. Around 13 per cent of urban population manage witb
the quantity supplied through the FPS. Another 13 per cent depend exclusively
on the open market. OJy less than 1 pkr cent of the urban population purchase
both from the PDS and the open market. It appears that wherever wheat is
supplied through FPS, people buy from it and the quantity suppiied is sufficient
to meet their requirement, and wherever it is not supplied, people have to resort
to the open market.
The percentage of population purchasing rice exciusively from the open
market in urban areas (47 per cent) is much higher than that in rural areas (22 per
cent). Further, in rural areas nearly 60 per cent of the population purchase either
pantry or wholly from the PDS, while the corresponding percentage in urban
areas is only 47 per cent. Besides, the percentage of consumer purchasing
exclusively from the PDS is much higher in rural areas (18 per cent) than in
urban areas ( 5 per cent).
Table 4.16 Extent of Food Security Provided by PDS
in Andhra Pradesh in 1996-97
Source : NSSO Report No. 362 and Report No. 355.
287
% ge PDS Rice purchases Tdal CePeal
18.19
t7.53
18.06
% ge PDS Rice Purchases in Total Rice Consumption
23.07
20.00
22-41
Region
Rural
Urban
Andhra Pradesh
% ge PDS Rice Purchases in Total
Rice Purchases
32.54
21.47
29.63

Rice is the most popular item distributed through the PDS in Andhra
Pradesh. Therefore, the extent of food security provided by the PDS in Andhra
Pradesh may be measured by (a) the percentage of PDS rice purchases in total
rice purchases and (b) the percentage of PDS rice purchases in total rice
consuinption. The analysis reveals that in Andhra Pradesh nearly 30 per cent of
rice purchases are made from FPS and form over 22 per cent in total rice
consumption. The corresponding percentages are 32 and 23 in rural areas and 20
in urban areas. Thus, the extent of food security provided by PDS appears to be
higher in rural areas.
In rural areas, for nearly 47 per cent of the respondents the quantity
distributed through FPS was insufticient, while 20 per cent of the respondents had
no entitlement, only 13 per cent of the population was found to be not requiring
rice (see the table 4.17). This may be due to the availability of home - grown
stock. Only very few persons (2.26per cent) complained about the quality of rice.
With regard to wheat many (80 per cent) did not buy as they did not require it
and some (16 per cent) could not because of its non-availability in the radon
shop. In urban areas, over 42 per cent of respondents could not purchase rice as
they had nQ entitlement. Over 40 per cent of respondents made only part
purchases as the quantity supplied through FPS was insufficient with regard to
wheat. Many (70 per cent) did not buy wheat as they did not require it. About 18
per cent could not because of non-availability and 7 per cent could not because
of non-entitlement. In short, in both rural and urban areas, the main reasons for
making part purchase or no purchase from PDS are: (a) non-entitlement (b) non-
availability. poor quality and insufficient availability.

Table 4.17
Percentage Distribution of Persons not Wholly Dependent on PDS over Reasons for No PurchaseIPart Purchase for Selected Items
Source : NSSO Report No. 362
Reason for No Purchase/Part Purchase
Not Credit Others Total Item Not Not No Quantity
Rural
Not
100.00
100.00
8..61
2.34
Rice
Wheat
Urban
19.80
1.84
100.00
100.00
4.08
2.34
13.00
79.23
1 Rice 1 42.69
Wheat 7.08
0.05
0.00
0.33
0.00
0.71
0.00
0.19
0.30
3.90
69.91
46.51
0.13
7.49
16.21
2.26
0.21
40.79
0.56
2.74
17.50
5.07
2.15

The percentage of ibopk not making purchases from ihe PDS on account
of non-entitlement is relatively ,high in urban areas. The percentage making part
or no purchase on account of non-availability of items is higher in rural areas. In
other words, the coverage of the PDS, in terms of percentage of cardholder. is
better. in rural areas; but the supply of ccknmodities appears to be better in urban
areas.
There are some micro-level studies which have examined the extent of
benefits derived from PDS. For instance, Sastry in a study of Rayalaseema area
found 78 per cent of poor house - holds were covered by the subsidised rice
scheme and that each beneficiary household got 19.5 kg of subsidised rice per
month.26 They noticed that non-target groups were also enjoying the benefits of
the scheme. However, the extent of leakage in the PDS was much smaller (22
percent) than in the IRDP (61 per cent) and other schemes. In another study,
venugopal observed that the subsidised rice scheme ensured access to grain during
the off-season at low prices to the poor.n The study of Meera Selchar reveals
improvement in nutrition standards of households covered under food security
scheme."
4.21 AN OVERVIEW OF FP SHOPS IN A.P.
There are 40,006 fair price shops in the state. Out of them 7,167 are in
urban areas and 32,839 are in rural areas. On an average, each shop is catering
to 41 1 cards/families. As against Central Government norms of one fair price
shop for every 2,000 persons, there is one shop for every 1,650 persons in A.P.
Similarly as against the Government of India's norm of locating a FP shop within
a distam sf 2 Krns. from the residence of cardholder, A.P. has aimed at reducing
the dis*mnce to 1 Km. as far as possible.

431.1 Reservation in Appointment of FB Shop Dealers
The following reservatiom are prescribed in the matter of appointment of
FP shop dealers.
i. Scheduled Castes .... 15percent
ii. Scheduled Tribes . . . . 6 per cent
iii. Backward Classes . . . . . 25 per cent
iv. Physically Handicapped . ... 3 per cent.
30 per cent of FP shops are reserved for women. Each Revenue
Division/Circle is a unit. Of the 40,006 shops, 1,886 shops are run by
co-operatives, 6,904 shops by scheduled castes 1,447 shops by scheduled tribes,
10,785 shops by backward classes, 790 shops by physically handicapped 17,285
by others and 12,894 by women.
FP shops are generally allotted to local people so that they are accessible
to the consumers and in exceptional cases, where no local comes forward, people
living in the neighbouring places are preferred. The minimum qualification
prescribed for the selection of the FP shop dealer is 10th class. In the event of
persons with this qualification being not available, people with lesser
qualifications are also selected.
4.21.2 Supervision of FP Shops
The key stone in the PDS is the FP shop and the kingpin of the system is
the FP shop dealer. The success of the scheme depends upon how efficiently and
effectively the shops are run. To achieve this, there is a need for effective
supervision. There should be purposeful inspections of FP shops rro that ?he

commodities supplied at suhidised rates do reach the targeted group without any
diversion. Inspection schedules have been drawn for the enforcement officials , .
right from collector to deputy thasildar. In order to ensure that there is no
misappropriation of stocks at the MLS points, inspection targets have been fixed
for the officials. The target fixed for inspections i.e. frequency of inspections in
a month, is as follows :
Table 4.18
Inspecting Authorities and Frequency of Inspections to FP Shops and M t S Points
S1' No.
1
1.
2.
3.
4.
5 .
6.
7.
8.
Inspecting Authority
2
Collector
Joint collector
District Supply Officer
Revenue Divisional Officer
Mandal Revenue Officer
District Manager
Inspector of Police (Vigilance Cell)
Dist. Inspector of Legal Metrology
Frequency of Visits in a Month
FP Shops
3
5 in a month
7 in a month
10 in a month
10 in a month
10 in a month
--
10 in a month
-..
MLS Points
4
1 in a quamr
1 in a month
4 in a montb
2 in a month
1 in a month
4 ill a month
4 in a month
4 in a month

There is a Vigilance Celt (VC) attached to the civil supplies department to
enforce the various acts and control orders and prevent black marketing, hoarding
and smuggling of essential commodities.
Food Advisory Committees (Vigilance ,Committees)
There are Food Advisory Committees at the following levels:
(i) State (ii) District (iii) Corporation (iv) Municipality (v) Circle (vi) Ward (vii) FP shop (Rural) (viii) FP Shop (Urban)
These committees consist of officials, representatives of people,
representatives of recognised political parties, women, youth and representatives
of the trade. These committees oversee the functioning of the PDS and advise the
Government on the measures to be taken to improve the system and to plug the
loopholes in the system. While the committees in the State, District and
Corporation levels should meet once in a quarter, all other committees should
meet at least once in a month.
4.22 EFFECTIVENESS OF PDS IN ANDHRA PRADESH
In Andhra Pradesh, PDS is being implemented effectively by taking the
following measures :
( I ) Timely lifting of essential commodities from PC1 and other agencies.

(2) Moving tben to the MLS points for onward transportation to h e FP shops through a route prograryne.
(3) Delivery of the stocks at the door steps of FP shops by the Government
agencies.
(4) Supply of assured entitlement every month.
(5 ) Review of PDS periodically by the vigilance committees at various levels.
(6) Exhibition of samples at the FP shops.
(7) Minimum one FP shop in each village.
(8) Subsidised supply of FAQ, finelsuperfine rice to consumers.
(9) Periodical checks by different officials from time to time.
(10) Provision of bank loan to FP shop dealers belonging to SC, ST a d BC communities.
(1 1) One FP shop for an average population of abaut 1,800 and within a radius of less than 1 Km. in Tribal areas and within a radius of less than 2 Km,
in other areas.
Infact, many state governments have deputed their officials to Andha
Pradesh to study the PDS of the state. This is because of Andhra Pradesh has
been acclaimed as one of the very few states which has been implementing the
PDS effectively by covering the entire population of [he state under its fold.

4.23 SUBSIDIES
The performance of ~ ~ s ' d e p o d s on foodgrains procurement operations
of the central government as well as the.distribution of subsidised grain by state
govehents . Ever since the Telugu Desam come to power largely on the basis
of its electoral promise of cheap rice at on 2 per Kg. rice subsides have been a
major issue in Andhra ~radesh polities. There are no parallels for such a
development in other states. To appreciate the transformation of the state
governments role, see table 4.6. Which presents the central and state subsidy
amounts for, one tonne of rice for the period 1980-81 to 1994-95. The central
subsidy is the difference between the issue price and the economic cost consisting
of costs of procurement, storage and transport. The state subsidy is the difference
between the central issue price and the issue price at retail outlets. As table 4.19
shows the state subsidy in Andhra Pradesh has been increasing over the years and
has been substantially greater than the central subsidy in recent years. This is in
contrast to the other states where the state government subsidies are significantly
smaller than central subsidies. The Andhra Pradesh rice subsidy scheme is also
notable for efforts to target the beneficiaries. Those identified as paor are issued
a white cards which enable them to receive higher subsidies than non-poor or
pink card holders. In terms of political commitment, the extent of state
government's funding and the targeting design, the A.P. programme is a clear
departure from the other states as well as from its own past.

Table - 4.19 Central and State Subsidy on a Tome of Rice in A.P.:
1980-81 to 1994-95
Notes : I . Fi ures in brackets are percenta es to horizontal totals. 2. d : NO^ Significant u 5% lev$. 3. ** : Signif~ant at I % level. 4. * : Significant at 5% level.
sauroes: 1 . Economic Survey, Ministry of Finance. Governmnt of India. 2. M e d u r n of Andhn Pradesh submit14 to the 10th Finance
Commissidn and Explanarory Memorandum of A.P. volume VL? pp.240-24 1

Total subsidy and its break-up as central and state shares of subsidies per
taRne are shown in table 4.19. Yearly average amount of subsidies per tom by
Central and State Governmenti separately and by both the Governments put
together are Rs.830.93,Rs. 1,249.89and Rs. 1,913.77per tonne respectively. C.V.
value,of State Government subsidy is of higher magnitude (68.18 per cent) than
that of Central Government (35.54). LGR and CGR of state subsidy are 15.84 and
26.60 per cent respectively which are higher than those of Central Government,
that is, 6.56 and 7.57 per cent respectively. t-values calculated for LGRs of
subsidies by Central and State Governments are statistically significant at 1 pu
cent level. r-value of central and state subsidies are 0.83 and 0.91 respectively.
Whenever the prices of oils go up in the state, to contain the price rise
palmolien oils is released at the subsidised rate. Kerosene is also subsidised by the
Government of India as well the State Government. Kerosene is a poor man's
commodity and its price is pegged very low to enable the poor to purchase this
at affordable price. Government of India is incurring an amount of about Rs.S,800
to 6,000 crores per annum, on release of kerosene. Government of Andhra
Pradesh is supplying kerosene to the cardholders in the state at a uniform rate of
Rs.3 per litre. The ex-depot issue price varies from depot to depot as the transport
charges from the refinery to the depot vary. Similarly, from depot to wholesale
point also the transport charges vary. The wholesale price of kerosene, therefore,
differes from district to district. However, in order to supply kerosene at unifonn
rate of Rs.3.00per Kg. to the consumer, the wholesale rate is fixed at Rs.2.88per
litre. The retailer,'receiving kerosene at this rate and adding margin of 12 praise
per lirre, sells the kerosene at Rs.3.00 per litre. As the wholesale price on sn
average works out to Rs.2.98per litre, the Governnlent of Andhra Pradesh incurs
a subsidy of 10 praise per litre. A quantity of 8.67 lakh kilolives of kerosene
being distributed presently, and on this the subsidy works out to Rs.8.67 crorw,
per annum.

Though PDS is functioning fairly satisfactorily it cannot be said that there
are no loopholes in the distribu,tion, which require to be effectively plugged.
The following are some bf the suggestions in this regard.
(1) Instead of variable subsidy, it is better to allow a constant amount of subsidy by increasing the price of rice supplied through PDS, whenever FCI effects increase in the issue price of rice.
(2) At present 70 per cent of the state's population is covered under white (BPL) cards and they 'are supplikd rice at subsidised rate. As already mentioned, this is because of existence of bogus cards. There is absolute need for weeding out the bogus cards. At the same time, thete is need for issuing white cards to the genuine families which are really the targeted group, to achieve the objective of PDS.
(3) The subsidy amount of about Rs. 1,062crores per year is a heavy burden; for a state like Andhra Pradesh. Since this is a welfare scheme aimed at ensuring the poorest of the poor to have two square meals a day, government is prepared to meet this expenditure. However, optimum economy has to be maintained by the agencies involved in the scheme. This is possible by taking the following measures :
(a) Proper handling of stocks to avoid spoilage of stocks and resultant shortages.
(b) Observation of utmost economy in transport charges and administrative charges. '
(c) Minimisation of transit and storage losses. (d) Proper verification of the stocks periodically to prevent
misappropriation of stocks. (e) Immediate deposit of the cost of grains received by the Andhra
hadesh State Civil Supplies Corporation Limited (APSCSCL), so that the interest on cash credit could be reduced.
The amount of subsidy which was borne by the Government of Andhra
M e s h was Rs.78.69crores in 1983-84, which has touched Rs. 1062.80crores per
annum during 1998-99. Table 4.20shows the subsidy incurred by Andha Rdesh
every year since 1983-84. .

Table 4.20
Notes : 1. Figures in Parmtheses are annual percentage increases ovcr the nsprclive p r d i n g annual .amounts. 2. NS : Not Significanl at 5% level. 3. ** : Significant at 1 % levd. 4. * : S t g n ~ f ~ y t a( 5% Icvcl.
.%wee: Civil Supplics Depanmenl, Govcrnr~wt~~ of A~dhct Yrrdesli.

Quantity of rice released by A.P. State Government and amount of subsidy
incurred by it are shown in table 4.20. Yearly average of rice released for PDS
in A,P. is 20.2744 lakh tonnes, and of subsidy incurred Rs.43 1 .SO28 crores. C.V.
values of stock released and subsidy incurred are 24.30 and 80.13 per cent
respectively. Annual LGR and CGR of subsidy incurred are 13.45 and 23.00 per
cent respectively, which are of higher magnitude than those of quantity released,
that is, 2.83 and 5.01 per cent respectiveIy. Both the growth rates for stocks and
subsidies are significant at 1' per cent level of significance. r-values of stock
released and subsidy incurred are 0.623 and 0.896 respectively.
4.24 SUGGESTIONS TO PROVIDE BETTER SERVICE TO
BENEFICIARIES UNDER PDS
The following suggestions meant for attention:
(1) Procurement of essential commodities for distribution should be of Fair Average Quality (FAQ) and there should not be any compromise in the quality at the time of procurement by the procuring agencies.
(2) At the time of lifting of essential commodities from various agencies, care should be takeh not to lift essential commodities of substandard quality which does not conform to FAQ specifications.
(3) FP shops should adhere to the timings fmed and make themselves available as per the timings to enable the consumers to draw the stocks according to their full entitlement.
(4) Efforts must be made to see that h e FP shop dealers charge the prescribed rates.
(5) Stocks should be released with correct weights.
(6) Care should be taken to ensure timely release of stocks to the FP $bops.

(7) In case the FP shop dealer is not financially sound to lift the stocks allotted for him bank loan may be given so that for the inability to lift the stocks by the FP slkp dealer cardholders should not suffer.
(8) Publicity of the availability of stocks, per capita entitlement per cardlper . month should be given for the benefit of the consumers.
(9) Government shouId not be complacent by allotting the quantities, assuming that they. are reaching the consumers. Whenever any complaints against any FP shop dealer or the district administration in the distribution are received, they may be checked up by an agency other than the district administration to have an unbiased report. It is incumbent that the state officials should conduct surprise checks at Mandal Level Supply (MLS), points to have a correct view of the situation.
(10) The consumers need to be educated of their legitimate right and the agencies to whom they could approach in case of denial of his rights.
4.25 PUBLIC DiSTRIBUTION SYSTEM NEEDS REORIENTATION
The public Distribution System (PDS) has been considered as an
instrument of government policy for influencing the open market prices of
essential commodities and for ensuring fpod security at the household level. While
the central government procures and supplies essential commodities such as
wheat, rice, levy sugar, imported edible oils and Kerosene to the states at fixed
Central Issue Price (CIP), the state governments take up the responsibili$ of
distribution of the'same to the public through fair price shops (FPS).
However, the recent policies of the central government in pruning the
food subsidy by making the PDS focussed towards the poorest of the poor have
already adversely affected the feasibility of PP shops in the country and may
ultimately result in extinction of the entire ne~work, which has been built with
dedication and hard work over a fairly long peritd of time.

The availability of a FP shop depends upon a number of factors such as
the number of cards allotted to.the shop, the number and volume of commodities
distributed, by the shop, the rates of commission paid on the commodities
distributed the cardholder's demand for the PDS commodities which, in turn,
depends upon the difference between the PDS price and the open market retail
price, and the quality of the commodities distributed by the FP shop and the
availability of working capital to the FP shop dealers at affordable interest rate.
Several changes have taken place in recent times in the number of
commodities distributed to the cardholder under PDS.
1.a Sugar has completely been withdrawn from the PDS for APL category card-holders and the quantity of sugar distributed to the BPL category card-holders has been restricted to lkg per card, irrespective of the
number of family members.
1 .b As for as kerosene is concerned, those who are having LPG connection, irrespective of their category, allotment is restricted to 3 ltcs. Per cardholder. ~urther; the cardholder is not entitled to supply of kerosene if he has a spare cylinder. .
2.a Further, subsidy on ricelwheat supplied to the APL category consumm
has been reduced by increasing the price of ricelwheat supplied.
Consequently the APL cardholder have practically stopped buying ricelwheat from the FP shop.
2.b Similarly, both the APL and BPL consumers have stopped buying rice in
Northern States and wheat in Southern Stales from FP shops as the open market retail price is much less than the PDS price.

2.c The flood of importstof edible oils, especially palmdein and soybean, into the country made .them cheaper in the market. This has made the
distribution of palmoleih unattractive to the FP shop dealers.
3. Further, the rates of commission applicable to various commodities distributed under PDS have not been revised in many states for a long
period of time.
Each of the above factors has contributed its own might in making the FP
shop unvialable. The decline in income of some of the shops surveyed is about
50 per cent on an average between March 2000 and March 2001, while the
expenditure remained the same. The highest decline in income from commission
is in the case of distribution of palmolien and wheat (loo%), followed by sugar
(73-93%) and rice (10-202). This has resulted in negative income lo the dealers
of FP shop when the expenses are deducted from the income from commission.
The rates of commission paid to the FP shop dealers have remained
unchanged since June 1999. At present, they are getting a commission of about
Rs. 32 per quintal of rice and about Rs. 33 per quintal of sugar in urban areas,
which include revenue generated by the'^^ shop on the sale of empty gunny bags.
In rural areas the commission rates are still lower. This has further aggravated the
problems of the FP shop dealers and affected the viability of FP shops.
The government shall make every effort to protect the wide nebwork of
FP shops, which are at the verge of closure due lo their mn-viability.
Diversiticatio~l of the FP shops, by introducing more number of non-PDS
commodities into the system, is the only way to tnake the111 viable.

It may be mentioned in this context that the A.P. State Civil Supplies
Corporalion was established by the government with an objective of protecting
the interests of the consumers by making the essential commodities available to
them at affordable prices. Incidentally, tl~is will also help tbe farmers in
processing and supplying the essential agricultural commodities, if the corporatian
procures the foodgrains directly from them at the time of harvest by pay@
remunerative price to them. he main objective of protecting the interest of h e
consumers will be served if the procured commodities are disrributed to the
consumers at an affordable price by charging a reasonable margin. This may be
done by using the brand name of the corporation to ensure the quality of the
commodities.
PDS in Andhra Pradesh is one of the effectively managed systems in the
entire country. Fair price shops spread over the nook and corner of the state.
While some of the commodities such as APL rice and wheat and palmolein have
disappeared from the shelves of FP shops, as the open market retail prices of
these commodities are much lower that! the consumer price under PDS, tben has
been substantial reduction in the quantities of sugar and kerosene supplied by FP
shops.
As a first step in the direction of weeding out the bogus ration cards, the
state government has introduced coupon system for distribution of rice for this
category of cardholder. This has yielded positive results in weeding out a
significant number of bogus BPL ration-cards. However, the reduction in the
number of such cards is more pronounced in rural areas than in urban areas.

4.26 CONCLUSION
PDS is instrument to ensure food security. It was introduced first in 1973
throughout A.P. State. With 32,839 and.7.167 FP shops in urban and rural areas
respectively, PDS in A.P. is the largest in India. Rice is staple cereal in ADdhn
Pradesh. To implement PDS, A. P. State Government procures 50 per cent of rice
milled from millers/traders a; levy, allowing other M per cent be sold in open
market either in the state or outside. Subsidised rice scheme was introduced in
A.P. in 1983. 113.05 lakh families are covered under the scheme in 1999.
Three-tier system of distribution with FP shop dealers in the lower-tier, exists to
ensure proper distribution of essential commodities. To ensure efficiency in the
system, margins are fixed to FP shop dealers for each commodity. Besides this,
surprise checks by public authorities and food committees constituted and
functioning at different levels, avoid leakages in PDS. State share of subsidy on
rice has been increasing over the years vis-a-vis centre's share of subsidy. There
are block spots in PDS in A.P. : exclusion errors, that is, exclusion of eligible
families from PDS; inclusion errors that is, inclusion of families not eligible for
benefits under PDS. The scale of commodities distributed through PDS in the
state is low compared to the per user quantities, which indicates increasing
dependence of families on open market for supplies. 'To avert this trend, effective
targeting of the families is required.

. REFERENCES
1. A. Gupta. "Public ~istribution of ~ a o d ~ r a i n s in Indiat1, CMA Monograph
No. 69, IIM, Ahmedabad, 1977.
2. N. Dholakia, and R. Khurana, (ed.) : "Public Distribution Systems :
Evaluation and Prospects", Oxford and IBH Publishing Co., New Delhi,
1 979.
3. S.L. Bapna "Public Distribution System and Food Security in India",
CMA Monograph, Indian Institute of Management, Ahmedabad, 1988.
4. A. Gupta, Op.Cit., P.99.
5 . S. N.V. Siva Kumar, A study of "Public Distribution System in India with
Emphasis on Andhra Pradesh", thesis submitted to University of
Hyderabad, A.P., 1989.
6. Ibid., P.155.
7. Prasad, Kanta "Scope and Functioning of Public Distribution System in
India" in A.K.Singh et al. (ed) Economic Policy and Planning in India, Sterling Publishers, New Delhi, 1984.
8. N. Dholakia and R. Khurana, 0p.Cit.
9. R.Radhakrishna, "Food Trends, Public Distribution System and Food
Security Concern", Indian Journal of Agricultural Economics, Vo1.51,
Nos. l and 2, Jan-June, 1996, pp. 172-173.

National Sample Suivey Organisation, "Food Access to the Poor" (July 1998-June 1999). Part:l-Notes, Sarvekshana, 2000, Special Number : S- 1-S-424.
Ruddar Datt, "Food Security in India: The Emerging Challenges in the Context of Economic Liberalisation", National Seminar Organid by
Centre for Economic and Social Studies, Hyderabad on March 25-27,
2000, p.14.
M.H. Suryanarayana, "PDS Reform and Scope for Commodity Based
Targeting" (Mimeo) 1995.
D.S. Tyagi, "Managing Indian's Food Economy : Problems and Alternative", Sage Publications, New Delhi, 1990.
Jha, Shikha and P.V. Srinivasan, "On Targeting Food Subsidies" in K. Seeta Prabhu (ed.) Reforming India's Social Sectors: Strategies and
Prospects, Sage Publications, New Delhi, 2000.
Jha, Shikha and P.V. Srinivasan, "Grian Price Stabilization in India :
Evaluation of Policy Alternatives", Agriculture Economics, Vnl21,1999,
pp.93-108.
Government of India, Report of the Working Group on "Public
Distribution System and Food Security" for the Tenth Five Year Plan
(2002-2007), Planning Commission. November 2001.
M. Swaminathan, Weakening Welfare, "The Public Distribution of Food
in India". New Delhi, 2000.
N. Krishnaji, and T.N. Krisht~n, "Public Support for Food Sccuriry", New DelhiIThousand OakslLoncloa Sage Publications, 2000. p. 15- 16.

19. K .R. Venugopal, ' "D,eliverance from Hunger : The Public Distribution System in India", Sage Publications, 1992, New Delhi, p.223.
20. J. Satyanarayana and S.V. Satyanarayana, "Price Stabitisation of Esstllrlal Agricultural Commodities : AnInsight into Andhra Pradesh Experience",
. Quality Publishing Company, Bhopal, 1999, p. 133.
21. S. Indrakant, "Public Distribution System in Andhra Pradesh with Special Reference to Rice",' Indian ~ournal of Economics, 72 (286), 1992, 11.261-272.
22. Government of India : Ministry of Finance, Economics Division, Economic Survey, 1994-95, p.86.
23. 1.Y .R.Krishna Rao, : "An Experiment in Food Security", Andhra Pradesh
Economic and Political Weekly, 28(37), September: 1993, pp. 191 1-1914.
24. D. Ahuluwalia, "Public Distribution of Food in India : Coverage, Targeting and Leakages", Food Policy, Economic and Political Weekly, Vo1.8, No. 1,1993.
25. N. Krishnaji and T.N. Krishnan, 0p.Cit. p.256.
26. K.V.S. Sastry, K. Hanumantha Rao and M. Narasinga Rao, "Welfare Implications of Rice Subnsidy Scheme", Paper Presented at the A.P.
Economic Association CESS, Hyderabad, 1990.
27. K.R. Venugopal, "Deliverance from Hunger. The Public Distribution
system in India". Sage Publications, New Delhi, 1992.
28. Shekhar, Meera, Prahlad Rao and Viodini Reddy, "Nutrition in India, Relevant Actions in Andhra Pradesh and Tamil Nadu", National ~ U S t i ~ 0
of Nutrition, ~~deyabad . 1992.