CHAPTER - Information and Library Network...
28
37 CHAPTER – I SURVEY OF ALZHEIMER’S DISEASE PREVALENCE IN CHOSEN MEDICAL COLLEGE HOSPITALS OF TAMILNADU
Transcript of CHAPTER - Information and Library Network...
37
CHAPTER – I
SURVEY OF ALZHEIMER’S DISEASE PREVALENCE IN
CHOSEN MEDICAL COLLEGE HOSPITALS OF
TAMILNADU
38
SURVEY OF ALZHEIMER’S DISEASE PREVALENCE IN
CHOSEN MEDICAL COLLEGE HOSPITALS OF
TAMILNADU
INTRODUCTION
In 1906, Dr. Alois Alzheimer, a German neuroscientist, described the
neuropathological features found in the brain of a 55 year old woman suffering
from progressive dementia. Grossly, there is cerebral atrophy in Alzheimer’s
disease, most marked in fronto temporal association cortices, not affecting the
primary motor, sensory or visual areas of the brain (Perl, 2000). Microscopic
examination typically shows neurofibrillary tangles and plaques. Neurofibrillary
tangles are dense fibrillary aggregates in the cytoplasm of neurons, composed of
hyper phosphorylated tau protiens. Senile plaques are large structures, containing
extracellular accumulation of Beta-amyloid. Granulovacuolar degeneration,
Hirano bodies and amyloid angiopathy are typical associated features in
Alzheimer’s disease (Braak and Braak, 1991).
Alzheimer’s disease develops after the age of 65 years in majority of the
cases. Rarer forms of Alzheimer’s disease occur from the fourth decade of life
until the age of 65 years. Alzheimer’s disease is the fourth leading cause of death
among adults in the United States (Barbara et al., 1998). The prevalence of
Alzheimer’s disease increases with age, being 5% at 65 years of age and doubling
every 5 years (Hendne, 1998). Several studies have shown higher prevalence in
women (Jorm and Jolley, 1998). With the increase in life expectancy and rising
39
population of the elderly, the prevalence of Alzheimer’s disease is expected to
rise in the future causing a major public health problem.
Approximately 4.5 million people in the United States are currently
afflicted with this disorder, and the number is expected to rise sharply in near
future due to the increase in the elderly population, which represents the fastest
growing segment in our society (Hebert et al., 2003). It is estimated that nearly
13−16 million people will suffer from AD by 2050 and, among those, nearly 13%
of individuals over age 65 may be affected (Hebert et al., 2003; Maier-Lorentz,
2000). Most AD cases are sporadic, with multiple risk factors, such as aging,
environmental stress, and diet, suggested to play critical pathogenic roles. The
remaining AD cases, which account for 5−10% of total AD cases, are rare, but
inherited from one generation to the next and are referred to as familial AD
(FAD).
A 2003 epidemiologic report by Wimo and collogues puts the number of
people suffering from AD at 27.7 million worldwide. Although 38% of these
people are from the developed economies and the rest are in the developing
countries. China has the highest number of AD with 5.2 million while USA got
around 5 million Alzheimer's patients. In India, the prevalence of the disease is
4.7 per 1000 person. It ranks seventh among the leading causes of death in 2004,
passing influenza and pneumonia. It is also projected that there are 4.6 million
new cases added every year worldwide and expected to double in about 20 years
time suggesting new identification and intervention strategies to tackle this
disease.

40
Given the fact that AD affects older population, the heath economy costs
of this is estimated to be around 156.2 billion US dollars in 2003 by Wimo and
colleagues. Again, this estimate of the money is spent in the developed countries
on direct cost only. Apart from this, the indirect costs along with other effects on
the health sector implicate the high impact of this disease on the economy. The
2003 estimates put the money spent on AD as follows: USA around 48.6 billion
dollars, Japan 24.7 billion dollars, EU countries together 60.5 billion dollars
(Wimo et al., 2003; 2006).
AD control measures can be well carried out only, if the incidence of the
disease has been found out. Epidemiology data on AD in India is some what
scanty. With the exception of the National Sample Survey (NSS) done in 1955-
58, virtually no other information is available at the national level. In this regard,
the present study was carried out to point out the prevalence of AD cases among
the population enrolled in the four medical colleges of Tamilnadu.
41
MATERIALS AND METHODS
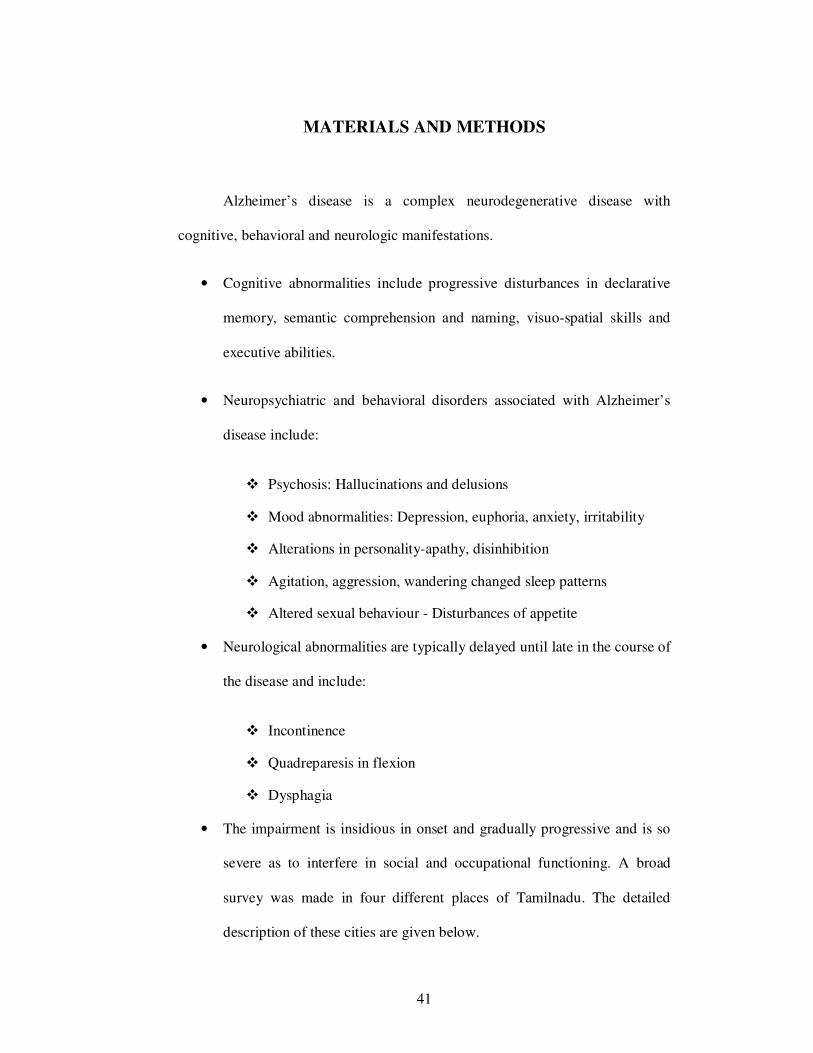
Alzheimer’s disease is a complex neurodegenerative disease with
cognitive, behavioral and neurologic manifestations.
• Cognitive abnormalities include progressive disturbances in declarative
memory, semantic comprehension and naming, visuo-spatial skills and
executive abilities.
• Neuropsychiatric and behavioral disorders associated with Alzheimer’s
disease include:
� Psychosis: Hallucinations and delusions
� Mood abnormalities: Depression, euphoria, anxiety, irritability
� Alterations in personality-apathy, disinhibition
� Agitation, aggression, wandering changed sleep patterns
� Altered sexual behaviour - Disturbances of appetite
• Neurological abnormalities are typically delayed until late in the course of
the disease and include:
� Incontinence
� Quadreparesis in flexion
� Dysphagia
• The impairment is insidious in onset and gradually progressive and is so
severe as to interfere in social and occupational functioning. A broad
survey was made in four different places of Tamilnadu. The detailed
description of these cities are given below.

42
Study Area and population
Chennai
Chennai is the capital city of the State, besides being an important district.
The district city is one of the metropolitan cities of India and serves as the
gateway of the culture of South India. In spite of being the capital of a Tamil
speaking State, it has emerged as a cosmopolitan city playing an important role
in the historical, cultural and intellectual development of India.
Fig. 1. Area map of Chennai (data collection site)
Source: www.mapsofindia.com
43
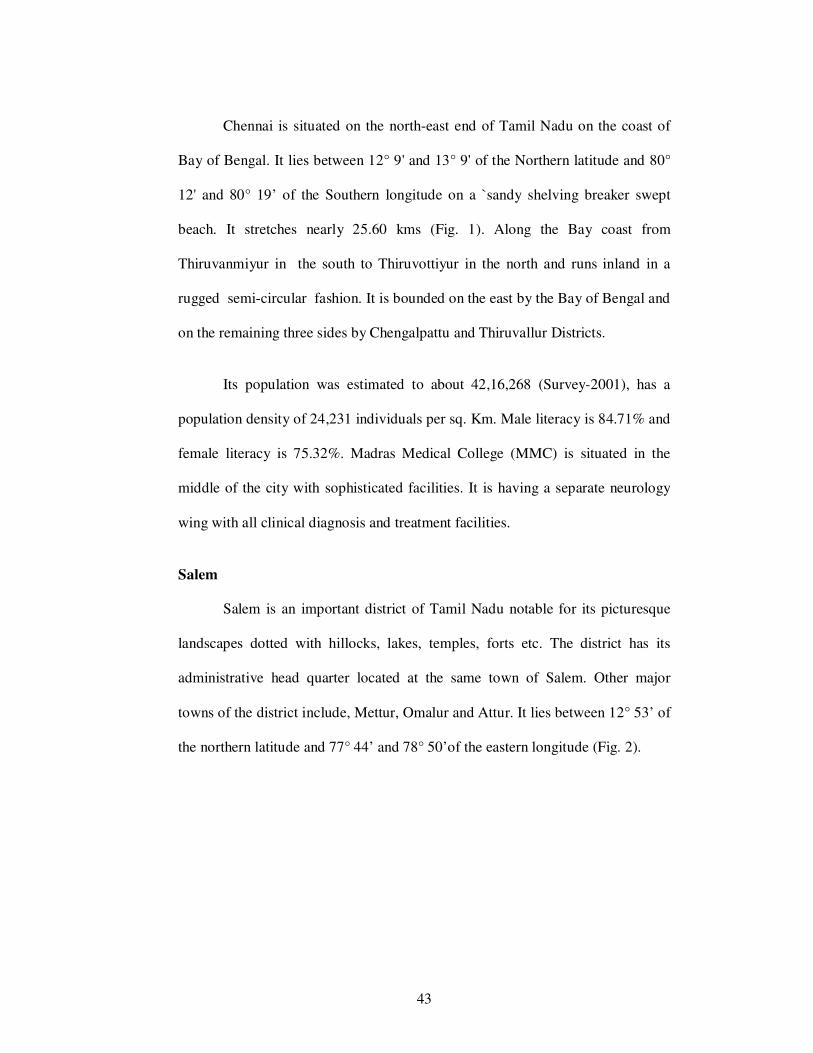
Chennai is situated on the north-east end of Tamil Nadu on the coast of
Bay of Bengal. It lies between 12° 9' and 13° 9' of the Northern latitude and 80°
12' and 80° 19’ of the Southern longitude on a `sandy shelving breaker swept
beach. It stretches nearly 25.60 kms (Fig. 1). Along the Bay coast from
Thiruvanmiyur in the south to Thiruvottiyur in the north and runs inland in a
rugged semi-circular fashion. It is bounded on the east by the Bay of Bengal and
on the remaining three sides by Chengalpattu and Thiruvallur Districts.
Its population was estimated to about 42,16,268 (Survey-2001), has a
population density of 24,231 individuals per sq. Km. Male literacy is 84.71% and
female literacy is 75.32%. Madras Medical College (MMC) is situated in the
middle of the city with sophisticated facilities. It is having a separate neurology
wing with all clinical diagnosis and treatment facilities.
Salem
Salem is an important district of Tamil Nadu notable for its picturesque
landscapes dotted with hillocks, lakes, temples, forts etc. The district has its
administrative head quarter located at the same town of Salem. Other major
towns of the district include, Mettur, Omalur and Attur. It lies between 12° 53’ of
the northern latitude and 77° 44’ and 78° 50’of the eastern longitude (Fig. 2).

44
Fig. 2. Area map of Salem (data collection site)
Source: www.mapsinfobase.com
It spreads over an area of 5205 sq. km. Its population was estimated to
about 3016346 (Survey-2001), has a population density of 573 (Per sq. km.). Sex
ratio of this district is 929 females per 1000 males. It has a literacy rate of
57.50% and the average rain fall is 363.5 mm. Mohan Kumaramagalam Medical
College is situated in Salem. Most of the neuro- patients of this district and the
surrounding district like Dharmapuri, Namakkal and Erode is benefitted from this
hospital.

45
Madurai
Madurai District is situated in the South of Tamil Nadu state. It is
bounded on the North by the districts of Dindigul, Thiruchirapalli and on the East
by Sivagangai and on the West by Theni and South by Virudhunagar .It lies
between 9°30.00 and 10°30.00 of the northern latitude and 77°00.00 and
78°30.00 of the eastern longitude (Fig. 3).
Fig. 3. Area map of Madurai (data collection site)
Source: www.mapsofindia.com
It spreads over an area of 3741.73 Sq.Km. Its population was estimated to
about 25,78,201 (Survey-2001), has a population density of 689 (Per sq. km.).
Madurai district has 8 major hospitals. The Government Madurai Medical
College Hospital is having a separate Neurology wing with adequate facilities.

46
Kanyakumari
The district of Kanyakumari in Tamil Nadu, India is located at 8.08ºN
77.57ºE .It lies at the meeting point of three water bodies: the Arabian Sea, the
Bay of Bengal and the Indian Ocean. It is the terminating point of the Western
Ghats and Eastern Ghats. On the north and east it is bounded by the Tirunelveli
district, on the west and the north west is bounded by Kerala.
Fig. 4. Area map of Kanyakumari (data collection site)
Source: www.mapsofindia.com
47
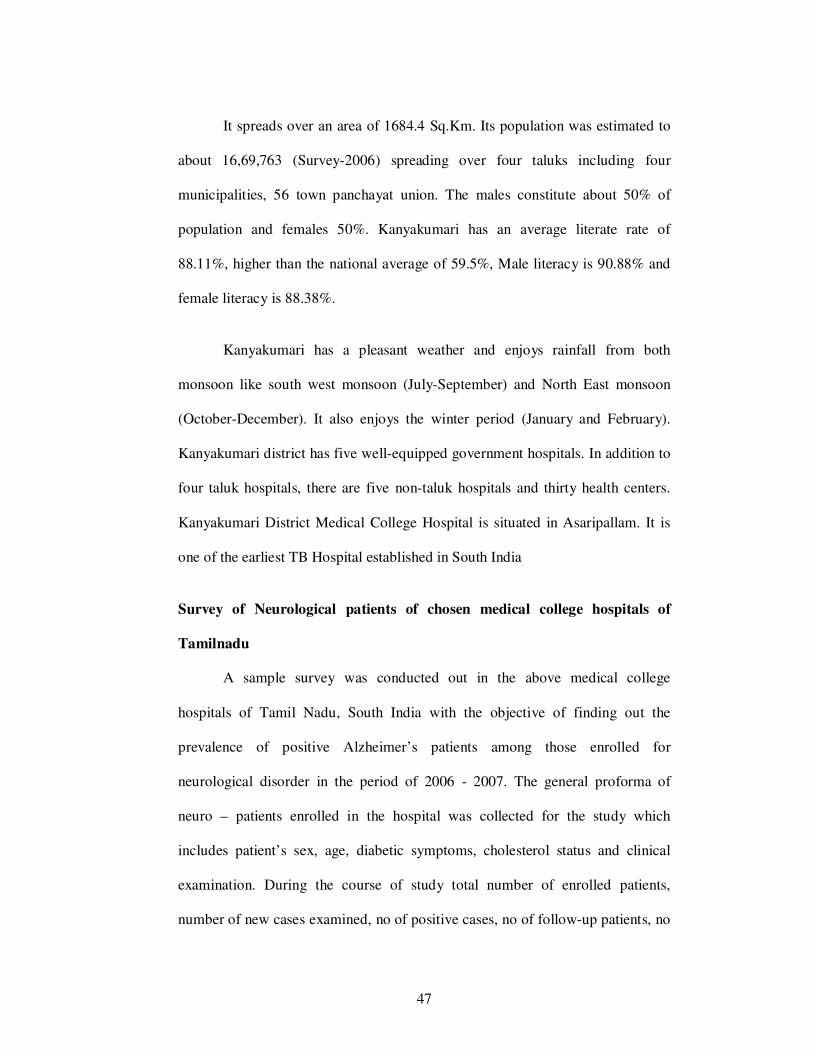
It spreads over an area of 1684.4 Sq.Km. Its population was estimated to
about 16,69,763 (Survey-2006) spreading over four taluks including four
municipalities, 56 town panchayat union. The males constitute about 50% of
population and females 50%. Kanyakumari has an average literate rate of
88.11%, higher than the national average of 59.5%, Male literacy is 90.88% and
female literacy is 88.38%.
Kanyakumari has a pleasant weather and enjoys rainfall from both
monsoon like south west monsoon (July-September) and North East monsoon
(October-December). It also enjoys the winter period (January and February).
Kanyakumari district has five well-equipped government hospitals. In addition to
four taluk hospitals, there are five non-taluk hospitals and thirty health centers.
Kanyakumari District Medical College Hospital is situated in Asaripallam. It is
one of the earliest TB Hospital established in South India
Survey of Neurological patients of chosen medical college hospitals of
Tamilnadu
A sample survey was conducted out in the above medical college
hospitals of Tamil Nadu, South India with the objective of finding out the
prevalence of positive Alzheimer’s patients among those enrolled for
neurological disorder in the period of 2006 - 2007. The general proforma of
neuro – patients enrolled in the hospital was collected for the study which
includes patient’s sex, age, diabetic symptoms, cholesterol status and clinical
examination. During the course of study total number of enrolled patients,
number of new cases examined, no of positive cases, no of follow-up patients, no

48
of positive patients among follow-up patients were examined and the results were
recorded.
Detection of year wise percentage AD outbreaks
From the collected data, year wise percentages, prevalence, percentage of
associated symptoms were calculated. Similarly the percentages of occurrence in
male and female populations were examined in different hospitals. From the case
register the percentage of incident among the different age groups was also
determined.
Statistical Analysis
The collected data were statistically (Skewness and Kurtosis Section,
Descriptive Statistics, correlation analysis and significance) analyzed using SPSS
software. The results were tabulated and the preliminary data are presented in
Annexure I.

49
RESULTS
The survey was made in the chosen Tamilnadu Govt. Medical College
Hospitals during 2006 - 2007. The hospitals chosen for the AD survey and
prevalence analysis are Madras Medical College Hospital, Chennai, Mohan
Kumarmangalam Medical College Hospital, Salem, Madurai Medical College
Hospital, Madurai and Kanyakumari District Medical College Hospital of Tamil
Nadu, South India, with the objective of finding out the prevalence of positive
cognitive neurodegenerative disorder among peoples enrolled in neurological
wing.
It was found that during the year 2006, a total of 4326 outpatients were
enrolled, of which 2618 were new cases. Among the new cases, examined 774
were found to have some neurological problems. However, in the overall status,
total neuro-patients observed in the four hospitals were 1398. Among that,
Chennai contributes 30.54% followed by Salem and Madurai at a rate of 25.89%
and 24.53% of neuro patients respectively. As per the results, 2.6% of the
neuropateients suffer from A.D. in Chennai. Among that 36% of the patients
were diabetic, 36% patients had high cholesterol and 27% patients were obese.
But in Madurai, the percentage has been decreased to 2.3%. Among those, 50%
were diabetic, 31% had high cholesterol and 50% were obese. The data available
from the salem government hospital indicates that 2.5% of the total neuro-
patients suffer from AD, which is accompanied by 44% diabetic, 44% with high
cholesterol and 33% with obesity. Interestingly Kanyakumari had the least
population of AD patients, that is less than 2% were reported to be AD patients,

50
among whom 40% were diabetic, 40% had high cholesterol and 40% with
obesity. The report also clearly indicated that AD. is closely linked to diabetes,
high cholesterol and obesity. In contrast to other 3 cities, Kanyakumari had more
male AD patients.
The correlation between the physical parameters (Diabetes, High
Cholesterol, Obese and Sex with Alzheimer’s Disease Patients) are given in
Table 2. AD patient’s ratio with neuro- patients in different season at different
study area, Diabetic patients and AD patients comparison, cholesterol patients
among AD patients ratio, Obese patients and AD patients ratio, male frequency
ratio and female frequency ratio in different study locations are given in Fig 5 to
10. The colonial discriminate function of AD patients of different sampling sites
are given in Fig 11.

5
1
Ta
ble
2.C
orr
elati
on
bet
wee
n P
hy
sica
l p
ara
met
ers
(Dia
bet
es,
Hig
h C
ho
lest
erol,
Ob
ese
an
d S
ex w
ith
Alz
hei
mer
’s D
isea
se P
ati
ents
)
Ra
tio
(AD
/Tota
l
Pati
ents
)
Dia
bet
ic
Ch
ole
ster
ol
Ob
ese
pati
ents
T
ota
l M
ale
R
ati
o
Tota
l F
emale
R
ati
o
Ken
dal
l's
tau_
b
Rat
io (
AD
/Tota
l
Pat
ients
)
Corr
elat
ion
Co
effi
cien
t 1
.000
.37
1
.037
-.17
3
.045
.05
5
Sig
. (2
-tai
led
) .
.06
5
.852
.378
.817
.780
N
16
1
6
16
16
16
16
Dia
bet
ic
Corr
elat
ion
Co
effi
cien
t .3
71
1.0
00
-.4
92
(*)
.072
.205
-.2
71
Sig
. (2
-tai
led
) .0
65
. .0
22
.734
.333
.20
6
N
16
1
6
16
16
16
16
Chole
ster
ol
Corr
elat
ion
Co
effi
cien
t .0
37
-.49
2(*
) 1
.000
-.36
2
-.21
0
.32
5
Sig
. (2
-tai
led
) .8
52
.02
2
. .0
85
.316
.12
5
N
16
1
6
16
16
16
16
Obes
e p
atie
nts
Corr
elat
ion
Co
effi
cien
t -.
17
3
.07
2
-.3
62
1.0
00
.020
-.0
30
Sig
. (2
-tai
led
) .3
78
.73
4
.085
. .9
24
.88
6
N
16
1
6
16
16
16
16
Tota
l M
ale
Rat
io
Corr
elat
ion
Co
effi
cien
t .0
45
.20
5
-.2
10
.020
1.0
00
-.90
6(*
*)
Sig
. (2
-tai
led
) .8
17
.33
3
.316
.924
. .0
00
N
16
1
6
16
16
16
16
Tota
l F
emal
e
Rat
io
Corr
elat
ion
Co
effi
cien
t .0
55
-.2
71
.325
-.03
0
-.9
06
(**)
1.0
00
Sig
. (2
-tai
led
) .7
80
.20
6
.125
.886
.000
.
N
16
1
6
16
16
16
16

5
2
Ra
tio
(AD
/Tota
l
Pati
ents
)
Dia
bet
ic
Ch
ole
ster
ol
Ob
ese
pati
ents
Tota
l M
ale
Rati
o
Tota
l F
emale
Ra
tio
Spearm
an
's r
ho
Rat
io (
AD
/Tota
l
Pat
ients
)
Corr
elat
ion
Co
effi
cien
t 1
.000
.47
8
-.0
02
-.19
6
.132
-.0
39
Sig
. (2
-tai
led
) .
.06
1
.996
.467
.627
.88
7
N
16
1
6
16
16
16
16
Dia
bet
ic
Corr
elat
ion
Co
effi
cien
t .4
78
1.0
00
-.5
51
(*)
.069
.260
-.3
14
Sig
. (2
-tai
led
) .0
61
. .0
27
.799
.330
.23
7
N
16
1
6
16
16
16
16
Chole
ster
ol
Corr
elat
ion
Co
effi
cien
t -.
00
2
-.55
1(*
) 1
.000
-.39
5
-.24
8
.35
5
Sig
. (2
-tai
led
) .9
96
.02
7
. .1
30
.354
.17
7
N
16
1
6
16
16
16
16
Obes
e p
atie
nts
Corr
elat
ion
Co
effi
cien
t -.
19
6
.06
9
-.3
95
1.0
00
.000
.00
5
Sig
. (2
-tai
led
) .4
67
.79
9
.130
. 1.0
00
.98
6
N
16
1
6
16
16
16
16
Tota
l M
ale
Rat
io
Corr
elat
ion
Co
effi
cien
t .1
32
.26
0
-.2
48
.000
1.0
00
-.94
6(*
*)
Sig
. (2
-tai
led
) .6
27
.33
0
.354
1.0
00
. .0
00
N
16
1
6
16
16
16
16
Tota
l F
emal
e
Rat
io
Corr
elat
ion
Co
effi
cien
t -.
03
9
-.3
14
.355
.005
-.9
46
(**)
1.0
00
Sig
. (2
-tai
led
) .8
87
.23
7
.177
.986
.000
.
N
16
1
6
16
16
16
16
* C
orr
ela
tion is s
ign
ific
ant
at
the
0.0
5 le
vel (
2-t
aile
d)
;
**
C
orr
ela
tion is s
ignific
ant
at th
e 0
.01 le
vel (
2-t
aile
d).

53
Fig. 5. AD patients / Neuropatients ratio in different durations at study areas
0
0.5
1
1.5
2
2.5
3
3.5
4
4.5
Chennai Madurai Selam Unknown
Study Locations
Rati
o V
alu
e Aug-Oct 2006
Nov-Jan 2007
Feb-Apl 2007
May-Jul 2007

54
Fig. 6. Number of diabetic patients in observed AD patients
0
20
40
60
80
100
120
1 2 3 4
Study Locations
Rati
o V
alu
e Series1
Series2
Series3
Series4

55
Fig. 7. Number of high cholesterol patients in observed AD patients
0
20
40
60
80
100
120
1 2 3 4
Study Locations
Rati
o V
alu
e Series1
Series2
Series3
Series4
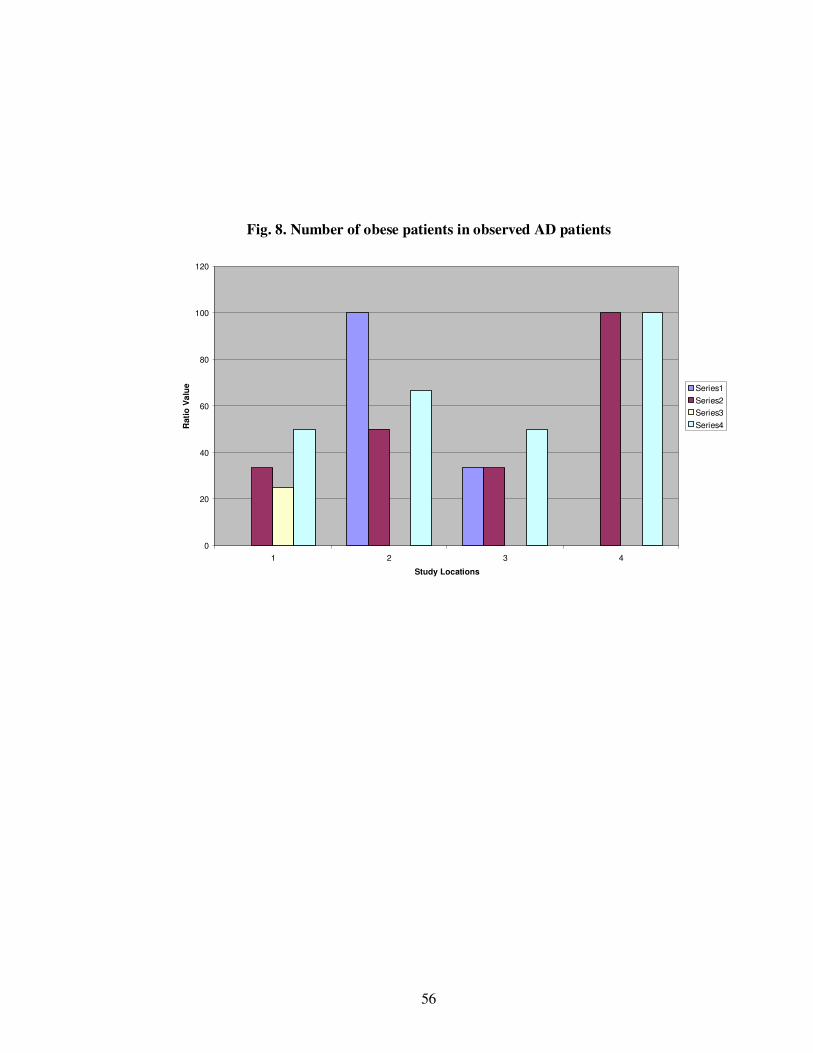
56
Fig. 8. Number of obese patients in observed AD patients
0
20
40
60
80
100
120
1 2 3 4
Study Locations
Rati
o V
alu
e Series1
Series2
Series3
Series4

57
Fig. 9. Male frequency ratio in total AD patients from different study locations
0
20
40
60
80
100
120
1 2 3 4
Study Locations
Rati
o V
alu
e Series1
Series2
Series3
Series4
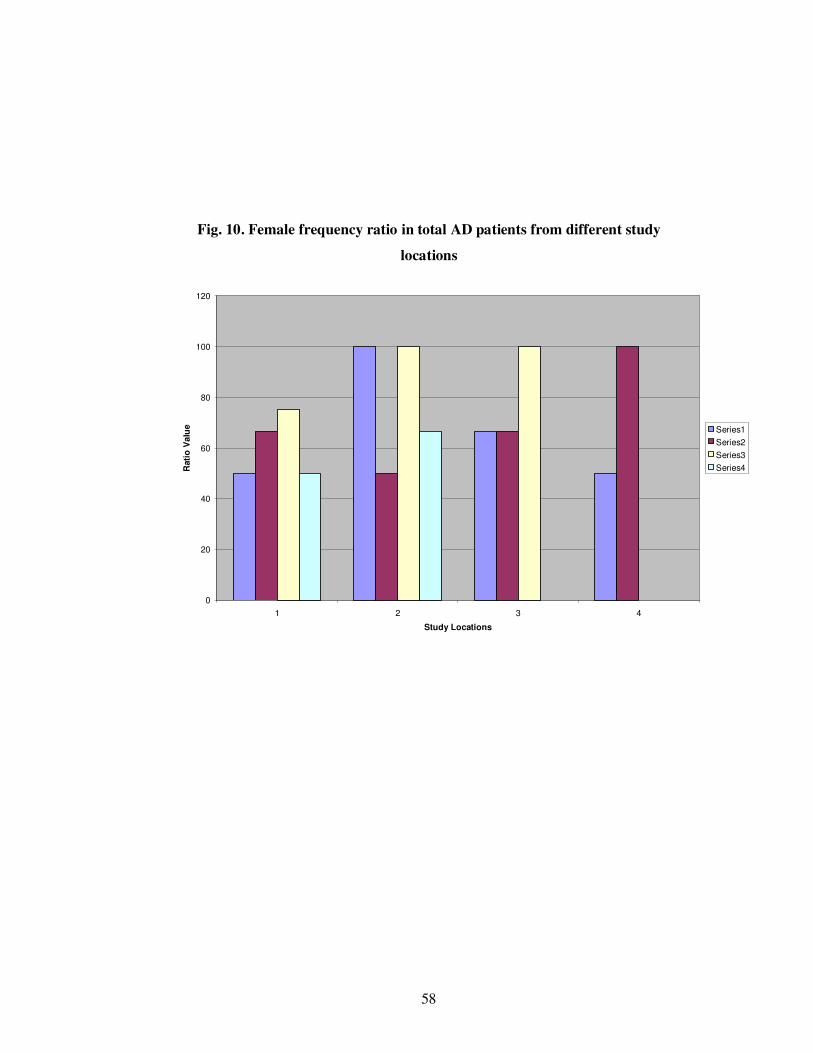
58
Fig. 10. Female frequency ratio in total AD patients from different study
locations
0
20
40
60
80
100
120
1 2 3 4
Study Locations
Rati
o V
alu
e Series1
Series2
Series3
Series4

59
Fig. 11

60
The general proforma of outpatients enrolled in the hospital was collected
for the AD prevalence study, which includes patient’s sex, age, general symptom,
cholesterol, obesity and diabetes examination were carried out in the four major
Government hospitals of Tamilnadu. During the course of study, the total number
of enrolled outpatients, number of new cases examined, no of positive cases, no of
follow-up patients, no of positive patients among follow-up patients were
examined and the results were recorded. It was found that during the year 2006, a
total of 4326 outpatients were enrolled, of which 2618 are new cases. Among the
new cases examined, 774 were found with neurological problems. However, in the
overall status of neuro-patients observed in the four hospitals were 1398. Among
that, Chennai contributes 30.54% followed by Salem and Madurai at a rate of
25.89% and 24.53% respectively. As per the results, 2.6% of the neuropateients
suffer from A.D. in Chennai. Among that, 36% of the patients were diabetic, 36%
patients had high cholesterol and 27% patients were obese. But in Madurai, the
percentage has been decreased to 2.3%, among those 50% were diabetic, 31% had
high cholesterol and 50% were obese. The data available from the Salem
government hospital indicates that 2.5% of the total neuro-patients suffer from AD,
which is accompanied by 44% diabetic, 44% with high cholesterol and 33% with
obesity. Kanyakumari had the least population of AD patients, interestingly less
than 2% were reported to be AD patients, among whom, 40% were diabetic, 40%
had high cholesterol and 40% with obesity. The report also clearly indicated that
AD. is closely linked to diabetes, high cholesterol and obesity. In contrast to other
3 cities, Kanyakumari had more male AD patients.
61
DISCUSSION
Neurological diseases are common disorders, resulting in various degrees
of disability and loss of productive life. A change in demographic profile towards
the aging population was observed recently in India. Reports also have shown an
increasing trend of stroke and dementia in India (Banerjee et al., 2005). The area
based prevalence studies from India have documented a crude prevalence rate of
dementia ranging from 8.4 to 35 per 1000 among population above the age of 55 yr
(Saha et al., 2003; Vas et al., 2003; Gourie-Devi et al., 2004; Shaji et al., 2005).
Age specific prevalence of dementia also revealed higher rate with advancement of
age (Banerjee et al., 2005; Vas et al., 2003; Gourie-Devi,et al., 2004; Shaji,et al.,
2005). Though there are many prevalence studies on neurological diseases, there
are inherent weaknesses in terms of methodology of case ascertainment, case
definition, sampling of study population and lack of age variation rate in national
and international population. This might be the primary reasons for wide variations
of prevalence rate among neurological disorders in India. To overcome these
problems, random selection of sample population is required, which will ensure the
chance of equal representation of different groups in the study population and
inclusion of both health seeking and non health seeking subjects. So that, the
present study selected four different sampling areas like highly populated, metro
city (Chennai), medium populated, industrialized (Salem), thick populated and
rural based (Madurai) and highly educated and hygienic populations
(Kanyakumari). Apart from these, the chosen area has some geographical, climate,
food and life style variations.
62
The Alzheimer's Association today reports that, in 2007, more than 5
million people in the United States were living with Alzheimer's disease. This
number includes 4.9 million people over the age of 65 and the rest were below the
age of 65 with early onset Alzheimer's disease and other dementias. There was
10% increase from the previous prevalence of nationwide estimate. The greatest
risk factor for Alzheimer's is, increasing age, and with 78 million baby boomers
beginning to turn 60 last year. It is estimated that someone in America develops
Alzheimer's every 72 seconds; by mid-century someone will develop Alzheimer's
every 33 seconds.
Alzheimer’s disease develops after the age of 65 years in majority of the
cases. Rarer forms of Alzheimer’s disease occur from the fourth decade of life
until the age of 65 years. AD is the fourth leading cause of death among adults in
the United States (Barbara et al., 1998). The prevalence of Alzheimer’s disease
increases with age, being 5% at 65 years of age and doubling every 5 years
(Hendne, 1998). Several studies have shown higher prevalence in women (Jorm
and Jolley, 1998). With the increase in life expectancy and rising population of the
elderly, the prevalence of Alzheimer’s disease is expected to rise in the future
causing a major public health problem.
Approximately 4.5 million people in the United States are currently
afflicted with this disorder, and the number is expected to rise sharply in future
years due to the increase in the elderly population, which represents the fastest
growing segment in our society (Hebert et al., 2003). It is estimated that nearly
13−16 million people will suffer from AD by 2050 and, among those, nearly 13%
63
of individuals over age 65 may be affected (Hebert et al., 2003; Maier-Lorentz,
2000).
The results of the present study indicated that 2.6% of the neuropatients
suffer from A.D. in Chennai. Among that 36% of the patients were diabetic, 36%
patients had high cholesterol and 27% patients were obese. But in Madurai, the
percentage has been decreased to 2.3%. Among those, 50% were diabetic, 31%
had high cholesterol and 50% were obese. The data available from the Salem
Government Hospital indicates that, 2.5% of the total neuro-patients suffer from
AD, which is accompanied by 44% diabetic, 44% with high cholesterol and 33%
with obesity. Interestingly Kanyakumari had the least population of AD patients
and less than 2% were reported to be AD patients, among whom 40% were
diabetic, 40% had high cholesterol and 40% with obesity. The report also clearly
indicated that AD is closely linked to diabetes, high cholesterol and obesity. In
contrast to other 3 cities, Kanyakumari had more male AD patients.
These observations of prevalence of dementia were lower than that of
western countries. This may partly be due to strict inclusion criteria or the rate may
be truly low. As compared to higher prevalence of dementia in developed countries
ranging between 5-10% after 60 to 65 yr of age (Jackson et al., 2009), several
urban and rural studies on dementia from different parts of India had documented
lower rates varying from 1.02 to 3.36% above 60 to 65 yr of age (Shaji et al.,
2003). It is also evident that prevalence was higher in rural as compared to urban
population and is higher in southern when compared to northern states of India.
This variation of prevalence rates in different studies may partly be due to true

64
regional and rural/urban differences owing to variation in genetic factor,
environmental factors including dietary habit, age structure and literacy rate of the
study population. A study from USA has shown the protective effect of dietary
constituent (turmeric- haldi) in Indian diet against degenerative dementia (Lim et
al., 2001). Hence, multicentre studies with comparable methodologies and uniform
diagnostic criteria are needed to determine the true nature and extent of regional
and rural/urban variation in India.
In conclusion, findings of our study showed a high prevalence of dementia
compared to western figures. The heterogenecity of the population might result in
differences in prevalence rates of neurological diseases from different parts of the
country. Therefore, more epidemiological studies need to be conducted in India to
look into the changing pattern of neurological diseases using a uniform
methodology, case definition and appropriate representative sampling of study
population. Apart from finding disease prevalence, the incidence and the risk
factors should also be determined to delineate the natural course of the
neurological diseases, and to identify consequent disabilities, their socio-economic
impact on quality of life, so that appropriate remedial measures could be taken.