
Chapter III Research Methodology and Design · marketing, finance, sales, production, logistics,...
38
37 Chapter III Research Methodology and Design Introduction The research methodology and the research design of the study are explained in Chapter III. The chapter begins with the research questions that guide the study as well as an explanation of the sales forecasting model. The constructs within the model are defined. After the definitions of constructs, the research propositions are explained. Finally, the research design is presented. Research Questions The following research questions guided this research investigation: 1) What is the relationship of the four dimensions of the sales forecasting benchmarking process (Mentzer et al., 1996; Mentzer et al., 1999) with the level of accuracy of sales forecast in the commercial restaurant setting? 2) What is the relationship of the four dimensions of the sales forecasting benchmarking process (Mentzer et al.,1996; Mentzer et al., 1999) with the level of managers’ satisfaction with their sales forecasting process in the commercial restaurant setting? Sales Forecast Benchmarking Model A sales forecast benchmarking model developed by Mentzer, Kahn, & Bienstock (1996; 1999) consists of four dimensions. These dimensions are functional integration, approach, systems, and performance measurement. • Functional Integration refers to collaboration, communication, and coordination (internal to the firm), which are three key concepts in forecasting. • Approach refers to what is forecasted and how it is forecasted (within the company). • Systems refer to the computer and electronic communications hardware and software utilized to develop, analyze, and distribute forecasts. • Performance Measurement refers to the metric (statistical or mathematical techniques) used to measure forecasting effectiveness and any information gathered to explain performance (Mentzer et al., 1996; 1999).
Transcript of Chapter III Research Methodology and Design · marketing, finance, sales, production, logistics,...

37
Chapter III
Research Methodology and DesignIntroduction
The research methodology and the research design of the study are explained in
Chapter III. The chapter begins with the research questions that guide the study as well
as an explanation of the sales forecasting model. The constructs within the model are
defined. After the definitions of constructs, the research propositions are explained.
Finally, the research design is presented.
Research Questions
The following research questions guided this research investigation:
1) What is the relationship of the four dimensions of the sales forecasting benchmarking
process (Mentzer et al., 1996; Mentzer et al., 1999) with the level of accuracy of sales
forecast in the commercial restaurant setting?
2) What is the relationship of the four dimensions of the sales forecasting benchmarking
process (Mentzer et al.,1996; Mentzer et al., 1999) with the level of managers’
satisfaction with their sales forecasting process in the commercial restaurant setting?
Sales Forecast Benchmarking Model
A sales forecast benchmarking model developed by Mentzer, Kahn, & Bienstock
(1996; 1999) consists of four dimensions. These dimensions are functional integration,
approach, systems, and performance measurement.
• Functional Integration refers to collaboration, communication, and coordination
(internal to the firm), which are three key concepts in forecasting.
• Approach refers to what is forecasted and how it is forecasted (within the company).
• Systems refer to the computer and electronic communications hardware and software
utilized to develop, analyze, and distribute forecasts.
• Performance Measurement refers to the metric (statistical or mathematical
techniques) used to measure forecasting effectiveness and any information gathered
to explain performance (Mentzer et al., 1996; 1999).

38
Explanation of the Sales Forecasting Benchmarking Model
The focus of the present research is depicted in Figure 3.1 by providing a pictorial
display of the Mentzer et al. (1996; 1999) descriptive model. The model represents the
relationships of the constructs that were examined in this study. The model begins with
the original dimensions identified in the Mentzer et al. (1996; 1999) studies. These
dimensions are functional integration, approach, systems, and performance measurement.
The proposed model accepts the four dimensions developed by Mentzer et al. (1996;
1999) and looks at the relationship of these dimensions with two additional variables.
The model includes the additional constructs of level of accuracy with the sales
forecast and the level of managers’ satisfaction with the sales forecasting process. These
latter dimensions were identified as important factors during the literature review. This
model was examined in the context of the commercial restaurant setting.
Constructs
The Mentzer et al. (1996; 1999) studies were exploratory investigations of 20
manufacturing, distribution, and retailing companies. Mentzer et al.'s (1996; 1999)
descriptive model explained the managerial dimensions of the forecasting process. The
study accepts the original dimensions of the Mentzer et al. (1996; 1999) studies. The
study attempted to explain the relationship of these dimensions (functional integration,
approach, systems, and performance measurement) to the level of accuracy with the sales
forecast and level of managers’ satisfaction with the sales forecasting process within the
context of commercial restaurant corporations.
In the next section, a review of the definitions of the constructs within the model
is presented.

39
Figure 3.1. Sales Forecasting Benchmarking Model (Adapted from Mentzeret al., 1996; 1999)
Level ofAccuracyof SalesForecast
Level ofManagers’Satisfactionwith SalesForecastingProcess
FunctionalIntegration
Approach
Systems
PerformanceMeasurement

40
Functional Integration
Sales forecasting can be seen as an integrated effort of management functions.
Departments, which utilize the forecasted information, must also communicate this
information throughout the company. Various data are collected to develop sales
forecasts. These data come from within and outside the organization. Various
departments are responsible for supplying data. Key decisions are made through the
coordinated efforts of the managers involved (Lazer, 1965; Kavanagh, 1969; Barron &
Targett, 1986). Listed in Table 3.1are the characteristics of companies within the four
stages of the functional integration dimension as determined by Mentzer et al. (1996).
Approach
The approach to developing a forecast and the techniques used to produce the
forecast are essential parts of the forecasting process. Determining which department or
departments are responsible for forecasting and how decisions are made based on the
forecast is imperative. The techniques used in sales forecasting can be both qualitative
and quantitative in nature. Selecting a technique requires careful investigation of the
company's forecasting needs and available data (Mentzer & Cox, 1984a; Kahn &
Mentzer, 1994; Mentzer & Kahn, 1995). The four general approaches to forecasting are
1) the independent approach, 2) the concentrated approach, 3) the negotiated approach,
and 4) the consensus approach. The methods or techniques for forecasting can be divided
into two broad categories: quantitative and qualitative. The techniques in the quantitative
category include mathematical models such as moving average, straight-line projection,
exponential smoothing, regression, trend-line analysis, simulation, life-cycle analysis,
decomposition, Box-Jenkins, expert systems, and neural network. The techniques in the
qualitative category include subjective or intuitive models such as jury or executive
opinion, sales force composite, and customer expectations.
The forecasting techniques broken down by category of quantitative or qualitative
are shown in Table 3.2. The characteristics of companies within the four stages of the
approach dimension as determined by Mentzer et al. (1996) are listed in Table 3.3.

41
Table 3.1. Functional Integration: Stage Characteristics (Mentzer et al. 1996; 1999)
Stage 1• Major disconnects between marketing, finance, sales, production, logistics, and
forecasting• Each area has its own forecasting effort• No accountability between areas for forecast accuracy
Stage 2• Coordination (formal meetings) between marketing, finance, sales, production,
logistics, and forecasting• Forecasting located in a certain area — typically operations oriented (located in
logistics or production) or marketing oriented (located in marketing or sales) — whichdictates forecasts to other areas
• Planned consensus meetings, but with meeting dominated by operations, finance, ormarketing--i.e., no real consensus
• Performance rewards for forecasting personnel based only on performancecontribution to the department in which forecasting is housed
Stage 3• Communication and coordination between marketing, finance, sales, production,
logistics, and forecasting• Existence of a forecasting champion• Recognition that marketing is a capacity unconstrained forecast and operations is a
capacity constrained forecast• Consensus and negotiation process to reconcile marketing and operations forecasts• Performance rewards for improved forecasting accuracy for all personnel involved in
the consensus process
Stage 4• Functional integration (collaboration, communication, and coordination) between
marketing, finance, sales, production, logistics, and forecasting• Existence of forecasting as a separate functional area• Needs of all areas recognized and met by reconciled marketing and operations forecast
(finance: annual dollar forecast; sales: quarterly dollar sales territory based forecasts;marketing: annual dollar product based forecasts; production: production cycle unitSKU forecasts; logistics: order cycle unit SKUL forecasts)
• Consensus process recognizes feedback loops (i.e., constrained capacity information isprovided to sales, marketing, and advertising; sales, promotions, and advertising candrive demand; etc.)
• Multidimensional performance rewards for all personnel involved in the consensusprocess

42
Table 3.2. Quantitative and Qualitative Techniques of Forecasting
Quantitative Forecasting Techniques:• Regression Analysis: statistically relates sales to one or more explanatory
(independent variables). Explanatory variables may be marketing decisions(price changes, for instance), competitive information, economic data, or anyother variable related to sales.
• Exponential smoothing makes an exponentially smoothed weighted average ofpast sales, trends, and seasonality to derive a forecast.
• Moving average takes an average of a specified number of past observations tomake a forecast. As new observations become available, they are used in theforecast and the oldest observations are dropped.
• Box-Jenkins uses the auto correlative structure of sales data to develop anautoregressive moving average forecast from past sales and forecast errors.
• Trend-line analysis fits a line to the sales data by minimizing the squared errorbetween the line and actual past sales values. This line is then projected into thefuture as the forecast.
• Decomposition breaks the sales data into seasonal, cyclical, trend, and noisecomponents and projects each into the future.
• Straight-line projection is a visual extrapolation of the past data, which isprojected into the future as the forecast.
• Life-cycle analysis bases the forecast upon whether the product is judged to bein the introduction, growth, maturity, or decline stage of the life cycle.
• Simulation uses the computer to model the forces that affect sales: customers,marketing plans, competitors, flow of goods, etc. The simulation model is amathematical replication of the actual corporation.
• Expert systems use the knowledge of one or more forecasting experts to developdecision rules to arrive at a forecast.
• Neural networks look for patterns in previous history of sales and explanatorydata to uncover relationships. These relationships are used to produce theforecast.
Qualitative Forecasting Techniques• Jury of executive opinion consists of combining top executives’ views
concerning future sales.• Sales force composite combines the individual forecasts of salespeople.• Customer expectations (customer surveys) use customers' expectations as the
basis for the forecast. The data are typically gathered by a customer survey bythe sales force.
• Delphi model is similar to jury of executive opinion in taking advantage of thewisdom of experts. However, it has the additional advantage of anonymityamong participants.
• Naïve model assumes that the next period will be identical to the present. Theforecast is based on the most recent observation of data.

43
Table 3.3. Approach: Stage Characteristics (Mentzer et al, 1996; 1999)
Stage 1• Plan-driven, top-down forecasting approach (failure to recognize the interaction between forecasting,
marketing, and the business plan)• Forecast shipments only• Treat all forecasted products the same• Naïve and/or simple statistic approach to forecasting often with little understanding of the techniques
used or the environment ("Black Box Forecasting")• Failure to see the role of forecasting in developing the business plan (forecasting viewed solely as a
tactical function)• No training of forecasting personnel in techniques or understanding of business environment--no
documentation of the forecasting process
Stage 2• Bottom-up, SKUL-based forecasting approach• Forecast self-reported demand (demand recognized by the organization) or adjusted demand (invoice
keyed demand)• Recognize that marketing/promotion efforts and seasonality can drive demand• Recognize the relationship between forecasting and the business plan, but the plan still takes
precedence over the forecasts• Limited training in statistics with no training in understanding the business environment—limited
documentation of the forecasting process
Stage 3• Both top-down and bottom-up forecasting approach• Forecast POS (point of sale) demand and back this information up the supply chain and/or utilize key
customer demand information ("uncommitted commitments")• Use ABC analysis or some other categorization for forecasting accuracy importance• Identification of categories of products that do not need to be forecast (i.e., two-bin items, dependent-
demand items, make-to-order items)• Use of regression-based models for higher level (corporate to product line) forecasts and time-series
models for operation (product-to-SKUL) forecasts• Recognize the importance of subjective input from marketing, sales, and operations to the forecast• Forecasting drives the business plan• Training in quantitative analysis/statistics and understanding of the business environment—a strong
manager/advocate of the forecasting process
Stage 4• Top-down and bottom-up forecasting approach with reconciliation• Vendor-managed inventory factored out of the forecasting process• Full forecasting segmentation of products (ABC, two-bin, dependent-demand, make-to-order, product
value, seasonality, customer service sensitivity, promotion driven, life-cycle stage, shelf life, rawmaterial lead time, production lead time
• Understand the "game playing" inherent in the sales force and the distribution channel (motivation forsales to underforecast and for distribution to overforecast)
• Develop forecasts and business plan simultaneously, with periodic reconciliation of both• On-going training in quantitative analysis/statistics and understanding of the business environment—
top management support of the forecasting process

44
Systems
Various information systems have been developed to capture and distribute
forecasting data. These systems should be accessible to key personnel within the
company. An automated system should be designed to accommodate the company's
needs (Kahn & Mentzer, 1996; Allnoch, 1997). Automated software systems such as
Electronic Data Interchange (EDI), Point-of-Sales (POS) systems, Efficient Foodservice
Response (EFR), and Decision Support Systems (DSS) collect the necessary data in order
to produce effective forecasts. The software systems have specific hardware
requirements. Ultimately, the hardware and software requirements must fit the specific
needs of the company. A list of the characteristics of companies within the four stages of
the systems dimension as determined by Mentzer et al. (1996) are shown in Table 3.4.
Performance Measurement
Accuracy of a sales forecast is essential if the results are to be useful.
Performance measures, which determine accuracy of the approach and techniques
selected, are a necessary part of the forecasting process (Mentzer & Cox, 1984b; Mentzer
& Kahn, 1995). Typical measures of performance include Mean Absolute Percentage
Error (MAPE) and Mean Absolute Deviation (MAD). A list of the characteristics of
companies within the four stages of the performance measurement dimension as
determined by Mentzer et al. (1996) are shown in Table 3.5.
Level of Accuracy of Sales Forecast
Accuracy refers to the level of error between the projected sales and the actual
sales as well as how a particular technique or system accomplishes the outlined goals.
The researchers argued that accuracy is a necessary outcome in order for the forecasting
technique or process to be successful (Mentzer & Cox, 1984b; Mentzer & Kahn, 1995;
Kahn & Mentzer, 1996).

45
Table 3.4: Systems: Stage Characteristics (Mentzer et al., 1996; 1999)
Stage 1• Corporate MIS, forecasting software, and DPR (Distribution Requirement Planning)
systems are not linked electronically• Printed reports, manual transfer of data from one system to another, lack of
coordination between information in different systems• Few people understand the systems and their interaction (all systems knowledge held
in MIS)• "Islands of analysis" exists• Lack of performance metrics in any of the systems or reports
Stage 2• Electronic links between marketing, finance, forecasting, manufacturing, logistics,
and sales systems• On-screen reports available• Measures of performance available in reports• Reports periodically generated
Stage 3• Client-server architecture that allows changes to be made easily and communicated
to other systems• Improved system-user interfaces to allow subjective input• Common ownership of data bases and information systems• Measures of performance available in reports and in the system• Reports generated on demand, and performance measures available on line
Stage 4• Open-systems architecture so all affected areas can provide electronic input to the
forecasting process• EDI linkages with major customers and suppliers to allow forecasting by key
customer and supply chain staging of forecasts (i.e., real-time POS forecasts to plankey customer demand ahead of supply chain cycle)

46
Table 3.5: Performance Measurement: Stage Characteristics (Mentzer et al., 1996;1999)
Stage 1• Accuracy not measured• Forecasting performance evaluation not tied to any measure of accuracy (often tied
to meeting plan, reconciliation with plan, etc.)
Stage 2• Accuracy measured primarily as Mean Absolute Percent Error, but sometime
measured inaccurately (e.g., forecast, rather than demand, used in the denominatorof the calculation)
• Forecasting performance evaluation based upon accuracy, with no considerationfor the implications of accurate forecasts on operations
• Recognition of the impact upon demand of external factors (e.g., economicconditions, competitive actions, etc.)
Stage 3• Accuracy still measured as Mean Absolute Percent Error, but more concern given
to measurement of the supply chain impact of forecast accuracy (i.e., loweracceptable accuracy for low-value noncompetitive products, recognition ofcapacity constraints in the supply chain and their impact on forecasting andperformance, etc.)
• Graphical and collective reporting of forecast accuracy (throughout the producthierarchy)
• Forecasting performance evaluation still based upon accuracy, but there is agrowing recognition that accuracy has an effect upon inventory levels, customerservice, and achieving the marketing and financial plans
Stage 4• Realization that exogenous factors affect forecast accuracy and that unfulfilled
demand is partially a function of forecasting error and partially a function ofoperator error
• Forecasting error treated as an indication of the need for a problem search (forinstance, POS demand was forecast accurately, but plant capacity preventedproduction of the forecast amount)
• Multidimensional metrics of forecasting performance--forecasting performanceevaluation tied to the impact of accuracy on achievement of corporate goals (e.g.,profitability, supply chain costs, customer service)

47
Level of Managers’ Satisfaction with Sales Forecasting Process
Satisfaction refers to the level of confidence that a firm has in the process or
technique. Results of the studies have shown that manager satisfaction is necessary in
order for the forecasting process to receive company support (Mentzer & Cox, 1984a;
Mentzer & Kahn, 1995; Kahn & Mentzer, 1996).
Research Propositions
Research propositions were selected because of the exploratory nature of the
study. Propositions are statements concerned with the relationships among concepts.
Hypotheses are the empirical counterpart to propositions, requiring that the statement be
tested in some way (Zikmund, 1991). The propositions are not tested; they are examined
to identify relationships. Two main research propositions were selected to align with the
research questions guiding the study. Each major proposition is followed by sub
propositions to account for each dimension within the model. The research propositions
are as follows:
P1: There is a relationship between the sales forecasting benchmarking model and the
level of accuracy of the sales forecast in a commercial restaurant setting.
P1a: There is a relationship between functional integration and the level of
accuracy of the sales forecast in a commercial restaurant setting.
It is expected that as a firm becomes more functionally integrated the
accuracy of the forecast increases.
P1b: There is a relationship between approach and the level of accuracy of the
sales forecast in a commercial restaurant setting.
It is expected that as a firm maintains a higher approach stage the
accuracy of the forecast increases.
P1c: There is a relationship between systems and the level of accuracy of the
sales forecast in a commercial restaurant setting.

48
It is expected that as a firm develops a higher system dimension the
accuracy of the forecast increases.
P1d: There is a relationship between performance measurement and the level of
accuracy of the sales forecast in a commercial restaurant setting.
It is expected that as a firm employs more performance measurements the
accuracy of the forecast increases.
P2: There is a relationship between the sales forecasting benchmarking model and the
level of managers’ satisfaction with the sales forecasting process in a commercial
restaurant setting.
P2a: There is a relationship between functional integration and the level of
managers’ satisfaction with the sales forecasting process in a commercial
restaurant setting.
It is expected that as a firm becomes more functionally integrated the
level of manager satisfaction with the forecasting process increases.
P2b: There is a relationship between approach and the level of managers’
satisfaction with the sales forecasting process in a commercial restaurant
setting.
It is expected that as a firm maintains a higher approach stage the level of
manager satisfaction with the forecasting process will increase.
P2c: There is a relationship between systems and the level of managers’
satisfaction with the sales forecasting process in a commercial restaurant
setting.
It is expected that as a firm develops a higher system dimension the level
of manager satisfaction with the forecasting process increases.

49
P2d: There is a relationship between performance measurement and the level of
managers’ satisfaction with the sales forecasting process in a commercial
restaurant setting.
It is expected that as a firm employs more performance measurements the
level of manager satisfaction with the forecasting process increases.
Design of the Proposed Research
Selecting a Qualitative Study
Marshall and Rossman (1999) point out that the literature review of previous
research has raised many questions. In addition, a researcher may find that a descriptive
study will yield the most important results for theory development. If any of the above
conditions exists, then a qualitative study is appropriate (Marshall and Rossman, 1999).
Keeping this in mind, the aforementioned propositions assisted in the discovery process.
The Four-Step Method of Inquiry
Marshall and Rossman (1999) indicated the purpose of an exploratory study is to
investigate little-understood phenomena, to identify/discover important variables, and/or
to generate hypotheses for further research. The authors suggest a research strategy that
uses cases or field studies. The example of data collection techniques provided by the
authors included participant observation, in-depth interviewing, and/or elite interviewing.
For this study, a form of the in-depth interviewing technique was used.
McCracken (1988) suggests a four-step method of inquiry when using the
interview technique in research. This four-step approach is an effort to systemize the
qualitative technique of interviewing in a way that addresses a variety of validity and
reliability questions outlined by McCracken (1988). The four steps include: 1) a review
of analytic categories and interview design; 2) a review of cultural categories and
interview design; 3) an interview procedure and the discovery of cultural categories; and
4) interview analysis and discovery of analytical categories. Each step will be explained
in more detail.

50
Step 1: Review of Analytic Categories – The Literature Review
McCracken (1988) identified the literature review as the first step in the inquiry
process. The purpose of the literature review is to assist the researcher in defining the
problem and to assist in assessing data. This assists in formulating expectations for the
study as well as provide guidance in constructing the questionnaire. The literature
reviewed for this study came from two major bodies of knowledge: the forecasting
literature and the hospitality foodservice literature. Both academic publications and trade
publications were used to develop the literature base.
Step 2: Review of Cultural Categories
The second step of the inquiry process engages the researcher in a familiarization
and de-familiarization process (McCracken, 1988). Without familiarization, the listening
skills needed for the data collection are impaired. Without de-familiarization, the
researcher will not be in a position to distance his/herself from his/her own personal
assumptions. The purpose of this step is to help the researcher better understand his/her
own personal experience with the topic. This step coupled with the literature review help
shape the interview questions.
Step 3: An Interview Procedure and the Discovery of Cultural
Categories – Questionnaire Development and Interview Procedure
The actual interview is the third part of the inquiry process. Steps 1 and 2 of the
inquiry process assists in developing an interview protocol on the research topic. The
interview must allow the persons interviewed to respond openly and in their own way.
The role of the researcher is to seek the knowledge in an unobstructive manner
(McCracken, 1988). One type of interviewing uses the interview guide. An interview
guide lists the questions or issues to be explored during the interview. The guide
provides the subject areas to be covered, and the interviewer is free to explore and probe
the topics further (Patton, 1990; McCracken, 1988). The interview guide or protocol
contains varying types of questions. Grand tour questions are designed to get the
conversation started. The questions are very general in nature. Floating prompt

51
questions are questions that interviewers use to continue the grand tour questions.
Finally, planned prompt questions are questions that are designed to prompt the person
being questioned to consider areas of the topic that do not come readily to mind or speech
(McCracken, 1988).
Step 4: Discovery of Analytic Categories – Data Analysis
It is recommended that the interviews be taped and then transcribed by a
professional. This process will allow the researcher to concentrate on the interviews and
not allow the researcher to become too familiar with the data before the analysis phase
begins. The fourth step in the inquiry process consists of five stages to analyze the data.
These stages will be presented later in the chapter under Data Collection and Data
Analysis.
A combination of The Four-Step Method of Inquiry (McCracken, 1988) along
with data collection and analysis techniques by Strauss & Corbin (1990) was used as the
basis for the approach in this study. The use of in-depth interviewing was the data
collection method. Again, the process is outlined under Data Collection and Data
Analysis.
Population of Interest
The population of this study was corporate forecasting managers or those
performing a similar function for commercial restaurant companies. This population was
selected because the forecasting managers would have access to company policies and
procedures as they relate to the forecasting process. In addition, these managers collect,
analyze, and utilize the forecasted information as well as distribute the information.
The corporate restaurant-forecasting managers were solicited individually and
asked to confirm their agreement to participate in the study. Companies selected for the
study were established companies. An established company was defined as a company
whose operating procedures are in place and functioning. A new company would be in
the development stages of their operating procedures and not have an established sales
history.

52
Sample
Due to the nature of the population and limited access to a sampling frame,
restaurant chains were contacted and the participation of the individual responsible for
sales forecasting within corporate headquarters was solicited. These managers were
selected from casual theme and family dining segments of commercial restaurant
corporations. The titles for the manager varied from corporation to corporation; thus, a
determination of whether sales forecasting was the primary or secondary/tertiary function
of the manager and which department within the corporation each manger is housed was
made.
The companies were screened in order to establish each as a company with a
proven sales history. Companies that were ten years and older were considered
established companies. The list of participants was developed based on companies who
first met the requirements, and second were willing to participate in the study.
Sample Size and Sampling Technique
Determining the number of interviews was an important process. Crow,
Olshavsky, & Summers (1980) believed that large samples are not practical with protocol
analysis. Exploratory studies should be used when the purpose is to assist in the
development of theory (Crow, Olshavsky, & Summers, 1980).
Patton (1990) suggests that redundancy is the primary criteria for determining
when to discontinue interviewing. The purpose of any study is to maximize information;
thus interviews should be discontinued when little or no new information is being
gathered from new contacts.
McCracken (1988) suggests that no more than eight interviews are needed when
using the Four-Step Method of Inquiry. Weller & Romney (1988) propose several
matrices designed to determine the number of interviews necessary in a qualitative study,
using agreement among individuals in the sample and cultural competence to recommend
sample size. The majority of instances require twenty respondents or fewer. Dunn
(1986) suggests that a “universe of meaning” was achieved in his qualitative studies after
conducting ten interviews even though he went on to conduct a total of seventeen. Clark

53
(1993) conducted twenty-three interviews using the Four-Step Inquiry Method
(McCracken, 1988) in a hospitality setting.
Theoretically, sampling addresses the concern of representativeness to sample
concepts, ideas, processes and experiences (Strauss & Corbin, 1990). In qualitative
research, the aim is not to discover how many people share a certain characteristic but to
gain access to cultural categories, assumptions, and possible relationships (McCracken,
1988). Theoretically, sampling specifically and systematically explores instances of
variation for each variable (Strauss & Corbin, 1990).
The current study began with two pre-test interviews. The results of the pre-test
interviews allowed the researcher to adjust the interview protocol to reflect the
terminology differences between industries. The participants made suggestions to the
interview protocol that reflected the restaurant industry. The managers in these
companies were then interviewed to discuss their sales forecasting processes. The
researcher proceeded with additional interviews. At the conclusion of each interview, the
audiotapes and transcripts were reviewed to determine whether there was redundancy in
the responses. If there was no redundancy, then the researcher continued. Redundancy
was achieved when no new information was presented and there was no variability in the
responses to the level of accuracy of sales forecast and variability in the level of
managers’ satisfaction with the sales forecasting process.
Data Collection and Data Analysis (Strauss & Corbin, 1990)
Specific Interview Guidelines
The manner in which each interview begins is crucial to obtaining the richness of
data that long interviews are known to provide. In the early stages of the interview, the
participant will establish barriers and/or safeguards. The participant must be placed at
ease and begin to develop a trusting relationship with the researcher. The atmosphere
must allow the participant to speak openly and freely about ideas, feelings, and
experiences. The researcher is seeking to go beyond surface-level responses by the
participants. This can be accomplished if the atmosphere is open and comfortable
(Strauss & Corbin, 1990).

54
Long interviews should begin with basic small talk and biographical data
allowing the participant to get to know the researcher (McCracken, 1988: Patton, 1990).
In addition, this will establish the participant as the expert. However, the researcher
should appear professional and curious so that the participant is aware that the researcher
is familiar with the topic.
The participants in this research were assured of confidentiality and all interviews
were taped and transcribed verbatim. Each participant was asked to sign an informed
consent form that included the purpose of the study, a request to audiotape the interview,
the manner in which the data was to be analyzed, and the participants’ right to terminate
the interview.
The interviews were structured openly and the researcher refrained from leading
the participant. Probes were used to encourage participants to elaborate on thoughts,
feelings, and experiences. It is here that the grand tour questions, floating-prompt, and
planned-prompt questions were used.
Strauss & Corbin (1990) describe the data collection and data analysis as
simultaneous processes. This is a way for the researcher to discover and learn. The
process moves back and forth between data collection (e.g., conducting interviews),
coding, and memoing. Previous data collection and analyses (Strauss & Corbin, 1990)
influence future data collection.
Coding and memoing are closely related activities. Coding refers to categorizing,
naming, and identifying properties and dimensions of all aspects of activities and
experiences uncovered. Memoing refers to a formal process of note taking where the
researcher captures his/her thoughts, feelings, observations, insights and spontaneous
revelations concerning the phenomenon under investigation (Strauss & Corbin, 1990).
The researcher used the QSR NUD-IST (Nonumerical Unstructured Data-Indexing,
Searching, and Theorizing) Version 4 software (Sage Publications, 1999) to code
verbatim transcripts and capture emerging interpretations in the form of memos.
Memoing
Memoing refers to written records of the analyses used in developing a
relationship between concepts. Memos concerning any thoughts, integration, questions
55
that arise, or inspirations should be kept in a journal, on cards, or in the computer. This
allows the researcher to look at relationships that emerge as data collection and analysis
continues (Strauss & Corbin, 1990).
Open Coding
Open coding refers to the process of breaking down, examining, comparing,
conceptualizing, and categorizing data (Strauss & Corbin, 1990). It is the process of
naming a phenomena observed in the data and giving it necessary attention.
Conceptualizing and developing categories are two key activities of open coding. During
this process the researcher is drawing comparisons and constantly asking questions
(Strauss & Corbin, 1990). The questions of “Who, what, where, when, why, and how?”
constantly emerge. The researcher continues to question responses. For instance,
“What’s going on here?”, “How is this similar?”, “How is this different?”, What are its
properties (the relationships)?”, “What are the dimensions of the properties?” The
constant questions allow the researcher to search for in-depth meanings in the interviews
and develop categories.
Conceptualizing refers to dissecting an observation, a sentence, or a paragraph
and giving each incident, event or idea a name. Placing names on things begins to
develop concepts again leading to the developing of categories (Strauss & Corbin, 1990).
Axial Coding
Axial coding allows data to be placed back together in new ways (Strauss &
Corbin, 1990). Axial coding connects related categories. It involves identifying
conditions under which various categories exist and examining the categories in light of
one another. The framework used in axial coding sensitizes the researcher to possible
relationships between constructs in the data (Strauss & Corbin, 1990). The researcher
will be able to determine antecedents, precedents, or events that have a relationship with
the core phenomena.
Axial coding involves linking sub-categories to main categories in a set of
relationships. The relationships should demonstrate causal conditions, the phenomenon,
56
the context, intervening conditions, action strategies, and consequences (Strauss &
Corbin, 1990).
Integration (Selective Coding)
Integration refers to the final stages of developing relationships. It involves
combining axial coding into a theoretical framework. It is very similar to axial coding,
yet on a more abstract level (Strauss & Corbin, 1990). Selective coding blends together
the open and axial coding to tell the story line of the integrated data (Strauss & Corbin,
1990). Integration allows for discussion and conclusions based on the proposed model.
Strauss & Corbin (1990) provided a step-by-step outline to be followed for data
collection and analysis of qualitative research. These techniques are usually employed in
social science research; however, they were successfully employed in business-based
research in the marketing field (Flint, 1998; Garver, 1998). In addition to marketing-
based research, Strauss & Corbin’s (1990) techniques were successfully used in
hospitality research (Farrar, 1996).
Using the Strauss & Corbin (1990) methods, the researcher was able to fully
describe the relationships that the original dimensions of the sales forecasting
benchmarking model (functional integration, approach, systems, performance
measurement) had with the dimensions of level of accuracy of the sales forecast and level
of managers’ satisfaction with the sales forecasting process (Figure 3.1).
Development of the Interview Protocol
Original Interview Protocol
The original interview protocol used in the Mentzer et al. (1996; 1999) studies
was used in the current research. Questions in the protocol were originally derived from
the literature. These questions were used in the manufacturing, distribution, and retailing
industries, and the protocol reflects the four dimensions of the Sales Forecasting
Benchmarking Model. Using the same interview protocol allows comparisons between
studies. Appendix A shows the questions in the Mentzer et al. (1996; 1999) interview
protocol. The following discussion identifies questions within each of the constructs.

57
Functional Integration Dimension Questions
The grand tour question for the functional integration construct is “Please
describe the process you go through to develop each sales forecast.” The floating prompt
questions include “ To what extent are functional departments (e.g., marketing, finance)
involved in the forecast?”, “What is middle management’s role in developing the sales
forecast?”, “What is upper level management’s role in developing the sales forecast?”,
and “At the beginning of each period, how does the forecast process begin?” These
floating prompt questions expanded the grand tour question. There were several planned
prompt questions that dealt with the specifics of sales forecasting administration. A list
of each question related to the functional integration dimension categorized by question
type is shown in Table 3.6.
Approach Dimension Questions
The grand tour question for the approach dimension was “ What approach is used
by the functional departments to develop sales forecasts?” The floating prompt questions
included “Do the departments use their own forecasts?”, “Does one department develop a
single forecast?”, “Does a forecast committee develop the forecast?”, and “Does each
department develop its own forecast?” These floating prompt questions expanded the
grand tour question. The planned prompt questions addressed specifics such as time
horizons, geographic breakdowns and techniques used to conduct the sales forecast. A
list of each question related to the approach dimension categorized by question type is
shown in Table 3.7.
Systems Dimension Questions
The grand tour question for the systems dimension is “Please describe the
information systems and forecasting computer systems you use to develop each forecast.”
The floating prompt questions include “The number and type of hardware and software
used for the forecasting system”, “How long has each been in use?”, “Is your forecasting
system on a Distributed Data Network (LAN/WAN)?”, “Is your forecasting system on
personal computers, a mainframe, or both?”, “Was your software (1) developed by
vendor, (2) custom built by your company, or (3) a commercial software package?”,

58
Table 3.6. Questions Relating to Functional Integration Dimension
Grand Tour Question1) Please describe the process you go through to develop each sales forecast.
Floating Prompt Questions1) To what extent are various functional departments involved in the
development of sales forecasts?2) What is middle management's role in developing sales forecasts?3) What is upper management's role in developing sales forecasts?4) At the beginning of each forecasting period, how does the sales forecasting
process begin?
Planned Prompt Questions1) Is the business plan based upon the sales forecast or sales forecast based upon
the business plan?2) To what degree do you make the forecast agree with the business plan?3) Which department(s) are responsible for managing inventory?4) Do you think the process for preparing a forecast is clear and routine with
precise instructions available? Please be specific.5) Is forecasting performance formally evaluated and rewarded? How?6) Is the sales forecasting budget sufficient for the personnel, computer
hardware/software, and training required?7) Are the sales forecasts developed and reported in: Units, then converted to
dollars; Units Only; Dollars, then converted to units; Dollars Only?8) What is forecast? (Examples: Distributor Orders, Shipments, Sales, Customer
Demand)9) How do you deal with the following special events: new products, promotions,
variety in product/package details10) What is the length and variability of production lead times for your company?11) What is the length and variability of raw material lead times for your company?12) What is the length and variability of cycle times to your customers?13) Are products primarily made to order or made to forecast?14) Do you have a specified goal for level of logistics? customer service?15) Inventory turns?16) What is the achieved level for both of these?17) How would you describe the level of competition in your industry?18) Is the demand for your products primarily driven by marketing efforts of your
company and its competitors?19) Describe the typical channel of distribution for your products (length)?20) What is the shelf life for your products?21) To what degree do you use the same forecasting management processes in
different countries?22) If the answer is low, is this something you are trying to accomplish?

59
Table 3.7. Questions Relating to Approach Dimension
Grand Tour Question1) What approach is used by these functional departments to develop sales
forecasts?
Floating Prompt Questions1) Do these departments use their own separate forecasts, or2) Does one department develop a single forecast that all departments use,
or3) Does a forecast committee develop a single forecast that all departments
use, or4) Does each department develop its own forecast and a committee
develops a final compromise forecast?5) If #2, which department develops the forecast?6) If #3 or #4, which departments are on the committee?
Planned Prompt Questions1) How satisfied are you with this approach?2) At what level of product detail do you forecast? Why?3) For what forecast interval do you forecast? Why?4) For what time horizon do you forecast? Why?5) For what geographic breakdown?6) For each of the levels, intervals, horizons, and geographic breakdowns
just described, what forecasting technique(s) is used?7) How credible are the subjective technique values you receive from:
channel members, executive managers, and salespersons?8) To what degree of each forecast is "game play" used in providing
forecasts?9) How do you forecast "slow movers," "spikes," and "blips?"

60
“If # 1, who was the vendor and please describe the development process.”, “If # 3, what
is the name of the package?”, “Is the output from the forecasting system electronically
transmitted to a DRP/MRP system for production and inventory planning?”, “Are
forecasts used to determine ROP and OQ?”, “Is the input from your forecasting system
electronically transmitted from the corporate Management Information System?”, “With
what other systems does the forecasting system interact?”, and “How automated is the
integration?” The floating prompt questions expanded the grand tour question. The
planned prompt questions addressed specifics such as electronic data interchange, usage
of demand information, access by personnel to the systems, and adaptability of the sales
forecasting system. A list of each question related to the systems dimension categorized
by question type is shown in Table 3.8.
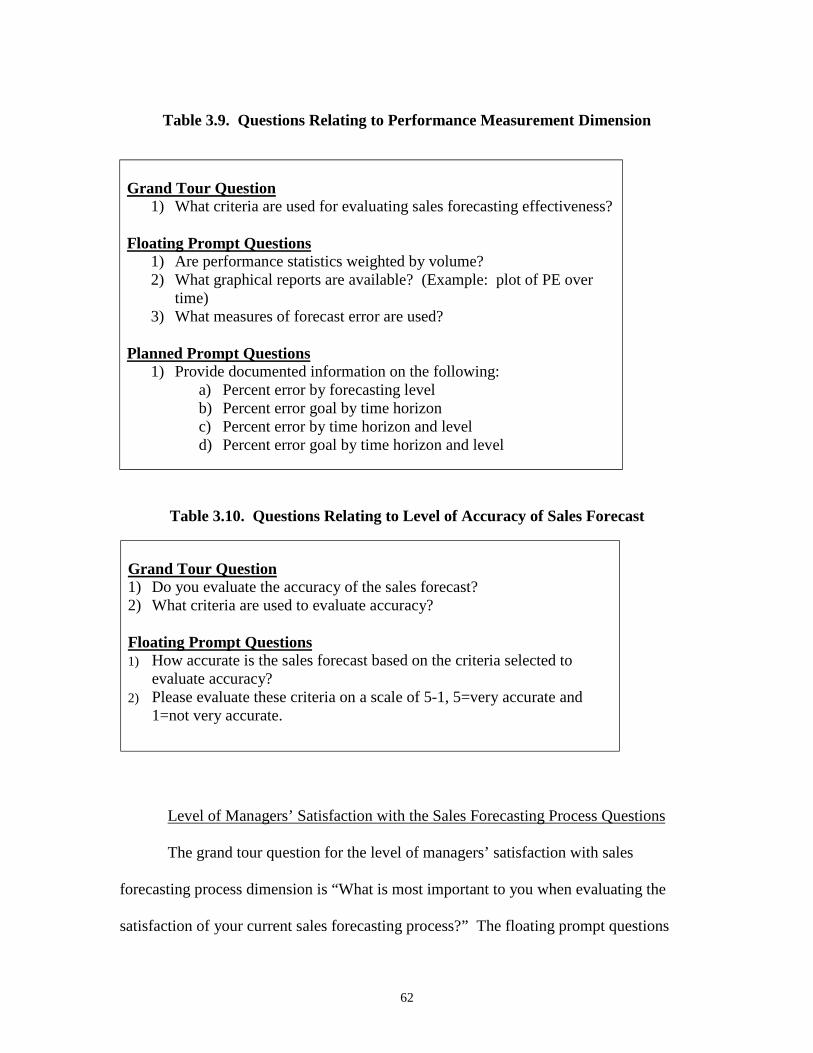
Performance Measurement Dimension Questions
The grand tour question for the performance measurement dimension is “What
criteria are used for evaluating sales forecasting effectiveness?” The floating prompt
questions include “Are performance statistics weighted by volume?”, “What graphical
reports are available?”, and “What measures of forecast error are used?” The planned
prompt questions addressed specifics such as information on percentage error by
forecasting level and time horizon. A list of each question related to the performance
measurement dimension categorized by question type is shown in Table 3.9.
Additional Protocol Questions
The additional constructs level of accuracy of the sales forecast and level of
managers’ satisfaction with the sales forecasting process were present in the literature
and protocol questions came from the literature (Mentzer & Cox, 1984a; Mentzer &
Kahn, 1995; Mentzer et al., 1996; 1999).
Level of Accuracy of the Sales Forecast Questions
The grand tour questions are “Do you evaluate the accuracy of the sales
forecast?” and “What criteria are used to evaluate accuracy?” The floating prompt
questions include “How accurate is the sales forecast based on the criteria selected to
evaluate accuracy?” and “Please evaluate these criteria on a scale of 5-1, 5=very accurate

61
and 1=not very accurate.” A list of each question related to the level of accuracy of sales
forecast dimension categorized by question type is shown in Table 3.10.
Table 3.8. Questions Relating to Systems Dimension
Grand Tour Question1) Please describe the information systems and forecasting computer systems you
use to develop each sales forecast.
Floating Prompt Questions1) The number and type (hardware, software) of forecasting systems?2) How long has each been in use?3) Is your forecasting system on a Distributed Data Network (LAN/WAN)?4) Is your forecasting system on personal computers, a mainframe, or both?5) Was your software (1) developed by vendor, (2) custom built by your
company, or (3) a commercial software package?6) If # 1, who was the vendor and please describe the development process?7) If # 3, what is the name of the package?8) Is the output from the forecasting system electronically transmitted to a
DRP/MRP system for production and inventory planning? Are forecasts usedto determine ROP and OQ?
9) Is the input to your forecasting system electronically transmitted from thecorporate Management Information System?
10) With what other systems does the forecasting system interact?11) How automated is the integration?
Planned Prompt Questions1) What information is input from the MIS to the sales forecasting system?2) Does the sales forecasting system have access to EDI (electronic data
interchange) information from suppliers?3) Does the sales forecasting system have access to EDI (electronic data
interchange) information from customers?4) Does the sales forecasting system receive demand information directly from
customers?5) If yes, are forecasts adjusted based upon this information?6) How easy is it for users to enter adjustments to sales forecasts directly into the
forecasting system?7) Which functional personnel have access to the sales forecasting system to
review, but not make changes to, the forecasts?8) Which have access to the sales forecasting system to make changes to the
forecasts?9) To what degree are your forecasting systems in different countries compatible?10) If the answer is low, is this something you are trying to accomplish?11) How satisfied are you with your existing sales forecasting system?
62
Table 3.9. Questions Relating to Performance Measurement Dimension
Grand Tour Question1) What criteria are used for evaluating sales forecasting effectiveness?
Floating Prompt Questions1) Are performance statistics weighted by volume?2) What graphical reports are available? (Example: plot of PE over
time)3) What measures of forecast error are used?
Planned Prompt Questions1) Provide documented information on the following:
a) Percent error by forecasting levelb) Percent error goal by time horizonc) Percent error by time horizon and leveld) Percent error goal by time horizon and level
Table 3.10. Questions Relating to Level of Accuracy of Sales Forecast
Grand Tour Question1) Do you evaluate the accuracy of the sales forecast?2) What criteria are used to evaluate accuracy?
Floating Prompt Questions1) How accurate is the sales forecast based on the criteria selected to
evaluate accuracy?2) Please evaluate these criteria on a scale of 5-1, 5=very accurate and
1=not very accurate.
Level of Managers’ Satisfaction with the Sales Forecasting Process Questions
The grand tour question for the level of managers’ satisfaction with sales
forecasting process dimension is “What is most important to you when evaluating the
satisfaction of your current sales forecasting process?” The floating prompt questions
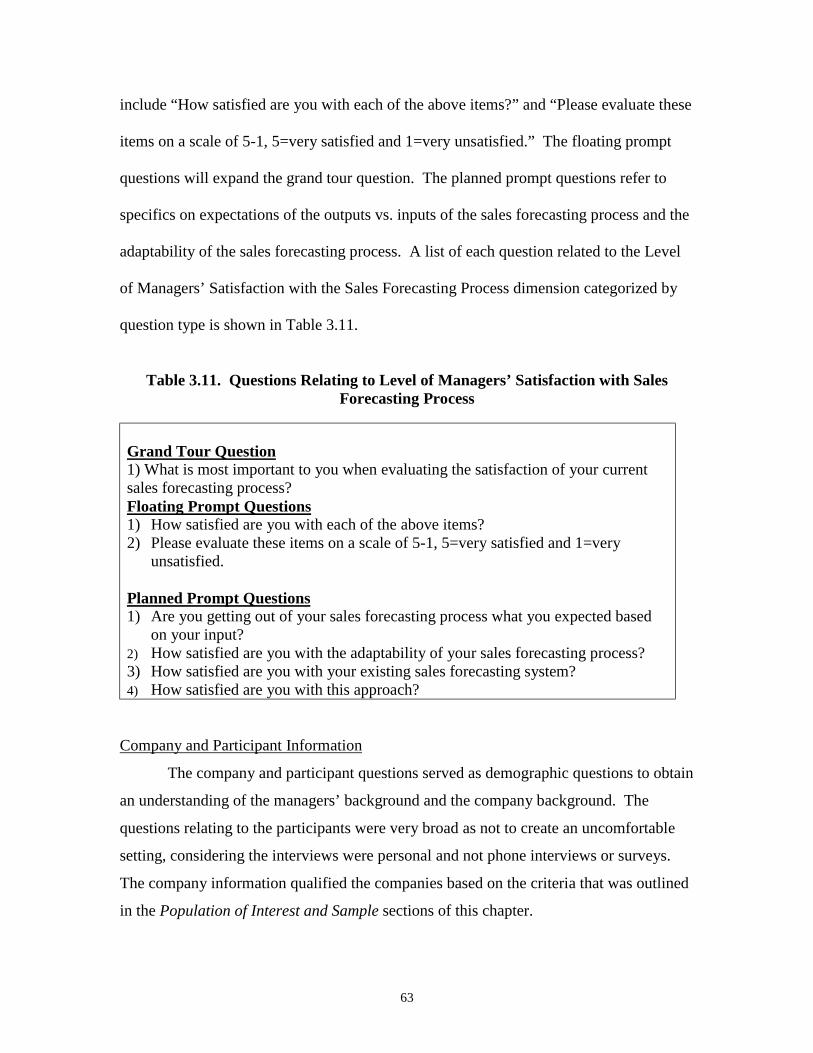
63
include “How satisfied are you with each of the above items?” and “Please evaluate these
items on a scale of 5-1, 5=very satisfied and 1=very unsatisfied.” The floating prompt
questions will expand the grand tour question. The planned prompt questions refer to
specifics on expectations of the outputs vs. inputs of the sales forecasting process and the
adaptability of the sales forecasting process. A list of each question related to the Level
of Managers’ Satisfaction with the Sales Forecasting Process dimension categorized by
question type is shown in Table 3.11.
Table 3.11. Questions Relating to Level of Managers’ Satisfaction with SalesForecasting Process
Grand Tour Question1) What is most important to you when evaluating the satisfaction of your currentsales forecasting process?Floating Prompt Questions1) How satisfied are you with each of the above items?2) Please evaluate these items on a scale of 5-1, 5=very satisfied and 1=very
unsatisfied.
Planned Prompt Questions1) Are you getting out of your sales forecasting process what you expected based
on your input?2) How satisfied are you with the adaptability of your sales forecasting process?3) How satisfied are you with your existing sales forecasting system?4) How satisfied are you with this approach?
Company and Participant Information
The company and participant questions served as demographic questions to obtain
an understanding of the managers’ background and the company background. The
questions relating to the participants were very broad as not to create an uncomfortable
setting, considering the interviews were personal and not phone interviews or surveys.
The company information qualified the companies based on the criteria that was outlined
in the Population of Interest and Sample sections of this chapter.
64
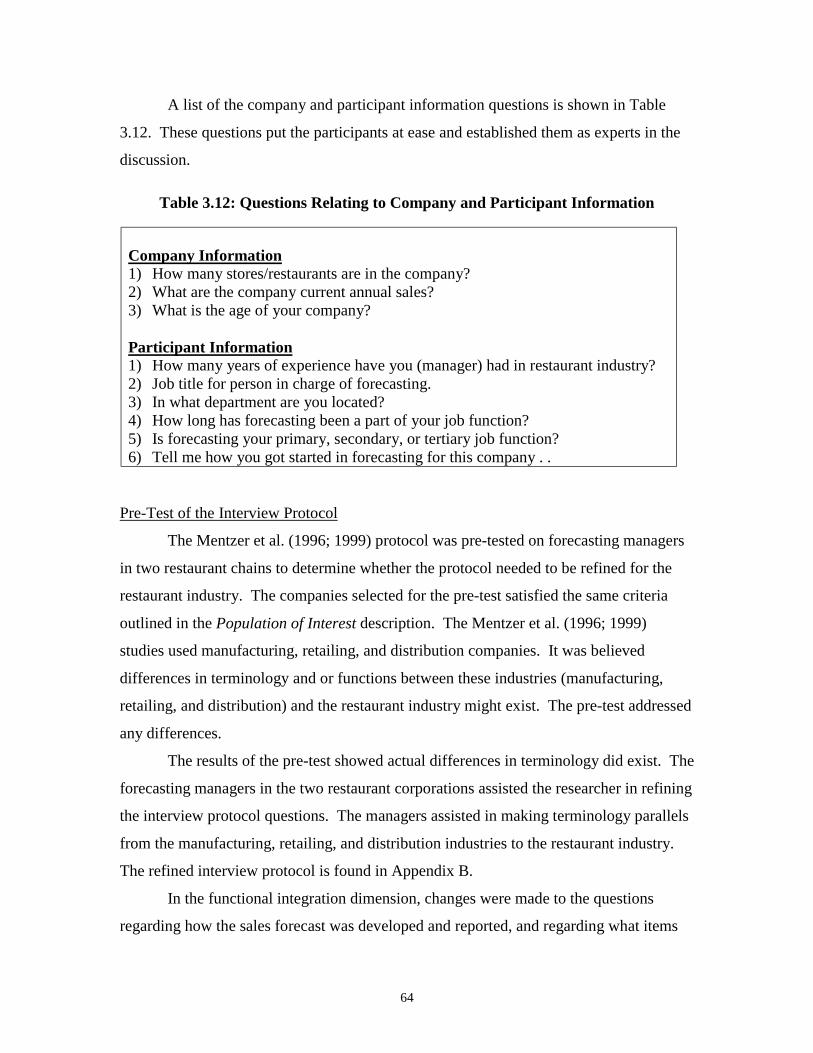
A list of the company and participant information questions is shown in Table
3.12. These questions put the participants at ease and established them as experts in the
discussion.
Table 3.12: Questions Relating to Company and Participant Information
Company Information1) How many stores/restaurants are in the company?2) What are the company current annual sales?3) What is the age of your company?
Participant Information1) How many years of experience have you (manager) had in restaurant industry?2) Job title for person in charge of forecasting.3) In what department are you located?4) How long has forecasting been a part of your job function?5) Is forecasting your primary, secondary, or tertiary job function?6) Tell me how you got started in forecasting for this company . .
Pre-Test of the Interview Protocol
The Mentzer et al. (1996; 1999) protocol was pre-tested on forecasting managers
in two restaurant chains to determine whether the protocol needed to be refined for the
restaurant industry. The companies selected for the pre-test satisfied the same criteria
outlined in the Population of Interest description. The Mentzer et al. (1996; 1999)
studies used manufacturing, retailing, and distribution companies. It was believed
differences in terminology and or functions between these industries (manufacturing,
retailing, and distribution) and the restaurant industry might exist. The pre-test addressed
any differences.
The results of the pre-test showed actual differences in terminology did exist. The
forecasting managers in the two restaurant corporations assisted the researcher in refining
the interview protocol questions. The managers assisted in making terminology parallels
from the manufacturing, retailing, and distribution industries to the restaurant industry.
The refined interview protocol is found in Appendix B.
In the functional integration dimension, changes were made to the questions
regarding how the sales forecast was developed and reported, and regarding what items

65
are forecast. These questions offered examples that reflect the restaurant industry. Listed
in Table 3.13, are the functional integration dimension questions refined for the restaurant
industry.
In the approach dimension, a question was developed regarding how “stars,”
“puzzles,” “plowhorses,” and “dogs” are forecast. These are menu items classified by
popularity and contribution margin. Listed in Table 3.14, are the approach dimension
questions refined for the restaurant industry.
In the systems dimension, questions were added about the company Point of Sales
(POS) and Back Office Systems (BOS). A question was added concerning the Efficient
Foodservice Response system, a purchasing systems for restaurants. Listed in Table
3.15, are the systems dimension questions refined for the restaurant industry.
In the performance measurement dimension, the question about weighted
performance statistics was removed, and the questions about percentage error were
reduced. Listed in Table 3.16, are the performance measurement questions refined for the
restaurant industry.
In the level of accuracy of the sales forecast dimension, questions were added
about criteria for level of accuracy of the sales forecast, and, if the company did not
measure accuracy, then what did it measure. The scale for the criteria was adjusted to
reflect importance of the criteria to the level of accuracy of the sales forecast. The new
five-point scale is, 5=very important and 1= very unimportant. A list of criteria was
added to assist the respondents in determining the level of accuracy of the sales forecast.
Listed in Table 3.17, is the questions used to determine the level of accuracy of the sales
forecast refined for the restaurant industry.

66
Table 3.13. Refined Protocol Questions Relating to Functional IntegrationDimension
Grand Tour Question1) Please describe the process you go through to develop each sales forecast.
Floating Prompt Questions1) To what extent are various functional departments involved in the development of sales
forecasts?2) What is middle management's role in developing sales forecasts?3) What is upper management's role in developing sales forecasts?4) At the beginning of each forecasting period, how does the sales forecasting process begin?
Planned Prompt Questions1) Is the business plan based upon the sales forecast or sales forecast based upon the business
plan?2) To what degree do you make the forecast agree with the business plan?3) What is a typical planning horizon for your company? Examples: 3-months, 6-months, 1-year.4) Do you use a top-down or bottom-up approach to forecasting?5) Does your company have a distribution center?6) If so, which department(s) is responsible for managing inventory?7) Do you think the process for preparing a forecast is clear and routine with precise instructions
available? Please be specific.8) Is the forecasting goals performance formally evaluated and rewarded? How?9) Are the sales forecasts developed and reported in: Guest counts, then converted to dollars;
Guest counts only; Dollars, then converted to guest counts; Dollars Only10) Are there any other ways that you report your sales forecast?11) What is forecast? (Examples: Sales revenue, Customer Demand, Smallwares, Food,
Marketing/Administrative expenses, Menu items, Retailing, Cost of Sales,Food/Beverage/Labor Costs)
12) Are there any other items that you forecast (Not mentioned above)?13) How do you plan for the following special events: new menu items, promotions? Please
elaborate on this process. (e.g., test in one store, then 50 stores, then nationally)14) Do you have company standards for any of the following? If so, please elaborate:
a. What is the length and variability of production times for most menu items?b. What is the length of ticket time to your customers?c. Are products primarily made to order or made to forecast?d. How often do stores turn over inventory?
15) How would you describe the level of competition in your industry?16) Is the demand for your products primarily driven by marketing efforts of your company and
its competitors?17) If you have a distribution center, describe the typical channel of distribution for your food
products (length)?18) If you have a distribution center, what is the shelf life for your raw products?19) If you do not have a distribution center, how involved are you in the distribution of food to
your restaurants?20) What is the shelf life for your finished products?21) Do you have overseas stores? If yes, are they a part of the same company?22) If yes, to what degree do you use the same forecasting management processes in different
countries? If the answer is low, is this something you are trying to accomplish?

67
Table 3.14. Refined Protocol Questions Relating to Approach Dimension
Grand Tour Question1) What approach is used by these functional departments to develop sales forecasts?
Floating Prompt Questions1) Do these departments develop and use their own separate forecasts, or2) Does one department develop a single forecast that all departments use, or3) Does a forecast committee develop a single forecast that all departments use, or4) Does each department develop its own forecast and a committee develops a final
compromise forecast?5) If #2, which department develops the forecast?6) If #3 or #4, which departments are on the committee?
Planned Prompt Questions1) How satisfied are you with this approach?2) At what level of product detail do you forecast? Why?3) For what forecast interval do you forecast? Why?4) For what time horizon do you forecast? Why?5) Do you forecast geographically (regions)? If so, please explain the process as it
relates to the corporate forecast.6) For each of forecasts just described, what forecasting technique(s) is used?7) How credible are the subjective technique values you receive from: executives,
channel members, salespersons?8) Do you forecast the following and, if so, how? “stars”, “puzzles”, “plowhorses”, or
“dogs”?

68
Table 3.15. Refined Protocol Questions Relating to Systems Dimension
Grand Tour Question1) Please describe the information systems and forecasting computer systems you
use to develop each sales forecast.
Floating Prompt Questions1) The number and type (hardware, software) of forecasting systems? Restaurant
Management System?2) How long has each been in use?3) Is your forecasting system on a Distributed Data Network (LAN/WAN)?4) Is your forecasting system on personal computers, a mainframe, or both?5) Was your software (1) developed by vendor, (2) custom built by your company,
or (3) a commercial software package?6) If # 1, who was the vendor and please describe the development process.7) If # 3, what is the name of the package?8) Is the output from the forecasting system electronically transmitted to a Point-
of-Sales (POS) system or Back-Office System (BOS) for production andinventory planning?
9) Is the input to your forecasting system electronically transmitted from thecorporate Management Information System?
10) With what other systems does the forecasting system interact?11) How automated is the integration?
Planned Prompt Questions1) What information is input from the MIS to the sales forecasting system?2) Does the sales forecasting system have access to EDI (electronic data
interchange) information from suppliers?3) Does your company use the Efficient Foodservice Response system? If yes, how
satisfied are you with this system?4) How easy is it for users to enter adjustments to sales forecasts directly into the
forecasting system?5) Which functional personnel have access to the sales forecasting system to
review, but not make changes, to the forecasts?6) Which departments have access to the sales forecasting system to make changes
to the forecasts?7) If you are overseas, to what degree are your forecasting systems in different
countries compatible?8) If the answer is low, is this something you are trying to accomplish?9) How satisfied are you with your existing sales forecasting system?

69
Table 3.16. Refined Protocol Questions Relating to Performance MeasurementDimension
Grand Tour Question1) What criteria are used for evaluating sales forecasting effectiveness?
Floating Prompt Questions1) What graphical reports are available?2) What measures of forecast error are used?
Planned Prompt Questions1) Please provide documented information on the following:
PERCENT ERROR BY FORECASTING LEVELPERCENT ERROR GOAL BY TIME HORIZON
2) If you do not use this information, may we have documented information on how youmeasure forecasting performance?
Table 3.17. Refined Protocol Questions Relating to Level of Accuracy of the SalesForecast Dimension
Grand Tour Question1) Do you evaluate the accuracy of your sales forecast?
Floating Prompt Questions1) What criteria do you use to evaluate your level of accuracy of sales forecast?2) On a scale of 5-1, 5 being very important and 1 being very unimportant, how
important are your criteria to your level of accuracy of sales forecast?3) If you do not measure accuracy, what do you measure?
Planned Prompt Questions1) The following is a list of criteria for measuring the level of accuracy of the salesforecast:
Guest counts, Promotions, History, Upward trends, Downward trends,CompetitionOn a scale of 5-1, 5 being very important and 1 being very unimportant, howimportant is each item in this list to your level of accuracy of sales forecast.
70
In the level of managers’ satisfaction with the sales forecasting process
dimension, the scale used to measure the level of managers’ satisfaction with the sales
forecasting process was adjusted to reflect importance of the criteria to the level of
managers’ satisfaction with the sales forecasting process. The new scale is a five point
scale, 5=very important and 1= very unimportant. A list of criteria was developed to
assist managers in determining the level of managers’ satisfaction with the sales
forecasting process. Listed in Table 3.18, is the questions used to determine the level of
managers’ satisfaction with the sales forecasting process refined for the restaurant
industry.
Reliability and Validity
A discussion of reliability and validity is very important because of the subjective
nature of the research design. Yin (1989) suggests that reliability should allow a later
investigator to arrive at the same findings or conclusions. Kirk and Miller (1986)
believed that observations entail the recording of the reaction of some entity to some
stimulus, even if the stimulus is the act of measurement. Reliability depends essentially
on explicitly described observational procedures. Weller and Romney (1988) concluded
that, in its simplest terms, reliability is synonymous with consistency. In contrast,
Marshall & Rossman (1999) suggest that qualitative research does not pretend to be
replicable. They believed that replication is impossible because the real world changes.
Hudson and Ozanne (1988), who suggest that qualitative studies are time bound, also
support this idea.
According to Kirk and Miller (1986) the issue of validity is a question of whether
the researcher sees what he thinks he sees. Marshall and Rossman (1999) point out that
the strength of the qualitative study that aims to explore a problem or describe a setting, a
process, a social group, or a pattern of interaction will be its validity. An in-depth
description showing the complexities of variables and interactions will be so embedded
with data derived from the setting that it cannot help but be valid (Marshall and Rossman,
1999). The discussion of reliability and validity are often used to evaluate quantitative
research Lincoln and Guba (1985) put forth four questions that need to be answered in

71
order to assess trustworthiness of qualitative research findings allowing qualitative
research to be evaluated according to qualitative criteria. These are discussed below.
Table 3.18. Refined Protocol Questions Relating to Level of Managers’ Satisfactionwith Sales Forecasting Process
Grand Tour Question1) What is most important to you when evaluating the satisfaction of your current sales
forecasting process?
Floating Prompt Questions1) What criteria do you use to evaluate your level of satisfaction with your sales forecasting
process?2) On a scale of 5-1, 5 being very important and 1 being very unimportant, how important
are your criteria to your level of satisfaction with your sales forecasting process?
Planned Prompt Questions1) The following are a list of criteria for measuring a managers’ level of satisfaction with the
sales forecasting process:• Numeric percentage of guest counts• Sales dollars• No reports of forecasting error from other managers• A reward for using the forecasting system• Ease of use
2) On a scale of 5-1, 5 being very important and 1 being very unimportant, how important arethis list of criteria to your level of satisfaction with the sales forecasting process?
3) Are you getting out of your sales forecasting process what you expected based on the inputs?4) How satisfied are you with the adaptability of your sales forecasting process?5) Is there anything about your sales forecasting process that you would change?6) How satisfied are you with your existing sales forecasting system?7) How satisfied are you with this approach to forecasting?
Assessing the Trustworthiness of Qualitative Data and Interpreted Findings
The four questions put forth to assess trustworthiness of qualitative research
(Lincoln & Guba, 1985) include the following: How do we know whether to have
confidence in the findings (credibility)? How do we know the degree to which the
findings apply in other contexts (transferability)? How do we know the findings would
repeat if the study could be replicated in essentially the same way (dependability)? How

72
do we know the degree to which the findings emerge from the context and the
participants and not solely from the researcher (confirmability)? Wallendorf and Belk
(1989) extend this framework by adding a fifth question: How do we know whether the
findings are based on false information from the informants (integrity)? The five
concepts addressed in the above questions will be described and defined. Then,
techniques employed in the current research are discussed.
Credibility
Credibility is defined as the adequate and believable representations of the
participants’ constructions of reality (Wallendorf & Belk, 1989). In other words, do the
results of the proposed research seem believable, complete, and adequate? Credibility
must be considered during data collection and analysis. During data collection,
prolonged engagement and triangulation across sources (Lincoln & Guba, 1985;
Wallendorf & Belk, 1989) are used to assess/ensure credibility.
Prolonged engagement is described as the amount of time the researcher is
interacting with the participants and the core phenomenon. The required amount of
prolonged engagement is a function of the research questions and the researcher’s
experience in the area of investigation. In the current study, prolonged engagement was
accomplished by spending a reasonable amount of interviewing time with the participants
in their place of employment. Previous experience in the restaurant industry benefits the
researcher here (Lincoln & Guba, 1985; Wallendorf & Belk, 1989).
Triangulation across sources is described as collecting evidence for an
interpretation from interaction with several participants. Triangulation across sources is
accomplished through redundant results and perspectives among participants.
Redundancy is the key to concluding the data collection process (Lincoln & Guba, 1985;
Wallendorf & Belk, 1989).
Transferability
Transferability is the ability to which findings from one study in one context will
apply to other contexts (Wallendorf & Belk, 1985). Sampling enables the researcher to
let findings from initial participants guide selection of future participants within one
73
study. Both the design and the participant selection should remain flexible in order to
take advantage of the discovery process (Strauss & Corbin, 1990).
Dependability
Dependability is defined as the degree to which the interpretation was constructed
so as to limit interpretation instability (Wallendorf & Belk, 1989). In short, would these
findings emerge if a different researcher conducted the identical research study? Lincoln
and Guba (1985) suggest the use of a dependability/confirmatory audit. This audit is
conducted by giving raw data and interpretations to an external auditor. In the current
study, a trained external researcher read portions of the qualitative data analyses and
commented on its appropriateness. The external reviewer, Dr. Michael Garver of Central
Michigan University, alerted the researcher to any disagreements in the data. In addition,
open, axial, and selective coding techniques have dependability checks built in (Strauss &
Corbin, 1990).
Confirmability
Confirmability is the ability to trace the researcher’s steps taken to analyze the
qualitative data (Wallendorf & Belk, 1989). Wallendorf and Belk (1989) suggest that an
audit also can achieve confirmability. To this end, for this study, the external researcher
was asked to read a rough draft of the qualitative findings to determine if he is
comfortable with the interpretation. In addition, actual participant quotes are used in the
discussion section of this dissertation to provide support for confirmability. The latter is
important for readers to be able to, at least potentially, make their own assessment of
confirmability.
Integrity
Finally, integrity refers to the degree of trustworthiness placed in the data,
assuming that participants do not purposefully mislead or misinform the researcher
(Wallendorf & Belk, 1989). Techniques to ensure integrity include triangulation across
participants, good interviewing techniques, and safeguarding participants.

74
Triangulation across sources is described as collecting evidence for an
interpretation from interaction with several participants. Triangulation across sources is
used to assess/ensure credibility, but is also employed to assess/ensure integrity. Once
again, triangulation is accomplished by finding redundant results and perspectives among
participants. As stated earlier, redundancy among participants was key to concluding the
interviewing process.
An indicator to successful interviewing is the degree of talking by participants and
the interviewer. A good assessment of integrity was the participants doing a majority of
talking. The researcher facilitated the interview and the participants openly and freely
discussed their perspectives.
Finally, safeguarding participant identity is a useful tool to assess/ensure integrity
in qualitative data. The researcher safeguarded the identity of the participants by
providing anonymity to participants. The researcher ensured each participant that his/her
responses would be held in complete confidence, which gave participants psychological
freedom to discuss their perspectives.
Trustworthiness in qualitative data and findings allows qualitative research to be
evaluated with qualitative criteria (Wallendorf & Belk, 1989; Lincoln & Guba, 1985). In
addition, the aforementioned criteria are used in marketing-based research (Flint, 1998;
Garver, 1998).
Chapter Summary
The methodology for the study was presented in Chapter III. The chapter began
with a review of the research questions and the sales forecasting benchmarking model.
Each construct of the model was defined and supported through tables. Following the
constructs, a discussion of the research design was presented. The research design
included the selection of a qualitative study, the use of a four-step method of inquiry in
qualitative research, the interviewing process, sample selection, sample size, data analysis
procedures, and a discussion of reliability and validity in qualitative research. Research
propositions were identified and the interview protocol was presented.


![THE RELATIONSHIP BETWEEN THE PRECAUTIONARY ......2009] Prevention, precaution, logic and law 107 superfluous the continued existence of a separate preventative principle in international](https://static.fdocuments.in/doc/165x107/60955125c3edbe21a42fe693/the-relationship-between-the-precautionary-2009-prevention-precaution.jpg)


