CHAPTER III DYNAMICS, WASTAGE, AND EFFICIENCY … · CHAPTER III DYNAMICS, WASTAGE, AND EFFICIENCY...
42
CHAPTER III DYNAMICS, WASTAGE, AND EFFICIENCY OF THE GENERAL EDUCATION 3.1. Scope and Significance Originating from the language of economists, the term "wastage" is used within the field of education to describe various aspects of failure of an educational system to achieve its objectives (UNESCO, 1971). The term is particularly used to describe the combined effect of repetition and dropout on the progression of a group of students through a specific educational system. To repeat a class is regarded as a waste, to the extent that it increases the class density and lessens the chance for new beginners to the educational level. To drop out before completing the final grade of a given level or stage of education is considered wasteful, since some dropouts do not achieve the required cultural level and might be added to the credit of illiteracy. In addition, non-graduates provide unqualified additions to the labour market and increase the economic loss of expenses. On the other side, "efficiency" is a concept that refers to the relationship between the inputs into a system and outputs from that system. An activity is said to be efficient if maximum outputs is being obtained with the minimum possible inputs (UNESCO, 1979). The inputs in an educational system are the pupils entering a given level or stage and the different kinds of educational supplies and services (school buildings, equipment, teachers, textbooks, teaching aids, etc.). However, for our purpose, inputs into a given educational level are measured in "pupil/years", which is defined as "the number of pupils entering the level multiplied by the number of school years actually spent by each of them in the level". One pupil/year stands for both a pupil's personal effort and the educational supplies and services spent on him in the course of one school year. Educational output is, basically, to be defined as "the number of pupils successfully completing an educational level, namely graduating from the level” (UNESCO, 1971). It should be noted here that the above definitions of inputs and outputs, which are commonly used in evaluating the educational wastage and efficiency, may overlook some of the real performances of the educational system in Egypt. For instance, pupils separating from school due to the official regulations governing the number of repetitions allowed in a specific educational level (or by each grade of the level) are considered, according to the above definitions, wastage of dropout. While the educational system in Egypt permits those dropouts from the different levels of education due to repetition regulations to change their educational path to other types of vocational or technical education. For example, in 1991/92 school year, the third grade of commercial secondary received 5149 students (1693 males and 3456 females) among those who consumed the
Transcript of CHAPTER III DYNAMICS, WASTAGE, AND EFFICIENCY … · CHAPTER III DYNAMICS, WASTAGE, AND EFFICIENCY...

CHAPTER III DYNAMICS, WASTAGE, AND EFFICIENCY OF
THE GENERAL EDUCATION
3.1. Scope and Significance
Originating from the language of economists, the term "wastage" is used within the field of
education to describe various aspects of failure of an educational system to achieve its
objectives (UNESCO, 1971). The term is particularly used to describe the combined effect
of repetition and dropout on the progression of a group of students through a specific
educational system. To repeat a class is regarded as a waste, to the extent that it increases
the class density and lessens the chance for new beginners to the educational level. To drop
out before completing the final grade of a given level or stage of education is considered
wasteful, since some dropouts do not achieve the required cultural level and might be
added to the credit of illiteracy. In addition, non-graduates provide unqualified additions
to the labour market and increase the economic loss of expenses. On the other side,
"efficiency" is a concept that refers to the relationship between the inputs into a system and
outputs from that system. An activity is said to be efficient if maximum outputs is being
obtained with the minimum possible inputs (UNESCO, 1979).
The inputs in an educational system are the pupils entering a given level or stage and the
different kinds of educational supplies and services (school buildings, equipment, teachers,
textbooks, teaching aids, etc.). However, for our purpose, inputs into a given educational
level are measured in "pupil/years", which is defined as "the number of pupils entering the
level multiplied by the number of school years actually spent by each of them in the level".
One pupil/year stands for both a pupil's personal effort and the educational supplies and
services spent on him in the course of one school year. Educational output is, basically, to
be defined as "the number of pupils successfully completing an educational level, namely
graduating from the level” (UNESCO, 1971).
It should be noted here that the above definitions of inputs and outputs, which are
commonly used in evaluating the educational wastage and efficiency, may overlook some
of the real performances of the educational system in Egypt. For instance, pupils
separating from school due to the official regulations governing the number of repetitions
allowed in a specific educational level (or by each grade of the level) are considered,
according to the above definitions, wastage of dropout. While the educational system in
Egypt permits those dropouts from the different levels of education due to repetition
regulations to change their educational path to other types of vocational or technical
education. For example, in 1991/92 school year, the third grade of commercial secondary
received 5149 students (1693 males and 3456 females) among those who consumed the

40
allowable repetitions in general secondary level. A sum of 12479 students (7619 males and
4860 females) among those dropped out compulsorily from general secondary were
enrolled at both the second and third grades of industrial secondary, in the 1992/93 school
year.
In spite of the implied shortcomings, the above-mentioned definitions of inputs and
outputs will be utilized for the purpose of analyzing wastage and efficiency of the main
levels of general and technical education in Egypt. Besides, a modest approach is followed
to overcome those shortcomings when we proceed in analyzing the flow of a hypothetical
cohort in each of the educational levels. That is to decompose the total number of dropouts
from a given level, out of the radix of the cohort, into two main categories:
a) Dropouts due to official regulations controlling the times of repetitions permitted
in the level, and
b) Dropouts due to other reasons rather than repeated failure, such as unwillingness
to proceed in education or death.
A considerable proportion of the first category must be regarded as they are entitled to
pursue their education in other vocational or technical schools. Some others might sit for
examination in their original levels as home students.
In measuring the wastage of the educational process, the total wastage of pupil/years due
to dropout is, consequently, divided into:
a) Wastage of dropout due to repeated failure, and
b) Wastage of dropout due to other causes including death.
A sizeable number of the first division must be viewed not as wastage of pupil/years, but
as capital transfers between the different levels inside the educational system.
3.1.1. Data Required
The basic statistical data required for the analysis of the wastage and efficiency of an
educational system are the actual enrollment by grade for successive years, classified into:
beginners and repeaters for the first grade, and into promoted and repeaters for the other
grades of the level. Before the 1991/92 school year, the numbers of repeaters enrolled at
each grade of the different levels of education, were given in the results of the annual
November school census by the M.O.E., for both sexes combined. As one of the objectives
of the present study is to examine the gender differentials in the educational process, the
available data by gender for the school years from 1991/92 to 1994/95 are used for
calculating the average rates of promotion, repetition, and dropout as in this period.
3.1.2. Concepts and Notations
It is necessary, before proceeding to the analysis, to summarize the major concepts utilized
in examining the educational progression. These concepts can be classified in two groups:

41
group (A) includes the definitions and notations appertaining to the input/output flow,
while the concepts utilized for the analysis of educational wastage and efficiency are
included in group (B). It is worthy to mention that, these concepts and definitions are
utilized in the present chapter for studying the dynamics and wastage of the general
educational levels (primary, general preparatory and general secondary) and in the
following chapter for the same purpose with respect to the technical secondary education
(industrial, agricultural and commercial).
Group (A): Notations and definitions pertaining to the input-output flow:
B1y = number of beginners entering the first grade of the cycle in the school year (y).
Egy = number of pupils enrolled in grade (g) in the school year (y).
Pgy = promoted pupils enrolled in grade (g) at the school year (y), that were in grade
(g-1) at year (y-1).
Rgy = repeaters enrolled in grade (g) at the school year (y), that were in grade (g) at
year (y-1).
Dgy = dropouts from grade (g) at the school year (y).
The enrollment (Egy) in grade (g) at year (y) is the sum of repeaters (Rg
y) enrolled in
grade (g) at year (y) and promoted (Pgy) enrolled in grade (g) at year (y). This number,
when transferred to the next year (y+1), will be partitioned into three parts: the first part
will be (Pgy++11), those promoted being enrolled in grade (g+1) at year (y+1); the second
part will be (Rgy+ 1) those repeating in grade (g) at year (y+1); and the third part (Dg
y),
those dropping out from grade (g) at year (y).
The dropout is one who leaves the educational system whether the reason be death,
repeated failure or unwillingness to proceed (Abdel-Aty, 1977).
Therefore, we have the following relations for every two successive grades (g, g+1) in two
successive years (y, y+1):

42
Egy = Pg
y + Rgy ................................. (3.1)
and
Egy = Pg
y++11 + Rg
y+ 1 + Dgy ................................ (3.2)
Thus, (Dgy), the dropouts from grade (g) in year (y), are evaluated from equation (3.2).
We have to point out that, for the first grade of a specific level, P1y = B1
y .
Also, for the final grade of the level, the output will be:
(Pgy++11) representing those enrolled as beginners in the next higher level, plus
(Dgy) representing those dropping out and not enrolled in the next higher level.
Rates of flow:
Dividing both sides of (3.2) by Egy we get the following rates:
(i) Promotion rate:
pgy++11 = Pg
y++11 / Eg
y ................................. (3.3)
representing the rate of promotion from grade (g) to grade (g+1) when passing from year
(y) to the next year (y+1).
(ii) Repetition rate:
rgy+ 1 = Rg
y+ 1 / Egy ................................. (3.4)
representing the rate of repetition, that is from grade (g) to same grade (g) also, when
passing from year (y) to the next year (y+1).
(iii) Dropout rate:
dgy = Dg
y / Egy ................................... (3.5)
representing the drop-out rate from grade (g) at year (y) when passing to the next year
(y+1).
The sum of the three rates will add to unity, i.e.:
pgy++11 + rg
y+ 1 + dgy = 1

43
Those rates are variables that might change from year to year. However, their values give
us an indication for evaluating the educational process. Larger values of promotion rate
with lower repetition and dropout rates indicate improvement in the educational system.
When these rates approach fixed values, then we can say that the system of education
attained a stationary state (Abdel-Aty, 1977).
Group (B): Concepts utilized in measuring wastage and efficiency of an
educational system: Measures and indices of educational wastage and efficiency utilized in the present chapter
and in the following one are derived by the application of two methods:
1. The "Mathematical Treatment" developed by Abdel-Aty in 1977, and
2. The "Demonstrative" or "Students' Flow" method.
Both methods assume constant grade-specific promotion, repetition and dropout rates
over time. The measurements in both methods are derived by applying the respective rates
of promotion, repetition and dropout to a hypothetical cohort of 1000 entrants into each of
the educational cycles. The only difference between the two methods is with regard to the
frequency of repetitions. In case of the first method it is assumed that official regulations
permit two repetitions in the level, one by grade; so it is used in analyzing wastage and
efficiency of the educational levels which are governed by regulations accord with this
assumption (industrial, agricultural and commercial secondary levels). As regards the
educational cycles in which the repetition allowance exceeds two times, the demonstrative
method is applied.
(i) Efficiency of an educational cycle
Efficiency is basically a mechanical term which compares the input with the output energy
of a machine; similarly for an educational cycle's system we have to compare the output
with the input of the cycle. Evidently, if 1000 pupils start an educational cycle together, say
the primary cycle of five grades, and then all terminate the cycle after five years, the cycle
will be completely efficient.
Taking the efficiency measure to be the ratio of output to input, then:
Efficiency = total number of graduates / 1000
Ideal (or maximum) efficiency ratio is, of course, equal to one, there being no repeaters,
dropout or death. However, 100% efficiency has never been attained in any educational
system (Abdel-Aty, 1977).
(ii) Total number of pupil / years
The total number of years spent by the students of a cohort in an educational level whether
they are successfully terminating the level or not. This represents the actual cost of the
cohort (years-cost). This is derived as:
Total number of pupil / years = i∑ (G i x i+ D i y i )
44
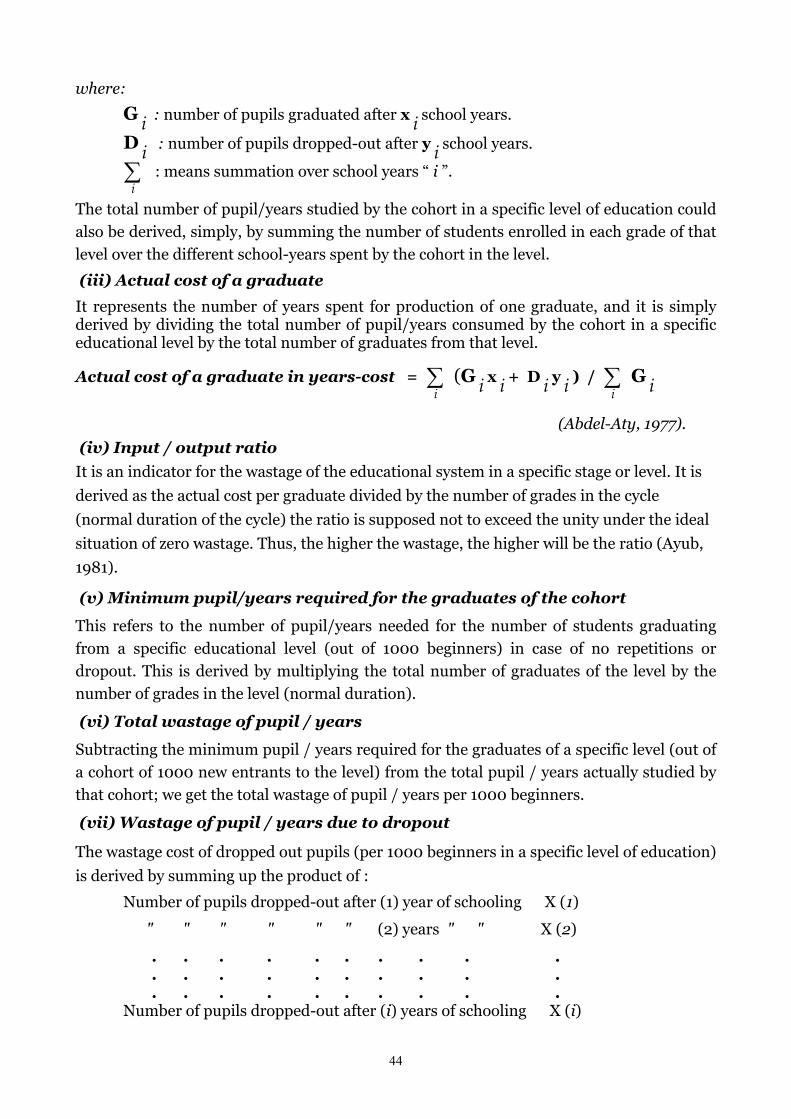
where:
G i : number of pupils graduated after x i school years.
D i : number of pupils dropped-out after y i school years.
i∑ : means summation over school years “ i ”.
The total number of pupil/years studied by the cohort in a specific level of education could
also be derived, simply, by summing the number of students enrolled in each grade of that
level over the different school-years spent by the cohort in the level.
(iii) Actual cost of a graduate
It represents the number of years spent for production of one graduate, and it is simply derived by dividing the total number of pupil/years consumed by the cohort in a specific educational level by the total number of graduates from that level.
Actual cost of a graduate in years-cost = i∑ (G i x i+ D i y i ) /
i∑ G i
(Abdel-Aty, 1977).
(iv) Input / output ratio
It is an indicator for the wastage of the educational system in a specific stage or level. It is
derived as the actual cost per graduate divided by the number of grades in the cycle
(normal duration of the cycle) the ratio is supposed not to exceed the unity under the ideal
situation of zero wastage. Thus, the higher the wastage, the higher will be the ratio (Ayub,
1981).
(v) Minimum pupil/years required for the graduates of the cohort
This refers to the number of pupil/years needed for the number of students graduating
from a specific educational level (out of 1000 beginners) in case of no repetitions or
dropout. This is derived by multiplying the total number of graduates of the level by the
number of grades in the level (normal duration).
(vi) Total wastage of pupil / years
Subtracting the minimum pupil / years required for the graduates of a specific level (out of
a cohort of 1000 new entrants to the level) from the total pupil / years actually studied by
that cohort; we get the total wastage of pupil / years per 1000 beginners.
(vii) Wastage of pupil / years due to dropout
The wastage cost of dropped out pupils (per 1000 beginners in a specific level of education)
is derived by summing up the product of :
Number of pupils dropped-out after (1) year of schooling X (1)
" " " " " " (2) years " " X (2)
. . . . . . . . . . . . . . . . . . . . . . . . . . . . . . Number of pupils dropped-out after (i) years of schooling X (i)

45
That is, wastage cost of dropped-out pupils = i∑ D i y i
The above procedure is used in computing the wastage cost of dropouts, in pupil/years
cost, whatever the reason behind dropping-out the educational cycle is (repetition
regulations, death, unwillingness to continue in education or all these reasons combined).
(viii) Wastage of pupil / years due to repetition
This is simply, derived as the difference between the total wastage of pupil/years and the
wastage of pupil / years due to dropout.
Also, it can derived by summing up the products of:
Number of graduates repeated one year X (1)
" " " " " two years X (2)
. . . . . . . . . . . . . . . . . . . . . . . .
Number of graduates repeated (n) years X (n)
3.2. Dynamics, Wastage, and Efficiency of the Primary Education
Primary education is the first cycle of the compulsory basic education in Egypt. It is the
base for the pre-university education, in particular, and the entire educational system, in
general. The main goals for basic education in Egypt, as identified in the various education
acts are:
1. Preparing and developing Egyptian citizens in a manner that will assist them both to
adjust to the demands of modern society and to comprehend the religious, national and
cultural dimensions of their society.
2. Providing society with citizens who have mastered basic academic skills, with special
emphasis on skills of reading and writing, mathematics, science and languages.
3. Preparing and assisting citizens to develop transferable skills, including analytical skills,
critical thinking, scientific skills and problem-solving skills, which can enable them to
respond to ongoing demands and adjustments required by scientific and technological
progress.
Within this general context, the essential objectives of primary education are to cultivate
the basics of national identity and culture and to develop the potentialities and abilities of
the child, within a framework that balances a child's right to education and his right to
enjoy his childhood (M.O.E., 1993).
The present section is devoted for examining the pupils flow in the primary education cycle, and for evaluating the wastage and efficiency of the cycle's systems as well. This analysis necessitates, firstly, having a look at the promotion system and repetition regulations in this stage of education.

46
3.2.1. Promotion System and Repetition Regulations in the Primary Education
Cycle
The system of promotion to the different forms and the repetition regulations in the
primary education cycle are defined by the ministerial decree No. 270, (1989) and its
amendment by the decree No. 10, (16-1-1996). These are summarized as follows:
1. Pupils of grade 1:
A second session exams will be held for the pupils who fail, in the first session, to get 50%
of the total marks of all or some of the subjects (religious education, Arabic and
mathematics). Then, all the pupils are promoted to grade 2.
2. Pupils of grades 2,3 and 4:
a. A second session exams will be held for the pupils who fail in the first session, or who do
not attend the examinations of the first session.
b. It is permitted for the pupils who fail to pass the examinations of the second session to
repeat the grade for one time, then they will be promoted to the higher grade (after sitting
for the exams on one or two sessions).
3. Pupils of grade 5:
a. Pupils of the fifth grade primary who fail to pass the exams of the first and second
sessions are allowed to repeat the grade once.
b. Those who fail for the second time (after the exams of two sessions) will be enrolled at
the first grade of the vocational preparatory education.
3.2.2. Pupils' Flow in Primary Level
It is obvious that a student enrolled in a specific grade of school may be promoted to the
next higher grade, or may be retained in school to repeat the same grade, or may dropout
from school due to different reasons such as: death, repeated failure or unwillingness to
continue learning. Thus, the study of the flow of students involves an examination for the
above three components.
The following few pages include an examination for the flow of pupils, of each sex, at the
primary education cycle, as indicated by the most recent educational data. But before
proceeding in this examination, it is necessary to note that the enrollment statistics by the
M.O.E. showed numbers of pupils classified as repeaters in grade one primary, although it
is stated in the ministerial decree No. 270, (1989) and its amendment by decree No. 10,
(1996) that all the pupils of grade one primary are promoted to grade two after sitting for
exams of one or two sessions. It is likely that the pupils classified as repeaters in grade one
primary are those who have not attended the exams of the second session, in a specific
school year, and who have been re-enrolled in the same grade during the following year. In
our analysis, however, those numbers of pupils are considered repeaters, as they are

47
presented by the statistics, to reflect the actual picture of the flow of the pupils in primary
level, regardless of texts of the decrees.
3.2.2.a. Flow of boys
Table (3.1) shows the enrollment of boy pupils in primary level for the school years from 1991/92 to 1994/95, classified by grade, promoted and repeaters. Numbers of dropouts from each grade, on transition from a specific year of schooling to the next year; which could be evaluated using equation (3.2) and the above data, are given also in the same table. Applying the equations numbered from (3.3) to (3.5) on data of the above table, we got the rates of flow for boys at primary level between the above school years. These rates, as well as their arithmetic means, as in period 1991/92 - 1994/95, are given in table (3.2).
From the above table, no striking regularity is observed regarding the trend in promotion and repetition rates from the 1991/92 to 1993/94 school years. There has been a decreasing trend in dropout rate between the 1991/92 and 1994/95 school years in both the fourth and the fifth grades.
As respects the pattern of the rates of flow across grades, the arithmetic means of these rates, shown in the bottom of table (3.2), indicate the following:
1. A very high rate of promotion in the initial grade, then it declines gradually by grade. However, if the regulations of promotion from grade one to grade two are well used by the boy pupils and their parents, the average promotion rate in grade one would have been 99.74% instead of 99.60%.
2. The pattern of repetition starts by a rate of 7.24% in grade two, then it increases gradually to reach 12.89% in grade five.
3. The pattern of dropout begins by a very low rate of 0.26% in the initial grade, then it increases gradually up to grade four to reach 2.25%. A great jump in dropout rate is noticed in the final grade of the level; where the average dropout rate exceed that of grade four by 2.5 times.
Back to table (3.1), the absolute numbers indicate a declining trend in the total number of boy pupils dropping out from the primary level, despite the continuous increase in the total enrollment of boys in the level. In the year 1991/92 the total enrollment of boys in primary schools was 3,599,454 of which 90,111 pupils were dropped out on transition to the next year. That is a percentage of 2.5% were dropped out. The total number of boys enrolled in the primary education cycle, in the school year 1992/93 was 3,721,608 of whom a sum of 73,544 boys were dropped out the cycle during transition to the 1993/94 school year. That is, a percentage of 2.0% of the total enrollment of boys were dropped out the cycle. Out of 3,843,122 boys enrolled in the primary level in 1993/94, there were 62,143 dropped out on transition to the next school year 1994/95, which comes out to be 1.6%. The phenomenon of dropping out is markedly noticed in the last two grades of the primary level. The total of boys who dropped out from grades four and five combined represents a value around three fourths the total boys who dropped out from the primary level; along the school years under study.

48
Table (3.1): Enrollment of boys in primary level classified by grade, promoted, and repeaters, Egypt, 1991/92 - 1994/95
School Grade 1 Grade 2 Grade 3 Grade 4 Grade 5
years Beg. Rep. Drp. Enr. Pro. Rep. Drp. Enr. Pro. Rep. Drp. Enr. Pro. Rep. Drp. Enr. Pro. Rep. Drp. Enr.
1991/92 716341 0 716341 710311 55977 766288 659325 45276 704601 626085 83916 710001 596129 106094 702223 3283 9925 8421 18015 50467
1992/93 758649 774 759423 712284 62691 774975 693672 51063 744735 645117 91520 736637 600466 105372 705838 31 10250 9012 17725 36526
1993/94 795908 1241 797149 758151 48778 806929 715947 41148 757095 694575 67443 762018 651469 68462 719931 2366 5490 7642 13684 32961
1994/95 773774 1302 775076 793481 58330 851811 743109 74537 817646 674916 82762 757678 665572 100470 766042
Source: Information & computer services directorate, M.O.E. Note : Numbers of dropouts are evaluated using equation (3.2).
Table (3.2): Promotion, repetition, and dropout rates for boys in primary level grades,
in Egypt between 1991/92 and 1994/95 School Grade 1 Grade 2 Grade 3 Grade 4 Grade 5 years Rates in % of: Rates in % of: Rates in % of: Rates in % of: Rates in % of:
Pro. Rep. Drp. Pro. Rep. Drp. Pro. Rep. Drp. Pro. Rep. Drp. Pro. Rep. Drp.
1991/92 99.43 0.11 0.46 90.52 8.18 1.30 91.56 7.25 1.19 84.57 12.89 2.54 77.80 15.01 7.19
1992/93 99.83 0.16 0.01 92.38 6.30 1.32 93.26 5.53 1.21 88.44 9.16 2.40 85.13 9.70 5.17
1993/94 99.54 0.16 0.30 92.09 7.23 0.68 89.15 9.84 1.01 87.34 10.86 1.80 81.46 13.96 4.58
Arithmetic
Means 99.60 0.14 0.26 91.66 7.24 1.10 91.32 7.54 1.14 86.78 10.97 2.25 81.46 12.89 5.65
Source: Computed by applying the equations from (3.3) to (3.5) on data of table (3.1).

49
As regards the dropouts of boys from the final grade only, table (3.1) shows the following:
1. On transition from 1991/92 school year to the next year, about 56% of the total boys who
dropped out the primary schools come from grade five only.
2. About 50% of the total boys who dropped out the primary level, during transition from
1992/93 to the next year, come from the final grade also.
3. The number of boys who dropped out the fifth grade only, on transition from the
1993/94 school year to the 1994/95 school year, represented 53% of the total boys who
dropped out the whole level in the same period.
One can easily imagine how great the wastage of pupil / years due to dropouts is, when
being informed that every pupil dropping out the fifth grade means at least five pupil /
years cost.
3.2.2.b. Flow of girls
Table (3.4) presents the rates of promotion, repetition, and dropout for girls in primary
level between 1991/92 and 1994/95. Having a look on the above table, and another on table
(3.2), the following could be noticed:
1. Promotion rates for girls, along the school years under investigation, are higher
than those for boys, in all grades of primary level except in the initial grade.
2. Repetition rates for girls in the above grades, along the same period, are lower than
those for boys.
3. Girls tend more than their boy colleagues to separate from the early two grades of
primary education, but once they reach the middle grade of the cycle, they dropout
from school by rates lower than those of boys.
Table (3.4) also shows a declining trend in the dropout rates for girls between 1991/92 and
1994/95, starting from grade two, up to the final grade of the primary cycle. The absolute
numbers of enrollment of girls at the primary education, which are presented in table
(3.3), indicate a successive increase in the enrollment figures accompanied with a
successive decrease in the numbers of dropouts, along the years under investigation. The
total number of girls enrolled at the primary education, in the 1991/92 school year was
2,942,755; of whom 67,897 dropped out on transition to the next school year. That is a
percentage of 2.3% were dropped out the level. In the 1992/93 school year, a total of
3,069,520 girls were enrolled in primary schools, of which 54,678 dropped out during
transition to the next year of schooling; representing 1.8% of the above total. Out of
3,206,427 girl pupils enrolled in primary level in 1993/94 there were 39,465 dropped out
on transition to the next school year 1994/95; which comes out to be 1.2%. Total of girls
who dropout from the final two grades of the primary level represented a percentage
around 70% of the total number of girls who dropped out the whole level, during transition
from each of the school years investigated in this study to the next year.

50
Table (3.3): Enrollment of girls in primary level classified by grade, promoted, and repeaters, Egypt, 1991/92 - 1994/95
School Grade 1 Grade 2 Grade 3 Grade 4 Grade 5
years Beg. Rep. Drp. Enr. Pro. Rep. Drp. Enr. Pro. Rep. Drp. Enr. Pro. Rep. Drp. Enr. Pro. Rep. Drp. Enr.
1991/92 607014 0 607014 597434 34586 632020 550236 27204 577440 516339 53454 569853 489254 67174 556428 3325 9318 8040 14317 32897
1992/93 650320 627 650947 603062 38502 641564 584200 30054 614254 539346 57723 597069 497813 67873 565686 909 8123 7289 13263 25094
1993/94 691051 1213 692264 648825 29342 678167 604099 24325 628424 582640 41690 624330 542116 41126 583242 1473 4966 4772 8332 19922
1994/95 680871 1512 682383 689279 34787 724066 638414 40778 679192 582874 50073 632947 565925 60272 626197
Source & Note : Same as for table (3.1).
Table (3.4): Promotion, repetition, and dropout rates for girls in primary level grades, in Egypt between 1991/92 and 1994/95
School Grade 1 Grade 2 Grade 3 Grade 4 Grade 5
years Rates in % of: Rates in % of: Rates in % of: Rates in % of: Rates in % of:
Pro. Rep. Drp. Pro. Rep. Drp. Pro. Rep. Drp. Pro. Rep. Drp. Pro. Rep. Drp.
1991/92 99.35 0.10 0.55 92.43 6.09 1.48 93.40 5.21 1.39 87.36 10.13 2.51 81.89 12.20 5.91 1992/93 99.67 0.19 0.14 94.16 4.57 1.27 94.85 3.96 1.19 90.80 6.98 2.22 88.29 7.27 4.44 1993/94 99.57 0.22 0.21 94.14 5.13 0.73 92.75 6.49 0.76 90.65 8.02 1.33 86.25 10.33 3.42
Arithmetic Means
99.53 0.17 0.30 93.58 5.26 1.16 93.67 5.22 1.11 89.60 8.38 2.02 85.48 9.93 4.59
Source: Computed by applying the equations from (3.3) to (3.5) on data of table (3.3).

51
It is obvious, from table (3.3), that the majority of girls' dropout from the primary level
occurs in the final grade of the level. On transition from each of the school years, 1991/92,
1992/93 and 1993/94 to the next year of schooling, the percentages of girls who dropped
out from grade five to total who dropped the whole primary level were: 48.4%, 45.9% and
50.5% respectively.
If no one of the pupils, of both sexes, who dropped out the final grade of primary
level has had repeated any previous grade, then the wastage of pupil/years due to
dropout from grade five only, between 1991/92 and 1994/95, would be 989,335
pupil/years cost (599,770 pupil/years waste by boys and 389,565 by girls).
3.2.3. Efficiency and Wastage of the Primary Level’s System
To evaluate the wastage and efficiency of the system of a specific level of education, a
cohort analysis is necessary to figure out how a cohort of 1000 beginners will proceed in
the educational system (Abdel-Aty, 1977).
For the purpose of the cohort analysis of 1000 beginner students in a specific level of
education, it is necessary to apply a methodology that is thought to be the most convenient
to the official regulations of repetition in the level. Therefore, the "Students Flow Method"
will be applied for tracing a cohort of beginners, of each sex separately, in the primary
education. Accordingly; the following equations are used, as well as the average rates of
promotion, dropout and repetition, in the primary level as in period 1991/92-1994/95:
(A) For all grades of the level:
1. (Pgy++11) The number of pupils promoted to grade (g+1) at year (y+1) :
(Pgy++11) = (Eg
y) . (pgy++11) ......................................... (3.6)
where:
(Egy) = enrollments in grade (g) at school year (y), and
(pgy++11) = rate of promotion from grade (g) to grade (g+1) when passing from
school year (y) to year (y+1).
It is to be noted here that, for the final grade of the level, (Pgy++11) represent the graduates
of the level who will be enrolled as beginners in the next higher level.

52
2. (Rgy+ 1), number of pupils repeating grade (g) at year (y+1):
(Rgy+ 1) = (Eg
y) . (rgy+ 1) .......................................... (3.7)
where:
(rgy+ 1) = rate of repetition from grade (g) to grade (g) also, when passing from
school year (y) to the next year (y+1).
3. (Dgy), the number of pupils dropping out from grade (g) in year (y), due to reasons
rather than repetition regulations; such as death or unwillingness to proceed.
(Dgy) = (Eg
y) . (dgy) .......................................... (3.8)
Where:
(dgy) = rate of dropout from grade (g) at year (y), when passing to the next year (y+1).
(B) As for grade 5 only:
(D*gy+ 1) , the number of pupils dropping out from grade (g) at year (y+1) due to
repetition regulations, means those who have exhausted the times of repetitions allowed by
the grade.
(D*gy+ 1) = (Rg
y+ 1) . (rgy+ 1) ..................................... (3.9)
According to the ministerial decree No. 10, (1996), It is allowed for the pupils who have
vocational inclinations, among those dropping out compulsorily from grade 5 primary to
be enrolled at the first grade of the vocational preparatory education.
3.2.3.A. Case of boys:
The flow of a cohort of 1000 beginner boys in the primary educational level is
demonstrated by chart (3.1), and the figures of the cohort analysis are presented in table
(3.5). The above chart and table indicate that a cohort of 1000 beginner boys starting the
primary level, under the conditions prevailing between 1991/92 and 1994/95, will give up
590 graduates after the normal duration of the level (without any repetition), 243
graduates after six years (one grade repeated), 36 graduates after seven years (those who
repeat two grades), and 3 graduates after eight years of schooling (repeaters of three
different grades). That comes to a total of 872 graduates out of a cohort of 1000 beginner
boys.

53

54
Table (3.5): Cohort analysis of (1000) beginner boys in primary level:
(3.5.a): Enrollment by grades, and graduates at the successive school years.
School Grades Pupil/years
years 1 2 3 4 5 by school
years
Graduates
1 1000 1000 2 1 996 997 3 73 913 986 4 141 834 975 5 5 225 724 954 590 6 20 298 318 243 7 1 44 45 36 8 3 3 3
Pupil/years
by grades
1001 1069 1059 1080 1069 5,278
Total graduates of a cohort of 1000 beginners 872 Source: Chart (3.1).
(3.5.b): Dropouts by grades attained and school-years duration.
School- Grades attained Dropouts by school-years duration:
years
duration
1 2 3 4 5 due to rep.
reg.
due to other
causes
Total
1 3 3 3 2 11 11 11 3 1 10 11 11 4 2 19 21 21 5 5 41 46 46 6 1 12+17 12 18 30 7 4 + 2 4 2 6
Dropouts by grades attained:
due to rep.
reg.
16 16
other
causes
3 12 12 25 60 112
Total 3 12 12 25 76 128 Source: Chart (3.1).

55
The dropout leavers of primary level being 128 out of every 1000 beginner boys; of whom
3 drop at the first grade, 12 at each of the second and the third grades, and 25 dropouts at
grade four. As for final grade of the level, there would be 76 dropouts; of whom 16 separate
from school due to repeated failure in the grade. (See repetition regulations, section
(3.2.1)).
Also, when we look to the school-years duration, we notice the following:
- Three boys only dropped out after one year of schooling.
- Eleven boys dropped out after each of the second and third years of schooling.
- Twenty one boys dropped after four years, and 46 after five years of schooling.
- After the sixth year of schooling, the total number of dropouts was 30 boys, of whom
12 dropped due to repeated failure in grade five.
- Six boys dropped out after the seventh year of schooling, of whom 4 separated also
due to exhausting the times of repetitions allowed in the final grade of the primary
level.
Those 16 boys who failed twice in grade five primary have the chance to be enrolled in
grade one of the vocational preparatory education, if they have vocational inclinations.
Table (3.7) provides some measures of the efficiency of the educational system of the
primary level of education, and of the various forms of wastage involved. These measures
are derived from the cohort analysis of 1000 beginners, of each sex, in the level.
Defining efficiency of school system as the number of output graduates to the number of
input beginners, then efficiency of the primary level system for boy pupils, as shown in the
above table, equals 87.2%.
The total number of years studied by the cohort of boys is 5278 pupil/years. Since this
cohort gave up 872 graduates, the actual cost of a graduate being 6.05 years cost, instead of
5 years under the ideal situation of zero wastage. Thus, we can say that there is wastage of
1.05 years per boy graduating from the primary cycle. Consequently, the input/output
ratio, which supposed to equal the unity in case of zero wastage, amounted 1.21 for boys.
The above table also shows that, in case of no repetitions or dropouts, the 872 boys
graduating out of the cohort would require 4,360 pupil/years. The difference between this
figure and the actual cost of the whole cohort (5,278 pupil/years) gives a total 918
pupil/years waste; of which 324 wastage due to repetition, and 594 pupil/years waste due
to dropouts. Decomposing the later figure into its two main components resulted in 494
pupil/years wastage of dropout due to causes rather than repetition regulations; such as
unwillingness to continue in education or death, and 100 pupil/years wastage of dropouts
due to repeated failure in the final grade of the primary level. If all of the 16 boys who
dropped out from grade five due to repeated failure in the grade will be enrolled in the

56
vocational preparatory education, as it is permitted by law, then, the above figure (100
pupil/years) must not considered wastage altogether, as the majority of these years are the
main requirements that qualify those pupils to pursue their education in the vocational
schools.
3.2.3.B. Case of girls:
Chart (3.2) illustrates the flow of a cohort of 1000 beginner girls in the primary level of
education, and the figures of the cohort analysis are given in table (3.6). A comparison
between the figures shown in the above table and the corresponding figures in table (3.5)
reveals that the educational performance of girls in the primary level of education is much
better than that of their boy colleagues. This can be, simply, deduced from the following:
- The total number of graduates out of a cohort of 1000 girls exceeds the
corresponding number of boys by 20 graduates, consequently, the total dropouts of
girls is less than that of boys by the same number.
- The number of girls graduating without any repetition exceeds the corresponding
number of boys by 78 graduates.
- The number of girls graduating after eight years of schooling is lesser than the
corresponding number of boys by 2 graduates.
- Ten girls only dropped out due to repeated failure in the final grade of primary level;
in front of 16 boys. Therefore, the wastage of dropouts of boys due to repetition
regulations exceeds that of girls by 38 pupil/years, as shown in table (3.7).
A comparison between the indices of the efficiency and wastage of the educational system
in primary level for boys and girls, which are presented in table (3.7), reveals the following:
- The efficiency measure of the cycle's system as to girls exceeds that for boys by 2%.
- The actual cost of a girl graduating from the primary level is less than that of a boy
by nearly a quarter of a year-cost.
- The input/output ratio for girls lessens than that for boys by (0.05); indicating
higher wastage for boy pupils in the primary level.
- The total number of pupil/years consumed by a cohort of 1000 boys exceeds the
corresponding number of years studied by a similar cohort of girls by 94
pupil/years.
- The total waste of pupil/years, resulting from the repetitions and dropouts of the
cohort of girls, which amounted 724, is less than the corresponding figure of boys by
194 pupil/years.

57

58
Table (3.6): Cohort analysis of (1000) beginner girls in primary level:
(3.6.a): Enrollment by grades, and graduates at the successive school years.
School Grades Pupil/years
years 1 2 3 4 5 by school
years
Graduates
1 1000 1000 2 2 995 997 3 54 931 985 4 102 872 974 5 3 170 782 955 668 6 11 236 247 202 7 25 25 21 8 1 1 1
Pupil/years
by grades
1002 1049 1036 1053 1044 5184
Total graduates of a cohort of 1000 beginners 892 Source: Chart (3.2). (3.6.b): Dropouts by grades attained and school-years duration.
School- Grades attained Dropouts by school-years duration:
years
duration
1 2 3 4 5 due to rep.
reg.
due to other
causes
Total
1 3 3 3 2 12 12 12 3 1 10 11 11 4 2 17 19 19 5 4 36 40 40 6 2 8 +10 8 12 20 7 2 + 1 2 1 3
Dropouts by grades attained:
due to rep.
reg.
10 10
other
causes
3 13 12 23 47 98
Total 3 13 12 23 57 108 Source: Chart (3.2).

59
- The percent of the contribution of dropout due to all causes in the total waste of
pupil/years, in case of girls (65.88%) is higher than that of boys by 1.18%, although
it is obvious that the percent share of dropouts due to repeated failure only in the
above wastage, as to boys is higher than that of girls by 2.33%. This gives an
impression that girls, once stayed in school, tend more to excel in learning. This
excellence of girls is obvious from their lesser times of repetitions in the different
grades of the level, compared to their boy colleagues.
Table (3.7): Measures of the educational efficiency and wastage, derived from the cohort analysis of (1000) beginner pupils of each sex, in primary level.
Measures Boys Girls
1 Efficiency of the level's system (%) 87.2 89.2
2 Actual years-cost per graduate 6.05 5.81 3 Input/output ratio 1.21 1.16
4 Total pupil/years studied by the cohort 5278 5184 5 Minimum pupil/years required for the
graduates of the cohort
4360
4460
6 Total pupil/years wastage: - Number 918 724
- % of (4) 17.39 13.97
7 Pupil/years wastage of dropout: - Due to repetition regulations: .Number 100 62
.% of (6) 10.89 8.56
- Due to other causes:
.Number 494 415
.% of (6) 53.81 57.32
- Total:
.Number 594 477
.% of (6) 64.70 65.88
8 Wastage of pupil/years due to
repetition:
.Number 324 247
.% of (6) 35.30 34.12 Sources: (1) Tables (3.5) and (3.6). (2) Group (B) of concepts, section (3.1.2).

60
3.3. Dynamics, Wastage, and Efficiency of the General Preparatory Education
The present section is devoted to examining flow of the pupils in the general preparatory
education, and for evaluating efficiency and wastage of the educational system of this cycle
as well. It is worthy mentioning that the forthcoming analysis is restricted on the general
preparatory education, among the other types of the preparatory education, for the
following reasons:
Firstly: It is noticed that the majority of the pupils of the second cycle of the compulsory
education are enrolled in the general preparatory schools. For instance, in the 1994/95
school year, the total enrollment in the preparatory level was 3,409,127 pupils; of whom
3,306,609 pupils were enrolled in the general preparatory schools, 100,050 in the
vocational preparatory schools and 2,468 pupils were enrolled in the sports preparatory
schools. That is 96.993% of the total enrollment in the second cycle of the basic education,
in the 1994/95 year of schooling were enrolled in general preparatory schools, while the
corresponding percentages for the vocational preparatory and the sports preparatory
schools, were 2.935% and 0.072% respectively.
Secondly: The system of promotion to the different grades in the vocational preparatory
schools and the sports preparatory schools is different from that in the general preparatory
schools, and so are the repetition regulations.
The third reason: is that a proportion of the pupils enrolled in the first and second
grades of the vocational preparatory schools come from the general preparatory level after
exhausting the times of repetitions allowed in a specific grade of this level. So, tracing the
pupils' flow and performances in the preparatory education as a whole requires a precise
and accurate set of data on the history of the pupils changing their educational path from
general to vocational preparatory schools. Unfortunately, such data are not available.
3.3.1. Repetition Regulation in General Preparatory Education
1. Pupils of grades 1 and 2:
a. Pupils who fail to pass the exams of the second session are allowed to repeat the
grade.
b. Pupils who fail to pass the grade after the repetition will be enrolled at the
corresponding grade of the vocational preparatory education; If they have
vocational inclinations.
2. Pupils of grade 3:
They are allowed, also, to repeat the grade once, but those who fail again after the
repetition are permitted to be enrolled in grade 2 of the vocational preparatory education.

61
3.3.2. Pupils' Flow in General Preparatory Level
3.3.2.a. Flow of boys
Data on enrollment of boys in general preparatory education from 1991/92 to 1994/95,
classified by promoted and repeaters, as well as the numbers dropping out on transition
from a specific year of schooling to the next year, within the above period, are presented in
table (3.8). Rate of promotion, repetition and dropout for boys as in period 1991/92-
1994/95 are given in table (3.9). This table indicates a declining trend in dropout rate from
both grades one and two, and in the repetition rate for grade three; between 1991/92 and
1994/95. It also shows a very high dropout rate for boys enrolled in grade three when
passing from 1992/93 to the next year of schooling, if compared to the corresponding rates
in both the school year after and before the above mentioned year; where it is noticed that
the rate in 1992/93 exceeds 4.5 times and 3.5 times the corresponding rates in 1991/92 and
1993/94 respectively.
As for the pattern of flow rates across grades, it is noticed that the promotion rate in the
middle grade of the level is higher than that in both the initial and final grades. Also, the
average rate of dropout from grade one is higher than the dropout rates from both grades
two and three.
The absolute figures in table (3.8) indicate the following:
- Out of 1,919,477 boys were enrolled at general preparatory in 1991/92, a total of
92,639 dropped out the level when passing to the next year of schooling,
representing 4.83% of total enrollees of boys. Over 53% of those dropouts were from
the initial grade.
- The total enrollment of boys in the 1992/93 school year was 1,780,803, of whom
126,404 dropped out during transition to 1993/94 year of schooling; that is a
percentage of 7.10% of the enrolled boys were dropped out the whole level. The bulk
of those dropouts (58,578) were from the final grade, where they represented
46.34% of total dropouts of the level, while the dropouts from the initial grade were
43,591 boys, constituting 34.5% of the total of boys dropped out the whole level.
- As for the 1993/94 school year, there were 1,770,944 boys enrolled in general
preparatory, of whom 70,452 dropped out on transition to the next year 1994/95;
that is a percentage of 3.98% of boys dropped out the level. More than 56% of the
above-mentioned dropout occurred in the initial grade of the level.
3.3.2.b. Flow of girls
Promotion, repetition, and dropout rates for girls in general preparatory level grades, as
well as the averages of those rates in period 1991/92-1994/95 are given in table (3.11).
These rates are computed using data on the classification of enrollment of girls which are
shown in table (3.10). The earlier table indicates a declining trend in dropout rate from
both the initial and the middle grades, and in repetition rate in the final grade. It also
shows an increasing trend in promotion rate in grade two through years.

62
Table (3.8): Enrollment of boys in general preparatory level classified by grade, Promoted, and repeaters, Egypt, 1991/92 - 1994/95
School Grade 1 Grade 2 Grade 3
years Beginners Repeaters Dropouts Enrollments Promoted Repeaters Dropouts Enrollments Promoted Repeaters Dropouts Enrollments
1991/92 515417 101906 617323 489340 72531 561871 677919 62364 740283 49166 28001 15472
1992/93 527409 95175 622584 472982 62994 535976 470876 151367 622243 43591 24235 58578
1993/94 583208 81058 664266 497935 43655 541590 468086 97002 565088 39932 15496 15024
1994/95 566956 113954 680910 510380 53140 563520 472954 80237 553191
Source & Note: Same as for table (3.1).
Table (3.9): Promotion, repetition, and dropout rates for boys at general preparatory level grades, in Egypt between 1991/92 and 1994/95
Grade 1 Grade 2 Grade 3 School Rates in % of: Rates in % of: Rates in % of: years Promotion Repetition Dropout Promotion Repetition Dropout Promotion* Repetition Dropout
1991/92 76.62 15.42 7.96 83.81 11.21 4.98 77.46 20.45 2.09
1992/93 79.98 13.02 7.00 87.33 8.14 4.53 75.00 15.59 9.41
1993/94 76.83 17.15 6.02 87.33 9.81 2.86 83.14 14.20 2.66
Arithmetic Means
77.81 15.20 6.99 86.16 9.72 4.12 78.53 16.75 4.72
Source: Computed by applying the equations from (3.3) to (3.5) on data of table (3.8). * Final exam graduates.

63
Table (3.10): Enrollment of girls in general preparatory level classified by grade, Promoted, and repeaters, Egypt, 1991/92 - 1994/95
School Grade 1 Grade 2 Grade 3 years Beginners Repeaters Dropouts Enrollments Promoted Repeaters Dropouts Enrollments Promoted Repeaters Dropouts Enrollments
1991/92 434267 77056 511323 406599 53626 460225 580250 37238 617488 36458 20015 16323
1992/93 444251 72028 516279 402837 44128 446965 396082 95117 491199 31721 16488 40504
1993/94 489989 59169 549158 425389 29983 455372 400494 56705 457199 25458 10368 8858
1994/95 493239 81463 574702 442237 35995 478232 409009 47045 456054
Source & Note: Same as for table (3.1).
Table (3.11): Promotion, repetition, and dropout rates for girls at general preparatory level grades, in Egypt between 1991/92 and 1994/95
Grade 1 Grade 2 Grade 3 School Rates in % of: Rates in % of: Rates in % of: years Promotion Repetition Dropout Promotion Repetition Dropout Promotion* Repetition Dropout
1991/92 78.78 14.09 7.13 86.06 9.59 4.35 81.95 15.40 2.65
1992/93 82.40 11.46 6.14 89.60 6.71 3.69 80.21 11.54 8.25
1993/94 80.57 13.46 5.97 88.49 8.07 3.44 83.31 12.41 4.28
Arithmetic Means 80.57 13.46 5.97 88.49 8.07 3.44 83.31 12.41 4.28
Source: Computed by applying the equations from (3.3) to (3.5) on data of table (3.11). * Final exam graduates.

64
As for the pattern of girls' flow rates across grades, it is obvious that the middle grade of
the level has the highest rate of promotion and the lowest dropout and repetition rates.
A comparison between girls' flow rates in table (3.12) and the corresponding rates for boys
given in table (3.9) reveals the following:
- Promotion rates for girls, in all grades of the level and during all the school years
under study, are higher than those for boys.
- Boys' rates of repetition in all grades during the whole period examined are higher
than the corresponding rates for girls.
- Dropout rates for boys enrolled at both grades one and two are higher than those for
girls along the years of schooling under study. As for grade three, it is noticed that
girls' dropout rate from this grade in the first school year under study is higher than
the corresponding rate for boys, while in the remaining years of schooling the
reverse is true. Thus, the average rate of dropout for boys enrolled at the final grade
is also higher than the corresponding average rate for girls.
The figures in table (3.11) show the following:
- Out of 1,589,036 girls enrolled in general preparatory schools in 1991/92, there
were 72,796 dropped out on transition to the next year of schooling, which comes up
to be 4.58% A little more than 50% of those dropouts were from the initial grade of
the level only.
- In the year 1992/93, the total enrollment of girls in general preparatory level
decreases to be 1,454,443; of which 88,713 were dropped out when passing to the
next year 1993/94. That is a percentage of 6.10% of the enrollees of girls were
dropped out the whole level. The dropping out of girls in this year was markedly
higher from the final grade, where about 45.7% of the above dropouts were from
this grade only.
- The situation, regarding wastage due to dropout of girls seems to be better in
1993/94 school year, than in the two years before. In the above year of schooling
there were 1,461,729 girls enrolled in general preparatory, of whom 44,684 dropped
out the level on transition to the next school year, 1994/95. That is a percentage of
3.06% dropped of the general preparatory level enrollment of girls. The bulk of
those dropout (56.97%) dropped the first grade of the level.
3.3.3. Efficiency and Wastage of the General Preparatory Level’s System
For the purpose of the cohort analysis of 1000 beginner pupils, of each sex, in general
preparatory education, the "demonstrative method" will be applied as it is found to be the
most convenient to the official regulations of repetition in this level. Rates of promotion,
repetition and dropout in general preparatory education, as in period 1991/92-1994/95 are

65
used as input data for the above method. The computational procedures which were
followed in section 3.2 for tracing a cohort of 1000 new entrants to primary level will be
followed here also, meaning that the equations from (3.6) to (3.9) will be used for the
above purpose concerning the general preparatory level also. The only exception is that
equation (3.9) will be used for evaluating the numbers of pupils who dropout due to
repeated failure in each of the three grades of general preparatory level.
3.3.3.A. Case of boys:
Flow of boys through general preparatory level is illustrated by the flow chart (3.3) and the
figures of the cohort analysis are presented in table (3.12). The above mentioned chart and
table show that, out of every 1000 boys newly entering the first grade preparatory, under
the conditions prevailing in period 1991/92-1994/95, there will be 777 graduates
completing the level; while 223 boys dropout of school, of whom 55 drop due to repetition
regulations in the level. Meanwhile, the graduates who complete the level without any
repetitions are 526 boys, while 220 repeat once, 29 repeat two grades and 2 boys graduate
after repeating three different grades. About 47% of the dropout of boys from general
preparatory occurred in grade one. This shows a reasonable consistency with the
percentages of boys dropping out the initial grade of the level, previously evaluated in
article (3.2.2.a).
The same chart and table show that 70 boys dropped out the final grade of the level, of
whom 24 dropped due to repeated failure. The latter figure, in addition to other 8 boys
dropped out the middle grade for the same reason are allowed, by law, to be enrolled in
grade two of vocational preparatory schools if they are found to have vocational
inclinations (See 3.3.1).
In this respect, the analysis reveals also that among the 104 boys who dropped out grade
one there were 23 dropped due to repeated failure in this grade. Those also have the
chance to change their educational path and be enrolled in grade one of vocational
preparatory.
When we look to the school-years duration, we notice that, 70 boys dropped after one year
of schooling, 66 after two year, 47 after three year (among them 7 dropped due to
repetition regulations), 34 after four years (out of them 20 dropped due to repeated
failure), and 6 boys dropped out after five years of whom 83.3% dropped due to repetition
regulations.
Table (3.14) contains various measures of the educational efficiency and wastage in general
preparatory level, derived from the cohort analysis of 1000 pupils of each sex separately.
From this table, the efficiency of the educational system in general preparatory level, as
for boys, is estimated to be 77.7%. The number of years spent per graduate of

66

67
Table (3.12): Cohort analysis of (1000) beginner boys in
general preparatory level:
(3.12.a): Enrollment by grades, and graduates at the successive school years.
School Grades Pupil/years
years 1 2 3 by school
years Graduates
1 1000 1000
2 152 778 930
3 194 670 864 526
4 11 280 291 220
5 37 37 29
6 2 2 2 Pupil/years
by grades
1152 983 989 3124
Total graduates of a cohort of 1000 beginners 777
Source: Chart (3.3).
(3.12.b): Dropouts by grades attained and school-years duration.
School- Grades attained Dropouts by school-years duration:
years duration 1 2 3 due to rep.
reg.
due to other
causes
Total
1 70 70 70 2 23 + 11 32 23 43 66 3 7 + 8 32 7 40 47 4 1 + 1 19 + 13 20 14 34 5 5 + 1 5 1 6
Dropouts by grades attained: due to rep. reg. 23 8 24 55 other causes 81 41 46 168 Total 104 49 70 223
Source: Chart (3.3).

68
boys is 4.02 instead of 3 under the ideal situation of zero wastage. This, in turn, led to an
input/output ratio of 1.34. The table also shows a total of 3,124 pupil/years invested in the
cohort of 1000 boys in the level. The number of boys graduating out of this cohort
officially requires 2,331 pupils/years in case of no repetitions. Thus, the total number of
excess pupil/years amounted 793, representing about 25.4% of the total investment of
pupil/years in the cohort. About 35.8% of the above mentioned excess of pupil/years is
attributable to repeaters among graduates, and the remaining percentage is attributable to
dropouts due to all causes, including death. Also, it is noticed that, about 33.8% of the total
pupil/years waste of dropout is used up by boys who dropout due to repetition regulations,
and 66.2% of the above wastage is used up by those dropping out due to unwillingness to
continue in education, or death.
3.3.3.B. Case of girls:
The illustrative chart (3.4) shows the flow of a hypothetical cohort of 1000 beginner girls
in general preparatory education, while the figures of the analysis are presented in table
(3.13). Both chart and table indicate a much better situation for girls compared to boys, in
general preparatory. The number of girls graduating from general preparatory level, out of
every 1000 beginners exceeds the corresponding number of boys by 41. Consequently, the
number of boys dropping out the level exceeds the corresponding number of girls by the
same figure. About 72.7% of the graduates of girls do not repeat any grade in the level,
while the corresponding percentage of boys is 67.7%. The number of boys who graduate
from the level after 6 years of schooling (repeaters of 3 different grades) doubles the
corresponding number of girls. The percent dropping out due to repetition regulations
among the dropouts of girls is about 20%, in front of a percentage of 25% in case of boys.
The number of boys dropped out after 5 years of schooling is double the corresponding
number of girls.
Table (3.14) shows 4.1% increase in the efficiency measure of general preparatory level's
system as for girls than for boys. The actual cost per graduate of girls, in terms of
pupil/years, is less than that per graduate of boys by 0.23 of a year. The input/output ratio
for girls is closer to the unity than for boys; indicating higher wastage in case of boys.
The cohort of 1000 girls consumed a number of pupil/years lessens by 20 years than the
number invested in a similar cohort of boys. The above table also shows that, the waste of
pupil/years caused by the cohort of boys is more than that in case of girls by 143 years.
Percent excess of pupil/years attributable to repetitions of graduates of girls constitute
38.31% of the total waste of pupil/years, exceeding the corresponding percentage for boys
by 2.5%. This is not attributed to higher rates of repetition for girls, rather, it is due to the
higher number of girls graduating out of the cohort, compared to boys.

69

70
Table (3.13): Cohort analysis of (1000) beginner girls in general preparatory level:
(3.13.a): Enrollment by grades, and graduates at the successive school years.
School Grades Pupil/years
years 1 2 3 by school
years
Graduates
1 1000 1000
2 134 806 940
3 173 713 886 594
4 9 241 250 200
5 27 27 23
6 1 1 1 Pupil/years
by grades
1134 988 982 3104
Total graduates of a cohort of 1000 beginners 818
Source: Chart (3.4).
(3.13.b): Dropouts by grades attained and school-years duration.
School- Grades attained Dropouts by school-years duration:
years duration 1 2 3 due to rep.
reg.
due to other
causes
Total
1 60 60 60 2 18 + 8 8 18 36 54 3 5 + 6 31 5 37 42 4 1 11 + 11 12 11 23 5 2 + 1 2 1 3
Dropouts by grades attained: due to rep. reg. 18 6 13 37 other causes 68 34 43 145 Total 86 40 56 182
Source: Chart (3.4).

71
Table (3.14): Measures of the educational efficiency and wastage, derived from the cohort analysis of (1000) beginner pupils of each sex,
in general preparatory level.
Measures Boy
pupils
Girl
pupils
1 Efficiency of the level's system (%) 77.7 81.8
2 Actual years-cost per graduate 4.02 3.79
3 Input/output ratio 1.34 1.26
4 Total pupil/years studied by the cohort 3124 3104 5 Minimum pupil/years required for the
graduates of the cohort
2331
2454
6 Total pupil/years wastage:
- Number 793 650
- % of (4) 25.38 20.94
7 Pupil/years wastage of dropout: - Due to repetition regulations: .Number 172 109
.% of (6) 21.69 16.77
- Due to other causes: .Number 337 292 .% of (6) 42.50 44.92 - Total:
.Number 509 401
.% of (6) 64.19 61.69
8 Wastage of pupil/years due to
repetition:
.Number 284 249
.% of (6) 35.81 38.31
Sources: (1) Tables (3.12) & (3.13). (2) Group (B) of concepts, section (3.1.2).

72
3.4. Dynamics, Wastage, and Efficiency of the General Secondary Education
The present section provides an analysis for the flow of the students in general secondary
level, as well as for some areas relating to the qualitative dimensions of the school system.
It is to be noted that, the discussion on this section is based on educational data for the
school years from 1991/92 to 1994/95, which refers to the school system before the
amendment of some articles of the education law no. 193, (1981) in relation to the general
secondary certificate (G.S.C).
3.4.1. Present and Former Plan of the General Secondary Certificate:
Recently, the education law no. 193, (1981) was revised, by the National Centre for
Educational Research, in the light of comparative studies of the system of secondary stage
certificate in some advanced countries. In the light of these studies and their results, the
Supreme Council of Pre-university Education accepted - in principle - the necessity of
amending some articles of the law of education in order that the exams of the G.S.C. would
be held in more than one stage. There would be compulsory and optional subjects, and
chances of the exam would be limitless. Therefore, the above education law was amended
by the law no. 2, issued (20-1-1994).
At the first article of the new law, it was stated: the texts of article 29 of the education law
issued by the law no. 193, (1981) is substituted by the following text:
"The student is allowed to sit for re-examination in the subjects he failed, or if he wants to
improve the grades he obtained before, on condition that he pays the fees of the exam,
specified by a decree of the minister of education". This decree also determines the times a
student is allowed to sit for exams.
The second article of law no. 2, (1994) stated: "The provisions of law are valid for the
enrolled students in the first year of the general secondary teaching, starting from the
school year 1993/94. The present rules of G.S.C remain valid till the end of the school year
1994/95. The minister of education has the right to give the student who has exhausted all
times of enrollment for the exam of G.S.C, one or more chances, provided that he would
pay a fee for every chance he gets".
Thereon, the ministerial decree no. 144 was issued (15-6-1994) regarding the regulations of
the G.S.C as of the academic year 1994/95. Article one of this decree stated: "The exams for
obtaining the G.S.C will be set at two stages: the first at the end of the second year, and
the second at the end of third year. At the end of each stage the student will be allowed to
sit for the exams on the set subjects in one or two of the sessions held in May and August
of the same year".

73
"Students who fail in all or some of the subjects of the first stage, or who did not sit for the
first and second sessions of the first stage, or who did not sit for the first session of the
second stage (held in May) or who wish to improve their scores will be allowed to sit for
the second session of the second stage (held in August of the same year)".
"Students who fail in the second session exams of the second stage will sit in the following
academic year for the subjects in which they failed, and also for the subjects of the first
stage, whether they passed or not, as with those who did not attend both examinations of
the second stage".
"Students who fail in one or more subjects, or who did not attend the exams of the second
session of the second stage, besides failing to get 50% of the total score will be examined
in the following academic year in those subjects in which they failed or did not attend in
both exams of the second stage, in addition to subjects in which they were examined in the
first stage, whether they passed or failed them". Article five of the same decree stated that:
"This decree is to be operative as from the academic year 1994/95".
It is worthy to remind here that, we use in this study data on enrollment for the school
years from 1991/92 to 1994/95 to compute rates of promotion, repetition, and dropout as
between these two school years. Thus, the numbers of promoted students, repeaters and
dropouts, as well as rates of promotion, dropout and repetition in the three grades of
general secondary education, which will be examined below are reflections for the rules of
the former law of education, no. 193, (1981); That was permitting two repetitions through
the general secondary level; one by grade.
3.4.2. Students' Flow in General Secondary Level
3.4.2.a. Flow of male students
Classifications of enrollment of male students in general secondary education from
1991/92-1994/95 are presented in table (3.15), from which the rates of flow between each
two successive school years are evaluated and presented in table (3.16). This table indicates
a declining trend in repetition rate in both the second and third grades and an increasing
trend through years in dropout rate from grade three. The patterns of the flow rates across
grades are indicated by the arithmetic means in the bottom line of the above table. From
this line, it is noticed that, promotion rate increases from 95.2% in the initial grade to
reach 96.68% in the middle grade then it decreases sharply in the final grade of the level to
reach 71.8%. Repetition rate in grade three (20.51%) is very high if compared to the similar
rates in both grades one and two (2.27% and 2.39% respectively).
The pattern of dropout of male students from general secondary level begins by a rate of
2.08% in grade one, then declines to less than one percent in the middle grade; while in
grade three the average rate dropout amounts 7.69%.

74
Table (3.15): Enrollment of male students in general secondary level classified by grade, promoted, and repeaters, Egypt, 1991/92 - 1994/95
School Grade 1 Grade 2 Grade 3 Year Beginners Repeaters Dropouts Enrollments Promoted Repeaters Dropouts Enrollments Promoted Repeaters Dropouts Enrollments
1991/92 92806 3469 96275 95646 3645 99291 92559 30842 123401 1877 197 552
1992/93 176559 2615 179177 91783 3267 95580 95827 28244 124071 4236 2004 13129
1993/94 122877 3668 126545 171273 1875 173148 91701 25223 116924 2439 870 14092
1994/95 136411 4309 140720 119797 3314 123111 168964 21409 190373
Source & Note: Same as for table (3.1).
Table (3.16): Promotion, repetition, and dropout rates for male students at general secondary level grades, in Egypt between 1991/92 and 1994/95
School Grade 1 Grade 2 Grade 3 year Rates in % of: Rates in % of: Rates in % of: Promotion Repetition Dropout Promotion Repetition Dropout Promotion* Repetition Dropout
1991/92 95.33 2.72 1.95 96.51 3.29 0.20 76.66 22.89 0.45 1992/93 95.59 2.05 2.36 95.94 1.96 2.10 69.09 20.33 10.58 1993/94 94.67 3.40 1.93 97.58 1.92 0.50 69.64 18.31 12.05 Arithmetic
Means 95.20 2.72 2.08 96.68 2.39 0.93 71.80 20.51 7.69
Source: Computed by applying the equations from (3.3) to (3.5) on data of table (3.15). * Final exam graduates.

75
The absolute figures in table (3.15) reveal that, the largest number of male students
dropped out the general secondary level was during transition from the 1992/93 school
year to the next year 1993/94, where this number amounted 19,369 dropouts, representing
4.9% of the total enrollees of males in the whole level (398,828). More than two-thirds of
those dropouts (13,129) dropped the final grade of the level. The total enrollment of males
in general secondary, in the 1993/94 year of schooling was 416,617, of whom 17,401
dropped out the level when passing to the next year, 1994/95. That is, a percentage of 4.2%
dropped out the whole level. The bulk of those dropouts were from the final grade (81.0%).
3.4.2.b. Flow of female students
The picture of females' flow in general secondary seems to be much better than of males
(see table (3.18)). In general, females' rates of promotion are higher than males' rates, and
their repetition rates are lower than those for males, in all the grades of the level. The only
exception is that females' dropout rate from grade three is higher than that for males. For
the grades two and three, females dropped out by rates lower than those of males, and also
less than one percent.
A look to the figures in table (3.17) reveals that, in the 1991/92, there were 253,059 female
students enrolled in general secondary schools, of whom 5,601 dropped out the level,
representing 2.2% of the total enrollment of females. About 77.5% of those dropouts were
from the final grade only. Also, on transition from the 1992/93 year of schooling to the
next year, there were 13,819 females dropped out from general secondary schools, out of
total female enrollees amounting 328,862. That comes up to be 4.2% dropped out the level,
of which 85.8% dropped in grade three only. The number of female students evaluated as
dropouts when passing from the 1993/94 school year to 1994/95, was 9,491, out of total of
350,327 females were enrolled in 1993/94. That is, 2.7% of the enrollment of females
dropped out the general secondary level. The percent dropped the final grade only of the
total dropouts of females was 87.2%.
3.4.3. Efficiency and Wastage of the General Secondary Level’s System
Within the following few pages, an analysis of efficiency and wastage of the general
secondary education will be made, by putting a hypothetical cohort of students, of each
gender, through the relevant rates of promotion, repetition and dropout, as in period
1991/92-1994/95.
Once again, we remind that, students who were enrolled in grades two and three of general
secondary education during the above-mentioned period were subjected to rules of the
former system of general secondary certificate (G.S.C). According to that system, two
repetitions were allowed through the general secondary level; one by grade.

76
Table (3.17): Enrollment of female students in general secondary level classified by grade, Promoted, and repeaters, Egypt, 1991/92 - 1994/95
School Grade 1 Grade 2 Grade 3 years Beginners Repeaters Dropouts Enrollments Promoted Repeaters Dropouts Enrollments Promoted Repeaters Dropouts Enrollments
1991/92 76717 1281 77998 79062 1382 80444 76121 18496 94617 974 288 4339
1992/93 152664 837 153510 76187 1089 77276 79067 19009 98076 1046 922 11851
1993/94 104183 1412 105595 151052 705 151757 75649 17326 92975 589 622 8280
1994/95 120798 1762 122560 103244 1123 104367 150012 13215 163227
Source & Note: Same as for table (3.1).
Table (3.18): Promotion, repetition, and dropout rates for female students at general secondary level grades, in Egypt between 1991/92 and 1994/95
School Grade 1 Grade 2 Grade 3 years Rates in % of: Rates in % of: Rates in % of:
Promotion Repetition Dropout Promotion Repetition Dropout Promotion* Repetition Dropout
1991/92 97.68 1.07 1.25 98.29 1.35 0.36 75.32 20.09 4.59
1992/93 98.40 0.92 0.68 97.90 0.91 1.19 70.25 17.67 12.08
1993/94 97.77 1.67 0.56 98.85 0.74 0.41 76.88 14.21 8.91
Arithmetic Means 97.95 1.22 0.83 98.35 1.00 0.65 74.15 17.32 8.53
Source: Computed by applying the equations from (3.3) to (3.5) on data of table (3.17). * Final exam graduates.

77
Therefore, the most convenient methodology to be applied, for the purpose of a cohort
analysis of 1000 beginners in general secondary level in the "Mathematical Treatment
Method", which was developed by Abdel-Aty in 1977. By this methodology, a set of
formulas are offered for evaluating wastage and efficiency of an educational system, when
regulations permit the pupil to repeat the cycle through twice; one by grade. This
methodology will be detailed latter in section (4.1).
3.4.3.A. Case of male students:
Table (3.21) presents various indices of the educational wastage and efficiency of the
general secondary level of education, derived from the cohort analysis of (1000) beginners
of each sex in the level. Efficiency of the level's performance, in the light of the former plan
of (G.S.C), amounted 83.7% for males. The above table also shows that 3,194 pupil/years
were invested in the cohort of males, which gave up 837 graduates. Thus, the actual cost
per graduate amounted 3.82 years cost instead of 3 under the ideal situation of zero
wastage.
Ratio of input to output, which supposed to equal the unity in case of no wastage,
amounted 1.27 as for male students in general secondary. It is noticed also that, the total
waste of pupil/year was 683, representing 21.38% of the years studied by the cohort. The
bulk of this waste (500 pupil/years) is attributable to dropout; were it represented 73.21%
of the total waste, and excesses 2.7 times the waste of pupil/years due to repetitions of the
graduates.
As for the causes of dropout of males, the above table also showed that 34.2% of the excess
of pupil/years due to dropout is attributable to repeated failure in the level and the
remaining percentage (65.8%) is attributable to unwillingness to continue in education and
death.
3.4.3.B. Case of female students:
Figures of the cohort analysis of 1000 beginner female students in general secondary level
are given in table (3.20), this table, if being compared with table (3.19) shows that the
situation of female students in general secondary is, also, better than their male colleagues.
The number of females graduated out of the cohort is 857, about 83.3% of them have not
repeated any grade in the cycle. The latter percentage for males amounted 79.0%. Number
of female graduated after repeating two grade is less than the corresponding number of
males. It is noticed also that no one of the female students have dropped out due to
repeated failure in both grades one and two. Dropout due to repetition regulation
represented 20.3% of the total dropouts of females, which is less than the corresponding
percentage for males by 6.1%.

78
Table (3.19): Cohort analysis of (1000) beginner male students in general secondary level:
(3.19.a): Enrollment by grades, and graduates at the successive school years.
School Grades Pupil/years
years 1 2 3 by school
years
Graduates
1 1000 1000
2 27 952 979
3 49 920 969 661
4 236 236 169
5 10 10 7 Pupil/years
by grades
1027 1001 1166 3194
Total graduates of a cohort of 1000 beginners 837 Sources: (1) Arithmetic means of the flow rates, table (3.16). (2) ) Formulae (4.1) & (4.3).
(3.19.b): Dropouts by grades attained and school-years duration.
School- Grades attained Dropouts by school-years duration:
years duration 1 2 3 due to rep.
reg.
due to other
causes
Total
1 21 21 21 2 1 9 1 9 10 3 1 71 1 71 72 4 39 +18 39 18 57 5 2 +1 2 1 3
Dropouts by grades attained: due to rep. reg. 1 1 41 43 other causes 21 9 90 120 Total 22 10 131 163
Sources: (1) Arithmetic means of the flow rates, table (3.16). (2) ) Equations (4.4) & (4.5).

79
Table (3.20): Cohort analysis of (1000) beginner female students in general secondary level:
(3.20.a): Enrollment by grades, and graduates at the successive school years.
School Grades Pupil/years
years 1 2 3 by school
years
Graduates
1 1000 1000
2 12 980 992
3 22 963 985 714
4 188 188 140
5 3 3 3 Pupil/years
by grades
1012 1002 1154 3168
Total graduates of a cohort of 1000 beginners 857 Sources: (1) Arithmetic means of the flow rates, table (3.18). (2) Formulae (4.1) & (4.3).
(3.20.b): Dropouts by grades attained and school-years duration.
School- Grades attained Dropouts by school-years duration:
years duration 1 2 3 due to rep.
reg.
due to other
causes
Total
1 8 8 8 2 7 7 7 3 83 83 83 4 29 + 16 29 16 45 5
Dropouts by grades attained: due to rep. reg. 29 29 other causes 8 7 99 114 Total 8 7 128 143
Sources: (1) Arithmetic means of the flow rates, table (3.18). (2) Equations (4.4) & (4.5).

80
Table (3.21): Measures of the educational efficiency and wastage, derived from the cohort analysis of (1000) beginner students of each sex, in general
secondary level.
Measures Male students
Female students
1 Efficiency of the level's system (%) 83.7 85.7 2 Actual years-cost per graduate 3.82 3.70 3 Input/output ratio 1.27 1.23 4 Total pupil/years studied by the cohort 3194 3168 5 Minimum pupil/years required for the
graduates of the cohort
2511
2571 6 Total (pupil/years) wastage: - Number 683 597 - % of (4) 21.83 18.84
7 Pupil/years wastage of dropout: - Due to repetition regulations: .Number 171 116 .% of (6) 25.04 19.43
- Due to other causes:
.Number 329 335
.% of (6) 48.17 56.11
- Total: .Number 500 451 .% of (6) 73.21 75.54
8 Wastage of pupil/years due to repetition:
.Number 183 146 .% of (6) 26.79 24.46
Sources: (1) Tables (3.19) & (3.20). (2) Group (B) of concepts, section (3.1.2). (3) Equation (4.2).
A comparison between males and females as respects the indices of efficiency and wastage
of general secondary level reveals the following:
- Efficiency measure as for females exceeded that for males by 2.0%.
- Actual cost per graduate of females is less than that for males by 0.12 of a year.
- The input/output ratio for females is less than the corresponding ratio for males by
0.04.
- The cohort of females consumed a number of pupil/years lessens than the number
of pupil/year studied by the cohort of males by 26 years.
- The total wastage of pupil/year caused by the cohort of females is less than the
corresponding total for males by 86 pupil/years, of which 94 pupil/years less in case
of wastage attributed to dropout and 37 less concerning the waste due to repetition
of the graduates.