CHAPTER – IV RESULTS AND DISCUSSIONshodhganga.inflibnet.ac.in/bitstream/10603/38474/9/chapter...
59
116 CHAPTER – IV RESULTS AND DISCUSSION 4.1. Introduction According to Ferguson, G.A. (1981), “the process of interpretation is essentially one of the statings what the results show, what do they mean, what is their significance, what is the answer to the original problem”. This chapter presents the analysis of the data (done through SPSS software). The data were tabulated in descriptive tables prior to the statistical analysis and presented in this chapter. Each research question is presented within the statistical findings section. Each hypothesis was tested and verified through statistical analysis. The results obtained through are discussed here hypothesis-wise. 4.2. Hypotheses 1. There is no significant difference in the competency levels of the students studying in different blocks (taluks). 2. Students studying in urban and rural areas do not differ significantly in their competency scores. 3. Male and female students do not differ significantly in their competency levels. 4. There is no significant difference between male and female students in MLL attainment scores in Mathematics of schools of Shimoga District. 5. There is no significant difference between rural and urban students in MLL attainment levels in Mathematics of schools of Shimoga District.
Transcript of CHAPTER – IV RESULTS AND DISCUSSIONshodhganga.inflibnet.ac.in/bitstream/10603/38474/9/chapter...
116
CHAPTER – IV
RESULTS AND DISCUSSION
4.1. Introduction
According to Ferguson, G.A. (1981), “the process of interpretation is
essentially one of the statings what the results show, what do they mean,
what is their significance, what is the answer to the original problem”.
This chapter presents the analysis of the data (done through SPSS software).
The data were tabulated in descriptive tables prior to the statistical analysis
and presented in this chapter. Each research question is presented within the
statistical findings section. Each hypothesis was tested and verified through
statistical analysis. The results obtained through are discussed here
hypothesis-wise.
4.2. Hypotheses
1. There is no significant difference in the competency levels of the students
studying in different blocks (taluks).
2. Students studying in urban and rural areas do not differ significantly in
their competency scores.
3. Male and female students do not differ significantly in their competency
levels.
4. There is no significant difference between male and female students in
MLL attainment scores in Mathematics of schools of Shimoga District.
5. There is no significant difference between rural and urban students in MLL
attainment levels in Mathematics of schools of Shimoga District.
117
6. There is no significant difference between control and experimental group
in the effect of diagnosis-based remediation programme in improving the
proportionate of students mastering each competency (percentage of
competency mastered) by the group of V standard students in the selected
(experimental) schools of Shimoga District.
4.3. Hypothesis 1: There is no significant difference in the competency
scores of the students studying in different blocks.
The investigator identified masters and non-masters based on pre-test and
the number of masters and non-masters found from each block are given in
table 4.3
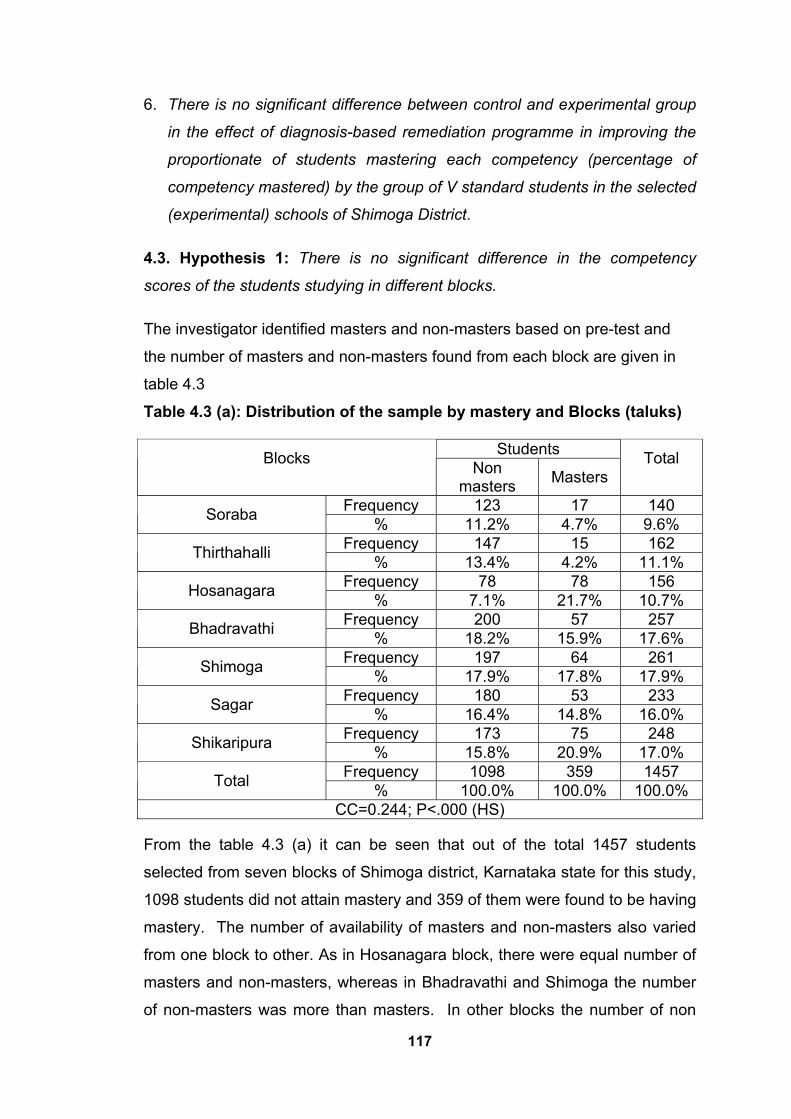
Table 4.3 (a): Distribution of the sample by mastery and Blocks (taluks)
Students Blocks Non
masters Masters Total
Frequency 123 17 140 Soraba % 11.2% 4.7% 9.6% Frequency 147 15 162 Thirthahalli % 13.4% 4.2% 11.1% Frequency 78 78 156 Hosanagara % 7.1% 21.7% 10.7% Frequency 200 57 257 Bhadravathi % 18.2% 15.9% 17.6% Frequency 197 64 261 Shimoga % 17.9% 17.8% 17.9% Frequency 180 53 233 Sagar % 16.4% 14.8% 16.0% Frequency 173 75 248 Shikaripura % 15.8% 20.9% 17.0% Frequency 1098 359 1457 Total % 100.0% 100.0% 100.0%
CC=0.244; P<.000 (HS)
From the table 4.3 (a) it can be seen that out of the total 1457 students
selected from seven blocks of Shimoga district, Karnataka state for this study,
1098 students did not attain mastery and 359 of them were found to be having
mastery. The number of availability of masters and non-masters also varied
from one block to other. As in Hosanagara block, there were equal number of
masters and non-masters, whereas in Bhadravathi and Shimoga the number
of non-masters was more than masters. In other blocks the number of non
118
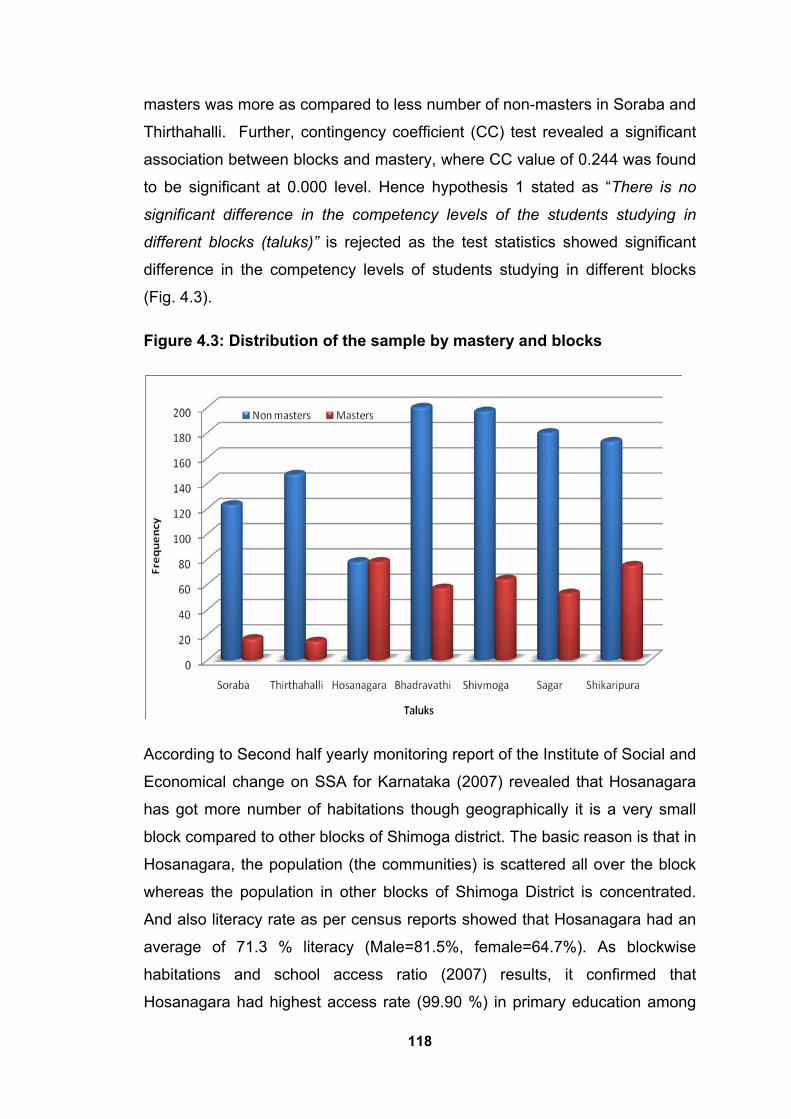
masters was more as compared to less number of non-masters in Soraba and
Thirthahalli. Further, contingency coefficient (CC) test revealed a significant
association between blocks and mastery, where CC value of 0.244 was found
to be significant at 0.000 level. Hence hypothesis 1 stated as “There is no
significant difference in the competency levels of the students studying in
different blocks (taluks)” is rejected as the test statistics showed significant
difference in the competency levels of students studying in different blocks
(Fig. 4.3).
Figure 4.3: Distribution of the sample by mastery and blocks
According to Second half yearly monitoring report of the Institute of Social and
Economical change on SSA for Karnataka (2007) revealed that Hosanagara
has got more number of habitations though geographically it is a very small
block compared to other blocks of Shimoga district. The basic reason is that in
Hosanagara, the population (the communities) is scattered all over the block
whereas the population in other blocks of Shimoga District is concentrated.
And also literacy rate as per census reports showed that Hosanagara had an
average of 71.3 % literacy (Male=81.5%, female=64.7%). As blockwise
habitations and school access ratio (2007) results, it confirmed that
Hosanagara had highest access rate (99.90 %) in primary education among
119
the blocks of Shimoga district. It is quite evident that differences in
geographical reasons and heterogeneity of the population influence over the
attainment levels so this influence is seen in the case of Hosanagara taluk in
the present study. Some of the studies revealed the reasons of the non
attainment of competency levels in mathematics. Van de Walle (2005)
observed, “the very fact that many students in grades 4 and 5 have not
mastered addition and subtraction and students in the middle and upper
grades do not have good command of their multiplication facts suggest that
this method simply does not work well.” Studies by Brownell and Chazal
(1935) concluded that children develop a variety of different thought
processes for basic facts regardless of the amount of drill they undergo (Van
de Walle 2005). They also found that children create and hold on to
procedures that develop from their own conception of numbers and that drill
does not help students develop any new or more efficient strategies (Van de
Walle 2005). However, drill can be used once a student has acquired an
efficient strategy. Premature drill (using drill before a student develops their
own understanding of numbers) will certainly be ineffective, waste valuable
time, and for many students contribute to a strong dislike and a faulty view of
learning mathematics (Van de Walle 2005). Overall, Van de Walle (2005)
suggested that drill can provide four things: an increased facility with a
strategy but only with a strategy already learned; a focus on a singular
method and an exclusion of flexible alternatives; a false appearance of
understanding; a rule-oriented view of what mathematics is about. In
conclusion, drill can only help students get faster at what they already know.
We feel that manipulatives have a place in the classroom but that children
learn through reflective thought and not through the manipulation of objects
(Colgan, 2007). We agree with Jon Van de Walle’s statement that you
‘cannot judge the value of an activity by the presence or absence of a physical
model’ and we feel that some problems are best solved without the assistance
of a manipulative (Colgan, 2007). Proof is and has been for long a
problematic area in the teaching of mathematics at the school level. While
proof remains central to the discipline of mathematics (articles like Horgan,
1993, notwithstanding), its pedagogic role at the school level remains unclear.
On perusing through the questions asked in the Math Forum site

120
(http://mathforum.org/) one sees the demoralizing nature of the difficulties felt
by students.
A major contributory factor to this problem is surely that we introduce proofs at
too late a stage. Moreover, it is done in too abrupt, too formal, and too stylized
a manner. This results in a feeling of alienation for the child, who finds proofs
unmotivated and unnatural. This feeling is added to if what is being proved
looks obvious. And a majority of the early results encountered in geometry do
indeed look .obvious (Recall some of the results we meet early in the study of
geometry; e.g., the bridge of asses theorem). Whatever be the cause, the
problem challenges us to respond with some effective pedagogy. The cost of
not doing so is considerable. A child reaching the senior grades without a
significant exposure to the culture of proof has lost a valuable opportunity to
experience a central component of the discipline of mathematics.
Learning achievement surveys undertaken by National Council of Education
Research and Training (NCERT) and other agencies show that mathematics
pedagogy calls for more attention to help children acquire the basic skills in
mathematics. At present the attempt is to strengthen the early reading and
mathematics skill development programmes at the Primary level and
Mathematics teaching at Upper Primary level to prepare the students in a
better manner.
National Knowledge Commission (2008) on attracting students to maths and
science revealed that curriculum reform remains an important issue in almost
all schools. School education must be made more relevant to the lives of
children. There is need to move away from rote-learning to understanding
concepts, good comprehension and communication skills and learning how to
access knowledge independently.
121
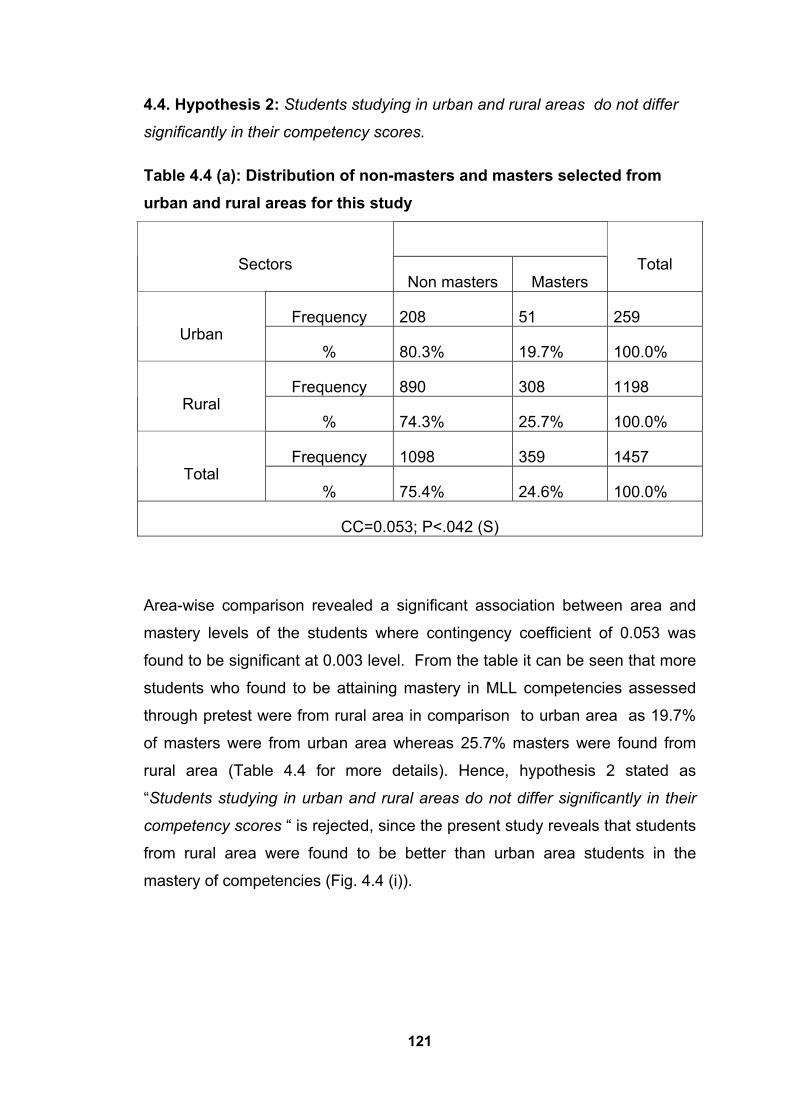
4.4. Hypothesis 2: Students studying in urban and rural areas do not differ
significantly in their competency scores.
Table 4.4 (a): Distribution of non-masters and masters selected from urban and rural areas for this study
Sectors
Non masters Masters Total
Frequency 208 51 259 Urban
% 80.3% 19.7% 100.0%
Frequency 890 308 1198 Rural
% 74.3% 25.7% 100.0%
Frequency 1098 359 1457 Total
% 75.4% 24.6% 100.0%
CC=0.053; P<.042 (S)
Area-wise comparison revealed a significant association between area and
mastery levels of the students where contingency coefficient of 0.053 was
found to be significant at 0.003 level. From the table it can be seen that more
students who found to be attaining mastery in MLL competencies assessed
through pretest were from rural area in comparison to urban area as 19.7%
of masters were from urban area whereas 25.7% masters were found from
rural area (Table 4.4 for more details). Hence, hypothesis 2 stated as
“Students studying in urban and rural areas do not differ significantly in their
competency scores “ is rejected, since the present study reveals that students
from rural area were found to be better than urban area students in the
mastery of competencies (Fig. 4.4 (i)).
122
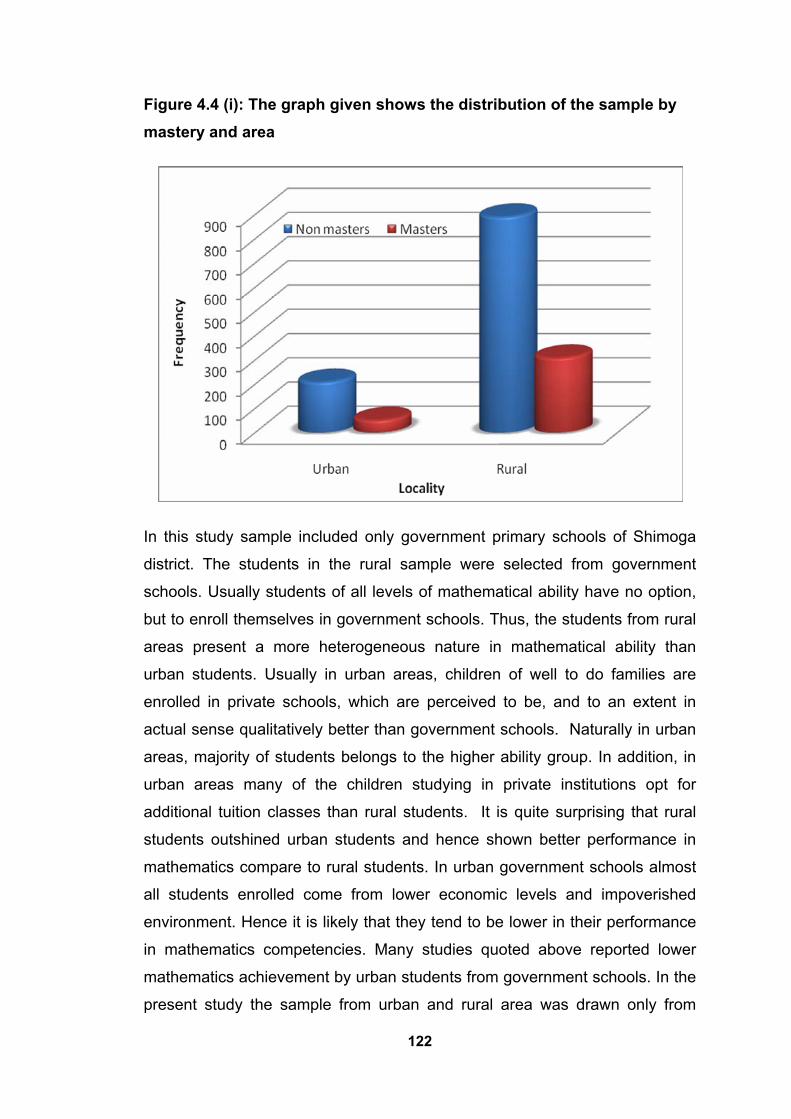
Figure 4.4 (i): The graph given shows the distribution of the sample by mastery and area
In this study sample included only government primary schools of Shimoga
district. The students in the rural sample were selected from government
schools. Usually students of all levels of mathematical ability have no option,
but to enroll themselves in government schools. Thus, the students from rural
areas present a more heterogeneous nature in mathematical ability than
urban students. Usually in urban areas, children of well to do families are
enrolled in private schools, which are perceived to be, and to an extent in
actual sense qualitatively better than government schools. Naturally in urban
areas, majority of students belongs to the higher ability group. In addition, in
urban areas many of the children studying in private institutions opt for
additional tuition classes than rural students. It is quite surprising that rural
students outshined urban students and hence shown better performance in
mathematics compare to rural students. In urban government schools almost
all students enrolled come from lower economic levels and impoverished
environment. Hence it is likely that they tend to be lower in their performance
in mathematics competencies. Many studies quoted above reported lower
mathematics achievement by urban students from government schools. In the
present study the sample from urban and rural area was drawn only from

123
government schools. As a result the rural sample becomes more
heterogeneous having many higher ability students as well as lower ability
students for the reason mentioned above. But the urban sample becomes
more homogeneous which consisting students from first generation learners
and poor family support. This difference between rural and urban students is
due to these reasons.
4.5 Hypothesis 3: Male and female students do not differ significantly in their
competency scores
For verifying this hypothesis, the investigator calculated contingency
coefficient test according to this the number of male and female masters were
found is given
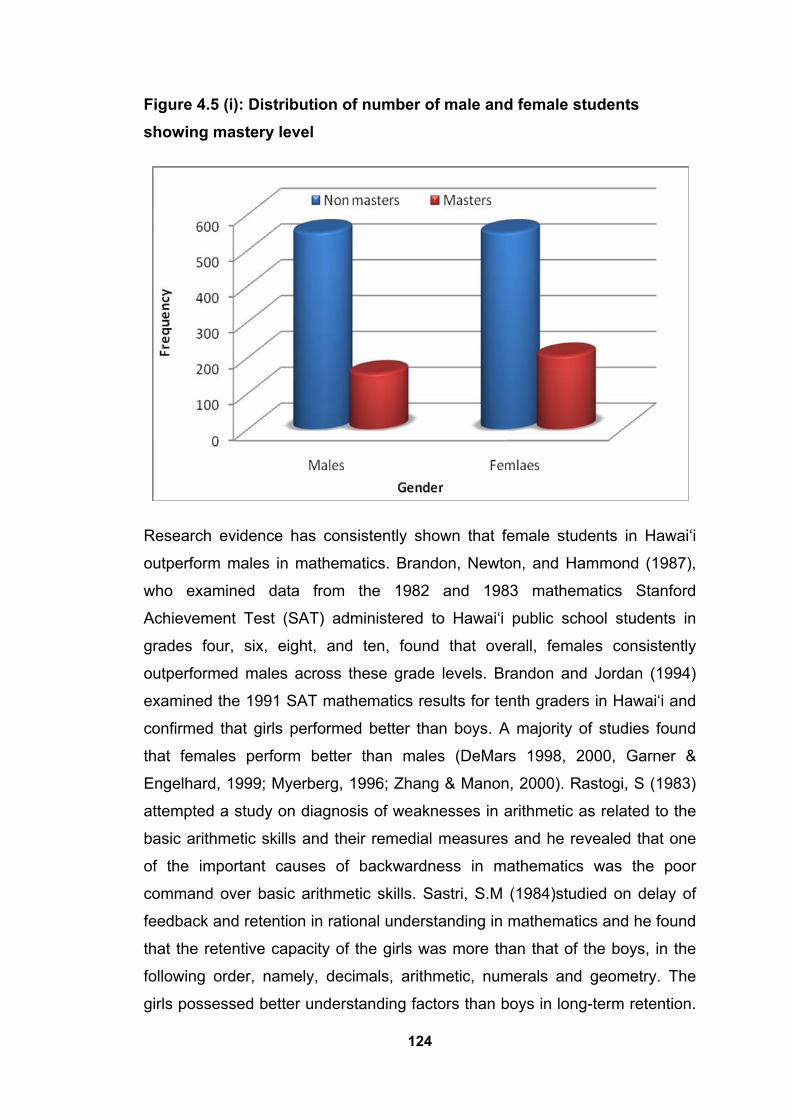
Table 4.5 (a): Distribution of Sample by Mastery and gender
Mastery Gender Non masters Masters Total
Frequency 549 155 704 Male % 78.0% 22.0% 100.0% Frequency 549 204 753 Female % 72.9% 27.1% 100.0% Frequency 1098 359 1457 Total % 75.4% 24.6% 100.0%
CC=0.059; P<.025 (S)
A significant association was observed between gender and level of mastery.
Contingency coefficient of .059 was found to be significant at 0.025 level.
From the table it can be seen that the number of female students attaining
mastery more than male students (27.1% vs 22.0%). Hence hypothesis 3
stated as “Male and female students do not differ significantly in their
competency levels” is rejected as we find that female students excelled male
students in their competency level (Fig. 4.5 (i)).
124
Figure 4.5 (i): Distribution of number of male and female students showing mastery level
Research evidence has consistently shown that female students in Hawai‘i
outperform males in mathematics. Brandon, Newton, and Hammond (1987),
who examined data from the 1982 and 1983 mathematics Stanford
Achievement Test (SAT) administered to Hawai‘i public school students in
grades four, six, eight, and ten, found that overall, females consistently
outperformed males across these grade levels. Brandon and Jordan (1994)
examined the 1991 SAT mathematics results for tenth graders in Hawai‘i and
confirmed that girls performed better than boys. A majority of studies found
that females perform better than males (DeMars 1998, 2000, Garner &
Engelhard, 1999; Myerberg, 1996; Zhang & Manon, 2000). Rastogi, S (1983)
attempted a study on diagnosis of weaknesses in arithmetic as related to the
basic arithmetic skills and their remedial measures and he revealed that one
of the important causes of backwardness in mathematics was the poor
command over basic arithmetic skills. Sastri, S.M (1984)studied on delay of
feedback and retention in rational understanding in mathematics and he found
that the retentive capacity of the girls was more than that of the boys, in the
following order, namely, decimals, arithmetic, numerals and geometry. The
girls possessed better understanding factors than boys in long-term retention.
125
In memory ability there was a small but consistent sex difference, the girls
being higher than the boys over the entire range in all the three standards.
Chitkara, M. (1985) studied on the effectiveness of different strategies of
teaching on achievement in mathematics and she found that girls of average
ability scored significantly higher in mathematics than boys of average ability.
Rumki Gupta (2000) studied gender disparity in madhyamik examination
result and he revealed that difference in overall achievements i.e., average
percentage of pass of boys and girls of West Bengal is small. Marginally
higher percentage of girls passed the Madhyamik Examination than the boys.
Basic literary skills (reading and writing) are pre-requisites to mathematics
achievement. For instructional and learning purposes, increasing students’
verbal scores might assist in increasing their performance on mathematics
assessments. This is especially important for boys, whose lower linguistic
skills negatively influence their mathematics assessment.
Because gender differences exist in early literacy skills, mathematics
educators may need to consider gender-appropriate pedagogical approaches
for boys and girls. To benefit males and females, the instruction for males and
females might need to be differentiated. As Gambell and Hunter (2000)
stated, "Males are in trouble in literacy!” (p. 712). And as a result, boys are in
trouble with mathematics as well. While mathematics performance of males
might be improved by focusing on linguistic skills, for females beneficial
outcomes might be obtained by focusing on mathematics. Boys might benefit
from additional guidance in reading comprehension and verbalization along
with quantitative reasoning, whereas for girls the benefit might accrue from
focused practice with mathematics-specific semiotics, e.g., symbols, formulas,
and algorithms.

126
4.6. Hypothsis 4: There is no significant difference between male and female
students in MLL attainment levels in Mathematics from selected schools of
Shimoga District.
Table 4.6 (a): Comparison of means on various competencies between male and female students and results of Independent samples‘t’ test
Competencies Gender Mean S.D ‘t’ value P valueMale 3.87 1.13 C1-Number
Female 3.84 1.13 0.397 0.692
Male 1.80 0.45 C2-Different numerals Female 1.83 0.40 1.308 0.191
Male 1.89 1.04 C3-Fundamental
operations
Female 2.03 1.11
2.318 0.021
Male 2.57 1.15 C4-Fractions, decimals, and percentages Female 2.68 1.13 1.846 0.065
Male 1.84 0.99 C5-Decimal’s fundamental operations Female 1.91 0.98 1.290 0.197
Male 2.01 0.99 C6-Decimals addition and subtraction with mixed operations
Female 1.99 1.02
0.384 0.701
Male 2.15 0.96 C7-Angles Female 2.06 0.97 1.763 0.078
Male 16.12 4.16 TOTAL Female 16.35 4.47 0.991 0.322
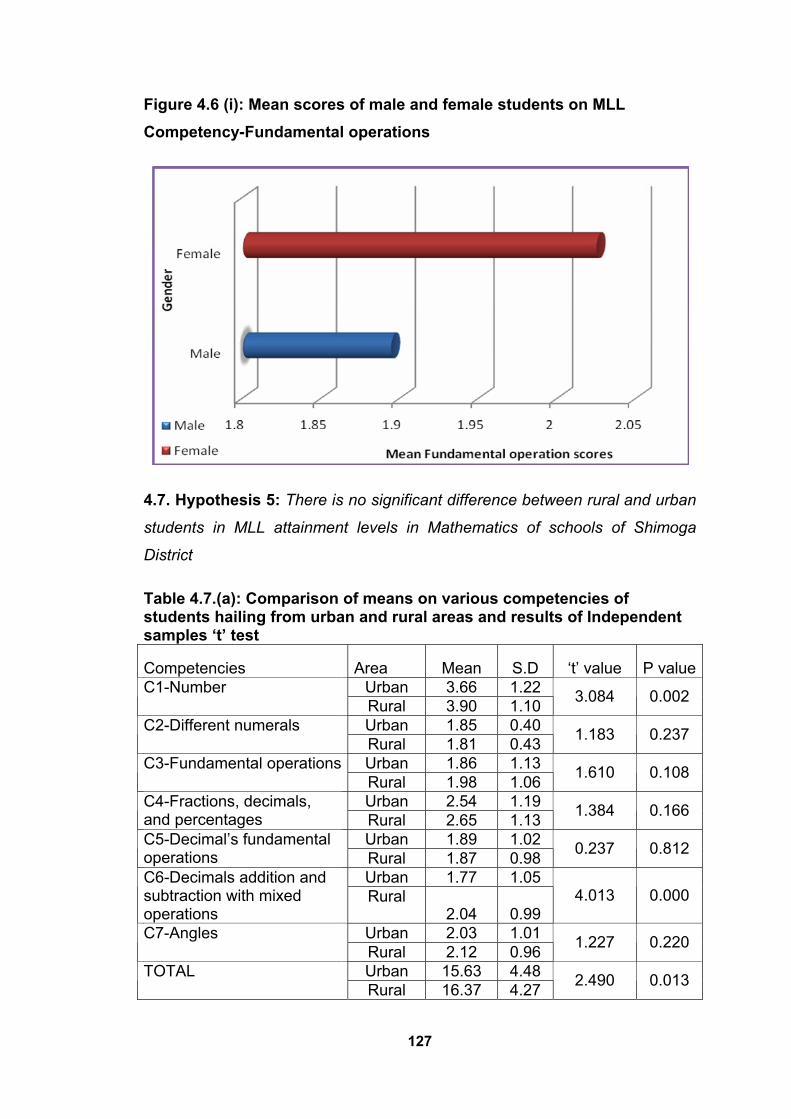
Only in Fundamental operationscompetency, significant difference was
observed between male and female students as the obtained ‘t’ value of 2.318
was found to be significant at 0.021 level where female students had high
scores (means 2.03 and 1.89 respectively). In rest of the components as well
as in total mathematics scores ‘t’ value revealed non-significant differences
between male and female students on the whole hypothesis 4 is accepted
where in all the competencies except one competency and in total
mathematics scores, the performance of male and female students had
statistically equal scores (Fig. 4.6 (i)).
127
Figure 4.6 (i): Mean scores of male and female students on MLL Competency-Fundamental operations
4.7. Hypothesis 5: There is no significant difference between rural and urban
students in MLL attainment levels in Mathematics of schools of Shimoga
District
Table 4.7.(a): Comparison of means on various competencies of students hailing from urban and rural areas and results of Independent samples ‘t’ test
Competencies Area Mean S.D ‘t’ value P valueUrban 3.66 1.22 C1-Number
Rural 3.90 1.10 3.084 0.002
Urban 1.85 0.40 C2-Different numerals Rural 1.81 0.43 1.183 0.237
Urban 1.86 1.13 C3-Fundamental operations Rural 1.98 1.06 1.610 0.108
Urban 2.54 1.19 C4-Fractions, decimals, and percentages Rural 2.65 1.13 1.384 0.166
Urban 1.89 1.02 C5-Decimal’s fundamental operations Rural 1.87 0.98 0.237 0.812
Urban 1.77 1.05 C6-Decimals addition and subtraction with mixed operations
Rural 2.04 0.99
4.013 0.000
Urban 2.03 1.01 C7-Angles Rural 2.12 0.96 1.227 0.220
Urban 15.63 4.48 TOTAL Rural 16.37 4.27 2.490 0.013

128
Only in number competency, different numeral competency and total
competencies overall performance of students on all the competencies it was
that significance differences between rural and urban areas were observed,
where ‘t’ values of 3.084, 4.013 and 2.490 were found to be significant at
0.002,0.000 and 0.013 levels respectively, where rural students had high
scores (means=3.8981, 2.6442 and 16.3689 and 3.66, 1.77 and 15.3
respectively) than urban students. In rest of the competencies ‘t’ value
revealed non significant differences between rural and urban students on the
whole hypothesis 5 is accepted where in all the conpetencies, except
numbers competency, Decimals addition and subtraction with mixed
operations and overall scores of all the competencies of rural and urban
students was found to be statistically equal scores.figure4.7(i)
Figure 4.7 (i): Mean scores of urban and rural students in numbers competency, Decimals addition and subtraction with mixed operations and overall scores of all the competencies
129
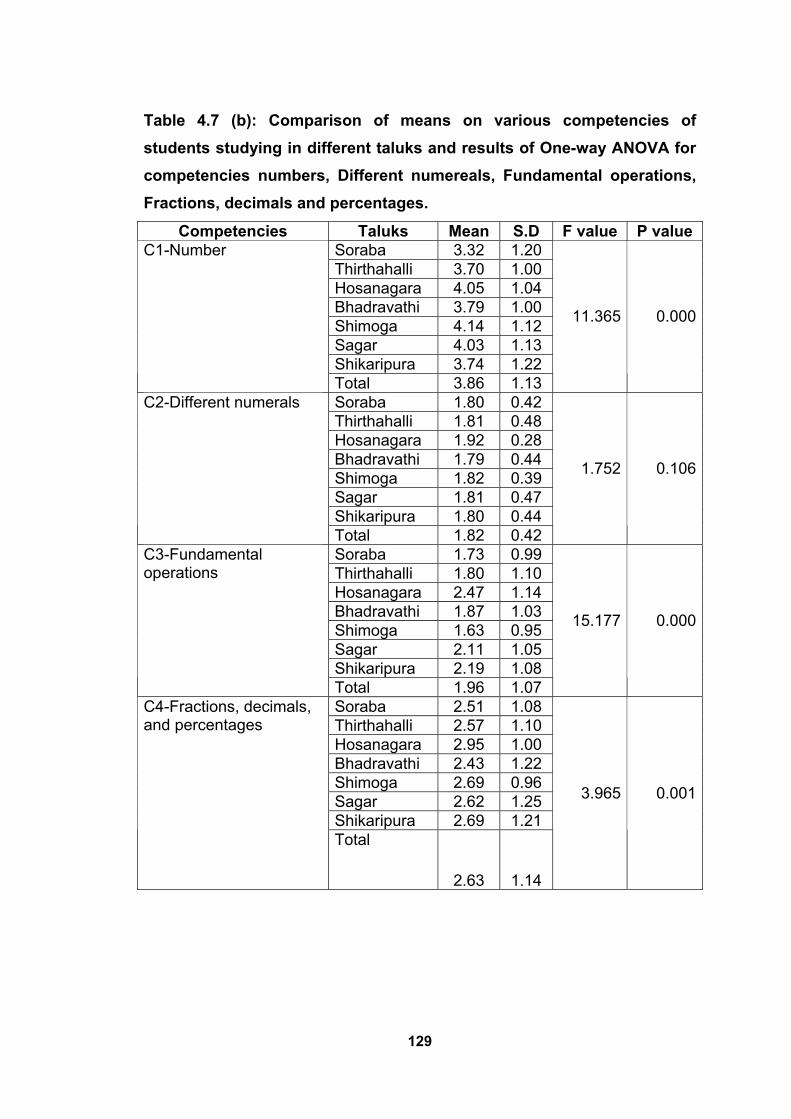
Table 4.7 (b): Comparison of means on various competencies of students studying in different taluks and results of One-way ANOVA for competencies numbers, Different numereals, Fundamental operations, Fractions, decimals and percentages.
Competencies Taluks Mean S.D F value P value Soraba 3.32 1.20 Thirthahalli 3.70 1.00 Hosanagara 4.05 1.04 Bhadravathi 3.79 1.00 Shimoga 4.14 1.12 Sagar 4.03 1.13 Shikaripura 3.74 1.22
C1-Number Total 3.86 1.13
11.365 0.000
Soraba 1.80 0.42 Thirthahalli 1.81 0.48 Hosanagara 1.92 0.28 Bhadravathi 1.79 0.44 Shimoga 1.82 0.39 Sagar 1.81 0.47 Shikaripura 1.80 0.44
C2-Different numerals
Total 1.82 0.42
1.752 0.106
Soraba 1.73 0.99 Thirthahalli 1.80 1.10 Hosanagara 2.47 1.14 Bhadravathi 1.87 1.03 Shimoga 1.63 0.95 Sagar 2.11 1.05 Shikaripura 2.19 1.08
C3-Fundamental operations
Total 1.96 1.07
15.177 0.000
Soraba 2.51 1.08 Thirthahalli 2.57 1.10 Hosanagara 2.95 1.00 Bhadravathi 2.43 1.22 Shimoga 2.69 0.96 Sagar 2.62 1.25 Shikaripura 2.69 1.21
C4-Fractions, decimals, and percentages Total
2.63 1.14
3.965 0.001

130
4.7.1. Numbers Competency
Table 4.7.1 (a): Results of Duncan’s Multiple Range Test for Competency: Number
Subset for alpha = .05 Taluks
N
1 2 3
Soraba 140 3.3214
Thirthahalli 162 3.6975
Shikaripura 248 3.7379
Bhadravathi 257 3.7899
Sagar 233 4.0343
Hosanagara 155 4.0516
Shimoga 261 4.1418
In the case of numbers competency significant difference was observed
between students studying in different taluks (F = 11.365; P = 0.000). The
mean numbers competency scores of Soraba, Thirthahalli, Hosanagara,
Bhadravathi, Shimoga, Sagar and Shikaripura were 3.32, 3.69, 4.05, 3.79,
4.14, 4.03 and 3.74 respectively. Further Duncan’s multiple range test
indicated that Soraba had least scores, Sagar, Hosanagar and Shimoga had
Highest scores, Thirthahalli, Shikaripura and Bhadravathi students had the
scores on competency numbers in between.
4.7.2. Different numerals competency
In the case of Different numerals competency no significant difference was
observed between sectors as the observed ‘F’ value of 1.752 failed to reach
significance level criterion. In other words the mean values for students
studying in different taluks were statistically same.

131
4.7.3. Fundamental operations competency
Table 4.7.3 (a): Results of Duncan’s Multiple Range Test for Competency: Fundamental operations
SECTOR N Subset for alpha = .05
1 2 3 4
Shimoga 261 1.6322
Soraba 139 1.7338 1.7338
Thirthahalli 162 1.8025 1.8025
Bhadravathi 257 1.8677
Sagar 233 2.1073
Shikaripura 248 2.1855
Hosanagara 156 2.4679
In the case of Fundamental operations competency significant difference was
observed between students studying in different taluks (F = 15.177;
P = 0.000). The mean Fundamental operations competency scores of
students studying in Soraba, Thirthahalli, Hosanagara, Bhadravathi, Shimoga,
Sagar and Shikaripura were 1.73, 1.80, 2.47, 1.87, 1.63, 2.11 and 2.19
respectively. Further Duncan’s multiple range test indicated that students
studying in Shimoga , Soraba, Thirtahalli had least scores, Hosanagara had
highest scores, students studying in Bhadravathi, Sagara, Shikaripura taluks
had the scores in between.
132
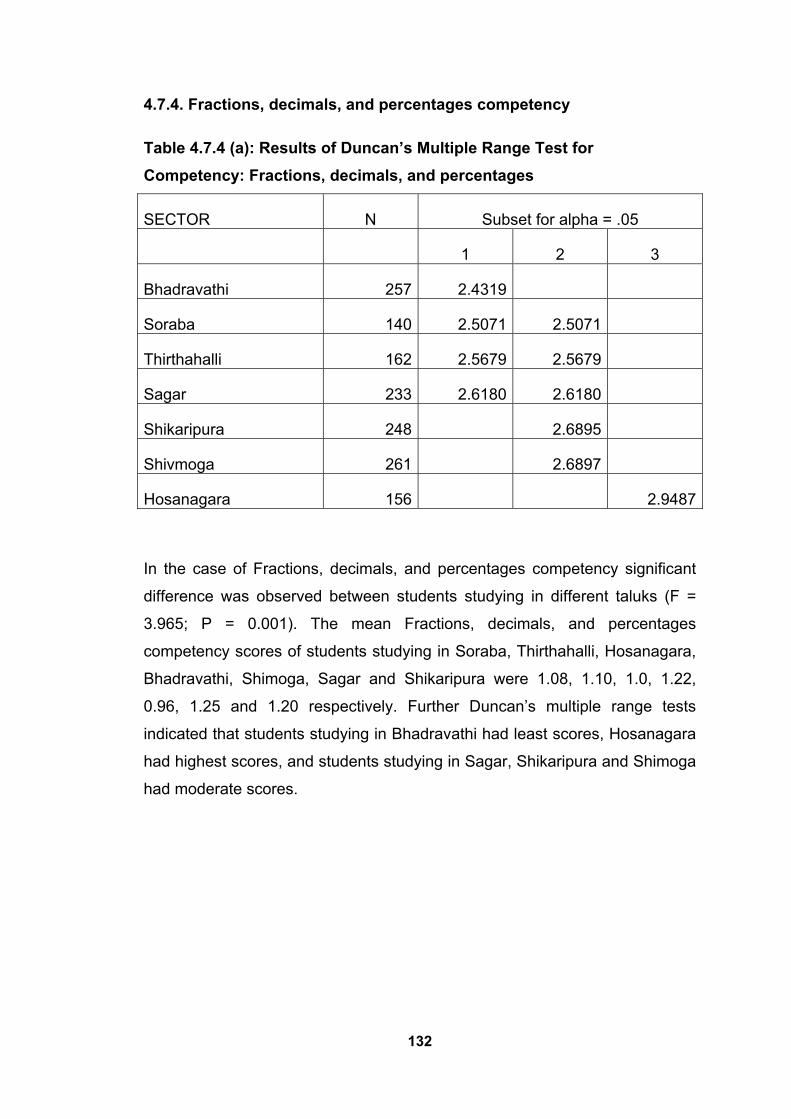
4.7.4. Fractions, decimals, and percentages competency
Table 4.7.4 (a): Results of Duncan’s Multiple Range Test for Competency: Fractions, decimals, and percentages
SECTOR N Subset for alpha = .05
1 2 3
Bhadravathi 257 2.4319
Soraba 140 2.5071 2.5071
Thirthahalli 162 2.5679 2.5679
Sagar 233 2.6180 2.6180
Shikaripura 248 2.6895
Shivmoga 261 2.6897
Hosanagara 156 2.9487
In the case of Fractions, decimals, and percentages competency significant
difference was observed between students studying in different taluks (F =
3.965; P = 0.001). The mean Fractions, decimals, and percentages
competency scores of students studying in Soraba, Thirthahalli, Hosanagara,
Bhadravathi, Shimoga, Sagar and Shikaripura were 1.08, 1.10, 1.0, 1.22,
0.96, 1.25 and 1.20 respectively. Further Duncan’s multiple range tests
indicated that students studying in Bhadravathi had least scores, Hosanagara
had highest scores, and students studying in Sagar, Shikaripura and Shimoga
had moderate scores.
133
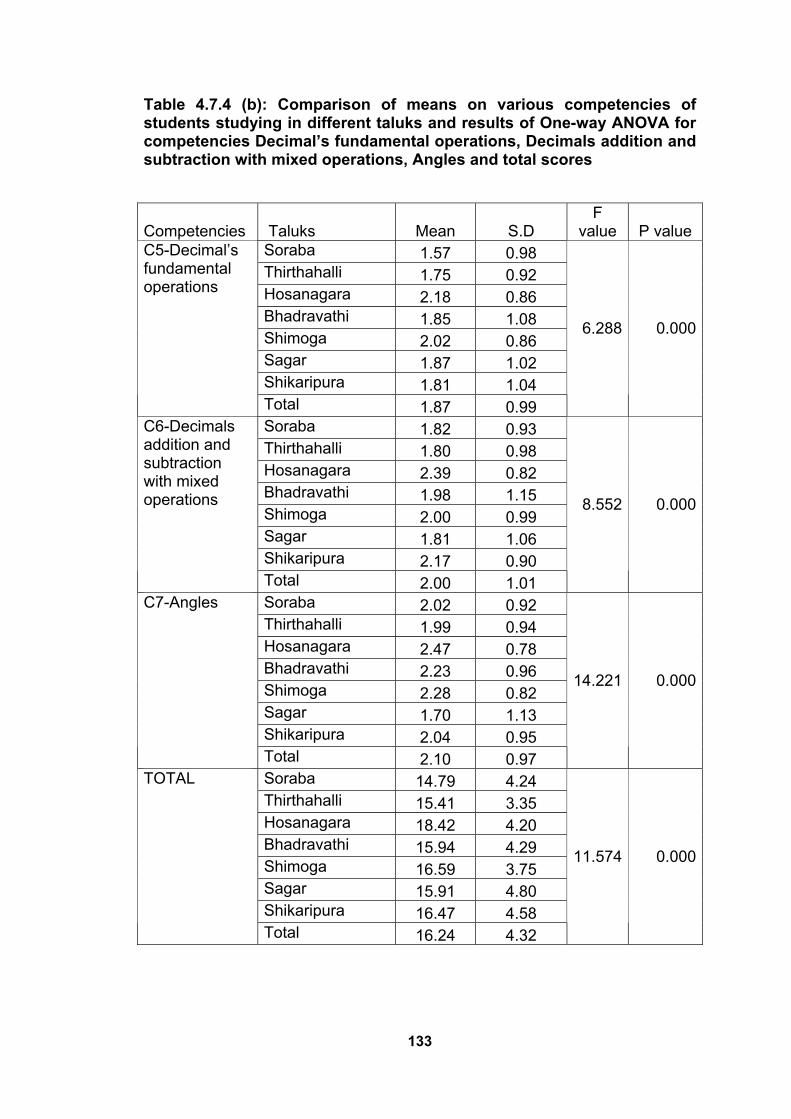
Table 4.7.4 (b): Comparison of means on various competencies of students studying in different taluks and results of One-way ANOVA for competencies Decimal’s fundamental operations, Decimals addition and subtraction with mixed operations, Angles and total scores
Competencies Taluks Mean S.D F
value P value Soraba 1.57 0.98 Thirthahalli 1.75 0.92 Hosanagara 2.18 0.86 Bhadravathi 1.85 1.08 Shimoga 2.02 0.86 Sagar 1.87 1.02 Shikaripura 1.81 1.04
C5-Decimal’s fundamental operations
Total 1.87 0.99
6.288 0.000
Soraba 1.82 0.93 Thirthahalli 1.80 0.98 Hosanagara 2.39 0.82 Bhadravathi 1.98 1.15 Shimoga 2.00 0.99 Sagar 1.81 1.06 Shikaripura 2.17 0.90
C6-Decimals addition and subtraction with mixed operations
Total 2.00 1.01
8.552 0.000
Soraba 2.02 0.92 Thirthahalli 1.99 0.94 Hosanagara 2.47 0.78 Bhadravathi 2.23 0.96 Shimoga 2.28 0.82 Sagar 1.70 1.13 Shikaripura 2.04 0.95
C7-Angles
Total 2.10 0.97
14.221 0.000
Soraba 14.79 4.24 Thirthahalli 15.41 3.35 Hosanagara 18.42 4.20 Bhadravathi 15.94 4.29 Shimoga 16.59 3.75 Sagar 15.91 4.80 Shikaripura 16.47 4.58
TOTAL
Total 16.24 4.32
11.574 0.000

134
4.7.5. Decimals Fundamental Operations Competency
Table 4.7.5 (a): Results of Duncan’s Multiple Range Test for Competency: Decimals fundamental operations
SECTOR N Subset for alpha = .05 1 2 3 4 Soraba 140 1.5714 Thirthahalli 162 1.7531 1.7531 Shikaripura 248 1.8145 1.8145 Bhadravathi 257 1.8521 1.8521 Sagar 230 1.8696 1.8696 Shivmoga 261 2.0153 2.0153Hosanagara 156 2.1795
A significant difference was found between the students studying in different
taluks in the Decimals fundamental operations competency scores as the
obtained F value of 6.288 was found to be significant at .000 level. The
mean Decimals fundamental operations competency scores of students
studying in Soraba, Thirthahalli, Hosanagara, Bhadravathi, Shimoga, Sagar
and Shikaripura were 1.57, 1.75, 2.18, 1.85, 2.02, 1.87, 1.81 and 1.87
respectively. Further Duncan’s multiple range tests indicated that students of
Soraba and Thirthahalli had least scores, and students of Shimoga and
Hosanagar had highest and others in between.
4.7.6. Decimals Addition and Subtraction with Mixed Operations Competency
Table 4.7.6 (a): Results of Duncan’s Multiple Range Test for Competency: Decimals addition and subtraction with mixed operations
Taluks N Subset for alpha = .05 1 2 3 Thirthahalli 162 1.7963 Sagar 233 1.8069 Soraba 140 1.8214 Bhadravathi 257 1.9767 1.9767 Shivmoga 261 2.0000 2.0000 Shikaripura 248 2.1653 Hosanagara 156 2.3910

135
In the case of Decimals addition and subtraction with mixed operations
competency, a significant difference was observed between students studying
in different taluks (F=8.552; P=0.000). The mean Decimals addition and
subtraction with mixed operations competency scores of students studying in
Soraba, Thirthahalli, Hosanagara, Bhadravathi, Shimoga, Sagar and
Shikaripura were 1.82, 1.80, 2.39, 1.98, 2.00, 1.80, 2.17 and 1.99
respectively. Further Duncan’s multiple range test indicated that students of
Thirthahalli, Sagar, Soraba had least scores, Hosanagar had highest scores,
and students of Bhadravathi, Shimoga, Sagar and Shikaripura had moderate
scores.
4.7.7. Angles competency
Table 4.7.7 (c): Results of Duncan’s Multiple Range Test for Competency: Angles
SECTOR N Subset for alpha = .05
1 2 3 4
Sagar 233 1.6996
Thirthahalli 162 1.9877
Soraba 140 2.0214
Shikaripura 248 2.0403
Bhadravathi 257 2.2335
Shimoga 261 2.2835 2.2835
Hosanagara 156 2.4679
In the case of Angles competency, a significant difference was observed
between students studying in different taluks (F=14.221; P=0.000). The mean
Angles competency scores of students studying in Soraba, Thirthahalli,
Hosanagara, Bhadravathi, Shimoga, Sagar and Shikaripura were 2.02, 1.98,
2.46, 2.23, 2.28, 1.69 and 2.04 respectively. Further Duncan’s multiple range
test indicated that students of Sagar had least scores, students of Shimoga
and Hosanagara had highest scores and other students in between.

136
4.7.8. Total competency scores
Table 4.7.8 (a): Results of Duncan’s Multiple Range Test for total competency scores
SECTOR N Subset for alpha = .05
1 2 3 4
Soraba 140 14.7857
Thirthahalli 162 15.4136 15.4136
Sagar 233 15.9142 15.9142
Bhadravathi 257 15.9416 15.9416
Shikaripura 248 16.4677
Shivmoga 261 16.5862
Hosanagara 156 18.4231
When total scores on all the competencies were verified, it was found that
students studying in different taluks differ significantly, as the obtained F value
of 11.574 was found to be significant at .000 level. The mean C7 scores for
Soraba, Thirthahalli, Hosanagara, Bhadravathi, Shimoga, Sagar and
Shikaripura were 14.79, 15.41, 18.42, 15.94, 16.59, 15.91 and 16.46
respectively. Further Duncan’s multiple range tests indicated that Sagar had
least scores, Shimoga and Hosanagar had highest scores, Thirthahalli,
Soraba, Shikaripura and Bhadravathi were in between.
Several studies have been conducted to compare achievement of mastery
level in mathematics by students studying in urban and rural schools. Singh
(2003) found significant difference in mathematic achievement between rural
and urban students. Santhosh Sharma (1999) also found the same results. A
study by Sharma (2000) found that teagarden school children (rural area)
lagged behind urban students. Dutta (2003) found that urban girls were better
in achievement in mathematics than rural girls. A study by Ramakalyani
(1993) showed that urban government school students were better than rural

137
government schools but they were inferior in mathematics achievements to
the private school children.
Some of the studies revealed that areas of study do not have significant
influence over achievement. Shailaja Shanbag (1992) reported that both rural
and urban schools fail to produce significant proportion of students who
attained required mastery level (80%). In mathematic competencies she did
not found significant difference in the proportion of mastery level students.
It can therefore be concluded that achievement pattern in mathematics
competencies among urban students is in a better position than compared to
rural students. The findings of the present study show the reverse pattern of
achievement as the rural students showed better performance .These results
can be explained in the following manner. The students in the rural sample
were selected from government schools. Usually students of all levels of
mathematical ability have no option, but to enroll themselves in government
schools. Thus, the students from rural areas present a more heterogeneous
nature in mathematical ability than urban students. Usually in urban areas,
children of well to do families are enrolled in private schools, which are
perceived to be, and to an extent in actual sense qualitatively better than
government schools. Naturally in urban areas, majority of students belonging
to the higher ability group go to private schools. In addition, in urban areas,
more number of students studying in private institutions opts for additional
tuition classes than the rural students. It is quite surprising that rural students
outshined urban students and hence shown better performance in
mathematics compare to urban students. In urban government schools almost
all students enrollment come from lower economic levels and impoverished
environment. Hence it is likely that they tend to be lower in their performance
in mathematics competencies. Many studies quoted above reported lower
mathematics achievement by urban students from government schools. In the
present study the sample from urban and rural area was drawn only from
government schools. As a result the rural sample becomes more
heterogeneous having many higher ability students as well as lower ability
students for the reason mentioned above. But the urban sample becomes
138
more homogeneous consisting of students from first generation learners and
poor family support. This difference of achievement between rural and urban
students occurred due to the above mentioned reasons.
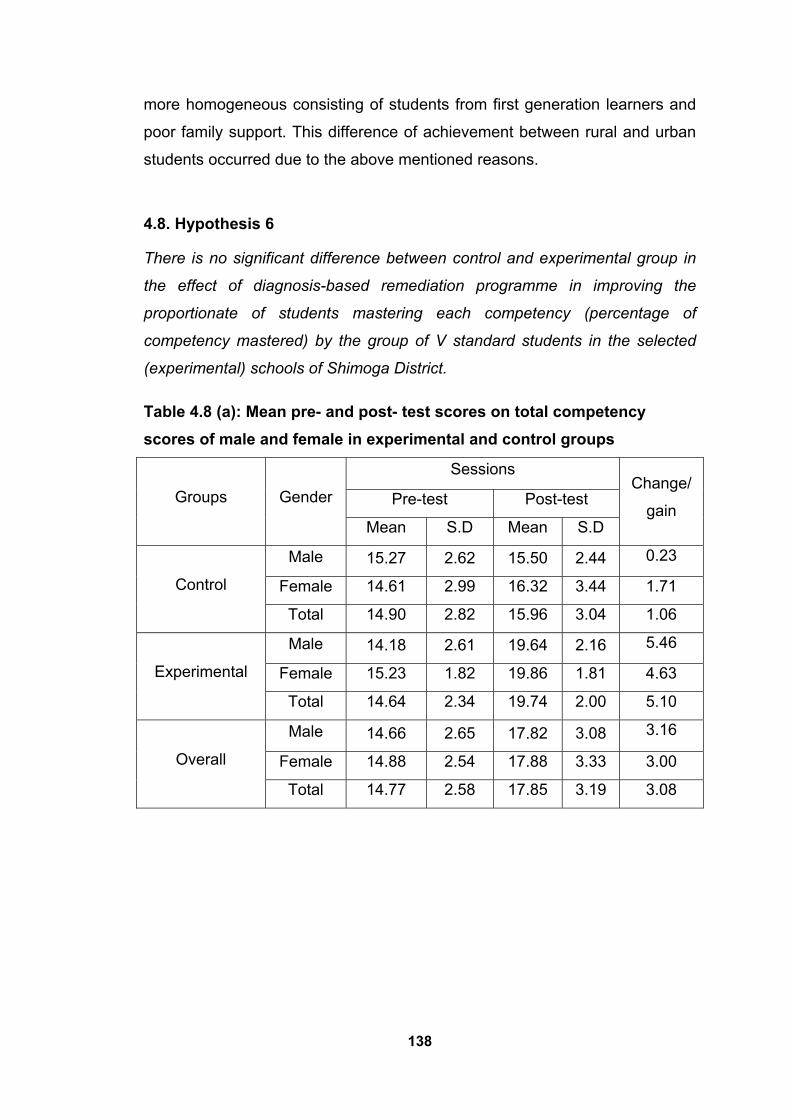
4.8. Hypothesis 6
There is no significant difference between control and experimental group in
the effect of diagnosis-based remediation programme in improving the
proportionate of students mastering each competency (percentage of
competency mastered) by the group of V standard students in the selected
(experimental) schools of Shimoga District.
Table 4.8 (a): Mean pre- and post- test scores on total competency scores of male and female in experimental and control groups
Sessions
Pre-test Post-test Groups Gender
Mean S.D Mean S.D
Change/
gain
Male 15.27 2.62 15.50 2.44 0.23
Female 14.61 2.99 16.32 3.44 1.71 Control
Total 14.90 2.82 15.96 3.04 1.06
Male 14.18 2.61 19.64 2.16 5.46
Female 15.23 1.82 19.86 1.81 4.63 Experimental
Total 14.64 2.34 19.74 2.00 5.10
Male 14.66 2.65 17.82 3.08 3.16
Female 14.88 2.54 17.88 3.33 3.00 Overall
Total 14.77 2.58 17.85 3.19 3.08
139
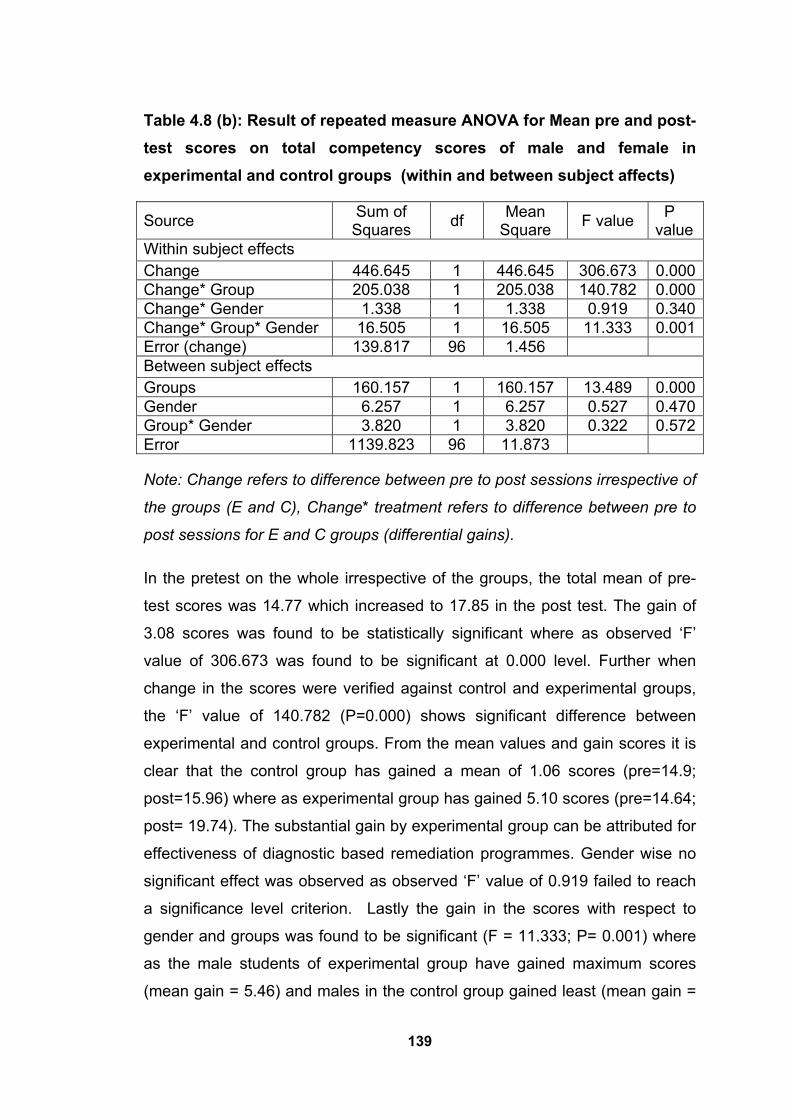
Table 4.8 (b): Result of repeated measure ANOVA for Mean pre and post- test scores on total competency scores of male and female in experimental and control groups (within and between subject affects)
Source Sum of Squares df Mean
Square F value P value
Within subject effects Change 446.645 1 446.645 306.673 0.000Change* Group 205.038 1 205.038 140.782 0.000Change* Gender 1.338 1 1.338 0.919 0.340Change* Group* Gender 16.505 1 16.505 11.333 0.001Error (change) 139.817 96 1.456 Between subject effects Groups 160.157 1 160.157 13.489 0.000Gender 6.257 1 6.257 0.527 0.470Group* Gender 3.820 1 3.820 0.322 0.572Error 1139.823 96 11.873
Note: Change refers to difference between pre to post sessions irrespective of
the groups (E and C), Change* treatment refers to difference between pre to
post sessions for E and C groups (differential gains).
In the pretest on the whole irrespective of the groups, the total mean of pre-
test scores was 14.77 which increased to 17.85 in the post test. The gain of
3.08 scores was found to be statistically significant where as observed ‘F’
value of 306.673 was found to be significant at 0.000 level. Further when
change in the scores were verified against control and experimental groups,
the ‘F’ value of 140.782 (P=0.000) shows significant difference between
experimental and control groups. From the mean values and gain scores it is
clear that the control group has gained a mean of 1.06 scores (pre=14.9;
post=15.96) where as experimental group has gained 5.10 scores (pre=14.64;
post= 19.74). The substantial gain by experimental group can be attributed for
effectiveness of diagnostic based remediation programmes. Gender wise no
significant effect was observed as observed ‘F’ value of 0.919 failed to reach
a significance level criterion. Lastly the gain in the scores with respect to
gender and groups was found to be significant (F = 11.333; P= 0.001) where
as the male students of experimental group have gained maximum scores
(mean gain = 5.46) and males in the control group gained least (mean gain =

140
0.23). In between subject effects only between experimental and control
group significant difference was observed (F = 13.489; P = 0.000). Gender
wise comparison and interaction between gender and groups were found to
be non significant (Fig. 4.8 (i)).
Figure 4.8 (i): Mean of pre and post test scores of experimental groups on total competencies scores
Table 4.8 (c): Mean of pre and post- test scores on Competency (Numbers) scores of male and female in experimental and control groups
Sessions Pre-test Post-test Groups Gender
Mean S.D Mean S.D
Change/ gain
Male 3.73 0.88 3.91 1.07 0.18
Female 3.82 0.67 4.07 1.05 0.25 Control Total 3.78 0.76 4.00 1.05 0.22 Male 4.68 0.61 4.54 0.84
-0.14
Female 4.41 0.80 4.64 0.58 0.23 Experimental Total 4.56 0.71 4.58 0.73 0.02 Male 4.26 0.88 4.26 0.99
0.00
Female 4.08 0.78 4.32 0.91 0.24 Overall Total 4.17 0.83 4.29 0.95 0.12

141
In the case of Competency numbers, in the pre-test on the whole, irrespective
of the group the total mean pre-scores were 4.17 which increased 4.29. The
gain of 0.12 scores was found to be statistically not significant as observed ‘F’
value of 1.926 was fail to reach significance level criterion. Further when
change in the scores were verified against control and experimental groups
no significant effect was observed as the observed ‘F’ value of 0.872 fail to
reach significant level criterion. Gender wise no significant effect was
observed as observed ‘F’ value of 1.389 failed to reach significance level
criterion. Lastly, the gain in the scores with respect to gender and groups wise
was found to be not significant as observed ‘F’ value of 0.659 fail to reach
significance level criterion.
Table 4.8 (d): Result of repeated measure ANOVA for Mean pre and post- test scores on Competency (Numbers) scores of male and female in experimental and control groups (within and between subject affects)
Source Sum of Squares df Mean
Square F value P value
Within subject effects Change 0.821 1 0.821 1.926 0.168Change * Group 0.372 1 0.372 0.872 0.353Change * Gender 0.592 1 0.592 1.389 0.242Change * Group *Gender 0.281 1 0.281 0.659 0.419
Error (change) 40.907 96 .426 Between subject effects Groups 22.964 1 22.964 24.300 0.000Gender .024 1 .024 0.025 0.875Group * Gender .557 1 .557 0.590 0.444Error 90.719 96 .945
In between subject effects only between experimental and control group
significant difference was observed (F = 24.300; P = 0.000). Gender wise
comparison and interaction between gender and groups were found to be non
significant.
142
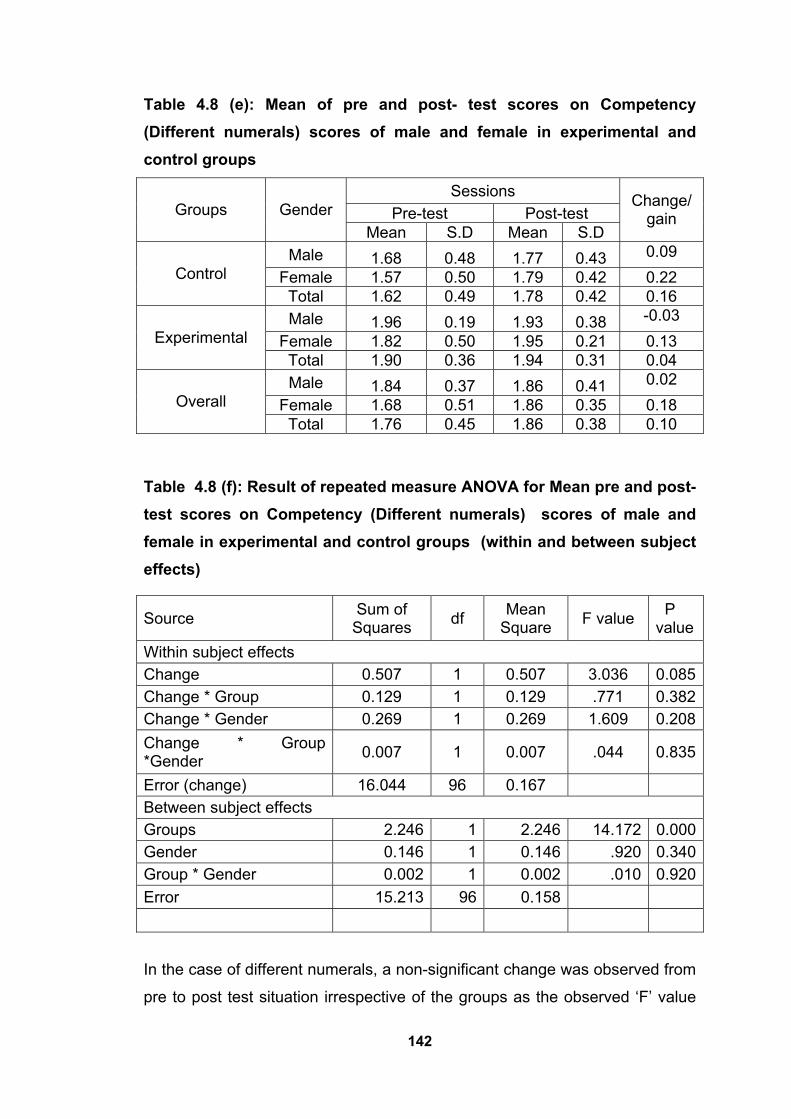
Table 4.8 (e): Mean of pre and post- test scores on Competency (Different numerals) scores of male and female in experimental and control groups
Sessions Pre-test Post-test Groups Gender
Mean S.D Mean S.D
Change/ gain
Male 1.68 0.48 1.77 0.43 0.09 Female 1.57 0.50 1.79 0.42 0.22 Control Total 1.62 0.49 1.78 0.42 0.16 Male 1.96 0.19 1.93 0.38 -0.03
Female 1.82 0.50 1.95 0.21 0.13 Experimental Total 1.90 0.36 1.94 0.31 0.04 Male 1.84 0.37 1.86 0.41 0.02
Female 1.68 0.51 1.86 0.35 0.18 Overall Total 1.76 0.45 1.86 0.38 0.10
Table 4.8 (f): Result of repeated measure ANOVA for Mean pre and post- test scores on Competency (Different numerals) scores of male and female in experimental and control groups (within and between subject effects)
Source Sum of Squares df Mean
Square F value P value
Within subject effects Change 0.507 1 0.507 3.036 0.085Change * Group 0.129 1 0.129 .771 0.382Change * Gender 0.269 1 0.269 1.609 0.208Change * Group *Gender 0.007 1 0.007 .044 0.835
Error (change) 16.044 96 0.167 Between subject effects Groups 2.246 1 2.246 14.172 0.000Gender 0.146 1 0.146 .920 0.340Group * Gender 0.002 1 0.002 .010 0.920Error 15.213 96 0.158
In the case of different numerals, a non-significant change was observed from
pre to post test situation irrespective of the groups as the observed ‘F’ value

143
of 3.036 fail to reach significance level criterion. A change of 0.10 scores was
observed from pre to post test situation. Further when change in the scores
were verified against control and experimental groups, again a non- significant
change was observed as the observed ‘F’ value of 0.771 fail to reach
significant level criterion. Gender wise also no significant effect was observed
as observed ‘F’ value of 1.609 fail to reach significance level criterion. Lastly
the gain in the scores with respect to gender and groups wise was found to be
no significant as observed ‘F’ value of 0.044 fail to reach significance level
criterion. In between subject effects only between experimental and control
group significant difference was observed (f = 14.172; p = 0.000). Gender
wise comparison and interaction between gender and groups were found to
be non significant.
Table 4.8 (g): Mean of pre and post- test scores on Competency (Fundamental operations) scores of male and female in experimental and control groups
Sessions Pre-test Post-test Groups Gender
Mean S.D Mean S.D
Change/ gain
Male 1.64 0.58 2.23 1.11 0.59 Female 1.82 0.77 2.18 1.09 0.36 Control Total 1.74 0.69 2.20 1.09 0.46 Male 1.57 1.17 3.00 0.61 1.43
Female 1.73 0.99 2.41 0.85 0.68 Experimental Total 1.64 1.08 2.74 0.78 1.10 Male 1.60 0.95 2.66 0.94 1.06
Female 1.78 0.86 2.28 0.99 0.50 Overall Total 1.69 0.91 2.47 0.98 0.78

144
Table 4.8 (h): Result of repeated measure ANOVA for Mean pre and post- test scores on Competency (Fundamental operations) scores of male and female in experimental and control groups (within and between subject affects)
Source Sum of Squares df Mean
Square F value P value
Within subject effects Change 28.811 1 28.811 38.581 0.000Change * Group 4.161 1 4.161 5.572 0.020Change * Gender 2.961 1 2.961 3.965 0.049Change * Group *Gender 0.811 1 0.811 1.085 0.300
Error (change) 71.688 96 0.747 Between subject effects Groups 2.195 1 2.195 2.290 0.134Gender 0.275 1 .275 0.287 0.594Group * Gender 1.006 1 1.006 1.049 0.308Error 92.019 96 0.959
In the case of fundamental operation competency on the pretest on the whole
irrespective of the group the total mean pre-scores were 1.69 which increased
2.47. The gain of 0.78 scores was found to be statistically significant where as
observed ‘F’ value of 38.581 was found to be significant at 0.000 level.
Further when change in the scores were verified against control and
experimental groups again we find a significant ‘F’ value of 5.572 (p = 0.020)
was found to be highly significant. From the mean values and gain scores it is
clear that the control group has gained a mean total of 0.46 scores (pre =
1.74; post = 2.20) where as experimental group has gained 0.90 scores (pre =
1.64; post = 2.74). The substantial gain by experimental group can be
attributed for effectiveness of diagnostic based remediation programmes. The
interaction between Gender and group was also found to be significant with
respect as the observed ‘F’ value of 3.965 was found to be significant at .049
level. We find that male subjects of experimental group gained maximum
compared to other groups. Lastly the gain in the scores with respect to
gender and groups wise was found to be non- significant as the observed ‘F’
value of 1.085 fail to reach significance level criterion. In between subject
effects only between experimental and control group, gender wise comparison
and interaction between gender and groups were found to be non significant
(Fig. 4.8 (ii)).

145
Figure 4.8 (ii): Mean pre and post test scores of experimental and control groups on Competency (Fundamental operations)
Table 4.8 (i): Mean pre and post- test scores on Competency (Fractions, decimals and percentages) scores of male and female in experimental and control groups
Sessions
Pre-test Post-test Groups Gender
Mean S.D Mean S.D
Change/ gain
Male 2.41 0.85 1.77 1.11
-0.64
Female 2.68 0.72 1.75 0.84 -0.93 Control
Total 2.56 0.79 1.76 0.96 -0.80
Male 1.50 0.84 2.96 0.79
1.46
Female 1.64 0.79 3.23 0.69 1.59 Experimental
Total 1.56 0.81 3.08 0.75 1.52
Male 1.90 0.95 2.44 1.11
0.54
Female 2.22 0.91 2.40 1.07 0.18 Overall
Total 2.06 0.94 2.42 1.08 0.36
146
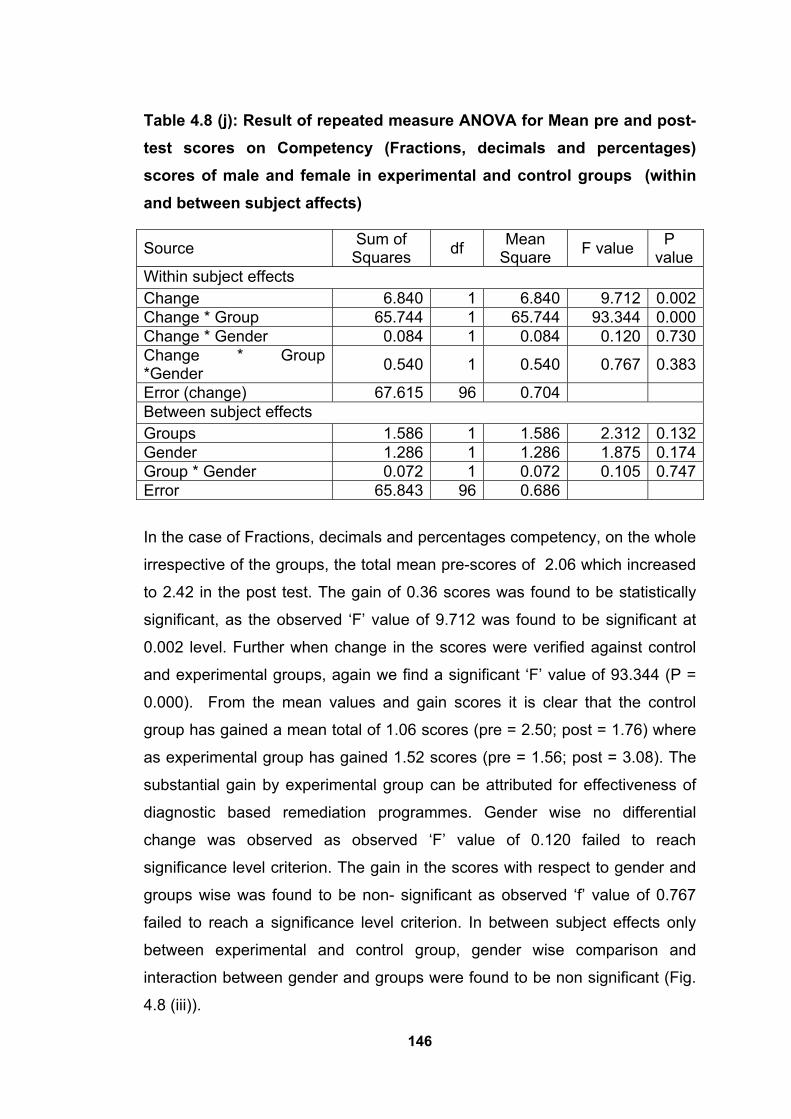
Table 4.8 (j): Result of repeated measure ANOVA for Mean pre and post- test scores on Competency (Fractions, decimals and percentages) scores of male and female in experimental and control groups (within and between subject affects)
Source Sum of Squares df Mean
Square F value P value
Within subject effects Change 6.840 1 6.840 9.712 0.002Change * Group 65.744 1 65.744 93.344 0.000Change * Gender 0.084 1 0.084 0.120 0.730Change * Group *Gender 0.540 1 0.540 0.767 0.383
Error (change) 67.615 96 0.704 Between subject effects Groups 1.586 1 1.586 2.312 0.132Gender 1.286 1 1.286 1.875 0.174Group * Gender 0.072 1 0.072 0.105 0.747Error 65.843 96 0.686
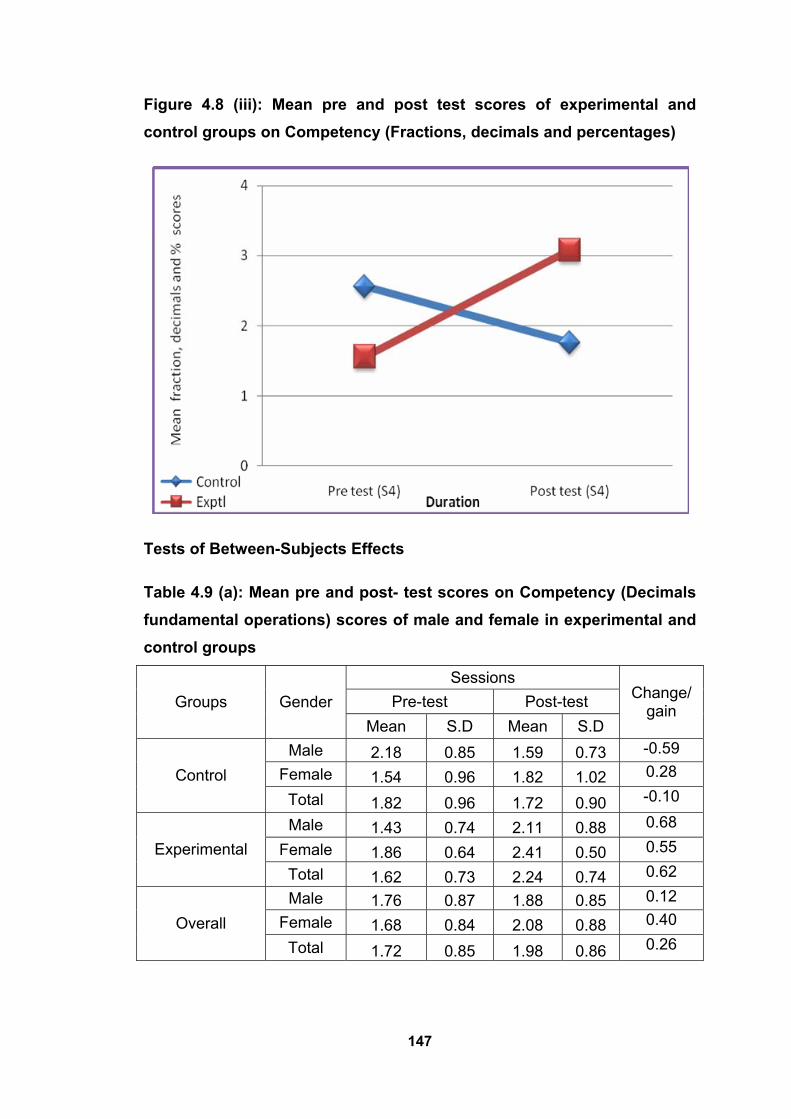
In the case of Fractions, decimals and percentages competency, on the whole
irrespective of the groups, the total mean pre-scores of 2.06 which increased
to 2.42 in the post test. The gain of 0.36 scores was found to be statistically
significant, as the observed ‘F’ value of 9.712 was found to be significant at
0.002 level. Further when change in the scores were verified against control
and experimental groups, again we find a significant ‘F’ value of 93.344 (P =
0.000). From the mean values and gain scores it is clear that the control
group has gained a mean total of 1.06 scores (pre = 2.50; post = 1.76) where
as experimental group has gained 1.52 scores (pre = 1.56; post = 3.08). The
substantial gain by experimental group can be attributed for effectiveness of
diagnostic based remediation programmes. Gender wise no differential
change was observed as observed ‘F’ value of 0.120 failed to reach
significance level criterion. The gain in the scores with respect to gender and
groups wise was found to be non- significant as observed ‘f’ value of 0.767
failed to reach a significance level criterion. In between subject effects only
between experimental and control group, gender wise comparison and
interaction between gender and groups were found to be non significant (Fig.
4.8 (iii)).
147
Figure 4.8 (iii): Mean pre and post test scores of experimental and control groups on Competency (Fractions, decimals and percentages)
Tests of Between-Subjects Effects
Table 4.9 (a): Mean pre and post- test scores on Competency (Decimals fundamental operations) scores of male and female in experimental and control groups
Sessions Pre-test Post-test Groups Gender
Mean S.D Mean S.D
Change/ gain
Male 2.18 0.85 1.59 0.73 -0.59 Female 1.54 0.96 1.82 1.02 0.28 Control Total 1.82 0.96 1.72 0.90 -0.10
Male 1.43 0.74 2.11 0.88 0.68
Female 1.86 0.64 2.41 0.50 0.55 Experimental Total 1.62 0.73 2.24 0.74 0.62
Male 1.76 0.87 1.88 0.85 0.12 Female 1.68 0.84 2.08 0.88 0.40 Overall Total 1.72 0.85 1.98 0.86 0.26

148
Table 4.9 (b): Result of repeated measure ANOVA for Mean pre and post- test scores on Competency (Decimals fundamental operations) scores of male and female in experimental and control groups (within and between subject affects)
Source Sum of Squares df Mean
Square F value P value
Within subject effects Change 2.600 1 2.600 6.045 0.016Change * Group 7.203 1 7.203 16.743 0.000Change * Gender 1.703 1 1.703 3.958 0.049Change * Group *Gender 3.140 1 3.140 7.300 0.008
Error (change) 41.297 96 0.430 Between subject effects Groups 1.418 1 1.418 1.550 0.216Gender 0.318 1 0.318 0.348 0.557Group * Gender 4.092 1 4.092 4.473 0.037Error 87.810 96 0.915
In the case of decimals fundamental operation competency, on the whole
irrespective of the group the total mean pre-scores were 1.72 which increased
to 1.98. The gain of 0.26 scores was found to be statistically significant as the
observed ‘F’ value of 6.045 was found to be significant at 0.016 level. Further
when change in the scores were verified against control and experimental
groups again we find a significant ‘F’ value of 16.743 (P = 0.000). From the
mean values and gain scores it is clear that the control group has gained a
mean total of 0.16 scores (pre = 1.82; post = 1.72) where as experimental
group has gained 0.62 scores (pre = 1.62; post = 2.24). The substantial gain
by experimental group can be attributed for effectiveness of diagnostic based
remediation programmes. The interaction between Gender group was also
found to be significant with respect to change as observed ‘F’ value of 3.958 (
P=0.049) .The scores where as it was found that male students gained
maximum (mean gain = 0.68) scores (pre = 1.43 ; post = 2.11) where gain in
female subjects gained least(mean gain = 0.55) scores (pre = 1.86 ; post =
2.41). The gain in the scores with respect to gender and groups was found to
be significant (F = 7.300; P = 0.008) where we find that male students of
experimental group have gained maximum (mean gain = 0.68) and males in

149
the control group gained least (mean gain = 0.59). In between subject effects
only between experimental and control group, gender wise comparison and
interaction between gender and groups were found to be non significant
(Fig.4.9 (i)).
Figure 4.9 (i): Mean of pre and post test scores of experimental and control groups on Competency (decimals fundamental operation)
Table 4.9 (c): Mean pre and post- test scores on Competency (Decimals, additions subtraction with mixed operations) scores of male and female in experimental and control groups
Sessions
Pre-test Post-test Groups Gender
Mean S.D Mean S.D
Change/ gain
Male 1.68 1.00 1.68 0.72 0.00
Female 1.68 0.98 1.82 0.98 0.14 Control
Total 1.68 0.98 1.76 0.87 0.08
Male 1.00 0.72 2.14 0.85 1.14
Female 1.32 0.65 2.23 0.61 0.91 Experimental
Total 1.14 0.70 2.18 0.75 1.04
Male 1.30 0.91 1.94 0.82 0.64
Female 1.52 0.86 2.00 0.86 0.48 Overall
Total 1.41 0.89 1.97 0.83 0.56
150
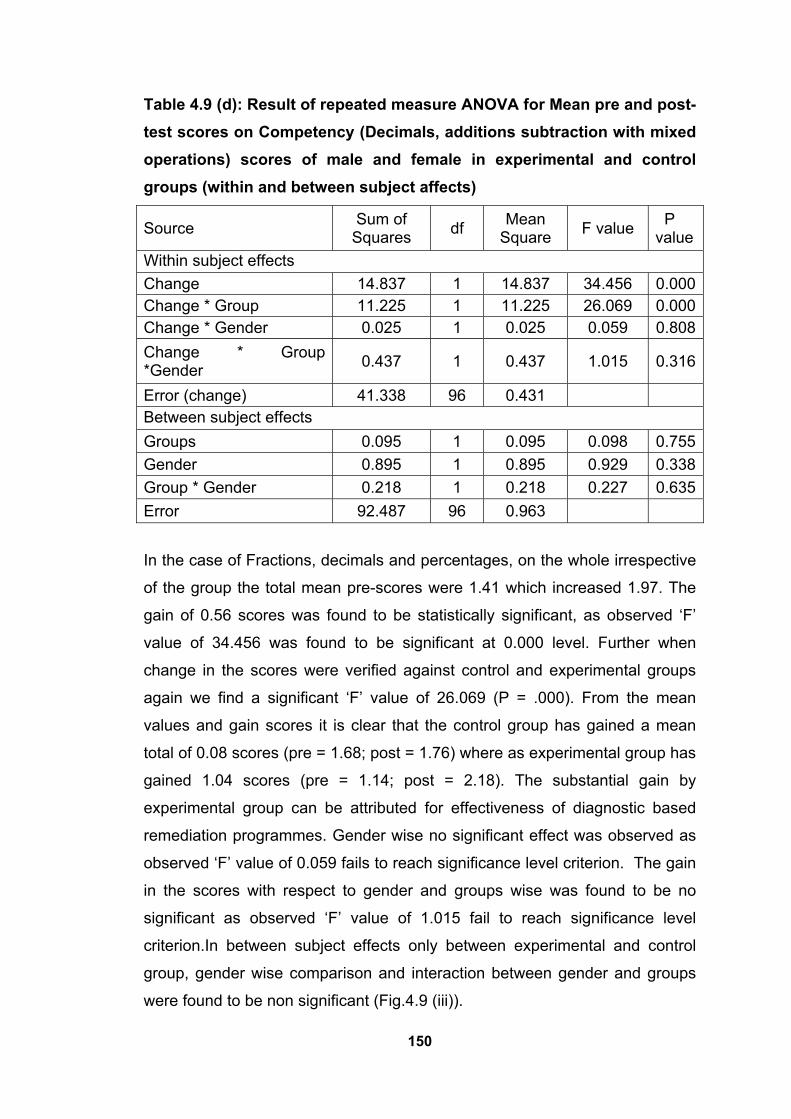
Table 4.9 (d): Result of repeated measure ANOVA for Mean pre and post- test scores on Competency (Decimals, additions subtraction with mixed operations) scores of male and female in experimental and control groups (within and between subject affects)
Source Sum of Squares df Mean
Square F value P value
Within subject effects Change 14.837 1 14.837 34.456 0.000Change * Group 11.225 1 11.225 26.069 0.000Change * Gender 0.025 1 0.025 0.059 0.808Change * Group *Gender 0.437 1 0.437 1.015 0.316
Error (change) 41.338 96 0.431 Between subject effects Groups 0.095 1 0.095 0.098 0.755Gender 0.895 1 0.895 0.929 0.338Group * Gender 0.218 1 0.218 0.227 0.635Error 92.487 96 0.963
In the case of Fractions, decimals and percentages, on the whole irrespective
of the group the total mean pre-scores were 1.41 which increased 1.97. The
gain of 0.56 scores was found to be statistically significant, as observed ‘F’
value of 34.456 was found to be significant at 0.000 level. Further when
change in the scores were verified against control and experimental groups
again we find a significant ‘F’ value of 26.069 (P = .000). From the mean
values and gain scores it is clear that the control group has gained a mean
total of 0.08 scores (pre = 1.68; post = 1.76) where as experimental group has
gained 1.04 scores (pre = 1.14; post = 2.18). The substantial gain by
experimental group can be attributed for effectiveness of diagnostic based
remediation programmes. Gender wise no significant effect was observed as
observed ‘F’ value of 0.059 fails to reach significance level criterion. The gain
in the scores with respect to gender and groups wise was found to be no
significant as observed ‘F’ value of 1.015 fail to reach significance level
criterion.In between subject effects only between experimental and control
group, gender wise comparison and interaction between gender and groups
were found to be non significant (Fig.4.9 (iii)).
151
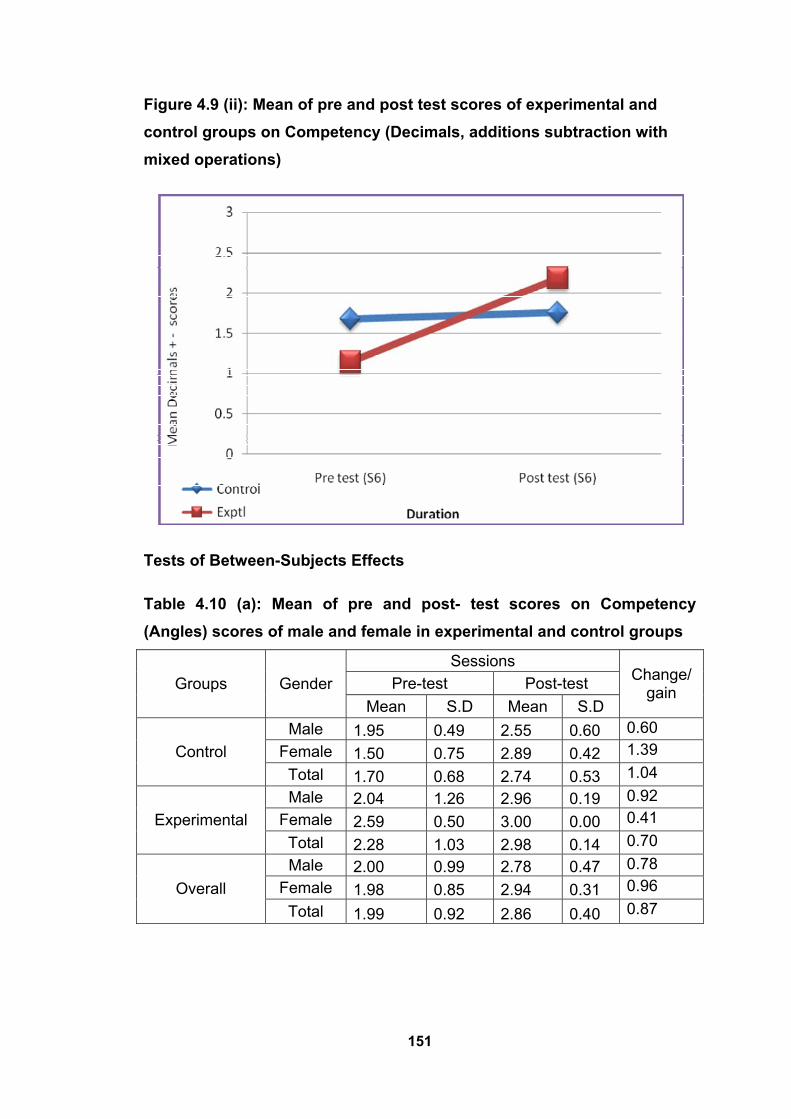
Figure 4.9 (ii): Mean of pre and post test scores of experimental and control groups on Competency (Decimals, additions subtraction with mixed operations)
Tests of Between-Subjects Effects
Table 4.10 (a): Mean of pre and post- test scores on Competency (Angles) scores of male and female in experimental and control groups
Sessions Pre-test Post-test Groups Gender
Mean S.D Mean S.D
Change/ gain
Male 1.95 0.49 2.55 0.60 0.60 Female 1.50 0.75 2.89 0.42 1.39 Control Total 1.70 0.68 2.74 0.53 1.04 Male 2.04 1.26 2.96 0.19 0.92
Female 2.59 0.50 3.00 0.00 0.41 Experimental Total 2.28 1.03 2.98 0.14 0.70 Male 2.00 0.99 2.78 0.47 0.78
Female 1.98 0.85 2.94 0.31 0.96 Overall Total 1.99 0.92 2.86 0.40 0.87
152
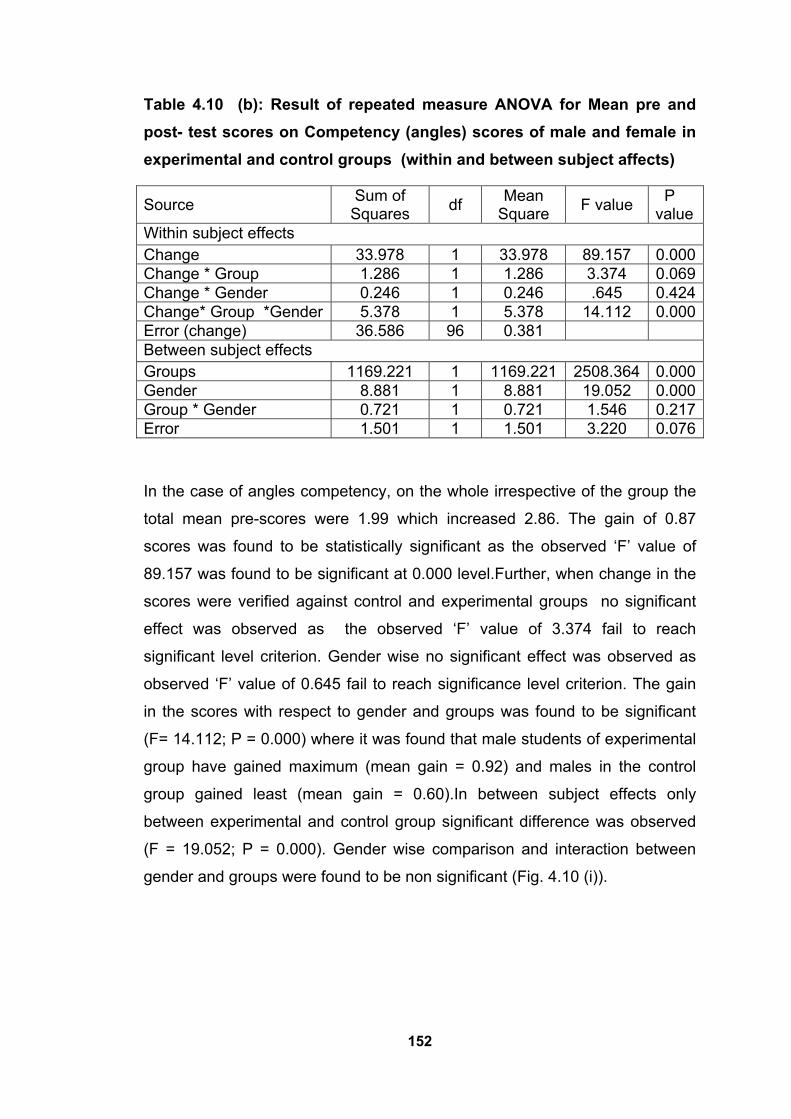
Table 4.10 (b): Result of repeated measure ANOVA for Mean pre and post- test scores on Competency (angles) scores of male and female in experimental and control groups (within and between subject affects)
Source Sum of Squares df Mean
Square F value P value
Within subject effects Change 33.978 1 33.978 89.157 0.000Change * Group 1.286 1 1.286 3.374 0.069Change * Gender 0.246 1 0.246 .645 0.424Change* Group *Gender 5.378 1 5.378 14.112 0.000Error (change) 36.586 96 0.381 Between subject effects Groups 1169.221 1 1169.221 2508.364 0.000Gender 8.881 1 8.881 19.052 0.000Group * Gender 0.721 1 0.721 1.546 0.217Error 1.501 1 1.501 3.220 0.076
In the case of angles competency, on the whole irrespective of the group the
total mean pre-scores were 1.99 which increased 2.86. The gain of 0.87
scores was found to be statistically significant as the observed ‘F’ value of
89.157 was found to be significant at 0.000 level.Further, when change in the
scores were verified against control and experimental groups no significant
effect was observed as the observed ‘F’ value of 3.374 fail to reach
significant level criterion. Gender wise no significant effect was observed as
observed ‘F’ value of 0.645 fail to reach significance level criterion. The gain
in the scores with respect to gender and groups was found to be significant
(F= 14.112; P = 0.000) where it was found that male students of experimental
group have gained maximum (mean gain = 0.92) and males in the control
group gained least (mean gain = 0.60).In between subject effects only
between experimental and control group significant difference was observed
(F = 19.052; P = 0.000). Gender wise comparison and interaction between
gender and groups were found to be non significant (Fig. 4.10 (i)).

153
Figure 4.10 (i): Mean pre and post test scores of experimental and control groups on Competency (Angles)
Table 4.10 (c): Distribution of the sample by groups and mastery level (total scores) in the post test and the results of contingency coefficient test
Groups Mastery level Control Experimental Total
Frequency 38 13 51 Non-masters percent 76.0% 26.0% 51.0%
Frequency 12 37 49 Masters percent 24.0% 74.0% 49.0%
Frequency 50 50 100 Total percent 100.0% 100.0% 100.0%
Contingency Coefficient=.447; P=0.000 (S) In the case of total seven(overall) competencies, both in experimental and
control groups there were 100 non masters (50 each) in the pretext after the
remediation program when the posttest was applied, we find that in
experimental group out of 50 non masters 37 became masters (74%) as
against only 12 in the control group became masters (24%). When
contingency coefficient tests were applied for mastery level and groups

154
contingency coefficient of 0.447 was found to be significant at 0.000 level. In
other words in comparison with control group 50 % of the experimental group
became masters that can be attributed to effectiveness of diagnosed based
remediation programme (Fig. 4.10 (ii)).
Figure 4.10 (ii): Distribution of the sample by groups and mastery level (total scores) level in the post test
Table 4.10 (d): Distribution of the sample by groups and mastery level (Numbers) in the post test and the results of contingency coefficient test
Groups Mastery level
Control Experimental Total Frequency 11 5 16Non-masters
percent 22.0% 10.0% 16.0%Frequency 39 45 84Masters
percent 78.0% 90.0% 84.0%Frequency 50 50 100Total
percent 100.0% 100.0% 100.0%
Contingency Coefficient=. 162; P=.102(NS)

155
In the case of Numbers competency, contingency coefficient test revealed a
non- significant association between mastery level and groups, where, after
the post test irrespective of the groups we find 84 out of 100 became masters
and this trend was found to be similar for both experimental and control group
(90% and 78% respectively). However comparatively we can see more
number of students became masters in the experimental group than control
group.
Table 4.10 (e): Distribution of the sample by groups and mastery level (Different Numerals) in the post test and the results of contingency coefficient test
Groups Mastery level
Control Experimental Total Frequency 11 2 13Non-masters
percent 22.0% 4.0% 13.0%Frequency 39 48 87Masters
percent 78.0% 96.0% 87.0%Frequency 50 50 100Total
percent 100.0% 100.0% 100.0%
Contingency Coefficient=. .259; P=. 007 (S)
In the case of different numerals competency, both in experimental and
control groups there were 100 non masters (50 each) in the pretest. After the
remediation program when the posttest was applied, we find that in
experimental group out of 50 non masters, 48 became masters (96%) as
against only 39 in the control group became masters (78%). When
contingency coefficient tests were applied for mastery level and groups,
contingency coefficient of 0.259 was found to be significant at 0.007 level. In
other words in comparison with control group 18 % of the experimental group
became masters that can be attributed to effectiveness of diagnosed based
remediation programme over different numerals (Fig. 4.10 (iii)).
156
Figure 4.10 (iii): Distribution of the sample by groups and mastery level (Different Numerals) level in the post test
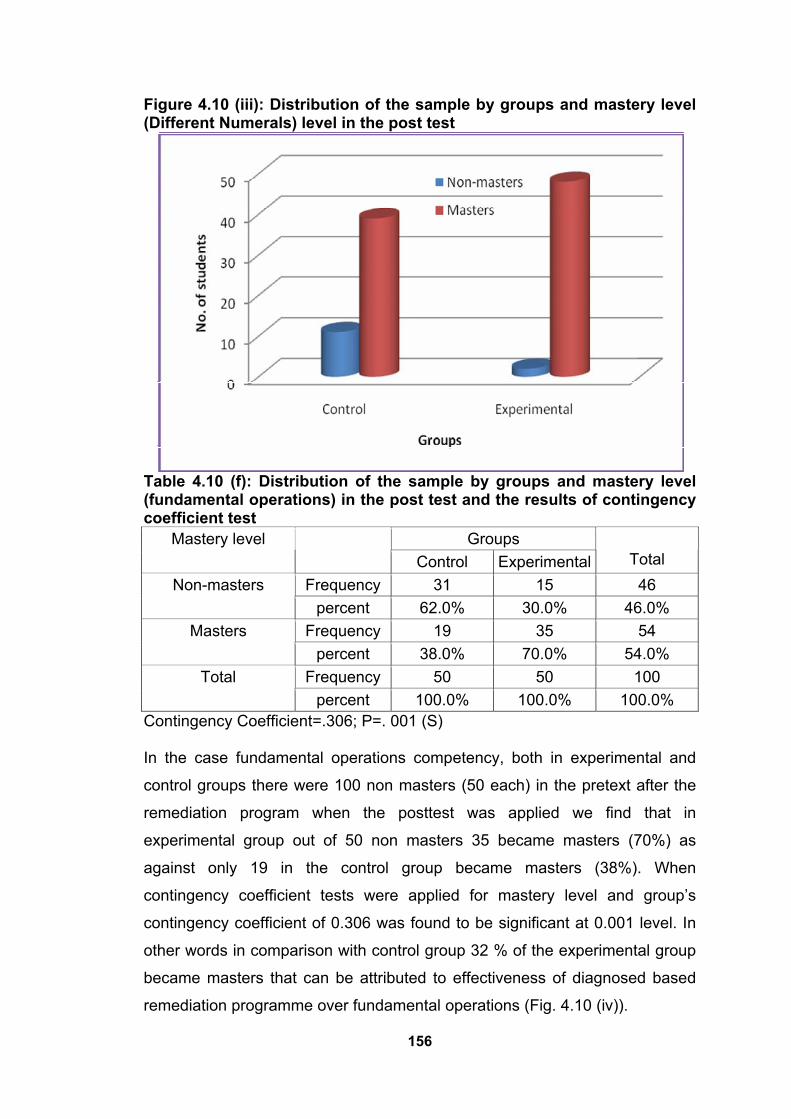
Table 4.10 (f): Distribution of the sample by groups and mastery level (fundamental operations) in the post test and the results of contingency coefficient test
Groups Mastery level Control Experimental Total
Frequency 31 15 46 Non-masters percent 62.0% 30.0% 46.0%
Frequency 19 35 54 Masters percent 38.0% 70.0% 54.0%
Frequency 50 50 100 Total percent 100.0% 100.0% 100.0%
Contingency Coefficient=.306; P=. 001 (S)
In the case fundamental operations competency, both in experimental and
control groups there were 100 non masters (50 each) in the pretext after the
remediation program when the posttest was applied we find that in
experimental group out of 50 non masters 35 became masters (70%) as
against only 19 in the control group became masters (38%). When
contingency coefficient tests were applied for mastery level and group’s
contingency coefficient of 0.306 was found to be significant at 0.001 level. In
other words in comparison with control group 32 % of the experimental group
became masters that can be attributed to effectiveness of diagnosed based
remediation programme over fundamental operations (Fig. 4.10 (iv)).

157
Figure 4.10 (iv): Distribution of the sample by groups and mastery level (fundamental operations) level in the post test
Table 4.10 (g): Distribution of the sample by groups and mastery level (Fractions, decimals and percentage) in the post test and the results of contingency coefficient test
Groups Mastery level
Control Experimental Total Frequency 40 10 50 Non-masters
percent 80.0% 20.0% 50.0% Frequency 10 40 50 Masters
percent 20.0% 80.0% 50.0% Frequency 50 50 100 Total
percent 100.0% 100.0% 100.0%
Contingency Coefficient=. 514; P=0.000 (S)
In the case Fractions, decimals and percentage competency, both in
experimental and control groups there were 100 non masters (50 each) in the
pretext after the remediation program, when the posttest was applied we find
that in experimental group out of 50 non masters 40 became masters (80%),
as against only 10 in the control group became masters (20%). When
contingency coefficient tests were applied for mastery level and groups
158
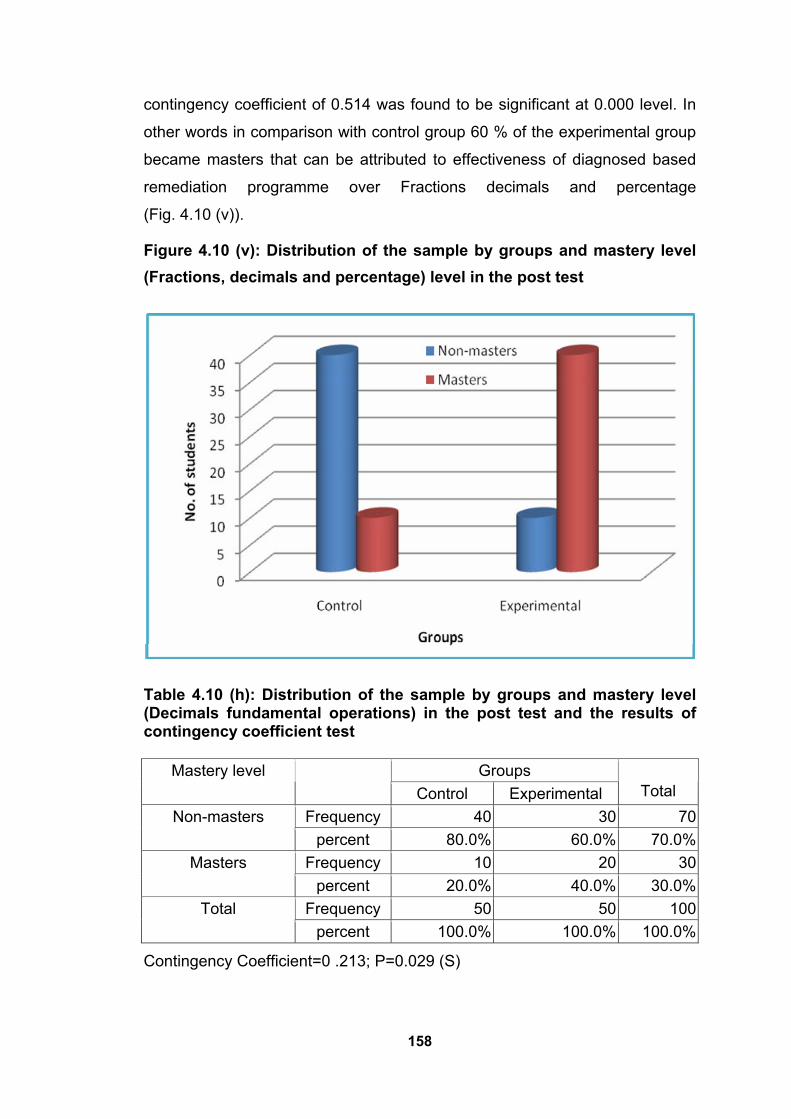
contingency coefficient of 0.514 was found to be significant at 0.000 level. In
other words in comparison with control group 60 % of the experimental group
became masters that can be attributed to effectiveness of diagnosed based
remediation programme over Fractions decimals and percentage
(Fig. 4.10 (v)).
Figure 4.10 (v): Distribution of the sample by groups and mastery level (Fractions, decimals and percentage) level in the post test
Table 4.10 (h): Distribution of the sample by groups and mastery level (Decimals fundamental operations) in the post test and the results of contingency coefficient test
Groups Mastery level Control Experimental Total
Frequency 40 30 70Non-masters percent 80.0% 60.0% 70.0%
Frequency 10 20 30Masters percent 20.0% 40.0% 30.0%
Frequency 50 50 100Total percent 100.0% 100.0% 100.0%
Contingency Coefficient=0 .213; P=0.029 (S)

159
In the case competency 5 (Decimals fundamental operations), both in
experimental and control groups there were 100 non masters (50 each) in the
pretest. After the remediation program, when the posttest was applied we find
that in experimental group, out of 50 non masters 20 became masters (40%)
as against only 10 in the control group became masters (20%). When
contingency coefficient tests were applied for mastery level and groups
contingency coefficient of 0.213 was found to be significant at 0.029 level. In
other words in comparison with control group 20 % of the experimental group
became masters that can be attributed to effectiveness of diagnosed based
remediation programme over Decimals fundamental operations
(Fig. 4.10 (vi)).
Figure 4.10 (vi): Distribution of the sample by groups and mastery level (Decimals fundamental operations) level in the post test
Table 4.10 (i): Distribution of the sample by groups and mastery level (Decimals addition and subtraction with mixed operations) in the post test and the results of contingency coefficient test
Groups Mastery level Control Experimental Total
Frequency 40 32 72Non-masters Percent 80.0% 64.0% 72.0%
Frequency 10 18 28Masters Percent 20.0% 36.0% 28.0%
Frequency 50 50 100Total Percent 100.0% 100.0% 100.0%
Contingency Coefficient=0 .175; P=0.075 (NS)

160
In the case of Decimals addition and subtraction with mixed operations
competency, contingency coefficient test revealed a non-significant
association between mastery level and groups, where, after the post test
irrespective of the groups we find 28 out of 100 became masters and this
trend was found to be similar for both experimental and control group (36%
and 20%) respectively. However comparatively we can see more number of
students became masters in the experimental group than control group.
Table 4.10 (j): Distribution of the sample by groups and mastery level (angles) in the post test and the results of contingency coefficient test
Groups Mastery level
Control Experimental Total Frequency 11 1 12Non-masters
percent 22.0% 2.0% 12.0%Frequency 39 49 88Masters
percent 78.0% 98.0% 88.0%Frequency 50 50 100Total
percent 100.0% 100.0% 100.0%
Contingency Coefficient=0 .294; P=0.002 (S)
In the case angles competency, both in experimental and control groups there
were 100 non masters (50 each) in the pretest. After the remediation program
when the posttest was applied, we find that in experimental group out of 50
non-masters 49 became masters (98%) as against only 39 in the control
group became masters (78%). When contingency coefficient tests were
applied for mastery level and groups’ contingency coefficient of 0.294 was
found to be significant at 0.002 level. In other words in comparison with
control group 20 % of the experimental group became masters that can be
attributed to effectiveness of diagnosed based remediation programme over
angles (Fig. 4.10 (vii)).

161
Figure 4.10 (vii): Distribution of the sample by groups and mastery level (angles) level in the post-test
Table 4.10 (k): Distribution of the sample by groups and mastery level of overall competencies in the post-test and the results of rank difference
Maximum masters converted in competency 4 (Fractions, decimals and
percentage) followed by competency 3 (fundamental operations), competency
5 (Decimals fundamental operations), competency 2 (different numerals),
competency 6 (Decimals addition and subtraction with mixed operations),
competency 1 (Numbers), competency 7 (angles) respectively.
In the pretest on the whole irrespective of the group the total mean pre-scores
were 14.77 which was increased 17.85. The gain of 3.08 scores was found to
be statistically significant. Further, experimental group has gained 5.10 scores
(pre=14.64; post= 19.74) compared to control group, which has gained a low
c Ctrl Exptl Diff Rank 1 78 90 12 6 2 78 96 18 4 3 38 70 32 2 4 20 80 60 1 5 20 40 20 3 6 20 36 16 5 7 39 49 10 7

162
mean of 1.06 scores (pre=14.9; post=15.96). The substantial gain by
experimental group over control group can be attributed for effectiveness of
diagnostic based remediation programmes. Hence hypothesis 6 formulated
as “There is no significant difference between control and experimental group
in the effect of diagnosis-based remediation programme in improving the
proportionate of students mastering each competency (percentage of
competency mastered) by the group of V standard students in the selected
(experimental) schools of Shimoga District’ is rejected.
Several studies have been conducted in India and abroad relating to the
effectiveness of various strategies of teaching mathematics and remedial
programmes designed in many ways by researchers. Gusky and Gates
(1986) surveyed 46 research studies relating to the effectiveness of blooms
mastery learning approach and found that in most of the studies mastery
learning approach was beneficial. It is significant to note the positive effects of
this approach were more in language and arts than in mathematics and
science. Airasian (1967) and Colins (1969) found that the mastery learning
approach was better than conventional method of teaching. Similarly Reese
(1976) reported positive effectiveness of remedial teaching over conventional
teaching in learning algebra. Block (1970), Reed (1993), Kersh (1990),
Meverrech (1986), Kulik et. al. (1990) have reported beneficial effects of
mastery in learning approach on learning mathematics.
In India also several studies have been conducted on the effectiveness of
several kinds of intervention programmes. Archana Srivastava (2004) showed
better achievement level was observed on the part of students with
mathematical disability after teaching them with the help of remedial
programme. Sullivan (1987) found in his study that students who were thought
through mastery learning method scored significantly higher in mathematics
than students taught through traditional method. Kumar, Surinder, Susma
and Harizuka (1996) found significant difference between experimental and
control groups after teaching mathematics through cooperative learning. They
found positive interaction among students. Amruthavalli Devi (2008) studied
the effectiveness of strategy of teaching mathematics developed by her based

163
on Piaget and Vigotski’s views. She found significant difference between
pretest and posttest scores in all the four variables studied namely
mathematical thinking, creative thinking, intelligence and mathematics
achievement. The above studies have shown positive effect of well designed
intervention programme (including remedial programmes and new teaching
strategies like discovery method, cooperative teaching, etc). Rastogi (1983)
attempted a study on diagnosis of weaknesses in arithmetic as related to the
basic arithmetic skills and their remedial measures and he revealed that basic
arithmetic skills could very quickly and conveniently be mastered through the
course of self-help in basic arithmetic skills as developed during the study.
Vyas (1983) attempted a study on development of symbol picture logic
programme and to study its effect on mathematics achievement the students
of the experimental group who were given a treatment of the SPLP showed
better achievement in mathematics than the control group students. Yadav
(1984) found that after the experimental treatment, the experimental group of
pupils exhibited a significantly higher achievement in mathematics than the
control group of pupils and higher gain scores of achievement in mathematics
and different percentile achievement scores of the experimental group of
pupils were found to be significantly higher than those of the control group of
pupils at post-test stage. Das and Barua (1986) studied on effect of remedial
teaching in arithmetic among grade IV pupils and they revealed that the major
conclusion of the study was that remedial teaching had definitely improved
significantly the achievements in arithmetic. Dutta (1986) attempted on
learning disabilities in the reasoning power of the students in geometry-
diagnosis and prevention and he found that the experimental groups taught by
audio-visual materials and techniques achieved significantly more than the
controlled groups taught by conventional methods.
However, some of the studies indicated non-effectiveness of intervention
programmes. Kirikire (1981) studied the impact of objective based lesson
plans on the class room verbal interaction of behaviour but he did not find any
significant effect. Wagh S K (1981) developed a multimedia instructional
system for remedial teaching about fractional numbers but did not find
significant difference in the achievement of the experimental and control

164
groups. Multimedia system and traditional system both were effective to the
same extent. Elfar (1982) evaluated two procedures – diagnostic and
prescriptive in terns of proportion of students achieving mastery level in
learning algebra but he did not find any significant difference between these
two procedures. But he found significant difference between the two
experimental groups (treatment 1 and 2) and the control group.
In the present study also the experimental group gained significantly higher
competencies in total scores than the control group, Male students of
experimental group gained most but if we analyze competency wise the
experimental group significantly gained more than the control group in
competencies ”fundamental operations“, “fractions, decimals and
percentages”, “decimal fundamental operations” and “decimals addition
subtraction with mixed operation”. In other competencies like “numbers”,
“different numerals” and “angles” the gain of the experimental group was
moderately observed over the control group. So it indicates that the remedial
teaching programme with reference to these competencies needs to be
revised and strengthened. It is significant to note that the male students
gained more than the female students in competencies like “fundamental
operations”, “decimal fundamental operations” and “angles” and in total
competency scores. So in conclusion it may be said that the effect of remedial
programme was not uniform across the competencies in mathematics and it
needs to be further modified.
Let us return to the classroom and try to gain insight by seeing how these
ideas work out in a school setting. If we consider our example of the teaching
of fractions, a subject is thought to be difficult for most children to apprehend
because the material is "so abstract." Indeed fractions are an appropriate
example for study, since one of the primary difficulties in understanding
fractions is in grasping that the fraction expresses a relationship between a
part and a whole (e.g., Harel, 1988). The difficulty lies in the child's confusion
about what the whole is, the very same difficulty we encountered when trying
to define concrete. The traditional approach to teaching the manipulation of
fractions is to give rules for each operation, rules such as "to add fractions,

165
make a common denominator," "to divide fractions, invert and multiply."
These rules are given as if they were definitions: they are supposed to serve
as the meaning of their corresponding operations. They are not connected to
each other, nor to previous knowledge about fractions. Indeed, studies have
shown that, in the case of dividing fractions, no connection is made between
the notion of division in fractions and familiar division of whole numbers (e.g.,
Ball, 1990; Wilensky, 1989). These practices lead to a disconnected knowing,
a knowledge of fractions that can only bear up if one is given problems that
just call for application of these rules. The solution to this problem, however,
is not to avoid abstract objects like fractions, or even to replace rules for
manipulating them with situated practices such as suggested by Lave (1988).
These solutions use the old mistaken notion of concrete, a notion of concrete
as a property of certain objects but not others, in order to restrict the domain
of learning. Rather, we must present multiple representations of fractions,
both sensory (pies, blocks, clocks) and non-sensory (ratios, equivalence
classes, binary relations), and give opportunities for the child to interact with
all of these and establish connections between them. This kind of enrichment
of the relationship between the child and the fraction will make the fraction
concrete for the child and provide a robust and meaningful knowledge of
fractions. By establishing this kind of complex and multifaceted relationship
with the fraction, the child may still not fall in love with fractions as Papert did
with the gears of his childhood (Papert, 1980), but at least fractions will be
brought into the "family" thus enabling a lifelong relationship with them. With
long term use of manipulatives in mathematics, educators have found that
students make gains in the following general areas (Heddens and Piccioto,
1998; Sebesta and Martin, 2004). These areas are verbalizing mathematical
thinking, discussing mathematical ideas and concepts, relating real world
situations to mathematical symbolism, working collaboratively, thinking
divergently to find a variety of ways to solve problems, expression problems
and solutions using a variety of mathematical symbols, making presentations,
taking ownership of their learning experiences, gaining confidence in their
abilities to find solutions to mathematical problems using methods that they
come up with themselves without relying on directions from the teacher.

166
The use of manipulatives helps students hone their mathematical thinking
skills. According to Stein and Bovalino (2001), “Manipulatives can be
important tools in helping students to think and reason in more meaningful
ways. By giving students concrete ways to compare and operate on
quantities, such manipulatives as pattern blocks, tiles and cubes can
contribute to the development of well grounded, interconnected
understandings of mathematical ideas. Studies have shown that students
using manipulatives in specific mathematical subjects are more likely to
achieve success than students who don’t have the opportunity to work with
manipulatives. Following are some specific areas in which research shows
manipulatives are especially helpful: Counting, some children need to use
manipulatives to learn to count (Clements, 1999). Place Value, using
manipulatives increases students’ understanding of place value (Phillips,
1989). Computation, students learning computational skills tend to master and
retain these skills more fully when manipulatives are used as part of their
instruction (Carroll and Porter, 1997). In case of Problem Solving, using
manipulatives has been shown to help students reduce errors and increase
their scores on tests that require them to solve problems (Carroll and Porter,
1997, Clements, 1999, Krac, 1998). In Fractions, students who have
appropriative manipulatives to help them learn fractions outperform students
who rely only on textbooks when tested on these concepts (Jordon, Miller and
Mercer, 1998; Sebesta and Martin, 2004). In case of Ratios/Percentages, students who have appropriate manipulatives to help them learn fractions also
have significantly improved achievement when tested on ratios as compared
to students who do not have exposure to these manipulatives (Jordon, Miller
and Mercer, 1998). Manipulatives have also been shown to provide a strong
foundation for students mastering the following mathematical concepts (The
Access Center, October 1, 2004). They are, namely, Number relations,
Measurement, Decimals, Number bases and Percentages.
Well known math educator Marilyn Burns considered manipulatives essential
for teaching math to students of all levels. She found that manipulatives help
make math concepts accessible to almost all learners, while at the same time
offering ample opportunities to challenge students who catch on quickly to the

167
concepts being taught. Research indicates that using manipulatives is
especially useful for teaching low achievers (Marsh and Cooke, 1996; Ruzic
and O’connell, 2001). Reseach also indicates that using manipulatives helps
improve the environment in math classrooms. When students work with
manipulatives and then are given a chance to reflect on their experiences, not
only is mathematical learning enhanced, but math anxiety is greatly reduced
(Cain-Caston, 1996, Heuser, 2000). Exploring manipulatives, especially self
directed exploration, provides an exciting classroom environment and
promotes in students positive attitude towards learning (Heuser, 1999, Moch,
2001). Among the benefits several researchers found for using manipulatives
was helpful in making the learning fun (Moch, 2001; Smith et.al, 1999).
How do we foster the concretion process? What kind of learning environment
nurtures it and promotes its growth? Clearly, much more research is needed
to explore the many facets of this question. Here we point to only one: the
constructionist paradigm for learning (Harel & Papert, 1990). When we
construct objects in the world, we come into engaged relationship with them
and the knowledge needed for their construction. It is especially likely then
that we will make this knowledge concrete. When Harel's fourth and fifth
graders (Harel, 1988) construct a computer program for representing and
teaching fractions, they have the opportunity to meet and connect multiple
representations of fractions and to construct their own idiosyncratic
relationships with and between them.
The number and math symbol cards facilitate the translation of words to
numbers and symbols. This critical connecting step helps students to bridge
the gap between the concrete and the abstract. This product is designed for
use with partners, in small groups, in centers, or with whole group instruction.
Grouws and Cebulla (2000) stated that long-term use of concrete materials is
positively related to increase mathematics achievement in the report,
“Improving Student Achievement in Mathematics.” This finding suggested that
teachers use manipulative materials in mathematics instruction regularly in
order to provide students hands-on experience that enables them to construct
useful meanings for the mathematical ideas that they are learning. Grouws

168
and Cebulla (2000) found that using small groups of students to work on
activities, problems and assignments can increase student mathematics
achievement. These researchers noted that using whole-class discussion
following individual and group work improves student achievement.
Research reflects the importance of whole-class discussion following student
work on problem-solving activities. Findings indicate that such discussion
following individual and small group work improves student achievement
(Grouws and Cebulla, 2000). The use of multimedia learning environments
may offer ways to overcome these difficulties (Mayer, 2001). In multimedia
learning environments, information presentation can be accomplished by
using different representational formats (textual and pictorial) which maybe
processed in different sensory channels (auditory and visual). Additionally,
information presentation is not restricted to static displays (e.g., diagrams,
pictures, written text), but the representations used can involve changes over
time (e.g., dynamic visualizations, spoken text).
Hodes (1992) compared the effectiveness of imagery instructions and
instructional visuals for fact recall and understanding. Both the instructional
methods were helpful in inducing an imagery strategy and in improving post-
test performance; however, for some performance measures, achievements
due to presenting external visuals were larger than for the imagery
instructions. Ginns, Chandler and Sweller (2003) showed that imagining
procedures (vs. studying text-based materials) was only helpful for learners
possessing sufficiently high prior knowledge in the domain. This replicates
findings of Cooper, Tindall-Ford, Chandler, and Sweller (2001) who found
interactions between domain-specific abilities and the type of instruction
given. For students who can read, most textbooks are not very helpful when it
comes to teaching students how to solve math problems. They typically
provide a four-step formula: (a) read the problem, (b) decide what to do,
(3) compute and (4) check your answer. “Read” the problem for
understanding is the first step. Understanding involves a representation of the
relationship between numbers, words and symbols in the problem. This
representation provides the basis for deciding what to do to solve the

169
problem. From early on, most students acquire the skills and strategies
needed to “read the problem” and “decide what to do” to solve it. Many
students who are nonmasters, however, do not easily acquire these skills and
strategies. Therefore, they need explicit instruction in mathematical problem-
solving skills and strategies to solve problems in their math textbooks and in
their daily lives. Problem types should be introduced beginning with the
easiest problem type, and after mastery, move to the next level of difficulty
(García, Jiménez and Hess, in press, for a taxonomy of the difficulty levels of
the four types of addition and subtraction problems for students with
mathematical difficulties).
Effective visual representations, whether with manipulatives, with paper and
pencil, or in one’s imagination, show the relationships among the problem
parts. These are called schematic representations (van Garderen &
Montague, 2003). Cognitive processes and strategies needed for successful
mathematical problem solving include paraphrasing the problem, which is a
comprehension strategy, hypothesizing or setting a goal and making a plan to
solve the problem, estimating or predicting the outcome, computing or doing
the arithmetic, and checking to make sure the plan was appropriate and the
answer is correct (Montague, 2003; Montague, Warger and Morgan, 2000).
Good problem solvers use a variety of processes and strategies as they read
and represent the problem before they make a plan to solve it (Montague,
2003). Visualizing or drawing a picture or diagram means developing a
schematic representation of the problem so that the picture or image reflects
the relationships among all the important problem parts. Using both verbal
translation and visual representation, good problem solvers not only are
guided toward understanding the problem, but they are also guided toward
developing a plan to solve the problem. This is the point at which students
decide what to do to solve the problem. They have represented the problem
and they are now ready to develop a solution path. They hypothesize by
thinking about logical solutions and the types of operations and number of
steps needed to solve the problem. They may write the operation symbols as
they decide on the most appropriate solution path and the algorithms they

170
need to carry out the plan. They ask themselves if the plan makes sense
given the information they have.
Why is it so difficult to teach students to solve math problems?
Students who are poor mathematical problem solvers, as most students who
are non-masters are, do not process problem information effectively or
efficiently. They lack or do not apply the resources needed to complete this
complex cognitive activity. Generally, these students also lack meta-cognitive
or self-regulation strategies that help successful students understand,
analyze, solve and evaluate problems. To help these students become good
problem solvers, teachers must understand and teach the cognitive processes
and meta-cognitive strategies that good problem solvers use. This is the
content of math problem-solving instruction. Teachers must also use
instructional procedures that are research-based and have proven effective.
These procedures are the basis of cognitive strategy instruction, which has
been demonstrated to be one of the most powerful interventions for non
master students (Swanson, 1999).
Visualization Visualization is critical to problem representation. It allows students to
construct an image of the problem on paper or mentally. Students must be
shown how to select the important information in the problem and develop a
schematic representation. To do this, teachers model how to use
manipulatives to represent a problem, and then how to draw a picture or make
a diagram that shows the relationships among the problem parts using both
the linguistic and numerical information in the problem. These three-
dimensional and two-dimensional visual representations can take many forms
and will vary from student to student. As students become better problem
solvers, they will use a variety of visual representations including
manipulatives, pictures, tables, graphs, or other types of displays. Initially,
students must be shown how to use the manipulatives and also how to
translate the results of their manipulations with concrete objects to more
symbolic representations using paper and pencil, e.g., the problem type
diagrams. Later, as students become more proficient, they will progress to

171
mental images. Interestingly, if the problem is novel or challenging, they
frequently return to conscious application of processes and strategies, which
is typical of good problem solvers.
The above studies showed that the improvement of mastery level in the
competencies ”fundamental operations“, “fractions, decimals and
percentages”, “decimal fundamental operations” and “ decimals addition
subtraction with mixed operation” is due to the use of adequate
manipulatives, so in the present study also investigator used adequate
manipulatives wherever necessary in his intervention programme. Hence it
can be stated that the adequate use of manipulatives and appropriate
strategies can improve the mastery level in attainment of the above
competencies.
4.9. Main findings of the study
4.9.1. Survey findings
1. Male and female students had statistically equal scores on all the
competencies and also on overall performance, except for ‘fundamental
operations’ where female students excelled male students.
2. Rural and urban area-wise comparisons revealed that rural students
scored high in ‘Numbers’, ‘Decimals addition and subtraction with mixed
operations’, and in ‘total scores’, than the urban students and in rest of the
components students from urban and rural areas had statistically equal
scores.
3. Block-wise comparison revealed that in numbers competency students
from Sagar, Hosanagar and Shimoga had Highest scores, and Soraba
taluk had least scores (Table 4.7.1).
4. In ‘fundamental operations’ competency, students studying in Hosanagara
taluk had highest scores and students in Shimoga, Soraba, and Thirtahalli
taluks had least scores (Table 4.7.3).
172
5. In ‘Fractions, decimals, and percentages competency, students studying in
Hosanagara taluk had highest scores and students studying in
Bhadravathi had least scores (Table 4.7.4).
6. Students of Shimoga and Hosanagar taluks scored highest in ‘Decimals
fundamental operations’ competency, where as students of Soraba and
Thirthahalli taluks scored least (Table 4.7.5).
7. In ‘Decimals addition and subtraction with mixed operations’ competency,
Hosanagar taluk students had highest scores and students of Thirthahalli,
Sagar, and Soraba taluks had least scores (Table 4.7.6).
8. Students of Shimoga and Hosanagara taluks scored highest in ‘Angles’
competency, where as students of Sagar taluk had least scores (Table
4.7.7).
9. In overall performance on ‘Total competencies scores’ students of
Shimoga and Hosanagar taluks excelled maximum and students of Sagar
taluk had least scores. The students studying in Thirthahalli, Soraba,
Shikaripura, and Bhadravathi taluks performed moderately in between the
above mentioned taluks (Table 4.7.8).
4.9.2. Effect of remedial teaching
1. Experimental group had gained significantly higher in general on all the
competencies and also overall performance scores than the control group.
Further, male students of experimental group had substantial gain in
comparison to all other groups.
2. Competency-wise, in ‘fundamental operations’, ‘Fractions, decimals and
percentages’, ‘Decimals fundamental operations’, and in ‘Decimals,
additions subtraction with mixed operations’ experimental group found to
be better significant as there is gain in comparison control group whereas
other competencies – ‘numbers’, ‘different numerals’ and for ‘angles’, the
effect of remedial teaching showed no significant effect on the
experimental group.

173
3. Male subjects gained more than female students in competencies like-
Fundamental operations, Decimals fundamental operations and in ‘angles’
and also on total competencies than female students.
4. The diagnosis-based remediation programme had maximum effect on
competency (Fractions, decimals and percentage) where most of the non-
masters became masters in experimental group.
The main findings are discussed along with verification of the hypothesis in
the light of previous findings and suggestions offered by the experts.
4.10. Implications 1. Present remediation programme can be used by the teachers to improve
mathematics achievement in schools.
2. The MLL strategy of the present study can be useful in implementing
constructivistic approach in teaching learning.
3. A teacher in group based context of teaching should keep in mind that the
instructional time required for mastery of competencies is not uniform
across learners. Hence there could be additional time required for some
learners when class is heterogeneous. Also, even in a group based
instructional program remediation is a necessary condition for mastery.
4. It was found out from the present study that diagnosis based remediation
programme leads to mastery of competencies in mathematics among non
masters, but time taken for mastering competencies by all non-masters
was higher than the time allotted in the school for teaching. In the rigid
time frame of an academic year it would then be necessary that the
competencies that are difficult for the students may be identified and
shifted to the bridge course. This will be the requirement for the diagnosis
based remediation programme prescribed for a grade to be appropriate for
the learners and for ensuring universal achievement of a comparable
standard by all learners.
5. The curriculum planners can design the curriculum based on concrete to
abstract learning continua in mathematics by providing concrete, semi-
abstract and abstract activities and games and live experiences in and

174
around the pupils daily life activities which will lead to high level of
attainment of MLL competencies.
6. Training programme can be designed for training the primary school
teachers in adopting diagnosis based remediation programme for teaching
mathematics at the primary level.
7. Teachers can use the diagnosis based remediation programme to achieve
mastery of MLL competencies in mathematics and can also create an
interest among the students to learn mathematics.
8. Findings of this study demand that teachers must try to improve the quality
of teaching so that abilities of attaining MLL competencies of mathematics
can be developed among children.. Teachers with the help of this study
can develop their own teaching strategies to teach different subjects
interestingly and innovatively.
9. The diagnosis based remediation program is useful for students who lag in
decimals, percentage and fractions where one can expect better results.
4.11. Suggestions 1. Present remediation programme can be extended to other classes.
2. New methods like discussion method, guided discovery method, mastery
learning and co-operative learning can be attempted by teachers.
3. This study can be extended in government aided and private schools in
urban and rural areas.
4. Studies may be conducted in other curricular areas using diagnosis based
remediation programme to study the effectiveness of the strategy.
5. The effectiveness of the diagnosis based remediation programme to be
verified for a full academic year.
6. A study involving other variables that may be intervening with attainment
levels could be conducted for greater understanding of the effectiveness of
diagnosis based remediation programme.
7. Further validation of effectiveness needs to be done when the strategy is
implemented on a larger scale and in different contexts of school
education, especially the multigrade context.