CHAPTER 9 · PDF fileORACLE Series / Oracle9iDBA Handbook / Loney, ... STATSPACK report will...
12
ORACLE Series / Oracle9i DBA Handbook / Loney, Theriault / 9374-3 / Chapter 9 Blind Folio 9:345 CHAPTER 9 Using STATSPACK P:\010Comp\Oracle8\374-3\ch09.vp Tuesday, November 06, 2001 1:01:54 PM Color profile: Generic CMYK printer profile Composite Default screen
Transcript of CHAPTER 9 · PDF fileORACLE Series / Oracle9iDBA Handbook / Loney, ... STATSPACK report will...

ORACLE Series / Oracle9i DBA Handbook / Loney, Theriault / 9374-3 / Chapter 9Blind Folio 9:345
CHAPTER9
Using STATSPACK
P:\010Comp\Oracle8\374-3\ch09.vpTuesday, November 06, 2001 1:01:54 PM
Color profile: Generic CMYK printer profileComposite Default screen

As of Oracle 8.1.6, you can use the STATSPACK utility to monitorthe performance of your database. STATSPACK replaces theUTLBSTAT/UTLESTAT scripts available with earlier versions ofOracle and offers several significant enhancements to those scripts.In this chapter, you will see how to install STATSPACK, how to
manage it, and how to run and interpret the generated reports.
Installing STATSPACKSTATSPACK must be installed in every database to be monitored. The installationscript, named spcreate.sql, is found in the /rdbms/admin subdirectory under theOracle software home directory. The spcreate.sql script creates a user namedPERFSTAT and creates a number of objects under that schema.
NOTEYou should allocate at least 100MB for the initialcreation of the PERFSTAT schema’s objects.
To start the spcreate.sql script, change your directory to the ORACLE_HOME/rdbms/admin directory and log into SQL*Plus in an account with SYSDBA privileges:
SQL> connect system/manager as SYSDBASQL> @spcreate
During the installation process, you will be prompted for a default tablespace forthe PERFSTAT user (a list of available tablespaces will be displayed along with thisprompt). You will also be asked to specify a temporary tablespace for the user. Onceyou have provided a default and temporary tablespace for the PERFSTAT account, itwill be created, and the installation script will log in as PERFSTAT and continue tocreate the required objects. If there is not sufficient space to create the PERFSTATobjects in the specified default tablespace, the script will return an error.
NOTEAlthough you start the installation script whilelogged in as a SYSDBA-privileged user, theconclusion of the installation script will leave youlogged in as the PERFSTAT user.
If you want to drop the PERFSTAT user at a later date, you can run the spdusr.sqlscript located in the ORACLE_HOME/rdbms/admin directory.
346 Oracle9i DBA Handbook
ORACLE Series / Oracle9i DBA Handbook / Loney, Theriault / 9374-3 / Chapter 9Blind Folio 9:346
P:\010Comp\Oracle8\374-3\ch09.vpTuesday, November 06, 2001 1:01:55 PM
Color profile: Generic CMYK printer profileComposite Default screen

Chapter 9: Using STATSPACK 347
ORACLE Series / Oracle9i DBA Handbook / Loney, Theriault / 9374-3 / Chapter 9Blind Folio 9:347
Security of the PERFSTAT AccountThe PERFSTAT account is created with the default password of PERFSTAT. Changethe password after the installation process completes.
The PERFSTAT account is granted the SELECT_CATALOG_ROLE andHS_ADMIN_ROLE roles, along with several system privileges (CREATE/ALTERSESSION, CREATE TABLE, CREATE/DROP PUBLIC SYNONYM, CREATE SEQUENCE,and CREATE PROCEDURE). Any user who can access your PERFSTAT accountcan select from all of the dictionary views. For example, such a user could queryall of the database account usernames from DBA_USERS, all the segment ownersfrom DBA_SEGMENTS, and the currently logged in sessions from V$SESSION. ThePERFSTAT account, if left unprotected, provides a security hole that allows intrudersto browse through your data dictionary and select targets for further intrusion.
In addition to the privileges it receives during the installation process, thePERFSTAT account will also have any privileges that have been granted to PUBLIC.If you use PUBLIC grants instead of roles for application privileges, you mustsecure the PERFSTAT account. You can lock database accounts and unlock themas needed; see Chapter 10 for details.
PostinstallationOnce the installation process is complete, the PERFSTAT account will own (in 9.0.1)36 tables, 37 indexes, a sequence, and a package. You will use the package, namedSTATSPACK, to manage the statistics collection process and the data in the tables. Thecollection tables, whose names all begin with “STATS$,” will have column definitionsbased on the V$ view definitions. For example, the columns in STATS$WAITSTATare the columns found in V$WAITSTAT with three identification columns addedat the top:
desc stats$waitstat
Name Null? Type------------------------ -------- ------------SNAP_ID NOT NULL NUMBER(6)DBID NOT NULL NUMBERINSTANCE_NUMBER NOT NULL NUMBERCLASS NOT NULL VARCHAR2(18)WAIT_COUNT NUMBERTIME NUMBER
P:\010Comp\Oracle8\374-3\ch09.vpTuesday, November 06, 2001 1:01:56 PM
Color profile: Generic CMYK printer profileComposite Default screen

The Class, Wait_Count, and Time columns are based on the Class, Count, and Timecolumns from V$WAITSTAT. STATSPACK has added three identification columns:
SNAP_ID An identification number for the collection. Eachcollection is called a snapshot and is assigned aninteger value.
DBID A numeric identifier for the database.
INSTANCE_NUMBER A numeric identifier for the instance, for RealApplication Cluster installations.
Each collection you perform is given a new Snap_ID value that is consistentacross the collection tables. You will need to know the Snap_ID values whenexecuting the statistics report provided with STATSPACK.
Gathering StatisticsEach collection of statistics is called a snapshot. Snapshots of statistics have norelation to snapshots or materialized views used in replication. Rather, they are apoint-in-time collection of the statistics available via the V$ views, and are givena Snap_ID value to identify the snapshot. You can generate reports on the changesin the statistics between any two snapshots.
NOTEAs with the UTLBSTAT/UTLESTAT reports, theSTATSPACK report will only be valid if the databasewas not shut down and restarted between thesnapshots evaluated.
NOTEBe sure the TIMED_STATISTICS databaseinitialization parameter is set to TRUE priorto gathering statistics.
To generate a snapshot of the statistics, execute the SNAP procedure of theSTATSPACK package, as shown in the following listing. You must be logged inas the PERFSTAT user to execute this procedure.
execute STATSPACK.SNAP;
PL/SQL procedure successfully completed.
348 Oracle9i DBA Handbook
ORACLE Series / Oracle9i DBA Handbook / Loney, Theriault / 9374-3 / Chapter 9Blind Folio 9:348
P:\010Comp\Oracle8\374-3\ch09.vpTuesday, November 06, 2001 1:01:57 PM
Color profile: Generic CMYK printer profileComposite Default screen

Chapter 9: Using STATSPACK 349
ORACLE Series / Oracle9i DBA Handbook / Loney, Theriault / 9374-3 / Chapter 9Blind Folio 9:349
When the SNAP procedure is executed, Oracle populates your SNAP$ tableswith the current statistics. You can then query those tables directly, or you can usethe standard STATSPACK report (to see the change in statistics between snapshots).
Snapshots should be taken in one of two ways:
■ To evaluate performance during specific tests of the system. For these tests, youcan execute the SNAP procedure manually, as shown in the prior example.
■ To evaluate performance changes over a long period of time. To establish abaseline of the system performance, you may generate statistics snapshotson a scheduled basis. For these snapshots, you should schedule the SNAPprocedure execution via Oracle’s internal DBMS_ JOB scheduler or via anoperating system scheduler.
For the snapshots related to specific tests, you may wish to increase thecollection level, which lets you gather more statistics. As noted in the “Managingthe STATSPACK Data” section later in this chapter, each snapshot has a cost interms of space usage and query performance. For example, since V$SYSSTAT has(in Oracle 9.0.1) 255 rows, every snapshot generates 255 rows in STATS$SYSSTAT.Avoid generating thousands of rows of statistical data with each snapshot unless youplan to use them.
To support differing collection levels, STATSPACK provides a level parameter.By default, the level value is set to 5. Prior to changing the level value, generateseveral snapshots and evaluate the reports generated. The default level value isadequate for most reports. Alternative level values are listed in the following table:
Level Description
0 to 4 General performance statistics on all memory areas, latches,pools, and events.
5 to 9 Same statistics from the lower levels, plus the mostresource-intensive SQL statements.
10 and greater Same statistics from the lower levels, plus the mostresource-intensive SQL statements and parent/child latch data.
The greater the collection level, the longer the snapshot will take. The defaultvalue (5) offers a significant degree of flexibility during the queries for the mostresource-intensive SQL statements. The parameters used for the resource-intensiveSQL portion of the snapshot are stored in a table named STATS$STATSPACK_PARAMETER. You can query STATS$STATSPACK_PARAMETER to see the settingsfor the different thresholds during the SQL statement gathering. Its columns includeSnap_Level (the snapshot level), Executions_Th (threshold value for the number of
P:\010Comp\Oracle8\374-3\ch09.vpTuesday, November 06, 2001 1:01:57 PM
Color profile: Generic CMYK printer profileComposite Default screen

350 Oracle9i DBA Handbook
ORACLE Series / Oracle9i DBA Handbook / Loney, Theriault / 9374-3 / Chapter 9Blind Folio 9:350
executions), Disk_Reads_Th (threshold value for the number of disk reads), andBuffer_Gets_Th (threshold value for the number of disk reads).
For a level 5 snapshot using the default thresholds, SQL statements are storedif they meet any of the following criteria:
■ The SQL statement has been executed at least 100 times.
■ The number of disk reads performed by the SQL statement exceeds 1000.
■ The number of parse calls performed by the SQL statement exceeds 1000.
■ The number of buffer gets performed by the SQL statement exceeds 10,000.
■ The sharable memory used by the SQL statement exceeds 1MB.
■ The version count for the SQL statement exceeds 20.
When evaluating the snapshot’s data and the performance report, keep in mindthat the SQL threshold parameter values are cumulative. A very efficient query, ifexecuted enough times, will exceed 10,000 buffer gets. Compare the number of buffergets and disk reads to the number of executions to determine the activity each timethe query is executed.
To modify the default settings for the thresholds, use the MODIFY_STATSPACK_PARAMETER procedure of the STATSPACK package. Specify the snapshot level viathe i_snap_level parameter, along with the parameters to change. Table 9-1 lists theavailable parameters for the MODIFY_STATSPACK_PARAMETER procedure.
To increase the Buffer_Gets threshold for a level 5 snapshot to 100,000, issuethe following command:
STATSPACK.MODIFY_STATSPACK_PARAMETER -(i_snap_level=>5, i_buffer_gets_th=>100000);
If you plan to run the SNAP procedure on a scheduled basis, you should pinthe STATSPACK package following database startup. The following listing shows atrigger that will be executed each time the database is started. The KEEP procedureof the DBMS_SHARED_POOL procedure pins the package in the Shared Pool.As an alternative to pinning, you can use the SHARED_POOL_RESERVED_SIZEinitialization parameter to reserve Shared Pool area for large packages.
create or replace trigger PIN_ON_STARTUPafter startup on databasebegin
DBMS_SHARED_POOL.KEEP ('PERFSTAT.STATSPACK', 'P');end;/
P:\010Comp\Oracle8\374-3\ch09.vpTuesday, November 06, 2001 1:01:58 PM
Color profile: Generic CMYK printer profileComposite Default screen

Chapter 9: Using STATSPACK 351
ORACLE Series / Oracle9i DBA Handbook / Loney, Theriault / 9374-3 / Chapter 9Blind Folio 9:351
Running the Statistics ReportIf you have generated more than one snapshot, you can report on the statistics forthe period between the two snapshots. The database must not have been shutdown between the times the two snapshots were taken. When you execute thereport, you will need to know the Snap_ID values for the snapshots. If you runthe report interactively, Oracle will provide a list of the available snapshots andthe times they were created.
To execute the report, go to the /rdbms/admin directory under the Oraclesoftware home directory. Log into SQL*Plus as the PERFSTAT user and run thespreport.sql file found there.
SQL> @spreport
Oracle will display the database and instance identification information fromV$INSTANCE and V$DATABASE and will then call a second SQL file, sprepins.sql.
Parameter Name Range of Values Default Description
i_snap_level 0, 5, 10 5 Snapshot level
i_ucomment Any text blank Comment for the snapshot
i_executions_th Integer >=0 100 Threshold for the cumulativenumber of executions
i_disk_reads_th Integer >=0 1000 Threshold for the cumulativenumber of disk reads
i_parse_calls_th Integer >=0 1000 Threshold for the cumulativenumber of parse calls
i_buffer_gets_th Integer >=0 10000 Threshold for the cumulativenumber of buffer gets
i_sharable_mem_th Integer >=0 1048576 Threshold for the amount ofsharable memory allocated
i_version_count_th Integer >=0 20 Threshold for the number ofversions of the SQL statement
i_session_id Valid SID fromV$SESSION
0 Session ID of an Oracle session, ifyou wish to gather session-levelstatistics
i_modify_parameter TRUE or FALSE FALSE Set to TRUE if you wish to saveyour changes for future snapshots
TABLE 9-1. Modification Parameters
P:\010Comp\Oracle8\374-3\ch09.vpTuesday, November 06, 2001 1:01:59 PM
Color profile: Generic CMYK printer profileComposite Default screen

The sprepins.sql generates the report of the changes in the statistics during the snapshottime interval. The available snapshots will be listed, and you will be prompted toenter a beginning and ending snapshot ID. Unless you specify otherwise, the outputwill be written to a file named sp_beginning_ending.lst (sp_1_2.lst for a reportbetween Snap_ID values of 1 and 2).
The first portion of the report output provides an overview of the cache areasand their usage. The following listing shows sample output for this section, showingthe cache sizes and the load profile.
Cache Sizes (end)~~~~~~~~~~~~~~~~~
Buffer Cache: 160M Std Block Size: 8KShared Pool Size: 64M Log Buffer: 512K
Load Profile~~~~~~~~~~~~ Per Second Per Transaction
--------------- ---------------Redo size: 2,270.95 333,830.00
Logical reads: 15.77 2,318.00Block changes: 3.83 562.50
Physical reads: 0.00 0.50Physical writes: 0.72 106.50
User calls: 0.10 14.50Parses: 0.27 39.00
Hard parses: 0.07 10.00Sorts: 0.30 44.50
Logons: 0.00 0.00Executes: 0.64 94.50
Transactions: 0.01
% Blocks changed per Read: 24.27 Recursive Call %: 98.14Rollback per transaction %: 0.00 Rows per Sort: 86.06
The load profile helps to identify the type of activity being performed. In thisexample, the activity recorded was primarily performing queries. The next sectionsof the report show the instance efficiency percentages (such as the buffer hit ratioand library cache hit ratio) followed by the Shared Pool statistics. The Shared Poolstatistics show the percentage of the Shared Pool in use and the percentage of SQLstatements that have been executed multiple times (as desired). The following listingshows sample Shared Pool statistics from the report:
Shared Pool Statistics Begin End------ ------
Memory Usage %: 28.37 29.17% SQL with executions>1: 27.77 30.45
% Memory for SQL w/exec>1: 56.64 67.74
352 Oracle9i DBA Handbook
ORACLE Series / Oracle9i DBA Handbook / Loney, Theriault / 9374-3 / Chapter 9Blind Folio 9:352
P:\010Comp\Oracle8\374-3\ch09.vpTuesday, November 06, 2001 1:02:00 PM
Color profile: Generic CMYK printer profileComposite Default screen
Based on the data in the preceding listing, at the time of the second snapshot,29.17% of the Shared Pool’s memory was in use. Of the statements in the SharedPool, only 30% had been executed more than once, indicating a potential need toimprove cursor sharing in the application.
NOTEThe section of the report showing the percentage ofShared Pool memory in use is new with theOracle9i version of STATSPACK.
The next portion of the generated report shows the top five wait events, the fulllist of wait events, and the background wait events. Identifying major wait eventsmay help to target your tuning efforts.
The most resource-intensive SQL statements in the database are then listed,in descending order of buffer gets. Since the buffer gets statistic is cumulative,the query with the most buffer gets may not be the worst-performing query in thedatabase; it may just have been executed enough times to earn the highest ranking.Compare the cumulative number of buffer gets to the cumulative number of diskreads for the queries; if the numbers are close, then you should evaluate the explainplan for the query.
NOTEIf the Shared Pool is flushed between the executiontimes of the two snapshots, the SQL portion of theoutput report will not necessarily contain the mostresource-intensive SQL executed during the period.
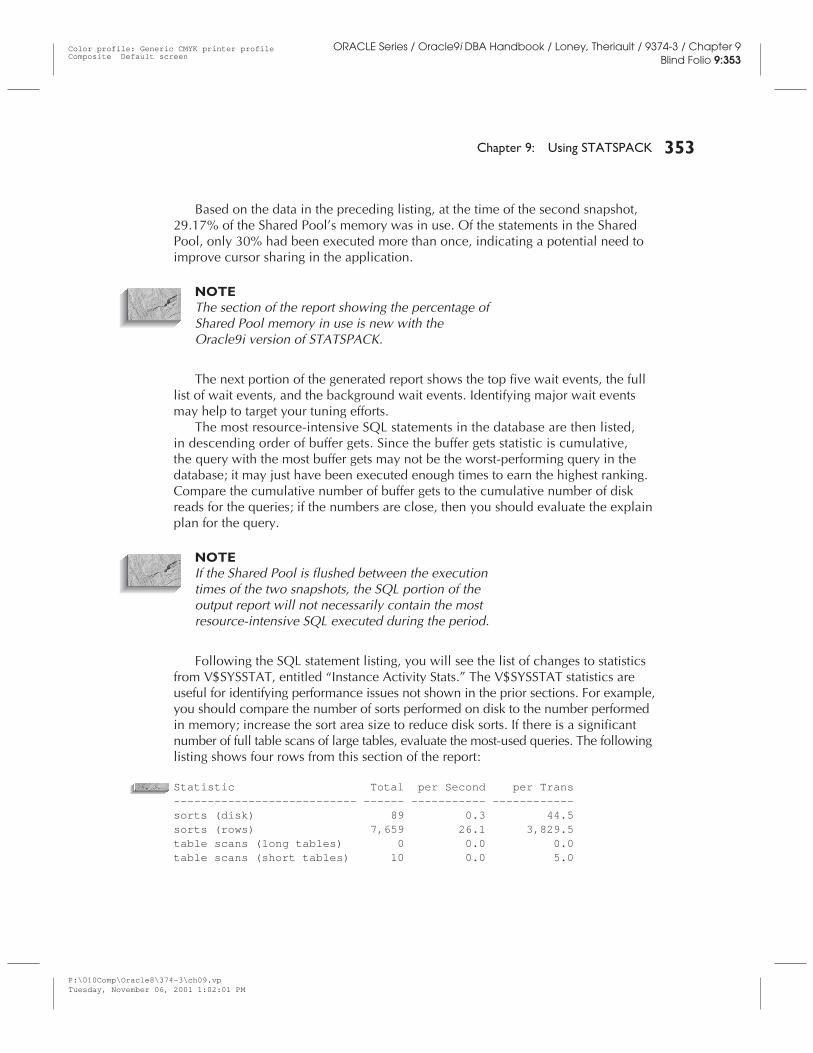
Following the SQL statement listing, you will see the list of changes to statisticsfrom V$SYSSTAT, entitled “Instance Activity Stats.” The V$SYSSTAT statistics areuseful for identifying performance issues not shown in the prior sections. For example,you should compare the number of sorts performed on disk to the number performedin memory; increase the sort area size to reduce disk sorts. If there is a significantnumber of full table scans of large tables, evaluate the most-used queries. The followinglisting shows four rows from this section of the report:
Statistic Total per Second per Trans--------------------------- ------ ----------- ------------sorts (disk) 89 0.3 44.5sorts (rows) 7,659 26.1 3,829.5table scans (long tables) 0 0.0 0.0table scans (short tables) 10 0.0 5.0
Chapter 9: Using STATSPACK 353
ORACLE Series / Oracle9i DBA Handbook / Loney, Theriault / 9374-3 / Chapter 9Blind Folio 9:353
P:\010Comp\Oracle8\374-3\ch09.vpTuesday, November 06, 2001 1:02:01 PM
Color profile: Generic CMYK printer profileComposite Default screen

354 Oracle9i DBA Handbook
ORACLE Series / Oracle9i DBA Handbook / Loney, Theriault / 9374-3 / Chapter 9Blind Folio 9:354
The next section of the report provides the I/O statistics by tablespace and bydatafile. If the I/O is not properly distributed among your files, you many encounterperformance bottlenecks during periods of high activity. You can use this sectionof the report to identify such bottlenecks and to measure how effectively youhave resolved those problems. See Chapter 4 for further details on I/O distributionacross files.
Following the I/O statistics, the report lists the buffer cache statistics by pool(default, keep, and recycle), instance recovery statistics (the number of redo blocks),and the PGA memory statistics. After those sections, the report provides rollbacksegment statistics. First, it lists the activity in the rollback segment (writes, wraps,shrinks, extends) and the waits encountered, as shown in the following example:
Trans Table Pct Undo BytesRBS No Gets Waits Written Wraps Shrinks Extends------ ------------- ------- -------------- -------- -------- --------
0 2.0 0.00 0 0 0 01 4.0 0.00 0 0 0 02 2.0 0.00 0 0 0 03 13.0 0.00 0 0 0 04 6.0 0.00 0 0 0 05 4.0 0.00 0 0 0 06 7.0 0.00 1,824 0 0 07 10.0 0.00 202 0 0 08 96.0 0.00 207,234 5 0 59 8.0 0.00 0 0 0 0
10 32.0 0.00 10,856 0 0 0
If rollback segment waits are occurring, you may need to add more rollbacksegments to your database. The next section after the rollback segment statistics showsthe storage allocations for your rollback segments, providing a guideline for thecreation of additional rollback segments. Following the rollback segment sections,the report lists the undo segment statistics for environments using system-managedundo (see Chapter 7).
Latch activity and dictionary cache statistics are then presented, followed by thelibrary cache activity. If your “Pct Miss” value is high, you may need to improve cursorsharing in your application or increase the size of the Shared Pool.
Get Pct Pin Pct Invali-Namespace Requests Miss Requests Miss Reloads dations--------------- -------- ------ ---------- ------ ------- -------BODY 4 0.0 5 0.0 0 0CLUSTER 3 0.0 3 0.0 0 0JAVA DATA 1 0.0 4 0.0 0 0SQL AREA 84 7.1 493 11.4 0 0TABLE/PROCEDURE 298 1.7 408 17.2 0 0TRIGGER 3 0.0 3 0.0 0 0
P:\010Comp\Oracle8\374-3\ch09.vpTuesday, November 06, 2001 1:02:02 PM
Color profile: Generic CMYK printer profileComposite Default screen

Chapter 9: Using STATSPACK 355
ORACLE Series / Oracle9i DBA Handbook / Loney, Theriault / 9374-3 / Chapter 9Blind Folio 9:355
Following an SGA memory summary (from V$SGA) and a listing of the memorychanges during the snapshot interval, the report lists the database initializationparameters in use at the beginning and end of the report.
Taken as a whole, the report generates a significant amount of data, allowingyou to develop a profile of the database and its usage. Based on the initialization,file I/O, and SGA data, you can develop an understanding of the major componentsin the database configuration. Since it generates so much data, you should becareful not to generate more statistics than you plan to use. The following sectionsof this chapter address the management of the gathered data.
Managing the STATSPACK DataYou should manage the data generated by STATSPACK to guarantee that the spaceusage and performance of the STATSPACK application meets your requirements asthe application data grows. Managing STATSPACK data includes the following steps:
1. Regularly analyze the STATSPACK data. At a minimum, you should analyzethe STATSPACK table prior to running the spreport.sql report:
execute DBMS_UTILITY.ANALYZE_SCHEMA('PERFSTAT','COMPUTE');
2. Purge old data. Since you cannot generate valid interval reports acrossdatabase shutdown/startup actions, data prior to the last database startupmay not be as useful as the most current data. When the data is no longerneeded, purge it from the tables. Oracle provides a script, sppurge.sql, tofacilitate purges. The sppurge.sql script, located in the /rdbms/admindirectory under the Oracle software home directory, lists the currentlystored snapshots and prompts you for two input parameters: the beginningand ending snapshot numbers for the purge. The related records in theSTATS$ tables will then be deleted. Due to the size of the transactionsinvolved, databases using rollback segments should force the session touse a large rollback segment during the deletes:
SQL> commit;
SQL> set transaction use rollback segment roll_large;
SQL> @sppurge
The sppurge script prompts you to back up your old statistics before purgingthem. You can back up the data by exporting the PERFSTAT schema.
3. Truncate the STATSPACK tables when the data is not needed. Old statisticaldata may no longer be relevant, or you may have imported the old statisticsduring database migrations or creations. To truncate the old tables, executethe sptrunc.sql SQL*Plus script from within the PERFSTAT account. Thescript is located in the /rdbms/admin directory under the Oracle softwarehome directory.
P:\010Comp\Oracle8\374-3\ch09.vpTuesday, November 06, 2001 1:02:02 PM
Color profile: Generic CMYK printer profileComposite Default screen

Deinstalling STATSPACKSince STATSPACK includes public synonyms as well as private objects, you shouldremove the application via a SYSDBA privileged account. Oracle provides a script,spdrop.sql, to automate the deinstallation process. From within the /rdbms/admindirectory under the Oracle software home directory, log into SQL*Plus and executethe script as shown in the following listing:
SQL> connect system/manager as SYSDBASQL> @spdrop
The spdrop.sql script calls scripts that will drop the tables, package, publicsynonyms, and the PERFSTAT user. To reinstall STATSPACK, execute the spcreate.sqlscript as shown earlier in this chapter.
356 Oracle9i DBA Handbook
ORACLE Series / Oracle9i DBA Handbook / Loney, Theriault / 9374-3 / Chapter 9Blind Folio 9:356
P:\010Comp\Oracle8\374-3\ch09.vpTuesday, November 06, 2001 1:02:02 PM
Color profile: Generic CMYK printer profileComposite Default screen