Performance Tuning with Statspack, Part II Tuning with Statspack, Part II An Oracle Technical White...
22
Performance Tuning with Statspack, Part II An Oracle Technical White Paper July 2000
Transcript of Performance Tuning with Statspack, Part II Tuning with Statspack, Part II An Oracle Technical White...

Performance Tuning with Statspack, Part II
An Oracle Technical White PaperJuly 2000

Performance Tuning with StatspackPerformance tuning with Statspack is part 2 of a two part article. Part 1 described Statspack’sfeatures, and how to install and run the tool. Part 2 introduces a method of tuning Oracledatabases using Statspack. The article briefly describes Statspack, covers fundamental tuningmethods and explains how to read a Statspack report.
Statspack Overview
Statspack is a performance diagnosis tool, available with Oracle8i Release 8.1.6. Statspack canbe considered BSTAT/ESTAT's successor, incorporating many new features, such as:• Storing performance data in permanent Oracle tables which can be used for analysis at any
time in the future• Capturing high-resource SQL statements• An easy to use report, with many useful ratios pre-computed• The ability to be run on all nodes of an OPS system
Statspack is a diagnosis tool for instance-wide performance problems; it also supports applicationtuning activities by providing data which identifies high-load SQL statements. Statspack can beused both proactively to monitor the changing load on a system, and also reactively to investigatea performance problem.
Proactively capturing data
The most effective way to tune using Statspack is to establish a performance baseline which canbe used for comparison if a performance issue arises. This is done by proactively gatheringperformance data by taking a snapshot with Statspack, and by gathering data on yourapplication’s typical response times.
No matter how your system is performing, if you don’t have existing baseline data, the time tobegin gathering baseline snapshots is now. You can automate taking a snapshot at repeatedintervals such as once an hour every day, or you can take a few representative snapshots atdifferent peak times on a regular basis. For example, your baseline may include a snapshot everyhour between 10am and 1pm, then another snapshot at 6pm, and include two additionalsnapshots to monitor the batch window of 12am midnight to 6am. If you capture a large numberof snapshots it is possible to purge** (or delete) unneeded data.
Remember to set timed_statistics to true for your instance. Setting this parameter providestiming data which is invaluable for performance tuning.
NOTE:** It is possible to delete snapshots by running sppurge.sql. This file is new in 8.1.7 andpurges snapshot data for the range of Snapshot Id’s you specify.Also note the Statspack file names have changed in 8.1.7 - for the details, please see thedocumentation file spdoc.txt in the RDBMS ADMIN directory.

Performance Tuning with Statspack, Part IIMay 2000
3
Proactively Examining Data
Using Statspack proactively is as simple as generating a report on a regular basis (for examplefortnightly), and examining first page of the report. This allows you to compare the currentreport to a baseline, to check whether the rates of activity are high, irrespective of a baseline,and also to become familiar with a new or changed application.
Changes in Load
First check to see if the load is changing over time. The section to examine is the Load Profile,which allows easy comparison of changing load, as the data is normalized per transaction and persecond.
Per Second Per Transaction--------------- ---------------
Redo size: 10,406.76 3,716.59Logical reads: 616.45 220.15Block changes: 53.28 19.03Physical reads: 16.33 5.83Physical writes: 4.88 1.74
User calls: 33.92 12.11Parses: 5.80 2.07
Hard parses: 0.01 0.00Sorts: 5.13 1.83
Transactions: 2.80
Rows per Sort: 11.00Pct Blocks changed / Read: 8.64
Recursive Call Pct: 43.88Rollback / transaction Pct: 1.88
The per-second statistics show you the changes in throughput (i.e. whether the instance isperforming more work per second). For example:• a significant increase in ‘redo size’, ‘block changes’ and ‘pct of blocks changed per read’
would indicate the instance is performing more inserts/updates/deletes.• an increase in the ‘redo size’ without an increase in the number of ‘transactions per second’
would indicate a changing transaction profile. Similarly, looking at the per-transaction statistics allows you to identify changes in the applicationcharacteristics by comparing these to the corresponding statistics from the baseline report.
When comparing two reports, ensure the two reports are from times where the system wasrunning comparable workloads - if the system was running totally different workloads (e.g. batchcompared to online), comparing the two reports is not valid.
High Rates of activity
Also examine the data on this page to identify whether the ‘rates’ of activity are very high,irrespective of whether a comparison baseline exists. It is difficult to make blanketrecommendations on ‘high’ values, as the thresholds will be different on each site, and arecontingent on the number and speed of CPUs, the Operating system, the IO system and theOracle release. Below are some generalized examples for parse rates:

Performance Tuning with Statspack, Part IIMay 2000
4
• A ‘hard parse’ rate of greater than 100 per second indicates there is a very high amount ofhard parsing on the system. High hard parse rates cause serious performance issues, andmust be investigated. A high hard parse rate is usually accompanied by latch contention onthe shared pool and library cache latches. Check whether waits for ‘latch free’ appear in thetop-5 wait events, and if so, examine the latching sections of the Statspack report.
• A high soft parse rate could be anywhere in the rate of 300 or more per second.
Unnecessary soft parses also limit application scalability; optimally a SQL statement should besoft-parsed once per session, and executed many times.
For an explanation of hard and soft parses, please see the Instance Efficiency section, ‘Softparse ratio’ and ‘Hard parse ratio’.
Familiarity with new and changing applications
It is also useful to look at Statspack reports proactively when a new application, or a new releaseof an existing application is installed; this allows the DBA to develop an understanding andfamiliarity with the application’s characteristics, and it’s impact on the system as a whole.
Using Statspack to solve Performance Problems Reactively
When a performance problem occurs on your system, Statspack will help identify the problem.However analyzing a Statspack report should not be the first problem solving action.
The fundamental steps to solving a performance problem reactively are to define the problem,examine the host hardware, analyze the Oracle statistics in the Statspack report, then implementand measure the effect of changes. These steps are discussed below.
The problem definition
It is vital to develop a good understanding of the problem before attempting to implement asolution; without understanding the problem it is virtually impossible to implement changes whichwill work. This data will also help determine what steps your reactive tuning process shouldinclude, and what to look for in the Statspack report.
During the problem definition, it is important to:
1. Identify the scopeWhat is affected by the slowdown? For example, is the whole instance slow, is it a particularapplication, program, specific operation, or a single user?
2. Identify the time frame when the problem occursIs the problem only evident during peak hours? Does performance deteriorate over thecourse of the day? Was the slowdown gradual (over the space of months, or weeks), or

Performance Tuning with Statspack, Part IIMay 2000
5
sudden?
3. Quantify the slowdownThis helps with both identifying the extent of the problem, and also acts as a measure forcomparison when deciding whether changes implemented to fix the problem have actuallymade an improvement. Find a consistently reproducable measure of the response time, orjob run time. How much worse are the timings than when the program was running well?
4. Identify any changesIdentify what has changed since performance was acceptable - this may narrow the potentialcause quickly. For example, has the Operating System software, hardware, applicationsoftware or Oracle release been upgraded? Has more data been loaded into the system, orhas the data volume or user population grown?
At the end of this phase, the you will have a good understanding of the symptoms. If thesymptoms can be identified as local to a program or set of programs, the problem is handled in adifferent manner to instance-wide performance issues. Issues which are specific to an applicationor user are briefly covered in ‘SQL Tuning using Statspack’, towards the end of this document.
The host hardware
It is important to look at the load on the database server, as well as the database instance. Lookat the Operating System, IO subsystem and network statistics, as examining these areas helpsdetermine what may be worthy of further investigation. In multi-tier systems, also examine theapplication server middle tier hosts.
• CPU usage If there is a significant amount of idle CPU, it may be an IO, Application, or database
bottleneck (Note that Wait IO should be considered as idle CPU). If there is high CPU usage, determine whether the CPU is being used effectively. Is the
majority of CPU usage attributable to a small number of high-CPU using programs, or is theCPU consumed by an evenly distributed workload? If the CPU is used by a small number ofhigh-usage programs, look at the programs to determine the cause: if the programs areOracle processes, it is usually of benefit to sql_trace the process and identify the SQLstatements being executed to see if they can be tuned; untuned SQL statements performingmany buffer gets scan buffers in the buffer cache which is CPU intensive and usually IOintensive.
If the CPU usage is evenly distributed over many Oracle server processes, examine the
Statspack report for other evidence.
• IO System An overly active IO system can be evidenced by long queue lengths, or disk service times
Performance Tuning with Statspack, Part IIMay 2000
6
which are over 20-30ms. If the IO system is overly active, it is worthwhile checking the IOsystem for potential hot spots which could benefit from distributing the IO across more disks.
Cross reference the host IO system data with information in the IO sections in the Statspack
report to identify hot datafiles and tablespaces; also compare the IO times to those in theStatspack report.
Check the high-load SQL identified in the ‘SQL ordered by physical reads’ section of the
Statspack report to see if there are any high-resource SQL statements contributing to thisload.
• Network
Using OS utilities, look at the network round-trip ping time and the number of collisions. Ifthe network is causing large delays in response time, investigate possible causes. Networkload can be reduced by scheduling large data transfers to off-peak times, or by codingapplications to batch requests to remote hosts, rather than accessing remote hosts once (ormore) per request.
Examining the host hardware often gives you a strong indication of the bottleneck in the system,and therefore which sections of the Statspack report may be useful for cross-reference andfurther diagnosis.
Analyzing a Statspack Report
Generate a Statspack report which covers the time when the instance had the performanceproblem. Optimally, you will have proactively gathered a baseline for comparison, which allowsyou to generate a report from the baseline which most represents the problem workload.
Analyzing a Statspack report involves examining the current report for anomalies, in addition tocomparing the current data to a baseline report (if there is one).
The Statspack report provides a complete instance performance reference. The first page is aperformance summary for the instance, and shows computed statistics, ratios and percentages.The subsequent sections provide detailed statistics for each area, and include data on file IO,rollback segments, system statistics, enqueues, buffer waits and latches.
The report is typically read in a non-sequential manner, skipping backwards and forwards thoughthe various sections; the order the report is read is dictated by the evidence found.
This summary page is examined first, as data on this page is used to identify key areas toinvestigate further; the detail sections provide further evidence which is used to formulatepossible causes for the problem.
Performance Tuning with Statspack, Part IIMay 2000
7
Summary Page
Examining the summary page of a Statspack report is often enough to indicate the area(s) ofconcern; it includes the Load Profile and Instance Efficiency sections which show derived statisticsfrom stats$sysstat, and the Top-5 Wait events from stats$system_event
The data on this first page indicates the subsequent sections of the report to examine. Inreactive tuning, the first section to examine is the Top-5 Wait Events.
Top-5 Wait Events - Directed drill down
Wait events are statistics which are incremented by a server process to indicate it had to waitduring processing.
A server process can wait for:• a resource to become available (such as a buffer, or a latch)• an action to complete (such as an IO)• more work to do (such as waiting for the client to provide the next SQL statement to execute.
Events which identify that a server process is waiting for more work, are known as *idleevents)
Wait event statistics include the number of times an event was waited for, and the time waitedfor the event to complete.
To minimize user response time, reduce the time spent by server processes waiting for eventcompletion. Look at the Top-5 wait events to determine what is preventing the majority ofserver processes from being productive. The Top-5 lists the highest ranking events waited forduring the snapshot period (idle* events are omitted from this list). Note the complete list ofevents waited for during the snapshot period, is on pages 2 and 3. Page 2 shows waits byforeground (i.e. server) processes, and page 3 shows waits by background processes (e.g. SMON,PMON, etc).
NOTE:Idle* events are events the server uses to indicate it does not have any work to do;these events should be ignored as they do not contribute to performance problems. Thefull list of idle events can be queried from the stats$idle_event table.
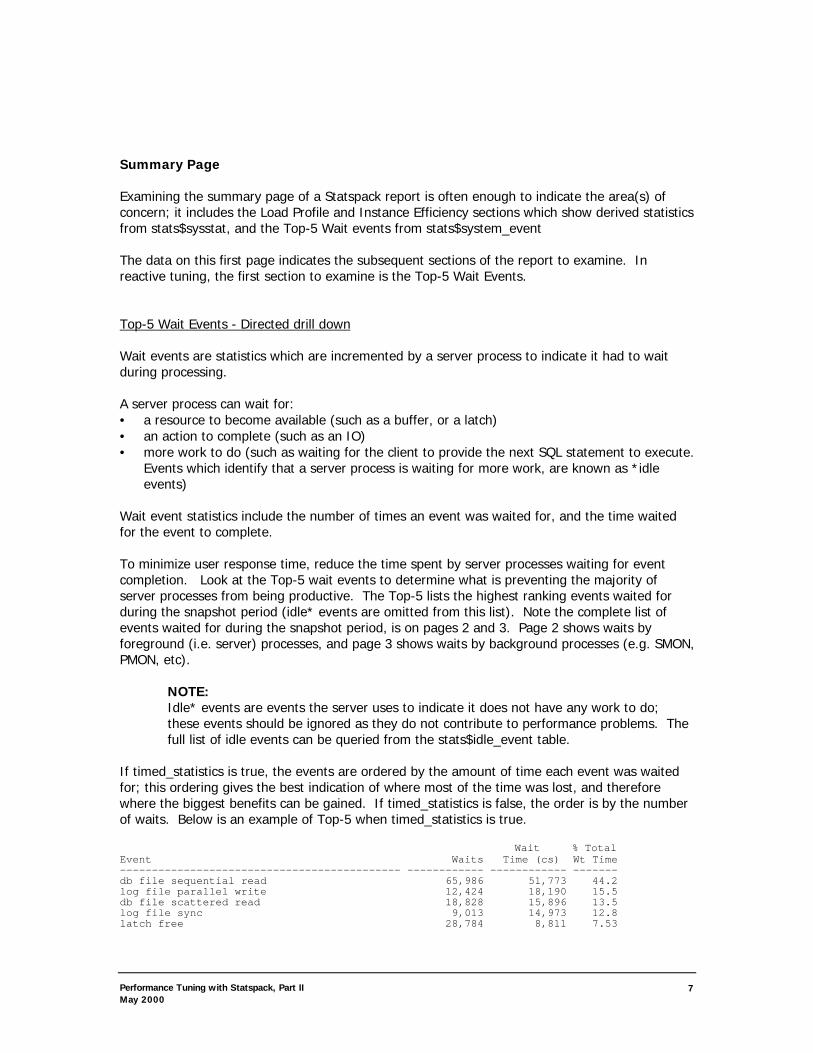
If timed_statistics is true, the events are ordered by the amount of time each event was waitedfor; this ordering gives the best indication of where most of the time was lost, and thereforewhere the biggest benefits can be gained. If timed_statistics is false, the order is by the numberof waits. Below is an example of Top-5 when timed_statistics is true.
Wait % TotalEvent Waits Time (cs) Wt Time-------------------------------------------- ------------ ------------ -------db file sequential read 65,986 51,773 44.2log file parallel write 12,424 18,190 15.5db file scattered read 18,828 15,896 13.5log file sync 9,013 14,973 12.8latch free 28,784 8,811 7.53

Performance Tuning with Statspack, Part IIMay 2000
8
The Top-5 wait events provides direction on the next relevant section in the report to drill-downto. In addition, when observing many waits of a similar type high in the list, this often indicates aspecific area to concentrate on. For example if many IO related events appear high in the list,the IO system may be slow, drill down to the Tablespace and IO statistics sections to investigatewhy.
Below are typical events which frequently appear in the 'Top-5', along with the relevant sectionsto examine:
• ‘db file scattered read’ and ‘db file sequential read’ (and other IO related events) The ‘db file scattered read’ and ‘db file sequential read’ are the two most common Read
events Oracle waits for; db file scattered read indicates a full table scan is occurring, or waitsfor the db file sequential read event which indicates a single block read is occurring (Whichone it waits for depends on the optimizer’s determination of the best way to return therequested data).
The appearance of these events may not necessarily indicate a problem, as IO is a normal
activity on a healthy instance. However, they can indicate problems if any of the followingcircumstances are true:
• The data-access method is bad (that is, the SQL statements are poorly tuned),resulting in unnecessary or inefficient IO operations
• The IO system is overloaded and performing poorly• The IO system is under-configured for the load• IO operations are taking too long
The above are usually tightly integrated.
To determine whether IO is an issue, examine the OS IO statistics (as described earlier) forsymptoms, and compare with average time per read in the File and Tablespace IO sections ofthe Statspack report. If the average time per read in the IO sections is large, and OSstatistics indicate high service times or queue lengths, there is an IO problem.
Examine the SQL ordered by physical reads section of the Statspack report to see if there are
any candidate high-resource SQL statements which can be tuned to reduce the IO load.Tune these statements; tuning high-resource or frequently executed SQL can greatly reducethe IO load.
If the IO system continues to be overloaded, or the read times are still high, examine the
host hardware for disk bottlenecks and identify how the files and/or disks can be reconfiguredto spread the IO load. Further evidence of an IO bandwidth problem is the appearance ofother IO related wait events in the Top 5 (e.g. ‘db file parallel write’, ‘direct read’, ‘directwrite’, and ‘log file parallel write’).
• ‘latch free’ A latch is a low level resource used for protecting internal Oracle memory structures. A wait
Performance Tuning with Statspack, Part IIMay 2000
9
for a ‘latch free’ occurs when a server requests a latch and is unable to immediately acquirethat latch. If latch free waits are high on the list, look at the Latch-specific sections to seewhich latches are contended for.
• ‘enqueue’ An enqueue is another term for a lock. Locks protect shared resources and allow access to
that resource via a queuing mechanism. Lots of time spent waiting for the ‘enqueue’ eventcan be caused by various problems. Look at the Enqueue Statistics section to identify whichare the highest contended enqueues.
• ‘free buffer waits’ A free buffer wait event occurs when a server would like a buffer, but there are no unused
buffers immediately available. If the time spent for ‘free buffer waits’ is significant, this caneither imply the buffer cache is too small, or that DBWR is not writing enough buffers to diskfast enough to keep up with requests for new buffers. Use O/S monitor tools to check theIO system, and look at the Statspack File IO statistics to examine whether the IO systemmay be slowing down DBWR.
• ‘buffer busy wait’ A buffer busy wait event occurs when a server process would like to access a buffer which is
either currently being read into the cache, or is already in the cache but is already being usedin an unsharable way. Check the Buffer Wait Statistics section to identify the contended-forbuffer types, and correlate this data with the wait data in the Tablespace and File IO sectionsto see whether there are any specific files or tablespaces which are experiencing buffercontention more than any others. This is the first step towards find out which segments arecontended for, and why.
• ‘write complete waits’
A write complete wait event occurs when DBWR is writing a block out to disk when a serverprocess would like to use the block; this implies DBWR is too slow (and hence there is an IObottleneck), or the cache is too small, or there is a number of processes performing a largenumbers of indexed buffer gets. Take note of this event if it occurs between checkpoints (thisevent is normal during a checkpoint and can be ignored). To identify whether a SQLstatement is causing large numbers of indexed buffer gets, examine the SQL section orderedby Buffer Gets to identify statements which may not be using the most selective indexes;using non-selective indexes unnecessarily flushes useful buffers from the buffer cache.
Summary Page - The Load Profile
Performance Tuning with Statspack, Part IIMay 2000
10
In reactive tuning, if a baseline report is available, the load profile is examined a sanity check toverify that the baseline and comparison reports both show the system was running comparableworkloads. For example if the load profiles are inconsistent (e.g. one report shows a majority ofread only activity and the second is very update intensive), it is likely the workloads are notsimilar, so comparing these two reports would not be useful.
If the reports are valid to compare, this section is used in a similar way as for proactive tuning -to identify differences between the baseline report and the report generated from the problemtime.
Irrespective of whether there is a comparison baseline report, you should examine the rates inthis section to see if they are high. The method for examining the load profile section reactivelyis very similar to examining this section proactively; for more details on reading the Load Profilesection, refer to ‘Proactively Examining Data’ early in this document.
Instance Efficiency
It is important to understand the application and workload before reading this section of theStatspack reprt, as knowing the application is key in deciding whether the ratios computed aregood or bad. For example in a DSS environment, a low in-memory sort ratio would not be acause for concern, however in an OLTP system, this may be worthy of investigation.
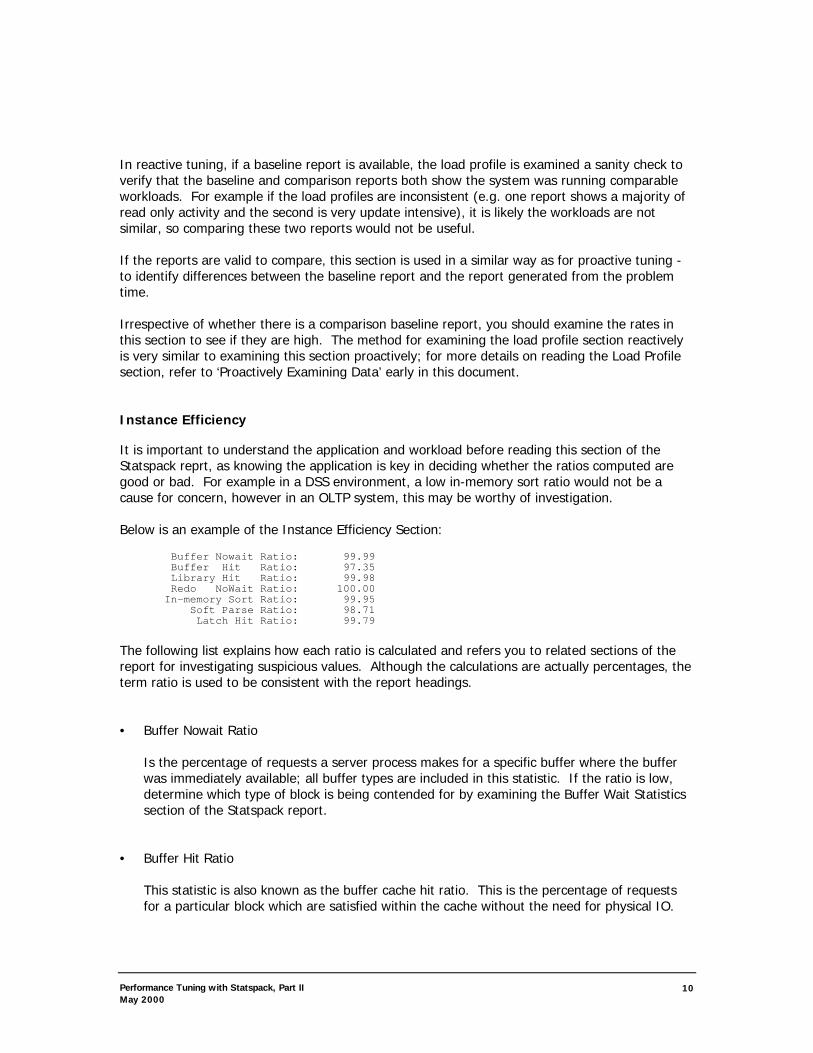
Below is an example of the Instance Efficiency Section:
Buffer Nowait Ratio: 99.99Buffer Hit Ratio: 97.35Library Hit Ratio: 99.98Redo NoWait Ratio: 100.00In-memory Sort Ratio: 99.95
Soft Parse Ratio: 98.71Latch Hit Ratio: 99.79
The following list explains how each ratio is calculated and refers you to related sections of thereport for investigating suspicious values. Although the calculations are actually percentages, theterm ratio is used to be consistent with the report headings.
• Buffer Nowait Ratio
Is the percentage of requests a server process makes for a specific buffer where the bufferwas immediately available; all buffer types are included in this statistic. If the ratio is low,determine which type of block is being contended for by examining the Buffer Wait Statisticssection of the Statspack report.
• Buffer Hit Ratio
This statistic is also known as the buffer cache hit ratio. This is the percentage of requestsfor a particular block which are satisfied within the cache without the need for physical IO.

Performance Tuning with Statspack, Part IIMay 2000
11
Although historically known as one of the most important statistics, the buffer cache hit ratiocan sometimes be misleading. A high (e.g. 99%) cache hit ratio normally indicates the cacheis adequately sized, however this may not be the case in all circumstances. For example,frequently executed SQL statements which repeatedly refer to a small number of buffers viaindexed lookups can skew the buffer gets statistic. When these blocks are read, they areplaced at the most recently used (MRU) end of the buffer cache; iterative access to theseblocks can artificially inflate the cache hit ratio. This makes tuning the buffer cache achallenging activity.
On some sites, it is possible to identify a too small buffer cache by the appearance of the‘write complete waits’ event, which indicates that hot blocks (i.e. blocks which are still beingmodified) are aging out of the cache while they are still needed; check the Wait eventssection for evidence of this event.
Alternatively, a lower buffer cache hit ratio does not necessarily mean the cache is too small;it may be that (potentially valid) full table scans are artificially reducing what is otherwise agood hit ratio.
• Library Hit Ratio
This is also known as the library cache hit ratio. The ratio indicates the number of pinrequests which result in pin hits. A pin hit occurs when the SQL or PL/SQL code you wish toexecute is already in the library cache and is valid to execute.
A low library cache hit percentage could imply SQL is prematurely aging out of the sharedpool as the shared pool may be small, or that unsharable SQL is being used. Also comparewith the soft parse ratio; if they are both low, then investigate whether there is a parsingissue.
• Redo no-wait Ratio
This ratio is indicative of the number of redo-entries generated for which there was spaceimmediately available in the redo log. The percentage is calculated as followed:
100 x (1- (redo log space requests/redo entries))
The ‘redo log space request’ statistic is incremented when an Oracle process attempts towrite a redo entry, however there was not sufficient space remaining in the online redo log.The ‘redo entries’ statistic is incremented for each entry made to the redo log.
Frequent, or slow log switches may be contributing to waits for redo log space. If you areswitching logs frequently (e.g. more than once every 15 minutes) this may be improved byincreasing the size of the online redo logs.
If the log switches are not frequent, check the disks the redo logs reside on to see if logswitches are taking a long time due to a slow IO system. If the IO system is overloaded,either move the redo logs to disks with less activity, place the logs on dedicated disks or

Performance Tuning with Statspack, Part IIMay 2000
12
faster devices.
• In-memory Sort Ratio
This is the percentage of sorts which were performed in memory, rather than sorts whichalso required a disk sort segment to complete. Optimally, in an OLTP environment thepercentage of sorts performed in memory should be high; refer to the Oracle8i Designing andTuning for Performance manual (i.e. the “server tuning” guide) for information on tuningsorts.
• Soft parse ratio
The soft parse ratio shows the total number of parses which were soft.
A soft parse occurs when a session attempts to execute a SQL statement, the statement isalready in the shared pool, and can be used. For a statement to be used (i.e. shared) alldata, (including data such as the optimizer execution plan) pertaining to the existing SQLstatement must be equally applicable to the current statement being issued.
A hard parse occurs when a SQL statement is executed, and the SQL statement is either notin the shared pool, or it is in the shared pool but can not be shared as part of the metadatafor the two SQL statements is different (for example, this may happen if a SQL statement istextually identical as a preexisting SQL statement, but the tables referred to in the twostatements resolve to physically different tables).
In an OLTP environment, hard parses are expensive CPU wise, which adds elapsed time tothe user executing the statement. The aim is to parse once, execute many times. Ideallythe soft parse ratio would be greater than 95%; when the soft parse ratio falls significantlylower than 80%, it may be cause to investigate whether it is possible to share SQL by usingbind variables, or if the code can not be changed, to force cursor sharing by using the newOracle8i release 8.1.6 init.ora parameter cursor_sharing.
As a sanity check, compare this ratio to the hard and soft parse rates (per second) in theLoad Profile. If the rates are low (e.g. 1 per second), parsing may not be a significant issue.
Another useful comparison is against the proportion of parse time that was not CPU-related: (parse time CPU) / (parse time elapsed)
A low value for this ratio could mean that the non-CPU-related parse time was spent waitingfor latches, which might indicate a parsing or latching problem. To investigate further, look atthe shared-pool and library-cache latches in the Latch sections for indications of contentionon these latches.
• Latch Hit Ratio

Performance Tuning with Statspack, Part IIMay 2000
13
This percentage is based on the ratio of the total number of latch misses to the number oflatch gets for all latches. The ratio is indicative of a latching problem if the ratio is low,however as the data is rolled up over all latches, a high ratio can artificially mask a low getrate on a specific latch. Cross check this value with the top-5 wait events to see if ‘latch free’is in the list, and if so, refer to the Latch sections.
Wait Events - Complete list
The next two sections of a Statspack report show the complete list of events waited for; the firstsection shows events waited for by foreground processes (server processes); the second sectionshows events waited for by background processes (e.g. PMON); both lists include idle events,which are listed last.
The complete wait events includes the average amount of time waited for each event inmilliseconds (this data is not present in the Top-5 section). Examine these sections forinordinately large waits. Also ensure no other significant events were waited for which were notbe displayed in the top-5.
Idle events (such as ‘SQL*Net message to client’ and ‘smon timer’) are listed at the bottom ofeach section, to show that these events do not contribute to performance problems.
Wait Events for DB: PERFDB Instance: perfdb Snaps: 79 - 80->cs - centisecond - 100th of a second->ms - millisecond - 1000th of a second (unit often used for OS timings)
AvgTotal Wait wait Waits
Event Waits Timeouts Time (cs) (ms) /txn---------------------------- ------------ ---------- ----------- ----- ------db file sequential read 65,986 0 51,773 8 6.0log file parallel write 12,424 0 18,190 15 1.1db file scattered read 18,828 0 15,896 8 1.7log file sync 9,013 16 14,973 17 0.8latch free 28,784 4,449 8,811 3 2.6control file parallel write 1,244 0 2,345 19 0.1db file parallel write 46 0 1,960 426 0.0SQL*Net more data to client 16,444 0 1,067 1 1.5buffer busy waits 741 0 635 9 0.1inactive session 3 3 303 1010 0.0SQL*Net message from dblink 20 0 287 144 0.0file open 2,357 0 275 1 0.2direct path write 80 0 75 9 0.0SQL*Net break/reset to clien 783 0 45 1 0.1free buffer waits 8 0 29 36 0.0enqueue 19 0 10 5 0.0control file sequential read 195 0 6 0 0.0refresh controlfile command 25 0 6 2 0.0SQL*Net message to dblink 20 0 0 0 0.0SQL*Net message from client 202,549 0 47,073,000 2324 18.5pipe get 6,363 6,363 1,507,343 2369 0.6SQL*Net more data from clien 23,561 0 8,698 4 2.2SQL*Net message to client 202,550 0 103 0 18.5
-------------------------------------------------------------
Background Wait Events for DB: PERFDB Instance: perfdb Snaps: 79 - 80Avg
Total Wait wait WaitsEvent Waits Timeouts Time (cs) (ms) /txn---------------------------- ------------ ---------- ----------- ----- ------log file parallel write 12,422 0 18,189 15 1.1

Performance Tuning with Statspack, Part IIMay 2000
14
control file parallel write 1,244 0 2,345 19 0.1db file parallel write 46 0 1,960 426 0.0latch free 33 31 32 10 0.0log file sync 16 0 16 10 0.0control file sequential read 50 0 3 1 0.0db file sequential read 4 0 3 8 0.0db file scattered read 1 0 3 30 0.0rdbms ipc message 15,012 3,660 1,856,950 1237 1.4smon timer 13 13 390,013 ##### 0.0pmon timer 1,259 1,247 376,973 2994 0.1
-------------------------------------------------------------
SQL ordered by Buffer Gets, Physical Reads and Rows processed
If the report is based on level 5 (or higher) snapshots, high resource SQL statements are shownin the SQL sections of the Statspack report. The first SQL section shows statements ordered bybuffer gets, the second physical reads, and the third ordered by rows processed. These sectionsmake it easy to identify the highest load statements in each category; each section also showsthe percentage of total resource used for each statement.
If the aim is to improve response time, tune the SQL statements which are executed by onlineusers first, but which may performs fewer buffer gets than the top SQL statement, as this willdecrease the user response time.
Alternatively, if you are attempting to tune resource usage, it is best to tune the statement whichuses the most resources first.
It is also important to examine frequently executed SQL statements to see whether they need tobe run that frequently. Unnecessary repetitive execution of SQL usually occurs in two situations:1. a job which runs the SQL is scheduled more frequently than actually needed2. a coding error places a SQL statement inside a loop, when the SQL does not need to be
inside the loop; this results in multiple unneeded executions of a statement, when the SQLonly needs to be executed once (out side the loop).
If CPU is a bottleneck, examine the buffer gets section; this section shows the top SQL whichperformed the most buffer gets. Scanning buffers in the buffer cache consumes significantamount of CPU; tuning these statements to access data efficiently will reduce CPU usage. Anexample of this section is below.
SQL ordered by Gets for DB: PERFDB Instance: perfdb Snaps: 79 - 80
Buffer Gets % ofGets Executes Per Exec Total Hash value-------------- ------------ ------------ ------ ------------
26,863,359 2 13431679.5 22.2 3175109080select group_id, group_type, group_code from groups where gr
19,255,628 48 401158.9 15.9 817705335DELETE FROM EMP WHERE EMP_ID = :b1 AND NOT EXISTS (SELECT EM. . .
If IO is a bottleneck, examine SQL ordered by physical reads. A physical read results when arequired buffer is not in the buffer cache and so requires an IO request to the Operating systemto read that block. Typically these statements will be the biggest IO load on the system - if your

Performance Tuning with Statspack, Part IIMay 2000
15
system is IO bound, tune these statements first.
The output of the ‘SQL ordered by physical reads’ is very similar to the output shown for buffergets above (‘Physical Reads’ substitutes ‘Buffer Gets’, ‘Reads per execute’ substitutes ‘Gets perexecute’).
If the report does not show enough of the SQL text to easily identify the statement, use the hashvalue (which is the statement’s identifying key) to query stats$sql_summary for that hash_valueand snap_id. The sql_text column contains the first 1000 characters of the SQL text:
select sql_textfrom stats$sql_summarywhere snap_id = &snap_idand dbid = &dbidand instance_number = &instance_numberand hash_value = &hash_value;
If the SQL is still not identifiable by viewing the first 1000 characters, and the SQL is still in theshared pool, it is possible view the full text by querying v$sqltext:
select sql_textfrom v$sqltextwhere hash_value = &hash_valueorder by piece;
If a baseline report is available, it is also useful to compare the top-SQL statements in bothreports to see whether SQL statements appearing are the same statements or differentstatements. If the top SQL statements are the same, but the amount of resource used by thoseSQL statements is significantly more, it is likely that either the data volumes have grown, that theexecution plan of the statement has changed, or the parameters passed into the SQL statementare less selective. For example, the rows processed report can show whether a SQL statement isprocessing more rows per execute than historically which can indicate a growing data volume.
If the top statements are different in the two reports, it may be an indication that the twoworkloads may not be comparable, or indicate the workload is changing.
Instance Activity Statistics
This section shows the full list of statistics derived from stats$sysstat, and is typically used forcomparison with a baseline report for differences. It is also used for computing ratios, and forderiving further evidence for the cause of a performance problem.
Commonly referenced statistics in this section include: ‘CPU used by this session’, ‘consistentgets’, ‘db block gets’, ‘enqueue waits’, ‘execute count’, ‘parse count (hard)’ and ‘parse count(total)’, ‘physical reads’, ‘sorts’. Many of the most useful ratios computed from these statisticsappear on the first page of the Statspack report in the Instance Efficiency section.
An important ratio which does not currently appear in the Statspack report is the percentage ofCPU used for parsing, which is calculated by dividing the ‘parse time CPU’ by the total CPU timeused during the snapshot. The total CPU used during this snapshot is actually stored as the ‘CPU

Performance Tuning with Statspack, Part IIMay 2000
16
used by this session’ statistic; this statistic is mis-named, as in the stats$sysstat table it showstotal CPU time used by all sessions. Optimally the computed percentage is low - a high value willmost likely indicate latching problems:
100 * ( parse time cpu / CPU used by this session )
Tablespace and File IO
The tablespace and IO sections are used to identify whether IO is especially slow and/or thereare an exceptional number of IOs on any specific datafiles or tablespaces. If the IO systemseems to be contributing to the performance problem, investigate why: is poor SQL overloadinga capable system (examine the SQL ordered by physical reads section), is the disk layout notoptimized (examine the host IO statistics for potential disk reconfiguration), or is the IO systemno longer able to cope with a growing workload?
Metrics observed here often include:
• Which tablespaces or files have the most read activity (as a percentage of total reads, andalso which have most reads per second).
• Whether most accesses to a file are via a full table scan (multiblock reads); this is shown in
the ‘Avg Blks Rd’ column which is the average number of blocks per read. If this number isgreater than 1 (i.e. a single block access), check to see if the number corresponds to theinstance’s db_file_multiblock_count - if it is similar value, most accesses to this file areperformed by full table scans. This would imply the next section to examine would be theSQL Statements ordered by Physical Reads to identify which statements are causing theload, and to tune them.
• Whether the IO read times are within the acceptable limit (e.g. 20ms-40ms read may be
considered slow for single block reads). Look to see if the disks are capable of the IO ratesrequired - if so, is the file-to-disk layout result in some disks being under-utilized while othersare overly busy?
• Which tablespaces have the most write activity, and the writes per second. If the Temp
tablespace is the highest, this could imply much of the sorting is to disk, and may beoptimized.
• Whether the average wait time for buffers in those files is particularly high. These waits can
be attributed to any buffer wait event such as buffer busy waits or write complete waits.
Note that the file write times are not printed in the Statspack report because they do notrepresent the actual physical write time, due to the batched operation of DBWR.
If IO bottlenecks seem to be causing performance problems, check that the IO load is evenlydistributed across all disks, and try to use OS striping software; optimal IO performance isachieved by distributing database files over as many disks as possible (it is best to keep bothrecoverability and performance in mind when designing your disk layout).

Performance Tuning with Statspack, Part IIMay 2000
17
Buffer wait Statistics section
This section shows the number of waits (and wait times, if timed_statistics is true) for each typeof buffer. Only buffer types with waits are shown.
Examples of typical buffer types waited for include: free list, data block, index block, undo block,undo header, segment header. For example, if the waits are for:
• segment headers - this could be due to contention on freelists and can be alleviated byadding freelists and/or freelist groups
• undo headers - this may indicate more rollback segments are required • freelist blocks - increase the number of freelists in the segment, and for OPS ensure each
instance has it’s own freelist groups
Cross reference this section with the File and Tablespace IO sections to see whether there is aspecific tablespace or file which is suffering from excessive buffer waits. To identify whichsegments are contended for, you will need to perform additional queries while the problem isoccurring.
First identify the file and block:
select p1 file, p2 block, p3 reason
from v$session_waitwhere event = ‘buffer busy waits’;
To identify the segment, execute the following SQL statement, substituting the resulting filenumber and block id from the query above:
select distinct owner, segment_name, segment_typefrom dba_extentswhere file_id = &file_idand &block_number between block_id and block_id + blocks - 1;
Enqueue Activity
This section shows the list of enqueues waited for, including the number of gets and number ofwaits. Waits for enqueues are waits for locks. Typical enqueues waited on are:
• TX: These are transactions locks. Usually the TX locks are in exclusive mode, which meansthe locks are row-level locks; these are sometimes caused by the application architecture. TXlocks in share mode are less common, and are symptomatic of block level InterestedTransaction List (ITL) contention. The only method to determine whether a TX lock is heldexclusive or shared, is by querying V$SESSION_WAIT while the locks are held. The followingquery will show the Lock Type, and the lock mode:
SELECT chr(bitand(p1,-16777216)/16777215)||

Performance Tuning with Statspack, Part IIMay 2000
18
chr(bitand(p1, 16711680)/65535) "Lock", to_char( bitand(p1, 65535) ) "Mode"
FROM v$session_waitWHERE event = 'enqueue';
If the mode is mode is 6, the lock is an Exclusive lock. If the mode is 4, the lock is a Sharelock.
• TM: TM locks are table locks. Waits for these locks are usually due to application issues,possibly because foreign key constraints have not been indexed.
• ST: ST locks are space management locks. Space management contention can be eliminated
by avoiding frequent dynamic space allocation by:• using TEMP tablespaces of type TEMPORARY (rather than of type PERMANENT)• specifying adequate storage clauses• using uniform extent sizes with locally managed tablespaces (space allocation in
locally managed tablespaces does not use the ST enqueues), which helps by notusing the ST enqueue for space allocation
Rollback Segment Statistics and Storage
These two sections show statistics and storage information related to the rollback segments inthe database. Transaction table waits in the Rollback Segment statistics section implies rollbacksegment headers were waited for, which can usually be reduced by increasing the number ofrollback segments. If this is the case, the time spent waiting for buffer busy waits for undosegment header blocks will also be high; cross reference with the buffer waits section to confirmthis.
Latch Activity, Latch Sleep Breakdown and Latch Miss Sources
These are three different consecutive latching sections. If ‘latch free’ is high in the wait events,identify which latches have the most waits.
In the Latch Activity section, the ‘Pct Get Miss’ and ‘Pct NoWait misses’ should be low. ‘Pct GetMiss’ is the percentage of time a latch was requested (in a willing-to-wait mode) and the latchwas not obtained immediately.
For latches requested in ‘No wait’ mode, ‘Pct NoWait misses’ is a percentage based on thenumber of times a latch was requested in nowait mode, and the latch request was not successful.
For willing to wait latch gets, also examine the “Avg Sleeps per miss” statistic which shows theaverage number of times a server process had to sleep before being able to acquire the latch.This statistic should be low.
Look at the raw sleep data in the Latch Sleep Breakdown section, and identify latches which areobtained by spinning or by sleeping, with sleeping being the most expensive method of gettingthe latch.

Performance Tuning with Statspack, Part IIMay 2000
19
The Latch Miss Sources report is primarily useful to Oracle Support staff. The data here is usedto identify the code which was executing at the time the latch was not obtained (i.e. “missed”).
Three of the most common latches waited for are the shared pool, library cache and cachebuffers chains latches.
Latch contention is not usually a problem in itself, but is symptomatic of other issues. Forexample, contention on the shared pool and library cache latches can often be symptomatic ofunnecessary parsing, or of very high rates of logon/logoffs initiated by middle-tier software.Unnecessary parsing can be can be avoided by writing sharable SQL which uses bind variables.Middle tier software can be designed to connect to the database once and maintain theconnections, rather than connect/disconnect from the instance for each database call. Latchcontention for these latches can also be caused by loading large PL/SQL packages into the sharedpool; to avoid this activity, look at pinning these packages to avoid them aging out.
Contention on a cache buffers chains latch can sometimes be caused by very heavy access to asingle block - this would require identifying the hot block, and then why the block is beingcontended for.
Buffer Pool
If multiple buffer pools are used, this report shows the breakdown of the buffer access statisticsand physical read/write statistics for each of the pools. This can help isolate whether a particularpool is having higher contention or IO than the other pools.
Library Cache
This section shows statistics on the Library Cache in the Shared Pool, one line per each type ofdata in the library cache. An important statistic to look at is the number or RELOADS. If thereare significant number of RELOADS, then reusuable information is being aged out of the SGA, andhence having to be reloaded and rebuilt. This indicates the shared pool may need attention(which may include resizing, changing large pool, pinning objects etc).
If the Get Hit Ratio or Pin Hit Ratio is low (i.e. less than .9), it is possible the application is usingunsharable SQL.
Also look for a high number of invalidations. An invalidation occurs when an object in the librarycache is determined to be no longer valid for execution or reference; this housekeeping is doneautomatically by Oracle. One situation where objects are invalidated is when executing DDLoperations frequently. The effects of invalidations can be reduced by executing DDL statementsduring off peak periods.
Non-default init.ora
This section shows all non-defaulted init.ora parameters. The data here will match exactly with
Performance Tuning with Statspack, Part IIMay 2000
20
what is in the init.ora file, unless the DBA had executed an ‘alter system set’ command to changea parameter value dynamically after the instance was started.
Scan this section. The best policy with init.ora parameters is to define the absolute minimum; donot set any parameters unless you clearly understand the need for the parameter, andunderstand when the parameter will no longer be valid for the instance. Also beware of ‘gofaster’ init.ora parameters which are usually unsuccessfully set as quick fixes for performanceproblems.
When statistics and wait events can be misleading
There are certain checks which can be performed to help identify whether a statistic or event isreally of interest.
When timed statistics is false, wait events are ordered by the number of waits. This informationmay indicate which events are of interest, however it may be misleading. An event may bewaited for a large number of times, however the wait time (if it were available for comparison)may show the actual time waited is small despite the high count, hence the event is not really ofinterest.
If wait time is available, a useful comparison can be made by taking the total wait time for anevent, and comparing it to the elapsed time between snapshots. For example, if the wait eventaccounts for only 30 seconds out of a two hour period, there is probably little to be gained byinvestigating this event. However, if the event accounts for 30 minutes of a 45 minute period,the event may be worth investigating. There is a warning here, too: even an event which had await of 30 minutes in a 45 minute snapshot may not be indicative of a problem, when you takeinto account there were 2000 users on the system, and the host hardware was a 64 nodemachine.
When interpreting computed statistics (such as percentages, or per-second rates), it is importantto cross-verify the computed statistic with the actual statistic counts. This acts as a sanity checkto determine whether the derived rates are really of interest. On initial examination, a soft-parseratio of 50% would normally indicate a potential tuning area. However if the actual statisticcounts are small, this would not be an area of interest. For example, if there was one hard parseand one soft parse during the Statspack interval, the soft-parse ratio would be 50%, even thoughthe statistic counts show this is not an area of concern.
SQL Tuning using Statspack - Application or User-local performance issues
For performance issues which are isolated to a particular application or program, the best courseof action is to examine the application code, the SQL issued and the parameters or actionsspecified by the user.
You can use Statspack to identify high-load SQL if a level 5 (or above) snapshot is taken, as theSQL text and resource usage is captured and stored in the stats$sql_summary table. The topSQL statements (according to buffer gets, physical reads and rows processed) are then displayed

Performance Tuning with Statspack, Part IIMay 2000
21
in the report.
Other tools which can be used to identify high-load SQL include SQL trace, Oracle*Trace, orsimply by querying the v$sqlarea view (order the results by the resource you are most interestedin tuning).
Once the poorly-performing SQL is identified, determine how the SQL and/or data design can betuned. Standard performance tuning methodology includes looking at the execution plan of theSQL, the data volumes, the indexing, table structure and any view definitions. If a proceduralprogramming language is used, is the program flow correct, have unnecessary database calls beavoided by storing data locally, and check if there is any SQL placed in a loop which only needs tobe executed once outside the loop.
Also note data in the stats$sql_summary table can be queried for analysis and comparison of howthe resource usage of the SQL statement has changed over time. If a poorly performing SQLstatement is identified, it may be possible to find the same statement in the stats$sql_summarytable which executed at an earlier date by querying on the hash_value; look at the characteristicsof the statement to see how it has changed - is the statement using more resources now thanhistorically? Examining whether a SQL statements resource usage has changed can often helpdetect whether an index has been lost, or whether the Cost Based Optimizer statistics are nolonger valid. For example, if the buffer gets or physical reads change, the change may be causedby a variance in the execution plan.
Making Changes to Improve performance
Often at the end of a tuning exercise it is possible to identify two or three changes which willpotentially help alleviate the problem. To be able to identify which change provides the mostbenefit, it is recommended that only one change be implemented at a time, and the effect of thechange measured by using the baselines performance measurements defined in the problemdefinition phase.
Typically most sites with dire performance problems implement a number of overlapping changesat once, and thus do not have the ability to identify which changes provided any benefit.Although this is not immediately an issue, this does become a significant hinderance if any similarproblems subsequently appear, as it is not possible to know which of the changes provided themost benefit and hence know which efforts to prioritize.
If it is not possible to implement changes separately, identify whether it is possible to measurethe effects of dissimilar changes. For example, it is possible to measure the effect of making aninit.ora change to optimize redo generation separately from the effect of creation of a new indexto improve the performance of a modified query. It is impossible to measure the benefit ofperforming an OS upgrade if SQL is tuned, the OS disk layout is changed, and the init.oraparameters are also changed at the same time.
Performance tuning is an iterative process; it is atypical to find a ‘silver bullet’ which solves aninstance-wide performance problem. In the majority of cases, gaining excellent performancerequires iteration through the performance tuning phases, as solving one bottleneck often

Performance Tuning with Statspack, Part IIMay 2000
22
uncovers another (sometimes worse) problem to be solved.
Knowing when to stop tuning is also key - the most important measure of performance is userperception, rather than how close the statistic is to an ideal value.
AUTHORS:Connie Dialeris and Graham Wood
WITH THANKS:To Richard Powell for his excellent Notes on Performance Tuning, and to Cecilia Gervasio, RussellGreen and Patrick Tearle for their reviews and feedback.
Revision: 01.03
Oracle CorporationWorld Headquarters500 Oracle ParkwayRedwood Shores, CA 94065U.S.A.
Worldwide Inquiries:+1.650.506.7000Fax +1.650.506.7200http://www.oracle.com/
Copyright © Oracle Corporation 2000All Rights Reserved
This document is provided for informational purposes only, and theinformation herein is subject to change without notice. Pleasereport any errors herein to Oracle Corporation. Oracle Corporationdoes not provide any warranties covering and specificallydisclaims any liability in connection with this document.
Oracle is a registered trademark, and Oracle8i, Oracle8, PL/SQL,and Oracle Expert are trademarks of Oracle Corporation. All othercompany and product names mentioned are used for identificationpurposes only and may be trademarks of their respective owners.