Chapter 7: Ecology - Ocala-CHC - home · •environment biotic f actor ecology abiotic factor FCAT...
28
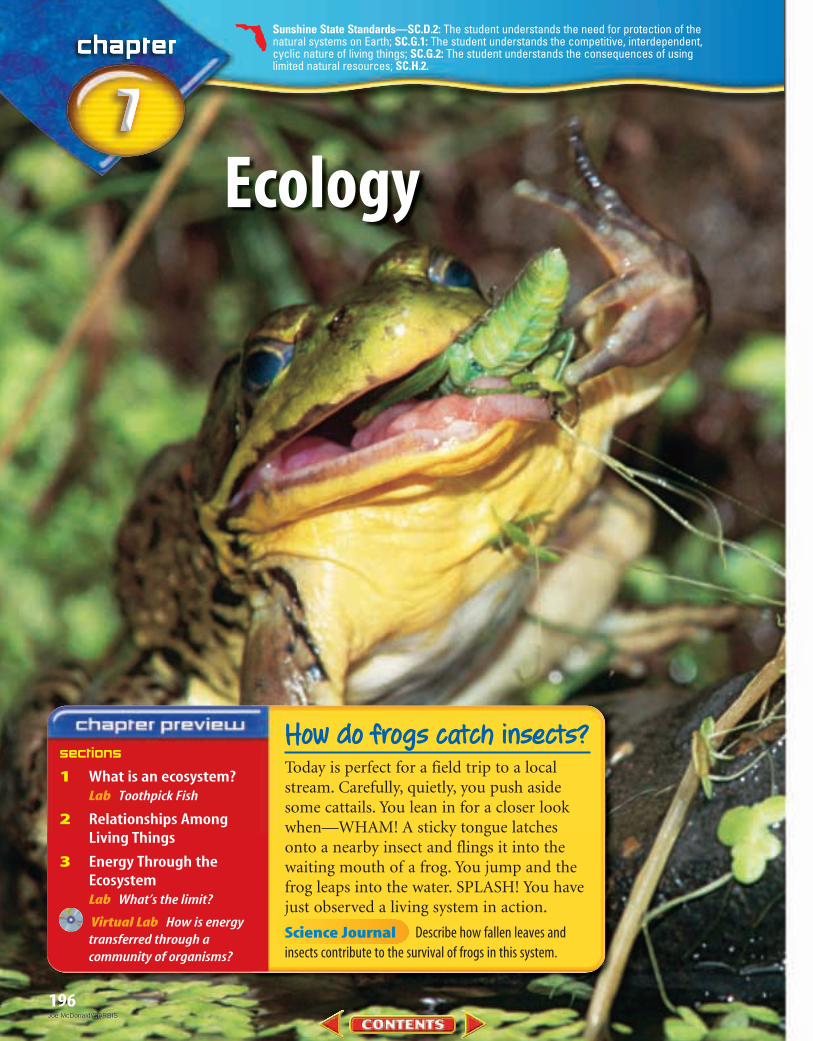
196 Ecology sections 1 What is an ecosystem? Lab Toothpick Fish 2 Relationships Among Living Things 3 Energy Through the Ecosystem Lab What’s the limit? Virtual Lab How is energy transferred through a community of organisms? How do frogs catch insects? Today is perfect for a field trip to a local stream. Carefully, quietly, you push aside some cattails. You lean in for a closer look when—WHAM! A sticky tongue latches onto a nearby insect and flings it into the waiting mouth of a frog. You jump and the frog leaps into the water. SPLASH! You have just observed a living system in action. Describe how fallen leaves and insects contribute to the survival of frogs in this system. Science Journal Sunshine State Standards—SC.D.2: The student understands the need for protection of the natural systems on Earth; SC.G.1: The student understands the competitive, interdependent, cyclic nature of living things; SC.G.2: The student understands the consequences of using limited natural resources; SC.H.2. Joe McDonald/CORBIS Joe McDonald/CORBIS
-
Upload
doankhuong -
Category
Documents
-
view
243 -
download
3
Transcript of Chapter 7: Ecology - Ocala-CHC - home · •environment biotic f actor ecology abiotic factor FCAT...
196
Ecology
sections
1 What is an ecosystem?Lab Toothpick Fish
2 Relationships AmongLiving Things
3 Energy Through theEcosystemLab What’s the limit?
Virtual Lab How is energytransferred through acommunity of organisms?
How do frogs catch insects?Today is perfect for a field trip to a localstream. Carefully, quietly, you push asidesome cattails. You lean in for a closer lookwhen—WHAM! A sticky tongue latchesonto a nearby insect and flings it into thewaiting mouth of a frog. You jump and thefrog leaps into the water. SPLASH! You havejust observed a living system in action.
Describe how fallen leaves andinsects contribute to the survival of frogs in this system.Science Journal
Sunshine State Standards—SC.D.2: The student understands the need for protection of thenatural systems on Earth; SC.G.1: The student understands the competitive, interdependent,cyclic nature of living things; SC.G.2: The student understands the consequences of usinglimited natural resources; SC.H.2.
Joe McDonald/CORBISJoe McDonald/CORBIS
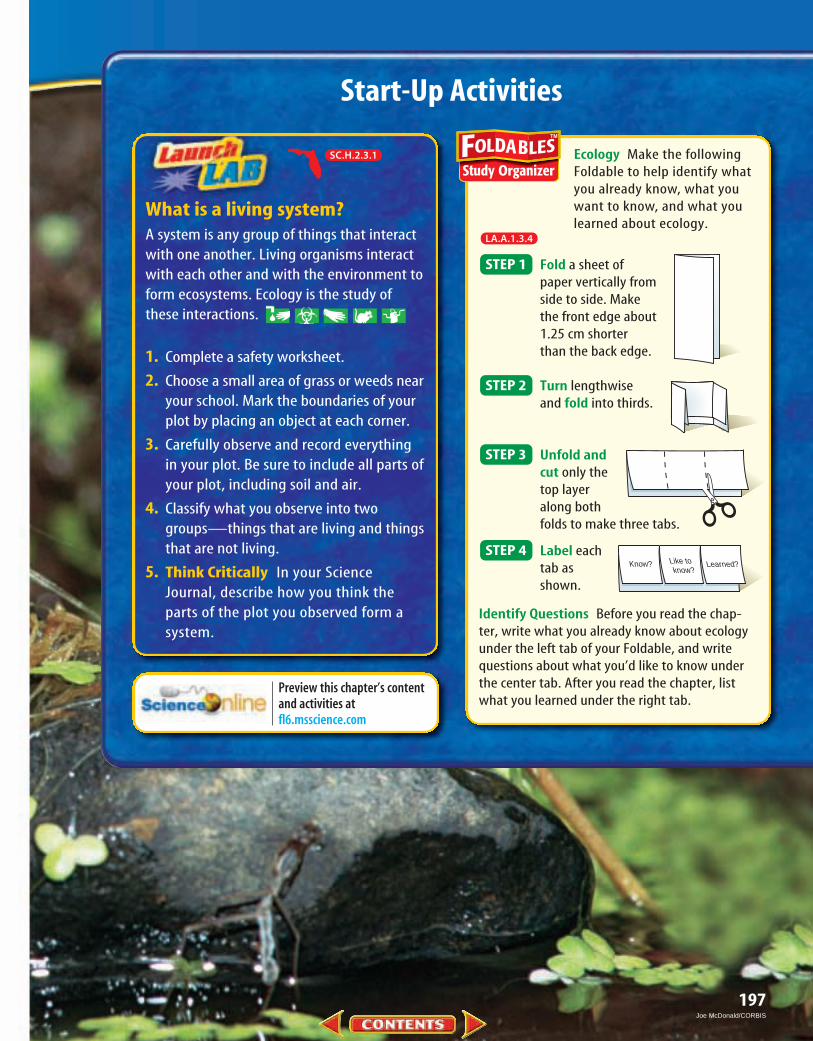
Ecology Make the followingFoldable to help identify whatyou already know, what youwant to know, and what youlearned about ecology.
Fold a sheet ofpaper vertically fromside to side. Makethe front edge about1.25 cm shorterthan the back edge.
Turn lengthwiseand fold into thirds.
Unfold and cut only the top layer along both folds to make three tabs.
Label eachtab asshown.
Identify Questions Before you read the chap-ter, write what you already know about ecologyunder the left tab of your Foldable, and writequestions about what you’d like to know underthe center tab. After you read the chapter, listwhat you learned under the right tab.
STEP 4
STEP 3
STEP 2
STEP 1
What is a living system?A system is any group of things that interactwith one another. Living organisms interactwith each other and with the environment toform ecosystems. Ecology is the study ofthese interactions.
1. Complete a safety worksheet.
2. Choose a small area of grass or weeds nearyour school. Mark the boundaries of yourplot by placing an object at each corner.
3. Carefully observe and record everythingin your plot. Be sure to include all parts ofyour plot, including soil and air.
4. Classify what you observe into twogroups—things that are living and thingsthat are not living.
5. Think Critically In your ScienceJournal, describe how you think theparts of the plot you observed form asystem.
Start-Up Activities
Preview this chapter’s contentand activities at fl6.msscience.com
Know? Learned?Like to know?
197
SC.H.2.3.1
LA.A.1.3.4
Joe McDonald/CORBIS

198 CHAPTER 7 Ecology
EcosystemsTake a walk outside and look around. If you observe an area
closely, you might see many different organisms (OR guh nihzumz) living there. In your backyard, you might see squirrels,birds, insects, grass, and shrubs. These organisms, along with the nonliving things in the yard, such as soil, air, and light, makean ecosystem (EE koh sihs tum). An ecosystem is made up oforganisms interacting with one another and with nonliving fac-tors to form a working unit. Figure 1 shows an example of astream ecosystem.
What does it mean to say that one organism interacts withanother organism? Think back to the field trip at the beginningof the chapter. When the frog ate the insect, an interactionoccurred between two organisms living in the same ecosystem.
■ Describe the living and nonlivingfactors in an ecosystem.
■ Explain how the parts of anecosystem interact.
Understanding interactions of anecosystem will help you understandyour role in your ecosystem.
What is an ecosystem?
Benchmarks—SC.D.2.3.1 (p. 205): The student understands that the quality of life is relevant to personalexperience; SC.G.2.3.2 (pp. 198–205): The student knows that all biotic and abiotic factors are interrelatedand that if one factor is changed or removed, it impacts the availability of other resources within the sys-tem; SC.H.2.3.1 (pp. 197, 198–199): The student recognizes that patterns exist within and across systems.
Also covers: SC.D.1.3.4 Annually Assessed (p. 202), SC.G.1.3.4 Annually Assessed (p. 205), SC.H.1.3.5Annually Assessed (p. 203), SC.H.1.3.7 Annually Assessed (p. 206)
Review Vocabularyorganism: any living thing;
uses energy, is made of cells,reproduces, responds, and grows
New Vocabularyecosystem • biosphere
• environment biotic factor
• ecology abiotic factor
FCAT Vocabulary
(tl)D
avid
M.
Den
nis/
Tom
Sta
ck &
Ass
oc.,
(bl)T
odd
Gip
stei
n/P
hoto
Res
earc
hers
, (b
kgd)
Car
r C
lifto
n/M
inde
n P
ictu
res

What does it mean to say that an organism interacts with the nonliving parts of an ecosystem? Think about thefield trip again. What did the frog do when it spotted yourmovement? It dove into the stream, probably for safety. Thefrog uses the stream for shelter. This is an example of aninteraction between a living organism and a nonliving part ofan ecosystem. All conditions, both living and nonliving, thatsurround and affect an organism are called its environment.
Patterns that exist in one environment can affect other envi-ronments. For example, a hurricane over an ocean environmenthas a great effect when it travels over land environments.
Figure 1 Let’s identify the living and nonlivingparts of this stream ecosystem. Rocks and waterare nonliving things. Water striders are alive—these insects skim the surface of the water. Algae,fish, crayfish, and mosses covering rocks are otherliving parts of this ecosystem.Describe how these living organisms interact withnonliving parts of the ecosystem.
SECTION 1 What is an ecosystem? 199(tr)Harold R. Hungerford/Photo Researchers, (bl)Colin Milkins/OSF/Animals Animals, (br)Ed Reschke/Peter Arnold, Inc., (bkgd)Carr Clifton/Minden Pictures(tr)Harold R. Hungerford/Photo Researchers, (bl)Colin Milkins/OSF/Animals Animals, (br)Ed Reschke/Peter Arnold, Inc., (bkgd)Carr Clifton/Minden Pictures

The Study of Ecosystems When you study the interactionsin an ecosystem, you are studying the science of ecology (ih KAHluh jee). Ecology is the study of the interactions that take placeamong the living organisms and nonliving parts of an ecosystem.Ecologists spend most of their time outdoors, observing the sub-ject matter in the field. Just as you knelt quietly in the cattails onyour field trip, an ecologist might spend hours by a stream,watching, recording, and analyzing what goes on there. In addi-tion, like other scientists, ecologists also conduct experiments inlaboratories. For instance, they might need to analyze samples ofstream water. The observations in the field and laboratory workhelp give a complete picture of an ecosystem.
The Largest Ecosystem Ecosystems come in all sizes. Someare small, like a pile of leaves. Others are big, like a forest. Figure 2shows the biosphere (BI uh sfihr), the largest ecosystem onEarth. The biosphere is the part of Earth where organisms canlive. It includes the topmost layer of Earth’s crust; all the oceans,rivers, and lakes; and the surrounding atmosphere. The bio-sphere is made up of all the ecosystems on Earth combined.
How many different ecosystems are part of the biosphere?Let’s list a few. There are deserts, mountains, rivers, prairies, wet-lands, forests, plains, oceans—the list can go on and on, and wehaven’t even gotten to smaller ecosystems yet, such as a vacantlot or a rotting tree trunk. The number of ecosystems that makeup the biosphere is almost too many to count. How would youdescribe your ecosystem?
Living Parts of EcosystemsEach ecosystem in the biosphere contains
many different living organisms. Think abouta rotting tree trunk. It’s a small ecosystemcompared to a forest, but the tree trunk maybe home to bacteria, bees, beetles, mosses,mushrooms, slugs, snails, snakes, wildflowers,woodpeckers, and worms. The organisms thatmake up the living part of an ecosystem arecalled biotic factors. An organism dependson other biotic (bi AH tihk) factors for food,shelter, protection, and reproduction. Forexample, a snake might use a rotting log forshelter. Termites are insects that depend on thesame log for food. Figure 3 shows some of thebiotic factors in an estuary ecosystem.
Figure 2 The biosphere is thepart of Earth that contains all theliving things on the planet. Eachecosystem that you study is partof the biosphere.
200 CHAPTER 7 Ecology
Topic: Mangrove EcosystemsVisit fl6.msscience.com for Web links to information aboutmangrove ecosystems.
Activity Write a paragraphdescribing how two differentorganisms interact with each other and with abiotic factors in a mangrove ecosystem.
LA.B.2.3.1
LA.B.2.3.4
SSEC/University of Wisconsin at Madison

Cypress tree
Osprey nest
The osprey, a member of theeagle family, has a diet consistingmostly of fish. The shallow watersof the estuary make hunting easier.
The low salt content of the waterof the estuary keeps the predatorsof the American oyster away.
Redhead duck
Striped mulletBay scallop
Plankton
Seagrasses provide habitatand food for many species.
The manatee is protected from predators inthe slow-moving water of the estuary. Themanatee's primary food source, seagrass, isabundant in the shallow waters of the estuary.
Brown pelican
Red mangrove
The horseshoe crabcomes on land oncea year to mate andlay eggs.
Figure 3
VISUALIZING BIOTIC FACTORS
Water birds, oysters, jellies, and fish are just some of the organisms that make up an estuary’s living, or biotic, factors. An estuary is an ecosystem formed
where freshwater from rivers and streams mixes with the salty water from the ocean, like the Apalachee Bay near Tallahassee, Florida.Water in an estuary is saltier than freshwater but less salty than waterfrom the ocean. An estuary is protected from tides by reefs, islands, mud, or sand. These conditions make a unique habitat.
Life in an estuary is specially adapted to living there. An estuary provides a rest stop for migrating birds, a protected nursery for fish and shellfish, as well as a home for many plants and otheranimals. Organisms such as horseshoe crabs, ospreys, manatees, mangroves, and seagrasses thrive in this habitat. They interact with each other and with the nonliving parts of the ecosystem, such as the sunlight, air, water, and soil.

202 CHAPTER 7 Ecology
Nonliving Parts of EcosystemsEarlier, you listed the parts that make up an ecosystem near
your school. Was your list limited to the living organisms—thebiotic factors—only? No. You included nonliving factors, too,such as air and soil. The nonliving things found in an ecosys-tem are called abiotic (ay bi AH tihk) factors. Look for someabiotic factors in the estuary shown in Figure 3. Abiotic factorsaffect the type and number of organisms living in ecosystems.Let’s take a closer look at some abiotic factors.
Soil One abiotic factor that can affect which plants and otherorganisms are found in an ecosystem is soil. It is made up of sev-eral ingredients, much like a recipe. Soil is made up of a combi-nation of minerals, water, air, and organic matter—the decayingparts of plants and animals. You know that salt, flour, and sugarare found in many recipes. But not all foods made from thesesame ingredients taste or look the same. Cakes and cookies lookand taste different because different amounts of salt, flour, andsugar are used to make them. It’s the same with soil. Differentamounts of minerals, organic matter, water, and air make differ-ent types of soil, as shown in Figure 4.
What ingredients make up soil?
Figure 4 Different types of soilsupport different kinds of plantlife. Cactus and other desert plantscan thrive in dry, sandy, or rockysoils. Forest soils are deep, moist,and full of nutrients from decayingleaves.
(l)Charlie Ott/Photo Researchers, (r)Terry Donnelly/Tom Stack & Assoc.

Different soils offer different materials and conditions fororganisms. If you’ve ever visited a gardening store, you’ve seenall kinds of products gardeners add to their soil to make it justright for the types of plants they want to grow. The next timeyou dig a hole, take a close look at the soil. Is it dry? Does it havea lot of dead leaves and twigs in it? Is it tightly packed or looseand airy?
Temperature Soil is only one of the factors that affect theorganisms that live in an ecosystem. Temperature also deter-mines which organisms live in a particular place. How do thetropical plants shown in Figure 5 compare with the mountain-side plants? Predict what would happen if the organisms on themountainside were moved to a hot climate such as a tropicalrain forest.
Figure 5 Plants have adaptations for theirenvironments. The mountainside wildflowersgrow in clusters close to the ground, whichprotects them from strong winds. The tropicalplants have large leaves to absorb as muchlight as possible in the dim light of the rainforest floor.
Observing SoilCharacteristicsProcedure1. Complete a safety
worksheet.2. Using different amounts of
the materials available tocreate two different “soilrecipes,” fill two cups withsoil. Pack the soil equallyinto each cup.
3. Pour equal amounts ofwater into each cup.
4. After a minute or so, tipthe cups over to see if anywater pours out.
5. Observe the characteristicsof the soils you made.Record your observationsin your Science Journal.
Analysis1. What was the difference
between the soil in thetwo cups to start with?
2. Was there a difference in how the soil in each cup held water? Whatenvironments might havesoils like these?
203
SC.H.1.3.5
(l)F.
Stu
art
Wes
tmor
land
/Pho
to R
esea
rche
rs,
(r)J
im Z
ipp/
Pho
to R
esea
rche
rs

204 CHAPTER 7 Ecology
Water Another important abiotic factor is water. Inthe field trip to the stream at the beginning of thechapter, maybe you saw a sleek trout dart through thewater. Some organisms, such as fish, whales, and algae(AL jee), are adapted for life in water, not on land. Butthese organisms depend upon water for more thanjust a home. Water helps all living things carry outimportant life processes such as digestion and wasteremoval. In fact, most cells are made up largely ofwater. Iceberg lettuce is about 95 percent water!Scientists estimate that two-thirds of the weight of thehuman body is water, as shown in Figure 6. Do youknow how much you weigh? Calculate about howmuch of your weight is made up of water.
Because water is so important to livingthings, it is also important to an ecosystem.The amount of water available in an ecosys-tem can determine how many organisms canlive in a particular area. It can also serve asshelter and as a way to move from place toplace.
Sunlight The Sun is the main source ofenergy for most organisms on Earth. Energyfrom the Sun is used by green plants to pro-duce food. Humans and other animals thenobtain their energy by eating these plantsand other organisms that have fed on theplants. When you eat food produced by aplant, you are consuming energy that startedout as sunlight. You’ll learn more about thetransfer of energy in an ecosystem later inthis chapter.
Why are water and sunlightimportant to ecosystems?
Figure 6 Sunlight and water are two abioticfactors essential to ecosystems. Water isimportant to humans because about 66 percentof our bodies is composed of water.Explain why most ecosystems could not existwithout sunlight.
Francois Gohier/Photo Researchers

SECTION 1 What is an ecosystem? 205
Self Check1. Describe two ways in which an organism can interact
with the other biotic factors of the ecosystem in whichit lives.
2. Explain four ways in which abiotic factors are impor-tant to an ecosystem.
3. Compare and contrast the meanings of the termsecosystem and biosphere.
4. Think Critically You have been asked to design a spacestation on the Moon. Use your knowledge of ecosys-tems to describe how you would develop your design.
SC.G.2.3.1
SC.G.2.3.1
SummaryEcosystems
• Ecosystems are made up of organisms thatinteract with each other and with the nonliv-ing parts of the environment.
• Ecology is the study of interactions that occurin ecosystems.
• The biosphere is the part of Earth that sup-ports life.
Living Parts of Ecosystems
• Biotic factors are the organisms in an ecosystem.
Nonliving Parts of Ecosystems
• Abiotic factors include soil, temperature,water, and sunlight.
A Balanced System
• Ecosystems change over time.
5. Describe the ecosystem that you are a part of. Whatare the biotic factors? The abiotic factors? What kinds of interactions take place in your ecosystem?
A Balanced SystemEvery ecosystem is made up of many
different biotic and abiotic factors work-ing together. When these factors are inbalance, the system is in balance, too.
Ecosystems are constantly changing.These changes affect the quality of life indifferent ways for different organisms. Forexample, hurricanes can change an ecosys-tem greatly, as shown in Figure 7. They areextremely destructive, causing erosion, fishkills, and loss of beach vegetation. Thebeach vegetation clogs the waterways caus-ing oxygen depletion. However, the flood-ing caused by hurricanes adds soil andnutrients to marshes. This can make themarshes healthier by allowing new growthand habitat. Nutrients tied up in the bot-tom water can be stirred up and mixedback into the aquatic system, having bene-ficial, long-term effects. Studies also haveshown that some aquatic animals thriveafter a hurricane, due to less competitionand nutrient-rich waters. Now the ecosys-tem must reach a new balance.
Figure 7 Hurricane-forcewinds destroyed the treesand fruit in this orangegrove. This environmentmight recover over time buthabitats have been lost temporarily.
More Section Review fl6.msscience.com
SC.G.2.3.1
(t)Wendell Metzen/Index Stock Imagery, (b)Joshua Rodas/Getty Images
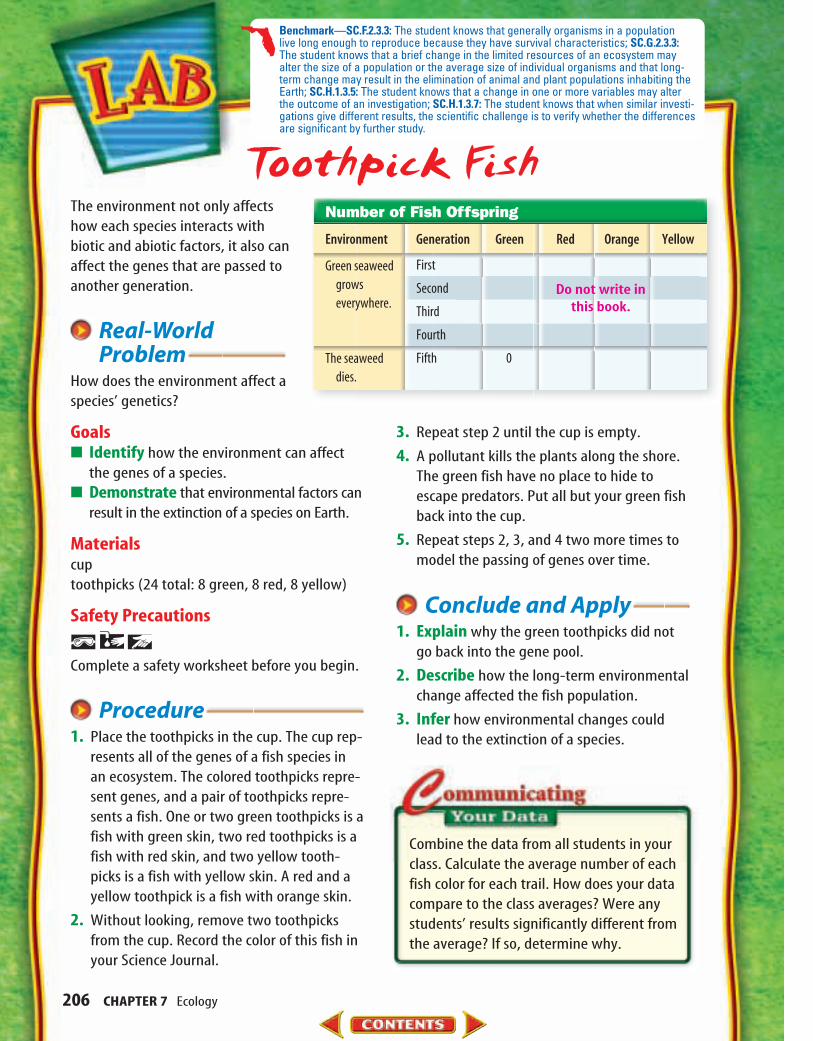
The environment not only affectshow each species interacts withbiotic and abiotic factors, it also canaffect the genes that are passed toanother generation.
Real-WorldProblem
How does the environment affect aspecies’ genetics?
Goals■ Identify how the environment can affect
the genes of a species.■ Demonstrate that environmental factors can
result in the extinction of a species on Earth.
Materialscuptoothpicks (24 total: 8 green, 8 red, 8 yellow)
Safety Precautions
Complete a safety worksheet before you begin.
Procedure1. Place the toothpicks in the cup. The cup rep-
resents all of the genes of a fish species inan ecosystem. The colored toothpicks repre-sent genes, and a pair of toothpicks repre-sents a fish. One or two green toothpicks is afish with green skin, two red toothpicks is afish with red skin, and two yellow tooth-picks is a fish with yellow skin. A red and ayellow toothpick is a fish with orange skin.
2. Without looking, remove two toothpicksfrom the cup. Record the color of this fish inyour Science Journal.
3. Repeat step 2 until the cup is empty.
4. A pollutant kills the plants along the shore.The green fish have no place to hide toescape predators. Put all but your green fishback into the cup.
5. Repeat steps 2, 3, and 4 two more times tomodel the passing of genes over time.
Conclude and Apply1. Explain why the green toothpicks did not
go back into the gene pool.
2. Describe how the long-term environmentalchange affected the fish population.
3. Infer how environmental changes couldlead to the extinction of a species.
Toothpick Fish
Combine the data from all students in yourclass. Calculate the average number of eachfish color for each trail. How does your datacompare to the class averages? Were anystudents’ results significantly different fromthe average? If so, determine why.
206 CHAPTER 7 Ecology
Number of Fish Offspring
Environment Generation Green Red Orange Yellow
Green seaweed grows everywhere.
The seaweed dies.
First
Second
Third
Fourth
Fifth 0
Benchmark—SC.F.2.3.3: The student knows that generally organisms in a populationlive long enough to reproduce because they have survival characteristics; SC.G.2.3.3:The student knows that a brief change in the limited resources of an ecosystem mayalter the size of a population or the average size of individual organisms and that long-term change may result in the elimination of animal and plant populations inhabiting theEarth; SC.H.1.3.5: The student knows that a change in one or more variables may alterthe outcome of an investigation; SC.H.1.3.7: The student knows that when similar investi-gations give different results, the scientific challenge is to verify whether the differencesare significant by further study.
Do not write in this book.

SECTION 2 Relationships Among Living Things 207
Organizing EcosystemsImagine trying to study all of the living things on Earth at
once! When ecologists study living things, they usually don’tstart by studying the entire biosphere. Remember, the biosphereconsists of all the parts of Earth where organisms can live. It’smuch easier to begin by studying smaller parts of the biosphere.
To separate the biosphere into smaller systems that are eas-ier to study, ecologists find it helpful to organize living thingsinto groups. They then study how members of a group interactwith each other and their environments.
Groups of Organisms Look at the fish in Figure 8. This par-ticular kind of fish lives in a coral reef in the warm, shallowwaters near Florida. The fish uses energy, grows, reproduces, andeventually dies. The coral reef is the ecosystem the fish lives in.All of the fish that live in this particular coral reef make up apopulation. A population is a group of the same type of organ-isms living in the same place at the same time. Some other pop-ulations that you might find in a coral reef ecosystem aresponges, algae, sharks, and coral. What are some populations oforganisms that live around your school?
Relationships Among Living Things
■ Explain how ecologists organizeliving systems.
■ Describe relationships among living things.
Learning how living things relate toone another will help you under-stand how you depend on otherorganisms for survival.
Figure 8 This school of blue-striped grunt fish belongs to thepopulation of fish living in a coralreef ecosystem.
Benchmarks—SC.H.2.3.1 (p. 207): The student recognizes that patterns exist within and across systems.
Also covers: SC.D.1.3.2 Annually Assessed (p. 207), SC.G.2.3.3 (p. 209)
Review Vocabularyadaptation: any variation that
makes an organism better suitedto its environment
New Vocabularypopulationcommunity
• limiting factor
• nichehabitat
FCAT Vocabulary
Stephen Frink/CORBIS

208 CHAPTER 7 Ecology
Groups of Populations Many populations live in an ecosys-tem like the coral reef in Figure 9. All of the populations that livein an area make up a community (kuh MYEW nuh tee). Themembers of a community depend on each other for food, shel-ter, and other needs. For example, a shark depends on the fishpopulations for food. The fish populations, on the other hand,depend on coral animals to build the reef that they use to hidefrom the sharks.
No matter where you live, you are part of a community.Make a list of as many of the populations that make up yourcommunity as you can. Compare your list with the lists of yourclassmates. How many populations did the class come up with?
In what ways do the members of a communitydepend on each other?
Characteristics of Populations Look around your class-room. Is the room big or small? How many students are in yourclass? Are there enough books and supplies for everyone?Ecologists ask questions like these to describe populations. Theywant to know the size of the population, where its members live,and how it is able to stay alive. These characteristics exist for anypopulation, from bacteria to people.
Population Density Think about your classroom. A popula-tion of 25 students in a large room has plenty of space. Howwould the same 25 students fit into a smaller room? Ecologistsdetermine population density (DEN suh tee) by comparing thesize of a population with its area. For instance, if 100 dandelionsare growing in a field that is one square kilometer in size, thenthe population density is 100 dandelions per square kilometer.
CalculatingPopulation DensityProcedure1. Using a measuring tape,
calculate the total area ofyour home by multiplyingthe length times the widthof each room and addingall the products together.
2. Count the number ofpeople who live in yourhome.
3. Divide the number ofpeople living in your homeby the total area todetermine the populationdensity.
Analysis1. Calculate what would
happen to the populationdensity if the number ofpeople living in your homedoubled. If it doubled again?
2. Explain how increasingpopulation density in your home could affectavailability of resources in your home.
Figure 9 Many populationsmake up a coral reef community.Identify three populations in thiscoral reef community.
Stephen Frink/CORBIS
SECTION 2 Relationships Among Living Things 209
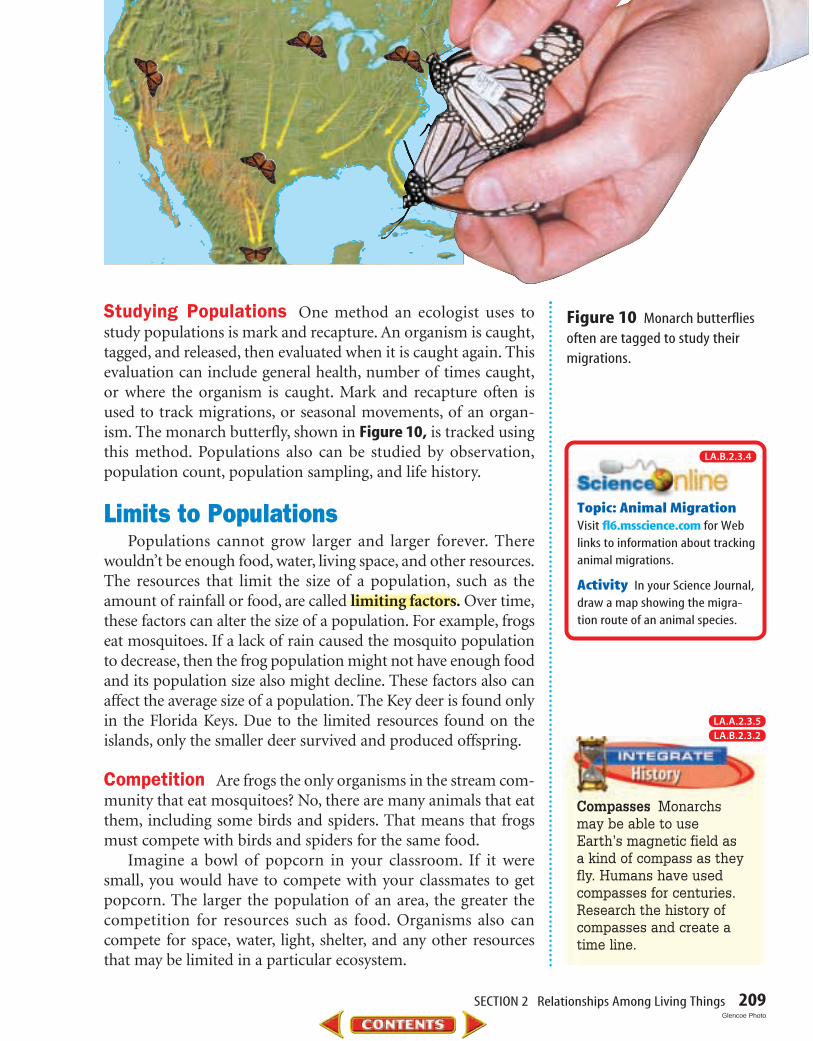
Studying Populations One method an ecologist uses tostudy populations is mark and recapture. An organism is caught,tagged, and released, then evaluated when it is caught again. Thisevaluation can include general health, number of times caught,or where the organism is caught. Mark and recapture often isused to track migrations, or seasonal movements, of an organ-ism. The monarch butterfly, shown in Figure 10, is tracked usingthis method. Populations also can be studied by observation,population count, population sampling, and life history.
Limits to PopulationsPopulations cannot grow larger and larger forever. There
wouldn’t be enough food, water, living space, and other resources.The resources that limit the size of a population, such as theamount of rainfall or food, are called limiting factors. Over time,these factors can alter the size of a population. For example, frogseat mosquitoes. If a lack of rain caused the mosquito populationto decrease, then the frog population might not have enough foodand its population size also might decline. These factors also canaffect the average size of a population. The Key deer is found onlyin the Florida Keys. Due to the limited resources found on theislands, only the smaller deer survived and produced offspring.
Competition Are frogs the only organisms in the stream com-munity that eat mosquitoes? No, there are many animals that eatthem, including some birds and spiders. That means that frogsmust compete with birds and spiders for the same food.
Imagine a bowl of popcorn in your classroom. If it weresmall, you would have to compete with your classmates to getpopcorn. The larger the population of an area, the greater thecompetition for resources such as food. Organisms also cancompete for space, water, light, shelter, and any other resourcesthat may be limited in a particular ecosystem.
Figure 10 Monarch butterfliesoften are tagged to study theirmigrations.
Topic: Animal MigrationVisit fl6.msscience.com for Web links to information about trackinganimal migrations.
Activity In your Science Journal,draw a map showing the migra-tion route of an animal species.
Compasses Monarchsmay be able to useEarth’s magnetic field asa kind of compass as theyfly. Humans have usedcompasses for centuries.Research the history ofcompasses and create atime line.
LA.B.2.3.2LA.A.2.3.5
LA.B.2.3.4
Glencoe Photo

210 CHAPTER 7 Ecology
Where and How Organisms LiveHow can a small ecosystem such as a classroom aquarium
support a variety of different organisms? It’s possible becauseeach type of organism has a different role to play in theecosystem. A typical classroom aquarium may contain snails,fish, algae, and bacteria. The role of snails is to feed on algae.The glass of an aquarium can become clouded by the growthof too much algae. Snails eat the algae, helping keep the glassclear so light can get in. The role of the algae is to providefood for snails and fish, and to provide oxygen for the systemthrough photosynthesis. The role of an organism in an ecosys-tem is called the organism’s niche (NICH).
What do you think the role of the fish might be in anaquarium ecosystem? The niche of the fish includes addingnutrients to the ecosystem through its waste products thatencourage the growth of algae. All the interactions in whichan organism takes part make up its niche.
How would you describe your niche? Perhaps you helpdispose of wastes by recycling, or obtain food by groceryshopping. What other activities does your niche include?
Graph Populations
One way to understand more about relation-
ships among organisms in an ecosystem is to keep track of, or monitor, and graph populations. Use the information in Table 1 to make a graph of population size over time for barn owls and field mice. Then, answer the questions that follow.
Identifying the ProblemSet up your graph with months on the x-axis and numbers of organisms on the
y-axis. Use two colors to plot your data. For more help, refer to the Math SkillHandbook. Use your graph to infer how the population of field mice affects thepopulation of barn owls.
Solving the Problem1. Predict how the next two months of the graph will look.2. Field mice eat green plants and grains. What do you think would happen to
the population of barn owls if there were no rain in the area for a long time?
Month J F M A M J J A S
Field mice 6 5 4 3 3 4 5 4 6
Barn owls 2 3 4 4 2 1 4 3 4
Monthly Population Size per Hectare (in 100s)
Table 1

SECTION 2 Relationships Among Living Things 211
The place where an organismlives is called its habitat (HA buhtat). The habitat of a catfish is themuddy bottom of a lake or pond.The habitat of a penguin is the icywaters of the Antarctic. How wouldyou describe the habitat of the petreptile shown in Figure 11?
Different species of organismsoften live in the same habitat.Resources, such as food, living space, and shelter, are shared amongall the species living in a habitat. Forexample, the branches of an appletree provide a habitat for spiders,fruit flies, beetles, caterpillars, andbirds. How can all these organismsshare the same home? They have dif-ferent ways of feeding, seeking shel-ter, and using other resources. Inother words, they have differentniches. For example, spiders feed on beetles and other insects.Caterpillars eat leaves. Fruit flies feed on apples. Birds eat spi-ders, caterpillars, or flies. Each species has a different nichewithin the same habitat.
Figure 11 Each organism in anecosystem has its own job, or niche. Explain how the reptile and theplant can share the same habitat.
Self Check1. Identify a population that lives in your community.
2. Explain how the number of trees in a forest could affectthe size of a bird population.
3. Design an experiment to identify a limiting factor thatprevents the snail population in a home aquarium fromgrowing larger.
4. Think Critically Ladybug beetles help gardeners con-trol insect pests called aphids. What kind of interactionmight take place between ladybug beetles and aphids?
SC.G.2.3.3SC.G.2.3.2
SummaryOrganizing Ecosystems
• A population is a group of the same type oforganisms living together in the same place.
• A community is made up of all the popula-tions in an ecosystem.
Limits to Populations
• Limiting factors prevent a population fromgrowing larger.
Where and How Organisms Live
• An organism’s role in an ecosystem is itsniche.
• An organism’s home is its habitat.
5. Calculate the population density of buttercups in ameadow. There are 550 buttercups in a meadow that measures 100 m by 66 m.
More Section Review fl6.msscience.com
SC.G.2.3.2 SC.G.2.3.3
Matt Meadows

212
The Flow of EnergyEnergy for most organisms comes from the Sun. This con-
tinuous input of energy is moved through the ecosystem in theform of food. Energy transfers never are one hundred percentefficient. At each feeding level the amount of useable energy isreduced because some energy is transformed to heat. Forinstance, in Figure 12, the Sun is the energy source for a plant.When it is eaten by the grasshopper, only some of this energy istransferred. Some of the energy is used by the plant for its lifeprocesses, and some is given off as heat. When the bird eats thegrasshopper, it receives even less energy. This decrease occurs atevery step in the food web. The interactions of organisms witheach other and with the nonliving parts of their environments,such as the Sun, result in the flow of energy throughout the sys-tem. All energy in an ecosystem is eventually cycled through theecosystem and used again and again.
Energy Through theEcosystem
■ Explain how organisms get theenergy they need.
■ Describe how energy flowsthrough an ecosystem.
The energy most living thingsrequire comes directly or indirectlyfrom the Sun.
Figure 12 In any community, energyflows through the living organisms.
Benchmarks—SC.G.1.3.4 Annually Assessed (pp. 212–214): The student knows that the interactionsof organisms with each other and with the non-living parts of their environments result in the flowof energy and the cycling of matter throughout the system.
Also covers: SC.B.1.3.4 (p. 212), SC.B.2.3.1 Annually Assessed (p. 212), SC.D.1.3.4 Annually Assessed (p. 213),SC.G.1.3.5 Annually Assessed (pp. 212–215), SC.G.2.3.2 (p. 213), SC.H.1.3.5 Annually Assessed (pp. 216–217), SC.H.1.3.7 Annually Assessed (p. 217), SC.H.2.3.1 (p. 214)
Review Vocabularyrecycling: reuse of an item or nat-ural resource that requires chang-ing or reprocessing it
New Vocabularyproducer preyconsumer decomposerpredator
FCAT Vocabulary
212

SECTION 3 Energy Through the Ecosystem 213
Figure 13 This food chain showsone of the most common waysorganisms interact in a community.
Interactions in CommunitiesMany different populations can interact in
a backyard ecosystem, including plants, birds,insects, squirrels, and fungi, as shown in Figure 12.The plants in the ecosystem produce food throughphotosynthesis. An organism that makes its ownfood, like a plant, is called a producer. Thegrasshopper that nibbles on the plants is aconsumer. A consumer eats other organisms.
Consumers There are different types of consumersin an ecosystem. The bird in Figure 13 is a predator,which means it captures and eats other animals. The lady-bug is its prey, an organism that is hunted and caught for foodby another animal. This relationship can be seen in a food chain,like the one shown in Figure 13. A food chain shows a sequenceof organisms, each of which obtains energy from the next lowermember of the sequence as food.
Decomposers Some of the consumers in an ecosystem are sosmall that you might not notice them, but they have an impor-tant role to play. They are the decomposers, such as bacteria andfungi. Decomposers use dead organisms and the waste materialof other organisms for food.
Identify four ways organisms interact in anecosystem.
Organisms That Live Together There are other types ofrelationships among organisms. In one type of interaction,both organisms in the relationship benefit. The African tick-bird, for instance, gets its food by eating insects off the skin of zebras. The tickbird gets food, while the zebra getsrid of harmful insects. In another type of relationship,only one organism benefits. The other organismdoesn’t benefit, but is not harmed. A bird building anest in a tree gets protection from the tree, but thetree isn’t harmed. In still another relationship, oneorganism is helped while the other is harmed. Haveyou ever been bitten by a mosquito? That’s a first-hand experience of this type of relationship. Themosquito benefits because your blood providesnutrients for the female mosquito’s eggs. You are harmed and your body will have an immune reaction—an itchy, red bump. You also could get a diseaselike malaria if you are bitten by an infected mosquito.

214 CHAPTER 7 Ecology
Modeling the Flow of EnergyThe food chain in Figure 13 is a simple model that shows
how energy from food passes from one organism to another.Each organism is linked by an arrow. The arrows show thatenergy moves from one organism to another. However, a foodchain does not show every species in the community. Forinstance, a bird may eat seeds and in turn be eaten by a hawk.The hawk also might eat a snake or a mouse. One food chaincannot model all these overlapping relationships. We need amore complex model to show all the feeding interactions in anecosystem.
Scientists use a more complicated model, called a food web,to show the transfer of energy in an ecosystem. A food web,shown in Figure 14, is a series of overlapping food chains thatshows possible feeding relationships in an ecosystem.
What does a food web model?
Feeding patterns and relationships occur throughout allecosystems. Every organism is part of a food web. In an oceanfood web, plankton use the Sun’s energy. Some of this energyeventually is transferred the orca. From the orca, some energy istransferred to decomposers, such as bacteria that feed on theorca’s remains. All food webs include an energy source, produc-ers, consumers, and decomposers.
Energy Conversion Energycannot be created ordestroyed, but it can changeform. Research to find outwhat kinds of energy con-versions take place in yourbody.
Ocean Food Web
Penguin
Orca
Seal
Whale
Squid
Krill
Plankton
Sun
Fish
Figure 14 The Sun provides theenergy for this food web.
LA.A.2.3.5
Annually AssessedBenchmark Check
SC.G.1.3.4 Arrange the follow-ing to show the flow of energy:algae, bacteria, fish, osprey, andSun. How is this matter recycled?
FC
AT FOCUSF
C
AT FOCUS

SECTION 3 Energy Through the Ecosystem 215
Cycling of MaterialsWhat happens when you recycle a soda can? The can is taken
to a processing plant and melted so that the aluminum can beused again. This is an example of a simple cycle. The same alu-minum can be used over and over again. Cycles are important toecosystems. Instead of aluminum cans, however, it’s the materi-als that make up organisms that get recycled in an ecosystem.
The bodies of living things are made up of matter, includingwater and chemicals like nitrogen and carbon. To get the matterneeded to build bones, muscles, and skin, you need to eatfood made of the right kinds of matter, as the horse inFigure 15 is doing. In an ecosystem, matter cyclesthrough food chains. The amount of matter on Earthnever changes. So matter in ecosystems is recycled,or used again and again.
Living organisms depend on these cycles forsurvival. Organisms also depend on one anotherfor food, shelter, and other needs. All the differ-ent things that make up the biosphere—froma tiny insect to a raging river—have a uniquerole to play.
Self Check1. List some organisms that are consumers. Give an exam-
ple of the type of food each eats.
2. Explain how the Sun’s energy reaches a cat that eats abird.
3. Compare and contrast food chains and food webs.
4. Think Critically Explain why more energy is availablein the first link of a food chain than in the fourth link ofthe same food chain.
SummaryIt’s All About Food
• Energy moves through ecosystems in the formof food.
• Producers make their own food.
• Consumers obtain food by eating other organisms.
• Decomposers break down dead organisms.
Modeling the Flow of Energy
• Food chains and food webs show how foodenergy passes from one organism to another.
Cycling of Materials
• All matter on Earth is recycled through foodchains.
5. Sequence Use an events-chain concept map to tracethe path of energy that flows from the Sun to your body when you eat a piece of chicken.
Figure 15 Horses get the materials they needto grow and maintain their bodies by eating foodsuch as grass. Infer where you think the grass gets the materialsit needs for growth.
More Section Review fl6.msscience.com
Annually AssessedBenchmark Check
SC.G.1.3.5 Imagine a horse eating an apple. Where did theenergy come from to grow theapple? How are the atoms of theapples recycled?
FC
AT FOCUSF
C
AT FOCUS
SC.G.1.3.3
SC.G.1.3.4
SC.B.1.3.4
SC.G.1.3.4
Tom McGuire

Design Your OwnDesign Your Own
216 CHAPTER 7 Ecology
Real-World ProblemHow many blades of grass are in a park? It may seem to you like there’sno limit to the number of blades of grass that can grow there. However,as you’ve discovered, there are many factors that organisms like theplants in the park need to live and grow. By experimenting with thesefactors, you can see how they limit the size of the population. How dospace, light, water, and temperature limit plant populations?
Form a HypothesisThink about what you already know about the needs of plants. As agroup, form a hypothesis to explain how one abiotic factor may limitthe number of bean plants that can grow in a single pot.
Test Your HypothesisMake a Plan1. Decide on a way to test your group’s
hypothesis. Make a complete materials list as you plan the steps of your experiment.
What’s the limit?Goals■ Observe how space,
light, water, or temper-ature affect how manybean plants are able togrow in a pot.
■ Design an experi-ment that showswhether a certain abi-otic factor limits a plantpopulation using thematerials listed.
Possible Materialsbean seedssmall planting containerssoilwaterlabelsspoonsaluminum foilsunny window or other
light sourcerefrigerator or heater
Safety Precautions
Complete a safety work-sheet before you begin.WARNING: Wash yourhands after you handle soiland seeds.
--InquiryInquiry
Benchmark—SC.G.2.3.1: The student knows that some resources are renewable andothers are nonrenewable; SC.H.1.3.5: The student knows that a change in one or morevariables may alter the outcome of an investigation.
Matt Meadows

2. What is the one abiotic factor you will be testing? How will you test it? What factors will you need to control? Be specific in describing how you will handle the other abiotic factors.
3. How long will you run your experiment? How many trials of your experiment will you run?
4. Decide what data you will need to collect. Prepare a data table in your Science Journal.
5. Identify the variables in your experiment.
6. Identify the controls in your experiment.
7. Read over your entire experiment and imagine yourself doing it. Make sure the steps are in logical order.
Follow Your Plan1. Make sure your teacher has approved your plan and your
data table before you proceed.
2. Carry out your plan.
3. Record your observations during the experiment.
4. Complete your data table in your Science Journal.
Analyze Your Data1. Make a graph to show your results.
2. Use a bar graph to compare the number of seedlings that grew in the experimental containers with the number of seedlings that grew in the control containers.
Conclude and Apply1. Explain how the abiotic factor you tested
affected the bean plant population.
2. Predict what would happen to your plant population if you added another kind of plant or animal to the containers.
Extending InquiryChoose a plant species to study in a local park orgreen space. Observe different abiotic factors anddocument where the plant thrives and where it does not.
LAB 217
Compare your results with other groups.Explain how different factors affected theplants grown by each group. Investigatefurther any differences in results todetermine if the differences are significant.
Doug Martin

When you think about Florida, youprobably picture sandy beaches andpalm trees. But do you think about
alligators? Alligators are among the best-knownanimals that live in Florida. They can grow tobe 13 feet long and weigh more than 600pounds.
Endangered AlligatorsBy the 1960s, the number of alligators was
greatly reduced in Florida due to hunting andhabitat loss. The numbers became so low thatalligators were placed on the endangeredspecies list. A species is listed as endangered
when so few of its members are living that theentire species is in danger of becoming extinct.In the United States, it became illegal to huntalligators. Gradually the number of alligatorswent up. By 1977, they were renamed as athreatened species. A threatened species stillneeds to be protected but is not in immediatedanger of becoming extinct. Now, more than amillion alligators live on farms and in the wild.Good news, right? Think again. There areproblems—big problems from big alligators.
Alligator ProblemsToday more people live, work, and play in
areas where alligators live. Alligators have beenfound in swimming pools and on golf courses.Many people believe that the size of Florida’salligator population should be tightly con-trolled. They fear that more alligators will leadto more encounters with humans and increasethe possibility of alligator attacks.
Other people point out that, as the numberof houses, roads, and shopping centers inFlorida increases, alligators are left with fewerand fewer places to live and hunt. These peo-ple suggest that more wilderness areas must beset aside for alligators and other predators.
SCIENCEANDSocietySCIENCE ISSUES
THAT AFFECTYOU!
Gatorsat the Gate!
Write Alligators are not the only predators people fear. Someparts of the country also have problems with bears, wolves,cougars, or other animals. Write a short paper about encountersbetween people and predators in your area.
Gatorsat the Gate!
For more information, visitfl6.msscience.com
Rosemary Calvert/Tony Stone Images/Getty Images

Copy and complete this concept map about ecosystems.
What is an ecosystem?
1. An ecosystem is made up of organismsinteracting with each other and with thenonliving factors in the system.
2. The biosphere is made up of all the ecosys-tems on Earth.
Relationships AmongLiving Things
1. A population is made up of the same typeof organisms living together in the sameplace at the same time.
2. A community is made up of all the popula-tions in an ecosystem.
3. Limiting factors, which may be living or nonliving, influence the size of a population.
Energy Through theEcosystem
1. Energy is transferred through an ecosystemin the form of food.
2. The feeding relationships in an ecosystem canbe illustrated by food chains and food webs.
CHAPTER STUDY GUIDE 219
Ecosystems
light
include include
Biotic Factors
water
including
including including
includingwhich involve
amongamong
among
producers
Interactive Tutor fl6.msscience.com(l)David Woodfall/ENP Images, (r)David M. Dennis

Explain the difference between the vocabularywords in each of the following sets.
1. abiotic factor—biotic factor
2. biosphere—ecology
3. community—population
4. ecosystem—limiting factor
5. niche—habitat
6. producer—consumer
7. consumer—decomposer
Choose the word or phrase that completes thesentence.
8. Which of the following is NOT a bioticfactor?A) raccoons C) pine treesB) sunlight D) mushrooms
9. Ponds, streams, and prairies are examplesof what parts of the environment?A) niches C) populationsB) producers D) ecosystems
10. What is a group of the same type oforganism living in the same place at thesame time?A) habitat C) communityB) population D) ecosystem
11. Which of the following is an example of aproducer?A) grass C) fungusB) horse D) fish
Use the illustration below to answer question 12.
12. What is the diagram shown above anexample of ?A) food chain C) ecosystemB) food web D) population
13. All of the following are abiotic factorsexceptA) sunlight. C) bacteria.B) water. D) temperature.
14. All ecosystems on Earth make up the A) atmosphere. C) lithosphere.B) biosphere. D) hydrosphere.
15. All the populations in an ecosystem makeup a A) community. C) habitat.B) niche. D) limiting factor.
16. In an estuary ecosystem, lightning whelksfeed on American oysters. When the oysterpopulation is small, there is less food forthe whelks. What is the oyster populationin relation to the whelk population in thisecosystem?A) niche C) producerB) habitat D) limiting factor
17. A food web is a model that shows how A) energy moves through an ecosystem.B) ecosystems change over time.C) producers use sunlight.D) abiotic factors affect populations.
220 CHAPTER REVIEW
abiotic factor p. 202
biosphere p. 200
biotic factor p. 200
community p. 208
consumer p. 213
decomposer p. 213
ecology p. 200
ecosystem p. 198
environment p. 199
habitat p. 211
limiting factor p. 209
niche p. 210
population p. 207
predator p. 213
prey p. 213
producer p. 213
Vocabulary PuzzleMaker fl6.msscience.com
FCAT Vocabulary
SC.G.2.3.2
SC.G.2.3.2
SC.G.2.3.2
SC.G.2.3.2
SC.G.1.3.4

18. Infer why it is correct to say that decom-posers are also consumers.
19. List examples of foods you would eat if youwere eating low on the food chain.
20. Draw and label a diagram of an ecosystem.Label biotic and abiotic factors. Describethree interactions among organisms inthe ecosystem.
21. Identify three possible limiting factors foran aquarium ecosystem. Describe howeach factor can limit population growth.
22. Describe your own habitat and niche.
23. Classify each of your ten favorite foods ascoming from a producer, consumer, ordecomposer. Write a short explanation ofyour classification of each item.
Use the graph below to answer question 24.
24. Make and Use Graphs The graph above showsthe changes in the size of a population ofinsects living on roses over the course of ayear. During what month is the insectpopulation the smallest? During whatmonth is the population the largest?
25. Predict what would happen to an ecosystemif its decomposers were removed.
26. Develop Multimedia Presentations Find slidesor photographs that show different ecosys-tems. Arrange a slide presentation orphoto display of these images. Use titles orcaptions to identify each one.
27. Research Information Choose an ecosystem toresearch. Find out what organisms arefound there and how they interact. Make aposter or a computer slideshow illustrat-ing a food web in this ecosystem.
Nu
mb
er o
f in
sect
s p
er ro
se
140
100
180
60
20
A M J J A S O N D J F MMonths
Rose Insect Population
CHAPTER REVIEW 221
28. Population Density The population density ofrabbits living along the banks of a stream isabout one rabbit per 100 m2. How many rabbitsare likely to be found in a 900-m by 25-m sec-tion of the stream bank?
Use the table below to answer question 29.
29. Changes in Population Size Use the data fromthe table above to make a graph of popula-tion size over time for rabbits and bobcats.Based on your graph, infer how the size ofthe rabbit population affects the size of thebobcat population.
Changes in Population Size(in 100s)
Year Rabbit Bobcat Population Population
1970 100 39
1975 133 80
1980 94 61
1985 65 63
1990 80 45
Chapter Review fl6.msscience.com
SC.G.2.3.2
SC.G.2.3.2
SC.G.2.3.2

222 FLORIDA
a Beavers in a forest ecosystem gnaw downtrees to build a dam across a stream. Inwhich way could this behavior affect thebiotic factors within the ecosystem?
A. It increases the amount of waterwithin the ecosystem.
B. It destroys the habitats of animals thatused the trees as homes.
C. It may cause soil to be washed away inthe areas that were cleared of trees.
D. It may raise the average temperatureof the ecosystem because there is lessshade.
s Which conclusion is best supported by thediagram below?
F. A food chain shows that producersrely on sunlight.
G. A food chain shows how ecosystemschange over time.
H. A food chain shows that abiotic fac-tors affect populations.
I. A food chain shows how energymoves through an ecosystem.
d The graph below shows the changes in aprey population over time.
What was the approximate density of theprey population in October?
A. 13 prey per square kilometer
B. 10 prey per square kilometer
C. 9 prey per square kilometer
D. 7 prey per square kilometer
f Which represents a likely food chain in anecosystem?
F. A producer eats a consumer. Then theproducer is eaten by another producer.
G. A producer eats a consumer. Then theproducer is eaten by another consumer.
H. A consumer eats another consumer. Thenthe consumer is eaten by a producer.
I. A consumer eats a producer. Then theconsumer is eaten by another consumer.
Prey Population over Time
8
12
4
0
16
6
10
2
14
Months
Nu
mb
er o
f pre
y p
er k
m2
January
March MayJu
ly
September
November
FloridaFloridachapter chapter
The assessed Florida Benchmark appears above each question.Record your answers on the answer sheet provided by your teacher or on a sheet of paper.
FC
AT FOCUSF
C
AT FOCUS
SC.G.2.3.2
SC.G.2.3.3
SC.G.1.3.4
SC.G.1.3.4

FCAT PRACTICE 223FCAT Practice fl6.msscience.com
g There are 48 dogs that live within a townwith an area of 16 square kilometers.What is the population density of dogs persquare kilometer?
h Marika wanted to know if temperatureaffects the flying-insect population at herschool’s pond. Marika recorded the aver-age high temperature and the averagenumber of flying insects at the pond eachmonth for one year. Her results are shownin the graph below.
When was the flying-insect population thegreatest? Based on the graph, describe therelationship between average temperatureand the flying-insect population at thepond.
Flying Insect Population at the School Pond
40
60
20
0
80
100
Month and average high temperature
Num
ber o
f fly
ing
inse
cts
Jan/18°C
Feb/19°C
Mar/23°C
Apr/26°C
May/29°C
Jun/3
2°C
Jul/3
2°C
Aug/32°C
Sep/30°C
Oct/26°C
Nov/22°C
Dec/18°C
j The diagram below shows one type ofocean food web. In this food web, plank-ton is the producer.
PART A Describe how the energy usedby the penguin originally comesfrom the Sun.
PART B What might happen to thisfood web if there were as manyorcas as there were krill?
Plankton
Penguin
FishSeal
Orca
Krill
READINQUIREEXPLAIN
READINQUIREEXPLAIN
FCAT PracticeFCAT Practice FC
AT FOCUSF
C
AT FOCUS
When In Doubt If you don’t know the answer to a multiple-choice question, try to eliminate as many incorrect answers aspossible. Mark your best guess from the remaining answersbefore moving on to the next question.
SC.G.2.3.3 SC.G.1.3.4
SC.H.2.3.1