CHAPTER 6 The Long-Run Challenges of Entitlement Spending
21
175 C H A P T E R 6 The Long-Run Challenges of Entitlement Spending F ederal spending on entitlement programs is expected to increase dramatically in the coming decades, particularly for Social Security, Medicare, and Medicaid. Taken together, these programs currently constitute 45 percent of Federal non-interest spending; assuming there are no major changes to these programs, this share is projected to rise dramatically in coming decades. An aging population and rising health care spending per person are major reasons for these projected increases. The primary objective of this chapter is to highlight the budgetary challenges facing each of the three major entitlement programs and to outline possible strategies for addressing these challenges. The key points of this chapter are: on the three major entitlement programs—Social Security, Medicare, and Medicaid—is projected to increase much faster than tax revenues or than the overall economy over the coming decades. Paying all sched- uled benefits would eventually require substantial reductions in other Government spending, or major tax increases, or both. for Social Security, representing a permanent, as opposed to temporary, shift in the entitlement landscape. Currently, one out of six adults is age 65 or older; by 2020, one out of five adults will be 65 or older; and, by 2030, one out of four adults will be age 65 or older. the aging population, creates a sizeable structural imbalance that will cause current and future generations of workers to bear increasing costs, or receive smaller benefits than now scheduled, or both. considerably faster than real gross domestic product (GDP) per capita. Real growth in Medicare spending is being driven by increasing enrollment, greater utilization of more expensive high-technology medical treatments, and expansion of the goods and services covered by the program. persons represent a large and growing share of total Medicaid spending. The demand for long-term care is expected to grow in the United States as a result of the aging population. In turn, this will place even greater financial strain on Federal and State budgets.
Transcript of CHAPTER 6 The Long-Run Challenges of Entitlement Spending
175
C H A P T E R 6
The Long-Run Challenges of Entitlement Spending
Federal spending on entitlement programs is expected to increase dramatically in the coming decades, particularly for Social Security,
Medicare, and Medicaid. Taken together, these programs currently constitute 45 percent of Federal non-interest spending; assuming there are no major changes to these programs, this share is projected to rise dramatically in coming decades. An aging population and rising health care spending per person are major reasons for these projected increases. The primary objective of this chapter is to highlight the budgetary challenges facing each of the three major entitlement programs and to outline possible strategies for addressing these challenges.
The key points of this chapter are:
on the three major entitlement programs—Social Security, Medicare, and Medicaid—is projected to increase much faster than tax revenues or than the overall economy over the coming decades. Paying all sched-uled benefits would eventually require substantial reductions in other Government spending, or major tax increases, or both.
for Social Security, representing a permanent, as opposed to temporary, shift in the entitlement landscape. Currently, one out of six adults is age 65 or older; by 2020, one out of five adults will be 65 or older; and, by 2030, one out of four adults will be age 65 or older.
the aging population, creates a sizeable structural imbalance that will cause current and future generations of workers to bear increasing costs, or receive smaller benefits than now scheduled, or both.
considerably faster than real gross domestic product (GDP) per capita. Real growth in Medicare spending is being driven by increasing enrollment, greater utilization of more expensive high-technology medical treatments, and expansion of the goods and services covered by the program.
persons represent a large and growing share of total Medicaid spending. The demand for long-term care is expected to grow in the United States as a result of the aging population. In turn, this will place even greater financial strain on Federal and State budgets.

176 | Economic Report of the President
Background Facts About Entitlement ProgramsSocial Security, Medicare, and Medicaid are key components of the U.S.
social safety net. This section briefly reviews the evolution and current structure of each program.
Social SecurityThe Social Security system protects people from income loss due to life
events such as retirement, a period of disability, or the death of a household wage earner. This system was introduced in 1935, when it is estimated that over half of the elderly lacked the income needed to care for themselves. In 2007, approximately 50 million beneficiaries received $585 billion in benefit payments. Approximately $486 billion of these benefits was paid to over 40 million retirees and survivors, and $99 billion was paid to 8.9 million disabled workers and their families. Nearly 90 percent of all individuals aged 65 and over received some benefit from Social Security in 2006 (the most recent year for which these data are available). Social Security benefits provided about 58 percent of all income received by individuals age 65 and older and for 32 percent of recipients, Social Security benefits provided over 90 percent of their entire income.
Social Security is largely a pay-as-you-go program, meaning that current benefits are financed primarily with a payroll tax on wages earned by current workers. Employers and employees each pay 6.2 percent of wages—although economists generally believe the employer’s portion is passed on to workers in the form of lower wages—up to a maximum amount of taxable wages. This maximum, called the contribution and benefit base, increases each year as average wages increase; it was $102,000 in 2008, increasing to $106,800 in 2009. Self-employed individuals pay the entire 12.4 percent.
As a result of legislation enacted in 1983, Social Security began collecting more revenue than was needed to pay benefits each year, thereby requiring current workers to partially prefund future retirement benefits. The annual surpluses have been placed in the Social Security Trust Fund, which is invested in special U.S. Treasury bonds, used only for this purpose. In 2007, Social Security ran a surplus of $190 billion, which brought the balance in the Trust Fund to over $2.2 trillion. Because the value of the assets accumulated in the Trust Fund is exactly offset by the liability of the general fund to repay the special Treasury bonds, the Social Security Trust Fund has zero net value for the Government.
The Social Security benefit a worker receives in retirement is based on the average wage he or she earns when working and paying the Social Security payroll tax. Workers who earned higher wages get larger benefits, but the portion of preretirement income replaced by Social Security declines as

Chapter 6 | 177
preretirement wage income rises. An individual must have worked and paid Social Security taxes for 40 quarters (10 years of employment) to be eligible for retirement benefits. Individuals become eligible for a reduced benefit at age 62, while those who work past full retirement age can receive a larger benefit for each year worked up to age 70. Once a retiree’s initial benefit has been determined, it increases each year with annual cost-of-living adjustments that are based on the inflation rate for the previous year.
More than one in six recipients of Social Security benefits receive their bene-fits through the Disability Insurance program. This program provides monthly benefits to workers and their families for workers who are unable to work for a year or more. The Social Security Administration has guidelines about the conditions that must be met before an individual can receive this benefit.
MedicareBeginning in the 1930s and for several subsequent decades, policymakers
considered legislation that would create a larger role for Government in the provision of health insurance for Americans, particularly for those who faced financial barriers to medical care. Before Medicare was created in 1965, almost 50 percent of older adults lacked health insurance. Originally, only people age 65 and older were eligible for Medicare. In 1972, eligibility was expanded to include those receiving Social Security Disability Insurance payments for 2 consecutive years and those with end-stage renal disease who meet specific eligibility requirements. Today, nearly 45 million individuals are enrolled in Medicare, including approximately 38 million elderly and 7 million disabled beneficiaries.
Medicare has four parts:
hospital services, some home health care, hospice, and up to 100 days in a skilled nursing facility after a qualifying inpatient stay. Individuals who have worked at least 40 quarters in qualified employment are auto-matically enrolled in Part A upon reaching age 65. Individuals who lack 40 quarters of employment can buy into Part A when they reach 65 years of age by paying a monthly premium (plus a late penalty if enrolling after the initial eligibility period); in 2009, the maximum monthly premium is $443.
-tient provider visits, emergency room services, and certain preventive screening measures. Enrollment in Part B is optional (there is a penalty for enrolling after the initial eligibility period) and requires a premium contribution, which is higher for individuals who make more than $85,000 per year, based on their most recent Federal income tax return.

178 | Economic Report of the President
provide Part A and B and, in most cases, Part D benefits. Medicare Advantage plans often include benefits not covered by traditional Medicare. The Medicare Prescription Drug, Improvement, and Modernization Act of 2003 changed how the Government reimburses health plans for the coverage they provide to enrollees. This resulted in an increase in the number of private plan choices available to beneficia-ries in every county in America. Enrollment growth has been steady, most likely due to improved access to Medicare Advantage plans and more generous benefits. Current enrollment is nearly 10 million benefi-ciaries, representing over 20 percent of all Medicare beneficiaries.
prescription drug benefit. This benefit is administered by private health insurance plan sponsors that contract with the Federal Government. In 2008, 32 million Medicare beneficiaries were enrolled in stand-alone prescription drug plans, Medicare Advantage prescription drug plans, or employer/union plans receiving the Retiree Drug Subsidy.
Medicare is financed primarily through a combination of payroll taxes, general revenues, and premiums paid by beneficiaries. Part A is financed primarily by a dedicated payroll tax of 2.9 percent, which is split evenly between employees and employers. If total non-interest revenues exceed Medicare Part A spending for a particular year, the difference is placed into the Hospital Insurance Trust Fund. If non-interest revenues are lower than spending, money is withdrawn from the Hospital Insurance Trust Fund. At the end of 2007, the Hospital Insurance Trust Fund had a balance of $326 billion; however, under the Medicare Trustees’ intermediate estimates, this balance is expected to begin declining in 2008.
Medicare Part B is financed by general revenues and beneficiary premiums, the latter of which are set to equal approximately 25 percent of total expected spending. Part D is also financed through beneficiary premiums and general revenues, as well as State payments for low-income beneficiaries who are also enrolled in Medicaid. Medicare Advantage (Part C) is not separately financed; rather, it is simply a vehicle for providing Part A, Part B, and typi-cally Part D benefits. Projections by the Medicare Trustees indicate that in 2010, approximately 45 percent of non-interest income will come from payroll taxes, 39 percent from general revenues, 12 percent from beneficiary premiums, and the remainder from miscellaneous sources.
MedicaidMedicaid provides medical assistance to low-income individuals, including
children and parents in working families, children and adults with severe disabilities, and low-income Medicare beneficiaries, who are known as
Chapter 6 | 179
“dual eligibles” because of their eligibility for both programs. The Federal and State Governments share responsibility for administering and funding Medicaid. For States to receive Federal funding, their Medicaid plans must cover specific populations, including children under the age of 6 and preg-nant women whose family income is below 133 percent of the poverty level; school-age children (ages 6 to 18) with family income below 100 percent of the poverty level; parents with income below States’ July 1996 welfare eligibility levels; and certain other low-income and disabled persons. In addi-tion, with approval from the Centers for Medicare and Medicaid Services, States have the flexibility to expand Medicaid eligibility to other groups of individuals, including those whose incomes exceed the mandatory thresholds indicated above.
Medicaid programs cover a broad set of health care services, including inpatient and outpatient services, dental care, family planning, mental health, substance abuse treatment, home health care, and long-term care services. In 2007, Medicaid monthly enrollment averaged approximately 48.1 million people, including 23.5 million children.
Medicaid is jointly financed by the Federal Government and the States. The Federal Government’s share of each State’s Medicaid spending is based on the Federal Medical Assistance Percentage (FMAP), which is calculated using a formula that incorporates data on average per capita income for each State and for the United States as a whole for the most recent 3 years. The FMAP formula is designed to provide a larger Federal share of spending for States with lower per capita income relative to the national average, with Federal shares ranging from a minimum of 50 percent to a maximum of 83 percent. Overall, Federal Government expenditures on Medicaid account for approximately 57 percent of total annual Medicaid spending. Unlike Medicare, the Medicaid program does not have any dedicated revenue sources; rather, Federal expendi-tures come from the general fund of the Federal Government.
As part of the Balanced Budget Act of 1997, the State Children’s Health Insurance Program (SCHIP) was created to provide health insurance to uninsured children under age 19 who live in low-income families that are not eligible for Medicaid. In 2007, more than 7 million children enrolled in SCHIP. States have significant flexibility in terms of their program design. In particular, they can implement SCHIP by expanding their existing Medicaid programs, creating separate programs, or using a combination of the two approaches. States that implement SCHIP as a Medicaid expansion must provide all of the benefits offered through their Medicaid programs, while States that choose to have separate SCHIP programs must provide benefits that meet specific Federal standards. Like Medicaid, the SCHIP program is financed jointly by the Federal Government and the States, although the Federal matching rate for SCHIP is higher than the rate used for Medicaid, and ranges from 65 percent to 83 percent of total spending.
180 | Economic Report of the President
Unlike Medicaid, SCHIP is not actually an entitlement program, but is instead a matching grant program that has a fixed limit on Federal spending, both nationally and State by State.
Major Entitlement Spending Over TimeFederal Government expenditures for Social Security, Medicare, and
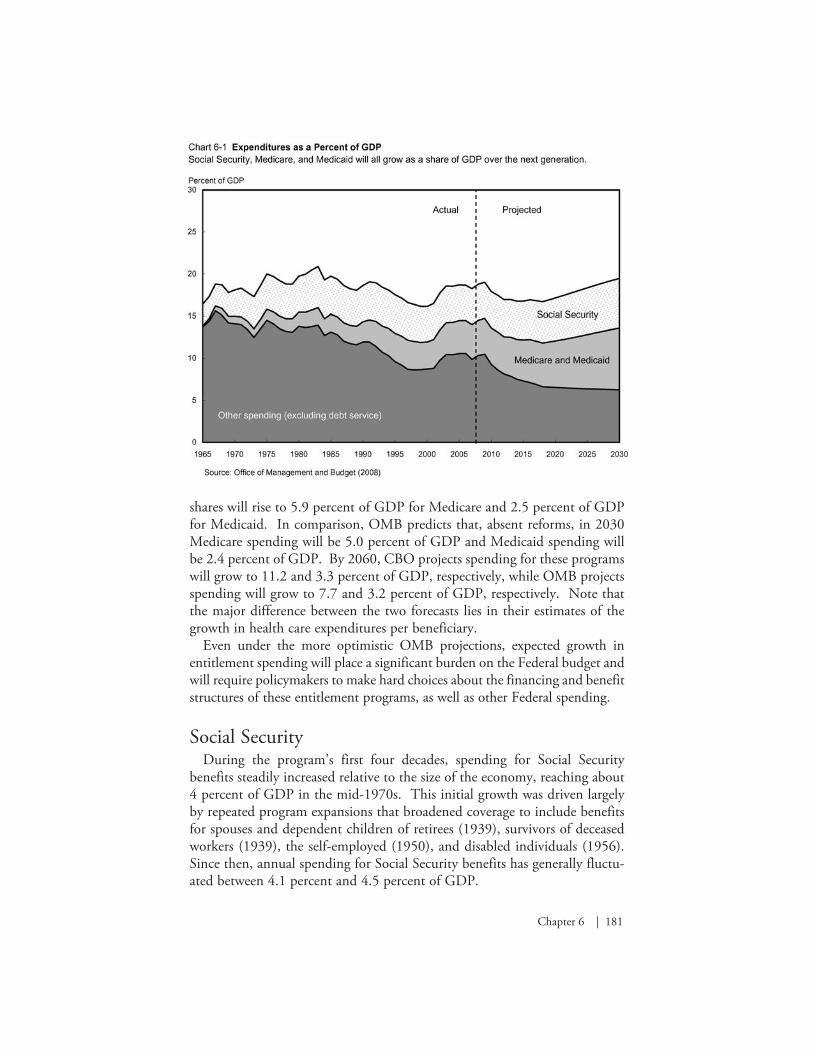
Medicaid have grown from 3.8 percent of GDP in 1970 to roughly 8.4 percent of GDP in 2008. (For comparison, Federal revenue generated from all sources averaged 18.3 percent of GDP over the last several decades.) Estimates of expected future growth in entitlement spending consistently predict sharply rising expenditures in coming decades, although such projec-tions depend on specific assumptions made for a variety of economic and demographic variables. The Office of Management and Budget (OMB) projects that in the absence of reforms, by 2020, spending on these three programs will exceed 10 percent of GDP; by 2040, it will reach 14.9 percent of GDP, and by 2080, it will reach 18.9 percent of GDP. It is important to note, however, that there is considerable uncertainty among long-run fore-casts. For example, under its Alternative Fiscal Scenario, the Congressional Budget Office (CBO) projects that Federal spending will rise much faster, reaching 11.2 percent of GDP by 2020, 16.8 percent of GDP by 2040, and exceeding 25 percent of GDP by 2080. The primary difference between the OMB and CBO projections (and other projections) is in their forecasts of future health care expenditures; in contrast, their forecasts of Social Security growth are very similar. Chart 6-1 uses the OMB projections to contrast the projected growth in these programs with other Federal spending, which fell in the 1990s with declines in defense spending, rose with increased Homeland Security spending over the past few years, and is assumed to decline in the coming decades, primarily due to declines in defense and other discretionary spending. Two trends can be discerned from Chart 6-1. One trend is the growth in Social Security spending expected over the next two decades. In 2008, Social Security spending constituted approximately 4.3 percent of GDP. CBO estimates this share will grow to 6.1 percent of GDP by 2030, with OMB estimating growth to 5.9 percent of GDP by 2030. After 2030, the share of GDP spent on Social Security remains relatively constant under both forecasts. Population aging is the main cause of this growth, a factor that also affects Medicare costs.
The second trend shown in Chart 6-1 is that after the period of Social Security’s rapid cost growth, health care expenditure growth will cause Medicare and Medicaid spending to grow far more over the long term. In 2008, Medicare and Medicaid respectively constituted 2.7 percent and 1.4 percent of GDP. CBO projects that, absent reforms, in 2030 these
Chapter 6 | 181
shares will rise to 5.9 percent of GDP for Medicare and 2.5 percent of GDP for Medicaid. In comparison, OMB predicts that, absent reforms, in 2030 Medicare spending will be 5.0 percent of GDP and Medicaid spending will be 2.4 percent of GDP. By 2060, CBO projects spending for these programs will grow to 11.2 and 3.3 percent of GDP, respectively, while OMB projects spending will grow to 7.7 and 3.2 percent of GDP, respectively. Note that the major difference between the two forecasts lies in their estimates of the growth in health care expenditures per beneficiary.
Even under the more optimistic OMB projections, expected growth in entitlement spending will place a significant burden on the Federal budget and will require policymakers to make hard choices about the financing and benefit structures of these entitlement programs, as well as other Federal spending.
Social SecurityDuring the program’s first four decades, spending for Social Security
benefits steadily increased relative to the size of the economy, reaching about 4 percent of GDP in the mid-1970s. This initial growth was driven largely by repeated program expansions that broadened coverage to include benefits for spouses and dependent children of retirees (1939), survivors of deceased workers (1939), the self-employed (1950), and disabled individuals (1956). Since then, annual spending for Social Security benefits has generally fluctu-ated between 4.1 percent and 4.5 percent of GDP.

182 | Economic Report of the President
As shown in Table 6-1, the number of Social Security beneficiaries is expected to more than double from 2000 to 2050, while the total population will increase by roughly 50 percent. The relative growth of the number of elderly individuals means that a larger share of the adult (age 18 and over) population will be drawing Social Security benefits in the years ahead. The demands imposed on the Social Security program by the baby boomers will diminish by the middle of the 21st century, but the expectation of a relatively constant fertility rate in combination with increasing lifespans means the portion of the adult population drawing Social Security benefits will remain high by historical standards. Box 6-1 describes some of the ways in which the Social Security program influences the saving behavior and labor supply decisions of individuals.
Table -.—Old-Age, Survivors, and Disability Insurance (OASDI) Benefits and Beneficiaries, 1950–2050
Year Benefits Paid (billions of dollars) Percent of GDP Beneficiaries
(thousands of people) Percent of Adult
Population
1950........................................ 1.5 0.5 2,930 2.8
1975........................................ 68.7 4.2 31,123 20.9
2000........................................ 418.2 4.3 45,162 21.5
2025........................................ 1,814.1 5.7 77,138 28.3
2050........................................ 5,989.4 6.1 95,640 28.3
Source: Congressional Budget Office, Department of Commerce (Bureau of the Census and Bureau of Economic Analysis), and Social Security Administration.
Box 6-1: Undesirable Consequences of Social Security
The specific taxation and benefit structure of Social Security produces some undesirable consequences that may discourage participants from working and saving. Reduced work and saving levels reduce national output (GDP) and gradually reduce the U.S. standard of living over time from what it could have been. Efforts to reform Social Security should address each of these disincentives.
There are at least three ways Social Security discourages work and saving. First, the system imposes high effective tax rates on secondary earners. The benefit available to a married couple is either the sum of the benefits they are each individually eligible for or up to 150 percent of the higher earner’s benefit, whichever is larger. This structure means the lower earner in a couple receives very little return on his or her Social
continued on the next page

Chapter 6 | 183
Security tax contributions and, if the low earner’s wage is low enough, may not realize any benefit from his or her tax contributions. This reduces the reward for the second member of a married couple to work outside the home and can contribute to a decision not to participate in the labor force at all. As an extreme example, this can also cause the Social Security taxes paid by a low-income two-earner couple to subsi-dize the benefits received by a high-income one-earner couple.
Second, the program encourages early retirement. The existence of an Early Eligibility Age encourages workers to retire earlier than they may have done in the absence of Social Security. In fact, while the decision of when to retire probably depends on many factors, the mere existence of a sure income source in retirement, via Social Security benefits, could encourage people to retire earlier. The average age of retirement has been declining steadily, from over 67 in the early 1950s to under 63 in the early 2000s. When workers retire early, they pay less tax into Social Security and draw benefits for a longer period of time. This provision thus places additional stresses on Social Security finances and reduces the total amount of labor supplied to the economy.
Few people work past normal retirement age, perhaps because, in terms of one’s Social Security benefit, the return to working past normal retirement age is modest at best. While a person who delays taking Social Security benefits receives a larger monthly benefit, they receive this benefit for a shorter period of time. The actuarial present value of the deferred payments is almost identical to the value of the payments that could be taken at normal retirement age. When one considers the additional taxes a person pays on labor income earned after normal retirement age, the return to working after this age may even be nega-tive. This provides little incentive for people to work past their normal retirement age.
Third, Social Security discourages private saving. Social Security is a system that effectively forces people to save for their retirement—a portion of their wage is taken away and, in return, they expect income during retirement. From the perspective of an individual planning for his or her retirement, it makes little difference whether this income comes from a government program or from his or her own investments. However, when individuals do their own saving, the money is used by the financial markets to expand the economy. With a pay-as-you-go Social Security system, the taxes collected today are used to pay bene-fits for current retirees, and no actual saving occurs in terms of money going into financial markets. This means that a pay-as-you-go Social Security system actually reduces economy-wide saving, which reduces economic growth from what it could have been.
Box 6-1 — continued
184 | Economic Report of the President
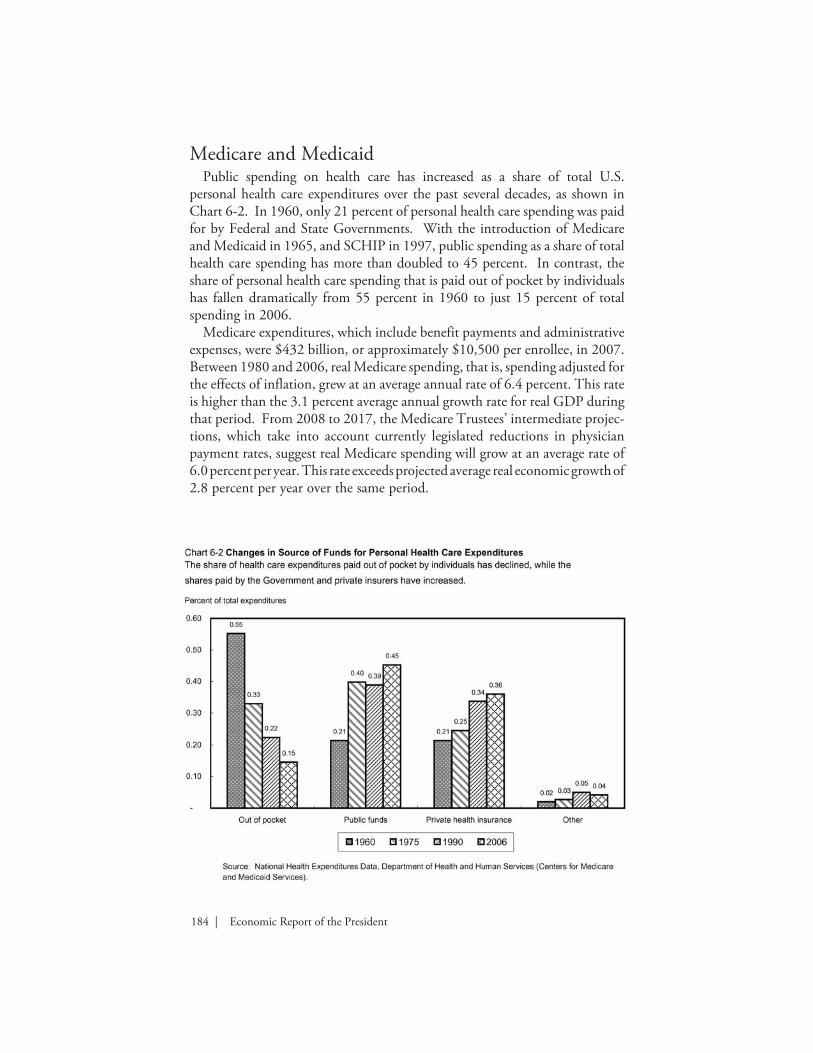
Medicare and MedicaidPublic spending on health care has increased as a share of total U.S.
personal health care expenditures over the past several decades, as shown in Chart 6-2. In 1960, only 21 percent of personal health care spending was paid for by Federal and State Governments. With the introduction of Medicare and Medicaid in 1965, and SCHIP in 1997, public spending as a share of total health care spending has more than doubled to 45 percent. In contrast, the share of personal health care spending that is paid out of pocket by individuals has fallen dramatically from 55 percent in 1960 to just 15 percent of total spending in 2006.
Medicare expenditures, which include benefit payments and administrative expenses, were $432 billion, or approximately $10,500 per enrollee, in 2007. Between 1980 and 2006, real Medicare spending, that is, spending adjusted for the effects of inflation, grew at an average annual rate of 6.4 percent. This rate is higher than the 3.1 percent average annual growth rate for real GDP during that period. From 2008 to 2017, the Medicare Trustees’ intermediate projec-tions, which take into account currently legislated reductions in physician payment rates, suggest real Medicare spending will grow at an average rate of 6.0 percent per year. This rate exceeds projected average real economic growth of 2.8 percent per year over the same period.
Chapter 6 | 185
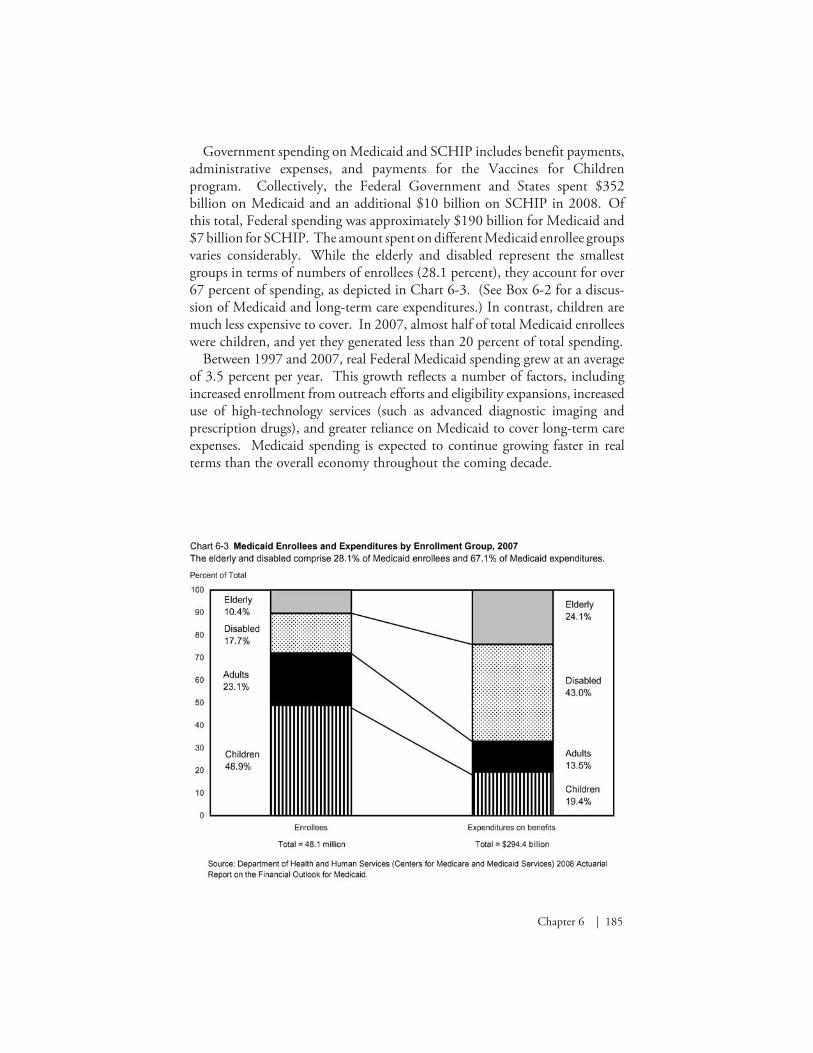
Government spending on Medicaid and SCHIP includes benefit payments, administrative expenses, and payments for the Vaccines for Children program. Collectively, the Federal Government and States spent $352 billion on Medicaid and an additional $10 billion on SCHIP in 2008. Of this total, Federal spending was approximately $190 billion for Medicaid and $7 billion for SCHIP. The amount spent on different Medicaid enrollee groups varies considerably. While the elderly and disabled represent the smallest groups in terms of numbers of enrollees (28.1 percent), they account for over 67 percent of spending, as depicted in Chart 6-3. (See Box 6-2 for a discus-sion of Medicaid and long-term care expenditures.) In contrast, children are much less expensive to cover. In 2007, almost half of total Medicaid enrollees were children, and yet they generated less than 20 percent of total spending.
Between 1997 and 2007, real Federal Medicaid spending grew at an average of 3.5 percent per year. This growth reflects a number of factors, including increased enrollment from outreach efforts and eligibility expansions, increased use of high-technology services (such as advanced diagnostic imaging and prescription drugs), and greater reliance on Medicaid to cover long-term care expenses. Medicaid spending is expected to continue growing faster in real terms than the overall economy throughout the coming decade.
186 | Economic Report of the President
Box 6-2: Long-Term Care and Medicaid
Today, about 10 million Americans receive long-term care services. Long-term care refers to medical care and support required by someone with a chronic illness or disability over an extended period of time. Typical long-term care services range from providing assistance with eating, bathing, and dressing, to managing medications and preparing food. Most people who require long-term care are 65 years of age or older. This demographic cohort is projected to grow dramatically over the next several decades, greatly increasing demand for long-term care services.
Current estimates suggest the average cost of nursing home care is $68,000 per year, an amount high enough to strain most families’ finances. Private long-term care insurance represents one way individ-uals can obtain financial protection from these costs. Yet most people do not purchase long-term care insurance.
In 2005, Medicaid expenditures for long-term care services were $101 billion, representing 49 percent of the Nation’s spending on long-term care. Under Federal law, State Medicaid programs must cover nursing home care and home health care, and may opt to cover some personal care services as well for qualified individuals. In contrast, Medicare covers only some home health care and limited recuperative care in skilled nursing facilities following a qualified inpatient hospital-ization. In 2005, Medicare’s share of total U.S. long-term care spending was approximately 20 percent.
Medicaid expenditures have grown rapidly in recent years with the increasing cost of covering long-term care and a growing population of elderly and disabled people. Medicaid expenditures on long-term care, including skilled nursing care as well as home- and community-based services, are expected to grow at an average real rate of approximately 6 percent per year over the next decade. By 2017, Medicaid long-term care expenditures for the Federal Government and States are projected to reach $228 billion. In the absence of fundamental reforms, this enormous entitlement burden will severely strain both Federal and State budgets.
Chapter 6 | 187
Factors That Drive Expenditure Growth Over Time
Growth in expenditures for Social Security is expected to accelerate as the baby-boom generation retires, after which it is expected to level off. In contrast, expenditures for Medicare and Medicaid are expected to continue rising faster than GDP. This section examines the main factors that drive these expected increases in expenditures.
Demographic ShiftsThe changing demographics of the United States population is an impor-
tant factor in the growth of entitlement spending. With slowing birth rates and increasing life expectancy, the U.S. population is aging. For example, in 1950, less than 12 percent of the adult population was 65 or older; in 2008 this group constituted nearly 17 percent of the adult population. Demographers estimate that this trend will continue and that by 2030, twenty-five percent of the adult population—72 million people—will be at least 65 years of age.
This demographic shift means there are fewer workers paying taxes into the Social Security system for each retired person. To illustrate, in 1950, there were 16 workers paying taxes into the Social Security system for each Social Security beneficiary, meaning the effective tax burden on each worker was only one-sixteenth of the average amount paid to each beneficiary. In 2007, there were 3.3 workers per beneficiary. The number of workers per benefi-ciary is expected to fall further, to 2.6 workers per beneficiary in 2020 and to 2.1 workers per beneficiary in 2035. As the number of workers per benefi-ciary falls, the effective individual burden of taxes for both Social Security and Medicare Part A increases. For example, for Social Security, the payroll tax rate has been raised more than 20 times and the maximum annual amount of taxable income has been increased statutorily 11 times since the program’s inception. This maximum is now (since 1981) adjusted annually to reflect average wage growth.
It is important to note that the demographic shift is not a temporary phenom-enon brought on simply by the aging of the baby-boom generation. That is, assuming stable fertility rates and immigration patterns, one should not expect to return to a world with 16 workers—or even 5—contributing to each Social Security recipient’s benefit after the baby-boom generation stops collecting Social Security benefits. Chart 6-4 shows that in the very near future, as the baby boomers retire en masse, the share of the adult population that is eligible for Social Security and Medicare will begin shifting from a recent average of about 16 percent to over 25 percent, where it will stay for the foreseeable future.

188 | Economic Report of the President
A clear implication of this trend is that there will be fewer workers to pay taxes to support each Social Security and Medicare recipient.
Increased Health Care Spending per BeneficiaryAdvances in medicine over the past few decades have created new methods
for diagnosing illness and disease, as well as new therapies for preventing and treating medical conditions. While these advances have contributed to improvements in quality of life and longer life expectancy, they also have contributed to greater utilization of complex, expensive treatments and higher spending per person. This phenomenon is not restricted to Medicare and Medicaid enrollees, but instead reflects broader health spending patterns among individuals in the United States.
Although health insurance, including Medicare and Medicaid, provides important financial protections, one consequence of comprehensive coverage and a third-party payment system is that individuals have little incentive to consider providers’ costs when making decisions about the medical care they receive. This moral hazard effect can lead people to demand more medical care than they would without insurance because their out-of-pocket cost at the point of use constitutes only a small portion of the total cost of the service.
Among Medicare enrollees, moral hazard problems are exacerbated by the widespread use of supplemental insurance, including retiree coverage, private

Chapter 6 | 189
Medigap plans, and Medicaid (for dual eligibles). In effect, the combination of Medicare and supplemental insurance means enrollees pay only a very small portion or none of the total cost of care, and as a result, price is removed as a factor in determining how much medical care enrollees consume.
The Bottom LineThe permanent demographic shift and growth in per-person health care
spending suggest that there are two distinct aspects of these programs that must be addressed. One aspect is program solvency: that is, how will the Government finance the benefits scheduled to be paid over the near term to current and future beneficiaries? Given the permanent nature of the demo-graphic shift and the likelihood that future health care expenditures will grow, it will be impossible for the Government to continue these entitlement programs indefinitely as they currently exist. Thus, the second aspect that must be addressed is the long-term sustainability of the programs.
The Financial Future of Social SecurityThe demographic transition to an older population that is already underway in
the United States will place increasing stress on the financing of Social Security in the years ahead. This section examines the issues inherent in ensuring that benefits can be paid in the near term (solvency) and the issues that must be addressed to ensure long-term sustainability of this important program.
Addressing Future SolvencyProjections by the Social Security Administration (SSA) indicate that
payroll tax revenues will exceed expenses through 2016, then, beginning in 2017, it will be necessary to draw on Social Security Trust Fund assets to pay all scheduled benefits. This would require making increasing amounts of general revenue available from 2017–2041 to pay full scheduled benefits, after which time the trust fund would be exhausted. Payroll tax revenues are projected to be sufficient to pay 78 percent of scheduled benefits in 2041 and beyond.
As Social Security costs continue to rise faster than revenues, increasing pressure will be placed on the general fund of the Federal Government. By purchasing Treasury bonds with its annual surpluses, the Social Security Trust Fund has been effectively lending money to the general fund of the Federal Government. As Social Security’s annual surpluses decline, beginning after 2009, less money will be available to the Treasury Department from this channel and the Government will increasingly be forced to find other revenue
190 | Economic Report of the President
sources or reduce spending. The problems for the Federal budget intensify in 2017, when Social Security will first need money from the general fund to pay scheduled benefits. During the 2020s, Social Security will require larger and larger transfers from the general fund as it redeems the Treasury bonds that have accumulated in the trust fund, putting greater and greater pressure on the Federal budget.
Most proposed solutions to the solvency issue involve some form of revenue increases, or benefit reductions, or both. Social Security revenues could be increased either by raising the payroll tax rate or increasing the maximum amount of taxable earnings. However, as discussed in the preceding chapter, imposing taxes distorts markets—higher taxes would decrease economic effi-ciency by worsening the adverse labor incentives discussed in Box 6-1.
There are a variety of ways Social Security benefits could be reduced, such as further delaying the normal retirement age, or reducing scheduled bene-fits, particularly for higher-income workers. To help address the solvency issue, the President embraced the concept of progressive price indexing for new retirees. Progressive price indexing would reduce the growth in initial benefits for new retirees, particularly for high-income workers, and thus would reduce projected program costs in the decades ahead, while retaining currently scheduled benefits for very low income workers.
Workers with higher preretirement earnings are eligible for a larger initial benefit, but the marginal increase in the initial benefit decreases as a worker’s preretirement income gets higher and higher. Progressive price indexing would further reduce the rate at which benefits grow with preretirement income, which would slow the year-by-year growth of initial benefits for high- and middle-income retirees. This proposal would ensure that retirees of the future will receive real benefits that are at least as high as those of today’s retirees who are at comparable positions on the wage spectrum. Benefits for all recipients would still increase annually via cost-of-living adjustments to maintain the purchasing power of the benefits. Note that the current benefit formula would be preserved for individuals with low preretirement income. Estimates suggest that progressive price indexing would cover about 70 percent of the gap between income and outlays over the long term. Benefits paid under the Disability Insurance program would not be affected by this proposal.
Funding Future BenefitsThe current Social Security system was designed in an era in which average
life expectancy was less than 65 years and few women participated in the labor force. Today, average life expectancy is 78 years and about 60 percent of all women participate in the labor force. The demographic and labor market
Chapter 6 | 191
changes that have occurred in the last 70 years or so render the pay-as-you-go system of the 1930s inappropriate for the 21st century.
A central feature of the Administration’s 2005 proposals for Social Security reform, the Personal Retirement Account (PRA), was designed to pre-fund a portion of future benefit obligations. Participation in PRAs would be entirely voluntary. Workers could choose to have up to 4 percentage points of their current Social Security taxes go into their own, individual account. The Federal Government would administer these accounts, making contributions and with-drawals as appropriate for each worker’s wages and individual choices.
Each worker could choose to have the funds in their account invested in any of a set of prescreened, broadly diversified investment funds, similar to those currently available to Government employees in their retirement savings plan. Recent stock market declines raise concerns about the desirability of investing even a portion of Social Security assets in the stock market. However, market declines, like market increases, are a normal part of stock market behavior and do not negate the desirability of owning stocks as part of a long-term invest-ment strategy. From 1926 to 2000, even with several periods of significant market decline, stocks generated an average annual return of 10.7 percent.
Nevertheless, there is currently much concern about the risks of investing Social Security assets in the stock market. One way to mitigate these risks could occur automatically; as workers near retirement age, their PRA invest-ments could be moved to lower-risk, life-cycle funds, which ensure the safety of the worker’s retirement benefits by progressively shifting more of the worker’s investment from growth funds to secure bonds as the worker nears retirement age.
A PRA-based system offers a partially self-funded retirement benefit while retaining the social safety net aspects of the current system. A primary advan-tage of this system would be significantly reduced intergenerational transfers from future workers entering the system. This system would give workers a partial alternative to the current, pay-as-you-go, Social Security system that, as discussed above, will require reducing benefits when the Social Security Trust Fund is exhausted or force workers to bear ever-increasing tax burdens as the population continues to age.
PRAs could be phased in to ensure that current retirees and workers nearing retirement would receive the full Social Security benefits they are expecting. PRAs would offer those who want it individual ownership and management of retirement assets and could be transferable to family members if the worker were to die prematurely. Finally, PRAs would reduce the disincentives the current system generates regarding labor supply and saving decisions. (Box 6-1 describes the disincentives present in the current system.) For example, PRAs reduce possible adverse labor supply effects for secondary earners by giving them explicit rights to a portion of their Social Security assets.

192 | Economic Report of the President
The Financial Future of Medicare and MedicaidMedicare and Medicaid are currently responsible for purchasing health
care services for over 80 million individuals in the United States annually—a number that is expected to exceed 100 million by 2017. This section takes a closer look at the future budgetary impact of these programs and identi-fies possible strategies for promoting long-term sustainability of Medicare and Medicaid.
Recall that Medicare is financed predominately by payroll taxes, general revenues, and beneficiary premiums. Under current projections in the 2008 Medicare Trustees Report, the Medicare Hospital Insurance Trust Fund for Part A is projected to be exhausted in 2019. The projected 75-year deficit for the Medicare Hospital Insurance Trust Fund is 3.54 percent of taxable payroll. That is, the Medicare Hospital Insurance payroll tax would have to immediately increase from a total of 2.90 percent to 6.44 percent to cover all projected spending for Part A over the next 75 years. Thus, one option for keeping Part A solvent would be to more than double the Medicare payroll tax rate. For Medicare Parts B and D, as well as Medicaid, general revenues are the largest source of financing. This suggests that, in the absence of significant reforms to slow spending growth, spending on other government programs will have to be dramatically reduced, budget deficits will grow larger, or income taxes will have to increase.
Real spending growth for Medicare and Medicaid is on a much steeper trajectory than projected growth for the economy as a whole. The long-term sustainability of these programs is in question unless policymakers implement a comprehensive set of reforms to slow both the overall growth in health care spending as well as the Federal Government’s liabilities. Although key stakeholders have not yet discovered a silver bullet for slowing overall spending growth, insurers and providers are pursuing a variety of approaches in an attempt to improve the efficiency of resource allocation and to slow the growth of costs.
Some of these efforts focus on greater use of high-value health care services by individuals, including preventive care (certain types of screening for diseases), wellness initiatives (flu shots or smoking cessation advice), and disease management for those with chronic conditions. Other efforts target provider behavior, including adopting health information technology that may reduce medical errors and duplication of services, and participating in quality-measurement activities and public reporting. In value-based purchasing, insurers design payment systems that are tied more directly to the quality and efficiency of care that is delivered by providers. One example includes pay-for-performance programs, whereby providers may receive financial rewards if the quality of care they provide achieves certain outcomes (such as a physician
Chapter 6 | 193
making sure that all of his diabetic patients receive HbA1c tests during the year) or if a provider shows improvement over time in the quality of care he or she provides. Of course, many of these initiatives are fairly recent and as a result, the empirical evidence is not yet available to establish what impact these particular initiatives might have for slowing overall cost growth.
A second strategy directly targets Federal spending growth vis-à-vis struc-tural changes to the designs of the Medicare and Medicaid programs. Several types of reform proposals are specifically aimed to reduce Federal spending by altering the current structure of Medicare benefits. Increasing the age of eligibility for Medicare, raising premiums, and modifying the benefit design are three examples. Similar to the changes that were made to Social Security in 1983, the age at which individuals become eligible for Medicare could gradually increase. However, unlike Social Security, the savings generated from delaying eligibility may not be substantial, since younger Medicare beneficiaries have much lower average costs relative to older beneficiaries.
Beneficiary premiums are an important source of income for Medicare Parts B and D. Raising beneficiary premiums is one option for reducing Federal spending, although raising premiums for all beneficiaries may impose a significant financial burden on lower-income beneficiaries who are not also eligible for Medicaid. One suggested proposal calls for the broader use of income-related premiums, whereby higher-income beneficiaries would pay more for their coverage. Income-related premiums are already being used for Part B; however, as of 2007 the threshold was set so high that it affected less than 3 percent of the Medicare population. Using more stringent thresholds and adopting income-related premiums for Medicare Part D are two possible strategies for reducing the implicit subsidy that Medicare provides to higher-income beneficiaries.
Modifying the benefit design offers another approach to limiting Federal spending. Benefit design features, such as deductibles and coinsurance, are typically used to address moral hazard concerns. While increasing deduct-ibles and coinsurance can reduce beneficiaries’ incentives to overuse care and reduce spending, it may lead some beneficiaries to delay or forgo needed care due to cost. A related issue is the widespread use of supplemental Medicare insurance, which typically reimburses beneficiaries for deductibles and coin-surance amounts when they seek care. With this additional coverage, the price of medical care is effectively removed as a factor from decision making. Some economists have suggested that private supplemental Medicare insur-ance should be limited or eliminated altogether. Since greater utilization of high-technology treatments is a major driver of health care spending growth, an additional strategy is to base coverage decisions about new medical treatments on their comparative effectiveness and cost effectiveness relative to existing therapies. Certainly, this may raise concerns by patients and
194 | Economic Report of the President
providers regarding the role of government in determining which medical treatments are prescribed.
In addition to strategies that alter the existing program structure, others have suggested more fundamental changes to promote long-run sustainability. For example, some have suggested moving completely to a market-based approach in which Medicare beneficiaries receive risk-adjusted and income-adjusted vouchers that could be applied toward the cost of private health plans. Such a reform could build upon the strengths of the current Medicare Advantage program and potentially strengthen competition in the market for health insurance. Moreover, a voucher system would provide greater certainty in terms of the Federal Government’s future liabilities.
Medicare provider payment systems are complex and generally create poor incentives for limiting spending growth. Fee-for-service payment systems reward providers for how much they do rather than for the value that they provide to Medicare patients. Furthermore, administrative pricing may or may not necessarily reflect what would be observed in a competitive market, due to inflation and technological advances in medicine. Competitive bidding has been proposed as one alternative method for setting prices. Specifically, competitive bidding requires providers to submit bids that reflect costs plus a normal rate of profit. Providers with the lowest cost can be identified. Over time, this type of system can enable providers to more easily adjust prices to reflect changes in production costs resulting from changes in input prices (such as the wages of nurses) or technology (such as MRI or CT scanners).
For Medicaid, one of the most pressing issues is the anticipated growth in long-term care. While some people require the level of care provided by nursing homes, many eligible Medicaid beneficiaries would actually prefer less expensive community-based care. Transitioning away from primarily institutional care and toward a more community-based long-term care system is one potential cost-saving measure; however, it is not clear to what extent overall demand for services will rise when access to this option improves. Encouraging the purchase of private long-term care insurance through tax credits or Qualified State Long-Term Care Partnerships, which protect some assets of those with long-term care insurance while still allowing them to qualify for Medicaid, may both reduce the spending burden on Medicaid and protect many seniors from poverty. Additionally, better coordination of care between Medicare, which is often responsible for financing initial nursing home stays through its post-acute care coverage, and Medicaid, which often assumes responsibility for nursing home patients after their Medicare benefits end, could also help reduce costs.

Chapter 6 | 195
ConclusionThere are no painless solutions to the budgetary challenges arising from
long-term projected growth in Social Security, Medicare, and Medicaid. While there is no specific year when one can be sure a crisis is imminent, it is clear that these problems will only grow larger the longer policymakers delay in developing and implementing reform strategies. The environments in which Social Security, Medicare, and Medicaid were created no longer exist, and the Legislative and Executive branches of the Federal and State Governments need to take up the budgetary challenges entitlement programs present and ensure that these programs are adapted to their new realities.