Chapter 6 - Federal Highway Administration
39
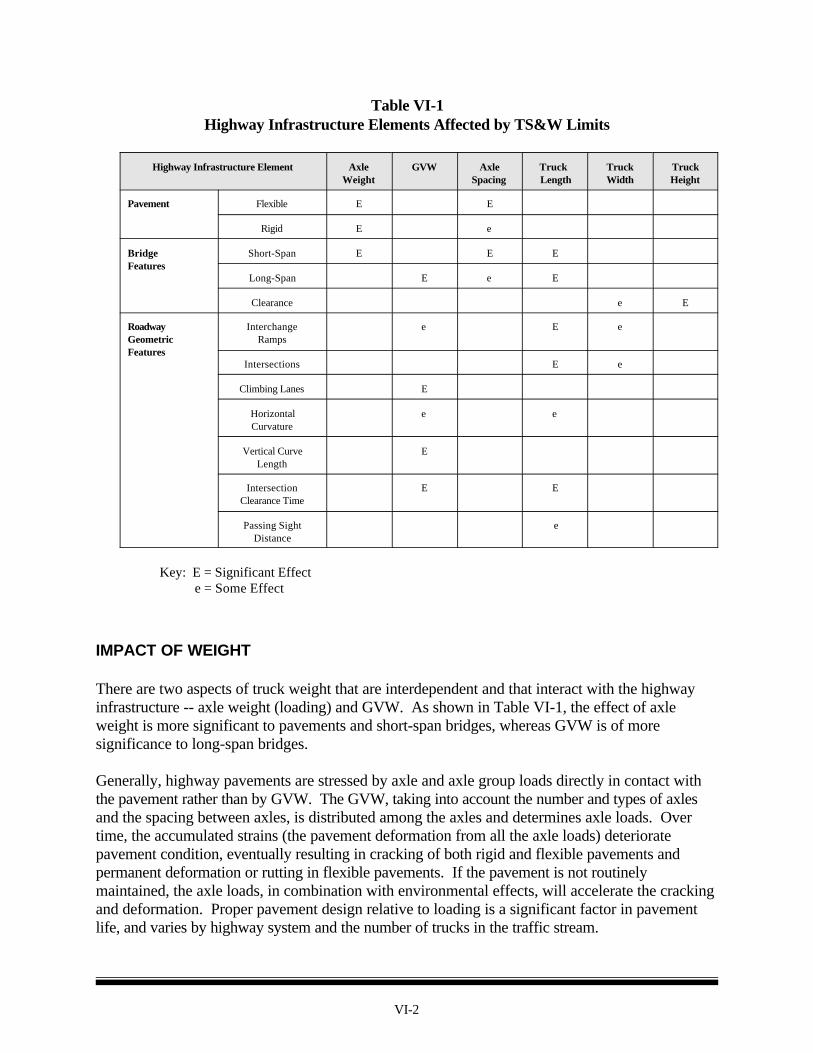
VI-1 CHAPTER 6 HIGHWAY INFRASTRUCTURE INTRODUCTION Highway infrastructure protection historically has been the primary consideration in determining TS&W limits as the weights and dimensions of trucks in particular determine the costs that highway agencies must bear to construct and maintain a highway system to serve present traffic and that anticipated in the near future. This Chapter is intended to acquaint the reader with the technical and practical side of TS&W interaction with the infrastructure elements. Pavement deterioration increases with axle weight, the number of axle loadings, and the spacing within axle groups. The axle loads and spacing on trucks also affects the design and fatigue life of bridges. Truck dimensions influence roadway design -- truck width affects lane widths, trailer or load height affects bridge and other overhead clearances, and length affects intersection and curve design. And conversely, truck designs are determined by existing pavement and bridge strength and roadway geometry. Pavement types analyzed in this Study include flexible, asphaltic concrete; and rigid, portland cement concrete. Bridge features included in the analysis are span length and type of member support -- simple or continuous. The list of roadway geometry features analyzed includes interchange ramps, intersections, and mainline curves. Alternative truck configurations analyzed, in terms of their interaction with highway infrastructure features, include single-unit or straight trucks and single- and multitrailer truck combinations. OVERVIEW OF INFRASTRUCTURE IMPACTS The TS&W characteristics -- axle weights, GVW, truck length, width, and height -- affect pavements, bridges, and roadway geometry in different ways, as shown in Table VI-1.
Transcript of Chapter 6 - Federal Highway Administration

VI-1
CHAPTER 6
HIGHWAY INFRASTRUCTURE
INTRODUCTION
Highway infrastructure protection historically has been the primary consideration in determiningTS&W limits as the weights and dimensions of trucks in particular determine the costs thathighway agencies must bear to construct and maintain a highway system to serve present traffic andthat anticipated in the near future. This Chapter is intended to acquaint the reader with thetechnical and practical side of TS&W interaction with the infrastructure elements. Pavementdeterioration increases with axle weight, the number of axle loadings, and the spacing within axlegroups. The axle loads and spacing on trucks also affects the design and fatigue life of bridges. Truck dimensions influence roadway design -- truck width affects lane widths, trailer or loadheight affects bridge and other overhead clearances, and length affects intersection and curvedesign. And conversely, truck designs are determined by existing pavement and bridge strengthand roadway geometry.
Pavement types analyzed in this Study include flexible, asphaltic concrete; and rigid,portland cement concrete. Bridge features included in the analysis are span length and typeof member support -- simple or continuous. The list of roadway geometry features analyzedincludes interchange ramps, intersections, and mainline curves. Alternative truck configurationsanalyzed, in terms of their interaction with highway infrastructure features, include single-unit or straight trucks and single- and multitrailer truck combinations.
OVERVIEW OF INFRASTRUCTURE IMPACTS
The TS&W characteristics -- axle weights, GVW, truck length, width, and height -- affectpavements, bridges, and roadway geometry in different ways, as shown in Table VI-1.
VI-2
Table VI-1Highway Infrastructure Elements Affected by TS&W Limits
Highway Infrastructure Element AxleWeight
GVW AxleSpacing
Truck Length
TruckWidth
TruckHeight
Pavement Flexible E E
Rigid E e
BridgeFeatures
Short-Span E E E
Long-Span E e E
Clearance e E
RoadwayGeometricFeatures
InterchangeRamps
e E e
Intersections E e
Climbing Lanes E
HorizontalCurvature
e e
Vertical CurveLength
E
IntersectionClearance Time
E E
Passing SightDistance
e
Key: E = Significant Effect
e = Some Effect
IMPACT OF WEIGHT
There are two aspects of truck weight that are interdependent and that interact with the highwayinfrastructure -- axle weight (loading) and GVW. As shown in Table VI-1, the effect of axleweight is more significant to pavements and short-span bridges, whereas GVW is of moresignificance to long-span bridges.
Generally, highway pavements are stressed by axle and axle group loads directly in contact withthe pavement rather than by GVW. The GVW, taking into account the number and types of axlesand the spacing between axles, is distributed among the axles and determines axle loads. Overtime, the accumulated strains (the pavement deformation from all the axle loads) deterioratepavement condition, eventually resulting in cracking of both rigid and flexible pavements andpermanent deformation or rutting in flexible pavements. If the pavement is not routinelymaintained, the axle loads, in combination with environmental effects, will accelerate the crackingand deformation. Proper pavement design relative to loading is a significant factor in pavementlife, and varies by highway system and the number of trucks in the traffic stream.

VI-3
Axle groups, such as tandems or tridems, distribute the load along the pavement, allowing greaterweights to be carried and resulting in the same or less pavement distress than that occasioned by asingle axle at a lower weight. The spread between two consecutive axles also affects pavementlife or performance; the greater the spread, the more each axle in a group acts as a single axle. Forexample, a spread of 9 to 10 feet results in no apparent interaction of 1-axle with another, and eachaxle is considered a separate loading for pavement impact analysis or design purposes. Conversely, the closer the axles in a group are, the greater the weight they may carry withoutincreasing pavement deterioration beyond that occasioned by a single axle, dependent on thenumber of axles in the group. This benefit to pavements of adding axles to a group decreasesrapidly beyond 4-axles.
Axle loads also have a beneficial effect on short-span bridges -- that is, bridge spans that areshorter than the truck, thereby resulting in only 1-axle group, front or rear, being on the span at anytime. While spreading the axles in an axle group is beneficial to short-span bridges, it isdetrimental to pavement. It is not GVW but the distribution of the GVW over axles that impactspavements.
However, GVW is a factor for the life of long-span bridges -- that is, bridge spans longer thanthe wheelbase of the truck. Bridge bending stress is more sensitive to the spread of axles than tothe number of axles. The FBF takes into account both the number of axles and axle spreads indetermining allowable GVW.
In the context of roadway geometrics, increasing GVW affects a truck's ability to accelerate from astop, to enter a freeway, or to maintain speed on a long grade. Acceleration from a stop influencesthe time required to clear an intersection. Acceleration into a freeway affects the determination ofacceleration lane length requirements. Inability to maintain speed on a long grade requires theconstruction of truck climbing lanes. Some of these effects can be ameliorated by changes in truckdesign, primarily to engine and drive train components. The GVW also has a second order effecton offtracking -- that is, on how the rear axle of a trailer tracks relative to the steering axle of thetruck. Other truck characteristics affected by roadway geometrics are discussed in more detaillater in this Chapter.
IMPACT OF DIMENSIONS
The dimensions of trucks and truck combinations have various effects on the three elements ofhighway infrastructure. The most significant effects relate to length, particularly when combinedwith GVW. Width has a limited effect on swept path -- the combination of offtracking and vehiclewidth. Swept path affects highway geometrics in terms of interchange ramp or roadwayintersection design which is based on mapping a maximum swept path that the truck encroaches onthe shoulder, over the curb, or into another lane of traffic. Height regulations are intended toensure that trucks will clear overhead bridges, bridge members, overhead wires, traffic signals,and other obstructions.
In general, truck length -- or more specifically wheelbase -- has a strong effect on bridge stress forlong-span bridges. The longer the wheelbase the shorter the distance from the support member towhere the load is being applied (the moment arm) when the truck is in the middle of

1 A substantial amount of the background material is drawn from the TRB Special Report 225, Truck WeightLimits: Issues and Options, 1990 and from the 1981 U.S. DOT Report to Congress under Section 161, AnInvestigation of Truck Size and Weight Limits.
VI-4
the span. The shorter the truck the greater the concentration of load at the middle of the span, andthe longer the distance (moment arm) to the support member for the bridge span member. A truckat mid-span is the loading condition for the maximum stress in a simple supported span. This isnot the case for some continuous supported spans: when a truck is straddling the center pier of acontinuous span, increasing the truck length can increase the stress in the span at the pier.
The effect of truck wheelbase on offtracking is reduced considerably if the combination isarticulated, especially in a multitrailer combination. Low-speed offtracking affects interchangeand intersection design, and high-speed offtracking affects lane width.
BRIDGES
Bridges are critical to the safe and efficient movement of people and freight on the Nation’shighways. This section discusses the important considerations that have influenced the decisionmaking and investments of Federal and State transportation officials for bridges.
BRIDGE DESIGN1
Most highway bridges in the United States were designed according to the design guidelines of theAASHTO. These guidelines provide traffic-related loadings to be used in the development andtesting of bridge designs, as well as other detailed requirements for bridge design andconstruction.
Dynamic effects (vibration resulting in bridge loads that vary above and below that loadresulting trucks operating at higher speeds. In bridge design, design loadings (in the staticcondition) are adjusted upward to account for dynamic effects. To minimize the dynamic effects ofextra-heavy nondivisible loads on some bridges, permits often require the truck to cross at a veryslow speed, depending on its GVW.
A key task in bridge design is to select bridge members that are sufficiently sized to supportthe various loading combinations the structure may carry during its service life. These includedead load (the weight of the bridge itself); live load (the weights of vehicles using the bridge); andwind, seismic, and thermal forces. The relative importance of these loads is directly related to thetype of materials used in construction, anticipated traffic, climate, and environmental conditions. For a short-span bridge (for example, span length of 40 feet), about 70 percent of the load-bearingcapacity of the main structural members may be required to support the traffic-related live load,with the remaining 30 percent of capacity supporting the weight of the bridge itself. For a longbridge (for example, span length of 1,000 feet), as much as 75 percent

2 FHWA http://www.ota.fhwa.dot.gov/tech/struct/dp99lr.html, February 19, 1998.
VI-5
of the load-bearing capacity of the main structural members may be required to support the weightof the bridge.
In most instances, the loading event that governs bridge capacity is a design vehicle placedat the critical location on the bridge. In certain cases, a lane loading simulating the presence ofmultiple trucks on a bridge is the governing factor. Bridges are also affected by the dynamicimpact and lateral distribution of weight of trucks; dynamic impact is determined by speed androadway roughness, and the lateral distribution of loads varies with the position of the truck(s)on the bridge.
The methods used to calculate stresses in bridges caused by a given loading are necessarilyconservative; therefore, the actual measured stresses are generally much less than calculatedstresses. Providing for a margin of safety is necessary to bridge design because:
C The materials used in construction are not always completely consistent in size, shape, andquality;
C The effects of weather and the environment are not always predictable;
C Highway users on occasion violate vehicle weight laws;
C Legally allowed loads may increase during the design life of a structure; and
C Overweight loading is occasionally allowed by permit.
The adjustment of the nominal legal loading is reflected in the safety factors, which are selected sothat there is only a very small probability that a loading condition that exceeds load capacity willbe reached within the bridge’s design life.
The margins of safety used by bridge designers in the past have been reduced in recent bridgedesign procedures. Use of new design procedures and computer-aided engineering and design hasenabled more precise analysis of load effects and the selection of smaller bridge members. Also,the competition between the steel and concrete industries has led each group to foster lower costsfor their own material. For example, many designs now proposed for steel bridges reduce thesafety factor by reducing the number of girders, which increases their spacing.
Design and construction of highway bridges in the United States has been governed by theAASHTO's Standard Specifications for Highway Bridges since 1931, with subsequent revisions. In the early 1990s AASHTO decided to develop an entirely new bridge code to incorporatestate-of-the-art bridge engineering that is based on the load and resistance factor design (LRFD)approach.2 In 1993, AASHTO adopted LRFD bridge design specifications on a trial basis, as an

3 AASHTO http://www2.epix.net/~lrfd/develop.html, February 19, 1998.4 Ibid.5 According to the AASHTO Manual for Maintenance Inspection of Highway Bridges (1983) an operating
rating is defined as RF = 0.75-D/L(1+I) where RF= rating factor arrived at with the equation 0.55R= D + L (1 +I) where R= the limiting stress (often the stress at which steel will undergo permanent deformation, or “yield”),D= stress due to dead load (the effect of gravity on bridge components), L= stress due to live load (vehicles onthe bridge), I= an adjustment to the static effect of live loads to account for dynamic effects. An inventorybridge rating is arrived at by selecting the most highly stressed bridge component and inserting the rating factor(RF) into the Equation, RF= 0.55R- D/L(1 + I), as a multiplier on the live load of the rating truck.
VI-6
alternative to standard bridge design specifications. In 1996, interim LRFD specifications weremade available by AASHTO and conversion to this method was encouraged wherever practical.3
The LRFD method applies statistically determined factors to bridge design parameters, using aseries of load and resistance factors to account for variabilities in loads and material resistance. The specifications use statistical methods and probability theory to define the variations in loadingand material properties and the likelihood that various load combinations will occursimultaneously.4
BRIDGE IMPACT
Past studies of the impact of truck weight limit changes on bridges were based on variouspercentages of the yield stress for steel girder bridges, such as 55 percent or 75 percent. The yieldstress, a property of the particular type of steel, is the stress at the upper limit of the elastic rangefor bridge strain. The elastic range of a structural member is the set of stresses over which thedeformation -- the strain of the member -- is not permanent. In the elastic range, the memberreturns to its former size and shape when the stress is removed. There is no permanent set in thestructural member. For this discussion, strain is the elongation of a steel girder when (1) a portionof the strain becomes permanent at a stress level above the yield stress; and (2) the girdercontinues to elongate, or stretch, under increasing load until it ruptures or fails. Beyond the elasticrange, there is permanent elongation of the bridge girder, that is, for those stresses that are greaterthan the yield stress. However, in structural steel there is considerable strain before failureoccurs.
BRIDGE INVENTORY AND OPERATING RATINGS
States rate bridges, at their discretion, at either an inventory rating (55 percent of the yield stress)or operating rating (75 percent of the yield stress).5 Bridges are never intentionally loaded toyield stress in order to provide an adequate margin of safety. The design stress level for bridgesis the same as the inventory rating, 55 percent of the yield stress. These two ratings are also usedfor posting bridges; either may be used under AASHTO guidelines, at the option of the State. Asign specifying weight limits is posted on bridges when it is determined that a vehicle above thespecified weight would overstress the bridge. This weight could be that which stresses the bridgeat either the 55 percent or 75 percent level of the yield stress.

6 The TRB Special Reports 225, Truck Weight Limits: Issues and Options and 227, New Trucks for GreaterProductivity and Less Road Wear: an Evaluation of the Turner Proposal estimated the bridge costs of theTS&W changes under study based on the operating rating of 75 percent of yield stress, whereas reviewers ofthose reports found much higher bridge costs resulting from the use of the inventory rating of 55 percent ofyield stress.
VI-7
As States have the option to use either level for posting purposes, both ratings have been used inpast studies to assess the bridge impacts for evaluating TS&W policy scenarios. Significant costdifferences result from choice of rating. Use of the lower stress level (inventory rating) results inmore bridges being identified as needing to be upgraded to accommodate increased weights ordecreased lengths.6
Following the reviews of the TRB Special Reports 225 and 227 the FHWA determined thatthe stress level most representative of all State bridge posting practices was the inventory rating(55 percent of the yield stress) plus 25 percent, which gives a level of 68.8 percent of yield stress. The FHWA used this 68.8 percent of yield to estimate the bridge cost impacts of LCVs. Theresulting cost estimate reported by the FHWA in May 1991 was much closer to that based on the75 percent rating, the TRB findings.
BRIDGE STRESS
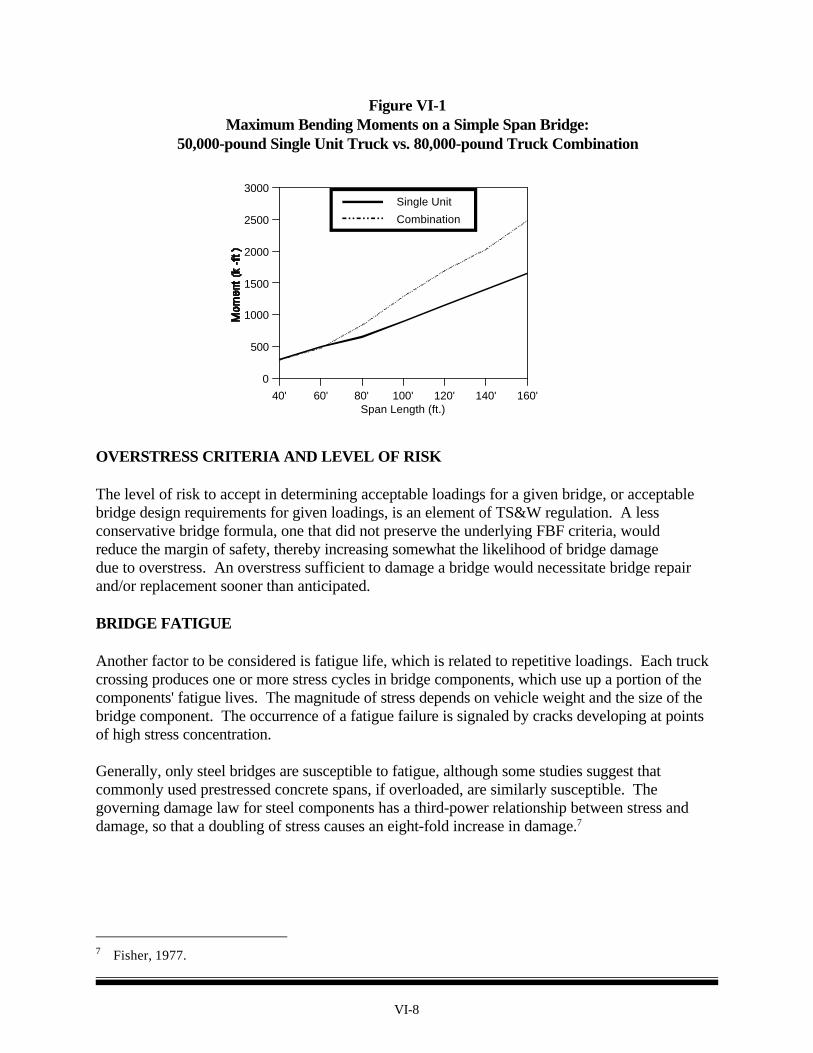
Bridge stresses caused by vehicles depend on both GVW and the distances between the axlesthat act as point loads. Trucks having equal weight but different wheelbases produce differentbridge stresses. The shorter the wheelbase, the greater the stress. On a simple-span bridge, thelength of a truck relative to the length of bridge span is also important. For relatively short spans(20 feet to 40 feet), all axles of a truck combination will not be on the bridge at the same time. Themaximum bending moments determine stresses in the main load-carrying members of simple spanbridges.
Figure VI-1 shows the maximum bending moments, by span lengths between 40 and 160 feet, fortwo trucks: a 50,000-pound single unit truck with a wheelbase of 19 feet, and an 80,000-poundcombination with a wheelbase of 54 feet. For shorter bridges, the 50,000-pound single unit truckproduces slightly higher stresses than the 80,000-pound combination; however, for longer bridges,the combination produces higher stresses.
TS&W REGULATION RELATED TO BRIDGE PROTECTION
The TS&W regulation to protect bridges generally takes the form of a bridge formula or table. Federal bridge protection regulation, which became effective in 1975, uses a formula. SomeStates still use bridge tables, which were grandfathered by the 1975 Federal law. Other States usebridge tables for issuing overweight permits. The FBF is based on overstress criteria, the amountof bridge stress above the design stress to be allowed.
7 Fisher, 1977.
VI-8
Span Length (ft.)40' 60' 80' 100' 120' 140' 160'
0
500
1000
1500
2000
2500
3000Single Unit
Combination
Figure VI-1Maximum Bending Moments on a Simple Span Bridge:
50,000-pound Single Unit Truck vs. 80,000-pound Truck Combination
OVERSTRESS CRITERIA AND LEVEL OF RISK
The level of risk to accept in determining acceptable loadings for a given bridge, or acceptablebridge design requirements for given loadings, is an element of TS&W regulation. A lessconservative bridge formula, one that did not preserve the underlying FBF criteria, wouldreduce the margin of safety, thereby increasing somewhat the likelihood of bridge damagedue to overstress. An overstress sufficient to damage a bridge would necessitate bridge repairand/or replacement sooner than anticipated.
BRIDGE FATIGUE
Another factor to be considered is fatigue life, which is related to repetitive loadings. Each truckcrossing produces one or more stress cycles in bridge components, which use up a portion of thecomponents' fatigue lives. The magnitude of stress depends on vehicle weight and the size of thebridge component. The occurrence of a fatigue failure is signaled by cracks developing at pointsof high stress concentration.
Generally, only steel bridges are susceptible to fatigue, although some studies suggest thatcommonly used prestressed concrete spans, if overloaded, are similarly susceptible. Thegoverning damage law for steel components has a third-power relationship between stress anddamage, so that a doubling of stress causes an eight-fold increase in damage.7
8 AASHTO specifications give different allowable fatigue stresses for different categories of detail. Thesefatigue rules were initiated in the mid-1970s, therefore many older bridges were never checked during theiroriginal design for fatigue life. Further, the AASHTO fatigue rules apply to welded and bolted details withstresses induced directly by load passages (Moses, 1989).
9 Maximum Desirable Dimensions and Weights of Vehicles Operated on the Federal-Aid System, 1964 StudyReport to Congress, U.S. Department of Commerce.
VI-9
Bridge details that are particularly susceptible to fatigue include weld connections in tensionzones, pin and hanger assemblies, and cover plates on the bottom flanges of steel beams.8 Manyfatigue failures result from stresses induced indirectly by the distortion of the structure due to poordesign details or unforeseen restraints. Most steel cracks reported to date probably fall into thecategory of distortion induced. Some of the worst detailing can be corrected by repair and retrofit.
FEDERAL BRIDGE FORMULA
In 1975 along with axle and maximum GVW limits for Interstate highways, Federal law adopted abridge formula that restricts the maximum weight allowed on any group of consecutive axles basedon the number of axles in the group and the distance from the first to the last axle. The AASHOproposed the formula concept in the 1940s. It was further developed and presented in a 1964Report to Congress from the Secretary of Commerce.9 That Study recommended a table ofmaximum weights for axle groups to protect bridges (see Appendix A). The values in the table arederived from the following formula, that is, FBF:
W = 500 [ L N / ( N - 1 ) + 12 N + 36 ]
where:
W = maximum weight in pounds carried on any group of two or more consecutive axles
L = distance in feet between the extremes of the axle group
N = number of axles in the axle group
Current Federal law specifies exceptions to the results given by the above formula: 68,000 poundsmay be carried on two sets of tandem axles spaced at least 36 feet apart, and a single set of tandemaxles spread no more than 8 feet is limited to 34,000 pounds.
The FBF is based on assumptions about the amount by which the design loading can beexceeded for different bridge designs. Specifically, this formula was designed to avoidoverstressing HS-20 bridges by more than 5 percent and H-15 bridges by more than 30 percent. The FHWA established a bridge stress level of not more than 5 percent over the design stressfor HS-20 bridges to preserve the significantly large investment in these bridges by Federal, State,and local governments, and because these bridges carry high volumes of truck traffic.
10 Between the outside axles of any group of 2 or more axles.
VI-10
Although a level of up to 30 percent is considered a safe level for overstressing an H-15 bridgein good condition, the fatigue lives of these structures may be shortened by repeated loadings atthis level.
The FBF reflects the fact that increasing the spacing between axles generally results in lessconcentrated loadings and lower stresses in bridge members. For example, the bridge formulawould allow a 3-axle single-unit truck with a wheelbase of 20 feet to operate at 51,000 pounds. Ifthe wheelbase of this truck is increased to 24 feet, the maximum weight allowed under FBF wouldincrease to 54,000 pounds as shown in Table VI-2.
Table VI-2FBF 3-axle, 4-axle, And 5-axle Single-unit Truck Limit
Distance10
(Feet)GVW (Pounds)
3-Axles 4-Axles 5-Axles
202428323640
51,00054,00057,00060,000
55,50058,00060,50063,50066,00068,500
60,50063,00065,50068,00070,50073,000
As noted, there is a greater gain in allowable load by adding an axle than by increasing thedistance between axles. For instance, at 30 feet a 3-axle vehicle is allowed a maximum GVWof 58,500 pounds and by adding 2 feet can gain only 1,500 pounds. If the same 3-axle vehicle at 30feet adds an axle there is a gain of 3,500 pounds -- or 2,000 pounds more than by increasingdistance by 2 feet. Increasing the number of axles in an axle group without increasing the overalllength of the group has very little effect in reducing bridge stress. However, more axles doprovide substantial benefits to pavements.
POTENTIAL ALTERNATIVES TO FBF
Actually, the FBF is not just one formula but a series of formulas with the appropriate one chosenby a parameter, N, the number of axles in the group in question. However, bridge stress is affectedmore by the total amount of load than by the number of axles. Thus the FBF is not effective inmodeling the actual physical phenomenon, and it results in loads, especially for long combinations,that overstress bridges more than intended. More importantly, it encourages the addition of axlesto obtain more payload even though one or both bridge stress criteria are exceeded. At othertimes, the equation restricts allowable loads for some short trucks below that
11 TRB Special Report 225.
VI-11
allowed by the stress criteria themselves. In summary, the FBF actually results in overstressingsome of the bridges it is intended to protect.
Since 1975, there have been a number of proposals to revise the FBF and reduce its shortcomings. However, significant areas of concern have been identified with respect to the alternatives aswell. Three alternative formulas proposed in recent years are discussed here: a TRB (acombination of the Texas Transportation Institute (TTI) and FBFs) alternative, an AASHTOalternative, and a Goshen alternative.
TRB ALTERNATIVE
In 1990, the TRB recommended adoption of the formula developed by the TTI which would allowa 5 percent overstress for HS-20 bridges, in conjunction with existing Federal axle limits forvehicles with GVWs of 80,000 pounds or less.11 The TRB Report further recommended the FBFcontinue to be applied to vehicles weighing more than 80,000 pounds. The effect of this proposalwould be an increase in maximum weights allowed for shorter vehicles, while the maximumweight limits for the longer wheelbase trucks would remain unchanged. It was asserted that theTTI formula was overly conservative at heavier weights.
The TTI formula is in the form of two equations for straight lines that meet at a wheelbase length of56 feet. For wheelbases less than 56 feet, it is:
W = 1,000 ( L + 34 )
For wheelbases equal to or greater than 56 feet, it is:
W = 1,000 ( L/2 + 62 )
where:
W = allowable weight
L = wheelbase for truck configuration

12 Bridge Overstress Criteria, Michael Ghosn, Charles G. Schilling, Fred Moses, and Gary Runco, Report by theCity College of the City University of New York for the FHWA (Washington, D.C., FHWA, 1995).
VI-12
AASHTO ALTERNATIVE
In 1993, AASHTO issued a report which recommended that its member committees (1) evaluatenationwide adoption of the TTI bridge formula as a replacement for FBF; (2) consider a limiton maximum extreme axle spacing of 73 feet in the short term; (3) retain existing single- andtandem-axle limits; (4) control tridem-axle weights -- and the special permitting of vehicles withGVWs more than 80,000 pounds -- using the original TTI bridge formula which protects both H-15 and HS-20 bridges, as opposed to the TTI formula mentioned above, which protects onlyHS-20 bridges. The recommendation was reviewed by the AASHTO Highway Subcommittees onBridges and Structures and Highway Transport, accepted in resolution form, and approved by theStanding Committee on Highways. The AASHTO Board of Directors considered therecommendations at its 1996 Fall Meeting. The board expressed concern that the impact onpavements was not adequately addressed and remanded it for further consideration to theSubcommittees on Design and on Bridges and Structures.
GHOSN ALTERNATIVE
In 1995 a research study by Ghosn and others for FHWA, proposed a new formula based onstructural reliability theory as a replacement for the FBF.12 Structural reliability theory moreexplicitly accounts for the uncertainties associated with bridge design and load evaluation. Theproposed formula, however, is considerably more permissive than the FBF when applied to longvehicles. It results in bridge stresses well above the criteria selected for this Study. Therefore, itwas not considered.
ALLOWABLE WEIGHTS BASED ON FBF STRESS CRITERIA
Original research conducted for this Study suggests that a series of look-up tables may bedeveloped based on the underlying the FBF stress criteria -- that is, a maximum overstress of 5 percent for HS-20 bridges, and 30 percent for H-15 bridges. These stresses were computedfor both simple and continuous spans for the most critical span lengths for truck configurations. The following discussion illustrates how this approach might be applied to three vehicles: (1) atractor-semitrailer combination vehicle with a 3-axle tractor and 2-axle semitrailer, (2) a tractor-semitrailer combination vehicle with a 3-axle tractor and a semitrailer with a tridem-axle group,and (3) a RMD. The GVWs for each configuration with varying semitrailer lengths werecalculated based on axle spacing.
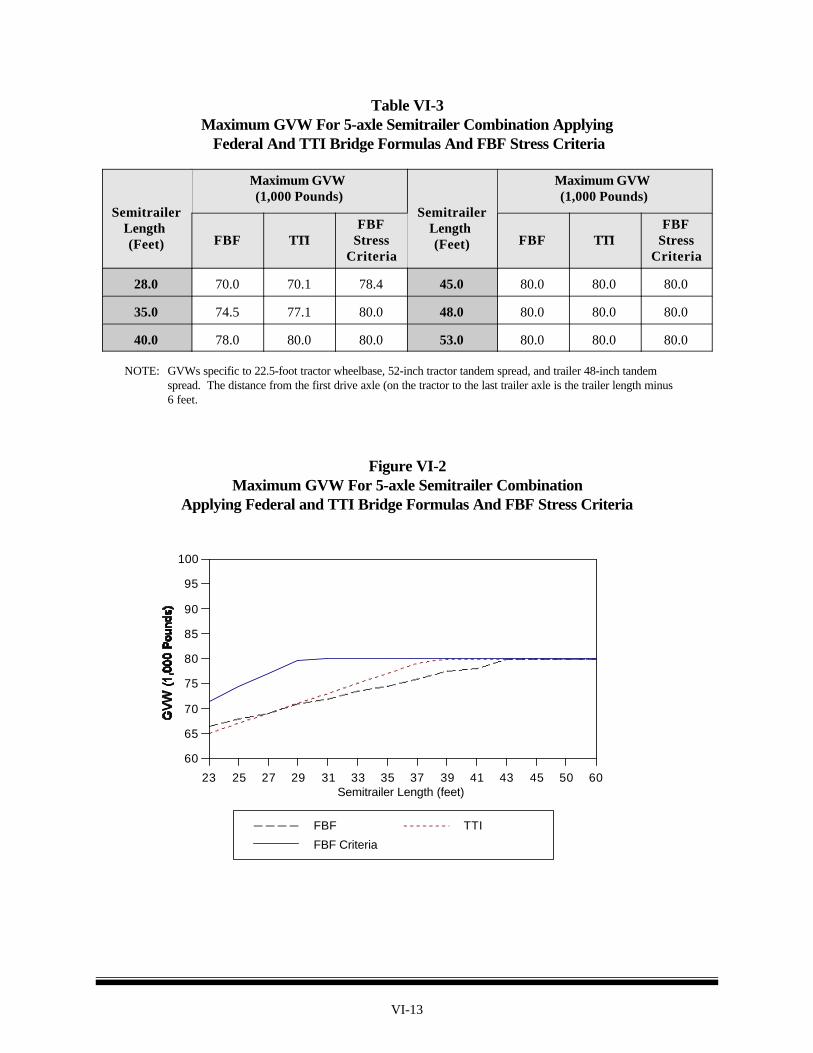
Table VI-3 presents the weight values for the first vehicle combination under the FBF, TTI, andFBF stress criteria; and Figure VI-2 graphically displays maximum GVW from the Table, forsemitrailers of varying lengths.
VI-13
Semitrailer Length (feet) 23 25 27 29 31 33 35 37 39 41 43 45 50 60
60
65
70
75
80
85
90
95
100
FBF TTI
FBF Criteria
Table VI-3Maximum GVW For 5-axle Semitrailer Combination Applying Federal And TTI Bridge Formulas And FBF Stress Criteria
SemitrailerLength (Feet)
Maximum GVW (1,000 Pounds)
SemitrailerLength (Feet)
Maximum GVW (1,000 Pounds)
FBF TTIFBF
StressCriteria
FBF TTIFBF
StressCriteria
28.0 70.0 70.1 78.4 45.0 80.0 80.0 80.0
35.0 74.5 77.1 80.0 48.0 80.0 80.0 80.0
40.0 78.0 80.0 80.0 53.0 80.0 80.0 80.0
NOTE: GVWs specific to 22.5-foot tractor wheelbase, 52-inch tractor tandem spread, and trailer 48-inch tandem spread. The distance from the first drive axle (on the tractor to the last trailer axle is the trailer length minus 6 feet.
Figure VI-2Maximum GVW For 5-axle Semitrailer Combination
Applying Federal and TTI Bridge Formulas And FBF Stress Criteria

VI-14
Semitrailer Length (feet)23 25 27 29 31 33 35 40 45 50 55 58
60
65
70
75
80
85
90
95
100
Legend
FBF TTI FBF Criteria
Table VI-4 presents weight values and maximum GVWs for the 6-axle semitrailer combinationwith the semitrailer supported at the rear by a tridem-axle group. In this case, both the tractorwheelbase and semitrailer length are varied (common descriptive dimensions). The allowableGVW for varying semitrailer lengths is shown in Figure VI-3.
Table VI-4Maximum GVW For 6-axle Semitrailer Combination Applying
Federal And TTI Bridge Formulas And FBF Stress CriteriaTractor Wheelbase = 22.5 Feet
SemitrailerLength (Feet)
Maximum GVW (1,000 Pounds)
SemitrailerLength (Feet)
Maximum GVW (1,000 Pounds)
FBF TTI FBFStress
Criteria
FBF TTI FBFStress
Criteria
28.0 75.0 70.1 73.4 45.0 85.5 87.1 88.6
35.0 79.5 77.1 84.5 48.0 87.5 90.1 90.0
40.0 82.5 82.1 88.7 53.0 90.5 92.0 94.2
Figure VI-3Maximum GVW For 6-axle Semitrailer Combination
Applying Federal And TTI Bridge Formulas And FBF Stress CriteriaTractor Wheelbase = 22.5 Feet

VI-15
Table VI-5 presents the values and maximum GVWs for the RMD combination, a tractor-semitrailer combination with a 3-axle tractor pulling a 2-axle semitrailer and a 2-axle full trailer. The tractor and semitrailer length of this double are varied, with the trailer remaining constant at28 feet. The limiting axle loads and maximum GVW for the entire vehicle are easily read froma table. This approach negates the need to compute the many axle group combinations inherent inthe use of the existing and proposed formulas (which can amount to as many as 36 differentcombinations in the case of a 9-axle vehicle). The GVW for varying semitrailer lengths is shownin Table VI-5.
Table VI-5Maximum GVW for RMD with Semitrailer of Variable Length
And 28' Trailer Applying Federal and TTI Bridge Formulas And FBF Stress Criteria
Tractor a = 18.2 Feet, Tractor B = 22.5 Feet
SemitrailerLength (Feet)
GVW (1,000 Pounds)
FBF TTI FBF Stress Criteria
Tractor A Tractor B Tractor A Tractor B Tractor A Tractor B
45 109.5 109.5 105.16 107.3 111.4 112
48 111 111 106.6 108.8 112.8 113.4
53 111 111 109.1 111.3 115.2 116
In summary, there is significant variation in the results derived from the three formulaicapproaches by vehicle configuration. In general, the TTI formula is better matched than theFBF for bridges, and there is a significant amount of load capacity available before limits areexceeded for the 5- and 6-axle semitrailer and 7-axle RMD configurations. This is not the case,however, for larger vehicles such as the 9-axle turnpike doubles -- FBF allows too much weightfor these in terms of the stress criteria. The TTI curve for that vehicle is on the low side of theFBF stress criteria curve. Also, FBF is conservative for multiaxle short straight trucks.
There are benefits to adhering to the criteria on which the FBF is based and incorporating theconsideration of continuous beams into the control. Tools such as user-friendly computer softwareprograms can be designed to assess allowable loading configurations for any vehicle, and standard(bridge formula) tables for the more common vehicles can be generated. The use of the FBF stresscriteria described in this section addresses the documented drawbacks of FBF and provides abasis for truck weight control that conforms to the criteria upon which both FBF and TTI are based-- but to which they do not always adhere.
13 TRB Special Report 225, Truck Weight Limits: Issues and Options, 1990.
VI-16
It should be noted that the FBF, by design, incorporates a degree of control for pavement damageby explicitly including the number of axles in the formula. The TTI formula and FBF stresscriteria indirectly control for pavement damage by adhering to axle weight limits -- the higherGVW limits, such as for LCVs, require more axles to avoid exceeding axle limits.
PAVEMENTS
The condition and performance of highway pavements depend on many factors, includingthe thickness of the various pavement layers, quality of construction materials and practices,maintenance, properties of the roadbed soil, environmental conditions (most importantly rainfalland temperature), and the number and weights of axle loads to which the pavements aresubjected.13
WEIGHT
While pavement engineers traditionally have used ESAL factors estimated from the AASHO RoadTest (started in 1956 and completed in 1962) as the basis for designing pavements, thereis increasing recognition that better relationships between axle load and pavement deteriorationare needed. Pavement distress models used in both the 1982 and 1997 Federal HCA Studies(HCAS) abandoned the use of ESALs to relate axle loading to pavement deterioration, andAASHTO will be replacing its ESAL-based pavement design formula with one that more directlyrelates axle loads to factors that determine pavement life. While ESALs were not used as thebasis for estimating pavement costs for this Study, they are widely understood by highwayadministrators, pavement engineers, and others concerned with the pavement impacts of TS&Wscenarios. Therefore, they are used here as a benchmark for comparing relative pavement impactsof various truck configurations with different numbers and types of axles.
Pavement deterioration increases sharply with increases in axle load. On both flexible andrigid pavements, the load equivalence factor for a 20,000-pound single axle is about 1.5. Thus,100 passes across a pavement by a 20,000-pound axle would have the same effect on pavementlife as 150 passes by an 18,000-pound axle.
The number of axles is also important in estimating pavement impact, other things being equal, as avehicle with more axles has less effect on pavements. For example, a 9-axle combination vehiclecarrying 80,000 pounds has less effect on pavements than a 5-axle combination vehicle carrying80,000 pounds. A significant amount of additional weight can be carried by the 9-axle vehiclewithout causing greater pavement consumption relative to the 5-axle vehicle. Comparing vehiclesin terms of ESALs provides information on load-related pavement impact, but it does not includean offsetting benefit gained by a reduction in the number of trips required to transport

14 Results of a study by Hutchinson and Haas compare the average and marginal costs per ESAL on highways with500,000 ESALs per year and 2 million ESALs per year. The cost per ESAL for highways with 500,00 ESALsis almost four times as great as the cost per ESAL on highways designed for 2 million ESALs. One importantimplication of this finding is that a policy that encourages heavy trucks to shift from highways with thickerpavements, such as the Interstate or NHS, to highways with thinner pavement can have a significant impact onpavement costs.
15 TRB Special Report 225.16 A study by Bartholomew (1989) summarized surveys of tire pressure conducted in seven States between 1984
and 1986 and found that 70 to 80 percent of the truck tires used were radials and that average tire pressureswere about 100 psi.
VI-17
the same amount of freight. Vehicles are often compared in terms of ESALs per unit of freightcarried as a means of including the reduction in pavement deterioration from fewer trips.
The increase in pavement costs per added ESAL mile can vary by several orders of magnitudedepending upon pavement thickness, quality of construction, and season of the year. Thinnerpavements are much more vulnerable to traffic loadings than thicker pavements.14 Additionally,pavements are much more vulnerable to traffic loadings during spring thaw in areas subject tofreeze-thaw cycles.
AXLE SPACING
The primary load effect of axle spacing on flexible pavement performance is fatigue. Axle spacing is a major concern for fatigue. When widely separated loads are brought closertogether, the stresses they impart to the pavement structure begin to overlap, and they cease toact as separate entities. While the maximum deflection of the pavement surface continues toincrease as axle spacing is reduced, maximum tensile stress at the underside of the surface layer(considered to be a primary cause of fatigue cracking) can actually decrease as axle spacing isreduced. However, effects of the overlapping stress contours also include increasing the durationof the loading period. Thus, the beneficial effects of stress reduction are offset to an unknowndegree by an increase in the time or duration of loading. The net effect of changes in axle spacingon pavement deterioration is complex and highly dependent on the nature of the pavementstructure.15
TIRE CHARACTERISTICS
In recent years, several studies on the impact of tire characteristics on pavement have raisedconcern over the possibility of accelerated pavement deterioration, particularly rutting, causedby increasing tire pressures. The tires of the AASHO Road Test trucks of the 1950s were bias-plyconstruction with inflation pressures between 75 pounds and 80 pounds per square inch (psi). Thereplacement of bias-ply tires with radial tires and higher inflation pressures, averaging 100 psi,result in a smaller size tire “footprint” on the pavement and, consequently, a concentration ofweight over a smaller area.16 These changes hasten the wear of flexible pavements, increasingboth the rate of rutting and the rate of cracking.

17 Gillespie (1993) found that a steering axle carrying 12,000 pounds with conventional single tires is moredamaging to flexible pavements than a 20,000-pound axle with conventional dual tires. Gillespie proposed thatroad damage from an 80,000-pound vehicle combination would be decreased by approximately 10 percent if amandated load distribution of 10,000 pounds on the steering axle and 35,000 pounds on tandems. Since theoperating weight distribution of a 5-axle tractor-semitrailer at 80,000 pounds GVW generally has less than11,000 pounds on the steering axle, the practical effect of the proposal would be to increase tandem axleweights without a compensating decrease in steering axle weights.
18 Bauer (1994) summarized several recent studies on the effects of single versus dual tires: “Smith (1989), in asynthesis of several studies . . . evaluated at 1.5 on average the relationship of the damage caused by wide basesingle assemblies and that caused by traditional dual tire assemblies with identical loading at the axle. Sebaalyand Tabataee (1992) found rutting damage ratios between wide base and dual tire assemblies varying between1.4 and 1.6 . . . Bonaquist (1992), reporting on results obtained from a study . . . on two types of roadway, usinga dual tire assembly with 11 R 22.5 and a wide base with 425/65 R 22.5, indicates rutting damage ratios varyingfrom 1.1 to 1.5, depending on the layers of the roadway.”
VI-18
The AASHTO load equivalency factors apply only to axles supported at each end by dual tires. Recent increases in steering axle loadings and more extensive use of single tires on load-bearingaxles have precipitated efforts to examine the effect on pavement deterioration of substitutingsingle for dual tires. Both standard and wide-based tires have been considered. Pastinvestigations of the pavement deterioration effects of single versus dual tires have found thatsingle tires induce more pavement deterioration than dual, but that the differential wear effectdiminishes with increases in pavement stiffness, in the width of the single tire, and in tire load.17
A general finding from the studies is that wide-base single tires appear to cause about 1.5 timesmore rutting than dual tires on flexible pavements (the most common type of pavement) as they donot have good rut resistance. Another finding is that one of the wheels in a dual tire assembly isfrequently overloaded due to variability in the roadway cross-section and that the averageoverload causes an increase in rutting similar to that caused by wide-based single and dual tireassemblies.
Based upon past studies, single tires have more adverse effects on pavements than dual tires,18 it appears likely, however, that past investigations have overstated the adverse effects of singletires by neglecting two potentially important effects: (1) unbalanced loads between the two tires ofa dual set, and (2) the effect of randomness in the lateral placement of the truck on the highway. Unbalanced loads between the tires of a dual set can occur as a result of unequal tire pressures,uneven tire wear, and pavement crown. As with unequal loads on axles within a multiaxle group,pavement deterioration increases as the loads on the two dual tires become more unbalanced.
The second neglected factor, sometimes termed “wander,” is the effect of randomness in the lateralplacement of trucks within and sometimes beyond lane boundaries. Less than perfect tracking isbeneficial to pavement deterioration, as the fatiguing effect is diminished because the repetitivetraffic loads are distributed over wider areas of the pavement surface. The greater overall widthof dual tires naturally subjects a greater width of pavement to destructive stresses, therefore,wander is expected to have a smaller beneficial effect for dual than for single tires. Once rutting

19 The TRB Special Report 225 examined the importance of loading imbalance and wander. The TRB Studyexamined two types of pavement deterioration: surface cracking due to fatigue and permanent deformation orrutting in the wheel tracks. Fatigue was found to be more sensitive to the differences between single and dualtires than rutting. Both balanced and unbalanced dual-tire loads were considered in analyzing the affect onwander. The analysis indicated that the adverse effects of single tires on pavement deterioration were reducedwhen wander was taken into account, although the effects were still significant.
20 From research summarized by the Midwest Research Institute (MRI) that suggests dynamic loadings are aconsideration in assessing the relative merits of wide base single versus dual tires. Gyenes and Mitchell reportthat the magnitude of the added dynamic components was earlier thought to increase road damage over that ofthe static loading alone between 13 and 38 percent, according to research reported by Eisenmann. The MRIresearch noted that many recent studies have pointed out the fallacy in the earlier work, which assumed that thedynamic component of loading was distributed uniformly over the pavement in the direction of travel. Theresearch found, however that the dynamic component is very localized, arising out of pavement surfaceirregularities and therefore is spatially correlated with these irregularities.
21 Gillespie, et. al. estimate that damage due to the combination of static and dynamic loading can be two to fourtimes that due to static loading locally. Von Becker estimates the combined loading produces a “shock factor”between 1.3 and 1.55, depending upon suspension characteristics. Applying the fourth power law wouldtranslate these figures into relative damage estimates ranging from 2.8 to 4.8 times the static loading damage. Gyenes and Mitchell suggest impact factors in the range of 1.3 to 1.5 for relative damage estimates of 2.8 to5.1.
22 TRB Special Report 225 noted that a heavy truck travels along the highway, axle loads applied to the pavementsurface fluctuate above and below their average values. The degree of fluctuation depends on factors such aspavement roughness, speed, radial stiffness of the tires, mechanical properties of the suspension system, andoverall configuration of the vehicle. On the assumption that the pavement deterioration effects of dynamicloads are similar to those of static loads and follow a fourth-power relationship, increases in the degrees offluctuation increase pavement deterioration.
VI-19
begins, however, tires -- especially radial tires -- tend to remain in the rut, thereby greatlyreducing the beneficial effects of wander for both single and dual tires.19
Another consideration in evaluating wide-base single versus dual tires is dynamic loadings thatarise from the vertical movement of the truck caused by surface roughness. Thus, peak loadsare applied to the pavement that are greater than the average static load.20 Signs of pavementdamage from dynamic loadings are typically localized, at least initially. Because of the localizednature of the dynamic loading, its severity is much greater than previously thought.21 A further noteon wide-base single tires is that those having only two sidewalls are much more flexible than apair of dual tires with four sidewalls. This means the tire absorbs more of the dynamic bouncingof the truck, and less of the dynamic load is transmitted to the pavement.
SUSPENSION SYSTEMS
The subject of road-friendly suspensions -- within the context of the broader subject of vehicle-pavement interaction -- was researched as an Organization for Economic Cooperation andDevelopment (OECD) Project -- the Dynamic Interaction between Vehicles and InfrastructureExperiment (DIVINE) Project -- involving the United States and 16 other countries.22 The workfocused on (1) how well different suspension systems distribute load among axles in a group (themore evenly, the better); (2) how well different suspension systems dampen vertical dynamic

23 OECD DIVINE Programme, Final Report "Dynamic Interaction of Heavy Vehicles with Roads and Bridges,"May 1997, p. 145.
24 Ibid.
VI-20
loads (the more, the better); and (3) spatial repeatability of dynamic loads. The research alsoexamines how road and bridge characteristics act to excite a truck, and in turn influence the loadsreceived by the road and bridge.
The findings of the DIVINE research primarily relate to the physical interaction between heavyvehicles and the highway infrastructure -- pavements and bridges. The research breaks newground, providing scientific evidence of the effects of heavy vehicles. Conclusions that relate tovehicle and pavement interaction are summarized from the final report.
Pavement wear -- the gradual loss of functional condition -- is expressed in permanentdeformations to the longitudinal profile of the pavement surface. Whereas, pavement damageresults from an accumulation of rutting and cracking distress from repeated applications of vehicleloads. "Road research . . . has historically tended to over-emphasize pavement damage, and thetrue importance and nature of pavement wear has not yet been recognized."23 The DIVINEresearch focused primarily on examining pavement wear rather than damage.
Two scientific breakthroughs resulted from the DIVINE accelerated pavement tests: "the effects ofdynamic loading were measured for the first time, and a detailed statistical analysis of both thepavement and vehicle variables was undertaken."24 Conclusions reached are:
• Changes in pavement profile under dynamically-active steel suspensions relate to: local structural compliance (the opposite of strength), and local dynamic wheel load.
• Changes in pavement profile under dynamically-quiet air suspensions are mainly related to the local structural compliance of the pavement.
• The relationship between tensile strain at the bottom of the pavement surfacing layerand dynamic wheel loading appears to depend on the pavement thickness. For thick pavement,strain is directly related to dynamic wheel loading. For thin pavement, strain directly relatedto dynamic wheel loading is weaker. This difference in pavement behavior is believed tobe related to changes in tire contact conditions occurring from variances in the dynamic wheelload.
• Air suspension would increase pavement life by 60 percent for thick pavement and 15 percentfor thin pavement (based on two types of implied assumptions: selected pavement responseparameter measured and analyzed, and the "damage law" applied).
• Spatial repeatability on a relatively smooth road would increase total wheel loading at certain locations by approximately 10 percent, reducing pavement life at those locations by approximately 35 percent to 50 percent.
25 Ibid, p. 147.26 In the Rakheja and Woodroofe model suspension effects are represented using a sprung mass, an unsprung
mass, and restoring and dissipative effects due to suspension and tire. The tire is modeled assuming linearspring rate, viscous damping, and point contact with the road.
27 Sousa, Lysmer and Monismith investigated the influence of dynamic effects on pavement life for differenttypes of axle suspension systems. They calculated a Reduction of Pavement Life (RPL) index of 19 percentfor torsion suspensions (an ideal suspension would have RPL of 0). Similar results were found by Peterson ina study for RTAC: under rough roads at 50 mph, air bag suspensions exhibited dynamic loading coefficients(DLC) of 16 percent, spring suspensions had a DLC of 24 percent, and rubber spring walking beam suspensionshad a DLC of 39 percent. Problems with walking-beam suspensions were also noted by Gillespie, et. al. whostate that on rough and moderately rough roads, walking-beam suspensions without shock absorbers aretypically 50 percent more damaging than other suspension types.
28 Billing, et. al.
VI-21
The findings indicate that "pavement wear is the key concept to be used in the scientificconsideration of the effect of heavy vehicles on highway pavements."25
Additionally, recent research outside the DIVINE Program evaluated the role of suspensiondamping in enhancing the road friendliness of a heavy vehicle. The findings indicated an increasein linear suspension damping tends to reduce the dynamic load coefficient and the dynamic tireforces -- factors related to road wear. The research concluded that linear and air springsuspensions with light linear damping offer significant potentials to enhance the road friendlinessof the vehicle with a slight deterioration in ride quality.26 It is worth noting that approximately 90percent of all truck-tractors and 70 percent of all van trailers sold in the United States areequipped with air suspensions. Additional studies on various types of axle suspension systemsinclude studies on: torsion suspensions, four-leaf suspensions, and walking-beam suspensions.27
The research has yet to produce any compelling argument to incorporate a suspension systemdeterminant into U.S. regulations, although some countries have done so. Mexico is in the finalstages of preparing regulations that will allow up to 2,200 pounds of additional weight for eachtrailer axle equipped with air suspension or its equivalent. For a drive axle, Mexico may allow upto an additional 3,300 pounds. The impacts of different suspension systems on pavementdeterioration are of secondary importance compared to the static axle load levels themselves. Useof road-friendly suspensions is beneficial, particularly for large trucking operations with well-controlled axle loadings.
LIFT AXLES
The widespread use of lift axles in Canada and the United States raises concern for resultingpavement deterioration when a driver, attempting to improve fuel consumption, fails to lower the axle when loaded. A 1988 and 1989 survey conducted in Ontario and Quebec found thatapproximately 17 percent and 21 percent, respectively, of trucks on highways in those Provinceshad lift axles.28 Lift axles have been adopted in response to GVW limits governed by the number

29 TRB Special Report 225 (1990) suggested regulation could be warranted if the more pessimistic analysesproved to be correct. NCHRP Study (1993) suggested limiting tire pressure to the recommended cold settingplus 15-psi; AASHTO (1993) suggested more research is required to answer all questions regarding therelationship of tire size, contact pressure, and contact area to pavement damage.
VI-22
of axles (such as the FBF), and because trucks with multiple widely spaced axles have difficultyturning on dry roads and the lift axles can be raised by the driver prior to turns.
Lift axles make compliance with and enforcement of axle weight limits difficult. Improperlyadjusted lift axles can damage pavements. The lift axle can be adjusted to any level by the driver. If the lift axle load is too high, the lift axle is overloaded. If it is too low, other axles may beoverloaded. For example, under current Federal limits, a 4-axle single unit truckwith a wheelbase of 30 feet can carry 62,000 pounds: 20,000 pounds on the steering axle and42,000 pounds on the rear tridem. This vehicle would produce approximately 2.1 ESALs onflexible pavements. However, if the first axle of the tridem is a lift axle carrying little or noweight, this vehicle would produce approximately 4.0 ESALs.
PAVEMENT COST
Unit pavement costs and pavement costs per unit of payload-mile by configuration are shownin Tables VI-6 and VI-7. They illustrate how the addition of axles allows for increased payloadsand at the same time reduces pavement deterioration. Particularly striking, are comparisonsbetween the 3- and 4-axle single unit trucks, the 5- and 6-axle semitrailer combinations, and the 5-and 8-axle doubles. As shown in Table VI-7, the 4-axle truck has costs per payload ton-mileabout 75 percent of that for the 3-axle truck even though its gross weight is 10,000 pounds morethan the 3-axle truck. The comparison of the 6-axle semitrailer with the 5-axle is very similar onnon-Interstate highways. The costs for the 8-axle double-trailer are less than half those for the5-axle double-trailer. Triples do not compare well with doubles. Generally, truck owners wouldbe opposed to adding axles because this increases the tare weight of the vehicle and reducespayload capacity.
TS&W REGULATION RELATED TO PAVEMENT PRESERVATION
TIRE REGULATIONS
Federal law and most State laws, do not address truck tire pressure. Tire pressure may have alarge effect on fatigue of flexible pavements as discussed earlier (albeit a small to moderate effecton rigid pavements), and today's tire pressures are higher than in the 1950s -- primarily theconsequence of a change from bias to radial ply tires. Concern has been raised about acceleratedpavement rutting as a result of increased tire pressures. Recent research gives conflicting viewsas to whether or not pressures should be regulated.29
Federal, and most State, laws do not discourage or prohibit the use of wide-base tires. Theconsensus of United States and international research is that these tires have substantially more

VI-23
adverse effects on pavements than dual tires because current designs employ smaller, overalltire-road contact patch sizes than equivalent dual tire sizes. Future tire designs could address thisissue. Wide-base tires -- which are widely used in Europe -- are being increasingly adopted byU.S. trucking operations. The benefits of wide-base tires are reduced energy use, emissions,tire weights, and truck operating costs. The trade off between changes in Federal pavement costsand operating benefits that would result from permitting or prohibiting extensive adoption of wide-base tires in the United States has not been analyzed.
Table VI-6Unit Pavement Cost For Various Truck Types
$/1,000 MILES
Truck Type
Single-Unit Semitrailer Double-Trailer Triple
3-Axles 4-Axles 5-Axles 6-Axles 5-Axles 7-Axles 8-Axles 7-Axles
GVW(Pounds)
54,000 64,000 80,000 90,000 80,000 100,000 105,000 100,000 115,000
AreaType
FunctionalClass
Rural Interstate 0.09 0.07 0.05 0.05 0.03 0.10 0.05 0.04 0.08
Prin. Art. 0.17 0.16 0.12 0.11 0.07 0.15 0.10 0.17 0.31
Min. Art. 0.37 0.33 0.29 0.22 0.32 0.41 0.21 0.39 0.75
Maj. Col. 1.38 1.35 0.90 0.80 1.17 1.03 0.65 1.46 2.95
Min. Col. 2.27 2.08 1.49 1.24 1.92 1.69 1.07 2.42 4.87
Locals 5.90 5.63 3.87 3.23 4.99 4.40 2.79 6.27 12.60
Urban Interstate 0.06 0.04 0.04 0.04 0.03 0.04 0.02 0.03 0.05
Freeway &Expressway
0.09 0.06 0.06 0.05 0.04 0.07 0.04 0.09 0.18
Prin. Art. 0.13 0.12 0.10 0.09 0.11 0.09 0.06 0.13 0.26
Min. Art. 0.30 0.24 0.22 0.17 0.19 0.18 0.12 0.34 0.70
Collectors 0.66 0.70 0.54 0.49 0.46 0.34 0.25 0.86 1.82
Locals 2.34 2.53 1.91 1.75 1.64 1.19 0.88 3.06 6.45
Historically, many States specified some form of tire load regulation for safety. In recent years,additional States have adopted tire load regulations to control the damage effect of wide-basetires. They restrict the weight that can be carried on a tire based on its width. The limits rangefrom 550 pounds per inch (in Alaska, Mississippi, and North Dakota) to 800 pounds per inch (inIndiana, Massachusetts, New Jersey, New York, and Pennsylvania). Such restrictions result inlower pavement costs; however, the size of the pavement cost savings (either in absolute terms orin relation to the increase in goods movement costs also resulting from these restrictions) have notbeen estimated.

VI-24
Table VI-7Unit Cost per Payload-mile for Various Truck Types
$/1,000 Ton-miles
Truck Type
Single-Unit Semitrailer Double-Trailer Triple
Weights(Pounds)
3-Axles 4-Axles 5-Axles 6-Axles 5-Axles 7-Axles 8-Axles 7-Axles
GVW 54,000 64,000 80,000 90,000 80,000 100,000 105,000 100,000 115,000
Tare 22,600 26,400 30.490 31,530 29,320 38,600 33,470 41,700 41,700
Payload 31,400 37,600 49,510 58,470 50,680 61,400 71,530 58,300 73,300
AreaType
FunctionalClass
Rural Interstate 0.006 0.004 0.002 0.002 0.001 0.003 0.001 0.001 0.002
Prin. Art. 0.011 0.009 0.005 0.004 0.003 0.005 0.003 0.006 0.008
Min. Art. 0.024 0.018 0.012 0.008 0.013 0.013 0.006 0.013 0.020
Maj. Col. 0.088 0.072 0.036 0.027 0.046 0.034 0.018 0.050 0.080
Min. Col. 0.145 0.111 0.060 0.042 0.076 0.055 0.030 0.083 0.133
Locals 0.376 0.299 0.156 0.110 0.197 0.143 0.078 0.215 0.344
Urban Interstate 0.004 0.002 0.002 0.001 0.001 0.001 0.001 0.001 0.001
Freeway &Expressway
0.006 0.003 0.002 0.002 0.002 0.002 0.001 0.003 0.005
Prin. Art. 0.008 0.006 0.004 0.003 0.004 0.003 0.002 0.004 0.007
Min. Art. 0.019 0.013 0.009 0.006 0.007 0.006 0.003 0.011 0.019
Collectors 0.042 0.037 0.022 0.017 0.018 0.011 0.007 0.030 0.050
Locals 0.149 0.136 0.077 0.060 0.065 0.039 0.024 0.105 0.176
SPLIT-TANDEM VERSUS TRIDEM-AXLE LOAD LIMITS
There is increasing use of split tandem axle groups with spreads up to 10 feet, particularly inflatbed heavy haul operations. These axles are allowed to be loaded at single axle limits --20,000 limits -- 20,000 pounds on each of the 2 axles -- as opposed to 34,000 pounds on aclosed tandem when they are split more than 8 feet. They offer two key benefits to 5-axle tractor-semitrailer usage: (1) flexibility in load distribution; and (2) full achievement of the 80,000-poundGVW cap, which is limited by the ability to distribute up to 12,000 pounds on the steering axle ofa combination. But they do so at a significant cost to pavement life.
In the United States, the allowable load on a group of three axles connected by a commonsuspension system (tridem) is determined by the Federal bridge formula rather than a limit set bylaw (or regulation). In Europe, Canada, Mexico, and most other jurisdictions, tridem axles aregiven a specific load limit in the same way the United States specifies single and tandem axle

VI-25
limits without direct reference to a bridge formula. This is not to say that these tridem limits arenot bridge-related. For example, the tridem limits prescribed by the RTAC, which vary as afunction of spacing, are based on bridge loading limitations -- not pavement limitations.
THE GVW LIMIT
The existing legal Federal maximum GVW (cap) limit for the Interstate System is 80,000 pounds,although some States allow truck combination weights above this cap under Federal grandfatheringprovisions. Axle weight limits and the FBF are designed to protect pavements and bridges,respectively. As such, the cap may not be providing any additional protection to pavements andbridges. Nevertheless, it is important to consider such factors as bridge design loads and criteria,structural evaluation procedures, the age of the existing bridges, and the extent to which increasedGVWs would affect the fatigue life of bridges in the United States.
44,000-POUND TRIDEM-AXLE WEIGHT LIMIT
Original research done for this Study on the pavement and bridge impacts of tridem axles showedhow bridge stresses decrease as the axles in the tridem group are spread apart. This allows moreweight to be carried on the tridem group as the axles are spread. The opposite is true forpavement damage. The more the axles are spread, the greater the damage. Therefore, as the axlesare spread within the group, the allowable weight must be reduced to hold pavement damageconstant.
The tridem-axle weight limit of 44,000 pounds was determined by observing where the curve ofthe increasing bridge allowable load function crosses the curve of the decreasing pavement loadequivalency function (see Figure VI-4). The two curves cross at a spread of 9 feet between thetwo outer axles which gives 44,000 pounds for both functions. To stop short of 9 feet wouldrequire a lower load limit as bridge damage would be greater than at 44,000 pounds. To gobeyond 9 feet would increase pavement damage over that at 44,000 pounds.
A 6-axle semitrailer combination is more effective in reducing pavement damage than a 5-axlesemitrailer combination with a split tandem (two trailer axles spread apart), which is allowedunder the current FBF. Table VI-8 provides the weight limits for a tridem axle between 8 and 16feet and Figure VI-4 illustrates the impact on pavement and bridges.
Table VI-8Tridem-axle Weight Limits
AxleSpreads
(Feet)
Distance BetweenAdjacent Axles
(Feet)
Load at LEF=1 Allowable Bridge Load
(1,000 Pounds)
8 4 45 43
12 6 42 48.6
16 8 40 ------

30 Both the TRB Special Report 225 and the AASHTO TS&W Subcommittee suggest consideration of the TTIbridge formula which could allow about 90,000 pounds for a 6-axle tractor-semitrailer combination.
VI-26
TRIDEM LOADING
Pavement Bridge
Axle Spacing (feet)4 4.5 5 5.5 6
40
41
42
43
44
45
46
47
48
Figure VI-4Pavement and Bridge Impact of Tridem-axle
USE OF TRIDEMS
The use of tridem axles could increase truck load capacity while reducing pavement damage.30 Many heavy bulk haulers have already switched from 3-axle to 4-axle single unit trucks, and asnoted above, significant pavement cost savings may be possible. The 80,000-pound GVW limitposes a constraint on adding axles to 5-axle combinations because the extra axle would reduce thepayload.
When viewed using the AASHTO load equivalence factors, combinations with tridem axlesgenerally have much lower pavement costs per ton of freight carried than conventional 5-axlecombinations. To illustrate this, as shown in Figur VI-5, a 6-axle tractor-semitrailerloaded to 90,000 pounds with a rear tridem carrying 44,000 pounds produces 2.00 ESALs onflexible pavements and 3.83 ESALs on rigid pavements. The corresponding ESAL values fora conventional 5-axle tractor-semitrailer carrying 80,000 pounds are 2.37 (flexible) and 3.94(rigid).
Assuming tare weights of 28,000 and 29,500 pounds for the 5- and 6-axle combinations,respectively, and using the AASHTO load equivalence factors, the ESALs per million poundsof payload for the trucks shown in Figure VI-5 are shown in Table VI-9.

VI-27
Figure VI-5ESAL Comparison of 5-axle and 6-axle Combinations on Pavement
5-Axle Tractor-Semitrailer
TOTAL Weight (pounds) 34,000 34,000 12,000 80,000
ESALs Flexible 1.09 1.09 0.19 2.37 Rigid 1.88 1.88 0.18 3.94
6-Axle Tractor-Semitrailer
TOTAL Weight (pounds) 44,000 34,000 12,000 90,000
ESALs Flexible 0.72 1.09 0.19 2.00 Rigid 1.77 1.88 0.18 3.83
Table VI-9ESALS per Million Pounds Payload for 5- and 6-axle Combinations
Flexible Pavement Rigid Pavement
5-Axle Tractor-Semitrailer 46 76
6-Axle Tractor-Semitrailer 33 63

VI-28
ROADWAY GEOMETRY
ELEMENTS OF ROADWAY GEOMETRY AFFECTING TRUCK OPERATIONS
INTERCHANGE RAMPS
Access and exit ramps for controlled access highways are intended to accommodate designvehicles at certain design speeds. Otherwise, trucks heavier than the design vehicle havean increased probability of rolling over, and trucks longer than the design vehicle will have trailerwheels that travel off the pavement to the inside of a curve. The TS&W, configuration, and speedinfluence the potential for rollover on short loop ramps. The AASHTO policy recommendswidening ramps to accommodate combination vehicles. For example, the width of a 1-lane ramp,with no provision for passing a stalled vehicle, would be 15 feet on a tangent section.
The extreme case for design consideration occurs when traffic is congested and stop-and-goconditions exist. The speed component to the offtracking equation is negligible and maximumofftracking to the inside of the curve occurs. Under this condition, the turnpike doubles analyzed inthis study offtrack 20 percent more than a 5-axle 53-foot semitrailer combination and as a result,encroach on adjacent lanes or shoulders and necessitate widening beyond AASHTO standards.
INTERSECTIONS
Most truck combinations turning at intersections encroach on either the roadway shoulderor adjacent lanes. For example, the turning path of a truck making a right turn is generallycontrolled by the curb return radius, whereas the turning path in left turns is not constrained byroadway curbs, but may be constrained by median curbs and other traffic lanes. Combinationvehicles with long semitrailers are critical in determining needed intersection improvements toaccommodate offtracking requirements. Additionally, the increased time required for a large truckto complete its turn requires longer traffic signals and affects pedestrian safety and intersectionefficiency. Figure VI-6 illustrates the intersection maneuver.
Proper design and operation requires that no incursion into the path of vehicles traveling inopposing directions be allowed. A higher standard is often used in design, especially in urbanareas, where no incursion into any adjacent lane is allowed. This is particularly critical atsignalized intersections where heavy traffic is a prevailing condition. A substantial number ofintersections on the existing highway and street network cannot accommodate even a 5-axletractor-semitrailer combination with a 48-foot semitrailer. Even more intersections would beinadequate to accommodate vehicles that offtrack more than the standard 48-foot semitrailercombination.

VI-29
Figure VI-6 Path of Tractor Semitrailer Keeping Tires Within Lanes
NOTE: Distance from kingping to rear axle is 40 feet; distance from rear axle to rear of trailer is 14.5 feet
31 Substantial is not defined by AASHTO. There is no universally acceptable standard and it is left to the States todefine.
32 The major determinants of the cross section are the number of lanes, the presence of curbing or shoulders, andcross slope. Generally, a slight cross slope is designed into the cross section to assist in proper drainage ofprecipitation. Often this slope breaks to a steeper slope at the shoulder line, on a divided multilane highway thegrade or elevation is generally highest at the centerline.
VI-30
Currently, there are a substantial number of intersections on the highway and street network where improvements for combinations with semitrailers over 48 feet are not feasible and where controlson vehicles, routing, or travel times are needed. Examples of common constraints to intersectionimprovements are bridges, buildings and sensitive environmental or historic plots. The use ofpermits in such cases can provide a desirable level of control. Another option for States might bethe provision of staging areas where routes and intersections have prohibitive constraints offInterstate-type highways.
CLIMBING LANES
The ability of a truck to maintain speed on a grade is described by the term “gradeability;” thetruck’s ability to start on a grade from a standstill is termed “startability.” The ability of varioustrucks to start and to maintain speeds on grades is a complex subject that primarily depends on netengine horsepower, torque, gearing, drive train efficiency, friction, GVW, and minimum allowablespeed. Gradeability and startability are discussed in Chapter 5, Safety and Traffic Operations. The AASHTO recommends that separate climbing lanes be provided on grades that havesubstantial truck traffic or that cause typical trucks to slow by more than 10 miles per hour.31
CROSS-SECTION
Cross-section refers to the shape of the surface of the roadway perpendicular to the direction oftraffic.32 Under normal operating conditions, cross-section is not a dominant factor in increasedTS&W, but under extreme icing conditions, a superelevated cross slope can be a significantproblem for vehicles with greater offtracking. The presence of cross-slope discontinuities canalso be a problem for vehicles more prone to rollover because of the dynamic forces that they tendto introduce.
HORIZONTAL CURVATURE
The rear wheels of trucks and truck combinations traversing horizontal curves generally offtrack toone side or the other of the paths of the wheels on the steering axle. When a truck is traveling athigher speeds the rear wheels can follow a path outside that of the steering wheels. This effect isrelatively small and virtually never results in the need to make geometric improvements beyondthose normally made in the design process. On the other hand, when offtracking is to the inside ofthe curve at lower speeds and in stop-and-go traffic, it is usually more substantial and must beaccommodated. Truck combinations with longer trailers are often prone to producing relativelylarge amounts of offtracking beyond that provided for in AASHTO

33 Federal Size Regulations for Commercial Motor Vehicles, U.S. DOT, Publication Number FHWA-MC-96-03.
VI-31
standards. For roadways not constructed to AASHTO standards more improvement would berequired to accommodate longer combinations where offtracking would exceed normal lane width.
VERTICAL CURVE LENGTH
The height of the truck driver's eye is a distinct advantage of trucks over passenger vehicles forcrest vertical curves that are designed to maximize stopping sight distance. Vertical curves aregenerally designed for passenger cars, as a passenger car driver's eye is lower than is a truckdriver’s. For a sag vertical curve going from a downgrade to an upgrade, headlight coverage andpassenger comfort usually control. The vehicles considered in this study have braking distancessimilar to vehicles in common use at this time; therefore, no geometric adjustments would berequired.
PASSING SIGHT DISTANCES
Distances required for passing trucks can be significantly longer than for automobiles and pickups. Longer trucks increase the distance required for a car or truck to pass and require more care inorder do so safely. Drivers of passenger cars passing trucks, and drivers of trucks who desire topass other vehicles, are expected to follow the rules of the road and exercise discretion, passingonly where sight distance is adequate. On multilane highways, passing is not as critical aspassing on a 2-lane highway with traffic in opposing directions. Sight distance criteria formarking passing and no-passing zones on 2-lane highways are more appropriate for a passengercar passing another passenger car: they do not consider trucks, even the standard truck-and 48-footsemitrailer combination vehicle at 80,000 pounds.
The additional lengths of LCVs could require as much as 8 percent more passing sight distance forcars passing LCVs on 2-lane roads; longer and/or heavier trucks would require incrementallylonger passing sight distances to pass cars safely on 2-lane roads.
DIMENSIONAL LIMITS IMPACTING TRUCK MANEUVERS
LENGTH LIMITS FOR SEMITRAILERS
The STAA of 1982 requires States to allow the operation of a semitrailer of at least 48 feet longon the NN. All States now allow up to 53 feet on at least some highways. The majority of Statesprohibit semitrailers longer than 53 feet, the exceptions being Alabama, Arizona, Arkansas,Colorado, Florida, Kansas, Louisiana, New Mexico, Oklahoma, Texas, and Wyoming.33 Most ofthese States allow trailers in the 57- to 60-foot range to operate.

VI-32
LENGTH LIMITS FOR DOUBLE TRAILERS IN COMBINATION
The STAA of 1982 also established a requirement for States to allow, at a minimum, theoperation of two 28-foot trailers (twins) in combination on the Interstate and NN. Aboutone-fourth of the States prescribe 28 feet as a maximum; the others allow additional length up to 30feet with 28.5 feet being the most common. Prior to passage of the ISTEA, Federal law allowedStates to permit longer trailers in combination (commonly referred to as doubles) but did notrequire States to do so.
OVERALL LENGTH LIMITS
The STAA of 1982 established a prohibition against State laws specifying a maximumlength for semitrailer and STAA double combinations operating on the Interstate and NN. Consequently, most States control total length on the NN by limiting semitrailer and trailer lengths. About two-thirds of the States have some form of control of total combination length for non-NNhighways. While there are no proposals that the Federal law prescribe a total length limit at thistime, offtracking standards could effectively limit overall lengths for single- and double-trailercombinations.
VEHICLE WIDTH AND HEIGHT LIMITS
Vehicle widths and heights are important from the standpoint of safety and traffic operations. Theeffect on roadway geometric design relates to lane and shoulder width and vertical clearances. A1-lane ramp with a narrow shoulder would result in a blockage if a truck were disabled. Manyolder structures (overpasses) were constructed with minimal vertical clearances. The addition ofpavement overlays over the years may have further reduced these clearances. Increases in vehicleheight increases the potential for striking these overhead structures as well as vehicle rollover.
ROADWAY GEOMETRY AND TRUCK OPERATING CHARACTERISTICS
When a vehicle makes a turn, its rear wheels do not follow the same path as its front wheels.The magnitude of this difference in path, known as “offtracking,” generally increases with thespacing between the axles of the vehicle and decreases for larger radius turns. Offtrackingof passenger cars is minimal because of their relatively short wheel bases; however, manytrucks offtrack substantially. The magnitude of the offtracking is often measured by the differencesin the paths of the centerlines of the front and subsequent axles. The maximum extent of offtrackingfor a turn of a given radius and length occurs at the rearmost axle or the center of the rearmost axlegroup.
Offtracking develops gradually as a vehicle enters a turn and, if the turn is long enough, eventuallyreaches what is termed as fully-developed offtracking. The offtracking does not continue toincrease beyond this point for curves that are any longer. The extent of this fully-developedofftracking is used to determine if the nominal lane width can accommodate the offtracking or howmuch the lane should be widen through the curve to accommodate the offtracking characteristics ofthe trucks using the highway.

VI-33
In contrast, for a short radius 90-degree turn such as a truck would make at an intersection, the turnis too short for fully-developed offtracking to occur. Nevertheless, the maximum extent ofofftracking may be readily calculated for designing an intersection that can accommodate the trucksexpected to make right turns at the intersection.
LOW-SPEED OFFTRACKING
When a combination vehicle makes a low-speed turn -- for example a 90-degree turn at anintersection -- the wheels of the rearmost trailer axle follows a path several feet inside the path ofthe tractor steering axle. This is called low-speed offtracking. Excessive low-speed offtrackingmay make it necessary for the driver to swing wide into adjacent lanes to execute the turn (that is,to avoid climbing inside curbs or striking curbside fixed objects or other vehicles). Whennegotiating exit ramps, excessive offtracking can result in the truck tracking inboard onto theshoulder or up over inside curbs.
This performance attribute is affected primarily by the distance from the tractor kingpin to thecenter of the trailer rear axle, or the wheelbase of the semitrailer. In the case of multitrailercombinations, the effective wheelbase(s) of all the trailers in the combination, along with thetracking characteristics of the converter dollies, dictate this property. In general, longerwheelbases worsen low-speed offtracking. However, other factors including the use of tandem ortridem axles, the kingpin offset from the center of the supporting axle group, the cross slope of theroadway, the loads of the axles, and the truck suspension have small, generally negligible, effectson low-speed offtracking. Figure VI-7 illustrates low-speed offtracking in a 90-degree turn for atractor-semitrailer combination.
The standard double-trailer combination (two 28-foot trailers) and triple combinations (three28-foot trailers) exhibit better low speed offtracking performance when compared to a standardtractor and 53-foot semitrailer combination. This is because they have more articulation points inthe vehicle combination, and use trailers with shorter wheelbases.
HIGH-SPEED OFFTRACKING
High-speed offtracking, on the other hand, is a dynamic, speed-dependent phenomenon. It resultsfrom the tendency of the rear of the truck to move outward due to the lateral acceleration of thevehicle as it makes a turn at higher speeds. High-speed offtracking is actually the algebraiccombination of the low-speed offtracking toward the inside of the turn and theoutward displacement due to the lateral acceleration. As the speed of the truck increases, the totalofftracking decreases until, at some particular speed, the rear trailer axles follow exactlythe tractor steering axle. At still higher speeds, the rear trailer axles will track outside of thetractor steering axle. The speed-dependent component of offtracking is primarily a function of thespacing between truck axles, the speed of the truck, and the radius of the turn; it is also dependenton the loads carried by the truck axles and the truck suspension characteristics. Figure VI-8illustrates offtracking maneuver for a standard tractor-semitrailer.

VI-34
Figure VI-7Low-speed Offtracking
Source: Roaduser Research
OFFTRACKING ON MAINLINE HORIZONTAL CURVE AND INTERCHANGE RAMPS
An analysis of offtracking and swept path width for horizontal curves designed in accordance withAASHTO's high-speed design criteria (1994) was completed for the vehicle configurationsconsidered in this study. Such curves are typically found on mainline roadways and higher speedramps. Alternative design criteria that permit higher unbalanced lateral acceleration and, thus,tighter radii can be used under AASHTO policies for horizontal curves with design speeds of 40 mph or less, which are typically found on ramps and turning roadways at intersections.
Under AASHTO policy (1994), the minimum radius for a horizontal curve varies with theroadway design speed and the maximum superelevation rate. For horizontal curves with a

VI-35
Figure VI-8High-Speed Offtracking
Source: Roaduser Research
maximum superelevation rate of 0.06 feet/foot (the maximum superelevation rate most commonlyused by State highway agencies), the minimum radii permitted by the AASHTO high-speed designcriteria vary with design speed, as shown in Table VI-10.
Table VI-10AASHTO High-speed Design Criteria
Design Speed (Mph)
Minimum Radius (Feet)
30 273
50 849
70 2,083

VI-36
The AASHTO policy for horizontal curve design specifies pavement widening on sharp radiushorizontal curves for which truck offtracking is a concern. For the minimum-radius curves listedabove on a highway with a lane width of 12 feet on tangent sections, only the 273-foot radius curve(for a 30-mph design speed) would require widening. The AASHTO criteria call for such a curveto be widened from 12 to 14.5 feet.
An analysis was conducted to determine whether minimum-radius curves with the widthsdescribed above, designed in accordance with AASHTO policies, would be capable ofaccommodating each of the vehicle configurations considered in this Study. This analysiswas conducted by comparing the lane or ramp width to the swept path width of the truck making aturn with the specified radius. Tables VI-11 and VI-12 present this comparison for selected truckconfigurations.
The swept path widths in Table VI-11 are based on fully-developed offtracking determined withthe Glauz and Harwood Model for a truck traversing the curve with a travel speed equal to theroadway design speed. None of the swept path widths shown in Table VI-11 exceed thecorresponding lane width for mainline roadways or the corresponding ramp widths, althoughthe turnpike double with 53-foot trailers does require nearly all of the (widened) 14.5 feet of the30-mph AASHTO horizontal curve. Thus, there is no indication that any of the Study vehicles,traveling at the roadway design speed, would necessarily offtrack into an adjacent lane or shoulderof the roadway or ramps designed in accordance with AASHTO policies.
Table VI-11Swept Path Width for Selected Trucks on Horizontal Curves
At AASHTO Design Speed Criteria
Maximum Swept Path Width (Feet) at the Design Speedon the Sharpest Horizontal Curve Allowed by AASHTO
Design Policy
Design Speed (Mph) 30 40 60
Curve Radius (Feet) 273 509 1,348
Truck Configuration Length (Feet)
3-Axle Single Unit Truck 39.5 8.12 8.00 8.00
5-Axle Tractor Semitrailer 64.3 10.09 8.56 8.50
5-Axle Tractor Semitrailer 76.8 11.88 9.43 8.50
6-Axle Tractor Semitrailer 76.8 11.79 9.48 8.50
7-Axle Truck-Full Trailer 61.3 8.44 8.00 8.00
7-Axle Rocky Mtn Double 99.3 11.62 9.21 8.50
8-Axle B-Train Double 84.3 10.39 8.70 8.50
9-Axle Turnpike Double 124.3 14.29 10.54 8.50
7-Axle Triple 109.0 9.69 8.50 8.50
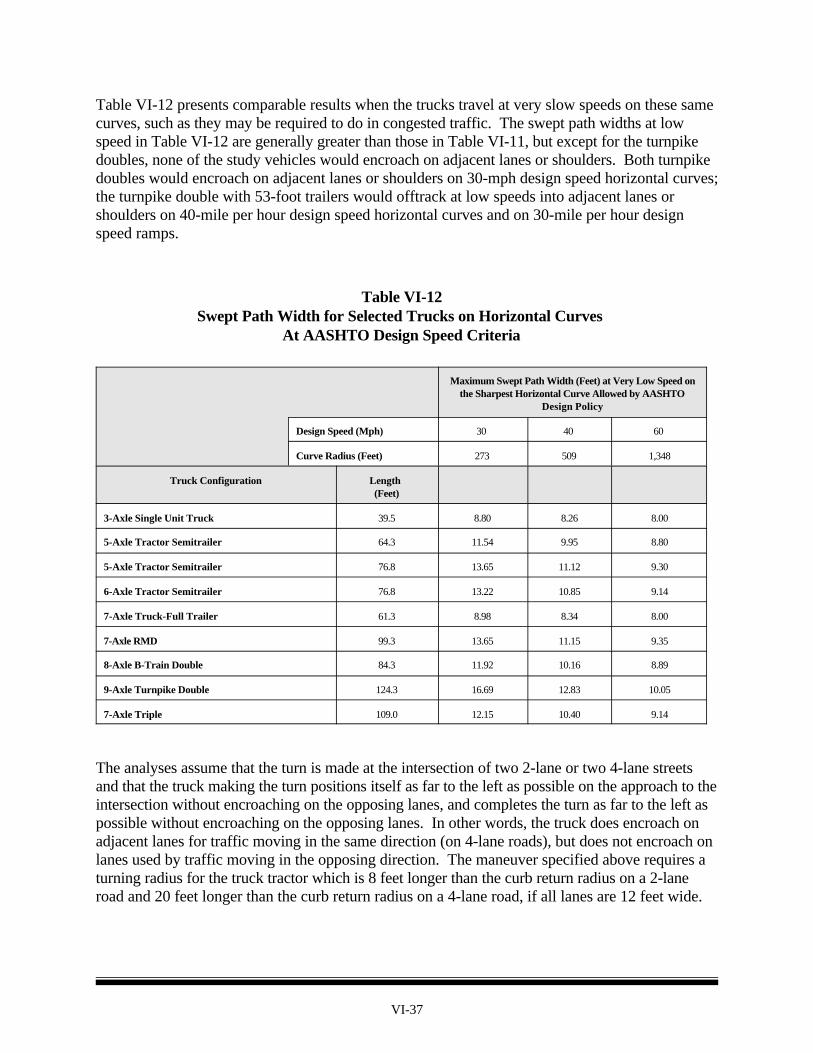
VI-37
Table VI-12 presents comparable results when the trucks travel at very slow speeds on these samecurves, such as they may be required to do in congested traffic. The swept path widths at lowspeed in Table VI-12 are generally greater than those in Table VI-11, but except for the turnpikedoubles, none of the study vehicles would encroach on adjacent lanes or shoulders. Both turnpikedoubles would encroach on adjacent lanes or shoulders on 30-mph design speed horizontal curves;the turnpike double with 53-foot trailers would offtrack at low speeds into adjacent lanes orshoulders on 40-mile per hour design speed horizontal curves and on 30-mile per hour designspeed ramps.
Table VI-12Swept Path Width for Selected Trucks on Horizontal Curves
At AASHTO Design Speed Criteria
Maximum Swept Path Width (Feet) at Very Low Speed onthe Sharpest Horizontal Curve Allowed by AASHTO
Design Policy
Design Speed (Mph) 30 40 60
Curve Radius (Feet) 273 509 1,348
Truck Configuration Length (Feet)
3-Axle Single Unit Truck 39.5 8.80 8.26 8.00
5-Axle Tractor Semitrailer 64.3 11.54 9.95 8.80
5-Axle Tractor Semitrailer 76.8 13.65 11.12 9.30
6-Axle Tractor Semitrailer 76.8 13.22 10.85 9.14
7-Axle Truck-Full Trailer 61.3 8.98 8.34 8.00
7-Axle RMD 99.3 13.65 11.15 9.35
8-Axle B-Train Double 84.3 11.92 10.16 8.89
9-Axle Turnpike Double 124.3 16.69 12.83 10.05
7-Axle Triple 109.0 12.15 10.40 9.14
The analyses assume that the turn is made at the intersection of two 2-lane or two 4-lane streetsand that the truck making the turn positions itself as far to the left as possible on the approach to theintersection without encroaching on the opposing lanes, and completes the turn as far to the left aspossible without encroaching on the opposing lanes. In other words, the truck does encroach onadjacent lanes for traffic moving in the same direction (on 4-lane roads), but does not encroach onlanes used by traffic moving in the opposing direction. The maneuver specified above requires aturning radius for the truck tractor which is 8 feet longer than the curb return radius on a 2-laneroad and 20 feet longer than the curb return radius on a 4-lane road, if all lanes are 12 feet wide.

VI-38
Table VI-13 presents estimates of encroachment on the curb return for selected trucks for rightturns at corners with curb return radii of 30, 60, and 100 feet. The data in these exhibits are basedon the maximum value of the partially developed offtracking because, in most cases, offtrackingwill not develop fully as a large truck proceeds through an intersection turning maneuver.
Table VI-13Curb Encroachment for 90-degree Right-turn Maneuvers
At Intersection of 4-lane Roads
Encroachment on Curb Return
Truck ConfigurationLength(Feet)
30-Foot Curb ReturnRadius
60-Foot Curb Return Radius
100-Foot Curb Return Radius
3-Axle Single Unit Truck 39.5 -9.97 -12.07 -13.37
5-Axle Tractor Semitrailer 64.3 -0.09 -4.47 -7.88
5-Axle Tractor Semitrailer 76.8 6.42 1.11 -3.49
6-Axle Tractor Semitrailer 76.8 5.34 0.16 -4.25
7-Axle Truck-Full Trailer 61.3 -8.10 -10.82 -12.54
7-Axle RMD 99.3 6.73 1.23 -3.48
8-Axle B-Train Double 84.3 1.58 -3.23 -7.02
9-Axle Turnpike Double 124.3 15.38 8.83 2.69
7-Axle Triple 109.0 1.97 -2.97 -6.87
The encroachment columns in Table VI-13 indicates the amount of encroachment on the curbline bythe rear axles of the turning truck. A negative value indicates that the truck does not encroach onthe curbline. A positive value indicates that encroachment does occur, and the magnitude of thevalue indicates the maximum encroachment distance. Where a positive value is shown for theencroachment distance, that particular truck could make the turn without encroaching on thecurbline only if it encroached on an opposing lane(s) instead.
The turn from a 4-lane street to another 4-lane street was chosen as the case of interest becausenone of the trucks considered -- baseline or study vehicles -- are capable of making a short-radiusturn from one 2-lane street to another without encroaching on either the curbline or an opposinglane, unless the curb return radius is very large (say, 100 feet), and then only by short trucks.
With a 30-foot curb return radius, many of the truck configurations will encroach on the curbreturn, with a few exceptions. The single unit trucks, the tractors with a 45-foot semitrailer,the truck-full trailers, and the Western twins can successfully negotiate these turns. Theencroachment of the 5-axle semitrailer configuration with a 45-foot trailer is very marginal,however, as is the triple with 28-foot trailers.

VI-39
By expanding the curb return radius to 60 feet, nearly all configurations examined can negotiate theturn without encroaching on the curb return. The exceptions that cannot successfully complete theturn are the tractors with 57.5-foot semitrailers, the longer RMD, and (especially) the turnpikedoubles. At an even larger curb return radius of 100 feet, all but the turnpike double with 53-foottrailers can properly negotiate the turn.
TS&W REGULATION RELATED TO ROADWAY GEOMETRY
CURRENT REGULATIONS ON OFFTRACKING
Federal law does not address offtracking-related characteristics of trucks and combinations. Inparticular, it specifies no requirements for kingpin setting, kingpin setback, and rear overhang. Innearly half of the States, regulations require a kingpin setting for semitrailers over 48 feet inlength. Although there is no one uniform standard, the most common setting is 41 feet.
REGULATORY APPROACHES
Control of offtracking can be accomplished in either of two ways. The first requires specifying thelength limit(s) of the combination units within the context of overall combination length,restrictions on the kingpin setback, wheelbase, and effective rear overhang, as in Canadianregulations. The second approach is a performance specification requiring that a truck beable to turn through a given angle, at a given speed, within a defined swept path as in Europeanregulations. Such a regulation would require matching truck equipment with trailer equipment foroperation based on knowledge of specific system characteristics, which would require extensivedocumentation and signage to implement and enforce.