Chapter 5 Transmission Planning and System Analysis...
38
5-1 Chapter 5 Transmission Planning and System Analysis In this chapter, various types of system analysis (power flow analysis, stability analysis, short circuit analysis, frequency analysis) are used and optimal transmission plans are developed to achieve the development of power stations. Short-term transmission planning (approximately until 2007) is studied to verify the PLN transmission plan and to evaluate generation constraints caused by the transmission limit of the 500kV trunk lines for stability. Mid- and long-term transmission plans for 2010 (approximately 25,000MW) and for 2015 (approximately 35,000MW) are studied in order to cope with the power development until approximately 2015. The study accounts for the various distribution patterns for the new power stations (balanced development, development mainly in West Java, development mainly in East Java, development heavily in East Java). 5.1 Current State of the Java Bali System Java is a long and narrow island, and the length from east to west is almost 1,000km and so power must be transmitted over a long distance. To cope with this problem, a 500kV transmission system was introduced in 1984 and has since been expanded. In 1999, northern 500kV transmission lines, which consist of two circuits, were completed from the Suralaya Power Station in West Java to the Paiton Power Station in East Java. As shown in Table 5.1.1, demand in West Java is high because of the high demand at Jakarta, which is located in this region. However, some of the large power stations, such as Paiton and Gresik, are located in East Java. Thus a lot of power flows from east to west through 500kV transmission lines, and power transmission is being restricted by stability considerations. To remove this restriction, southern 500kV transmission lines are being constructed. The section from the Paiton Power Station to the existing Klaten substation in central Java will be completed in 2003, and the section from the Klaten substation to the new DepokIII substation in south Jakarta will be completed in 2004. The one circuit of the transmission lines from Paiton to Klaten has already been in operation since April 2002, by bypassing the delayed Kediri substation. Figure 3.1.1 shows the Java Bali 500kV system in 2001. Table 5.1.1 Demand and supply balance of each area in the Java Bali system (2001) West Java (Area1, 2) Central Java (Area3) East Java (Area4) Total Demand (MW) 7,811 (60%) 2,057 (16%) 3,173 (24%) 13,041 (100%) Supply (MW) 9,848 (53%) 1,755 (9%) 7,005 (38%) 18,608 (100%)
Transcript of Chapter 5 Transmission Planning and System Analysis...

5-1
Chapter 5 Transmission Planning and System Analysis
In this chapter, various types of system analysis (power flow analysis, stability analysis,
short circuit analysis, frequency analysis) are used and optimal transmission plans are
developed to achieve the development of power stations.
Short-term transmission planning (approximately until 2007) is studied to verify the PLN
transmission plan and to evaluate generation constraints caused by the transmission limit of
the 500kV trunk lines for stability.
Mid- and long-term transmission plans for 2010 (approximately 25,000MW) and for 2015
(approximately 35,000MW) are studied in order to cope with the power development until
approximately 2015. The study accounts for the various distribution patterns for the new
power stations (balanced development, development mainly in West Java, development
mainly in East Java, development heavily in East Java). 5.1 Current State of the Java Bali System
Java is a long and narrow island, and the length from east to west is almost 1,000km and so
power must be transmitted over a long distance. To cope with this problem, a 500kV
transmission system was introduced in 1984 and has since been expanded. In 1999, northern
500kV transmission lines, which consist of two circuits, were completed from the Suralaya
Power Station in West Java to the Paiton Power Station in East Java.
As shown in Table 5.1.1, demand in West Java is high because of the high demand at
Jakarta, which is located in this region. However, some of the large power stations, such as
Paiton and Gresik, are located in East Java. Thus a lot of power flows from east to west
through 500kV transmission lines, and power transmission is being restricted by stability
considerations.
To remove this restriction, southern 500kV transmission lines are being constructed. The
section from the Paiton Power Station to the existing Klaten substation in central Java will be
completed in 2003, and the section from the Klaten substation to the new DepokIII substation
in south Jakarta will be completed in 2004.
The one circuit of the transmission lines from Paiton to Klaten has already been in
operation since April 2002, by bypassing the delayed Kediri substation.
Figure 3.1.1 shows the Java Bali 500kV system in 2001.
Table 5.1.1 Demand and supply balance of each area in the Java Bali system (2001) West Java
(Area1, 2) Central Java
(Area3) East Java (Area4)
Total
Demand (MW) 7,811 (60%) 2,057 (16%) 3,173 (24%) 13,041 (100%) Supply (MW) 9,848 (53%) 1,755 (9%) 7,005 (38%) 18,608 (100%)
5-2
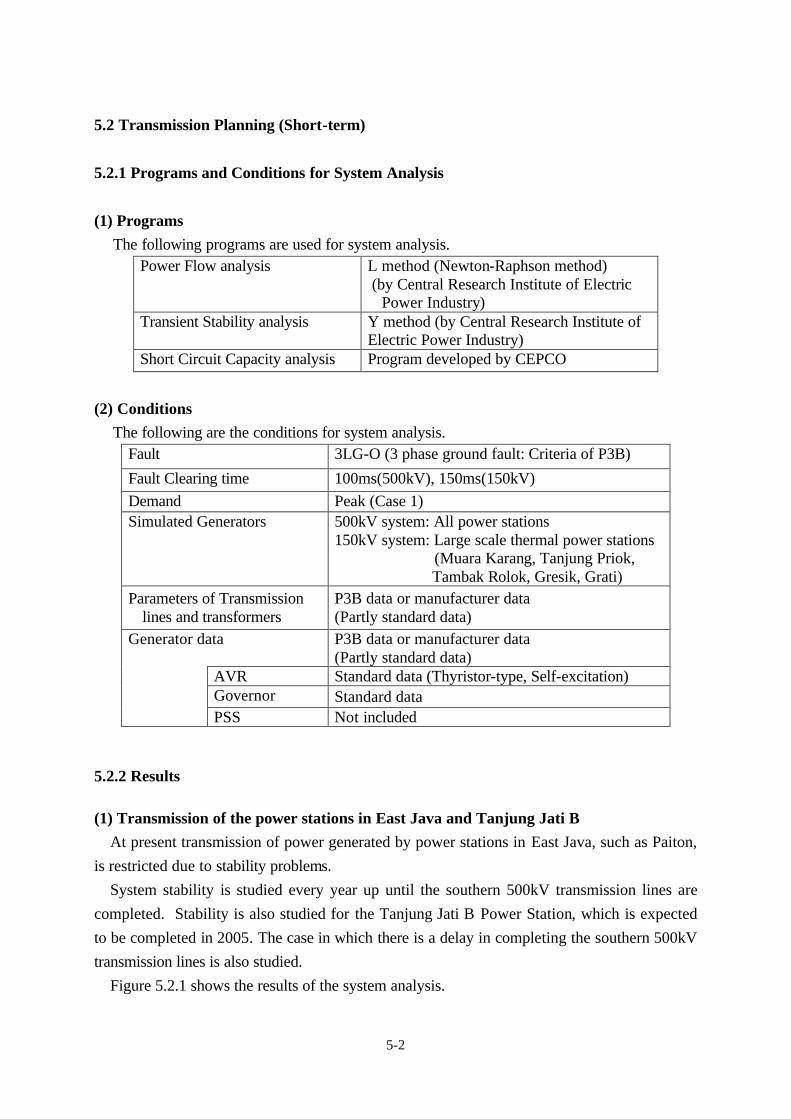
5.2 Transmission Planning (Short-term)
5.2.1 Programs and Conditions for System Analysis
(1) Programs
The following programs are used for system analysis. Power Flow analysis L method (Newton-Raphson method)
(by Central Research Institute of Electric Power Industry)
Transient Stability analysis Y method (by Central Research Institute of Electric Power Industry)
Short Circuit Capacity analysis Program developed by CEPCO
(2) Conditions
The following are the conditions for system analysis. Fault 3LG-O (3 phase ground fault: Criteria of P3B)
Fault Clearing time 100ms(500kV), 150ms(150kV) Demand Peak (Case 1) Simulated Generators 500kV system: All power stations
150kV system: Large scale thermal power stations (Muara Karang, Tanjung Priok, Tambak Rolok, Gresik, Grati)
Parameters of Transmission lines and transformers
P3B data or manufacturer data (Partly standard data)
Generator data P3B data or manufacturer data (Partly standard data)
AVR Standard data (Thyristor-type, Self-excitation) Governor Standard data
PSS Not included
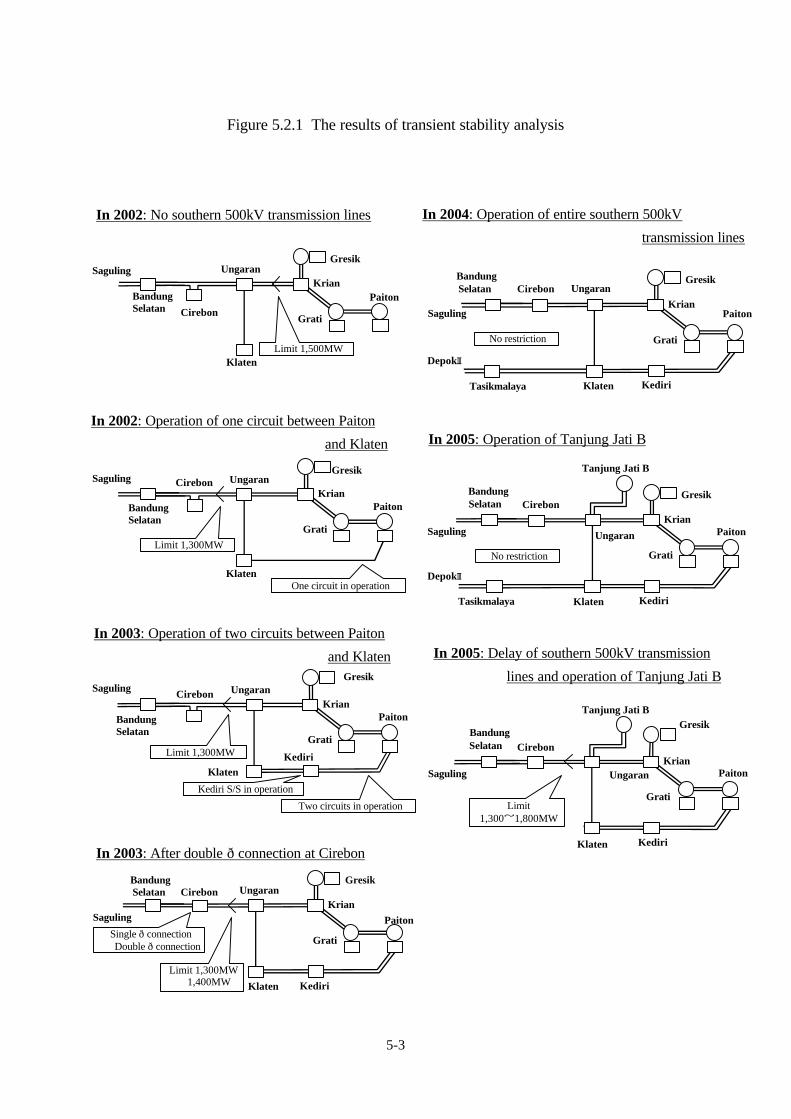
5.2.2 Results (1) Transmission of the power stations in East Java and Tanjung Jati B
At present transmission of power generated by power stations in East Java, such as Paiton,
is restricted due to stability problems.
System stability is studied every year up until the southern 500kV transmission lines are
completed. Stability is also studied for the Tanjung Jati B Power Station, which is expected
to be completed in 2005. The case in which there is a delay in completing the southern 500kV
transmission lines is also studied.
Figure 5.2.1 shows the results of the system analysis.
5-3
Figure 5.2.1 The results of transient stability analysis
Limit 1,500MW
Cirebon
Ungaran
Bandung Selatan
Saguling Krian
Gresik
Klaten
Grati
Paiton
Limit 1,300MW
Cirebon
Ungaran
Bandung Selatan
Saguling Krian
Gresik
Klaten
Grati
Paiton
One circuit in operation
Limit 1,300MW
Cirebon
Ungaran
Bandung Selatan
Saguling
Krian
Gresik
Klaten
Grati
Paiton
Kediri
Two circuits in operation Kediri S/S in operation
Limit 1,300MW � 1,400MW
Cirebon Ungaran
Bandung Selatan
Saguling Krian
Gresik
Klaten
Grati
Paiton
Kediri
Single ð connection � Double ð connection
Cirebon Ungaran
Bandung Selatan
Saguling Krian
Gresik
Klaten
Grati
Paiton
Kediri
DepokⅢ
No restriction
Tasikmalaya
Cirebon
Bandung Selatan
Saguling Krian
Gresik
Klaten
Grati
Paiton
Kediri
DepokⅢ
No restriction
Tasikmalaya
Ungaran
Tanjung Jati B
Cirebon
Bandung Selatan
Saguling Krian
Gresik
Klaten
Grati
Paiton
Kediri
Limit 1,300~1,800MW
Ungaran
Tanjung Jati B
In 2002: No southern 500kV transmission lines In 2004: Operation of entire southern 500kV
transmission lines
In 2002: Operation of one circuit between Paiton
and Klaten In 2005: Operation of Tanjung Jati B
In 2003: Operation of two circuits between Paiton
and Klaten In 2005: Delay of southern 500kV transmission
lines and operation of Tanjung Jati B
In 2003: After double ð connection at Cirebon

5-4
(2) Transmission planning for repowering at the Muara Karang Power Station
Transmission planning is studied for the Muara Karang Power Station (existing capacity:
1209MW) in northern Jakarta, where repowering (capacity increase: 420MW) is expected in
2006 and 2007.
Even though the power flow through the 150kV transmission lines between Muara Karang
and Duri Kosambi (two routes), and between Duri Kosambi and Petukangan will be great at
peak load, generation at the Muara Karang Power Station will not need to be restricted even
when there is a fault with one circuit of the transmission lines.
However, during off-peak periods (the load is 70% of the peak load) generation at the
Muara Karang Power Station will need to be restricted when there is a fault with one circuit
of the transmission lines (see Figure 5.2.2 and Table 5.2.1).
(It has to be recognized that the amount of restriction depends largely on the demand
forecast for that area. The demands of the substations for power flow analysis are forecasted
based on the power flow diagram in "PENGUSAHAAN SISTEM JAWA BALI 2001" and the
demand forecast for the entire Java Bali system (Case 1).)
The following measures can be considered for removing this restriction.
(A) Reinforcement of the existing 150kV transmission lines between Muara Karang and
Duri Kosambi (2 routes), and between Duri Kosambi and Petukangan by
reconductoring to sag suppression electric conductors (such as thermo-resistant
ACSR, gap-type ACSR and extra thermo-resistant aluminum alloy conductor
galvanized invar-reinforced series).
(Economical comparisons should be studied in detail to select the best type of sag
suppression electric conductors.)
(B) Expansion of the 150kV system to increase the demand that is directly supplied from
Muara Karang and Duri Kosambi along with the demand increase in Jakarta city.
(A) would be a drastic measure. (B) would be an efficient measure, if it were also used as a
measure against the demand increase in Jakarta city. It is difficult to remove the entire
restriction during off-peak only with (B). Therefore, it is more desirable to adopt (A) as a
drastic measure.
However, in light of the following items, consideration should be given to reducing the
amount of generation restriction with (B), and to cope with N-1 contingency by operational
spinning reserve.
- There will be no restrictions at peak load, and no restrictions during off-peak without
contingency.
- It will be possible to reduce generation at Muara Karang during off-peak periods,
because it is a power station intended for middle and peak loads.
5-5
- The amounts of generation restrictions will decrease if periodic inspections and repairs
are taken into consideration.
- The amounts of generation restrictions will decrease in accordance with the demand
increase in the area.
The results of the stability analysis show that there will be no problems after the Muara
Karang repowering. However, the stability will be severe in case of a transmission line fault
between Muara Karang and Duri Kosambi, so loop operation between Tangerang and Jatake
could be possible to improve stability.
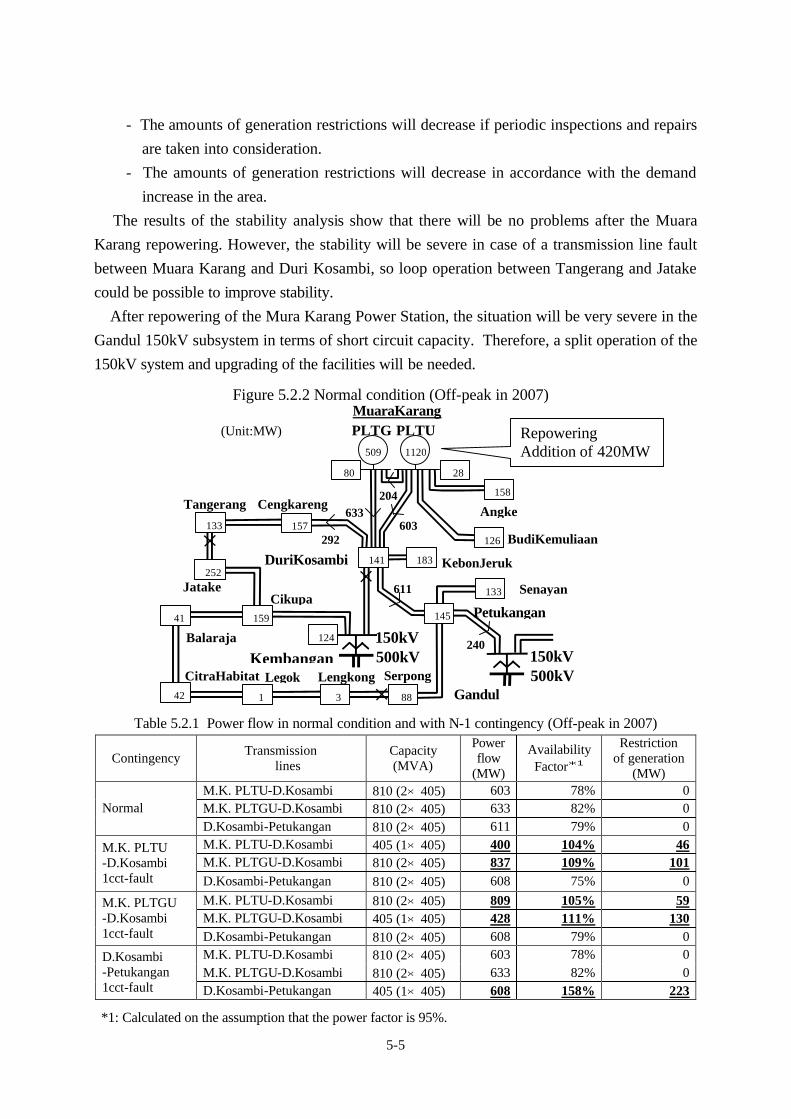
After repowering of the Mura Karang Power Station, the situation will be very severe in the
Gandul 150kV subsystem in terms of short circuit capacity. Therefore, a split operation of the
150kV system and upgrading of the facilities will be needed.
Table 5.2.1 Power flow in normal condition and with N-1 contingency (Off-peak in 2007)
Contingency Transmission lines
Capacity (MVA)
Power flow
(MW)
Availability Factor*1
Restriction of generation
(MW) M.K. PLTU-D.Kosambi 810 (2×405) 603 78% 0 M.K. PLTGU-D.Kosambi 810 (2×405) 633 82% 0 Normal D.Kosambi-Petukangan 810 (2×405) 611 79% 0 M.K. PLTU-D.Kosambi 405 (1×405) 400 104% 46 M.K. PLTGU-D.Kosambi 810 (2×405) 837 109% 101
M.K. PLTU -D.Kosambi 1cct-fault D.Kosambi-Petukangan 810 (2×405) 608 75% 0
M.K. PLTU-D.Kosambi 810 (2×405) 809 105% 59 M.K. PLTGU-D.Kosambi 405 (1×405) 428 111% 130
M.K. PLTGU -D.Kosambi 1cct-fault D.Kosambi-Petukangan 810 (2×405) 608 79% 0
M.K. PLTU-D.Kosambi 810 (2×405) 603 78% 0 M.K. PLTGU-D.Kosambi 810 (2×405) 633 82% 0
D.Kosambi -Petukangan 1cct-fault D.Kosambi-Petukangan 405 (1×405) 608 158% 223
Legok Lengkong Serpong
Repowering Addition of 420MW
AngkeTangerang 158
MuaraKarang
Cengkareng
Gandul 500kV 150kV
BudiKemuliaan
DuriKosambi
Kembangan
Petukangan
141
603 633
PLTG PLTU
159
252
3 88
Jatake Cikupa
157 133
CitraHabitat
41
42 1
Balaraja
611
500kV 150kV
509 1120
(Unit:MW)
183 KebonJeruk
80
145
133 Senayan
28
126 292
240
204
124
Figure 5.2.2 Normal condition (Off-peak in 2007)
*1: Calculated on the assumption that the power factor is 95%.

5-6
(3) Transmission planning for Muara Tawar Power Station
Transmission planning is studied for the Muara Tawar Power Station (existing capacity :
920MW) near Jakarta, where the expansion of Block Ⅱ (370MW) or the extension of Block
Ⅲ(750MW) is expected in 2006 and 2007.
1) Expansion of Block Ⅱ
Figure 5.2.3 shows the expected power flow diagram at peak load in 2007 after expansion
of Block Ⅱ(370MW). The power flow of each transmission line will be within the thermal
capacity of one circuit, therefore there will be no overload even when there is a fault with one
circuit. There will also be no problems in regard to stability.
2) Extension of Block Ⅲ
Figure 5.2.4 shows the expected power flow diagram at peak load in 2007 after extension
of Block Ⅲ(750MW). The power flow of each transmission line will be within the thermal
capacity of one circuit, therefore there will be no overload even when there is a fault with one
circuit. There will also be no problems in regard to about stability.
Saguling
Expansion of Block Ⅱ (370MW) 32
Cawang
664
Muara Tawar
Cirata
Cibinon
486
381
1008
701
1290
400
453
628
Bekasi
Figure 5.2.3 Expansion of Block Ⅱ(Peak in 2007)
1258
589
969
1443
1271 Tambun
(Unit:MW)
500kV 4xDOVE 2cct 1715MVA/cct Cibatu
Saguling
Extension of Block Ⅲ (750MW) 42
Cawang
664
Muara Tawar
Cirata
Cibinon
486
381
1008
701
1670
400
453
628
Bekasi
Figure 5.2.4 Extension of Block Ⅲ(Peak in 2007)
1628
957
1335
1778
1271 Tambun
(Unit:MW)
500kV 4xDOVE 2cct 1715MVA/cct Cibatu

5-7
(4) Short circuit capacity
Figure 5.2.5 shows the result of a short circuit analysis in the 500kV Java Bali system in
2007. There will be no problem in terms of with short circuit capacity in the 500kV system.
(5) Frequency
By increasing the unit capacity of the generators, the benefit of economies of scale
increases. But the larger the unit capacity of a generator becomes, the larger the drop in
frequency and the amount of load shedding will be in the case of a generator failure.
At present, the largest unit in the Java Bali system is 615MW at Paiton. In 2005 the largest
will be 660MW with the operation of Tanjung Jati B.
Through the least squares method and using the data of "EVALUASI OPERASI SISTEM
TENAGA LISTRIK JAWA BALI 2000", the relation between the rate of generation loss
(=(generation loss) /(system capacity)) and the drop of frequency in the Java Bali system is as
follows:
Δf = 0.146 x ΔP
Table 5.2.2 shows the frequency drop that is calculated by this equation when the largest
generator parallels out. It shows the amount of load shedding necessary for the frequency to
recover to 49.5Hz.
Table 5.2.2 Frequency drop and load shedding
2000 2005(Case1)
Peak Minimum Peak Minimum
Load (MW) 12,231 3,936(32%) 16,185 5,179(32%)
Largest Unit (MW) 615(Paiton) 660(Tanjung Jati B)
Frequency Drop (Hz) △0.73 △2.28 △0.59 △1.86
Load shedding (MW) 203 497 109 500
Kembangan
Grati
14
Kediri
Krian
Gresik
27 26
23
Paiton
26
Tanjung Jati B
13
Muara Tawar
Gandul
23 19
Klaten Tasikmalaya
Ungaran
Cirebon
Bandung Selatan
19 13
Saguling
Cawang
DepokⅢ
26
Cibinong
Cilegon
Cirata
Cibatu
Bekasi
22
26
28
18 19 Suralaya
24
22
28
29 23
17 23
Figure 5.2.5 Short Circuit Current (2007) (Unit:kA)
13
Rawalo
17
Ngimbang
26
Tambun 22
Balaraja
16 Selatan Surabaya

5-8
5.2.3 Conclusions and Recommendations
(1) Removal of transmission restrictions in East Java
1) Completion of southern 500kV transmission lines
The entire southern 500kV transmission lines have to be completed to remove all the
transmission restriction caused by system stability in East Java. Theses lines should be
constructed as soon as possible.
The land acquisition problems near the Depok III substation should be solved as soon as
possible in order to complete the entire southern 500kV transmission lines in 2004.
If the land acquisition problems are not solved, a temporary connection of the southern
500kV transmission line to the northern 500kV transmission line near Bandung Selaten or
near Upper Cisokan should be studied.
2) Double π connection at Crebon substation
After completion of the section from Paiton to Klaten, the power flow between Ungaran
and Cirebon will be restricted by stability considerations. Therefore, the connection of the
500kV transmission line at the Cirebon substation should be changed from a single π
configuration to a double π configuration to alleviate the transmission restrictions.
(2) Transmission planning for Tanjung Jati B Power Station
To stably transmit the power of the Tanjung Jati B Power Station, construction of a new
transmission line between Tanjung Jati B and Ungaran will be needed.
The entire southern 500kV transmission lines have to be completed to remove the
generation restriction caused by stability considerations at the Tanjung Jati B Power Station.
Therefore, the entire southern 500kV transmission lines should be constructed in 2004.
(3) Transmission planning for repowering at Muara Karang Power Station
After repowering of the Muara Karang Power Station, its generation will be restricted when
there is a fault with one circuit of the transmission lines. To remove this restriction, it is
desirable to reinforce the existing 150kV transmission lines between Muara Karang and Duri
Kosambi (two routes), and between Duri Kosambi and Petukangan by reconductoring to sag
suppression electric conductors (such as thermo-resistant ACSR, gap-type ACSR and extra
thermo-resistant aluminum alloy conductor galvanized invar-reinforced series).
However, considerations should be given to expanding the 150kV system in order to
increase the demand that is directly supplied from Muara Karang and Duri Kosambi in
accordance with the demand increase in Jakarta city. Therefore, this alternative should be
studied in detail, including demand forecast for this area.
5-9
With respect to short circuit capacity, after the repowering of the Muara Karang Power
Station, the situation will be very severe in the Gandul 150kV subsystem. Therefore, a split
operation of the 150kV system and upgrading of the facilities will be needed.
(4) Transmission planning for Muara Tawar Power Station
With respect to the expansion of Block Ⅱ (370MW) and the extension of Block Ⅲ
(750MW) at the Muara Tawar power station, the power can be transmitted by the existing
500kV transmission lines with N-1 contingency as long as one of the plans is carried out.
(5) Improvement of system stability
1) Using PSSs
At present, the PSSs (Power System Stabilizer) are not used at some power stations.
Therefore, the PSSs should be adjusted and used to improve stability.
2) Adoption of differential relay for trunk lines
At present, two sets of distance relays are adopted to protect each 500kV transmission
line in the Java Bali system. Single-phase reclosing by using PLC (Power Line Carrier) has
also been adopted. Distance relays have been technically established and their reliability is
relatively high and so it is used in many countries.
Recently, optical fiber communications have been introduced in the Java Bali system,
and so differential relays should be introduced to protect trunk lines in the future.
Differential relays have high reliability, and the fault clearing time can be shortened and
multi-phase reclosing can be achieved by utilizing differential relays. In this manner
stability can be improved.
(6) Largest generator unit in relation to system capacity
At present, the largest generator unit in the Java Bali system is 615MW at the Paiton Power
Station. It is relatively large in comparison with the system capacity (13,041MW in 2001).
Therefore, if a fault occurs at the largest generator, the frequency drops sharply and load
shedding is needed.
There are plans to install two 660MW units at the Tanjung Jati B Power Station in 2005. If
a larger capacity unit is installed, the amount of load shedding will increase. Thus,
installation of a larger unit has to be carefully considered.

5-10
(7) Margin of the transmission stability limit
In this stability analysis, standard data are used for the generators. A 3-phase ground fault
of one circuit is adopted, but generally a 1-phase ground fault for two circuits are stricter fault.
Only the peak-load is studied, and not off-peak load or minimum load.
Therefore, a sufficient transmission stability margin should be kept for system operations.
5.3 Transmission Planning (Mid- and Long-term) 5.3.1 Demand Forecasts
For transmission planning, Case 2 for which the rate of increase is larger in comparison
with Case 1, was adopted. The demand for each area is as follows.
Table 5.3.1 Demand forecast (Unit: MW)
Area1 Area2 Area3 Area4 Total
2001 5,495 (42%) 2,316 (18%) 2,057 (16%) 3,173 (24%) 13,041 (100%)
2010 10,077 (41%) 4,543 (19%) 3,689 (15%) 5,988 (25%) 24,297 (100%)
2015 14,413 (41%) 6,601 (19%) 5,282 (15%) 8,504 (25%) 34,800 (100%)
Figure 5.3.1 Demand forecast in each area
0
2,000
4,000
6,000
8,000
10,000
12,000
14,000
16,000
2001 2010 2015
Area 1
Peak Load (MW)
0
2,000
4,000
6,000
8,000
10,000
12,000
14,000
16,000
2001 2010 2015
0
2,000
4,000
6,000
8,000
10,000
12,000
14,000
16,000
2001 2010 2015
Area 2
Area 3
0
2,000
4,000
6,000
8,000
10,000
12,000
14,000
16,000
2001 2010 2015
Area 4
5-11
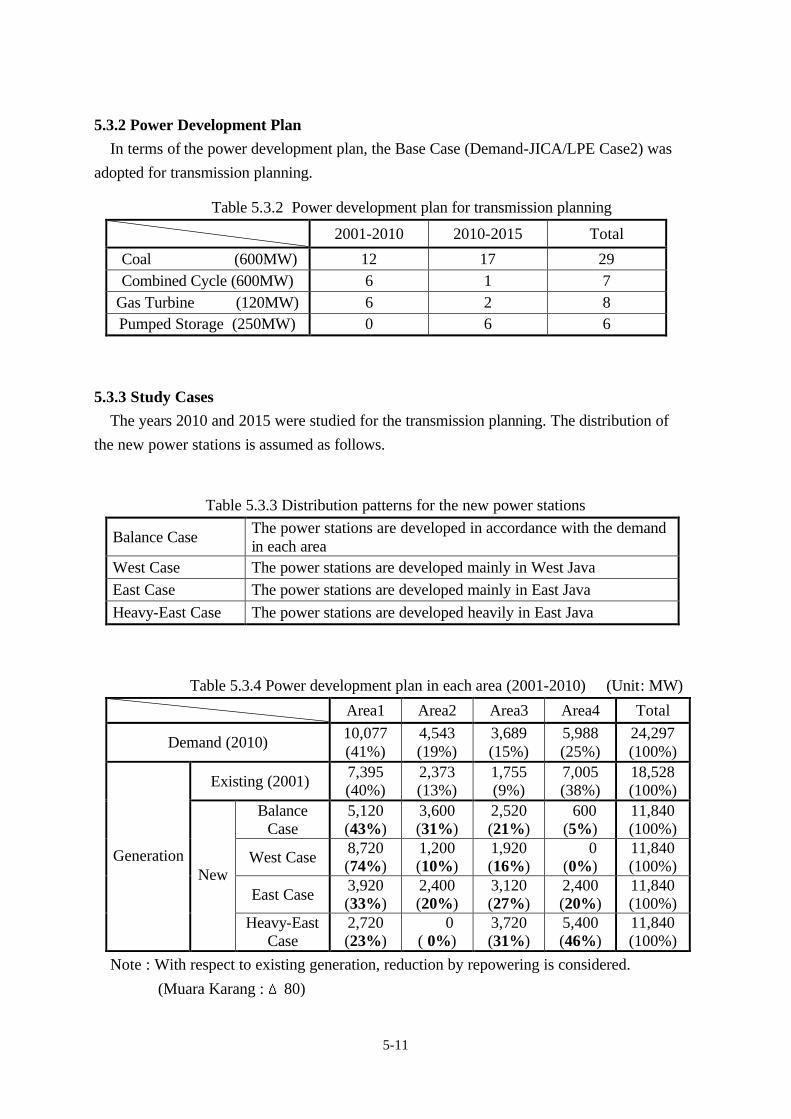
5.3.2 Power Development Plan
In terms of the power development plan, the Base Case (Demand-JICA/LPE Case2) was
adopted for transmission planning.
Table 5.3.2 Power development plan for transmission planning
2001-2010 2010-2015 Total
Coal (600MW) 12 17 29 Combined Cycle (600MW) 6 1 7
Gas Turbine (120MW) 6 2 8 Pumped Storage (250MW) 0 6 6
5.3.3 Study Cases
The years 2010 and 2015 were studied for the transmission planning. The distribution of
the new power stations is assumed as follows.
Table 5.3.3 Distribution patterns for the new power stations
Balance Case The power stations are developed in accordance with the demand in each area
West Case The power stations are developed mainly in West Java East Case The power stations are developed mainly in East Java Heavy-East Case The power stations are developed heavily in East Java
Table 5.3.4 Power development plan in each area (2001-2010) (Unit: MW)
Area1 Area2 Area3 Area4 Total
Demand (2010) 10,077 (41%)
4,543 (19%)
3,689 (15%)
5,988 (25%)
24,297 (100%)
Existing (2001) 7,395 (40%)
2,373 (13%)
1,755 (9%)
7,005 (38%)
18,528 (100%)
Balance Case
5,120 (43%)
3,600 (31%)
2,520 (21%)
600 (5%)
11,840 (100%)
West Case 8,720 (74%)
1,200 (10%)
1,920 (16%)
0 (0%)
11,840 (100%)
East Case 3,920 (33%)
2,400 (20%)
3,120 (27%)
2,400 (20%)
11,840 (100%)
Generation New
Heavy-East Case
2,720 (23%)
0 ( 0%)
3,720 (31%)
5,400 (46%)
11,840 (100%)
Note : With respect to existing generation, reduction by repowering is considered.
(Muara Karang : Δ80)

5-12
Table 5.3.5 Power development plan in each area (2001-2015) (Unit: MW)
Area1 Area2 Area3 Area4 Total
Demand (2015) 14,413 (41%)
6,601 (19%)
5,282 (15%)
8,504 (25%)
34,800 (100%)
Existing (2001) 7,295 (40%)
2,373 (13%)
1,655 ( 9%)
6,905 (38%)
18,228 (100%)
Balance Case
10,160 (41%)
6,300 (26%)
4,320 (18%)
3,600 (15%)
24,380 (100%)
West Case 13,760 (56%)
5,100 (21%)
4,320 (18%)
1,200 (5%)
24,380 (100%)
East Case 8,960 (37%)
5,100 (21%)
4,920 (20%)
5,400 (22%)
24,380 (100%)
Generation New
Heavy-East Case
5,360 (22%)
5,100 (21%)
5,520 (23%)
8,400 (34%)
24,380 (100%)
Note: The generators that will be removed by 2015 are excluded from the existing generation
(Δ300).
5.3.4 Conditions
The conditions for the study are as follows.
- Based on the N-1 rule that is adopted by PLN, transmission planning is developed to
ensure that there are no interruptions in the power supply when there is a failure
involving just one piece of the equipment (a failure of one circuit in the transmission
line).
Transmission planning is developed to accommodate stability when there is a
transmission fault (3LG-O: 3-phase short circuit).
- Transmission planning is studied at the peak demand.
- The programs for system analysis and other conditions are the same as those used for
short-term transmission planning (cf.5.2.1 Programs and Conditions for System
Analysis).
- With respect to the Balance Case, the ratios of periodic repair (PR) and balance stop
(BS) of the generators in each area are the same. With respect to the West Case, the
ratio of PR and BS is 10% in West Java, considering the dispersion of PR and BS.
With respect to the East and Heavy-East cases, the ratio of PR and BS is 10% in East
Java for the same reason.
5-13
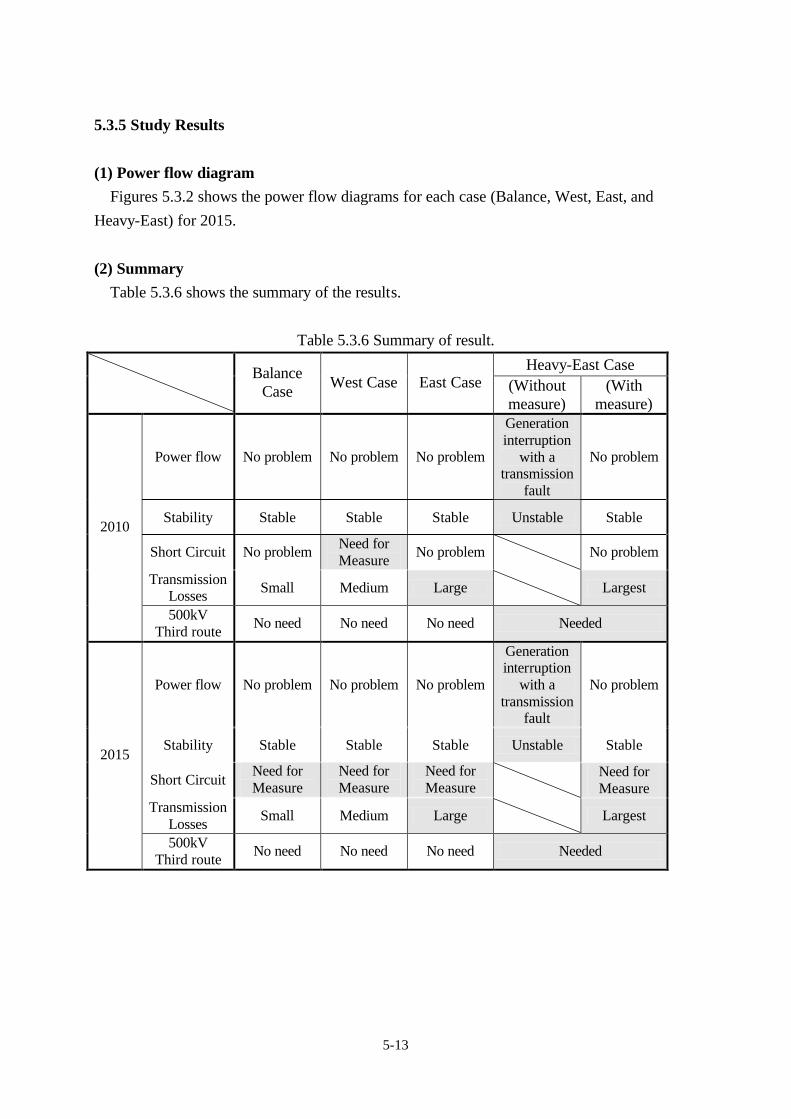
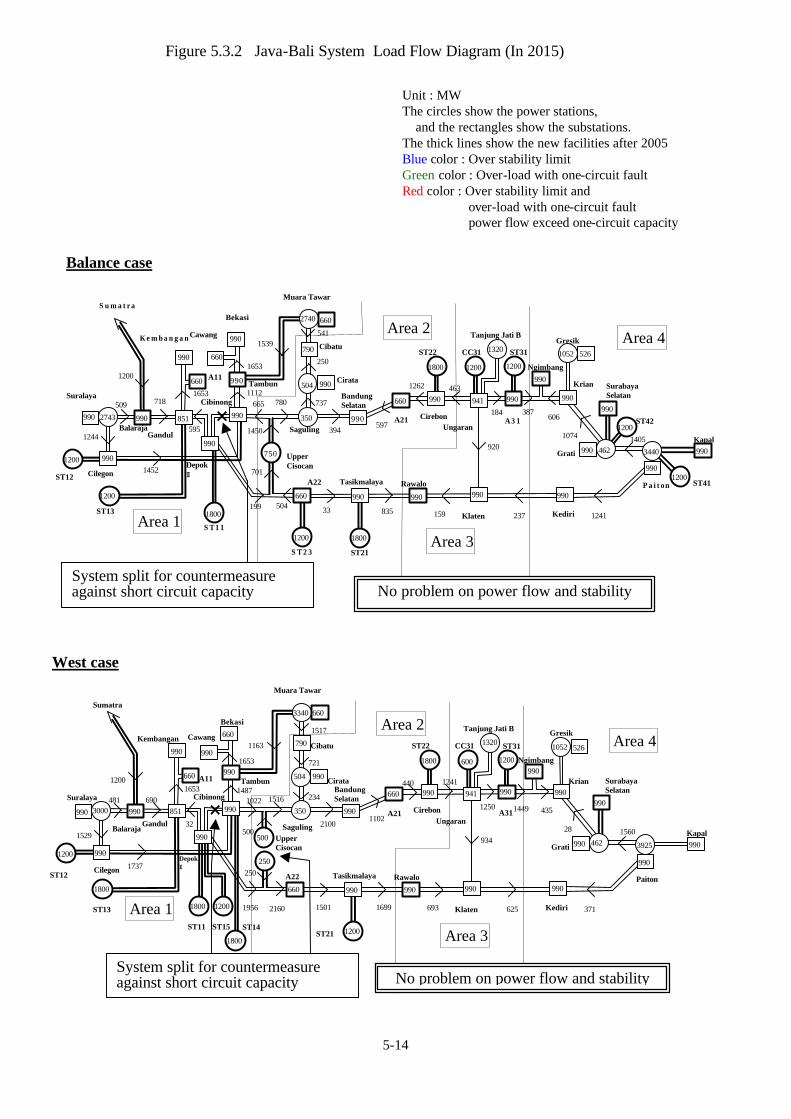
5.3.5 Study Results
(1) Power flow diagram
Figures 5.3.2 shows the power flow diagrams for each case (Balance, West, East, and
Heavy-East) for 2015.
(2) Summary
Table 5.3.6 shows the summary of the results.
Table 5.3.6 Summary of result.
Heavy-East Case Balance
Case West Case East Case (Without
measure) (With
measure)
Power flow No problem No problem No problem
Generation interruption
with a transmission
fault
No problem
Stability Stable Stable Stable Unstable Stable
Short Circuit No problem Need for Measure
No problem No problem
Transmission Losses Small Medium Large Largest
2010
500kV Third route
No need No need No need Needed
Power flow No problem No problem No problem
Generation interruption
with a transmission
fault
No problem
Stability Stable Stable Stable Unstable Stable
Short Circuit Need for Measure
Need for Measure
Need for Measure Need for
Measure Transmission
Losses Small Medium Large Largest
2015
500kV Third route
No need No need No need Needed
5-14
1200 1800
606
Kediri Klaten
Tasikmalaya
Grati
Krian
Gresik
Ungaran Cirebon
Bandung Selatan
463
1241 237 159
920
835
Tanjung Jati B
Rawalo
Kapal
Surabaya Selatan
1320
990 990
990
3440
990
462
990
1052
990
990
Ngimbang
Saguling
Cawang
Gandul
Depok Ⅲ
Pai ton
851
Cibinong
Tambun
Suralaya
Cilegon
Cirata
Cibatu
Muara Tawar
K e m b a n g a n
Bekasi
790
990
2740
504
350
660
990
2743
990
Balaraja 990
S u m a t r a
990
990
990
990 941
990
990
526
1405
504 199
184
1074
780
750
701
1450
665
1244
1452
1200
718
597
737
394
250
1112
Upper Cisocan
1539 541
1200
1800
1200
1800 1200
990
660
660
387
1262
A21
33
A22
S T 2 3 ST21
ST22
1200
CC31 ST31
1200 ST42
1200 ST41
660
1653
660
1653
A11
595 990
509
ST12
ST11
ST13
990 A 3 1
Balance case
990
Area 1
Area 2
Area 3
Area 4
No problem on power flow and stability System split for countermeasure against short circuit capacity
Unit : MW The circles show the power stations,
and the rectangles show the substations. The thick lines show the new facilities after 2005 Blue color : Over stability limit Green color : Over-load with one-circuit fault Red color : Over stability limit and
over-load with one-circuit fault power flow exceed one-circuit capacity
Figure 5.3.2 Java-Bali System Load Flow Diagram (In 2015)
990
1200
435
Kediri Klaten
Tasikmalaya
Grati
Krian
Gresik
Ungaran Cirebon
Bandung Selatan
1241
371 625 693
934
1699
Tanjung Jati B
Rawalo
Kapal
Surabaya Selatan
1320
990
990
990
3925
990
462
990
1052
990
990
990
Ngimbang
Saguling
Cawang
Gandul
Depok Ⅲ
Paiton
851
Cibinong
Tambun
Suralaya
Cilegon
Cirata
Cibatu
Muara Tawar
Kembangan
Bekasi
790
990
3340
504
350
990 990
3000
990
Balaraja
990
Sumatra
990
660
990
990
941 990
990
526
1560
2160 1956
1250
28
1516
500
250
500
1022
1529
1737
1200
690
1102
234
2100
721
1487
Upper Cisocan
990
1163 1517
1800
1800
1200
1800 1200
990
660
660
1449
440
A21
1501
A22
ST21
ST22
600
CC31 ST31
660
1653
660
1653 A11
32 990
481
ST12
ST11
ST13
990
250
1200
ST15
1800
ST14
A31
West case
Area 1
Area 2
Area 3
Area 4
No problem on power flow and stability System split for countermeasure against short circuit capacity

5-15
1200 1200 1800
1185
Kediri Klaten
Tasikmalaya
Grati
Krian
Gresik
Ungaran Cirebon
Bandung Selatan
1762
2257 1219 385
171
590
Tanjung Jati B
Rawalo
Kapal
Surabaya Selatan
1320
990
990 990
4450
990
462
990
1052
990
990
990
Ngimbang
Saguling
Cawang
Gandul
Depok Ⅲ
Paiton
851
Cibinong
Tambun
Suralaya
Cilegon
Cirata
Cibatu
Muara Tawar
Kembangan
Bekasi
790
990
1990
504
350
990 990
2626
990
Balaraja
990
Sumatra
990
660
990
990 941 990
990
526
1998
1921 445
1574
1659
1120
750
1456
2206
1077
1179
1387
1200
666
661
1140
330
652
1459
Upper Cisocan
990
1191
139
1200
1200
1200
600 1200
990
660
660
1389
1327
A21
1391
A22
ST23 ST21
ST22
1200 CC41
1800 ST41
660
1653
660
1653 A11
647 990
457
ST12
ST11
ST13
1200
ST43
ST31
ST32
A31
East case
Heavy-east case without measure
Area 1
Area 2
Area 3
Area 4
No problem on power flow and stability
1800
ST44 1200 ST33 1200 1200
1261
Kediri Klaten
Tasikmalaya
Grati
Krian
Gresik
Ungaran Cirebon
Bandung Selatan
2348
1943 1248 1197
610
1391
Tanjung Jati B
Rawalo
Kapal
Surabaya Selatan
1320
990
990
660
4050
990
462
660
1052
990
990
990
Ngimbang
Saguling
Cawang
Gandul
DepokⅢ
Paiton
851
Cibinong
Tambun
Suralaya
Cilegon
Cirata
Cibatu
Muara Tawar
Kembangan
Bekasi
790
990
1390
504
350
990 990
2666
990
Balaraja
990
Sumatra
990
660
990
990
941 990
990
526
2077
2116 2309
773
1736
1064
500
250
500
1553
603
813
1200
1278 1752
276
1261
1454
Upper Cisocan
990
1196
467
1200
1200
1200
990
660
1795
1275
1587
A22
ST23 ST21 ST32
ST22
600
CC31
1200 CC41
3000 ST41
660
1653
660
1653 A11
84 1234 990
1073
ST12 1035
1736
990
660
660 2226
ST43 1200
2151
250
A31
A23
A41
Heavy-east case with measure
Area 1
Area 2 Area 3
Area 4
No problem on power flow and stability
System split for countermeasure against short circuit capacity The third 500kV
route
1800 ST44 1200 ST33 1200 1200
2251
Kediri Klaten
Tasikmalaya
Grati
Krian
Gresik
Ungaran Cirebon
Bandung Selatan
3217
1947 2706 1971
867
2139
Tanjung Jati B
Rawalo
Kapal
Surabaya Selatan
1320
990
4050
990
990
1052
990
990
Ngimbang
Saguling
Cawang
Gandul
DepokⅢ
Paiton
851
Cibinong
Tambun
Suralaya
Cilegon
Cirata
Cibatu
Muara Tawar
Kembangan
Bekasi
790
990
1390
504
350
990 990
2917
990
Balaraja 990
Sumatra
990
660
990
990
526
3107
2837 2983
1397
2744
448
500
250
500
943
765
974
1200
1367 1439
1544
950
1764
Upper Cisocan
990
887
157
1200
1200
1200
990
2449
3247
2319
A22
ST23 ST21 ST32
ST22
600
CC31
1200 CC41
3000 ST41
660
1654
660
1653
A11
846 1147 990
1162
ST12
990
ST43
1200
2548 A21 A31
Area 1
Area 2
Area 3
Area 4
System split for countermeasure against short circuit capacity
990
462
941
660 990
990
990
250
990
660
Problems on power flow and stability
System split for countermeasure against short circuit capacity

5-16
5.3.6 Conclusions and Recommendations
(1) Distribution of new power stations
1) From the viewpoint of the transmission system, it is important to avoid the construction
of new 500kV trunk lines and to avoid reinforcement of the existing 500kV trunk lines for
power development.
Furthermore, it is desirable to minimize the power flows of the 500kV trunk lines to
reduce the transmission losses.
Therefore, it is desirable to choose the sites of the new power stations to balance the
generation with the demand in each area and to balance the power flows of the northern
500kV transmission lines with the power flows of the southern 500kV transmission lines.
- In area 1 (West Java), the generation is presently in balance with demand. However,
the ratio of the area's demand to the total demand of the Java-Bali system is large
(40%). Therefore, power development in coordination with the demand increase is
desirable.
- In area 2(middle West Java), the demand exceeds the generation at present, and so
it is desirable to promote more power development.
- In area 3 (central Java), though the demand exceeds the generation at present,
construction of Tanjung Jati B will bring generation into balance with demand.
Therefore, it is desirable to develop power in accordance with the increase in
demand.
- In area 4 (East Java), the generation greatly exceeds demand at present, therefore it
is desirable to develop power in other areas.
2) If power stations with capacities greater than 2400MW are developed in area 4 (East
Java) and power stations with capacities greater than 3120MW are developed in area 3
(central Java) by around 2010, the power flows on the trunk lines will be heavy and power
interruption will occur when there is a transmission fault, resulting in stability problems.
Therefore, a third 500kV trunk line with a distance of almost 1,000km will be needed.
If power stations with capacities greater than 5400MW are developed in area 4 (East
Java) and power stations with capacities greater than 4920MW are developed in area 3
(central Java) by around 2015, a third 500kV trunk line will also be needed.
Therefore, it is important to avoid the concentration of power development in East Java.
If construction of a third trunk line is needed, it could be a DC transmission line.
Therefore, a detail study will be needed.
5-17
3) If the demand and the generation are not balanced in each area, partial reinforcement of
the 500kV trunk lines or partial third 500kV trunk lines or 500kV transmission lines
between the northern 500kV trunk line and the southern 500kV trunk line might be needed.
Therefore, it is desirable to balance the demand with the generation in each area.
4) In terms of the new transmission lines from the new power stations to the existing 500kV
system, it is desirable to shorten its distance as much as possible to reduce the construction
costs and transmission losses and to improve transient stability. Therefore, it is desirable to
choose the new sites as close to the demand (500/150kV substation) as possible when
developing new power stations.
From the viewpoint of reliability, it is desirable to avoid concentration of power
development at one site.
(2) Short circuit capacity
If power stations are developed heavily in West Java, there will be the problem of short
circuits in the 500kV system. Therefore, a splitting of the system or other such measures (e.g.
upgrading the equipment, current-limiting reactor) will be needed.
Measures against short circuit capacity should be determined by considering reliability and
costs in comparison with the split of the system and other measures.
6-1
Chapter 6 Rehabilitation Plan of Thermal Power Plant
6.1 Summary
In this chapter, rehabilitation of the existing thermal power plants was planned. The
following is the flow of the examination and summary of this chapter:
(1) Survey of the current status of the facilities
Operational status (year of commissioning, capacity factor, etc.), derated capacity and its
reason, thermal efficiency, fuel cost per kWh, etc. were surveyed.
(2) Selection of focus of rehabilitation
From the survey results, it was decided to focus rehabilitation on thermal efficiency
improvement of conventional steam power plants (PLTU).
(3) Selection of measures to improve thermal efficiency
From the result of the data and the interview during the site survey, the following items
were selected as the thermal efficiency improvement measures to be examined in detail.
- Cleaning of feed water heater tubes
- Boiler chemical cleaning
- Improving high- and intermediate-pressure turbine blades
- Replacement of air preheater element and seal
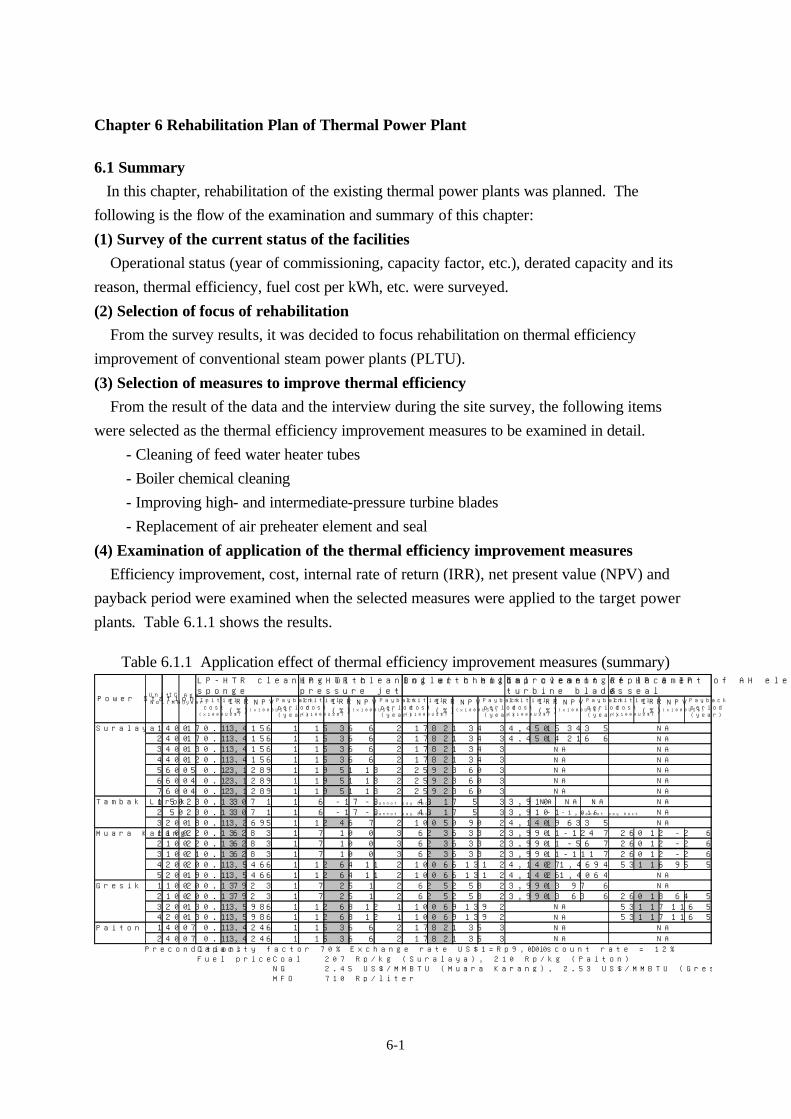
(4) Examination of application of the thermal efficiency improvement measures
Efficiency improvement, cost, internal rate of return (IRR), net present value (NPV) and
payback period were examined when the selected measures were applied to the target power
plants. Table 6.1.1 shows the results.
Table 6.1.1 Application effect of thermal efficiency improvement measures (summary)
Initialcost
(x1000US$)
IRR(%)
NPV(x1000US$)
Paybackperiod(year)
Initialcost
(x1000US$)
IRR(%)
NPV(x1000US$)
Paybackperiod(year)
Initialcost
(x1000US$)
IRR(%)
NPV(x1000US$)
Paybackperiod(year)
Initialcost
(x1000US$)
IRR(%)
NPV(x1000US$)
Paybackperiod(year)
Initialcost
(x1000US$)
IRR(%)
NPV(x1000US$)
Paybackperiod(year)
Suralaya 1 400 17 0.13 1,415 6 1 15 36 6 2 178 21 34 3 4,450 15 343 52 400 17 0.13 1,415 6 1 15 36 6 2 178 21 34 3 4,450 14 216 63 400 13 0.13 1,415 6 1 15 36 6 2 178 21 34 34 400 12 0.13 1,415 6 1 15 36 6 2 178 21 34 35 600 5 0.13 2,128 9 1 19 51 13 2 259 23 60 36 600 4 0.13 2,128 9 1 19 51 13 2 259 23 60 37 600 4 0.13 2,128 9 1 19 51 13 2 259 23 60 3
Tambak Lorok 1 50 23 0.13 307 1 1 6 -17 -3 cannot pay back 43 17 5 3 3,910 NA NA NA
2 50 23 0.13 307 1 1 6 -17 -3 cannot pay back 43 17 5 3 3,910 -1 -1,016 cannot pay back
3 200 18 0.13 1,269 5 1 12 46 7 2 100 50 90 2 4,140 19 633 5Muara Karang 1 100 22 0.13 628 3 1 7 10 0 3 62 36 33 2 3,990 11 -124 7 260 12 -2 6
2 100 22 0.13 628 3 1 7 10 0 3 62 36 33 2 3,990 11 -56 7 260 12 -2 63 100 21 0.13 628 3 1 7 10 0 3 62 36 33 2 3,990 11 -111 7 260 12 -2 64 200 20 0.13 1,546 6 1 12 64 11 2 100 66 131 2 4,140 27 1,469 4 531 16 95 55 200 19 0.13 1,546 6 1 12 64 11 2 100 66 131 2 4,140 26 1,406 4
Gresik 1 100 20 0.13 792 3 1 7 25 1 2 62 52 58 2 3,990 13 97 62 100 20 0.13 792 3 1 7 25 1 2 62 52 58 2 3,990 13 63 6 260 18 64 53 200 13 0.13 1,598 6 1 12 68 12 1 100 69 139 2 531 17 116 54 200 13 0.13 1,598 6 1 12 68 12 1 100 69 139 2 531 17 116 5
Paiton 1 400 7 0.13 1,424 6 1 15 36 6 2 178 21 35 32 400 7 0.13 1,424 6 1 15 36 6 2 178 21 35 3
Precondition: Capacity factor 70% Exchange rate US$1=Rp9,000 Discount rate = 12%Fuel price Coal 207 Rp/kg (Suralaya), 210 Rp/kg (Paiton)
NG 2.45 US$/MMBTU (Muara Karang), 2.53 US$/MMBTU (Gresik)MFO 710 Rp/liter
Power Station Age(year)
Improvement of HP & IPturbine blades
Replacement of AH element& seal
Boiler chemical cleaningHP-HTR cleaning with highpressure jet
LP-HTR cleaning withspongeUnit
No.IC(MW)
NA
NA
NA
NA
NA
NA
NA
NA
NA
NA
NA
NA
NANA
NA
NA
NA
NA
NA
NA
NA
NA
NA
6-2
6.2 Conclusion
Rehabilitation should be carried out beginning with high IRR items. Therefore,
rehabilitation items are prioritized as follows.
1) LP-HTR cleaning with sponge
This work is simple and does not require technical experience and know-how, and the
cost is very small. Therefore, this can be carried out immediately by the Indonesian side
alone. The targets are the last LP-HTRs of all steam power plants. This should be carried
out every 8 years along with periodical inspection of LP-HTR.
2) HP-HTR cleaning with high-pressure jet
One set of high-pressure water jet equipment for common use for all power plants should
be purchased first and it costs about US$140,000. And then, when the work is carried out,
it costs only about US$2,000-4,000 per one HTR as the costs of transportation of the
equipment, consumables such as nozzles, and labor.
Because this work requires technical experience and know-how, guidance from the
experts of the water jet cleaning company should be received in the early stages of the
introduction (e.g. for several months in total in several power plants).
The targets are the HP-HTRs of Suralaya PLTU 1-7, Tambak Lorok PLTU 3, Muara
Karang PLTU 4-5, Gresik PLTU 1-4 and Paiton PLTU 1-2. This should be carried out
every 4 years along with periodical inspection of HP-HTR.
3) Boiler chemical cleaning
Boiler chemical cleaning should be carried out at a proper time. Therefore it is necessary
to determine whether or when this should be carried out following the detailed examination
by the cutout test on the evaporation tube and operational state. The targets are the all
steam power plants.
4) Improvement of HP & IP turbine blades and replacement of AH element & seal
IRR is not too high for the high investment cost. Especially for the improvement of HP
& IP turbine blades, IRR is evaluated assuming that this improvement is carried out along
with the inevitable replacement due to deterioration. Therefore it is necessary to determine
whether this should be carried out following the detailed examination of the state of
deterioration. In the detailed examination, manufacturers should participate to examine the
applicable technology and the amount of efficiency improvement from the viewpoint of
design.
The targets of the detailed examination for the improvement of HP & IP turbine blades
are Suralaya PLTU 1-2, Tambak Lorok PLTU 3, Muara Karang PLTU 4-5 and Gresik
PLTU 1-2.
The targets of the detailed examination for the replacement of AH element & seal are
Muara Karang PLTU 4 and Gresik PLTU 2-4.

7-1
Chapter 7 Environmental Measures
In this chapter, an overview of the environmental regulations and measures in the thermal
power plants and the proposals for promoting utilization of coals in the future are studied.
The flow of examination and summary in this chapter is as follows.
7.1 Environmental Regulations and Standards
The whole environmental related regulations in Indonesia are investigated and the level of
restriction, especially for air pollution standards, is evaluated.
Indonesia reviewed its emission standards in 2000 and tightened control by reducing the
limit to 1/2 of existing level. As a result, while PM emission standard is a little lax, the SO2
and NO2 emission standards are nearly equal to the World Bank emission standards, so the
level of restriction is same as developed countries.
7.2 Current Environmental Conditions and Countermeasures in Thermal Power Plants
The current gas emission from each thermal power plant by fuel type is surveyed and the
proposals for environmental improvement are evaluated.
Table7.2.1 Current Environmental Conditions and Countermeasures Fuel type Current conditions Countermeasures
Coal-fired (Paiton, Sularaya)
- P M: Some plants exceed the
acceptable level (due to the damage of aging electrostatic precipitator) - SO2:
Emission of SO2 is currently close to the allowable level
- PM: Replacement of the interior parts of
electrostatic precipitator is planned. - SO2:
Difficult to purchase higher level coal. Consideration to the level of sulfur content
Oil-fired (Muara-karang)
- NO2, PM: Good operation condition
within acceptable level. - SO2:
Exceeding the acceptable level (due to using high sulfur contents Oil)
- SO2: Conversion of fuel to natural gas Reduction of sulfur in Oil Installation of desulfurization facility
(The conversion to natural gas is the most environmental friendly proposal for existing oil-fired power plants)
Natural gas-fired
- SO2, NO2, PM: Good operation condition
within acceptable level.
-

7-2
7.3 Environmental Protection Measures to Promote Utilization of Coal in Thermal Power Plants
The coal reserves by coal type is shown in Table7.3.1. Consumption of lower-grade
sub-bituminous coal and brown coal (lignite), which are abundant in coal reserves, are
expected to increase in the future because they ensure better cost performance and energy
security. To ensure ecological use of these types of coal, appropriate measures should be
taken. In this chapter, environmental countermeasures for utilizing various type of coal and
latest clean coal technologies (CCT) which are adaptable for Indonesia are studied.
Table 7.3.1 Coal reserves (%) by coal type Type of coal Amount of deposits (%) Anthracite 0.36 Bituminous coal 14.38 Sub-bituminous coal
26.63
Brown coal 58.63 Total 100.0
(1) Measures to ensure environmental with lower-grade coal
a. Use of coal with lower calorific value requires:
- Construction of new coal mills in order to compensate for inadequate capacity of
existing mills (for existing plants);
- Reinforced coal handling equipment to accommodate the expected increase in the
volume of coal (for existing plants);
- Re-designed combustion equipment and ventilation system that can accommodate
additional supply of fuel (for new and existing plants); and,
- Installation of coal mixing equipment to blend high-calorie and low-calorie coals (for
new and existing plants).
b. Use of coal with high sulfur/ash content requires:
- Installation/addition of desulfurizers and dust disposal equipment (electrostatic
precipitator) (for new and existing plants); and,
- Installation/addition of equipment to treat ash and by-product of desulfurization (for
new and existing plant) (2) Clean Coal Technology (CCT) that can be promoted to Indonesia
The increased use of coal for power generation in many countries has spurred innovation of
diverse types of CCT technologies. The three main types of boilers that may apply to
Indonesia are: supercritical boiler, brown coal (lignite) -fired boiler, and circulating fluidized
bed combustion boiler.
8-1
Chapter 8 Institutional and Organizational Recommendation for the Optimal Electric
Power Development Plan and Stable Power Supply
In this chapter, the following items were studied as the institutional and organizational
measures contributing to realize the optimal power development plan and to ensure stable
power supply.
(1) Lessons from the California Power Crisis to the power sector liberalization in Indonesia
In this section, the lessons from the California Power Crisis were examined to make use of
the power sector liberalization in Indonesia from the viewpoint of stable power supply.
(2) System for power supply bidding with a view to power supply composition
This section will introduce Japan’s wholesale electricity bidding system to implement the
optimal power development plan by private investment in Single Buyer System.
(3) An approach to power development supporting system in line with energy policy
In this section, measures to support the power development in line with energy policy were
examined from the viewpoint of realization of the optimal power development plan.
(4) Utilization of captive power
Captive power in Indonesia can affects stable supply of electric power. Therefore the
demand trend of captive and the possibility to utilize as a short-term countermeasure against
power deficit were examined.
(5) Utilization of Demand Side Management (DSM)
In this section, DSM was examined as a measure to ensure stable supply of electric power
from the demand side.
(6) Financial enhancement of PLN
The financial situation of PLN which affects realization of the optimal power development
plan was analyzed. And the required measures for enhancement of PLN financial condition
were examined.
(7) Measures to promote private investment
The measures for promoting private investment necessary to realize the optimal electric
power development plan were examined.
8-2
8.1 Lessons from the California Power Crisis to the Power Sector Liberalization in
Indonesia
8.1.1 California Power Crisis
California’s power sector reform started in 1996. Wholesale markets worked reasonably
well for the first two years (1996-8) while the initial surplus of generating capacity disappeared.
Then by 2000, when the demand surged and supply capacity cannot match the demand, rolling
blackouts disrupted the state economy. This shortage of electricity was accompanied by the
skyrocketing of the wholesale spot prices.
The immediate cause of the crisis is this mismatch of the demand and supply. The problem
is said to be in the design of the wholesale market, which could not provide price signal of the
users and/or the incentive for new power development to the wholesale market. Because
initially the major private distribution companies were not allowed to buy outside of the spot
market, they were exposed to the price volatility of the market. And the price signal of the users
was not transmitted to the wholesale market due to the retail price cap system. This price
volatility and the lack of interaction between the wholesale market and the retail market made
market participants difficult to manage their risks.
8.1.2 Lessons for Indonesia
The purposes of liberalization are clearly different between the cases of California and
Indonesia. California wanted to reduce the price by introducing competitive market. Indonesia
wants to increase the private participants by liberalizing the market. Also in California crisis,
the main concern was the establishment and regulation of a mandatory, wholesale power market
based on spot pricing. But Indonesia’s case is still far away from such an option.
Although there are such fundamental differences, there are also lessons to be shared.
a. The California case suggests the importance of the system to ensure new supply
capacity in the competitive market. In other country, this function can be
complemented by various means, namely a capacity obligation on distribution
company’s purchasing power in market, a parallel capacity market to the energy spot
market, or a forward energy trading market whose prices signal expectations about
future supply/demand balances. At the same time, the market rule has to be designed so
that investors in new supply capacity do not face major barriers to entry to the wholesale
power market. These barriers include uncertainty and expense in facing delays to the
permitting process, regulatory uncertainties.

8-3
b. Indonesia like other developing countries should start with limited forms of competition
that can evolve to full wholesale competition. The spot market should not be the
priority until the sector can manage full competition.
c. Regulators should encourage and even require supplies to take measures for allowing
large users to adjust their demand for power in real time, through smart metering and
other means, since competition works properly only when both suppliers and users
interact in the market.

8-4
8.2 System for Power Supply Bidding with a view to Power Supply Composition
This section will introduce Japan’s wholesale electricity bidding system as an example for
reference in connection with power procurement under the SBS system, which has yet to be
clearly defined. Under the wholesale power system, the Japanese power companies play a role
relatively similar to that of the single buyer, but the way they obtain new power sources would
be of reference in the design of the SBS.
8.2.1 Problems in Past Invitations to IPPs in Indonesia
In 1992 Presidential Decree No.37 was promulgated as a measure to solve the power supply
shortage foreseen by the Indonesian government. The decree strongly encouraged private
sector participation in power source development projects. By the time of the Asian currency
crisis in 1997, purchase contracts had been signed with a total of 27 IPPs. However, the
economic depression which began with the Asian currency crisis led to most of the contracts
being broken. Under the contracts which were not broken, the currency crisis led to a sharp drop
in the value of the Rupiah, causing a severe back spread between the PLN’s Rupiah-based
electricity sale price and the US$-based unit prices for electricity under the contracts with IPPs
(approximately 6c/kWh excess). This back spread drastically weakened the PLN’s financial
position, and it is now reviewing contract unit prices.
The plan to bring in IPPs in Indonesia was intended to use private sector funds to augment
power supply development funds, even though they cost rather more, because there was no way
to develop sufficient power sources to meet the growth in power demand from public sector
funds alone. In order to attract private capital while simultaneously reducing power supply
costs, the IPPs were offered attractive terms, but at the same time the IPPs involved had to be
chosen with consideration for a balanced power supply composition.
8.2.2 Power Source Bidding System taking Power Source Composition into account
As described above, Indonesia’s introduction of IPPs was intended to use private sector funds
to augment power supply development funds, even though they cost rather more, because there
was no way to develop sufficient power sources to meet the growth in power demand from
public sector funds alone. In that sense, it differs from the nature of the Japanese IPP bidding
system, which was intended to apply market principles to the power sector and reduce
electricity charges. Therefore the methods of the Japanese system which appear to be applicable
to the future design of the SBS will be summarized below in conclusion.

8-5
(1) Expansion of power sources using the power source bidding system
In Indonesia’s past introduction of IPPs, the majority of power sources are applied to base
load, and the system of soliciting sources from IPPs was certainly advantageous for base load
sources. In future, if all power sources are to be developed by the SBS bidding system under the
New Electrical Power Law, a bidding system will have to be introduced with methods that
allow peak and middle power sources to compete effectively with base power sources.
Specifically, the power purchase prices will have to be set for the anticipated peak, middle and
base power supply types (i.e. equipment usage rates) in order to encourage investment in power
stations that will have lower equipment usage rates. Under such a method, there would be
progress in expansion of peak and middle power sources.
(2) Power supply bidding system with consideration of power source combination
If peak, middle and base power sources are all targeted for investment under the power source
bidding system, the volume solicited and the power purchase prices should be set for each
equipment usage rate and fuel type in order to manipulate the power source combination while
suppressing electricity charges. Therefore long-term targets for power source combination
should be studied with a view to making effective use of primary energy and conserving the
environment. It is important to clarify the direction of the nation’s power source development in
this way in order to provide information on which the private sector can base investment
decisions.

8-6
8.3 An Approach to Power Development Supporting System in line with Energy Policy
Under the Electric Power Policy, energy development in Indonesia is focused on reduction
of use of fossil fuel to realize sustainable energy development. New and renewable energy
sources are also being introduced as switches in energy use, for the sake of environmental
preservation. In this section, electric power development supporting systems to introduce new
and renewable energy and to introduce gas-fired power using CDM scheme are studied
8.3.1 Introduction of New and Renewable Energy Sources
We introduce, in this report, the measures for new and renewable energy promotion, which
have introduced in foreign countries.
1) Obligation to purchase with fixed price
2) Obligation on the national electric power company to purchase by lump-sum bid
3) Quota and RPS (Renewable Portfolio Standard)
4) Self-regulated purchase system by the fixed price by Electric Power Companies
Clearly the key point of debate in system evaluations now used by each country is how to
reconcile [1] expanded introduction of these energy types with [2] reduction of their costs. The
existing systems in Germany and Britain emphasize [1] with legal regulations, and have gained
a grasp of the issues involved in evaluation. The US RPS system gave more consideration to [2]
through the introduction of market principles, but it is still too soon to produce an evaluation.
In order to identify the optimum system for Indonesia at this stage, it is important for the
Indonesian government to clarify its priorities between points [1] and [2]. If it aims to expand
the introduction of new and renewable energy sources in the short term, there will be an
attendant fiscal burden, but legislative measures could be used to make the use of new and
renewable energy sources mandatory. If it aims to reconcile expanded introduction of these
energy types with cost reduction in the long term, it will have to await an evaluation of the RPS.
8-7
8.3.2 Introduction of Clean Development Mechanism(CDM)
The Ministry of Environment carried out a study in which the marginal abatement costs
and the amount of reductions of green house gas emissions were calculated for the proposed
power generation projects. Then the priorities were assigned to the various projects. Although
large projects are not proposed in the study, the development of gas combined cycle, mini
hydropower and cogeneration are given to high priorities for CDM and fuel diversification
from coal to gas has been recommended.
According to the base case(JICA/LPE Case 2) in the optimal power development study using
the least cost method, coal-fired power will have a dominating 57.0% of the installed capacity
in 2015. CO2 emissions are projected to increase to 156.4 million tons in 2015 from 39.6
million tons in 2001. The possibility of having the additional cost to replace coal-fired power
with gas-fired power plants covered by the third countries or private companies, is going to be
considered.
In the case that a project in which coal-fired power with a capacity of 600MW will be
replaced with gas power in 2010, CO2 emissions credit cost is estimated to 20.77US$/tons-CO2
On the other hand, in Japan, marginal cost of CO2 emissions in fuel conversion from coal to
gas is 29.5 US$/tons-CO2 considerably high and Afforestation Cost and Emission Trading cost
have a wide range. It may provide competitive prices if the high CO2 emission factor in
Indonesia are improved.
There are a number of fundamental issues to be discussed for the implementation of CDM.
For example, effective demand for CDM emissions offset, type of projects, the price of
emissions credits, and credit distribution way between the countries are being discussed.
Therefore further study on CDM is necessary.

8-8
8.4 Utilization of Captive Power Captive power shares about 30% of installed capacity in Java-Bali system, which will make an
impact on electric power development plan. In this section, present status and movement of
captive power are studied for the electric power development plan 8.4.1 Present Status of Captive Power
There are two types of captive power: main power and supplementary power. Main power
captive plants are not connected to PLN and supplementary powers are installed for back-up.
Table 8.4.1 Captive Power Installed Capacity in Java-Bali
(Source:PLN Statistic 2000)
Consumers chose captives or PLN grid, depending on the reliability or price of electricity.
Those who need reliability switch to PLN when the PLN supply becomes stable. Those who
need low electricity prices switch to PLN when the PLN tariff is still low or fuel prices are high. 8.4.2 Cost Estimation of Captive Power
We will try to calculate the generating cost of captive power and compare it with the tariff of
PLN. In case of new installation, the cost is higher than PLN’s present tariff of Rp.371 for
Industry (I-4), but it is relatively lower than the tariff which is scheduled to be doubled in 2005.
On the other hand, in the case of existing captive which exclude investment costs, the costs are
different and depend on the fuel price and tariff schedule.
Table 8.4.2 Comparison the costs between captive power and PLN (Rp./kWh) Captive power cost Fuel price Newly installed Existing
PLN Tariff(I-4)
Rp.1,110/L(with subsidy, present) Rp.579 Rp.426 Rp.1,830/L(without subsidy) Rp.841 Rp.688
Rp.371(Present) Rp.742(Target in 2005)
As the movement of captive power will make an impact on electric power development, it is
needed to conduct an actual operational condition survey, and to manage the data of fuel
consumption and power generation, and power purchase conditions from existing captive
powers. The stable power will be supplied by reflecting the movement of captive power to the
electric power development plan.
Installed Capacity (MW) Main Power 1,835 Supplementary Power 5,958 Total 7,793
8-9
8.5 Utilization of Demand Side Management (DSM)
In this report, DSM implementation issues will be analyzed by examining the power demand
and DSM experience in Indonesia. Then institutional countermeasures for implementing DSM
program in Indonesia will be proposed.
8.5.1 Characterization of Power Demand in Indonesia (1) Daily load curve
Power demand in Indonesia has been increasing constantly, excluding the power crisis in
1991 and economic crisis from 1997 to 1998. Load factor as of 2000 remained at 69.9% which
is comparable with the other ASEAN countries
Based on the result of analysis of peak demand over 1,000 hours, peak demand occurs in all
months especially between July and December from the results for period of year. Based on the
results for time-of-day, peak demand occurs only between 18:00-21:00. Based on the results
for day of the week, peak demand of weekends is less than of weekdays. The results of
time-of-day show a more conspicuous trend than the other results. Therefore the DSM options
which decrease demand between 18:00-21:00 mainly caused by the electric lights are
reasonable as a "Peak Cut" type of DSM. That is why DGEEU of MEMR is very keen to install
the efficient type lamps in household.
8.5.2 Current Status in Indonesia
The DGEEU staff of MEMR, which is in charge of energy conservation, said that the
previous DSM program was suspended after the economic crisis of 1997. Until now, although
DGEEU appreciates the significance of DSM, it has not been able to implement substantial
DSM programs because of financial issues in the GOI.
Given this situation, DGEEU is now planning or implementing following three programs,
- National awareness campaign in Yogyakarta through the mass media and workshops
between local governments, universities and NGO's,
- TERANG program which aims to reduce demand by installing compact fluorescent lamps
(CFL's) in household, and
- PJU program which aims to reduce demand by installing efficient lamps in public lighting.

8-10
8.5.3 Analysis of the Issues and Recommendations
The introduction of DSM could provoke several technical, financial and systemic issues. In
this section, we are going to analyze these problems, focusing on common points among all
DSM programs.
(1) Development of governmental organization and its capacity
In accordance with the restructuring of energy sector, PLN is going to be divided into
generation, transmission and distribution sections. At this point, it can be assumed that the
responsibility of government will increase as a leading organization in DSM in various ways.
For example, concerning the introduction of energy saving oriented DSM programs, parties
such as the following are required:
1) Organizations which collect and administrate detailed data, such as load curves and the
diffusion rates of electric appliances,
2) Specialists who analyze the data and formulate and evaluate plans for the introduction of
DSM,
3) Organizations which support technical roles to formulate standards for electric appliances
and examine and evaluate them
are required. In order to keep up with these additional functions, governmental organizations
should be developed.
(2) Financial support for improvement of DSM
The introduction of energy saving oriented DSM programs, such as the introduction of highly
efficient electric appliances, requires large initial costs for purchasing equipment.
However, in the case of Indonesia, both government and PLN could not afford financial
support for the project. There are not any other effective organizations to subsidize it.
Considering these circumstances, it could be concluded that not only technical assistance to
support organizational development, but also financial assistance such as 'soft loans', are
necessary.
(3) Improvement of DSM after liberalization
In order to introduce a demand-control oriented DSM program such as Load Adjustment
contract and Time-Of-Use contract, power suppliers are required to be responsible for the
supply of power on the basis of contracts and systems. However, in the case of Indonesia, there
is no power supplier who is capable of meeting that responsibility in the framework of
liberalization.
In DSM developed countries such as US, investment towards DSM has been decreasing
since the implementation of liberalization. Therefore, it may be necessary to discuss methods
and actors to promote DSM programs at the formation of liberalization plans in Indonesia.

8-11
8.6 Financial Enhancement of PLN
8.6.1 Financial Analysis
We analyzed PLN’s financial position based on the company’s financial statements. The
most remarkable point in the financial condition is the fact that PLN has suffered from chronic
deficit since the economic crisis. This was caused by an expansion of USD-denominated
expenses on heels of a decline of rupiah. It was found that increases in fuel cost and
expenditure for electricity purchase from IPP are main factors for the current position in red ink,
along with a rise in interest payment. 8.6.2 Revenue/Cost Analysis
We also analyzed income and expenses in order to study the impact they will have on the
company’s profits in the future. The income analysis results indicate that the tariff’s impact is
particularly important, although the income prospects will differ largely depending on such
factors as electricity tariff, growth of demand, and expenses and their fluctuation. Compared to
a simulation case of retaining the current rate at $0.04/kWh, another case of hiking the rate to
$0.07/kWh from 2005 will boost the company’s profit by Rp 40 trillion or so in 2010. As for
expenses, power purchase from IPP is predicted to become the largest burden on management
in the future rather than a rise of fuel cost. 8.6.3 Response of the Government of Indonesia and PLN
Actually, the Indonesian government and PLN has taken such measures as 1) revision of the
electricity purchase contract with IPP, 2) debt-equity swap, 3) phased raise of tariff, 4) financial
restructuring for PLN, in a bid to minimize an increase of expenditure triggered by the currency
crisis and its adverse effects on PLN’s financial position.
From the viewpoint of income and expenses, revision of the electricity purchase contract
with IPP will reduce power purchasing cost, debt-equity swap will reduce interest payment by
converting debts that obliges PLN to pay interest into shareholders’ equity, and raise of tariff
will boost revenues. PLN’s financial restructuring intends to curtail cost from a management
aspect to improve productivity, leading a decrease of expenses, as noted in its Efficiency Drive
Program (EDP). These measures surely work well in improving financial statements for PLN
in terms of income and expenditure, and the effects are likely to surface gradually. However,
they will not improve the company’s financial position that is exposed to the exchange risk.
The same problem could arise in the future when the rupiah falls rapidly and largely again, even
if the purchase price from IPP is set at a proper level, debts decrease, and tariff is lowered.

8-12
8.6.4 Structural Problem
The fundamental problem on PLN’s financial structure is as follows; revenues from power
sales are rupiah-denominated, while most of operating expenses are denominated in USD and
other foreign currencies, which include fuel cost and electricity purchase cost, and fund raising
by borrowing. In short, although revenues are rupiah-denominated, expenditure (fuel cost and
electricity purchase cost) and debts are USD-denominated. As production costs and interest
payments have climbed on the currency mismatch, the company has faced negative spread in
which costs exceed revenues.
8.6.5 Proposals
Accordingly, PLN is required to study steps to clear the currency mismatch between
revenues and expenses/fund raising in order to improve its financial structure.
The best solution of the currency mismatch is to introduce USD-denominated electricity
tariff or tariff geared to USD rate movement for some users. A uniform tariff raise on a rupiah
basis will temporarily erase the company’s red ink, but it will not clear up the currency
mismatch. The partial USD-denominated tariff system looks more feasible. Large-lot users
such as major companies and part of rich people already hold USD accounts, in addition,
paying tariff in USD would not much affect their production activities and everyday life.
Setting tariff in USD is not unreasonable as long as the rates are around the average in a range
seen in other ASEAN members.
Introducing rupiah-denominated expenses could be an option, in addition to leading the
USD-denominated revenues. For instance, revising its USD-denominated purchase of fuel
could be effective. The ongoing liberalization of energy market is expected to gradually hike
fuel cost to the level of international trade. Differential fuel costs by user should be also
considered. Fuel cost accounts for approximately 60% of electricity generation cost. Sales of
fuel such as gas and oil are rupiah-denominated for individual consumption and
USD-denominated for business use in principle. Although PLN buys fuel on a USD basis, all
of its customers are not business- and industrial-users; there are also individual users.
Nevertheless, if PLN buys fuel for household-use electricity generation on a USD basis, which
is so-called lifeline of people, no one will enter in the household sector even after the electricity
market is liberalized in the future. As for fuel cost that is controlled by the government policies,
shifting supply to rupiah base from USD base could take effects in case PLN selects users on
consideration for such policy elements as user base, income differentials, and re-distribution of
wealth.

8-13
The reduction of the purchasing prices of fuels and electricity from IPP, however, has several
problems. The reduction of fuel price is against the governmental decision to liberalize the
energy sector, and may damage PLN’s competitiveness in the long run. In the same context,
re-negotiation with IPP and the reduction of power purchasing price from them could harm
trustworthiness of the Indonesian electricity market, and have negative impact on the future
prospect of the IPP. The Indonesian government has to balance short-term PLN rescue and
long-term electricity market.

8-14
8.7 The Measures to Promote the Private Investment
8.7.1 Issues for the Promotion of Private Investment in Indonesia
Various methods have been discussed and studied on the investment in Indonesia. The
measures are broadly classified into the following three categories: 1) the approach from the
aspect of organizations and systems, 2) the finical assistance from abroad, and 3) the
differentiation and separation of low risk consumers. The former two approaches do not
necessarily reduce the credit risk. Regarding this, this section presents two business models
based on the third approach.
8.7.2 Use of a Special-Purpose Company (SPC) and the Security Investment
Collateralized by the Power Purchase Agreement
In this model a Special Purpose Company (SPC), which has generating facilities transferred
from PLN, raises the fund by issuing its bond collateralizing generating facilities and the
purchase agreement of electricity. In order for the model to function, the investor must be able
to utilize the collateralized power plant effectively by himself. Then the foreign electric power
companies that want to make inroad into Indonesia are expected to become the investors.
1) The procedure of the scheme is as follows:
(i) PLN establishes the special-purpose company (SPC) by its own fund or by a joint venture
with other organization. The initial paid-in capital of a SPC will be usually very small.
This is because the SPC is a kind of a dummy company that has no actual business activity.
(ii) PLN transfers a specific power plant (or plural) to SPC. In this case, the transfer means to
sell the power plant. SPC pays PLN for the power plant by the fund raised by issuing its
bond afterwards.
(iii) SPC that owns the transferred generation unit from PLN concludes the long-term
purchase agreement of electricity (more than one year) with major electricity customers.
SPC issues the bond to raise the fund collateralizing the purchase agreement. The fund is
used to pay PLN for the transferred power plant.
If SPC does not repay the interest and the principal of the bond, the purchaser of the bond
(the investor) will receive the electricity charge directly from the major customers by exercising
the security right (the right of pledge) set in the purchase agreement between SPC and the major
customers. The purchaser can appropriate the money for the interest and the principal.
The purchaser of the SPC bond has the right of pledge on the demand right for electricity
charge payment set in the purchase agreement of electricity.

8-15
If SPC fails to perform its duty of supplying electricity specified by the agreement due to
bankruptcy, which forces SPC to discontinue the power generation, the bond purchaser (the
investor) is allowed to perform the duty of supplying electricity by exercising the right of
pledge on the SPC’s power plant.
(iv) After PLN has received the cost of the transferred power plant, PLN is able to implement
the building of a new power plant, the renovating, expanding and streamlining of the
existing power plants by appropriating the cost received from SPC. 2) The above scheme is shown in the following figure.
1. PLN establishes the special-purpose company.
2. The transfer agreement of power generation plant
3. The power purchase agreement
4. The collateralizing of the power purchase agreement
5. The issuing of SPC bond 3) Position of Individual Parties
i) PLN: PLN will assign specific power plants for generating electric power consumed by
foreign enterprises and transfer the plants to SPC. The arrangement will enable PLN to
raise the new fund by collateralizing the purchase agreement with the foreign enterprises.
PLN will continue to operate and maintain the power plants transferred to SPC based on
the O&M agreement with SPC, so that there is no essential change in this regard except the
ownership of the plants.
ii) Foreign Enterprises: JJC and foreign enterprises stationed at Jakarta are seriously
concerned about the electric power problem. If a power cut occurs due to the shortage of
PLN/SB Credible Users
StrategicInvestor
SPC/Genco
Genco
Genco 4.C
olla
tera
lize
PP
A
TraditionalUsers
Transfer ofPower Plant
Genco
StrategicInvestment5.
Issue Bonds
Power Supply
Pay in Rp
3.Power Purchase
Agreementin $US
Collater
al
In Caseof Default
Pay in $USIn Case of Default
1.Special Purpose
(Holding)Company by PLN
2.Transfer Agreement
of Power Plant
8-16
power supply, the foreign enterprises will possibly loose their investment fund and may
suffer a significant loss. They are willing to relieve PLN by accepting the electric power
rate of 7 cents/kWh in advance. The current rate will be raised to 7 cents/kWh sooner or
later.
In addition, the power plants of SPC are enabled to supply high-quality electric power
through the technical assistance and technology transfer from the foreign electric power
companies and they deserve to be paid by the foreign enterprises at the rate of 7 cents/kWh.
iii) Strategic Investor <the foreign electric power company>: The foreign electric power
company invests in the SPC bond, secures the repayment of the interest and the principal of
the bond and earns the profit by licensing the technology and know-how for the efficiency
improvement of power plants. Here is the room for promoting the technology transfer
through the cooperation between PLN and the foreign electric power company.
In this idea, the investor (the bond buyer) will take the credit risk of the foreign enterprises
(the electricity purchasers), not that of PLN. If SPC fails to pay the interest and the principal of
the bond, the investor will receive the electric power charges directly from the foreign
enterprises, which will be appropriated to the interest and the principal of the bond. If SPC or
PLN fails to perform the duty of supplying the electric power to the foreign enterprises and
cannot pay for the interest and the principal of the bond by the loss of income, the investor is
entitled to obtain the power plant by exercising the right of pledge for the plants. The investor,
the electric power company at it home country, will start the power generation to supply electric
power to the foreign enterprises that are the other parties of the sales agreement, and receive the
electric power charge.
The primary concerns of foreign companies in Indonesia at present are how to prevent the
occurrence of planned brown out caused by an electric power crisis in the near future. The
stable supply of electric power is given priority over the electricity rate for continuing their
operations in Indonesia. If they were supplied with stable and high quality electric power for a
long period of time, they would accept the electric power charge on US$ basis. 4) When the above investment model is applied for the actual development, the following
points must be reviewed.
- The consumption and its distribution of the consumption of PLN electricity by the foreign
enterprises
- The selection of the power plants (PLN’s plants) to supply electric power to the foreign
enterprises (the power consumption and the distribution to be considered)
- The necessity of improving the legal system (the law of the special-purpose company, the
laws related to electricity business etc.)

8-17
- The valuation of the assets for specified power plants
- Sounding the strategic investors about their intention
- The possibility of cooperation by the foreign governments (JBIC etc.)
- Sounding the Indonesian government
8.7.3 Investment into Power Generation Market (lifting the ban of the electric power
generation in the industrial estate of foreign affiliates)
The current IPP model restricts the selling of electric power only to PLN, meaning that IPP is
exposed to the credit risk of PLN. If private investment in the power generation market is to be
promoted, the investor in power generation market should be allowed to sell electric power to
consumers other than PLN. The most attractive consumer for the investor in power generation
would be the industrial estate of foreign affiliates where the investor can supply electric power
in the most efficient and safest way. If the Indonesian government decides to allow a partial
liberalization of the power supply business to the foreign industrial estate, prior to the full
liberalization in future, the investment in the power generation business would increase by the
foreign electric power companies.
Followings are the reasons why the foreign industrial estate is focused on for inviting the
investment in the market of electric power generation.
1) Few companies in the industrial estate would be forced in a position of nonpayment of
electric power charge, because they have enough size to run manufacturing business in the
estate. Then there would be no concerns about securing the return on the investment.
2) It is from the viewpoint of profitability. The investment in electric power generation requires
selling electricity on the US$ basis and US$ payment in order to avoid the risk of foreign
exchange fluctuations in particular by a heavy fall in rupiah. But the companies operating in
the industrial estate would have the financial strength enough to pay on US$ basis.
3) It is the efficiency from the technical viewpoint. The transmission and distribution efficiency
is higher if the consumers are concentrated in one area.
As for the investment in the power generation business in a leading industrial estate, there is
the opinion that the Indonesian government and PLN would not agree with the investment
because the investor will take only the excellent consumers. However, the financial problem of
PLN and the shortage of electric power are in a serious condition. The introduction of the
private investment at the earliest possible point will be the fast road to the sound public finance
for PLN and then the state of Indonesia. This model is worthy to be considered as the
fundamental plan for inviting the private investment.