Chapter 4 pp. 87-98webs.wofford.edu/boppkl/courseFiles/Expmtl/PPTslides/Ch4...Create a survey of...
16
Chapter 4 pp. 87-98
Transcript of Chapter 4 pp. 87-98webs.wofford.edu/boppkl/courseFiles/Expmtl/PPTslides/Ch4...Create a survey of...
Chapter 4
pp. 87-98
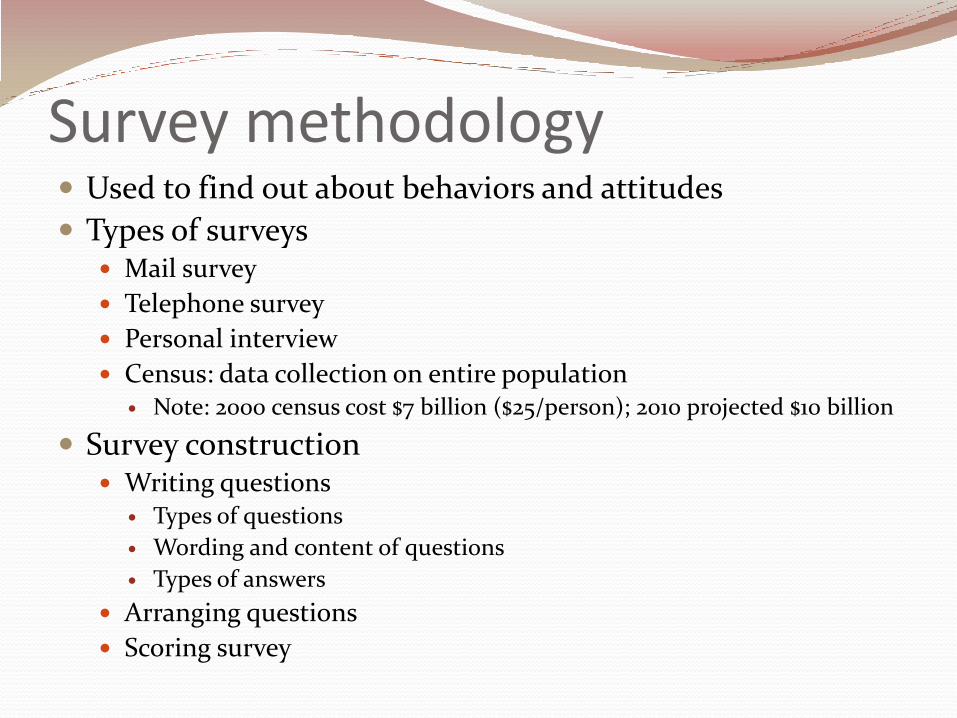
Survey methodology Used to find out about behaviors and attitudes
Types of surveys Mail survey
Telephone survey
Personal interview
Census: data collection on entire population Note: 2000 census cost $7 billion ($25/person); 2010 projected $10 billion
Survey construction Writing questions
Types of questions
Wording and content of questions
Types of answers
Arranging questions
Scoring survey
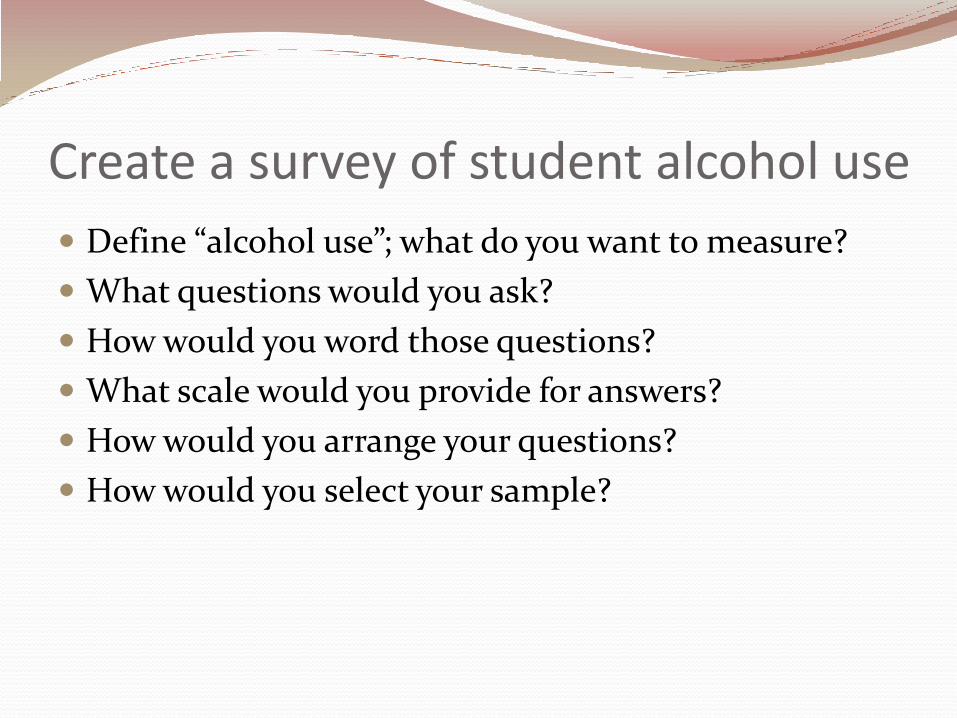
Create a survey of student alcohol use
Define “alcohol use”; what do you want to measure?
What questions would you ask?
How would you word those questions?
What scale would you provide for answers?
How would you arrange your questions?
How would you select your sample?

Writing questions Use clear, simple language to min confusion, max
truthfulness, and increase willingness to respond
Types of questions Open-ended
Ss generate answer w/o limitations; control length by amount of room for response
Closed-ended Ss choose from limited number of possible responses
Can use rating scale or “Likert scale”
Partially open-ended Choice w/ open-ended space (e.g. “other” choice)
Advantages/disadvantages of each? Open: difficult to analyze
Closed: limits responses participants can give (limits validity)
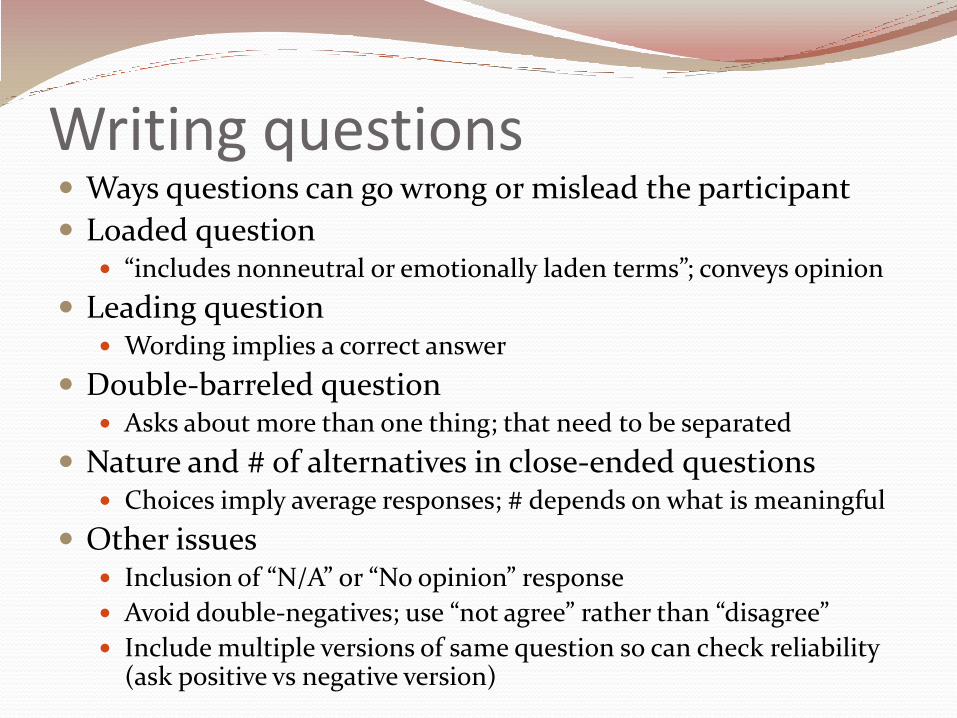
Writing questions Ways questions can go wrong or mislead the participant
Loaded question “includes nonneutral or emotionally laden terms”; conveys opinion
Leading question Wording implies a correct answer
Double-barreled question Asks about more than one thing; that need to be separated
Nature and # of alternatives in close-ended questions Choices imply average responses; # depends on what is meaningful
Other issues Inclusion of “N/A” or “No opinion” response
Avoid double-negatives; use “not agree” rather than “disagree”
Include multiple versions of same question so can check reliability (ask positive vs negative version)

Measurement errorsErrors based on poor measuring instruments or human error
Response bias Tendency for Ss to give same answer to all items
Acquiescence = tendency to agree with question no matter what
Socially desirability bias Ss give inaccurate response b/c other seems inappropriate
Can get non-responses; or make up response b/c didn’t know about topic
Interviewer bias Researcher can influence Ss answers (e.g. by nodding or frowning)
Sampling bias Non-random sample of Ss; one group overrepresented
Memory bias Error due to inaccurate memory
Other: Response may not produce intensity of behavior, attitude, or feeling
Difference to use computer vs. pen & paper?
Perception of purpose of questionnaire

Construct validity Do survey questions adequately measure
construct?
E.g. survey on adolescent smoking
Kovar (2000): 4 million adolescents smoke
What is definition of “adolescent” and “smoking”?
“adolescent” = 12-17 yr-old
“smoking” = 1 puff w/in past 30days - 4 packs/day
Quote provides incomplete picture; need more detail in operational definitions
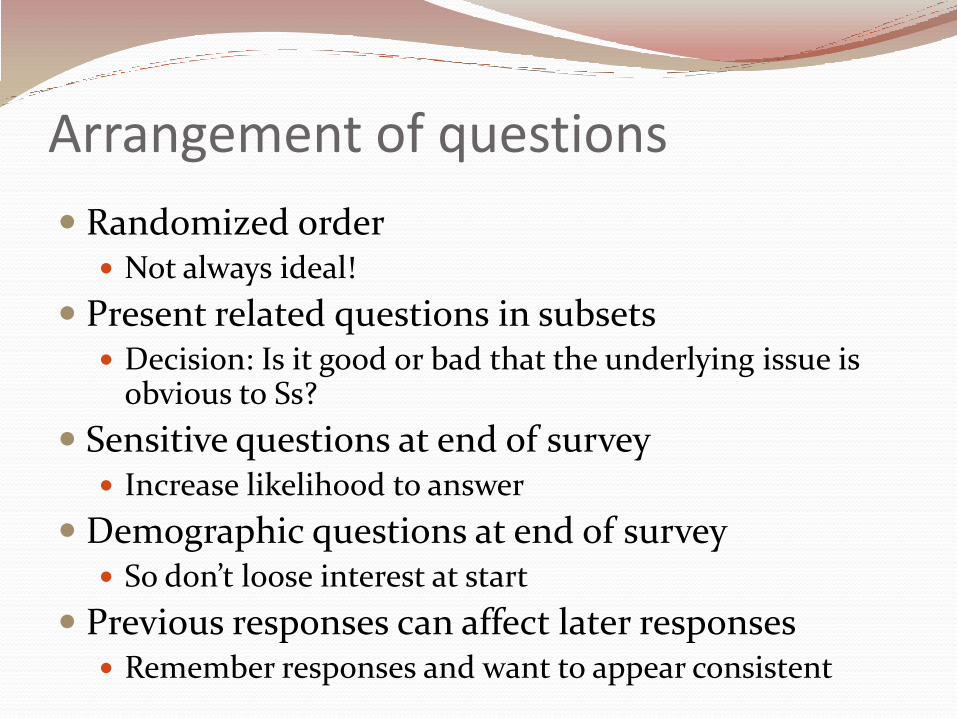
Arrangement of questions
Randomized order Not always ideal!
Present related questions in subsets Decision: Is it good or bad that the underlying issue is
obvious to Ss?
Sensitive questions at end of survey Increase likelihood to answer
Demographic questions at end of survey So don’t loose interest at start
Previous responses can affect later responses Remember responses and want to appear consistent
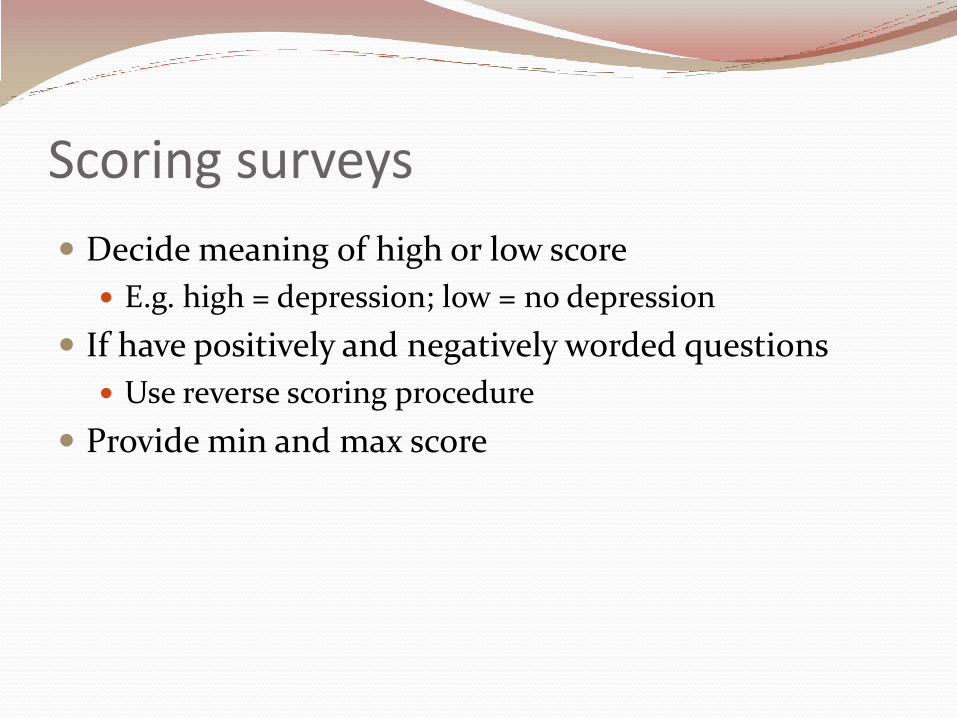
Scoring surveys
Decide meaning of high or low score
E.g. high = depression; low = no depression
If have positively and negatively worded questions
Use reverse scoring procedure
Provide min and max score

Considerations for ethics in survey research
Anonymity and Confidentiality
Only report data in aggregate (summary)
Ensure voluntary participation; Ss can decline participation or terminate responses at any time
Recognize that your presence can influence responses

Voter opinion (Beins, 2009)
Approx 100 million potential voters in U.S.
If you want to find out opinion w/ reasonable accuracy, how do you sample?
Typical political polls sample 1,000 people (Note: that’s .001% of population)
How accurate are they?
In 2000 presidential election difference between poll and result differed by 1.1%

Sampling Representative sample
When sample is similar to population we can be confident in generalization of results
Probability sampling
Nonprobability sampling
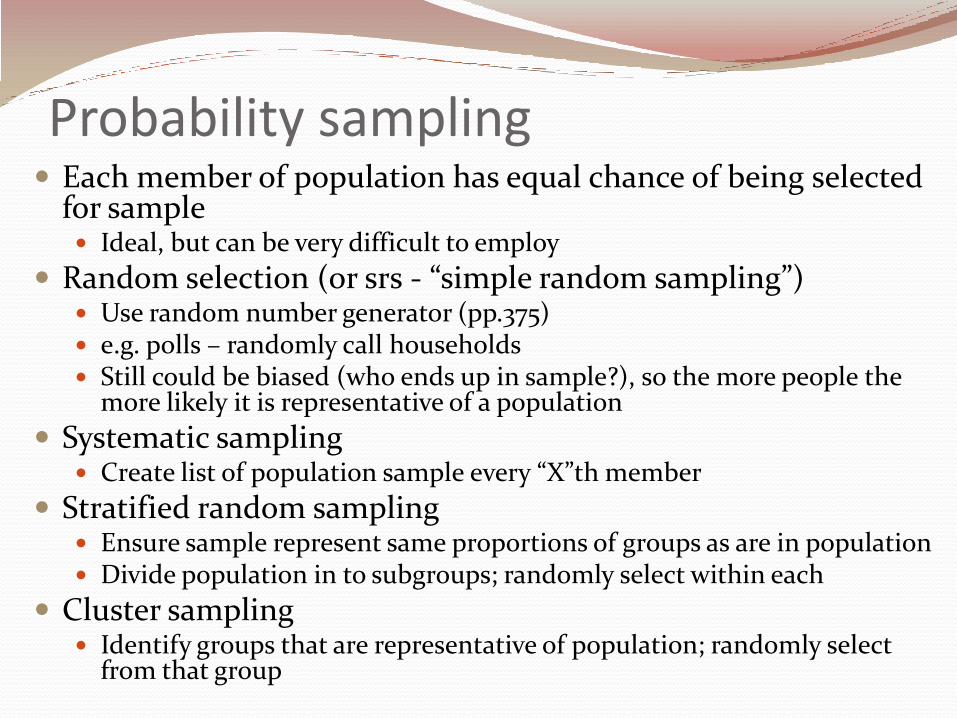
Probability sampling Each member of population has equal chance of being selected
for sample Ideal, but can be very difficult to employ
Random selection (or srs - “simple random sampling”) Use random number generator (pp.375) e.g. polls – randomly call households Still could be biased (who ends up in sample?), so the more people the
more likely it is representative of a population
Systematic sampling Create list of population sample every “X”th member
Stratified random sampling Ensure sample represent same proportions of groups as are in population Divide population in to subgroups; randomly select within each
Cluster sampling Identify groups that are representative of population; randomly select
from that group
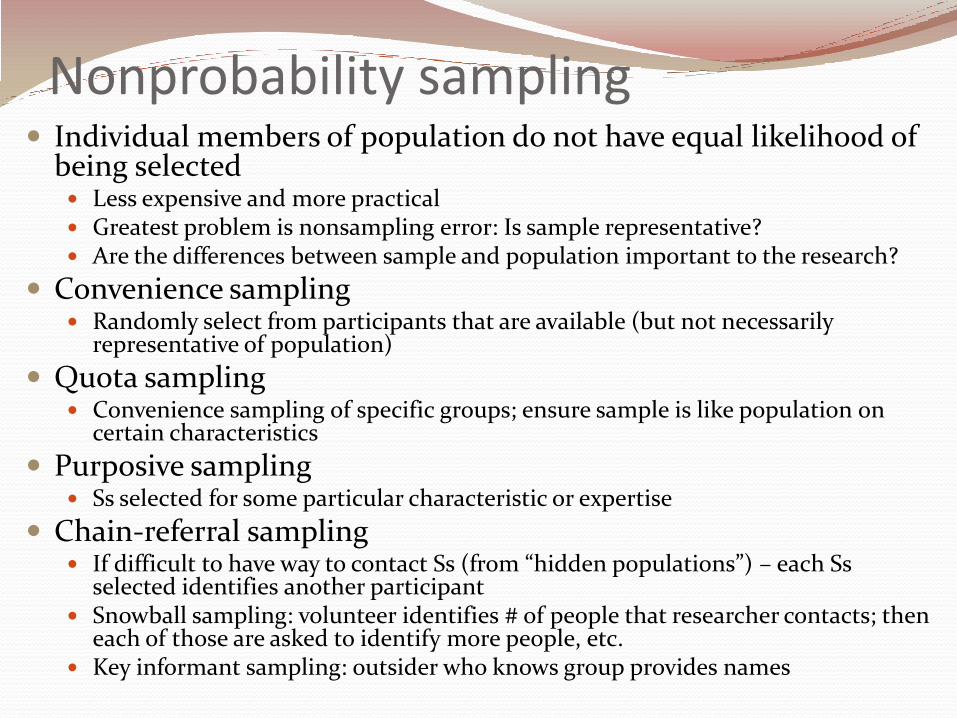
Nonprobability sampling Individual members of population do not have equal likelihood of
being selected Less expensive and more practical Greatest problem is nonsampling error: Is sample representative? Are the differences between sample and population important to the research?
Convenience sampling Randomly select from participants that are available (but not necessarily
representative of population)
Quota sampling Convenience sampling of specific groups; ensure sample is like population on
certain characteristics
Purposive sampling Ss selected for some particular characteristic or expertise
Chain-referral sampling If difficult to have way to contact Ss (from “hidden populations”) – each Ss
selected identifies another participant Snowball sampling: volunteer identifies # of people that researcher contacts; then
each of those are asked to identify more people, etc. Key informant sampling: outsider who knows group provides names

Incentives Do you compensate Ss for participation?
Internal motivation
External motivation
Internal motivators
Adding to knowledge-base
Learn more about self/others
If external, how do you compensate?
Monetary amount (by hour; flat rate)
Gift
Gift to organization of choice
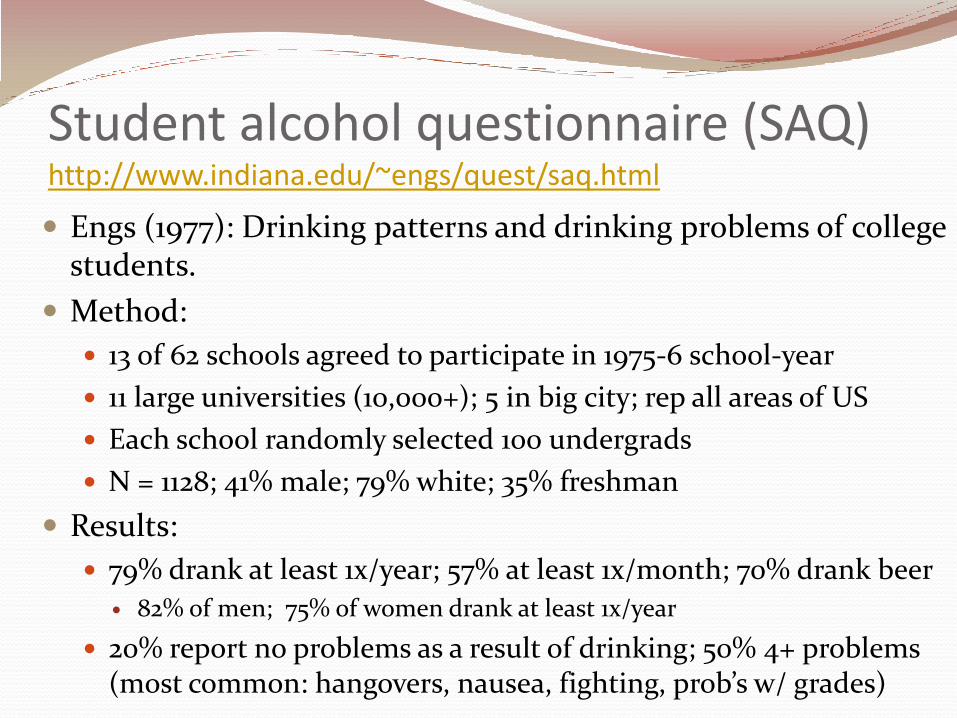
Student alcohol questionnaire (SAQ)http://www.indiana.edu/~engs/quest/saq.html
Engs (1977): Drinking patterns and drinking problems of college students.
Method:
13 of 62 schools agreed to participate in 1975-6 school-year
11 large universities (10,000+); 5 in big city; rep all areas of US
Each school randomly selected 100 undergrads
N = 1128; 41% male; 79% white; 35% freshman
Results:
79% drank at least 1x/year; 57% at least 1x/month; 70% drank beer
82% of men; 75% of women drank at least 1x/year
20% report no problems as a result of drinking; 50% 4+ problems (most common: hangovers, nausea, fighting, prob’s w/ grades)