Introduction to Analysis of Variance -...
35
Introduction to Analysis of Variance Chapter 11
Transcript of Introduction to Analysis of Variance -...

Introduction to
Analysis of Variance
Chapter 11

Review t-tests
Single-sample t-test
Independent samples t-test
Related or paired-samples t-test
ms
Mt
)(
21
21
)(
mms
MMt
DM
DD
s
Mt
n
ssM
1
)( 2
N
MXS
2
2
2
1
2
1)( 21 n
s
n
ss MM
N
ss D
M D 1
)( 2
N
MDS
D
D
n
ssM
2
1
)( 2
2
N
MXS

Which test do I use?
What is the DV?
What is the IV?
What factor designates the groups?
What and how many levels make up the factor
Is it a between or within subject design?
How many groups of subjects?
How many measures for each subject?
Which t-test do you use?


What type of t-test? What is the DV? IV?
What design is used (between or within-Ss)?
A newspaper article reported that the typical American family spent an average of $81 on Halloween candy and costumes last year. You are interested in finding out if families in Spartanburg spend more or less than the national average.
A researcher would like to replicate a study that found that older adults that owned pets were less likely to go to the doctor after an upsetting event than those who did not own pets. She would like to compare a group of pet owners to a group of people without pets and measure the number of visits to the doctor per year.
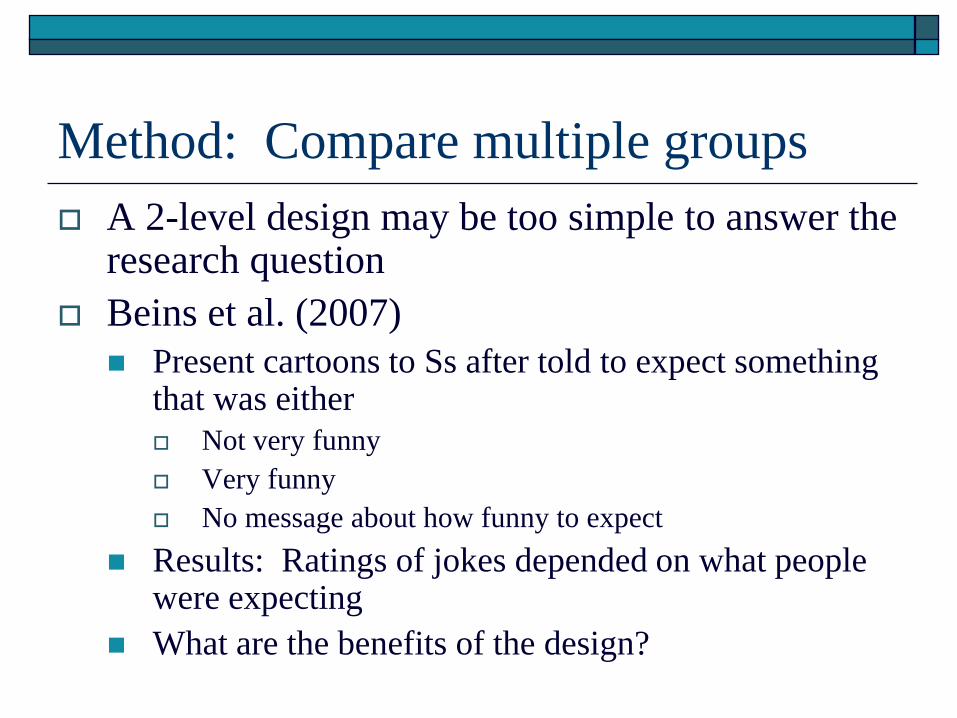
Method: Compare multiple groups
A 2-level design may be too simple to answer the research question
Beins et al. (2007)
Present cartoons to Ss after told to expect something that was either
Not very funny
Very funny
No message about how funny to expect
Results: Ratings of jokes depended on what people were expecting
What are the benefits of the design?

ANOVA: Analysis of Variance
How can we compare 3 or more levels at same time?
Single-factor or One-way ANOVA
Between subject design
1 factor or IV– but 2+ levels
Example
DV = # colds
IV = drug type
3 levels bet-Ss: placebo, low dose, high dose of vitamin C
Null hypothesis: no difference between means
Alternative hypothesis: difference between means
Examine VARIANCE instead of sample mean difference
0 1 2 3:H
3211 : H
1
)( 2
2
N
MXS

Why use ANOVAs?
If = .05 for each t-test you compute
Each test, 5% chance of type I error
or 1 in 20 tests expect error
If need multiple t-tests – error
Calculate chance of making Type I error: 1-(1-α)c
Where c is number of comparisons
1-(1-.05)3 = 1 – (.95)3 = .14 = 14% chance!
Bonferroni adjustment: divide alpha by # tests
Instead perform all tests simultaneously in ANOVA

ANOVA test statistic
T-test ratio:
F-ratio (ANOVA):
chanceby expected difference
means samplebetween differencet
(error) chanceby expected difference variance
means samplebetween sdifference varianceF

Logic of ANOVA
Separates total variability in the DV into two parts
Between-treatments variability
Systematic variance = diff’s in means due to the IV
(treatment effect)
with error variance
Within-treatments variability
Error variance

Between-Treatment Variance
gro
up
rating0 5 10 15
1
2
3
1 2X
2 4X
3 12X
Includes systematic
variance plus error variance

Within-Treatment Variance
gro
up
rating0 5 10 15
1
2
3
1 2SS
2 18SS
3 2SS
1 2 3withinSS SS SS SS
2 18 2 22withinSS

Logic of ANOVA
Separates total variability in the DV into two parts
Between-treatments variability Systematic variance = diff’s in means due to the IV (treatment
effect)
with error variance
Within-treatments variability Error variance
Need to calculate “Sum of Squares” = “SS” Sum of squared deviations from each score from mean
∑(X – M)2
Note: if you then divide by N-1 you get variance (s2)! Right?!
Note: and then if you take square root you get standard deviation (s)! Right?!
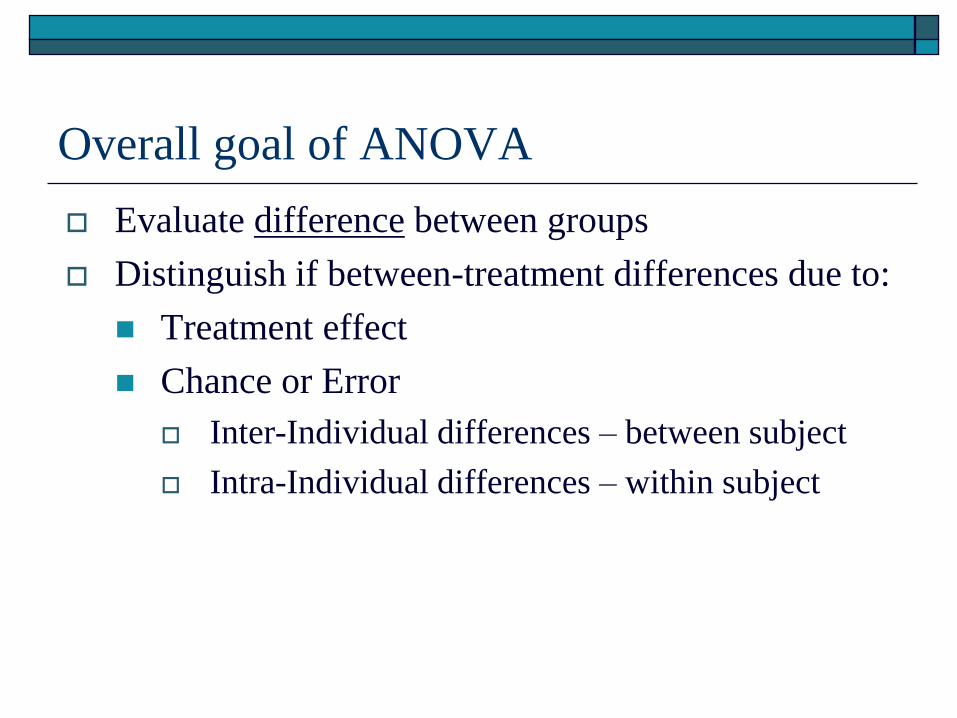
Overall goal of ANOVA
Evaluate difference between groups
Distinguish if between-treatment differences due to:
Treatment effect
Chance or Error
Inter-Individual differences – between subject
Intra-Individual differences – within subject

ANOVA: Partitions the Variance
Total Variance
Between Treatment Variance
1. Treatment effects
2. Error
Within Treatment Variance
Error
Between variance ---------------------- Within variance
F =

The Analysis of Variance: The F-statistic
variation among sample means
variation among individuals in the same sample
Analysis of variance (ANOVA) looks at the ratio:
F=
Treatment Effect +differences due to chance
differences due to chanceF=
If there is no treatment effect, what would you expect
for the value of F?
0 +differences due to chance
differences due to chanceF= = 1 = no effect
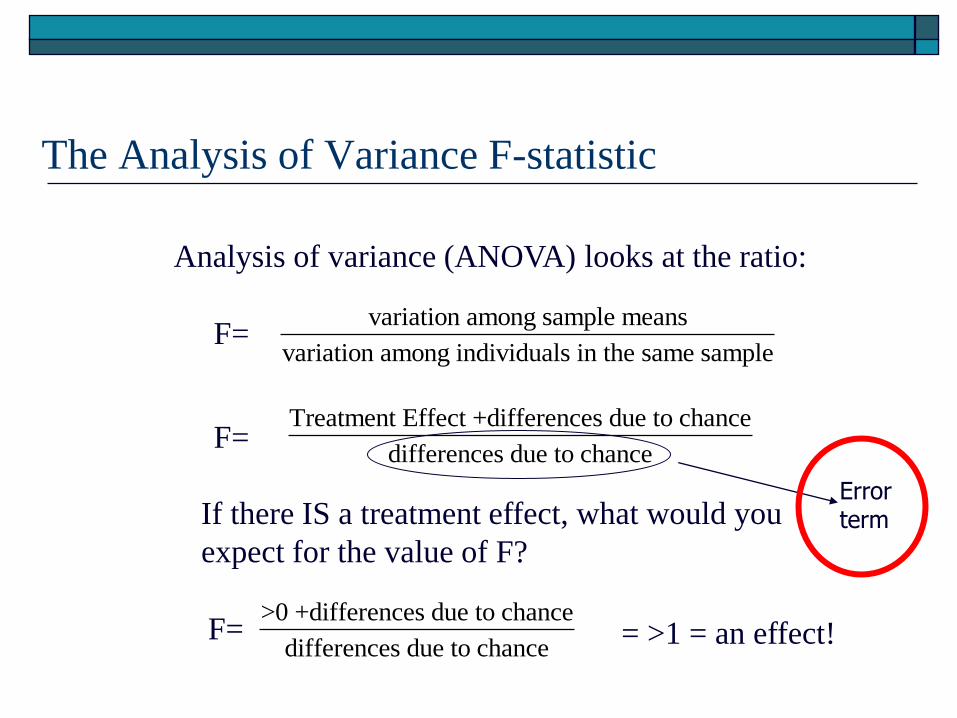
The Analysis of Variance F-statistic
variation among sample means
variation among individuals in the same sample
Analysis of variance (ANOVA) looks at the ratio:
F=
Treatment Effect +differences due to chance
differences due to chanceF=
If there IS a treatment effect, what would you
expect for the value of F?
>0 +differences due to chance
differences due to chanceF= = >1 = an effect!
Error term

ANOVA formulas
MSB= MSW=
SS = sums of squares

Dogs, friends and stress
45 people were asked do a stressful task
and their HR was measured
15 were randomly assigned to one of three groups
Alone With a friend With their dog
Group 1 Group 2 Group 3
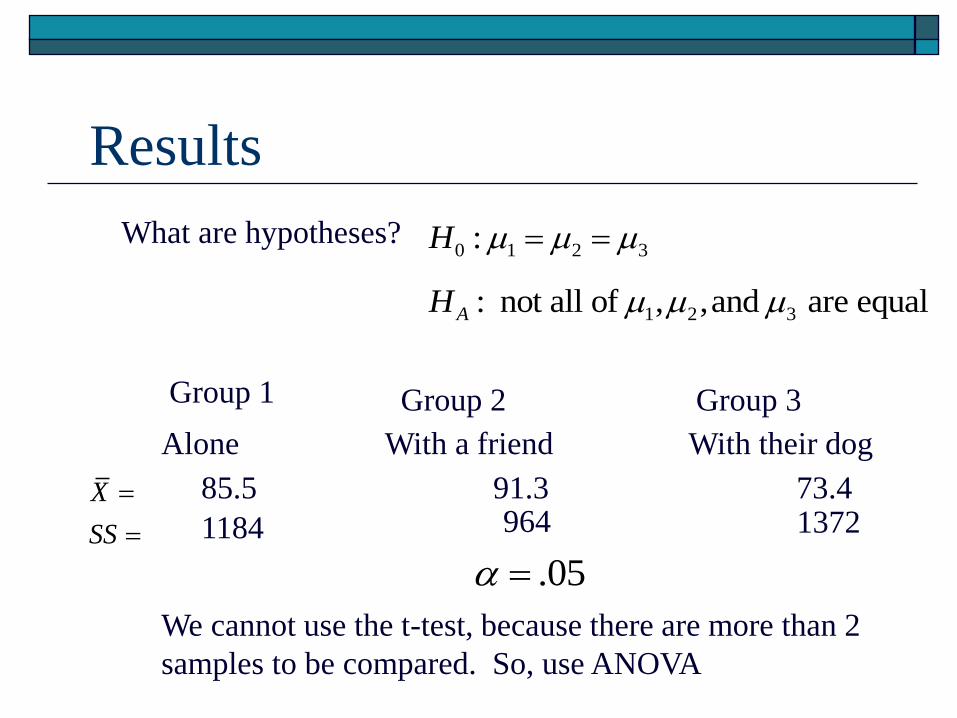
Results
Alone With a friend With their dog
Group 1 Group 2 Group 3
X
SS
85.5
1184
91.3 964
73.4 1372
What are hypotheses? 0 1 2 3:H
1 2 3: not all of , ,and are equalAH
.05
We cannot use the t-test, because there are more than 2
samples to be compared. So, use ANOVA

The ANOVA
Alone With a friend With their dog
Group 1 Group 2 Group 3
X
S
85.5
9.2
91.3 8.3
73.4 9.9
.05
F = 14.1
Between Group Variance = 1194
Within Group Variance = 84.9

Conclusion?
Is there evidence that the level of stress differs among
the experimental groups?
1. Determine correct df
2. Determine the critical F
3. Are the mean differences statistically significant?

ANOVA formulas: df
Total df = N – 1
Total = dfwithin + dfbetween
Within df = (n – 1) or = N – k
Total number of subjects – number of groups or levels
Between df = k – 1
Number of groups or levels - 1

ANOVA formulas: df
Total df = N – 1
Within df = (n – 1) or = N – k
Between df = k – 1 (where k = # grps or levels)
Total = dfwithin + dfbetween
Dog example: 45 people; 15 per condition
Total = 45 – 1 = 44
Within = (15-1)+(15-1)+(15-1) = 42
OR Within = 45 – 3 = 42
Between = 3 – 1 = 2
Total = 42 + 2 = 44
LOOK UP in table:
Between (numerator) and within (denominator) df

Critical F Table A.8 pp. 392-394
DF between
DF
wit
hin

t distribution for df = 18
F-ratios distribution for
df = 1, 18.
Notice that the critical
values for = .05 are t =
±2.101 and that F = 2.1012
= 4.41

Critical F Calculate between df and within df
Ex: between = 2, within = 42
Look up critical F
@ .05 = 3.23, @ .01 = 5.18
What is conclusion if: F (2, 42) = 14.1
Write-up
A one-way ANOVA was conducted to examine the effect of emotional support on heart rate. A significant difference in HR was found between the groups that dealt with a stressful event alone (M = 85.5, SD = 9.2), with a friend (M = 91.3, SD = 8.3), and with a dog (M = 73.4, SD = 9.9), F(2, 42) = 14.1, p < .01.

Anova: Definitional formulas
Between groups SS (sums of squares)
Sum of squared deviations from each group’s mean from grand mean multiplied by the number of Ss in group
Within groups SS
Sum of squared deviations of each score from group mean
Total SS
Sum of squared deviations of each score from the grand mean
])[( 2nMM Gg
2)( gMX
2)( GMX

ANOVA (theoretical) formulas: SS
Total SS =
= 46
Within SS =
= 16
Between SS =
= 30
SStotal = SSbetween + SSwithin
46 = 30 + 16
Temp Cond
1 2 3
0 4 1 X2=
1 3 2 106
3 6 2 G=30
1 3 0 N=15
0 4 0 k=3
T1=5 T2=20 T3=5 MG=2
SS1=6 SS2=6 SS3=4
n1=5 n2=5 n3=5
M1=1 M2=4 M3=1
])[( 2nMM Gg
2)( gMX
2)( GMX

ANOVA computational formulas:
Sum of Squares (SS)
Total SS: sum of squared deviations from grand mean
Within SS = SS = sum of squared deviations from grp mean
Between SS = sum of squared deviations of grp mean from
grand mean
SStotal = SSbetween + SSwithin
N
GXSSTOTAL
22
N
G
n
TSSbetween
22
Where G = grand (overall) sum of scores
Where N = total number of scores
Where T = sum of scores for group
Where n = number of scores in group
222 )()()(321 gggWithin MXMXMXSS

ANOVA formulas: SS
Total SS =
= 106 – 302/15 = 46
Within SS = SS
= 6 + 6 + 4 = 16
Between SS =
= 52/5 + 202/5 + 52/5 – 302/15
= 30
SStotal = SSbetween + SSwithin
46 = 30 + 16
N
GXSS
22
N
G
n
TSSbetween
22
Temp Cond
1 2 3
0 4 1 X2=
1 3 2 106
3 6 2 G=30
1 3 0 N=15
0 4 0 k=3
T1=5 T2=20 T3=5
SS1=6 SS2=6 SS3=4
n1=5 n2=5 n3=5
M1=1 M2=4 M3=1

ANOVA formulas
between
betweenbetween
df
SSMS
33.112
16withinMS
152
30betweenMS
within
withinwithin
df
SSMS
within
between
MS
MSF 28.11
33.1
15F

ANOVA summary table
Source df SS MS F
Between
Within
2
12
30
16
15
1.33
11.28*
Total 14 46
F (2, 12) = 11.28, p < .01
* Significant at .01 level
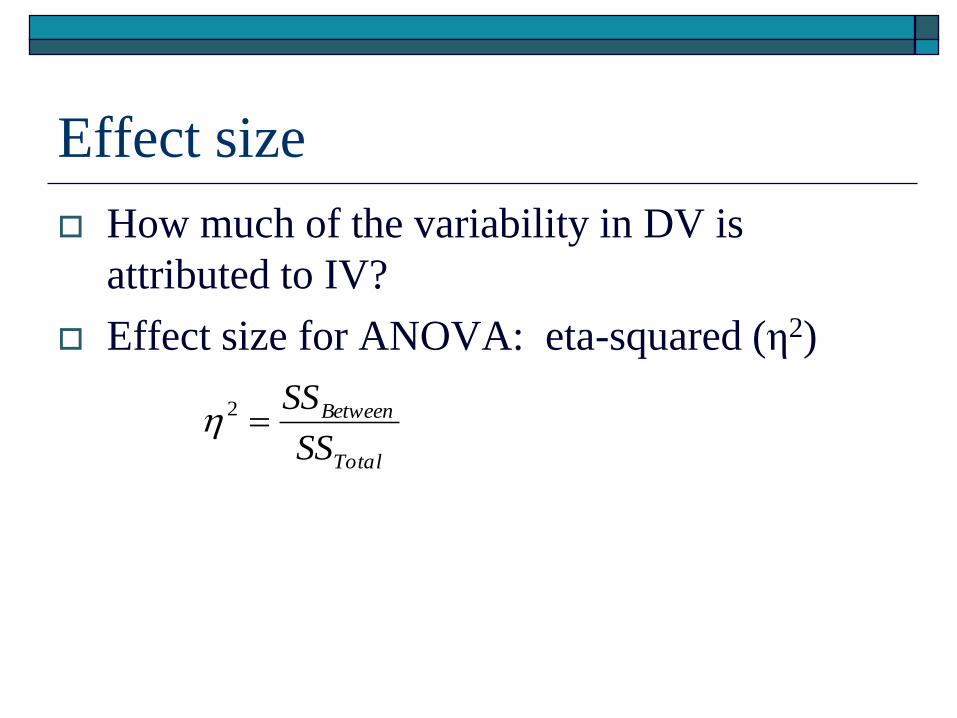
Effect size
How much of the variability in DV is
attributed to IV?
Effect size for ANOVA: eta-squared (η2)
Total
Between
SS
SS2

Post-hoc tests
If ANOVA result is significant…
How do you know which grps differ?
Need to do t-tests but reduce Type I error
Use Tukey’s HSD test
Pairwise comparisons while keeping same
alpha level