CHAPTER 3.5 AIR QUALITY - Welcome to NYC.gov | … for emissions from the heating, ventilation and...
27
161 st Street/River Avenue Rezoning EIS New York City Department of City Planning Air Quality Chapter 3.5 3.5-1 CHAPTER 3.5 AIR QUALITY INTRODUCTION The proposed Rezoning Action includes eleven projected and eleven potential development sites, which are shown on Figure 2.0-4. It would also alter land uses in the study area and allow residential use on some blocks where the existing zoning permits only commercial and industrial activity. Air quality, which is a general term used to describe pollutant levels in the atmosphere, would be affected by these changes. The air quality impacts that would be addressed in this analysis of the proposed Reasonable Worst Case Development Scenario (RWCDS) of the Rezoning Action are the: Potential for changes in vehicular travel associated with proposed development activities to result in significant mobile source (vehicular related) air quality impacts; Potential impacts from the exhaust of the proposed parking garage on nearby land uses; Potential for emissions from the heating, ventilation and air conditioning (HVAC) systems of the proposed development sites to significantly impact existing land uses; The potential for emissions from the HVAC systems of the proposed development sites to significantly impact other projected and potential development sites (project-on-project impacts); The potential combined impacts from HVAC emissions of proposed developments that are located close to one another (clusters) to significantly impact existing land uses and other proposed developments; The potential for significant air quality impacts from the emissions of “major” existing emission sources (i.e., HVAC systems with 20 or more million Btu/hr heat input) on the proposed residential developments located in areas that are being rezoned to allow new residential uses; and The potential for significant air quality impacts from air toxic emissions generated by nearby existing industrial sources on the proposed developments located in areas that are being rezoned to allow new residential uses. Air quality analyses were conducted, following the procedures outlined in the New York City Environmental Quality Review (CEQR) Technical Manual, to determine whether the proposed action would result in violations of ambient air quality standards or health-related guideline values. The methodologies and procedures utilized in these analyses are described below. POLLUTANTS OF CONCERN Criteria Pollutants The following air pollutants have been identified by the U.S. Environmental Protection Agency (EPA) as being of concern nationwide: carbon monoxide (CO), nitrogen dioxide (NO 2 ), ozone, particulate matter (PM 10 and PM 2.5 ), sulfur dioxide (SO 2 ), and lead. National Ambient Air Quality Standards (NAAQS) are concentrations set for each of the criteria pollutants specified by
Transcript of CHAPTER 3.5 AIR QUALITY - Welcome to NYC.gov | … for emissions from the heating, ventilation and...
161st Street/River Avenue Rezoning EIS New York City Department of City Planning
Air Quality Chapter 3.5 3.5-1
CHAPTER 3.5 AIR QUALITY
INTRODUCTION
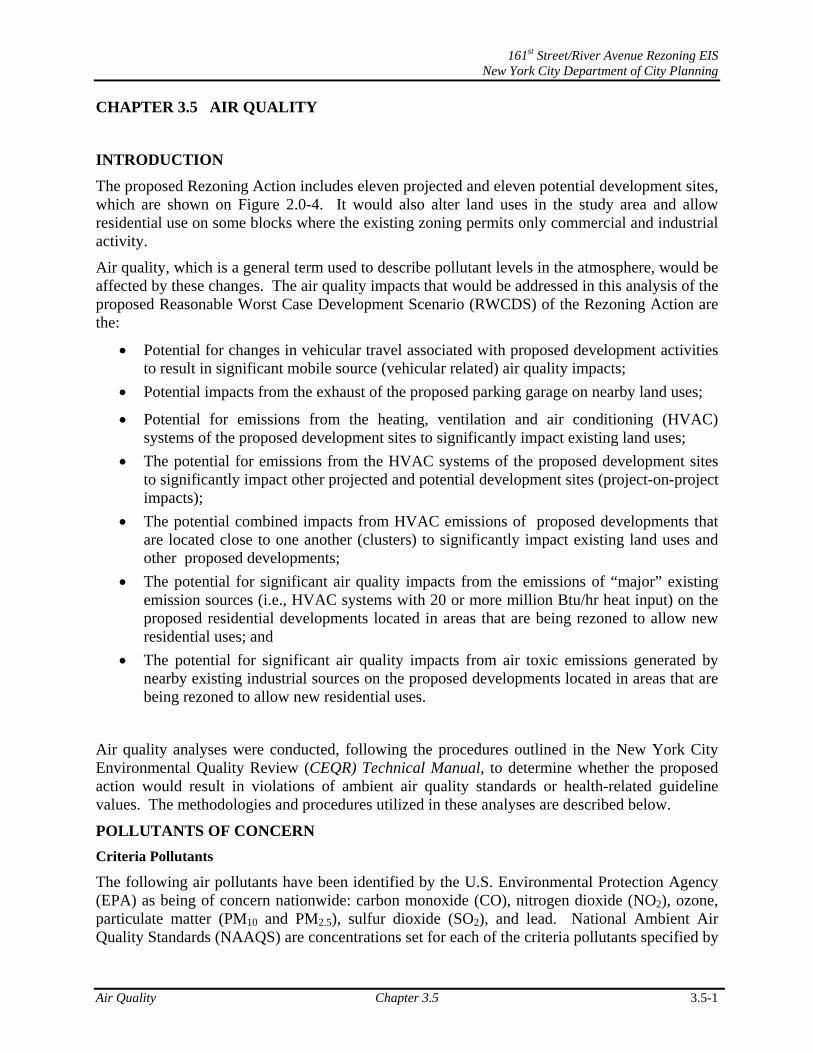
The proposed Rezoning Action includes eleven projected and eleven potential development sites, which are shown on Figure 2.0-4. It would also alter land uses in the study area and allow residential use on some blocks where the existing zoning permits only commercial and industrial activity.
Air quality, which is a general term used to describe pollutant levels in the atmosphere, would be affected by these changes. The air quality impacts that would be addressed in this analysis of the proposed Reasonable Worst Case Development Scenario (RWCDS) of the Rezoning Action are the:
Potential for changes in vehicular travel associated with proposed development activities to result in significant mobile source (vehicular related) air quality impacts;
Potential impacts from the exhaust of the proposed parking garage on nearby land uses;
Potential for emissions from the heating, ventilation and air conditioning (HVAC) systems of the proposed development sites to significantly impact existing land uses;
The potential for emissions from the HVAC systems of the proposed development sites to significantly impact other projected and potential development sites (project-on-project impacts);
The potential combined impacts from HVAC emissions of proposed developments that are located close to one another (clusters) to significantly impact existing land uses and other proposed developments;
The potential for significant air quality impacts from the emissions of “major” existing emission sources (i.e., HVAC systems with 20 or more million Btu/hr heat input) on the proposed residential developments located in areas that are being rezoned to allow new residential uses; and
The potential for significant air quality impacts from air toxic emissions generated by nearby existing industrial sources on the proposed developments located in areas that are being rezoned to allow new residential uses.
Air quality analyses were conducted, following the procedures outlined in the New York City Environmental Quality Review (CEQR) Technical Manual, to determine whether the proposed action would result in violations of ambient air quality standards or health-related guideline values. The methodologies and procedures utilized in these analyses are described below.
POLLUTANTS OF CONCERN
Criteria Pollutants
The following air pollutants have been identified by the U.S. Environmental Protection Agency (EPA) as being of concern nationwide: carbon monoxide (CO), nitrogen dioxide (NO2), ozone, particulate matter (PM10 and PM2.5), sulfur dioxide (SO2), and lead. National Ambient Air Quality Standards (NAAQS) are concentrations set for each of the criteria pollutants specified by
161st Street/River Avenue Rezoning EIS New York City Department of City Planning
Air Quality Chapter 3.5 3.5-2
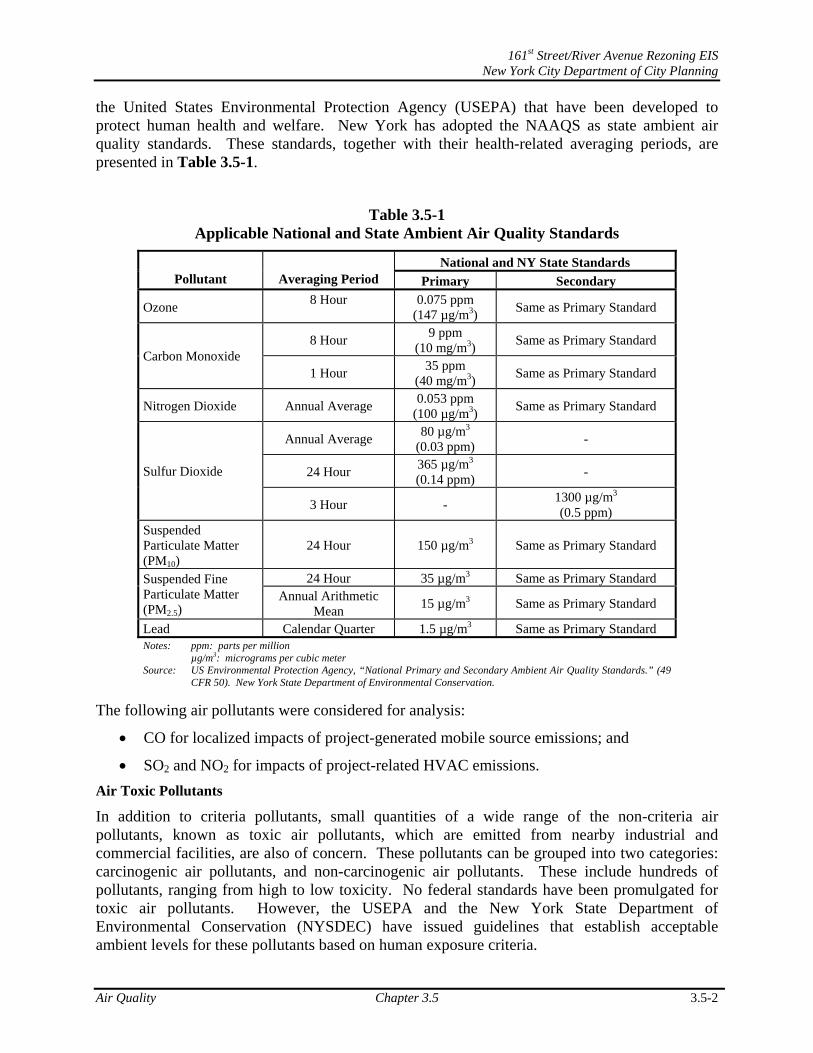
the United States Environmental Protection Agency (USEPA) that have been developed to protect human health and welfare. New York has adopted the NAAQS as state ambient air quality standards. These standards, together with their health-related averaging periods, are presented in Table 3.5-1.
Table 3.5-1 Applicable National and State Ambient Air Quality Standards
National and NY State Standards Pollutant Averaging Period Primary Secondary
Ozone 8 Hour
0.075 ppm
(147 µg/m3) Same as Primary Standard
8 Hour 9 ppm
(10 mg/m3) Same as Primary Standard
Carbon Monoxide 1 Hour
35 ppm (40 mg/m3)
Same as Primary Standard
Nitrogen Dioxide Annual Average 0.053 ppm
(100 µg/m3) Same as Primary Standard
Annual Average 80 µg/m3
(0.03 ppm) -
24 Hour 365 µg/m3 (0.14 ppm)
- Sulfur Dioxide
3 Hour - 1300 µg/m3 (0.5 ppm)
Suspended Particulate Matter (PM10)
24 Hour 150 µg/m3 Same as Primary Standard
24 Hour 35 µg/m3 Same as Primary Standard Suspended Fine Particulate Matter (PM2.5)
Annual Arithmetic Mean
15 µg/m3 Same as Primary Standard
Lead Calendar Quarter 1.5 µg/m3 Same as Primary Standard Notes: ppm: parts per million
µg/m3: micrograms per cubic meter Source: US Environmental Protection Agency, “National Primary and Secondary Ambient Air Quality Standards.” (49
CFR 50). New York State Department of Environmental Conservation.
The following air pollutants were considered for analysis:
CO for localized impacts of project-generated mobile source emissions; and
SO2 and NO2 for impacts of project-related HVAC emissions.
Air Toxic Pollutants
In addition to criteria pollutants, small quantities of a wide range of the non-criteria air pollutants, known as toxic air pollutants, which are emitted from nearby industrial and commercial facilities, are also of concern. These pollutants can be grouped into two categories: carcinogenic air pollutants, and non-carcinogenic air pollutants. These include hundreds of pollutants, ranging from high to low toxicity. No federal standards have been promulgated for toxic air pollutants. However, the USEPA and the New York State Department of Environmental Conservation (NYSDEC) have issued guidelines that establish acceptable ambient levels for these pollutants based on human exposure criteria.
161st Street/River Avenue Rezoning EIS New York City Department of City Planning
Air Quality Chapter 3.5 3.5-3
In order to evaluate short-term and annual impacts of carcinogenic and non-carcinogenic toxic air pollutants, the NYSDEC has established short-term guideline concentrations (SGCs) and annual guideline concentrations (AGCs) for exposure limits. These are maximum allowable 1-hour and annual guideline concentrations, respectively, that are considered acceptable concentrations below which there should be no adverse effects on the health of the general public. Based on SGCs and AGCs, USEPA also developed methodologies that can be used to estimate the potential impacts of air toxic pollutants from multiple emission sources. The "Hazard Index Approach" can be used to estimate the potential impacts of non-carcinogenic pollutants. If the combined ratio of estimated pollutant concentrations divided by the respective SGCs or AGCs value for each of the toxic pollutants is found to be less than 1, no significant air quality impacts are predicted to occur. Estimated overall incremental cancer risk should be compared with one-to-one million threshold established by USEPA to determine if significant air quality impacts are predicted.
3.5.1 MOBILE SOURCE ANALYSIS
Localized increases in pollutant levels may result from increased vehicular traffic volumes and changed traffic patterns in the study area as a consequence of the Proposed Action. According to the CEQR Technical Manual screening threshold criteria for this area of the City, if more than 100 vehicles project-generated vehicles pass through a signalized intersection in any given peak period there is a potential CO impacts and a detailed CO mobile source analysis is required. Additionally if more than 23 project-generated heavy duty diesel trucks (HDDV) or PM2.5
emission equivalents are generated through an arterial intersection, then a detailed PM2.5 analysis is required.
The trip generation conducted for the proposed residential development site indicates that the number of project-generated vehicles would be above CEQR CO screening threshold values during peak periods at affected intersections. Therefore, a detailed microscale modeling analysis was conducted that estimated CO levels near the intersections in the study area that are anticipated to be affected by the Proposed Action. Since the Proposed Action will generate primarily automobile traffic, a PM2.5 emission equivalency analysis was conducted. It was determined that project-generated automobile emissions were less than the CEQR screening threshold and therefore a detailed PM2.5 analysis is not required.
The project’s first year of operation (2018) was considered, and CO pollutant levels were estimated for Existing conditions and in for future 2018 conditions with and without the Proposed Action.
In order to select these analysis sites, traffic volumes, the traffic levels of service, and travel speeds at the major signalized intersections were evaluated with and without the Proposed Action. Analysis of the site selection was based on a screening analysis that was conducted using the CEQR Technical Manual screening threshold criteria to determine where the air quality levels would most greatly be affected by the Proposed Action. The screening analysis used total traffic volumes at intersections, changes associated with speeds, and project-generated trips from the traffic analysis to make the final determination on the analysis sites for all pollutants of concern in the microscale intersection analysis. The site selection process was conducted for both gameday and non-gameday conditions. Three intersections were selected for analysis – the intersection of 161st Street and River Avenue, the intersection of 161st Street and Grand
161st Street/River Avenue Rezoning EIS New York City Department of City Planning
Air Quality Chapter 3.5 3.5-4
Concourse and the intersection of 161st Street and Sheridan Avenue/Concourse Village West.
Receptors
The locations at which pollutant concentrations are estimated are known as “receptors.” Following guidelines established by the EPA, receptors were located where the maximum concentration is likely to occur and where the general public is likely to have access. For this analysis, receptors were distributed along sidewalks near the intersections selected for analysis.
Traffic Data
Traffic data for the air quality analysis were derived from traffic counts and other information developed as part of the traffic study analysis, using CEQR guidelines. Two scenarios were analyzed – a Gameday condition when traffic generated by Yankee Stadium is included in the traffic network and a Non-Gameday condition. Weekday AM, Midday and PM peak periods were considered as well as Saturday Midday conditions for non-Gameday conditions. The weekday PM and Saturday Midday peak hours were considered for Gameday conditions. These are the periods when the maximum changes in pollutant concentrations are expected based on overall traffic volumes and anticipated changes in traffic patterns.
The HCS+ software were used to develop the traffic data necessary for the air quality analysis. The vehicle classification was determined through field data collection. Existing vehicle speeds were obtained from field measurements for the area, and adjusted to estimate future free flow speeds.
Vehicle Classification Data
Vehicle classification data required to determine composite emission factors were based on traffic survey data for the following categories: light-duty gasoline vehicles (LDGVs), sport utility vehicles (SUVs), medallion taxis, light-duty trucks, heavy-duty trucks, and buses. Light-duty gasoline trucks were divided into four groups (LDGT1 LDGT2, LDGT3 and LDGT4) based on local registration data. Based upon current CEQR guidelines, SUVs were classified as light-duty gasoline trucks with 75 percent of emissions considered as LDGT1 and LDGT2, with the remaining 25 percent as LDGT3 and LDGT4. The split between LDGT1 and 2 and LDGT3 and 4 and heavy-duty gasoline vehicles (HDGVs) and heavy-duty diesel vehicles (HDDVs) was based on NYSDEC’s 2007 registration data in MOBILE 6 for each appropriate analysis year. All buses were analyzed using urban transit bus emission factors.
Vehicular Emissions
CO and PM2.5 emission factors were estimated using EPA’s MOBILE 6.2.03 (EPA420-R-03-010), the most current updated version of the mobile emission factor algorithm model. This version includes the effects of the new vehicle standards, vehicle turnover, and emission factors for particulate matter. The latest NYSDEC modeling inputs and assumptions were applied.
Analysis Years
Under the Reasonable Worse Case Development Scenario (RWCDS) the Proposed Action is expected to be fully implemented by 2018. The CO analysis was conducted for 2008 Existing conditions and for future 2018 conditions With and Without the Proposed Action for both the gameday and non-gameday conditions.
161st Street/River Avenue Rezoning EIS New York City Department of City Planning
Air Quality Chapter 3.5 3.5-5
Dispersion Analysis
Mobile source dispersion models are the basic analytical tools used to estimate pollutant concentrations from the emissions generated by motor vehicles as expected under given conditions of traffic, roadway geometry, and meteorology. CAL3QHC Version 2 is a line-source dispersion model that predicts pollutant concentrations near congested intersections and heavily traveled roadways. CAL3QHC input variables include free flow and calculated idle emission factors, roadway geometries, traffic volumes, site characteristics, background pollutant concentrations, signal timing, and meteorological conditions. CAL3QHC predicts inert pollutant concentrations, averaged over a one-hour period near roadways. This model was used to predict concentrations at the intersections.
CAL3QHC predicts peak one-hour pollutant concentrations using assumed meteorology and peak-period traffic conditions. Different emission rates occur when vehicles are stopped (idling), accelerating, decelerating, and moving at different average speeds. CAL3QHC simplifies these different emission rates into the following two components:
1. Emissions when vehicles are stopped (idling) during the red phase of a signalized intersection.
2. Emissions when vehicles are in motion during the green phase of a signalized intersection.
The analyses followed the EPA’s Intersection Modeling Guidelines (EPA-454/R-92-005) for CO modeling methodology and receptor placement. All major roadway segments (links) within approximately 1,000 feet from each analysis site (i.e., congested intersection) were considered.
Results
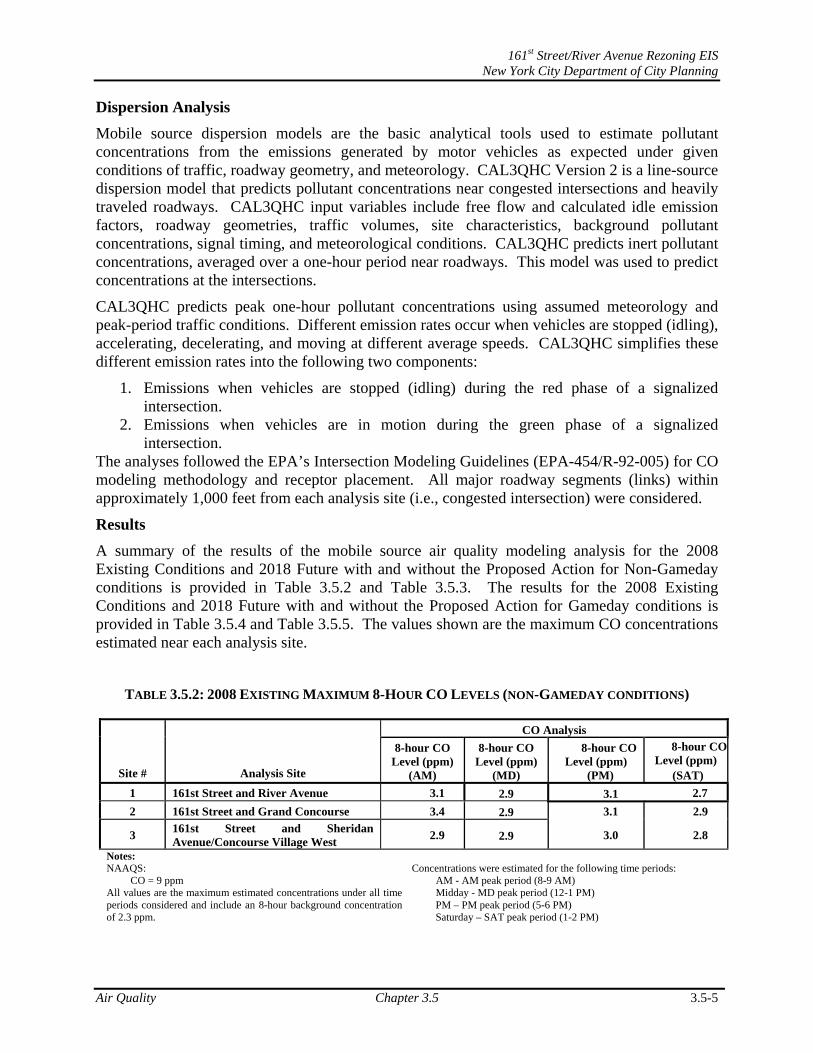
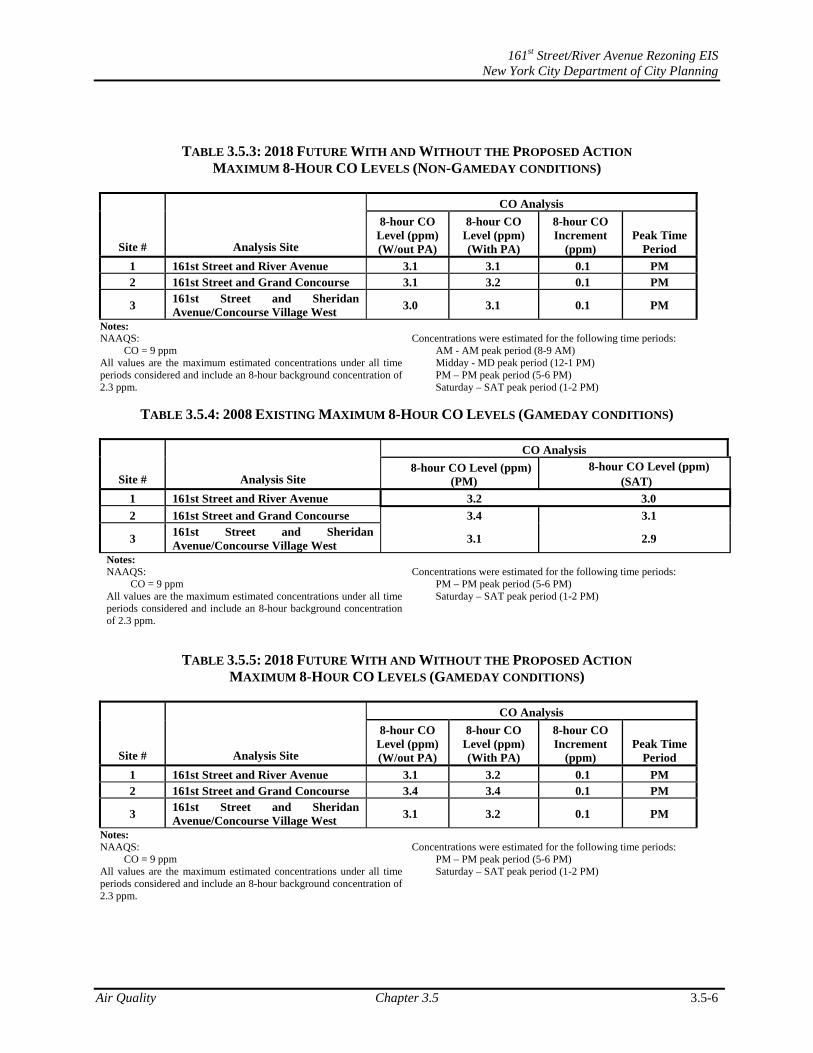
A summary of the results of the mobile source air quality modeling analysis for the 2008 Existing Conditions and 2018 Future with and without the Proposed Action for Non-Gameday conditions is provided in Table 3.5.2 and Table 3.5.3. The results for the 2008 Existing Conditions and 2018 Future with and without the Proposed Action for Gameday conditions is provided in Table 3.5.4 and Table 3.5.5. The values shown are the maximum CO concentrations estimated near each analysis site.
TABLE 3.5.2: 2008 EXISTING MAXIMUM 8-HOUR CO LEVELS (NON-GAMEDAY CONDITIONS)
CO Analysis
Site # Analysis Site
8-hour CO Level (ppm)
(AM)
8-hour CO Level (ppm)
(MD)
8-hour CO Level (ppm)
(PM)
8-hour CO Level (ppm)
(SAT)
1 161st Street and River Avenue 3.1 2.9 3.1 2.7
2 161st Street and Grand Concourse 3.4 2.9 3.1 2.9
3 161st Street and Sheridan Avenue/Concourse Village West
2.9 2.9 3.0 2.8
Notes: NAAQS: CO = 9 ppm All values are the maximum estimated concentrations under all time periods considered and include an 8-hour background concentration of 2.3 ppm.
Concentrations were estimated for the following time periods: AM - AM peak period (8-9 AM) Midday - MD peak period (12-1 PM) PM – PM peak period (5-6 PM) Saturday – SAT peak period (1-2 PM)
161st Street/River Avenue Rezoning EIS New York City Department of City Planning
Air Quality Chapter 3.5 3.5-6
TABLE 3.5.3: 2018 FUTURE WITH AND WITHOUT THE PROPOSED ACTION MAXIMUM 8-HOUR CO LEVELS (NON-GAMEDAY CONDITIONS)
CO Analysis
Site # Analysis Site
8-hour CO Level (ppm) (W/out PA)
8-hour CO Level (ppm) (With PA)
8-hour CO Increment
(ppm) Peak Time
Period
1 161st Street and River Avenue 3.1 3.1 0.1 PM 2 161st Street and Grand Concourse 3.1 3.2 0.1 PM
3 161st Street and Sheridan Avenue/Concourse Village West
3.0 3.1 0.1 PM
Notes: NAAQS: CO = 9 ppm All values are the maximum estimated concentrations under all time periods considered and include an 8-hour background concentration of 2.3 ppm.
Concentrations were estimated for the following time periods: AM - AM peak period (8-9 AM) Midday - MD peak period (12-1 PM) PM – PM peak period (5-6 PM) Saturday – SAT peak period (1-2 PM)
TABLE 3.5.4: 2008 EXISTING MAXIMUM 8-HOUR CO LEVELS (GAMEDAY CONDITIONS)
CO Analysis
Site # Analysis Site 8-hour CO Level (ppm)
(PM) 8-hour CO Level (ppm)
(SAT)
1 161st Street and River Avenue 3.2 3.0
2 161st Street and Grand Concourse 3.4 3.1
3 161st Street and Sheridan Avenue/Concourse Village West
3.1 2.9
Notes: NAAQS: CO = 9 ppm All values are the maximum estimated concentrations under all time periods considered and include an 8-hour background concentration of 2.3 ppm.
Concentrations were estimated for the following time periods: PM – PM peak period (5-6 PM) Saturday – SAT peak period (1-2 PM)
TABLE 3.5.5: 2018 FUTURE WITH AND WITHOUT THE PROPOSED ACTION MAXIMUM 8-HOUR CO LEVELS (GAMEDAY CONDITIONS)
CO Analysis
Site # Analysis Site
8-hour CO Level (ppm) (W/out PA)
8-hour CO Level (ppm) (With PA)
8-hour CO Increment
(ppm) Peak Time
Period
1 161st Street and River Avenue 3.1 3.2 0.1 PM 2 161st Street and Grand Concourse 3.4 3.4 0.1 PM
3 161st Street and Sheridan Avenue/Concourse Village West
3.1 3.2 0.1 PM
Notes: NAAQS: CO = 9 ppm All values are the maximum estimated concentrations under all time periods considered and include an 8-hour background concentration of 2.3 ppm.
Concentrations were estimated for the following time periods: PM – PM peak period (5-6 PM) Saturday – SAT peak period (1-2 PM)
161st Street/River Avenue Rezoning EIS New York City Department of City Planning
Air Quality Chapter 3.5 3.5-7
The results of the Gameday and Non-Gameday CO microscale analysis are summarized as follows:
1. CO levels would not exceed the 8-hour standard under Existing or future conditions.
2. The highest estimated 8-hour concentration (3.2 ppm) would occur at the intersection of 161st Street and Grand Concourse under the PM peak time period for Non-Gameday conditions under future (2018) Build conditions (see Table 3.5.3).
3. The highest estimated 8-hour concentration (3.4 ppm) would occur at the intersection of 161st Street and Grand Concourse under the PM peak time period for Gameday conditions under future (2018) Build conditions (see Table 3.5.5).
4. The DEP CO de minimis criteria would not be exceeded at any of the analysis sites under either the Gameday or the non-Gameday conditions, indicating that the Proposed Action would not have the potential to cause CO impacts that are considered to be significant.
5. A PM2.5 emission equivalency analysis was performed at the intersection of 161st Street and Sheridan Avenue/Concourse Village West which has the highest project-generated vehicular trips in 2018 under both the Gameday and Non-Gameday conditions in 2018. It was determined that PM2.5 emissions generated by the Proposed Action will be less than the HDDV emission equivalent threshold and therefore the Proposed Action would not cause increases above the 24-hour PM2.5 STV or the annual PM2.5 STV and would not result in any significant adverse impacts at any of the analysis sites based on both NYSDEC and NYCDEP criteria.
The result of this analysis is that the mobile source impacts of the Proposed Action would not significantly impact local air quality levels.
Garage Analysis For conservative purposes, this analysis assumes there will be a garage near Site 4 with 30,000 square feet floor area and 100 spaces, and that all 100 cars will be going in and out every hour over the peak 8-hour time period. Because the garage would be used almost exclusively by gasoline-powered automobiles and not diesel-fueled trucks, CO will be the only pollutant considered for this analysis. Potential PM10 and PM2.5 impacts were not considered because the concentrations of these pollutants would not be materially affected by the operation of this facility. Pollutants from the garage were assumed to be exhausted through one garage vent that cause pollutant levels to be elevated near the vent outside of the garage. For concentrations near the garage vent, the CO concentrations predicted within the garage were used to estimate concentrations near the facility. Estimates were performed following guidelines provided in the CEQR Technical Manual for a mechanically ventilated, enclosed garage. CO emission factors under different vehicles operating modes (cold/hot start/idle) for the future 2018 Build scenario were estimated using MOBILE 6.2.03 emission factors (i.e., idle emissions = 61.55 grams per hour; cold start emission factors at 5 mph = 19.12 grams per vehicle-mile, and hot stabilized emission factors at 5 mph = 6.695 grams per vehicle-mile). Maximum hourly CO emission rates within the facility were calculated for the PM time period with the maximum
161st Street/River Avenue Rezoning EIS New York City Department of City Planning
Air Quality Chapter 3.5 3.5-8
number of departing autos in an hour, since departing autos are assumed to be “cold” and arriving cars are assumed to be “hot” (“cold” autos emit CO at considerably higher rates than “hot” autos). Maximum hourly CO emission rates over a consecutive 8-hour period were computed for the 8-hour time period that averages the largest number of departing autos per hour. The maximum emission rate was determined based on the ins/outs for the 8-hour time period and the mean traveling distance within the garage. The analysis assumed that all departing autos would idle for one minute before traveling to the exits of the garage, and all arriving and departing autos would travel at 5 miles per hour within the garage.
Estimates of off-site CO impacts are based on EPA’s equation for dispersion of pollutants from a stack. The garage vents are converted into “virtual point sources” and the concentrations within the garage are used to estimate the initial dispersion at the garage vents. The initial horizontal and vertical distributions are assumed to be equal and calculated by setting CO concentration at the exit of the vent equal to the CO level within the facility. Eight-hour CO impacts are estimated at a receptor near the vent (i.e., 5 feet from the vent, 6 feet below the midpoint height of the vent) and at a receptor across a street on the far sidewalk from the vent (50 feet away, also 6 feet below the vent midpoint). Cumulative CO impacts on the near and far sidewalks adjacent to the garage vent were calculated by adding the impact from the garage exhaust to on-street sources, and background levels (2.3 ppm). The highest CO impact from on-street vehicular traffic that was estimated for the mobile source analysis (i.e., 1.15 ppm) was used.
A maximum total 8-hour CO concentration of 5.0 ppm was estimated at a receptor located 5 feet from the vent by adding the estimated garage impact and the background concentration; a maximum total 8-hour CO concentration of 4.5 ppm was estimated at the receptor located 50 feet from the vent by adding the garage impact, street traffic impacts, and the background concentration. The maximum total estimated 8-hour CO concentrations are therefore below the 8-hr CO NAAQS of 9.0 ppm.
The result of this analysis is that emissions from the proposed garage would not cause significant air quality impacts.
3.5.2 ANALYSIS OF HEATING SYSTEM EMISSIONS
Emission Sources Considered
Emissions from the HVAC systems of the projected and potential developments may affect air quality levels at nearby existing land uses as well as at the other projected and potential developments. The impact of these HVAC emissions would be a function of fuel type, stack height, building size (gross floor area), and location of each emission source relative to a sensitive land use.
The proposed developments are anticipated to be buildings that are from 45 feet to 305 feet tall, with total floor areas ranging from approximately 2,500 to 500,000 square feet.
The following information and assumptions were applied:
The size (gross floor area and height) and location (block and lot number) for each projected and potential development site under the proposed action were provided by the Department of City Planning (DCP).
The size and location of each existing building were determined using the New York City Open Accessible Space Information System Cooperative (OASIS) data base.
161st Street/River Avenue Rezoning EIS New York City Department of City Planning
Air Quality Chapter 3.5 3.5-9
Screening Level Analysis of Non-Adjacent Developments
Building-on-Building Impact Analysis
An analysis was conducted, using CEQR Technical Manual screening procedures, to determine whether the HVAC emissions of any of the projected and potential development sites that are not located adjacent to another development or are not part of a cluster would have the potential to significantly impact air quality levels at any of the other nearby projected and potential development sites (i.e., project-on-project impacts).
Each projected and potential development site was evaluated and all nearby projected or potential developments of similar or greater height were considered as potential sensitive receptor sites. If the distance from a projected and/or potential development to the nearest development of similar or greater height was less than the threshold distance provided in the CEQR Technical Manual nomograph, there is a potential for significant air quality impacts, and a detailed dispersion modeling analysis was conducted. Otherwise, the source passes the screening analysis, and no further analysis is required.
The maximum floor area of each of the projected and/or potential development site under RWCDS was used as input for the screening analysis. It was assumed that HVAC system of each development site would utilize a single stack with the height 3 feet above roof height (as per CEQR Technical Manual guidance). If a source did not pass the CEQR screen, detailed atmospheric dispersion analyses using EPA’s AERMOD model were conducted.
Impacts on Existing Land Uses
A screening level analysis was also conducted, using the same CEQR Technical Manual procedures, to determine the potential impacts of the HVAC emissions of any of the projected and potential development sites on existing sensitive land uses.
To conduct this analysis, a survey of existing land uses within 400 feet of the rezoning area was conducted using the New York City OASIS mapping network system to identify residential land uses and other sensitive receptor sites. The survey identified commercial and industrial establishments, 1 & 2 family homes, multi-family homes, and mixed use residential buildings.
The sensitive land uses considered in the screening analysis are residential buildings located on Blocks 2419, 2420, 2421, 2443, 2454, 2458, 2459, 2460, 2461, 2473, 2474, 2476, 2482, 2483, and 2484. These sensitive sites include 1 and 2 family homes as well as nearby multi-story mixed use buildings.
Methodology
The CEQR Technical Manual provides a nomographic procedure, based on the square footage and height of each building (provided that buildings are at least 30 feet apart), that was used to determine the threshold distance between each projected and/or potential non-adjacent development heated by oil or natural gas and a nearby building of similar or greater height. If more than one taller building is located near a shorter building, the potential impacts from the HVAC emissions of the shorter building on the closest taller building were considered.
161st Street/River Avenue Rezoning EIS New York City Department of City Planning
Air Quality Chapter 3.5 3.5-10
The following procedures were conducted:
Figures 3Q-5, 3Q-7 and 3Q-9 of the CEQR Technical Appendix were used to determine potential for significant SO2 (i.e., the critical pollutant for fuel oil) and NO2 (i.e., the critical pollutant for natural gas) impacts.
The estimated maximum size of each building was plotted on the nomograph against the distance to a potentially affected nearby taller building.
The threshold distance at which a potentially significant impact is likely to occur was estimated and compared to the actual distance between the shorter building and the nearest taller building.
If the distance between buildings was greater than the threshold distance indicated on the nomograph, no potentially significant impact is anticipated, and no detailed analysis was conducted.
If the distance was less than the threshold distance indicated on the nomograph, a potentially significant impact is possible, and a detailed dispersion modeling analysis was conducted.
Pollutants Considered
Screening level analyses were conducted using fuel oil and natural gas, with the critical pollutant for fuel oil being SO2 and the critical pollutant for natural being NO2. As SO2 emission rates are basically the same for Number 4 fuel oil and Number 2 fuel, analyses were conducted for Number 2 fuel oil and the results apply to Number 4 fuel oil as well.
Results
Non-Adjacent Building-on-Building Impacts
Six projected and potential developments under the RWCDS are non-adjacent sites that were considered in the building-on-building screening-level analysis.
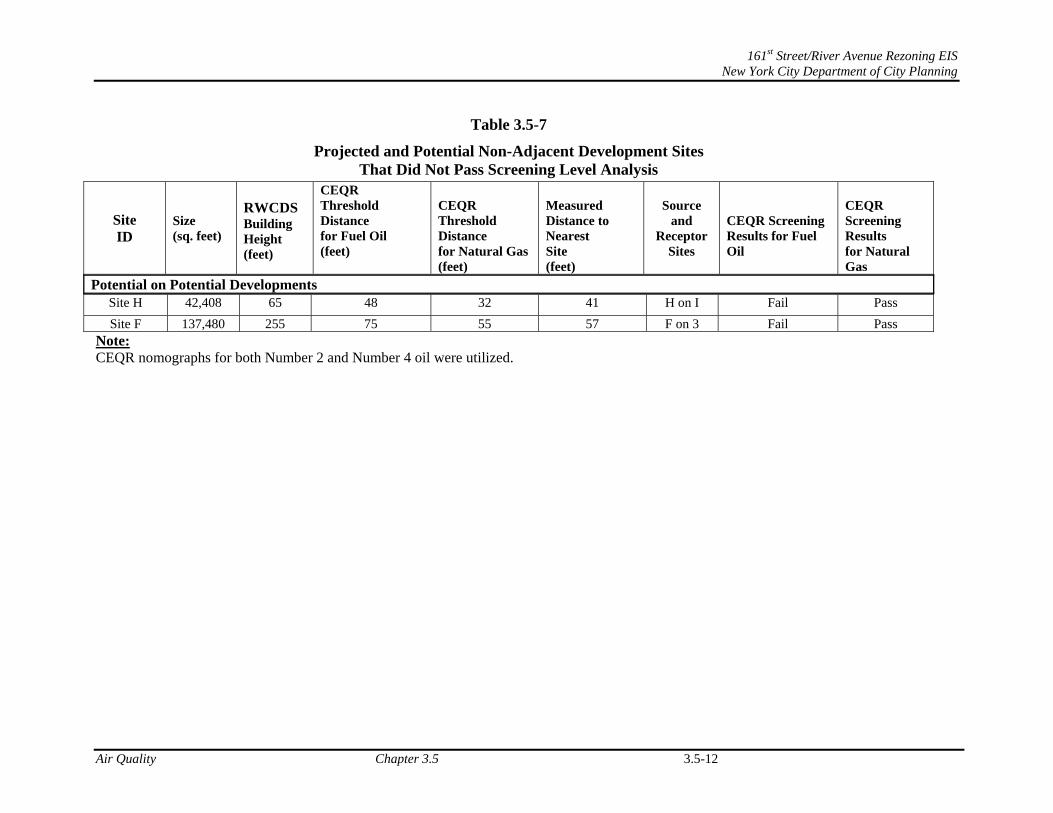
The potential impacts of Site F emissions on Site 3, which are not adjacent to each other, were evaluated as non-adjacent sites even though Site F is also adjacent to Site 2, and the results provided in Table 3.5-7. In addition, the potential impacts of emissions from Sites G, H, and I on Site 4 were all considered.
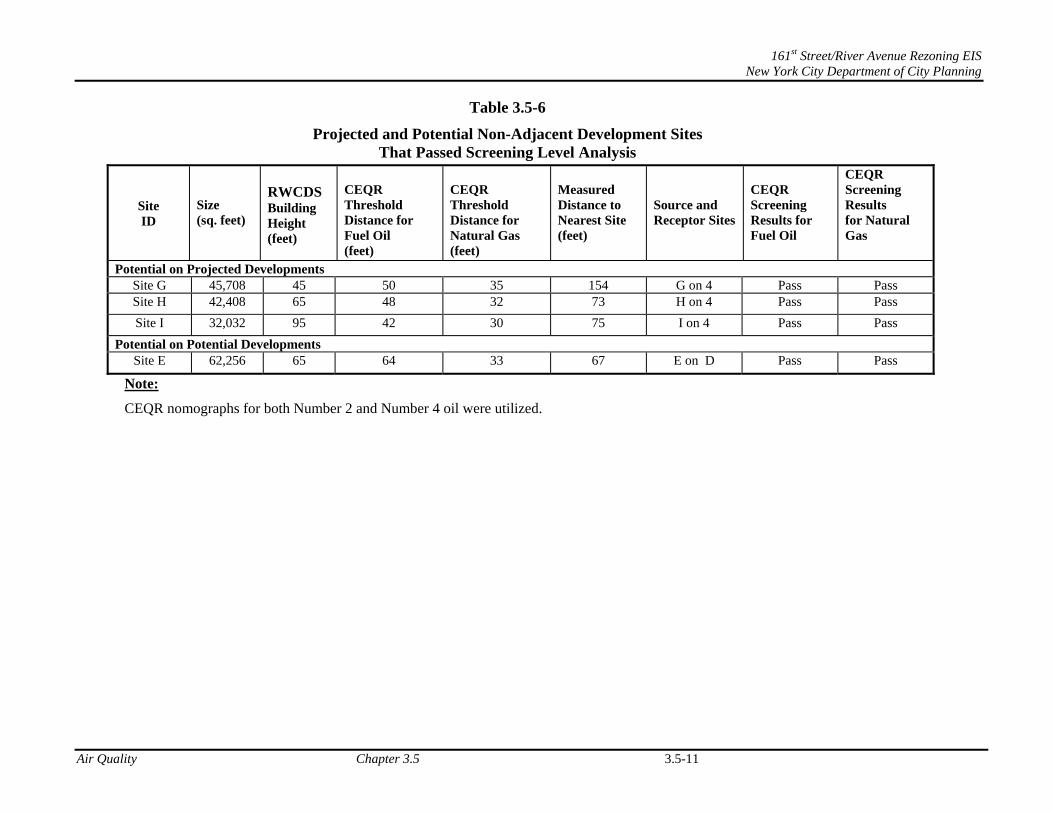
The results of the screening level analyses as well as the critical distance parameters used in these analyses, which are presented in Tables 3.5-6 and 3.5-7, are as follows:
All sites passed the screening level analysis using natural gas;
All sites, except Site H and F, passed the screening level analysis using fuel oil; and
Potential Development Site H with its potential impacts on Site I and Site F with its potential impacts on Site 3 did not pass the screening level analysis using fuel oil.
161st Street/River Avenue Rezoning EIS New York City Department of City Planning
Air Quality Chapter 3.5 3.5-11
Table 3.5-6
Projected and Potential Non-Adjacent Development Sites That Passed Screening Level Analysis
Site ID
Size (sq. feet)
RWCDS Building Height (feet)
CEQR Threshold Distance for Fuel Oil (feet)
CEQR Threshold Distance for Natural Gas (feet)
Measured Distance to Nearest Site (feet)
Source and Receptor Sites
CEQR Screening Results for Fuel Oil
CEQR Screening Results for Natural Gas
Potential on Projected Developments Site G 45,708 45 50 35 154 G on 4 Pass Pass Site H 42,408 65 48 32 73 H on 4 Pass Pass
Site I 32,032 95 42 30 75 I on 4 Pass Pass
Potential on Potential Developments Site E 62,256 65 64 33 67 E on D Pass Pass
Note:
CEQR nomographs for both Number 2 and Number 4 oil were utilized.
161st Street/River Avenue Rezoning EIS New York City Department of City Planning
Air Quality Chapter 3.5 3.5-12
Table 3.5-7
Projected and Potential Non-Adjacent Development Sites That Did Not Pass Screening Level Analysis
Site ID
Size (sq. feet)
RWCDS Building Height (feet)
CEQR Threshold Distance for Fuel Oil (feet)
CEQR Threshold Distance for Natural Gas (feet)
Measured Distance to Nearest Site (feet)
Source
and Receptor
Sites
CEQR Screening Results for Fuel Oil
CEQR Screening Results for Natural Gas
Potential on Potential Developments Site H 42,408 65 48 32 41 H on I Fail Pass
Site F 137,480 255 75 55 57 F on 3 Fail Pass Note: CEQR nomographs for both Number 2 and Number 4 oil were utilized.
161st Street/River Avenue Rezoning EIS New York City Department of City Planning
Air Quality Chapter 3.5 3.5-13
Impacts on Existing Land Uses
The results of screening level analyses is that, with the following exceptions, all existing residential buildings within 400 feet of the rezoning area are shorter than the proposed development sites. As such, the potential impacts on these shorter buildings are not considered to be significant. The exceptions are:
An existing 25-story building located on Block 2443 (Lot 170) that is taller than Projected Development Site 4, which is located on the same Block;
An existing 7-story building located on Block 2460 (Lots 10 and 30) that is taller than Potential Development Site G, which is located on same block (Lot 25).
The distance between Development Site 5 and the existing nearby taller building exceeds the estimated screening threshold distance and therefore the potential HVAC emission impacts of this development are not anticipated to be significant. However, because Development Sites 4 and G are attached to nearby existing buildings, these developments require detailed analysis to determine whether the potential impacts of these developments are significant.
Detailed Dispersion Analyses
Analyses Conducted
Detailed dispersion analyses, using the EPA AERMOD model, were conducted for:
The one non-adjacent development site (Site H) that did not pass the screening-level analysis for building-on-building impacts;
Development sites that are adjacent to other development sites, including Site F (that is adjacent to Site 2), which did not pass the screening-level analysis on non-adjacent Site 3; and
The two development sites (Sites 4 and G) that are attached to the existing buildings.
The rezoning area includes development sites that are immediately adjacent to one another that are zoned to have the same (or approximately the same) building heights. Because CEQR Technical Manual screening procedures are not applicable to buildings located than less than 30 feet apart, the potential impacts of the HVAC emissions from these buildings were estimated using detailed dispersion analyses.
Pollutants Considered
The maximum 24-hr SO2 and the annual NO2 impacts represent the critical pollutants and time period for determining potential project impacts. As such, SO2 analyses were conducted for fuel oil and NO2 analyses were conducted for natural gas.
Methodology
Dispersion Model
AERMOD is a steady-state plume model applicable in rural and urban areas, in flat and complex terrain, for surface and elevated releases, and for multiple emission sources (including point, area, and volume sources). It can be used to calculate pollutant concentrations from one or more points (e.g., exhaust stacks) based on hourly meteorological data, and has the capability of
161st Street/River Avenue Rezoning EIS New York City Department of City Planning
Air Quality Chapter 3.5 3.5-14
calculating pollutant concentrations in a cavity region and at locations where the plume from the exhaust stack is affected by the aerodynamic wakes and eddies (downwash) produced by nearby structures.
Regulatory default options of the AERMOD model were used. Following CEQR guidelines, analyses were conducted assuming stack tip downwash, urban dispersion and surface roughness length, with and without building downwash, and the elimination of calms. The AERMOD downwash algorithm was utilized to estimate the potential affects of the multiple building structures on the plume dispersion. While analyses were conducted with and without the consideration of downwash effects on plume dispersion (i.e., affects caused by wind flow obstructions around buildings), these maximum values were all estimated and reported as a results of direct plume impacts (i.e., without plume downwash).
Emission Rates
Emission rates were estimated as follows:
A fuel consumption rate for each site was estimated using fuel factors presented in the CEQR Technical Manual, Appendix 7.
These fuel factors, which are 0.38 gallons per square foot per year for Number 2 fuel oil and 52.8 cubic feet per square foot per year for natural gas for the New York City, were multiplied by the square footage of each site to estimate the total number of gallons (or cubic feet) of fuel consumed by that building annually.
It was assumed that all fuel is consumed in a 100 day (2,400 hour) heating season.
Average annual peak period pollutant emission rates were estimated, as recommended in the CEQR Technical Manual, by dividing the total amount of pollution estimated to be emitted in a year by 8760 hours.
Emission factors for pollutants of concern were obtained from USEPA’s “Compilation of Air Pollutant Emission Factors” (AP-42) for fuel oil with sulfur content of 0.2 percent and natural gas.
Stack Parameters
Stack heights, building sizes (square footages and heights), fuel consumption rates, and estimated pollutant emission rates used in these analyses are provided in the Technical Appendix. It was assumed that emissions from each development site would be released through a single stack located at the edge of the roof closest to the nearest taller building. The minimum distance between sites was estimated from lot line to lot line.
The following stack parameters, which were developed using the NYCDEP “CA Permit” database and the rated heat input (in MMBtus per hour) of the heating systems, were used:
Boilers (as being from 1 to 5 MMBtu/hr) = 0.5 foot (0.15 meter) diameter Exit velocities = 3.9 m/sec. Stack exit temperatures = 300oF (423oK).
Meteorological Data
Analyses were conducted using five consecutive years of meteorological data (2002-2006). Surface data were obtained from La Guardia Airport and upper air data were obtained from
161st Street/River Avenue Rezoning EIS New York City Department of City Planning
Air Quality Chapter 3.5 3.5-15
Brookhaven station, New York. These meteorological data provide hour-by-hour wind speeds and directions, stability states, and temperature inversion elevations over the 5-year period. Data were developed using the EPA AERMET processor. The land use around the site was classified using defined categories to determine surface parameters used by the AERMET program.
Receptor Locations
Source-receptor configurations (stack diameters, plume rise and dispersion, and stack proximity to the receptors) were considered in selecting receptor sites. In order to determine receptor locations where the maximum impacts would occur when stack is closed to the receptors, the test was conducted where receptors were placed on the façade of impacted development site directly under the plume centerline at the stack height and then above and below stack height in 0.1 meter increments. It was determined that the highest impacts occur at the height that is 0.3 meter higher then the stack height.
For the analysis of existing land uses, receptors were placed on the nearby existing buildings at the levels of the stacks of the development sites (i.e., where the highest impacts are likely to occur). If a stack on a proposed development site was taller than an existing building, receptors were placed at the level of the top floor of the existing building.
Background Values
Background concentrations (i.e., pollutant levels from other sources in the study area) for the pollutants of concern were obtained from monitoring data collected by the NYSDEC in 2006, the latest year of compiled data. Background data for SO2 and NO2 from Bronx monitoring station IS52 were used. The second highest 24-hr SO2 background concentration of 134 ug/m3 was added to the 1st highest AERMOD-predicted SO2 impact and resulting total 24-hr SO2 concentration was compared with appropriate 24-hr SO2 NAAQS of 365 ug/m3. Similarly, the annual background NO2 concentration of 56 ug/m3, from the same monitoring station, was added to predicted annual impacts, and the resulting total annual NO2 concentrations were compared with annual NO2 NAAQS of 100 ug/m3.
Results
Non-Adjacent Development Sites - Building-on-Building Impact Analysis
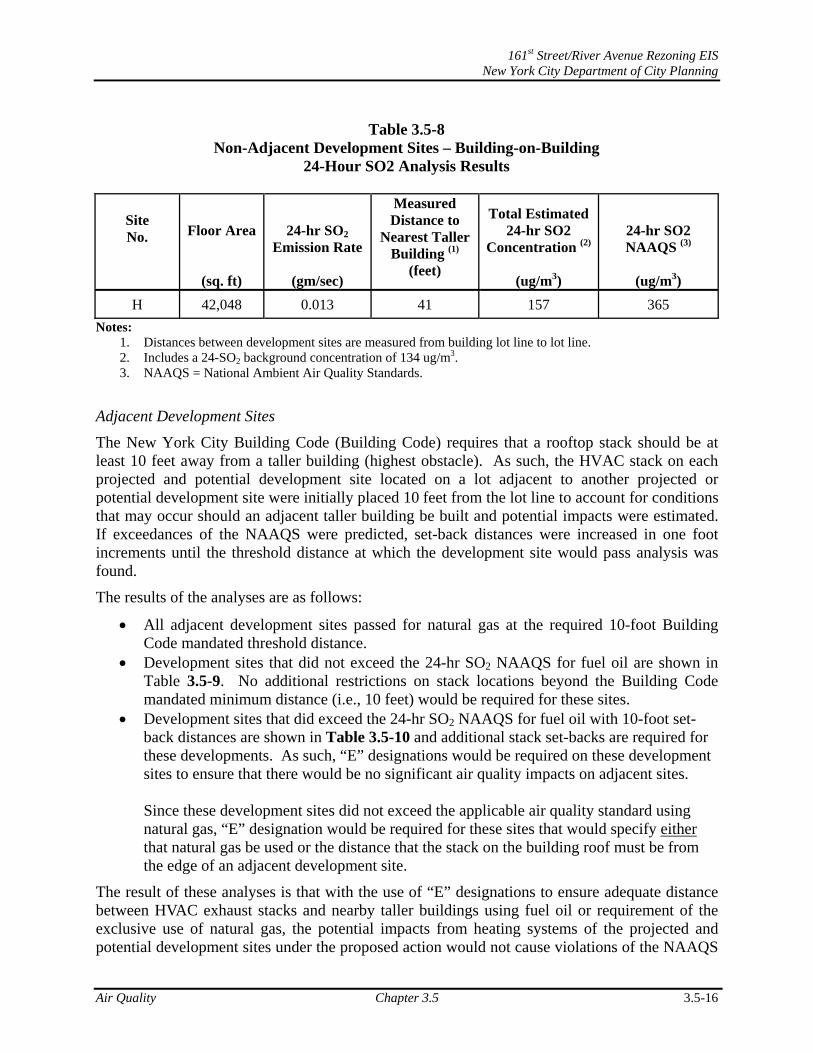
Detailed dispersion modeling analysis was conducted for the one potential development site that did not pass CEQR screening analysis – Development Site H with its potential impact on Development Site I. The result of this analysis for SO2, which are shown in Table 3.5-8, is that no exceedances of the 24-SO2 NAAQS are predicted as a result of non-adjacent building-on-building impact analysis using fuel oil. No exceedances of the annual NO2 NAAQS are also predicted as a result of non-adjacent building-on-building impact analysis using natural gas.
161st Street/River Avenue Rezoning EIS New York City Department of City Planning
Air Quality Chapter 3.5 3.5-16
Table 3.5-8 Non-Adjacent Development Sites – Building-on-Building
24-Hour SO2 Analysis Results
Site No.
Floor Area
(sq. ft)
24-hr SO2
Emission Rate
(gm/sec)
Measured Distance to
Nearest Taller Building (1)
(feet)
Total Estimated 24-hr SO2
Concentration (2)
(ug/m3)
24-hr SO2 NAAQS (3)
(ug/m3)
H 42,048 0.013 41 157 365
Notes: 1. Distances between development sites are measured from building lot line to lot line. 2. Includes a 24-SO2 background concentration of 134 ug/m3. 3. NAAQS = National Ambient Air Quality Standards.
Adjacent Development Sites
The New York City Building Code (Building Code) requires that a rooftop stack should be at least 10 feet away from a taller building (highest obstacle). As such, the HVAC stack on each projected and potential development site located on a lot adjacent to another projected or potential development site were initially placed 10 feet from the lot line to account for conditions that may occur should an adjacent taller building be built and potential impacts were estimated. If exceedances of the NAAQS were predicted, set-back distances were increased in one foot increments until the threshold distance at which the development site would pass analysis was found.
The results of the analyses are as follows:
All adjacent development sites passed for natural gas at the required 10-foot Building Code mandated threshold distance.
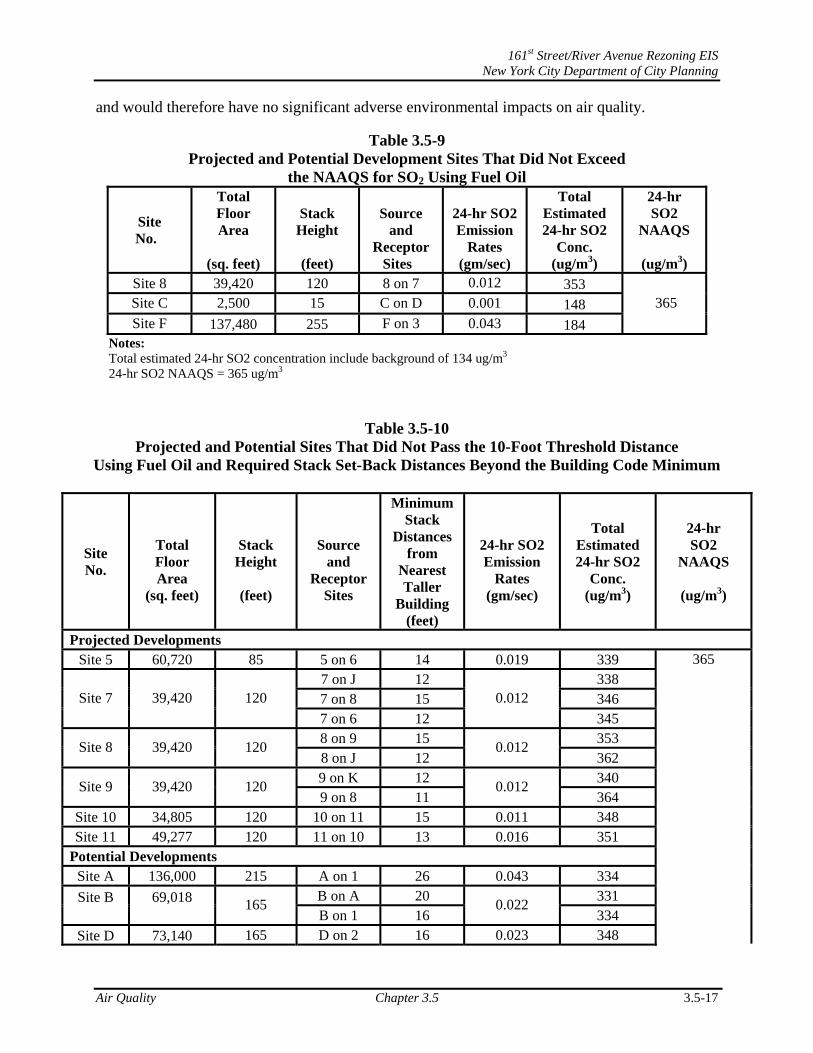
Development sites that did not exceed the 24-hr SO2 NAAQS for fuel oil are shown in Table 3.5-9. No additional restrictions on stack locations beyond the Building Code mandated minimum distance (i.e., 10 feet) would be required for these sites.
Development sites that did exceed the 24-hr SO2 NAAQS for fuel oil with 10-foot set-back distances are shown in Table 3.5-10 and additional stack set-backs are required for these developments. As such, “E” designations would be required on these development sites to ensure that there would be no significant air quality impacts on adjacent sites. Since these development sites did not exceed the applicable air quality standard using natural gas, “E” designation would be required for these sites that would specify either that natural gas be used or the distance that the stack on the building roof must be from the edge of an adjacent development site.
The result of these analyses is that with the use of “E” designations to ensure adequate distance between HVAC exhaust stacks and nearby taller buildings using fuel oil or requirement of the exclusive use of natural gas, the potential impacts from heating systems of the projected and potential development sites under the proposed action would not cause violations of the NAAQS
161st Street/River Avenue Rezoning EIS New York City Department of City Planning
Air Quality Chapter 3.5 3.5-17
and would therefore have no significant adverse environmental impacts on air quality.
Table 3.5-9 Projected and Potential Development Sites That Did Not Exceed
the NAAQS for SO2 Using Fuel Oil
Site No.
Total Floor Area
(sq. feet)
Stack Height
(feet)
Source and
Receptor Sites
24-hr SO2 Emission
Rates (gm/sec)
Total Estimated 24-hr SO2
Conc. (ug/m3)
24-hr SO2
NAAQS
(ug/m3) Site 8 39,420 120 8 on 7 0.012 353 Site C 2,500 15 C on D 0.001 148 Site F 137,480 255 F on 3 0.043 184
365
Notes: Total estimated 24-hr SO2 concentration include background of 134 ug/m3 24-hr SO2 NAAQS = 365 ug/m3
Table 3.5-10 Projected and Potential Sites That Did Not Pass the 10-Foot Threshold Distance
Using Fuel Oil and Required Stack Set-Back Distances Beyond the Building Code Minimum
Site No.
Total Floor Area
(sq. feet)
Stack
Height
(feet)
Source and
Receptor Sites
Minimum Stack
Distances from
Nearest Taller
Building (feet)
24-hr SO2 Emission
Rates (gm/sec)
Total Estimated 24-hr SO2
Conc. (ug/m3)
24-hr SO2
NAAQS
(ug/m3)
Projected Developments Site 5 60,720 85 5 on 6 14 0.019 339
7 on J 12 338 7 on 8 15 346
Site 7
39,420 120
7 on 6 12
0.012
345 8 on 9 15 353
Site 8 39,420 120 8 on J 12
0.012 362
9 on K 12 340 Site 9 39,420 120
9 on 8 11 0.012
364 Site 10 34,805 120 10 on 11 15 0.011 348 Site 11 49,277 120 11 on 10 13 0.016 351
Potential Developments Site A 136,000 215 A on 1 26 0.043 334
B on A 20 331 Site B
69,018
165 B on 1 16
0.022 334
Site D 73,140 165 D on 2 16 0.023 348
365
161st Street/River Avenue Rezoning EIS New York City Department of City Planning
Air Quality Chapter 3.5 3.5-18
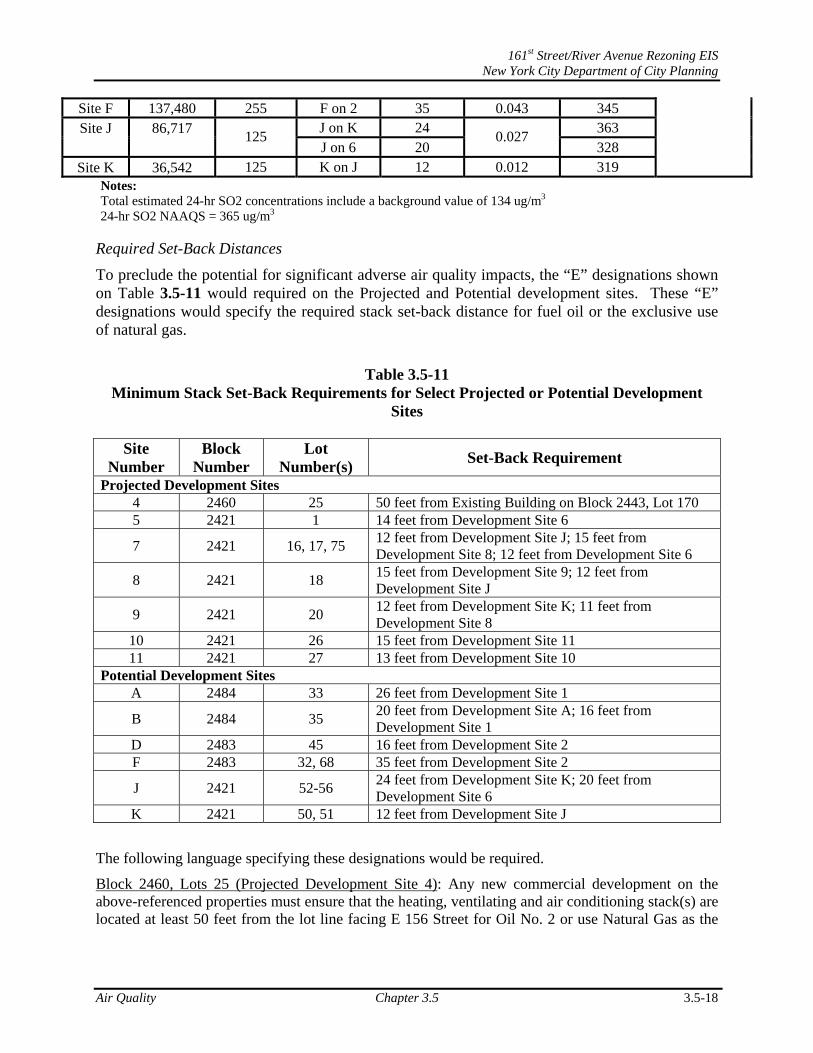
Site F 137,480 255 F on 2 35 0.043 345 J on K 24 363 Site J
86,717
125
J on 6 20 0.027
328 Site K 36,542 125 K on J 12 0.012 319
Notes: Total estimated 24-hr SO2 concentrations include a background value of 134 ug/m3 24-hr SO2 NAAQS = 365 ug/m3
Required Set-Back Distances
To preclude the potential for significant adverse air quality impacts, the “E” designations shown on Table 3.5-11 would required on the Projected and Potential development sites. These “E” designations would specify the required stack set-back distance for fuel oil or the exclusive use of natural gas.
Table 3.5-11
Minimum Stack Set-Back Requirements for Select Projected or Potential Development Sites
Site
Number Block
Number Lot
Number(s) Set-Back Requirement
Projected Development Sites 4 2460 25 50 feet from Existing Building on Block 2443, Lot 170 5 2421 1 14 feet from Development Site 6
7 2421 16, 17, 75 12 feet from Development Site J; 15 feet from Development Site 8; 12 feet from Development Site 6
8 2421 18 15 feet from Development Site 9; 12 feet from Development Site J
9 2421 20 12 feet from Development Site K; 11 feet from Development Site 8
10 2421 26 15 feet from Development Site 11 11 2421 27 13 feet from Development Site 10
Potential Development Sites A 2484 33 26 feet from Development Site 1
B 2484 35 20 feet from Development Site A; 16 feet from Development Site 1
D 2483 45 16 feet from Development Site 2 F 2483 32, 68 35 feet from Development Site 2
J 2421 52-56 24 feet from Development Site K; 20 feet from Development Site 6
K 2421 50, 51 12 feet from Development Site J
The following language specifying these designations would be required.
Block 2460, Lots 25 (Projected Development Site 4): Any new commercial development on the above-referenced properties must ensure that the heating, ventilating and air conditioning stack(s) are located at least 50 feet from the lot line facing E 156 Street for Oil No. 2 or use Natural Gas as the
161st Street/River Avenue Rezoning EIS New York City Department of City Planning
Air Quality Chapter 3.5 3.5-19
type of fuel for space heating and hot water (HVAC) systems, to avoid any potential significant adverse air quality impacts.
Block 2421, Lot 1 (Projected Development Site 5): Any new residential and/or commercial development on the above-referenced properties must ensure that the heating, ventilating and air conditioning stack(s) are located at least 14 feet from the lot line facing Park Avenue for Oil No. 2 or use Natural Gas as the type of fuel for space heating and hot water (HVAC) systems, to avoid any potential significant adverse air quality impacts.
Block 2421, Lots 16, 17, 75 (Projected Development Site 7): Any new residential and/or commercial development on the above-referenced properties must ensure that the heating, ventilating and air conditioning stack(s) are located at least 12 feet from the lot line facing E 161 Street, at least 15 feet the lot line facing Teller Avenue, and at least 12 feet the lot line facing Morris Avenue for Oil No. 2 or use Natural Gas as the type of fuel for space heating and hot water (HVAC) systems, to avoid any potential significant adverse air quality impacts.
Block 2421, Lots 18 (Projected Development Site 8): Any new residential and/or commercial development on the above-referenced properties must ensure that the heating, ventilating and air conditioning stack(s) are located at least 15 feet from the lot line facing Teller Avenue and at least 12 feet from the lot line facing E 161 Street for Oil No. 2 or use Natural Gas as the type of fuel for space heating and hot water (HVAC) systems, to avoid any potential significant adverse air quality impacts.
Block 2421, Lots 20 (Projected Development Site 9): Any new residential and/or commercial development on the above-referenced properties must ensure that the heating, ventilating and air conditioning stack(s) are located at least 12 feet from the lot line facing E 161 Street and at least 11 feet from the lot line facing Morris Avenue for Oil No. 2 or use Natural Gas as the type of fuel for space heating and hot water (HVAC) systems, to avoid any potential significant adverse air quality impacts.
Block 2421, Lot 26 (Projected Development Site 10): Any new residential and/or commercial development on the above-referenced properties must ensure that the heating, ventilating and air conditioning stack(s) are located at least 15 feet from the lot line facing Teller Avenue for Oil No. 2 or use Natural Gas as the type of fuel for space heating and hot water (HVAC) systems, to avoid any potential significant adverse air quality impacts.
Block 2421, Lot 27 (Projected Development Site 11): Any new residential and/or commercial development on the above-referenced properties must ensure that the heating, ventilating and air conditioning stack(s) are located at least 13 feet from the lot line facing Morris Avenue for Oil No. 2 or use Natural Gas as the type of fuel for space heating and hot water (HVAC) systems, to avoid any potential significant adverse air quality impacts.
Block 2484, Lot 33 (Potential Development Site A): Any new residential and/or commercial development on the above-referenced properties must ensure that the heating, ventilating and air conditioning stack(s) are located at least 26 feet from the lot line facing River Avenue for Oil No. 2 or use Natural Gas as the type of fuel for space heating and hot water (HVAC) systems, to avoid any potential significant adverse air quality impacts.
Block 2484, Lot 35 (Potential Development Site B): Any new commercial development on the above-referenced properties must ensure that the heating, ventilating and air conditioning stack(s) are located at least 20 feet from the lot line facing E 162 Street and at least 16 feet from the lot line facing River Avenue for Oil No. 2 or use Natural Gas as the type of fuel for space heating and hot water (HVAC) systems, to avoid any potential significant adverse air quality impacts.
161st Street/River Avenue Rezoning EIS New York City Department of City Planning
Air Quality Chapter 3.5 3.5-20
Block 2483, Lot 45 (Potential Development Site D): Any new commercial development on the above-referenced properties must ensure that the heating, ventilating and air conditioning stack(s) are located at least 16 feet from the lot line facing River Avenue for Oil No. 2 or use Natural Gas as the type of fuel for space heating and hot water (HVAC) systems, to avoid any potential significant adverse air quality impacts.
Block 2483, Lots 32, 68 (Potential Development Site F): Any new residential and/or commercial development on the above-referenced properties must ensure that the heating, ventilating and air conditioning stack(s) are located at least 35 feet from the lot line facing E 161 Street for Oil No. 2 or use Natural Gas as the type of fuel for space heating and hot water (HVAC) systems, to avoid any potential significant adverse air quality impacts.
Block 2421, Lots 52 through 56 (Potential Development Site J): Any new residential and/or commercial development on the above-referenced properties must ensure that the heating, ventilating and air conditioning stack(s) are located at least 24 feet from the lot line facing Park Avenue and at least 20 feet from the lot line facing Morris Avenue for Oil No. 2 or use Natural Gas as the type of fuel for space heating and hot water (HVAC) systems, to avoid any potential significant adverse air quality impacts.
Block 2421, Lots 50, 51 (Potential Development Site K): Any new residential and/or commercial development on the above-referenced properties must ensure that the heating, ventilating and air conditioning stack(s) are located at least 12 feet from the lot line facing Morris Avenue for Oil No. 2 or use Natural Gas as the type of fuel for space heating and hot water (HVAC) systems, to avoid any potential significant adverse air quality impacts.
With “E” designations, the potential impacts from projected and potential development sites heating systems would not exceed the applicable NAAQS and would have no potential significant adverse environmental impacts on air quality.
Impacts on Existing Land Uses
Projected Development Site 4 and Potential Development Site G were evaluated in the detailed analysis. Projected Development Site 4, which has a floor area of 528,216 square feet, has the potential to significant impact an adjacent existing building on Lot 170. A detailed analysis was conducted to determine the required stack set-back distance for this development site. The distance that the stack on this development site roof must be from the edge of an adjacent building in Lot 170 was estimated to be 50 feet. At this distance, the estimated maximum 24-hr SO2 impact of 353 ug/m3, which is below the NAAQS. To preclude the potential for significant adverse air quality impacts of the HVAC emissions from Development Site 4 on existing land uses, an “E” Designation should be placed on this site with the requirement of a minimum stack offset distance of 50 feet (see Table 3.5-7).
Development G, which has a floor area of 45,708 square feet, passes the Building Code 10-foot threshold distance requirement with a total maximum estimated 24-hr SO2 concentration of 352 ug/m3, which is below NAAQS. Therefore, this Development Site, which would have to comply with Building Code, would require no additional restrictions on stack location for its HVAC systems.
With “E” designations, the potential impacts from projected and potential development sites heating systems would not exceed the applicable NAAQS and would have no potential significant adverse
161st Street/River Avenue Rezoning EIS New York City Department of City Planning
Air Quality Chapter 3.5 3.5-21
environmental impacts on air quality.
Cluster Analysis
The proposed action could result in projected and potential developments with approximately the same building heights that are located in close proximity to one another. Therefore, in addition to estimating the potential impacts of the HVAC emissions of these development sites individually, emissions from these development sites were also considered as “clusters” of emission sources.
As the potential impacts of these development sites clusters could not be evaluated using CEQR Technical Manual screening procedures, the impacts of the HVAC systems emissions of these clusters were estimated using the detailed analyses. The cluster analysis was performed in the same manner described for the non-adjacent development sites, except that analysis was conducted using a single representative stack located in the approximate geographic center of each cluster as the emission source. Impacts of the cluster emissions on nearby projected/potential development sites and existing residential land uses were estimated.
The potential impacts of the following two clusters of the HVAC emissions were evaluated:
Cluster # 1: Projected Development Site 7 (Block 2421, Lot 16, 17, 75), Site 8 (Block 2421, Lot 18), Site 9 (Block 2421, Lot 20), with a total floor area of 241,519 square feet and representative stack height of 120 feet; and
Cluster # 2: Potential Development Site J (Block 2421, Lot 52 through 56), Site K (Block 2421, Lot 50, 51), and Site 6 (Block 2421, Lot 57) with total floor area of 164,759 square feet and representative stack height of 125 feet.
The results of the cluster analysis impacts on other nearby proposed development sites and existing sensitive land uses is that the maximum 24-hr SO2 impacts of combined emissions from these HVAC clusters using fuel oil would not cause an exceedance of a NAAQS. The result of this analysis, therefore, is that no exceedances of the NAAQS for all applicable pollutants are predicted as a result of clusters impacts.
Impacts from “Major” Existing Emission Sources
Following CEQR Technical Manual guidelines, a survey of land uses and building heights was conducted to determine whether there are any existing “major” sources of boiler emissions (i.e., emissions from boiler facilities with heat inputs 20 million Btu per hour or greater) located within 1,000 feet of the proposed residential Development Sites. The result of this survey is that no such emission sources were identified and therefore no further analysis is required.
An additional examination was conducted to determine if there is any “large” combustion emission source (e.g., power plant, co-generation facility, etc.) located within 1,000 feet of any of the projected and potential Development Sites. The result of this survey is that no large boiler emission sources are located within 1,000 feet of the proposed developments and therefore no further analysis is required.
161st Street/River Avenue Rezoning EIS New York City Department of City Planning
Air Quality Chapter 3.5 3.5-22
3.5.3 HEALTH RISK ASSESSMENT OF TOXIC AIR EMISSIONS FROM EXISTING INDUSTRIAL SOURCES
Introduction
The proposed action would allow development of residential uses within existing manufacturing and industrial zones. As such, emissions of toxic pollutants from the operation of existing industrial emission sources might affect proposed residential uses.
An analysis was therefore conducted to determine whether the impacts of these emissions would be significant. Data necessary to perform this analysis, which include facility type, source identification and location, pollutant emission rates, and exhaust stack parameters, were obtained from regulatory agencies (e.g., from existing air permits). All existing industrial facilities located within 400 feet of the rezoning area that are permitted to exhaust toxic pollutants were considered in this analysis.
Data Sources Information regarding emissions of toxic air pollutants from existing industrial sources was obtained from New York State and New York City databases as follows:
The boundaries of the rezoning area were used to identify the extent of the study area for determining air quality impacts associated with the Proposed Action. All permitted industrial toxic air pollutant emission sources located within a 400-foot radius of each projected and potential development site were included in this analysis.
New York State Department of Environmental Conservation (NYSDEC’s) DAR-1 software, which includes a database with information on all facilities in the state that have an air quality permit (as of 1996), was searched to identify facilities located within the area that had received the current state air quality permits.
The New York City Open Accessible Space Information System Cooperative (OASIS) data base, which is an interactive mapping and data analysis application, was used to identify existing industrial uses located within the analysis area;
A search was performed to identify NYSDEC Title V permits and permits listed in the EPA Envirofacts database.
Air permits for active (currently permitted) industrial facilities within the analysis area that are included in the New York City Department of Environmental Protection (NYCDEP) Clean Air Tracking System database were acquired and reviewed to obtain pollutant emission rates and stack parameters. The data on these permits, which include source locations, stack parameters, pollutant emission rates, etc., are considered to be the most current and served as the primary basis of data for this analysis. This information was compiled into DAR-1 software format for use in the following analyses.
Health Risk Assessment Methodology Toxic air pollutants can be grouped into two categories: carcinogenic air pollutants, and non-carcinogenic air pollutants. These include hundreds of pollutants, ranging from high to low toxicity. While no federal standards have been promulgated for toxic air pollutants, EPA and NYSDEC have issued guidelines that establish acceptable ambient levels for these pollutants based on human exposure criteria.
161st Street/River Avenue Rezoning EIS New York City Department of City Planning
Air Quality Chapter 3.5 3.5-23
In order to evaluate short-term and annual impacts of non-carcinogenic toxic air pollutants, the NYSDEC has established short-term guideline concentrations (SGCs) and annual guideline concentrations (AGCs) for exposure limits. These are maximum allowable 1-hour and annual guideline concentrations, respectively, that are considered acceptable concentrations below which there should be no adverse effects on the health of the general public.
Based on SGCs and AGCs, EPA has developed methodologies that can be used to estimate the potential impacts of air toxic pollutants from multiple emission sources. The "Hazard Index Approach" can be used to estimate the potential impacts of non-carcinogenic pollutants. If the sum of the combined ratios of estimated pollutant concentrations divided by the respective SGCs or AGCs value for each of the toxic pollutants is found to be less than 1, no significant air quality impact is predicted to occur.
For carcinogenic pollutants, unit risk factors based on the toxicity of each pollutant are used. EPA does not consider an overall incremental cancer risk from a proposed action of less than one-in-one million to be significant. Using these factors, the potential cancer risk associated with each carcinogenic pollutant, as well as the total cancer risk of the releases of all of the carcinogenic toxic pollutants combined, can be estimated. If the total incremental cancer risk of all of the carcinogenic toxic pollutants combined is less than one-in-one million, no significant air quality impacts are predicted to occur due to these pollutant releases.
These methods are based on equations that use EPA health risk information (established for individual compounds with known health effects) to determine the level of health risk posed by an increased ambient concentration of that compound at a potentially sensitive receptor. The derived health risk values are additive and can be used to determine the total risk posed by the release of multiple air contaminants.
Non-Carcinogens
Public health risk estimates for inhalation of non-carcinogenic compounds are based on the following calculation:
Hazard Index = C/AGCs Where:
C = annual average ambient air concentration of compound in µg/m3 AGCs = NYSDEC annual guideline concentration is an equivalent to reference dose concentrations RfC, established by the EPA, in µg/m3.
Once the hazard index of each compound is established, they are summed together. If the total hazard index is less than or equal to one, then the non-carcinogenic risk is considered to be insignificant.
Carcinogens
Public health risk estimates for inhalation of carcinogenic compounds are based on the following calculation:
Incremental Risk = C x URF Where:
C = annual average ambient air concentration of the compound in µg/m3 URF = compound-specific inhalation unit risk factor in (µg/m3)-1
Once the incremental risk of each compound is established, they are summed together. If the
161st Street/River Avenue Rezoning EIS New York City Department of City Planning
Air Quality Chapter 3.5 3.5-24
total risk is less than or equal to one-in-one million (1.0 E-06), the carcinogenic risk is considered to be insignificant.
Dispersion Analyses Dispersion analyses were conducted using EPA’s Hazard Index Approach for non-carcinogenic pollutants and EPA’s Unit Risk Factors for carcinogenic pollutants to determine the potential of the toxic emissions released from the permitted emission sources to adversely affect the new residential areas. NYCDEC DAR-1 database and modeling software (modified version of the SCREEN model and enhanced version of USEPA’s ISCLT2 model) was employed to estimate maximum cumulative short-term (1-hour) and annual impacts for each air toxic pollutant and determine whether facilities have the potential to exceed short-term or annual guidelines values (i.e., SGCs or AGCs). The refined analysis with ISCLT2 model was used to estimate the maximum concentrations of each pollutant compared to that pollutant’s SGC and/or AGC, and the total hazard index and incremental cancer risk associated with all pollutants combined.
Emission sources for the dispersion analysis were located using geographical information system (GIS) software and the Universal Transverse Mercator coordinate system with appropriate projection information (Datum NAD83, UTM Zone 18).
The dispersion analysis was performed by modeling the emissions of all identified toxic air pollutants from the existing industrial facilities in one modeling run. The estimated ambient concentrations of each air toxic pollutant were then compared with the guideline concentrations established by the NYSDEC and EPA and contained in the DAR-1 database.
Two types of the analyses were conducted – an analysis of non-carcinogenic pollutants (where the results were compared to the total Hazard Index of 1.0), and an analysis of the carcinogenic pollutants (where the results were compared to the EPA threshold level of one per million).
Industrial Source Emissions Analysis Twelve current industrial source permits in five addresses were identified as existing facilities located within a 400-foot radius of the rezoning area. One of the facilities - Eric Cook at 198 East 161 Street (Permit # PA 054595) - is located on same block and lot (Block 2443, Lot 94) as Projected Development Site 4 and, therefore, was eliminated from further consideration. Analyses, therefore, were conducted for the eleven remaining active permitted facilities, which identify the release of six (6) toxic non-carcinogenic air pollutants and two carcinogens (PERC and trichloroethylene).
In the permits, some of the air toxic contaminants were registered as compound groups (e.g., hydrocarbons). Because there are no guideline concentrations for these compound groups, it was necessary to use a substitute contaminant that was representative of the compound group, so that a comparison to the guidelines could be made for the analysis. In these instances, the type of source operation was considered when making these assumptions.
Results of the Cancer Risk and Hazard Index Evaluation
Non-Carcinogens
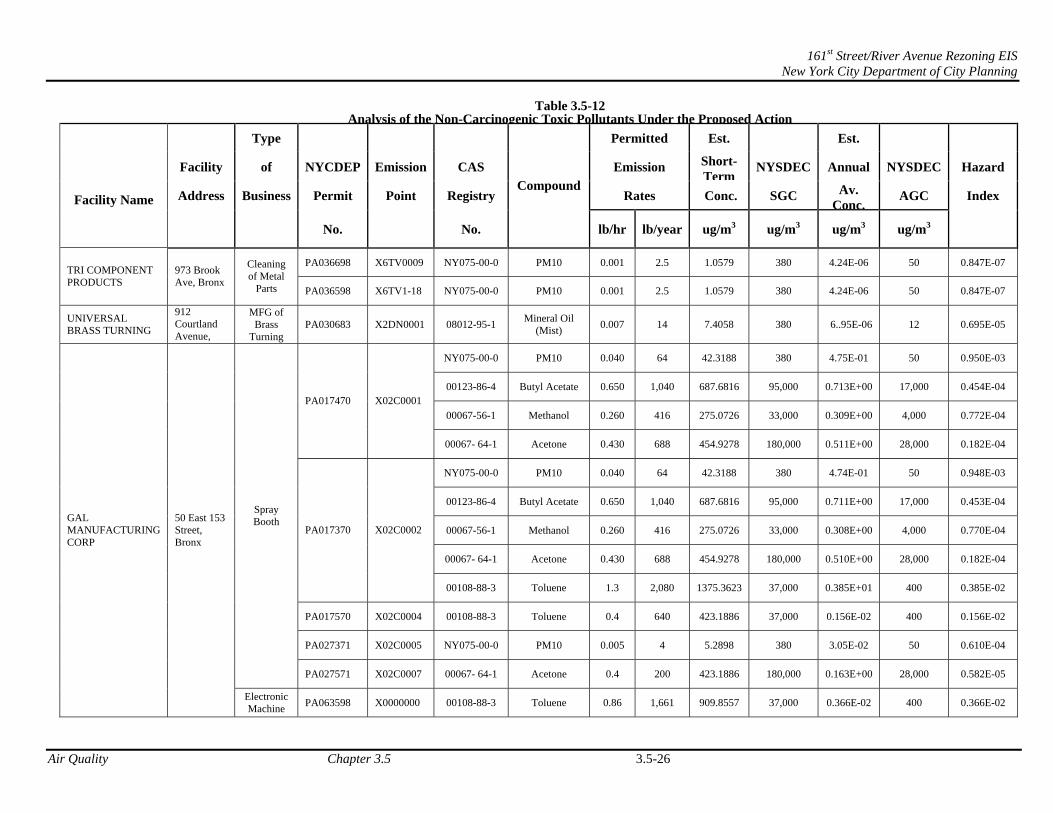
Table 3.5-12, entitled “Analysis of the Non-Carcinogenic Toxic Pollutants under the Proposed Action,” lists the identified facilities that emit non-carcinogenic pollutants together with the type and location of each facility and its permit number, emission point(s), contaminant name, and CAS registry number. Also provided are the respective pollutant guidelines values, estimated pollutant concentrations (short-term and long-term), and hazard indexes. As shown on this table,
161st Street/River Avenue Rezoning EIS New York City Department of City Planning
Air Quality Chapter 3.5 3.5-25
the maximum estimated concentrations for each non-carcinogenic toxic contaminant are below the NYSDEC short-term guideline concentrations (SGCs) and annual guideline concentrations (AGCs). In addition, the total hazard index caused by the non-carcinogenic pollutants emitted from all of the sources combined is estimated to be 0.112 x 10⁻¹ under the Proposed Action. This value is below the level (1.0) that is considered by EPA to be significant.
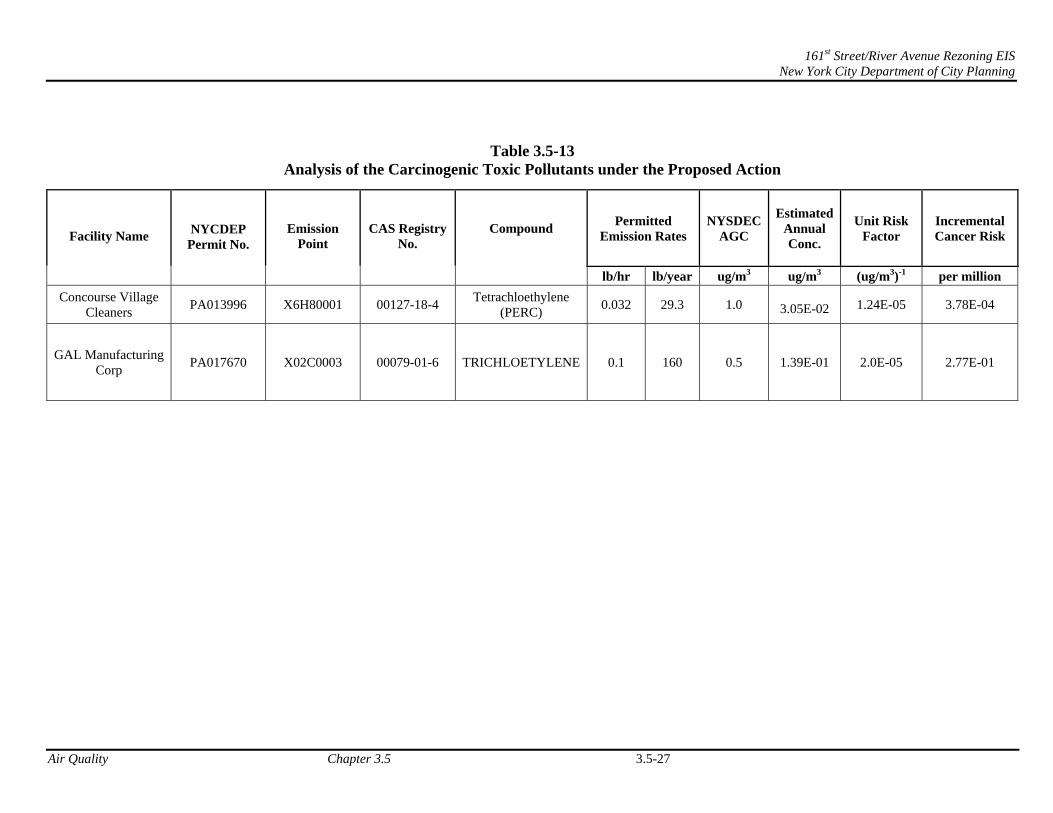
Carcinogens
Table 3.5-13, entitled “Analysis of the Carcinogenic Toxic Pollutants under the Proposed Action,” lists the identified facilities that emit carcinogenic pollutants together with the type and location of each facility and its permit number, emission point(s), contaminant name, and CAS registry number. Also provided are the estimated annual concentrations, unit risk factors, and incremental cancer risks. As shown on this table, the maximum total estimated incremental cancer risk caused by carcinogenic pollutants emitted from all of the sources combined is estimated to be 2.78 x10⁻¹ per million under the Proposed Action. This value is below the level of one per million that is considered by EPA to be significant.
Summary of Results The result of this analysis is that no exceedance of either the NYSDEC SGC or AGC acceptable limits or EPA’s incremental risk threshold limit is predicted.
161st Street/River Avenue Rezoning EIS New York City Department of City Planning
Air Quality Chapter 3.5 3.5-26
Table 3.5-12Analysis of the Non-Carcinogenic Toxic Pollutants Under the Proposed Action
Type Permitted Est. Est.
Facility of NYCDEP Emission CAS Emission Short-Term
NYSDEC Annual NYSDEC Hazard
Address Business Permit Point Registry Rates Conc. SGC Av. Conc.
AGC Index Facility Name
No. No.
Compound
lb/hr lb/year ug/m3 ug/m3 ug/m3 ug/m3
PA036698 X6TV0009 NY075-00-0 PM10 0.001 2.5 1.0579 380 4.24E-06 50 0.847E-07 TRI COMPONENT PRODUCTS
973 Brook Ave, Bronx
Cleaning of Metal
Parts PA036598 X6TV1-18 NY075-00-0 PM10 0.001 2.5 1.0579 380 4.24E-06 50 0.847E-07
UNIVERSAL BRASS TURNING
912 Courtland Avenue,
MFG of Brass
Turning PA030683 X2DN0001 08012-95-1
Mineral Oil (Mist)
0.007 14 7.4058 380 6..95E-06 12 0.695E-05
NY075-00-0 PM10 0.040 64 42.3188 380 4.75E-01 50 0.950E-03
00123-86-4 Butyl Acetate 0.650 1,040 687.6816 95,000 0.713E+00 17,000 0.454E-04
00067-56-1 Methanol 0.260 416 275.0726 33,000 0.309E+00 4,000 0.772E-04 PA017470 X02C0001
00067- 64-1 Acetone 0.430 688 454.9278 180,000 0.511E+00 28,000 0.182E-04
NY075-00-0 PM10 0.040 64 42.3188 380 4.74E-01 50 0.948E-03
00123-86-4 Butyl Acetate 0.650 1,040 687.6816 95,000 0.711E+00 17,000 0.453E-04
00067-56-1 Methanol 0.260 416 275.0726 33,000 0.308E+00 4,000 0.770E-04
00067- 64-1 Acetone 0.430 688 454.9278 180,000 0.510E+00 28,000 0.182E-04
PA017370 X02C0002
00108-88-3 Toluene 1.3 2,080 1375.3623 37,000 0.385E+01 400 0.385E-02
PA017570 X02C0004 00108-88-3 Toluene 0.4 640 423.1886 37,000 0.156E-02 400 0.156E-02
PA027371 X02C0005 NY075-00-0 PM10 0.005 4 5.2898 380 3.05E-02 50 0.610E-04
Spray Booth
PA027571 X02C0007 00067- 64-1 Acetone 0.4 200 423.1886 180,000 0.163E+00 28,000 0.582E-05
GAL MANUFACTURING CORP
50 East 153 Street, Bronx
Electronic Machine
PA063598 X0000000 00108-88-3 Toluene 0.86 1,661 909.8557 37,000 0.366E-02 400 0.366E-02
161st Street/River Avenue Rezoning EIS New York City Department of City Planning
Air Quality Chapter 3.5 3.5-27
Table 3.5-13 Analysis of the Carcinogenic Toxic Pollutants under the Proposed Action
Facility Name
NYCDEP Permit No.
Emission
Point
CAS Registry
No. Compound
Permitted Emission Rates
NYSDECAGC
Estimated Annual Conc.
Unit Risk Factor
Incremental Cancer Risk
lb/hr lb/year ug/m3 ug/m3 (ug/m3)-1 per million
Concourse Village Cleaners
PA013996 X6H80001 00127-18-4 Tetrachloethylene
(PERC) 0.032 29.3 1.0
3.05E-02 1.24E-05 3.78E-04
GAL Manufacturing Corp
PA017670
X02C0003
00079-01-6 TRICHLOETYLENE 0.1 160 0.5 1.39E-01 2.0E-05 2.77E-01