CHAPTER 11: AIR QUALITY - FEIS - nyc.gov
32
11-1 Rheingold Rezoning D F EIS CHAPTER 11: AIR QUALITY A. INTRODUCTION The Proposed Action, under the Reasonable Worst-Case Development Scenario (RWCDS), would affect 8 projected and 3 potential development sites over an approximate six block area in Bushwick, Brooklyn. Air quality, which is a general term used to describe pollutant levels in the atmosphere, would be affected by these changes. The following air quality analyses are presented in this chapter to determine the significance of these changes: 1. The potential for emissions from project-related vehicle trips; 2. The potential impacts of the emissions of a proposed parking garage; 3. The potential for emissions from the heating, ventilation and air conditioning (HVAC) systems of the projected and potential developments to significantly impact other projected/potential development sites (project-on-project impacts); 4. The potential for emissions from the HVAC systems of the projected and potential developments to significantly impact existing sensitive land uses within 400 feet; 5. The potential combined impacts from HVAC emissions of projected and potential developments that are located in close enough proximity to one another (clusters) to significantly impact existing sensitive land uses and other projected/potential developments; 6. The potential for emissions sources from existing commercial, institutional, or residential developments within 400 feet from proposed developments to significantly impacts the proposed developments, and 7. The potential for significant air quality impacts from air toxic emissions generated by nearby existing industrial sources on the proposed development sites. Air quality analyses were conducted, following the procedures outlined in the 2012 New York City Environmental Quality Review (CEQR) Technical Manual, to determine whether the Proposed Action under the RWCDS would result in exceedances of ambient air quality standards or health-related guideline values. The methodologies and procedures utilized in these analyses are described below. B. PRINCIPAL CONCLUSIONS The result of the analyses conducted is that the Proposed Action would not have any significant air quality impacts. This is based on the following findings: Emissions from project-related vehicle trips would not cause a significant mobile source air quality impact; With the specified (E) designations, the emissions from the heating, ventilation and air conditioning systems of selected projected and potential developments would not cause a significant air quality impact to other projected/potential development sites or existing sensitive land uses;
Transcript of CHAPTER 11: AIR QUALITY - FEIS - nyc.gov

11-1
Rheingold Rezoning DFEIS
CHAPTER 11: AIR QUALITY
A. INTRODUCTION The Proposed Action, under the Reasonable Worst-Case Development Scenario (RWCDS), would affect 8 projected and 3 potential development sites over an approximate six block area in Bushwick, Brooklyn. Air quality, which is a general term used to describe pollutant levels in the atmosphere, would be affected by these changes. The following air quality analyses are presented in this chapter to determine the significance of these changes: 1. The potential for emissions from project-related vehicle trips;
2. The potential impacts of the emissions of a proposed parking garage;
3. The potential for emissions from the heating, ventilation and air conditioning (HVAC) systems of the projected and potential developments to significantly impact other projected/potential development sites (project-on-project impacts);
4. The potential for emissions from the HVAC systems of the projected and potential developments to significantly impact existing sensitive land uses within 400 feet;
5. The potential combined impacts from HVAC emissions of projected and potential developments that are located in close enough proximity to one another (clusters) to significantly impact existing sensitive land uses and other projected/potential developments;
6. The potential for emissions sources from existing commercial, institutional, or residential developments within 400 feet from proposed developments to significantly impacts the proposed developments, and
7. The potential for significant air quality impacts from air toxic emissions generated by nearby existing industrial sources on the proposed development sites.
Air quality analyses were conducted, following the procedures outlined in the 2012 New York City Environmental Quality Review (CEQR) Technical Manual, to determine whether the Proposed Action under the RWCDS would result in exceedances of ambient air quality standards or health-related guideline values. The methodologies and procedures utilized in these analyses are described below. B. PRINCIPAL CONCLUSIONS The result of the analyses conducted is that the Proposed Action would not have any significant air quality impacts. This is based on the following findings:
Emissions from project-related vehicle trips would not cause a significant mobile source air quality impact;
With the specified (E) designations, the emissions from the heating, ventilation and air conditioning systems of selected projected and potential developments would not cause a significant air quality impact to other projected/potential development sites or existing sensitive land uses;

Rheingold Rezoning DFEIS Chapter 11: Air Quality
11-2
Emissions from “large” existing emission sources would not cause a significant air quality impact to the projected/ potential development sites; and
Air toxic emissions generated by nearby existing industrial sources would not cause a significant air quality impact to the projected/potential development sites.
C. STANDARDS AND CRITERIA National Ambient Air Quality Standards Ambient air is defined by the United States Environmental Protection Agency (EPA) as that portion of the atmosphere, external from buildings, to which the general public has access. National Ambient Air Quality Standards (NAAQS) were promulgated by EPA to protect public health and welfare, allowing for an adequate margin of safety. The NAAQS include sulfur dioxide, carbon monoxide, ozone, nitrogen dioxide, fine particulates, and lead. They consist of primary standards, established to protect public health with an adequate safety margin, and secondary standards, established to protect "plants and animals and to prevent economic damage." The six pollutants are deemed criteria pollutants because threshold criteria can be established for determining adverse effects on human health. These pollutants are described below.
Carbon Monoxide (CO) is a colorless, odorless gas produced from the incomplete combustion of gasoline and other fossil fuels. The primary source of CO in urban areas is from motor vehicles. Because this gas disperses quickly, CO concentrations can very greatly over relatively short distances.
Fine Particulates (PM10, PM2.5) also are known as Inhalable or Respirable Particulates.
Particulate matter is a generic term for a broad range of discrete liquid droplets or solid particles of various sizes. The PM10 standard covers particles with diameters of 10 micrometers or less, which are the ones most likely to reach the lungs. The PM2.5 standard covers particles with diameters of 2.5 micrometers or less.
Lead (Pb) is a heavy metal. Emissions are principally associated with industrial sources and
motor vehicles that use gasoline containing lead additives. Most U.S. vehicles produced since 1975, and all produced after 1980, are designed to use unleaded fuel. As a result, ambient concentrations of lead have declined significantly.
Nitrogen dioxide (NO2) is a highly oxidizing, extremely corrosive toxic gas. It is formed by
chemical conversion from nitric oxide (NO), which is emitted primarily by industrial furnaces, power plants, and motor vehicles.
Ozone (O3) is a principal component of smog. It is not emitted directly into the air, but is
formed through a series of chemical reactions between hydrocarbons and nitrogen oxides in the presence of sunlight.
Sulfur dioxides (SO2) are heavy gases primarily associated with the combustion of sulfur-
containing fuels such as coal and oil. No significant quantities are emitted from mobile sources.
In addition to NAAQS, New York State Ambient Air Quality Standards further regulate concentrations of the criteria pollutants discussed above. The New York State Department of Environmental Conservation (NYSDEC), Air Resources Division, is responsible for air quality monitoring in the state. Monitoring is

Rheingold Rezoning DFEIS Chapter 11: Air Quality
11-3
performed for each of the criteria pollutants to assess compliance. Table 11-1 shows the National and New York State Ambient Air Quality Standards. Table 11-1: National and New York State Ambient Air Quality Standards
Pollutant Averaging Period Standard 2011 Value Monitor
Sulfur Dioxide 3-hour average 1,300 μg/m3 82.7 μg/m3 Queens
College 2 1-hour averagee 197 μg/m3 79.8 μg/m3 Inhalable Particulates (PM10)
24-hour average 150 μg/m3 47 μg/m3 Queens College 2
Inhalable Particulates (PM2.5)
3-yr average annual mean 12 μg/m3 9.5 μg/m3 P.S. 219 / Queens College 2 Maximum 24-hr. 3-yr. avg.
c 35 μg/m3 34.9 μg/m3
Carbon Monoxide 8-hour average
a 9 ppm 1.8 μg/m3 Queens
College 2 1-hour averagea 35 ppm 2.1 ppm
Ozone Maximum daily 8-hr avg.b 0.075 ppm 0.075 ppm Queens College 2
Nitrogen Dioxide 12-month arithmetic mean 100 μg/m3 21.62 μg/m3 Queens
College 2 1-hour averaged 100 ppb (188 µg/m3) 67 ppb (128 μg/m3)
Lead Quarterly mean 0.15 μg/m3 0.0497 μg/m3 I.S. 52 (Bronx)
Notes: ppm = parts per million; μg/m3 = micrograms per cubic meter. a. Not to be exceeded more than once a year. b. Three-year average of the annual fourth highest maximum 8-hour average concentration effective May 27, 2008. c. Not to be exceeded by the 98th percentile of 24-hour PM2.5 concentrations in a year (averaged over 3 years). d. Three-year average of the 98th percentile of the daily maximum 1-hour average, effective January 22, 2010. e. Three-year average of the 99th percentile of the daily maximum 1-hour average, final rule signed June 2, 2010. Sources: New York State Department of Environmental Conservation; New York State Ambient Air Quality Development Report, 2009; New York City Department of Environmental Protection, 2012.
New York City De Minimis and Interim Guidance Criteria For carbon monoxide from mobile sources, the City's de minimis criteria are used to determine the significance of the incremental increases in CO concentrations that would result from a Proposed Action. These set the minimum change in an 8-hour average carbon monoxide concentration that would constitute a significant environmental impact. According to these criteria, significant impacts are defined as follows:
• An increase of 0.5 ppm or more in the maximum 8-hour average carbon monoxide concentration at a location where the predicted No Action 8-hour concentration is equal to or above 8 ppm.
• An increase of more than half the difference between baseline (i.e., No Action) concentrations
and the 8-hour standard, when No Action concentrations are below 8 ppm. For PM2.5, analyses at the microscale level, the City’s interim guidance criteria for determining significance are:
2.0/5.0 μg/m3 for the 24-hour period, and 0.3 μg/m3 for the annual period.
At the neighborhood scale of analysis, for mobile and stationary sources combined, the average PM2.5 concentration within a 1 km-square grid centered on the worst-case receptor has an interim guidance criterion value of:
0.1 μg/m3 for the annual period.
No interim guidance values have been assigned to PM10.
Rheingold Rezoning DFEIS Chapter 11: Air Quality
11-4
State Implementation Plan (SIP) The Clean Air Act requires states to submit to the EPA a SIP for attainment of the NAAQS. The 1977 and 1990 amendments required comprehensive plan revisions for areas where one or more of the standards have yet to be attained. Kings County is part of a CO maintenance area and is nonattainment (moderate) for the 8-hour ozone standard and nonattainment for PM10 and PM2.5. The state is under mandate to develop SIPs to address ozone, carbon monoxide, and PM10. It is also working with the EPA to formulate standard practices for regional haze and PM2.5. New York State Department of Environmental Conservation (NYSDEC) In addition to criteria pollutants, a wide range of non-criteria air pollutants known as toxic air pollutants may be emitted from industrial sources. These pollutants, ranging from high to low toxicity, can be grouped into two categories: carcinogenic air pollutants and non-carcinogenic air pollutants. NYSDEC has established Short-Term Guideline Concentrations (SGCs) and Annual Guideline Concentrations (AGCs) for numerous toxic or carcinogenic non-criteria pollutants for which EPA has no established standards. They are maximum allowable 1-hour and annual guideline concentrations, respectively, that are considered acceptable concentrations below which there should be no adverse effects on the health of the general public. SGCs are intended to protect the public from acute, short-term effects of pollutant exposures, and AGCs are intended to protect the public from chronic, long-term effects of the exposures. Pollutants with no known acute effects have no SGC criteria, but do have AGC criteria. NYSDEC’s DAR-1 AGC/SGC Tables (October 18, 2010) contains the most recent compilation of the SGC and AGC guideline concentrations. Where the NYSDEC-established AGC is based on a health risk criteria (i.e., a one in a million cancer risk), and the source has Best Available Control Technology (BACT) installed, NYCDEP may consider the potential impacts to be insignificant if the projected ambient concentration is less than 10 times the AGC. This is because NYSDEC developed the AGCs for these pollutants by reducing the health risk criteria by a factor of 10 as an added safety measure. No NAAQs, SGCs, or AGCs exist for emissions of pollutants that are grouped together such as total solid particulates, total hydrocarbons, or total organic solvents. Therefore, as recommended by NYCDEP, all solid particulates are assumed to be PM10. For total organic solvents or total hydrocarbons, the SGCs and AGCs for specific compounds should be obtained and used in an analysis. Based on SGCs and AGCs, EPA also developed methodologies that can be used to estimate the potential impacts of air toxic pollutants from multiple emission sources. The "Hazard Index Approach" can be used to estimate the potential impacts of non-carcinogenic pollutants. If the combined ratio of estimated pollutant concentrations divided by the respective SGCs or AGCs value for each of the toxic pollutants is found to be less than 1, no significant air quality impacts are predicted to occur. Using these factors, the potential cancer risk associated with each carcinogenic pollutant, as well as the total cancer risk of the releases of all of carcinogenic toxic pollutants combined, can be estimated. If the total incremental cancer risk of all of the carcinogenic toxic pollutants combined is less than one in one million, no significant air quality impacts are predicted to occur due to these pollutant releases.

Rheingold Rezoning DFEIS Chapter 11: Air Quality
11-5
D. EXISTING CONDITIONS Existing Air Quality As stated previously, Kings County is part of a CO maintenance area and is nonattainment (Moderate) for the 8-hour ozone standard and nonattainment for PM10 and PM2.5. It is in compliance with all other NAAQS. Background Concentrations For SO2, and NOx, and PM10, the background concentrations were obtained from the air quality monitor at Queens College 2 / Public School 219. The background values were calculated as follows:
79.5 µg/m3 for the 1-hour SO2 concentration averaged over 3 years of data (2009-2011) at the 99th percentile,
82.4 µg/m3 for the 3-hour SO2 concentration based on 2011, the most recent year of monitored data,
41.0 µg/m3 for the annual NO2 averaged over 5 years of data (2007-2011) at the 98th percentile, 126.8 ug/m3 for the 1-hour NO2 averaged over 3 years of data (2009-2011) at the 98th percentile
and 47 µg/m3 for the 24-hour PM10 average based on 2011, the most recent year of monitored data.
As a conservative approach for CO, the highest value from the past 5 years of monitored values was used as the background value. Based on the Queens College station, the CO background would be 3.4 ppm for the 1-hour average and 2.8 ppm for the 8-hour average as shown in Table 11-2. Table 11-2: Monitored CO Concentrations (ppm)
Monitor Year 1-Hour Value 8-Hour Value
Queens College, Queens
2007 3.4 2.8
2008 2.3 1.7
2009 3.1 1.9
2010 3.4 2.7
2011 2.1 1.8
Note: Numbers in bold type are the highest in their category. Source: New York State Department of Environmental Conservation.
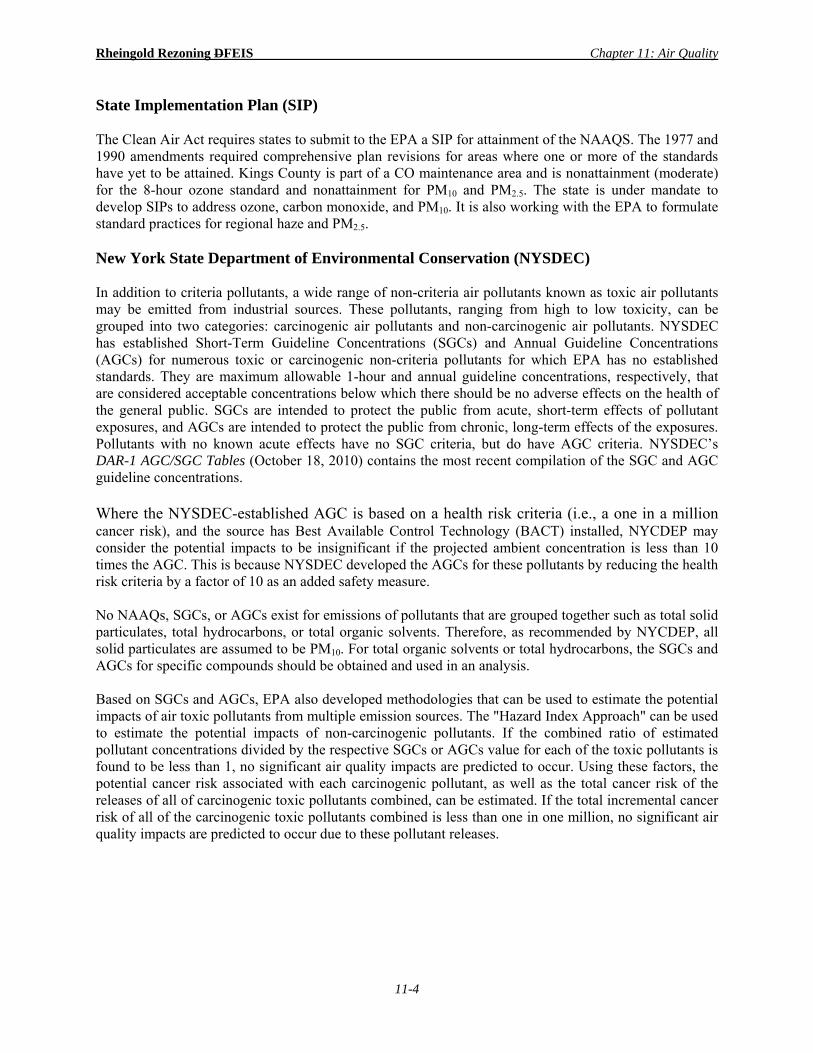
Affected Properties The proposed rezoning area is bounded by Flushing Avenue, Evergreen Avenue, Melrose Avenue, Stanwix Street, Forrest Street, Garden Street, and Beaver Street. It includes approximately 6 blocks, which encompass a total of approximately 623,080 sf. Table 11-3 provides a list of all the blocks and lots included within the proposed rezoning area. The 8 projected and 3 potential development sites are shown in Figure 11-1. The properties to be rezoned consist of Blocks 3138, 3139, 3140, 3141, and 3152, as well as the Flushing Avenue frontage on Block 3137 to a depth of 100 feet. The majority of the projected development sites are vacant or utilized as vehicle storage. There are 8 businesses located on the projected development sites with a total of 46 employees. These businesses include industrial/warehouse uses, vehicle storage, auto repair, a gas station, and food market. As shown in the table, projected development sites 1-4 are owned by the Applicant.
Rheingold Rezoning DFEIS Chapter 11: Air Quality
11-6
Figure 11-1: Projected and Potential Development Sites
Table 11-3: Affected Properties
Block Lots 3137 26 (portion), 49 (portion), 51, 56 3138 1, 7, 9-11, 13, 17, 18, 20, 22-25, 27, 32, 36,38, 40, 41 3139 1-12, 15-17, 18*, 19*, 20*, 21*, 23*, 24*, 25*, 26*, 27*, 28*,
29*, 30*, 31*, 32*, 33*, 34*, 35*, 36* 3140 1, 50 3141 1, 5-8, 10-12, 14, 15, 18, 20-23, 36 3152 1*, 2*, 3*, 35-38, 41, 43, 44, 45*, 48*, 56*, 58*, 62*, 63*,
64*, 66*, 100 *Lots owned by the applicant Besides the projected and potential development sites and the large warehouse occupying Block 3140, the remainder of the proposed rezoning area includes mostly 3 to 5 story apartment buildings, some with ground floor retail. It also contains a school playground and a few restaurant establishments in a concentration of 1-story buildings on Block 3137 adjacent to the C-town market on Flushing Avenue. The neighborhood has been undergoing a transformation in recent years, and many former industrial and commercial properties have been redeveloped with residential uses.
3139
3141
3152
3137 3138
3140

Rheingold Rezoning DFEIS Chapter 11: Air Quality
11-7
E. FUTURE WITHOUT THE PROPOSED ACTION In the 2016 Future without the Proposed Action, the project site and the proposed rezoning area would remain the same. No new development is expected to occur within the proposed rezoning area in the absence of the proposed action, and the existing uses would remain unchanged. F. FUTURE WITH THE PROPOSED ACTION Description of the Proposed Action Within the rezoning area, the blocks zoned M3-1 would be rezoned M1-2, and the blocks zoned M1-1 would be rezoned R7A and R6A with a C2-4 commercial overlay mapped along portions of the Bushwick, Flushing and Evergreen Avenue frontages to a depth of 100 feet. The Proposed Action also includes a zoning text amendment, which modifies Section 23-922 of the NYC Zoning Resolution to make the newly mapped R6A and R7A districts “Inclusionary Housing designated areas.” The Applicant also proposes to map and formally bestow to the City the unbuilt section of Stanwix Street between Montieth Street and Forrest Street and the unbuilt section of Noll Street between Evergreen Avenue and Stanwix Street. At present, these portions of the unmapped Stanwix and Noll Streets are inaccessible to the public and to public traffic. Table 11-4 shows the anticipated development and Figure 1-4 in the project description shows their locations. Properties controlled by the aApplicant include portions of Block 3139 (Lots 18-21 and 23-36), all of Block 3141, and a large portion of Block 3152 (Lots 1-3, 45, 48, 56, 58, 62-64 and 66). These are referred to as Projected Development Sites 1 through 4. The proposed rezoning action would facilitate a new development by the aApplicant consisting of 4- to 8-story residential buildings with ground floor local retail uses. These new buildings are expected to provide ten residential and mixed-use buildings with a total of 59,600 sf of retail space, 1,006,310 sf of residential space for 977 dwelling units (DUs), and 212,005 sf of garage space for 503 accessory parking spaces. The largest parking facility would be a garage on Site 2 with 167 spaces. Four additional sites in the proposed rezoning area surrounding the project site could be redeveloped as a result of the proposed rezoning. Designated as Projected Development Sites 5 through 8, they include Lot 56 on Block 3137, Lots 20, 22 and 32 on Block 3138, and Lots 36-38, 41 and 43, on Block 3152. Together, they would provide 102,048 sf of residential space for 99 potential DUs and 30,369 sf of ground floor retail space. In addition, three sites are designated as potential development sites (sites that are also rezoned but which are less likely to be developed), and they are numbered Sites 8 through 11. They include Lot 51 on Block 3137, Lot 11 on Block 3138, and Lot 44 on Block 3132. An estimated 87 DUs and 12,712 of commercial space could be developed on these three lots. Accessory garages would be small and are not included in the analysis. The remaining lots in the proposed rezoning area are not expected to be redeveloped as a result of the proposed action.

Rheingold Development Rezoning FEIS Chapter 11: Air Quality
11-8
Table 11-4: Projected and Potential Development Sites
Site No.
Building ID
Tax Block
Lot(s) Projected Square Footage Height
(ft) Residential Retail Subtotal Garage Total Projected Development Sites, Applicant 1 A 3139 18-21, 23-26 72,970 17,664 90,634 11,059 101,693 80 1 B 3139 27-36 63,288 0 63,288 18,261 84,549 70
Total Building A/B 136,258 17,664 153,922 29,320 183,242 2 C 3141 1, 5-8, 10, 11 77,296 18,711 96,008 0 96,008 80 2 D 3141 12, 14, 15, 18, 20 (part) 82,077 0 82,077 86,133 168,210 70 Subtotal 159,373 18,711 178,085 86,133 264,218 2 E 3141 23 (part), 36 (part) 82,077 0 82,077 0 82,077 70 2 F 3141 20 (part), 21, 22, 23 (part), 50 94,769 0 94,769 0 94,769 80 Subtotal 176,846 0 176,846 0 176,846
Total Building C/D/E/F 336,219 18,711 354,931 86,133 441,064 3 G 3152 3 (part), 48 (part) 226,512 0 226,512 52,751 279,263 80 3 H 3152 3 (part), 48 (part) 81,611 19,756 101,366 0 101,366 80 Total Building GH 308,123 19,756 327,878 52,751 380,629 4 I 3152 3 (part), 1, 2, 56, 58, 62-64, 66 128,215 0 128,215 43,801 172,016 70 4 J 3152 48 (part), 45 97,494 3,469 100,962 0 100,962 70 Total Building I/J 225,709 3,469 229,177 43,801 272,978 Total Applicant 1,006,309 59,600 1,065,908 212,005 1,277,913Projected Development Sites, Non-Applicant 5 NA 3152 36-38, 41, 43 37,679 9,121 46,800 96,755 56,555 80 6 NA 3138 20 15,791 5,213 21,004 5,755 26,759 70 7 NA 3138 32 30,025 9,911 39,936 10,600 50,536 70 8 NA 3137 56 18,553 6,124 24,677 6,550 31,227 70 Total Non-Applicant 102,048 30,369 132,417 32,660 165,077Potential Development Sites 9 NA 3152 44 11,066 832 11,898 2,500 14,398 80 10 NA 3138 11 18,952 0 18,952 4,000 22,952 70 11 NA 3137 51 2,521 11,880 14,401 2,880 17,281 70 Total Potential Sites 32,539 12,712 45,251 9,380 54,631 Grand Total 1,140,896 102,681 1,243,576 254,045 1,500,621
Source: Philip Habib & Associates, Inc.

Rheingold Development Rezoning FEIS Chapter 11: Air Quality
11-9
Mobile Source Analysis Carbon Monoxide Localized increases in CO levels may result from increased vehicular traffic volumes and changed traffic patterns in the study area as a consequence of the proposed action. The mobile source analysis outlined in the CEQR Technical Manual considers actions that add new vehicles to roadways or change traffic patterns, either of which may have significant adverse air quality impacts. The primary pollutant of concern is carbon monoxide. For this area of the City, the threshold volume for modeling CO concentrations using MOBILE6.2 and CAL3QHC is an increment of 170 vehicles during a peak hour. An evaluation was conducted to determine whether a detailed air quality assessment of mobile source CO impacts was warranted. Based on Figure 10-1 in Chapter 10, “Transportation,” the Proposed Action would generate a net increment of less than 170 vehicles during a peak hour. The maximum increment would be 136 vehicles, which would occur during the peak AM period at Bushwick Avenue and Melrose Street. Since this falls below the 170-vehicle increment, no intersection modeling of CO is required. Particulate Matter (PM2.5) A PM2.5 screening analysis was conducted using the spreadsheet referenced on page 17-10 of the CEQR Technical Manual. The algorithm uses traffic volume according to vehicular class and determines the equivalent number of HDDVs by type of road. Based on guidance from NYCDEP, the minor leg of an intersection determines its classification as a local road, collector, arterial, or expressway. A more detailed analysis is required if the proposed action would meet or exceed the thresholds shown below.
12 HDDV for paved roads with average daily traffic fewer than 5,000 vehicles, 19 HDDV for collector-type roads, 23 HDDV for principal and minor arterial roads, and 23 HDDV for expressways and limited-access roads.
The Proposed Action would generate passenger vehicles (autos and SUVs). Additional trucks generated during peak traffic periods would be minimal. The traffic study included 14 intersections. For the purposes of the PM2.5 screen, only signalized intersections would be considered for further analysis because the traffic volume on the main roadway of an unsignalized intersection flows freely and idling vehicles are limited to the much smaller volume on the minor roadway. Table 11-5 shows the net project increments at the signalized intersections analyzed by the traffic study. The increments range from a net loss (-16) to an increase of 136 vehicles. Table 11-5 also shows the roadway classification of the minor street(s) in the intersection. All intersections which have a collector road as the minor roadway pass NYCDEP’s PM2.5 screen. All intersections pass the screen except for two intersections with minor roads that have less than 5,000 vehicles per day. These two intersections, which fail the screen for all four peak periods, are: 1) Bushwick Avenue/Arion Place/Beaver Street, and 2) Bushwick Street/Melrose Street. The worst case occurs during the peak AM period at the Bushwick/Melrose Streets intersection, which would have a net project increment of 136 vehicles. This intersection was therefore modeled as a worst case for mobile source PM10 and PM2.5.

Rheingold Rezoning DFEIS Chapter 11: Air Quality
11-10
Table 11-5: PM 2.5 Screen for Signalized Intersections
Type Intersection Net Project Traffic
Increment Minor Street Classification
PM2.5 Screen Results
Peak AM
S Bushwick/Flushing 65 Principal Arterial
Pass
S Bushwick/Forrest/Garden 8 <5000 Pass
S Bushwick Avenue/Arion Place/Beaver 106 <5000 Fail
S Bushwick Street/Melrose Street 136 <5000 Fail
S Bushwick/Jefferson 15 Collector Pass
S Flushing/Evergreen -10 Collector Pass
S Noll/Evergreen -9 <5000 Pass
Peak Midday
S Bushwick/Flushing 6 Principal Arterial
Pass
S Bushwick/Forrest/Garden 17 <5000 Pass
S Bushwick Avenue/Arion Place/Beaver 61 <5000 Fail
S Bushwick Street/Melrose Street 90 <5000 Fail
S Bushwick/Jefferson 20 Collector Pass
S Flushing/Evergreen -16 Collector Pass
S Noll/Evergreen 1 <5000 Pass
Peak PM
S Bushwick/Flushing 20 Principal Arterial
Pass
S Bushwick/Forrest/Garden 10 <5000 Pass
S Bushwick Avenue/Arion Place/Beaver 70 <5000 Fail
S Bushwick Street/Melrose Street 94 <5000 Fail
S Bushwick/Jefferson 19 Collector Pass
S Flushing/Evergreen -6 Collector Pass
S Noll/Evergreen 9 <5000 Pass
Peak Saturday Midday
S Bushwick/Flushing 22 Principal Arterial
Pass
S Bushwick/Forrest/Garden 19 <5000 Pass
S Bushwick Avenue/Arion Place/Beaver 59 <5000 Fail
S Bushwick Street/Melrose Street 89 <5000 Fail
S Bushwick/Jefferson 16 Collector Pass
S Flushing/Evergreen -4 Collector Pass
S Noll/Evergreen 3 <5000 Pass
Note: Entries in bold type exceed NYCDEP’s PM2.5 screen CAL3QHC Modeling Fine particulate matter (PM10 and PM2.5) was modeled using MOBILE6.2 to obtain emission factors and CAL3QHC for overall pollutant concentrations. Emission factors for 2016 for a speed of 25 mph were obtained from EPA’s MOBILE6.2 model. The ambient temperature used in the model was 43°F, as recommended by the NYCDEP. Inputs pertaining to inspection/maintenance, anti-tampering programs, etc., were obtained from NYCDEP’s most recent guidelines (March 2008). The resulting MOBILE6.2

Rheingold Rezoning DFEIS Chapter 11: Air Quality
11-11
emission factors for autos and SUVs were multiplied by the percentages for each (76% and 24%, respectively) to calculate the composite emission factors, by speed, for use in the CAL3QHC model. Fugitive dust from brake and tire wear, as well as re-entrainment of dust was calculated using the formulas from Section 13.2.1-3 of EPA’s AP-42 Document. The formulas were based on an average fleet weight of 3 tons and a silt loading factor of 0.4 g/m2 as recommended by the CEQR Technical Manual (2012) for paved roadways with less than 5,000 vehicles per day. Roadway links were modeled to a distance of 1,000 feet from the intersection or to the end of the roadway, whichever came first. The mixing zone for free-flow links was equal to the width of the traveled way plus an additional 10 feet (3 meters) on each side of the roadway. Receptor points were placed at mid-sidewalk and outside the mixing zone. They were modeled at 20-foot intervals for a distance of 100 feet in each direction from the intersection. The idling emission factor for passenger vehicles is 0. Therefore, no queue links were included in the analysis. Typical worst-case meteorological conditions were modeled. These included a mixing layer height of 1,000 meters, a wind speed of 1 meter per second, and an atmospheric stability class of D (neutral stability). Settling and deposition velocities were assumed to be 0. Each computer run covered wind angles form 0 to 360 degrees and identified the worst-case wind angle for each receptor point. Traffic for Action Conditions was modeled for PM10. The 24-hour results were added to background concentrations and compared with the NAAQS. Since PM2.5 impacts are determined from the project-generated increments, only the traffic volumes for the net project increment (project induced traffic and diverted traffic) were modeled with CAL3QHC. Where the net volume increment on a roadway link was negative, a zero value was used in the model. If the modeling shows that PM2.5 concentrations are within the allowable increments for the 24-hour and annual periods, then no further analysis is required for that intersection or for intersections with lower new project increments of traffic. CAL3QHC provides maximum 1-hour concentrations. The one-hour concentration was converted to a 24-hour concentration using a conversion factor of 0.4 and also to an annual concentration using a conversion factor of 0.08 per guidance from NYCDEP. Table 11-6 shows the results of the modeling. For PM10, the worst-case receptor point was at the the southern corner of the intersection of Bushwick Avenue/Arion Place. Since this location was north of the intersection to be modeled, additional roadway links and receptor points were added to ensure that the receptor represented the maximum modeled concentration. The total concentration of PM10 is below the NAAQS of 150 ug/m3. For PM2.5, the worst-case receptor point was near the northern corner of the intersection of Bushwick Avenue and Melrose Street. The incremental concentration of PM2.5 due to the project is below 2 ug/m3 for the 24-hour period and below 0.3 µg/m3 for the annual period. Therefore, no impacts from PM10 or PM2.5 due to mobile sources are projected. Table 11-6: Mobile Source Air Quality for PM10 and PM2.5, Action Conditions
Pollutant Time
Period Modeled Value
(ug/m3) Background
(ug/m3) Total
(ug/m3) NAAQS (ug/m3) PM10 24-Hour 54.4 47 101.4 150
Pollutant Time
Period Modeled Value
(ug/m3)Background
(ug/m3)Total
(ug/m3) Interim Guidance
PM2.5 24-Hour 0.8 NA 0.8 2 µg/m3 (5 µg/m3 not-
to-exceed value) PM2.5 Annual 0.16 NA 0.2 0.3 µg/m3
Source: Sandstone Environmental Associates, Inc.
Rheingold Rezoning DFEIS Chapter 11: Air Quality
11-12
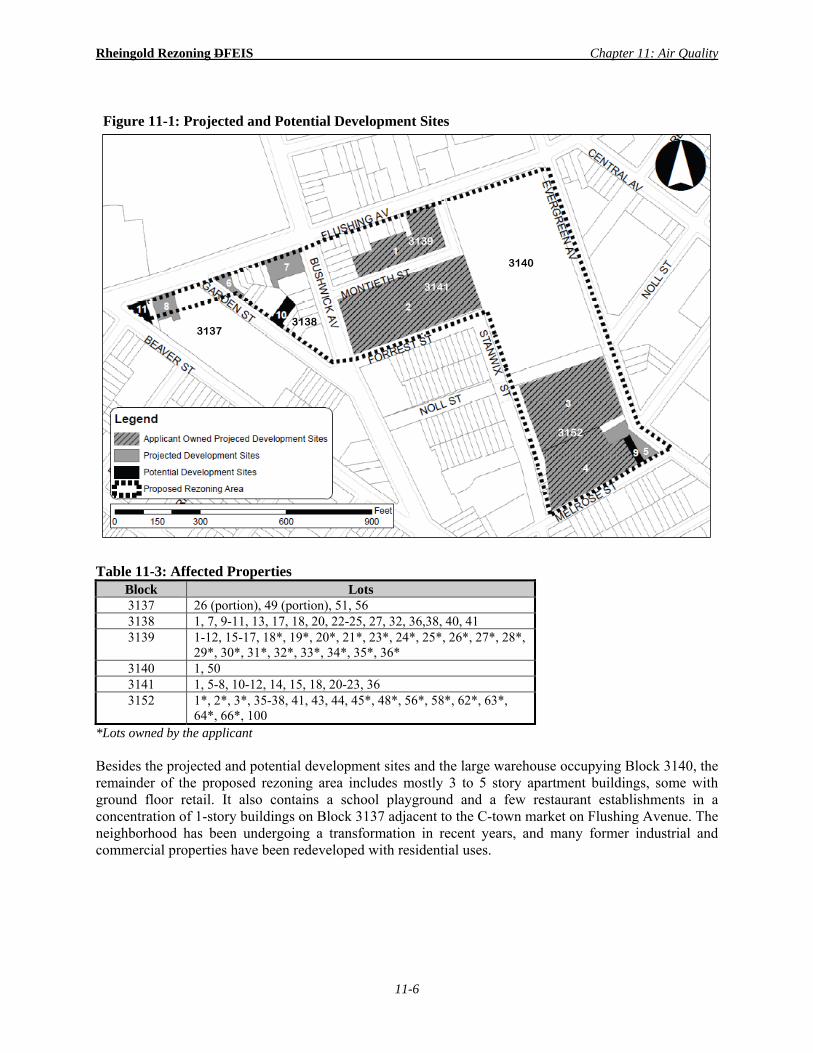
Parking Facilities The Proposed Action would include 503 parking spaces on Projected Development Sites 1, 2, 3, and 4. As a worst-case scenario, an air quality analysis was conducted for the largest proposed garage. This garage would be located on Projected Development Site 2 on the Block 3141, which is bounded by Monteith Street to the north, Stanwix Street (unbuilt) to the east, Forrest Street to the south, and Bushwick Avenue to the west. The garage would provide a total of 167 spaces comprising approximately 86,100 square feet of parking area. Patrons of the proposed garage would park their own vehicles. Table 11-7, shows the hourly parking demand for the garage. As a worst case, the highest incoming (23) and outgoing (25) volumes were used for the analysis. Table 11-7: Hourly Garage Parking Demand (Projected Site #2)
Time Volume Time Volume
Period In Out Total Period In Out Total 12-1 am 1 1 2 12-1 pm 6 8 14
1-2 1 1 2 1-2 7 7 14 2-3 1 1 2 2-3 8 6 14 3-4 0 0 0 3-4 12 5 17 4-5 0 0 0 4-5 15 10 25 5-6 1 3 4 5-6 23 10 33 6-7 2 9 11 6-7 17 7 24 7-8 3 15 18 7-8 15 4 19 8-9 4 25 29 8-9 10 2 12
9-10 5 12 17 9-10 4 1 5 10-11 4 11 15 10-11 2 1 3
11-12 pm 4 9 13 11-12 am 2 1 3 Note: Numbers in bold type represent the worst-case hour Source: Philip Habib & Associates Two potential stack locations were evaluated: one in the second-floor interior courtyard and one above the entrance on Monteith Street. Table 11-8 summarizes the potential vent sites for the garage. Figure 11-2 illustrates their locations. They are analyzed in the subsections that follow. Table 11-8: Potential Garage Vent Locations, Projected Development Site 2
Garage Vent Site Elevation Receptor 1 Receptor 2
Interior Courtyard Above Garage 25 ft. Residential window, 5 ft. away
from stack & 25 ft. high Pedestrian in courtyard, 5 ft. away from stack & 6 ft. tall
Above Building D Garage Exit 12 ft. Pedestrian on Near Sidewalk, 6.5 ft. away from building & 6 ft. tall
Pedestrian on Far Sidewalk, 43.5 ft. away from building & 6 ft. tall
Source: Sandstone Environmental Associates, Inc.
Rheingold Rezoning DFEIS Chapter 11: Air Quality
11-13
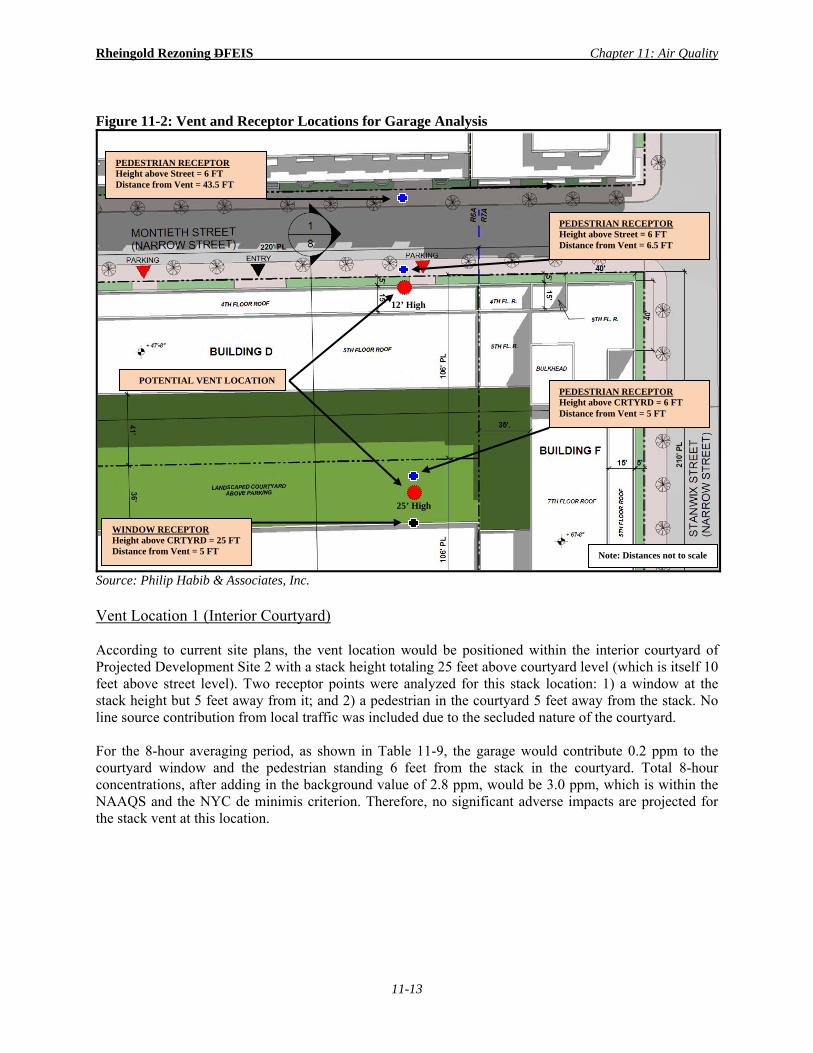
Figure 11-2: Vent and Receptor Locations for Garage Analysis
Source: Philip Habib & Associates, Inc. Vent Location 1 (Interior Courtyard) According to current site plans, the vent location would be positioned within the interior courtyard of Projected Development Site 2 with a stack height totaling 25 feet above courtyard level (which is itself 10 feet above street level). Two receptor points were analyzed for this stack location: 1) a window at the stack height but 5 feet away from it; and 2) a pedestrian in the courtyard 5 feet away from the stack. No line source contribution from local traffic was included due to the secluded nature of the courtyard. For the 8-hour averaging period, as shown in Table 11-9, the garage would contribute 0.2 ppm to the courtyard window and the pedestrian standing 6 feet from the stack in the courtyard. Total 8-hour concentrations, after adding in the background value of 2.8 ppm, would be 3.0 ppm, which is within the NAAQS and the NYC de minimis criterion. Therefore, no significant adverse impacts are projected for the stack vent at this location.
Note: Distances not to scale
WINDOW RECEPTOR Height above CRTYRD = 25 FT Distance from Vent = 5 FT
POTENTIAL VENT LOCATION PEDESTRIAN RECEPTOR Height above CRTYRD = 6 FT Distance from Vent = 5 FT
PEDESTRIAN RECEPTOR Height above Street = 6 FT Distance from Vent = 6.5 FT
12’ High
25’ High
PEDESTRIAN RECEPTOR Height above Street = 6 FT Distance from Vent = 43.5 FT

Rheingold Rezoning DFEIS Chapter 11: Air Quality
11-14
Table 11-9: CO Air Quality for Garage (ppm) Stack above Monteith Street Entrance
Near Sidewalk Far Sidewalk Distance to Vent (ft.) 6.0 43.5
Vent Height (ft.) 12.0 12.0 Receptor Height (ft.) 6.0 6.0
Averaging Period 1-Hour 8-Hour 1-Hour 8-HourGarage CO result (ppm) 0.0105 0.0073 0.0105 0.0073
Line Source (ppm) NA NA 0.0235 0.0165Background Value (ppm) 3.4 2.8 3.4 2.8Total Concentration (ppm) 3.41 2.81 3.41 2.82
NAAQS, CO (ppm) 35.0 9.0 35.0 9.0Impact No No
Stack in Courtyard Near Window Pedestrian
Distance to Vent 5.0 ft. 5.0 ft. Vent Height 25.0 25.0
Receptor Height 25.0 25.0 Averaging Period 1-Hour 8-Hour 1-Hour 8-Hour
Garage CO result (ppm) 0.3 0.2 0.1 0.2Background Value (ppm) 3.4 2.8 3.4 2.8Total Concentration (ppm) 3.7 3.0 3.5 3.0
NAAQS, CO (ppm) 35.0 9.0 35.0 9.0Impact No No
Source: Sandstone Environmental Associates, Inc. Vent Location 2 (Above Garage Entrance on Montieth Street) As a conservative estimate, an alternative worst-case vent location was analyzed. The alternative vent stack was 12 feet directly above ground level at the vehicle entry site on Monteith Street. Receptor points included the near and far sidewalks. The pedestrian on the near sidewalk would be 6.5 feet away from the garage vent while the pedestrian standing on the far sidewalk across Montieth Street would be 43.5 feet away. Carbon monoxide emissions from vehicles on Monteith were calculated from the formula in the CEQR Technical Manual Appendices. Table 11-9 shows the results. For the 8-hour averaging period, the total CO concentrations would be 2.81 ppm for the near sidewalk and 2.82 ppm for the far sidewalk. These values are within the NAAQS and the NYC de minimis criterion. Therefore, no significant adverse impacts are expected from this garage with the stack and vent installed at this location. Stationary Source HVAC Actions can result in stationary source air quality impacts when they create new stationary sources of pollutants that can affect surrounding uses (such exhaust from boiler stack(s) used for heating/hot water, ventilation, or air conditioning systems); when they locate new sensitive uses (schools, hospitals, residences) near such stationary sources; and when new emission sources are located within a short distance of each other. Air quality impacts from HVAC sources are unlikely at distances of 400 feet or

Rheingold Rezoning DFEIS Chapter 11: Air Quality
11-15
more, but a major source within 1,000 feet may be a source of concern. Figure 11-3 shows the radii of 400 and 1,000 feet from the rezoning boundaries.
Figure 11-3: 400-ft and 1,000-ft Radii from the Rezoning Boundaries
Effects of Existing HVAC Emission Sources on Proposed Action A large residential complex owned by the New York City Housing Authority (NYCHA), Bushwick Houses, is located northwest of the Proposed Action on Block 3129, Lot 1. The complex consists of 1,150,500 sf in eight 20-story buildings (approximately 143,812 sf each). Two buildings with frontage on Flushing Avenue are approximately 173 feet high and 95 feet from the rezoning area on Blocks 3137 and 3138. As per the CEQR Technical Manual Stationary Source Screen (Figure 17-3), since no projected or potential development sites, which may fall within 200 feet distance (screening threshold) of the NYCHA buildings, will be of similar or greater height, no potential for significant adverse air quality impact is anticipated.

Rheingold Rezoning DFEIS Chapter 11: Air Quality
11-16
Woodhull Medical Center at 760 Broadway (Block 1723, Lot 1) is directly west of the project area. It is 158 feet high, has 510,000 sf of space and is about 800 feet from the nearest lot to be rezoned. This facility has an Air Title V permit for the dual-fired boilers that supply steam for the building (Permit ID 2-6104-0015/00005). Natural gas is the primary fuel with #6 oil as backup fuel. Emissions are exhausted through a common stack. As per the CEQR Technical Manual Stationary Source Screen (Figure 17-3), since no projected or potential development sites fall within 400 feet distance (screening threshold) of the Medical Center and are not of similar or greater height of the Medical Center, no potential for significant adverse air quality impact is anticipated. NYCHA also owns the Marcus Garvey housing complex on Marcus Garvey Boulevard southwest of the proposed rezoning area. This development has 914,915 sf in seven seven-story buildings. (approximately 130,702 sf each). The nearest building is approximately 800 feet from the lots to be rezoned. As per the CEQR Technical Manual Stationary Source Screen (Figure 17-3), since no projected or potential development sites, which may be of similar or greater height, fall within 180 feet (screening threshold) of the Marcus Garvey buildings, no potential for significant adverse air quality impact is anticipated. Screening Analysis of Proposed Action on Existing and Future Structures Ten buildings would be constructed on Projected Development Sites 1 through 4, which are owned by the aApplicant. Bulkheads are on the rooftops of five of the buildings, and the stacks are assumed to be in the middle of the bulkheads, about three feet higher than the roof. All of these building would use natural gas. Five buildings would provide HVAC for an adjacent building as follows:
Building A contains boiler for Buildings A and B, Building C contains boiler for Buildings C and D, Building F contains boiler for Buildings E and F, Building H contains boiler for Buildings G and H, and Building I contains boiler for Buildings I and J.
The stacks may be located on the mechanical bulkheads on the rooftops. However, as a worst-case condition, no credit for the height of the bulkheads was used in the analysis. Stack emission points would be either 73 or 83 feet above ground level. In addition, all tiers were assumed to be at the full height of the building. Project Development Sites 5 through 11 are not owned by the aApplicant. They have the option of using either Ultra-Low Sulfur Fuel Oil No. 2 (ULSHO), or natural gas as the fuel for their HVAC systems, which is the requirement for new buildings within New York City. The buildings are presumed to cover their entire lots, use separate boilers, and have heights and square footages that are based on the maximum that would be permitted under the rezoning. The buildings would range in height from 70 to 80 feet above ground level. As a worse-case analysis for screening purposes, the distance between a stack and the nearest building of similar or greater height is assumed to be the distance between lot lines of the two buildings. The stacks would be at least three feet higher than the roof. Figure 11-4 shows the projected boiler stack locations and heights.

Rheingold Development Rezoning FEIS Chapter 11: Air Quality
11-17
Figure 11-4: Projected Boiler Stack Locations and Heights
Notes: ( ) Projected and Potential building designations
= Approximate stack location and height above ground level
73 ft 70 ft
73 ft 73 ft
70 ft
83 ft (C)
83 ft (F)
83 ft (A)
83 ft (H)
83 ft
83 ft
73 ft (I)
3140
3151
3145
3141
3137
31383139
3152

Rheingold Development Rezoning FEIS Chapter 11: Air Quality
11-18
A screening analysis was carried out using Figure 17-5 (SO2 boiler screen for residential #2 fuel oil) and Figure 17-7 (NO2 boiler screen for residential natural gas) from the 2012 CEQR Technical Manual Appendices. The size of the development is plotted against the distance in feet to the edge of the receptor building. Figures 17-5 and 17-7 are applicable to buildings where the boiler stack is at least 30 feet from the nearest building of similar or greater height. If the distance is less than 30 feet, the analysis must be carried out using AERMOD modeling. If the plotted point is on or above the applicable curve, the potential for a significant air quality impact exists, and further analysis is required using AERSCREEN or AERMOD modeling. Table 11-10 shows the stack heights and heated square footages for the Projected and Potential Development Sites, as well as their distances to the nearest buildings of similar or greater height and the results of the analysis. Since the aApplicant has committed to using natural gas, the buildings on Development Sites 1 through 4 were not included in the screen for fuel oil. Figure 11-4 showed the location of the stacks on the proposed buildings on the Applicant’s sites. The garage square footages were not included in the area to be heated. As shown in the table, further analysis is required for several individual buildings. Sites 5 and 9 together with Site 3 screen out as a cluster for both fuel oil #2 and natural gas. Table 11-10: CEQR Manual HVAC Screening Nomograph Analyses
Develop-ment Site
Bldg. ID
Tax Block
Stack Ht. (ft.)
Heated Area (sq.
ft.)
Nearest Bldg. of > Height Comments
Building ID/Site Distance
(ft.) ULSHO #2 Oil Natural Gas
Individual Buildings 1 A 3139 83 153,923 F 50 NA Needs further analysis2 C 3141 83 178,084 F 185 NA Screens out 2 F 3141 83 176,846 A 50 NA Needs further analysis3 H 3152 83 327,879 Site 5 25 NA Needs AERMOD 4 I 3152 73 229,177 87 Melrose 50 NA Needs further analysis5 NA 3152 83 46,800 Site 9 0 Needs AERMOD 6 NA 3138 73 21,004 Bushwick Houses 80 Screens out 7 NA 3138 73 39,936 Site 10 40 Needs further analysis 8 NA 3137 73 24,677 Site 11 25 Needs AERMOD 9 NA 3152 83 11,898 Site 5 0 Needs AERMOD 10 NA 3138 73 18,952 Site 7 40 Needs further analysis
11 NA 3137 73 14,401 Site 8 25 Needs AERMOD
Clusters of Buildings* 5, 9, G, H NA 3152 83 386,576 Building F 315 Screens out Screens out C, D, E, F NA 3141 83 336,219 Building A 178 NA Screens out
*Distances are averaged between the clustered buildings Source: Sandstone Environmental Associates, Inc. Modeling for Effects of Proposed Action All sites requiring further analysis were modeled with AERMOD. AERMOD, designed to support EPA’s regulatory modeling programs, is a steady-state Gaussian plume model with three separate components: AERMOD (a dispersion model), AERMAP (a terrain preprocessor), and AERMET (a meteorological preprocessor). AERMOD can handle emissions from point, line, area, and volume sources. The model is run with five years of meteorological data that include surface mixing height, wind speed, stability class, temperature, and wind direction. Urban/rural. Both the airport and the site are in urban locations, and AERMOD’s URBAN option was selected.

Rheingold Rezoning DFEIS Chapter 11: Air Quality
11-19
Stack parameters. EPA defines GEP (good engineering practice) stack height as the height necessary to insure that emissions from a building’s stack do not result in excessive concentrations of any air pollutant in the immediate vicinity of the source as a result of atmospheric downwash, eddies, or wakes that may be created by the source itself, nearby structures, or nearby terrain obstacles. The Building Profile Input Program (BPIP) was run in conjunction with AERMOD. Pollutants. NO2 was analyzed in order to compare the results with the NAAQS 1-hour and annual standards. Emission factors for natural gas were based on an annual consumption rate of 45.2 cubic feet of natural gas per square foot for a residential structure, as indicated in the NYC CEQR Technical Manual (2012). The annual consumption of natural gas, in cubic feet, was converted to pounds using a multiplier of 100 as recommended in Table 1.4-1 of EPA’s AP-42 publication for external combustion sources. The resulting annual emissions were converted to hourly and annual emission rates in grams/second based on 2,400 hours per year of use for heating. Because these emissions represent both NO and NO2 combined, the annual emissions were next multiplied by 0.80 to reflect the component of the total that is nitrogen dioxide. The1-hour emissions were modeled using the PVMRM option in AERMOD in conjunction with 5 years of ozone data for Queens College II. Meteorological Data. The model was run with data from LaGuardia Airport for 2008 through 2012. The upper air station used with La Guardia is Brookhaven. The data was obtained from Trinity Consultants, which provided the following description of the data and processing methods:
BREEZE FILLSFC: The BREEZE FILLSFC program identifies outlying and missing parameters, identifies the percentage of missing unprocessed data (to verify compliance with EPA’s 90% regulation), and specifies how missing data is filled. The program is created to follow the EPA’s guidelines for filling missing data in raw surface files as specified in their Procedures for Substituting Values for Missing NWS Meteorological Data for Use in Regulatory Air Quality Models. BREEZE FILLSFC is a FORTRAN executable program that reads raw surface meteorological data in CD-144 format and fills in missing observations of a length specified by the processor (typically 5 hours). The program measures the data capture of eight parameters: ceiling height, wind direction, wind speed, temperature, total opaque sky, station pressure, relative humidity, and total sky cover. Based on guidelines set forth by the EPA, the parameters are filled in using the following methods:
Ceiling height, Total opaque sky, Station pressure, Relative humidity, and Total sky cover: Filled using persistence – the value prior to a gap of missing hours is persisted through the missing period;
Temperature: Filled using interpolation – missing hours are filled in by
interpolating between the values prior to and following the gap;
Wind Speed: Filled by averaging – an arithmetic average of the four surrounding values (two before and two after) is taken and the gap is filled accordingly;
Wind Direction: Filled by vector averaging – a unit vector average of the four
surrounding values (two before and two after) is taken and the gap is filled accordingly. Only valid wind directions are used in this average - calms and variables are ignored and other steps are taken to ensure only valid data is used.
The program generates a report which details the data capture percentage prior to filling as well as the number of hours filled for each parameter sorted by the method used to fill the missing data.

Rheingold Rezoning DFEIS Chapter 11: Air Quality
11-20
BREEZE FSL Fill: The BREEZE FSL Fill program reads in the raw upper air data files in FSL format and identifies missing soundings. For individual missing soundings, the program fills in the sounding from the same time on the previous day. For consecutive missing days, the first day is filled with the previous day, the last day is filled with the following day and the soundings in between are just left as missing. Using persistence for upper air filling has been used quite extensively and is generally acceptable since upper air conditions vary much less than surface conditions and AERMET uses very limited information from the files in any case. The program also has an option to fill in missing soundings with data from another station should that methodology be necessary. Surface characteristics. Surface characteristics for the project site and meteorological site were identified according to EPA’s AERMOD Implementation Guide. In accordance with the U.S. EPA's AERMOD Implementation Guide dated 08009, Trinity Consultants used their AERSURFACE program for determining surface characteristics to be used in AERMET processing. By default, 12 sectors were implemented for determining surface roughness, and the seasonal averaging period was used. Both the airport and the site are in urban locations, and AERMOD’s URBAN option was selected. The population used for the urban area was 1,700,000, and the default urban surface roughness length of 1.0 m was used for the site. Receptors. Receptor points on the receiving building were assumed to be one foot above the stack height of the source building if the two buildings were the same height. Otherwise, a set of receptors at the same height as the stack were placed on the receiving building if it was taller than the source building. AERMOD Results for Boilers Using Natural Gas Modeling results for boilers using natural gas are shown in Table 11-11 and described below. Since, the one-hour concentrations influence the stack heights and type of boiler, the annual concentrations are shown with the same restrictions as would be required to meet the one-hour NAAQS. The aApplicant’s buildings, as well as the building on Site 5, must place the stacks at least 10 feet above the roof and must also use low NOx boilers. Sites 7 through 11 do not require any restrictions on stack height or boiler type. No significant adverse impacts are projected providing all buildings comply with the conditions shown in Table 11-11. Block 3141: Building A on Building F. Projected Development Site 1 occupying half of Block 3139 would have Buildings A and B based on the illustrative site plan (Figure 11-6). The rectangular buildings would face Flushing Avenue, Montieth Street, and Stanwix Street. Building A, with 90,634 sf of residential/commercial space and a height of 80 feet, would have frontage on Flushing Avenue, Montieth Street, and Stanwix Street. Building B would face the Monteith Street. It would be 70 feet high with about 63,288 sf of heated floor area. The two buildings would be serviced by a single HVAC system, and this would be reflected in a single stack placed atop Building A. The closest building of equal or greater height would be Building F on the south side of Monteith Street. As discussed above, the width of Monteith Street and the sidewalks would be a total of 50 feet. AERMOD modeling showed no potential impacts provided the stack is at least 10 feet above the roof and low NOx boilers are used. Modeling assumed that the stack was 10 feet from the edge of the roof facing Monteith Street. Block 3141: Building F on Building A. Projected Development Site 2 occupying all of Block 3141 would have Buildings C, D, E and F based on the illustrative site plan (Figure 11-6) . The rectangular buildings would face the streets, and the interior of the block would have a courtyard common to all four buildings. Building E, with 82,077 sf of residential/commercial space and a height of 70 feet, would front on Forrest Street. Building F would face the newly mapped Stanwix Street right-of-way. It would be 80 feet high with about 94,769 sf of heated floor area. Building E and Building F would be serviced by a single HVAC system, and this would be reflected in a single stack placed atop Building F. The closest building of equal or greater height would be Building A on the north side of Monteith Street. As discussed above, the width of Monteith Street and the sidewalks would be a total of 50 feet. AERMOD

Rheingold Rezoning DFEIS Chapter 11: Air Quality
11-21
modeling showed no potential impacts provided the stack is at least 10 feet above the roof and low-NOx boilers are used. Modeling assumed that the stack was 10 feet from the edge of the roof facing Monteith Street. Table 11-11: Nitrogen Dioxide AERMOD Concentrations (µg/m3) 1-Hour Concentrations (µg/m3)
Scenario Modeleda Background Total Comments Building A on Building F 27.5 126.8 154.3 10-foot stack and low NOX boilers Building F on Building A 25.4 126.8 153.7 10-foot stack and low NOX boilers Building H on site 5 37.6 126.8 164.4 10-foot stack and low NOX boilers Building I on 87 Melrose 34.1 126.8 160.9 10-foot stack and low NOX boilers Site 5 on Site 9 30.8 126.8 157.6 10-foot stack and low NOX boilers Site 7 on Site 10 9.7 126.8 136.5 No stack or boiler restrictions Site 8 on Site 11 6.8 126.8 133.6 No stack or boiler restrictions Site 9 on Site 5 18.5 126.8 145.2 No stack or boiler restrictions Site 10 on Site 7 7.4 126.8 134.2 No stack or boiler restrictions Site 11 on Site 8 7.1 126.8 134.5 No stack or boiler restrictions
NO2 NAAQS (ug/m3) Standard 188 Annual Concentrations (µg/m3)
Scenario Modeled Background Total Comments Building A on Building F 0.9 41 42.7 10-foot stack and low NOX boilers Building F on Building A 0.4 41 46.4 10-foot stack and low NOX boilers Building H on site 5 1.2 41 45.0 10-foot stack and low NOX boilers Building I on 87 Melrose 0.7 41 45.2 10-foot stack and low NOX boilers Site 5 on Site 9 0.8 41 44.1 10-foot stack and low NOx boilers Site 7 on Site 10 0.1 41 41.1 No stack or boiler restrictions Site 8 on Site 11 0.1 41 41.1 No stack or boiler restrictions Site 9 on Site 5 0.3 41 42.9 No stack or boiler restrictions Site 10 on Site 7 0.1 41 41.1 No stack or boiler restrictions Site 11 on Site 8 0.2 41 41.2 No stack or boiler restrictions
NO2 NAAQS (ug/m3) Standard 100
Notes: a 5-year average of 8th highest concentration Source: Sandstone Environmental Associates, Inc. Block 3152: Building H on Site 5. Projected Development Site 3 occupies the northern half of Block 3152. Building G, on the northwestern side of the block with frontage on Stanwix Street and the newly mapped Noll Street, would have approximately 226,512 sf of heated floor area and a height of 80 feet. Building H would be in the northeast corner of the block with frontage on Evergreen Avenue and the newly mapped Noll Street. It would be 80 feet high with approximately 101,366 sf of heated floor area. The combined total of 327,878 sf would be heated by Building H, and the stack would be on the bulkhead near the southeastern corner of the building. The nearest building of equal or greater height would be the 80-foot high building anticipated for Projected Development Site 5 (Lots 36-38, 41, and 43) on Block 3152. The estimated distance between Building H and the lot line for Projected Development Site 5 is 25 feet. AERMOD modeling showed no potential impacts provided that the stack is at least 10 feet above the roof and low-NOx boilers are used. Modeling assumed that the stack was 10 feet from the edge of the roof facing the courtyard between the two buildings. Block 3152: Building I on 87 Melrose Street. Projected Development Site 4 occupies the southern half of Block 3152 and would be improved with Buildings I and J. Building I on the corner of Melrose and Stanwix Streets would be 70 feet high with approximately 128,215 sf of heated floor area. Building J on the southeastern portion of the block would have frontage on Melrose Street. It would be 70 feet high with approximately 100,962 sf of heated floor area. The presumption is that the taller building, Building I, would have an emission stack for the combined square footage of 229,177. The nearest building of similar

Rheingold Rezoning DFEIS Chapter 11: Air Quality
11-22
or greater height would be 87 Melrose Street on the northwest corner of Melrose and Stanwix Streets. The estimated distance between Building I and a window at 87 Melrose Street is about 50 feet. AERMOD modeling showed no potential impacts provided that the stack is at least 10 feet above the roof and low-NOx boilers are used. Modeling assumed that the stack was 10 feet from the side of the roof facing Stanwyx Street. Block 3152: Projected and Potential Development Sites 5 and 9. Projected Development Site 5 is located at the intersection of Evergreen Avenue and Melrose Street on the southeast corner of Block 3152. A future building on this site would be about 80 feet high with approximately 46,800 sf of heated floor area. The closest building of equal or greater height would be the expected building on Potential Development Site 9, which would have 11,898 heated sf and also would be 80 feet high. The two sites are adjacent to each other.
AERMOD show no potential impacts from Site 5 on Site 9 provided that the heating, ventilating and air conditioning system uses natural gas with low NOx and stack is at least 10 feet above the roof. Modeling assumed that the stack was 10 feet from the side of the roof facing Stanwyx Street.
Site 9 would have no impacts on Site 5 provided that the stack is at least 10 feet from the side of the roof facing Evergreen Avenue
Block 3138: Projected and Potential Development Sites 7 and 10. Projected Development 7 (Lot 32) has frontage on Bushwick and Flushing Avenues. The projected development would have 39,936 sq. ft. of heated space and would be 70 feet high. The nearest building of similar or greater height would be Potential Development Site 10 (Lot 11) on Garden Street, about 40 feet away. Projected Development Site 10 (Lot 11) has frontage on Flushing Avenue and Beaver Street. The projected development would have 18,952 sf of residential and commercial space and would be 70 feet high.
AERMOD showed no potential impacts from Site 7 on Site 10. Modeling assumed that the stack was 10 feet from the rear of the building facing Garden Street.
AERMOD showed no potential impacts from Site 10 on Site 7. Modeling assumed that the stack was 10 feet from the side of the roof facing Flushing Avenue.
Block 3137: Projected and Potential Development Sites 8 and 11. Projected Development Site 8 (Lot 56) and Potential Development Site 11 (Lot 51) are clustered near the corner of Flushing Avenue and Beaver Street on the northwest corner the block. Site 8’s building would be approximately 70 ft high with about 24,677 sf of residential and commercial floor area. Projected Development Site 11 would be about 70 feet high with 14,401 sf of residential and commercial space. The two sites are separated by Lot 49, which is 25 feet wide.
AERMOD showed no potential impacts from Site 8 on Site 11. Modeling assumed that the stack was 10 feet from the side of the roof facing the corner of Flushing Avenue and Beaver Street.
AERMOD showed no potential impacts from Site 11 on Site 8. Modeling assumed that the stack was 10 feet from the side of the roof facing Garden Street.
AERMOD Results for Boilers Using ULSHO #2 New development in New York City has the option of using ultra low sulfur home heating oil #2 (ULSHO#2) for HVAC. This fuel type is limited to 0.15% sulfur. Table 11-12 shows the modeled results for PM2.5 for the non-aApplicant sites that did not show potential exceedances of the PM2.5 24-hour de minimis value. Site 5 is not in the table because it must use natural

Rheingold Rezoning DFEIS Chapter 11: Air Quality
11-23
gas. The aApplicant’s sites are not included because they are committed to using natural gas. The stack restrictions on Site 9 are based on the 24-hour average for PM2.5. Table 11-12: PM2.5 AERMOD Concentrations (µg/m3)
Scenario 24-Hour Concentrations (µg/m3)
Comments Modeled Background Total Site 7 on Site 10 0.3 NA 0.3 No restrictions Site 8 on Site 11 0.3 NA 0.3 No restrictions Site 9 on Site 5 1.1 NA 1.1 10-foot high stack, 10 feet from edge of building
facing Evergreen Avenue Site 10 on Site 7 0.1 NA 0.1 No restrictions Site 11 on Site 8 0.3 NA 0.3 No restrictions
PM2.5 De Minimis (ug/m3) 2.0
Scenario Annual Concentrations (µg/m3)
Comments Modeled Background Total Site 7 on Site 10 0.02 NA 0.02 No restrictions Site 8 on Site 11 0.02 NA 0.02 No restrictions Site 9 on Site 5 0.07 NA 0.07 10-foot high stack, 10 feet from edge of building
facing Evergreen Avenue Site 10 on Site 7 0.01 NA 0.01 No restrictions Site 11 on Site 8 0.02 NA 0.02 No restrictions
PM2.5 De Minimis (ug/m3) 0.3
Source: Sandstone Environmental Associates, Inc. Table 11-13 shows the modeled results for PM10 for sites that may use fuel oil. Based on the concentrations shown in the table, no potential impacts would occur. The stack restrictions for Site 9 are due to the results for PM2.5. and no stack location restrictions would be necessary. Table 11-13: PM10 AERMOD Concentrations (µg/m3) 24-Hour Concentrations (µg/m3)
Scenario Modeled Background Total Comments Site 7 on Site 10 0.3 47 47.3 No restrictions Site 8 on Site 11 0.3 47 47.3 No restrictions Site 9 on Site 5 1.2 47 48.2 10-foot high stack, 10 feet from edge of
building facing Evergreen Avenue Site 10 on Site 7 0.1 47 47.1 No restrictions Site 11 on Site 8 0.3 47 47.3 No restrictions
PM10 NAAQS (ug/m3) Standard 150
Source: Sandstone Environmental Associates, Inc. Table 11-14 shows the resulting SO2 concentrations from the AERMOD modeling with ULSHO#2 for those sites that do not have to use natural gas. No impacts are projected and no stack location restrictions would be required based on the SO2 concentrations.

Rheingold Rezoning DFEIS Chapter 11: Air Quality
11-24
Table 11-14: Sulfur Dioxide AERMOD Concentrations (µg/m3) 1-Hour Concentrations (µg/m3)
Scenario Modeled Background Total Comments Site 7 on Site 10 0.2 79.5 79.7 No restrictions Site 8 on Site 11 0.2 79.5 79.7 No restrictions Site 9 on Site 5 0.2 79.5 79.7 10-foot high stack, 10 feet from edge of
building facing Evergreen Avenue Site 10 on Site 7 0.03 79.5 79.5 No restrictions Site 11 on Site 8 0.2 79.5 79.7 No restrictions SO2
NAAQS (ug/m3) Standard 197 3-Hour Concentrations (µg/m3)
Scenario Modeled Background Total Comments Site 7 on Site 10 0.1 82.4 82.5 No restrictions Site 8 on Site 11 0.1 82.4 82.5 No restrictions Site 9 on Site 5 0.2 82.4 82.6 10-foot high stack, 10 feet from edge of
building facing Evergreen Avenue Site 10 on Site 7 0.01 82.4 82.4 No restrictions Site 11 on Site 8 0.1 82.4 82.5 No restrictions SO2
NAAQS (ug/m3) Standard 1,300 Source: Sandstone Environmental Associates, Inc. Air Toxics Search for Facilities with Operational Emissions Potential adverse effects on the proposed new development from existing industrial emissions are a source of concern as the proposed rezoning area is currently zoned M1-1 and M3-1 and would continue to be located adjacent to areas with manufacturing districts. This section addresses whether toxic emissions currently generated by nearby industrial sources would significantly impact the proposed development sites. According to the CEQR Technical Manual, existing facilities with the potential to cause adverse air quality impacts are those that would require permitting under city, state and federal regulations. The Manual lists the following types of uses as a source of concern for the residential uses that would occur under the proposed action:
large emission source (e.g., solid waste or medical waste incinerators, cogeneration facilities, asphalt and concrete plants, or power generating plants) within 1,000 feet,
a medical, chemical, or research laboratory nearby, a manufacturing or processing facility within 400 feet, and an odor producing facility within 1,000 feet.
To identify facilities in the categories listed above, the manufacturing survey included a field survey, on-line searches of NYSDEC’s Air Permit Facilities Registry and EPA’s Facility Registry System for permitted facilities, an on-line search of data provided by the NYC Department of Buildings, New York City’s Open Accessible Space Information System Cooperative (OASIS) data base, telephone directory listings, available aerial photos provided by Google and Bing, internet websites, NYSDEC’s DAR-1, and a search for NYCDEP permits. A field survey was carried out on October 30, 2009. The purpose of the site visit was to verify information obtained from other sources and to identify facilities that may be required to have permits even though they are not in the NYSDEC or NYCDEP permit data bases. The survey indicated numerous

Rheingold Rezoning DFEIS Chapter 11: Air Quality
11-25
vacant lots and residential uses, as well as a variety of small industrial establishments. No large industrial emission sources were identified within 1,000 feet of the rezoning boundaries. No laboratories or odor-producing facilities were observed within 400 feet of the rezoning boundaries. Based on the field survey and the OASIS data base, a list of industrial and commercial sites were submitted to NYCDEP for a permit search. They are shown in Table 11-15. Table 11-15: Commercial and Industrial Sites within 400 feet of Rezoning Boundaries
Block Lot Address Observed/Listed Land Uses
3117 37 199 Cook Street
754 Lexington Realty Corporation; Amity Textiles Inc ; Beautiful Images; Blue Center International Inc ; LGH 99 Cents & Plus Inc ; Michael Stuart Co
3117 49 173 Cook Street
Back Office of New York, Inc. (mail letter shop & warehousing); OL Furniture Warehouse; Off Location Furniture; Masterseal Windows & Doors Inc.
3118 5 232 Varet Street Di Micco Bros Inc.; Trocom Construction
3118 29 229 Cook Street Warehouse (unconfirmed)
3118 30 225 Cook Street Warehouse (unconfirmed)
3123 12 158 Cook Street Auto Shop
3123 14 162 Cook Street Warehouse (unconfirmed)
3123 15 164 Cook Street Warehouse (unconfirmed)
3123 16 166 Cook Street Warehouse (unconfirmed)
3123 17 168 Cook Street AA Diversified HVAC&R, Inc.
3123 19 172 Cook Street AA Diversified HVAC&R, Inc.
3123 31 961 Flushing Avenue Coral Furniture
3123 32 200 Cook Street Sincere Trading LLC
3123 37 210 Cook Street Textiles, Inc.
3123 52 945 Flushing Avenue Changhe Corporation
3123 65 915 Flushing Avenue Printing Ideas Corporation
3123 67 911 Flushing Avenue Sing Tao Newspaper
3124 13 991 Flushing Avenue Spring Import (wholesale clothing apparel & sleepwear)
3131 12 16 Sumner Place Warehouse (unconfirmed)
3131 27 810 Flushing Avenue M C Paper & Twine Corporation
3133 27 31 Beaver Street Warehouse (unconfirmed)
3152 3 80 Evergreen Avenue UT Wholesale; Fortuneline; Jo International Trading; L & J Restaurant; Manufacturing Import; Priority International, Inc.
3138 13 21 Garden Street Warehouse (unconfirmed)
3152 44 131 Melrose Street City General Builders Inc.; Right Voltage Electrical Corporation; S & A Iron works Inc.
3153 1 87 Evergreen Avenue Warehouse (unconfirmed)
3153 49 17 George Street Warehouse (unconfirmed)
3153 50 15 George Street Warehouse (unconfirmed)
3156 1 95 Evergreen Avenue
AMC Trucking Corporation; Atlantic Clothing International Traders Ltd.; Echad Precision Mach Shop; Evergreen Decorators; Finewool Merchandising Co.; Kimberly Knits; North Atlantic Overseas Ltd; Sares International Inc.; Spectrum Paint Applicator; Sureknit Inc.
3161 9 9 Stanwix Street Warehouse (unconfirmed)
3161 10 595 Bushwick Avenue Oriental Construction Inc.
3162 12 106 Melrose Street Warehouse (unconfirmed)
3162 13 108 Melrose Street Warehouse (unconfirmed)
3162 31 95 Jefferson Street Warehouse (unconfirmed)
3162 40 83 Jefferson Street John Black Plumbing & Heating
3162 47 61 Jefferson Street Metal Crafts Inc.
3163 1 105 Evergreen Avenue Morton Paper Co.
3171 33 88 Jefferson Street Warehouse (unconfirmed)

Rheingold Rezoning DFEIS Chapter 11: Air Quality
11-26
NYCDEP provided six permits for the addresses shown below.
Interior Service Incorporated (Permit PA000788), located at 225 Cook Street; Avant Guards Ltd. (Permit PA010099), located at 234 Varet Street; Jimenez Wire Products (Permit PA017669), located at 173 Cook Street; Parkside Printing Press (Permit PA049499), located at 21 Garden Street; Wolski Wood Works, Inc. (Permits PB85-10K and PB84-10M), located at 21 Garden Street; and A. Barzel Iron Works, Inc. (Permit # PB077001), located at 61 Jefferson Avenue.
Two permits were eliminated from further consideration. The permit for Jimenez Wire Products was shown as cancelled. The expiration date was 1989, and directory searches indicate the facility is no longer present at that address. Similarly, the Parkside Printing Press permit was eliminated because Parkside vacated the building, and Wolski Wood Works is the new tenant. An on-line search of the other four facilities was carried out in November, 2012.
Wolski Wood Works is still present. The current presence of Interior Service, Inc. at 225 Cook Street is uncertain, but it will be
considered to be present as a worst-case analysis. Avant Guards Manufacturing appears to be present at 234 Varet Street. A-Barzel Iron Works was contacted is still present at 61 Jefferson Avenue.
Therefore emissions from Interior Service, Inc., Avant Guards Ltd., A. Barzel Iron Works, Inc., and Wolski Wood Works, Inc. were analyzed. Their locations are shown in Figure 11-6. Interior Service, Inc., at 225 Cook Street (Block 3118, Lot 30) is engaged in spray booth painting operations. The permit for this facility shows that two pollutants are being emitted – isobutyl alcohol and particulates. This spray booth operates four hours per day for 200 days per year. It is approximately 375 feet from the rezoning area boundaries. Avant Guards Ltd, at 234 Varet Street (Block 3118, Lot 5) specializes in manufacturing window guards and security screens for buildings. This facility has a spray booth for powder paint spraying of metal and other hard surfaces, which it operates for 5 hours per day for 104 days per year. The building houses multiple tenants, and the lot extends from Varet Street to Cook Street. As a worst-case analysis, the minimum distance between the lot and the rezoning area boundary, 365 feet, was used in the analysis. No air pollutants or emission rates were listed on the permit. Therefore guidance was obtained from EPA’s AP-42 document. The most similar operation in AP-42 would be metal coating. Based on AP-42, Chapters 4.2.2.4 (Other Metal Coating) and 4.2.2.12 (Metal Furniture Coating), powder coatings contain almost no VOC. Electrostatic spraying, which is common, typically results in a utilization rate of 90 to 95%, which means that 5 to 10% of the paint may be emitted as particulates. Therefore, the primary pollutant of concern for this facility would be particulate matter. A review of the industry practices indicates that powder coatings are sold by the pound. For analysis purposes, however, the paint can be converted to gallons using a conversion factor of 5 pounds per gallon. Thus, the firm’s hourly and daily use of powder paint, in gallons, were converted to pounds, and the pounds were converted to emissions in grams per second. The estimated emissions were equivalent to 10% of the paint used. A Barzel Iron Works at 61 Jefferson Avenue (Block 3162, Lot 47) carries out spray painting of steel fencing and other decorative items. It is about 154 feet from the nearest rezoning boundary. The permit indicates that six pollutants are being emitted – ethylbenzene; xylene; light aromatic hydrocarbon; 1, 3, 5 trimethylbenzene; 1, 2, 4, trimethylbenzene, and particulates. The spray painting is carried out for 1 hour per day for 250 days per year.

Rheingold Rezoning DFEIS Chapter 11: Air Quality
11-27
Figure 11-5: Permit Locations
Source: Sandstone Environmental Associates, Inc. Wolski Wood Works, Inc., at 21 Garden Street (Block 3138, Lot 13) carries out architectural millworking, solid woodworking, and residential development. The permit for this facility indicates that the operations generate particulates from sawdust, solids from a paint spray booth, dipropylglycomether, and 2 prop,1butoxy (propylene glycol monobutyl ether). The facility operates for 8 hours per day, 250 days per year. Particulates from the table saw and belt sander are captured by a bag filter and are not emitted to the outside. Particulates and other pollutants from the spray booth are emitted from a stack that is six feet above the rooftop. This two-story building is within the rezoning boundaries, but is not one of the Projected or Potential Development sites. The stack appears to be about 50 feet from the nearest future development site, which would be the future 80-foot high building on Projected Development Site 6 (Block 3138, Lot 20). It is also in proximity to Projected Development Sites 7 and 10. Industrial Source Screen The industrial source screen from the NYC CEQR Technical Manual provides a table showing pollutant concentrations (ug/m3) at various distances resulting from a point source emitting 1 gram per second of a generic pollutant. It assumes that all inputs represent worst-case conditions for stack temperature, exhaust velocity, and other variables. Both the receptor height and stack height are assumed to be 20 feet high, which is a conservative assumption where the stacks listed in the permits are higher. Most point sources emit pollutants at a lower rate than 1 gram per second. Thus, the estimated emissions at each distance would be scaled downward accordingly. The emissions of various pollutants, which are shown on the permits in pounds, were converted to grams per second for use with the Industrial Source Screen. They were multiplied by the concentrations shown in Table 17-3 of the CEQR Technical Manual (2012) for the distance between the source and receiver. For the purposes of this analysis, the receiver was the nearest rezoning boundary. For Wolski Wood
A Barzel Works (61 Jefferson Ave.)
Avant Guards Ltd. (234 Varet St.)
Interior Service Inc. (225 Cook St.)
Wolski Wood Works, Inc. (21 Garden St.)

Rheingold Rezoning DFEIS Chapter 11: Air Quality
11-28
Works at 21 Garden Street, however, the receiver was the nearest future building of similar or greater height on a Projected or Potential Development Site. This would be Projected Development Site 6, which is about 50 feet from the stack location. For the purposes of a worst-case analysis, the concentrations derived from the Industrial Source Screen for each source facility were summed for each pollutant and compared with the NYC SGCs and AGCs. Particulate matter was also evaluated as PM10 and PM2.5. All particulates were conservatively assumed to be PM10, and 97% of PM10 was assumed to be PM2.5. The estimated short-term and long-term pollutant concentrations are summarized in the Table 11-16. Due to the relatively high particulate emissions estimated for Wolski Woodworks, it was modeled with AERMOD, and the results were incorporated into Table 11-16 along with the other sites that were evaluated using only the Industrial Source Screen. Therefore, more detailed AERMOD modeling was carried out for this site as discussed below. Table 11-16: Summary of Industrial Source Screen Results
CAS Number
Pollutant
Short-Term Results (µg/m3)
Long-Term Results (µg/m3)
Concentration SGC Concentration AGC
00108-67-8 1,3,5 Trimethylbenzene 153 N/A 0.20 290 00095-63-6 1,2,4 Trimethylbenzene 233 N/A 0.31 6 05131-86-8 2 Propy, 1 Butoxy 17 N/A 0.17 N/A 34590-94-8 Dipropylglycolmethether 17 91,000 0.17 1,400 00100-41-4 Ethyl Benzene 383 54,000 0.51 1,000 00078-83-1 Isobutyl Alcohol 356 N/A 1.34 360 64742-95-6 Light Aromatic Hydrocarbon 153 3,800 0.20 100
NY075-00-0 Particulates* 70 380 0.46 45 01330-20-7 Xylene 1,532 4,300 2.02 100
*Includes AERMOD results for Wolski Woodworks Source: Sandstone Environmental Associates, Inc.
AERMOD Modeling for Wolski Woodworks A more refined air quality analysis was carried out for particulates from Wolski Wood Works using EPA’s AERMOD model. The Building Profile Input Program (BPIP) was run in conjunction with AERMOD. The stack on the project site was 18 feet above the ground level. Based on the permit, the stack has an exhaust velocity of 12.8 meters/second (42 feet/second), and an exhaust temperature of 75o F. Particulates were analyzed for the 1-hour, 24-hour and annual time periods in order to compare the results with the NYSDEC SGC and NAAQS. The model was run with data from LaGuardia Airport for 2008 through 2012. Sensitive receptor points were modeled at the edges of the buildings on Potential and Projected Development Sites 6, 7, and 10. Receptor points were placed on the these buildings at elevations of 18, 28, and 38 feet as 18 feet is the modeled release height for the stack on 21 Garden Street. At each receptor elevation, several receptors were modeled across the façades of the buildings. AERMOD was run with a generic emission rate of 1 g/s, and the concentrations for the individual pollutants were obtained by multiplying the generic concentrations by the pollutants’ emission factors. The modeled results show maximum concentrations at an elevation of 38 feet. For the one-hour period, the maximum occurs on the northern façade of Building 10 that borders Wolski and faces Flushing Avenue. For the 24-hour averaging period, the maximum occurs on the southeast corner of Building 6. The maximum annual concentration occurs on the southwestern tip of Building 7. All resulting concentrations are within their relevant guidelines and standards, and no impacts to the Proposed Action are projected as a result of the analysis of Air Toxics.

Rheingold Rezoning DFEIS Chapter 11: Air Quality
11-29
Table 11-17: Wolski Woodworks AERMOD Results (ug/m3)
Pollutant Emission
Factor (g/s) Max. 1-Hour Concentration NYSDEC SGC
Particulates 0.006368611 4.9 380
Dipropylglycolmethether 0.000126111 0.1 91,000
2 Propy, 1butoxy 0.000126111 0.1 NA
Pollutant Emission
Factor (g/s) Max. 24-Hour Concentration NYSDEC SGC
Particulates 0.006368611 1.2 NA
Dipropylglycolmethether 0.000126111 NA NA
2 Propy, 1butoxy 0.000126111 NA NA
Pollutant Emission
Factor (g/s) Max. Annual Concentration NYSDEC AGC
Particulates 0.006368611 0.29 45
Dipropylglycolmethether 0.000126111 0.0 1,400
2 Propy, 1butoxy 0.000126111 0.0 NA
Source: Sandstone Environmental Associates, Inc. Cumulative Hazard Index The single chemical hazard index is the ratio of a hazardous air pollutant concentration divided by its safe exposure level. It is applied to pollutants with noncancer effects and typically represents long-term (chronic) exposures of one year. A cumulative hazard index is the sum of the individual hazard indexes. If the cumulative hazard index exceeds one, people are exposed to levels of hazardous air pollutants that may pose significant noncancer health risks over a lifetime of exposure, even though the hazard indexes for individual pollutants are within the safe exposure levels. Table 11-18 shows the individual and cumulative hazard indexes for the pollutants emitted by the four facilities with permits. All are listed as noncarcinogenic in DAR-1. The cumulative hazard index is 0.09, which is below the threshold criterion of 1.0 that would indicate significant noncancer health risks. This indicates that the potential long-term effects of existing industrial emission sources on the new residential development sites are not considered to be significant. Table 11-18: Cumulative Hazard Index
CAS Number
Pollutant Long-Term Results (µg/m3)
Hazard Index Concentration AGC
00108-67-8 1,3,5 Trimethylbenzene 0.20 290 0.0007 00095-63-6 1,2,4 Trimethylbenzene 0.31 6 0.0513 05131-86-8 2 Propy, 1 Butoxy 0.17 N/A N/A 34590-94-8 Dipropylglycolmethether 0.17 1,400 0.0001 00100-41-4 Ethyl Benzene 0.51 1,000 0.0005 00078-83-1 Isobutyl Alcohol 1.34 360 0.0037 64742-95-6 Light Aromatic Hydrocarbons 0.20 100 0.0020
NY075-00-0 Particulates* 0.46 45 0.0103
01330-20-7 Xylene 2.02 100 0.0202
Cumulative Hazard Index 0.0889
N/A = Not applicable. *Includes concentrations from AERMOD modeling for Wolski Woodworks.

Rheingold Rezoning DFEIS Chapter 11: Air Quality
11-30
F. CONCLUSIONS AND RECOMMENDATIONS Mobile Sources The Proposed Action would not generate air quality impacts for CO or fine particulates. It screens out for CO impacts because project-generated traffic would fall below the threshold of 170 vehicles through in intersection during a peak traffic hour. The screen for PM10/PM2.5 indicated the need for modeling. Modeling of the intersection of Melrose Street and Bushwick Avenue included fine particulates from exhaust fugitive dust. The analysis showed no potential for impacts due to PM10 or PM2.5. Parking Facilities No impacts due to underground parking are projected. The largest parking facility was analyzed with two scenarios. One scenario specified an exhaust stack in a second floor interior courtyard with potential receptors at: 1) the nearest window of similar height and 2) standing in the courtyard. The second scenario specified an exhaust stack above the garage entrance on Monteith Street with receptors at the near and far sidewalk. The far sidewalk included a line source contribution from Monteith Street. No 1-hour or 8-hour CO impacts to the receptor points were identified. Air Toxics Air pollutant emissions from industrial uses within 400 feet of the rezoning boundaries would not generate significant adverse impacts. An industrial source screen analysis of cumulative emissions from permitted facilities using CEQR TM Table 17-3 values and AERMOD modeling showed no potential for significant adverse impacts on the proposed action development sites. Stationary HVAC Sources No large emission sources within 1,000 feet of the rezoning area are likely to cause adverse air quality impacts. This is due to their distances, the heights of their stacks, and the lack of a direct line of site to the rezoning area. For HVAC, the aApplicant has committed to using natural gas with low NOx burners and stack heights of 10 feet above rooftop. Developers of the non-aApplicant owned sites have the choice of using ULSHO #2 or natural gas with restrictions as stated in the E-designation for HVAC. However, Sites 5 and 9 must use natural gas for HVAC. Air Quality (E) Designations The analysis determined that some sites would require (E) designations that would specify the type of fuel to be used, the type of boilers, and the height of the vent stack above the roof. The proposed (E) designations for the applicable projected and potential development sites with respect to HVAC systems are presented below. The (E) designations for the aApplicant’s development sites are based on the aApplicant’s illustrative building design for these sites, as shown on Figure 11-4 and Figure 11-6. Any changes to the heights or configurations of the buildings or tiers may necessitate revisions to the (E) designations. Block 3139, Lots 18-21, 23-26, and 27-36 (Projected Development Site 1, Buildings A and B): Any
new residential and/or commercial development on the above-referenced properties must ensure that the heating, ventilating and air conditioning stack(s) are placed on building A, which is configured

Rheingold Rezoning DFEIS Chapter 11: Air Quality
11-31
for Lots 18-21 and 23-26. The stack must discharge at least 90 feet above ground level and at least 10 feet from the Monteith Street lot line. The development must also ensure that the type of fuel used for the HVAC system is natural gas with low NOx only. Adherence to these conditions would avoid any potential significant adverse air quality impacts.
Block 3141, Lots 1, 5-8, 10, 11, 12, 14, 15, 18, (Projected Development Site 2, Buildings C and D): Any new residential and/or commercial development on the above-referenced properties must ensure that the type of fuel used for space heating and hot water (HVAC) systems is natural gas only, to avoid any potential significant adverse air quality impacts.
Block 3141, Lots 20, 21, 22, 23,36 (Projected Development Site 2,Buildings E and F):Any new
residential and/or commercial development on the above-referenced properties must ensure that the heating, ventilating and air conditioning stack(s) are placed on building F, which is configured for Lots 20 (part), 21, 22, 23 (part). The stack must discharge at least 90 feet above ground level and at least 10 feet from the Monteith Street lot line. The development must also ensure that the type of fuel used for the HVAC system is natural gas with low NOx only. Adherence to these conditions would avoid any potential significant adverse air quality impacts.
Block 3152, Lots 3 (part) and 48 (part) (Projected Development Site 3, Buildings G and H): Any new
residential and/or commercial development on the above-referenced properties must ensure that the heating, ventilating and air conditioning stack(s) are placed on building H, which is configured for Lots 3 (part) and 48 (part). The stack must discharge at least 90 feet above ground level and at least 10 feet from the lot line facing Melrose Street. The development must also ensure that the type of fuel used for the HVAC system is natural gas with low NOx only. Adherence to these conditions would avoid any potential significant adverse air quality impacts.
Block 3152, (Lots 3 (part) 48 (part), 1, 2, 45, 48 56, 58, 62-64, and 66 (Projected
Development Site 4, Buildings I and J): Any new residential and/or commercial development on the above-referenced properties must ensure that the heating, ventilating and air conditioning stack(s) are placed on building I, which is configured for Lots 3 (part) 1, 2, 56, 62-64, and 66 and are at least 80 above ground level. The stack must be at least 10 feet from the lot line facing Stanwix Street. The development must also ensure that the type of fuel used for the HVAC system is natural gas with low NOx only. Adherence to these conditions would avoid any potential significant adverse air quality impacts.
Block 3152, Lots 36, 37, 38, 41, 43 (Projected Development Site 5): Any new residential and/or
commercial development on the above-referenced properties must use natural gas with low NOx only for HVAC and ensure that the heating, ventilating and air conditioning stack are at least 10 feet above the roof to avoid any potential significant adverse air quality impacts. The stack must be at least 10 feet from the lot line facing Stanwix Street. Adherence to these conditions would avoid any potential significant adverse air quality impacts.
Block 3137, Lot 56 (Projected Development Site 8): Any new residential and/or commercial development on the above-referenced properties must ensure that the heating, ventilating, and air conditioning stack must discharge at least 10 feet from the lot line facing potential development site 11, Lot 51.
Block 3152, Lot 44 (Potential Development Site 9): Any new residential and/or commercial
development on the above-referenced properties must ensure that the heating, ventilating and air conditioning stack must discharge at least 10 feet from the lot line facing potential development site 5, Lots 36-38, 41, and 43.

Rheingold Rezoning DFEIS Chapter 11: Air Quality
11-32
Block 3138, Lot 11(Potential Development Site 10): Any new residential and/or commercial development on the above-referenced properties must ensure that the heating, ventilating, and air conditioning stack must discharge at least 10 feet from the lot line facing potential development site 7, Lot 32.
Block 3137, Lot 51 (Potential Development Site 11): Any new residential and/or commercial
development on the above-referenced properties must ensure that the heating, ventilating, and air conditioning stack must discharge at least 10 feet from the lot line facing potential development site 8, Lot 11.
With (E) designations, the potential impacts from the projected and potential development sites heating systems would not exceed the applicable NAAQS and would therefore not have potential significant adverse environmental impacts on air quality.