
CHAPTER 3 STRATIGRAPHY - OERA · CHAPTER 3 STRATIGRAPHY. Central Scotian Slope Study –CANADA...
26
CHAPTER 3 STRATIGRAPHY
Transcript of CHAPTER 3 STRATIGRAPHY - OERA · CHAPTER 3 STRATIGRAPHY. Central Scotian Slope Study –CANADA...
CHAPTER 3
STRATIGRAPHY

Central Scotian Slope Study – CANADA – July 2016
STRATIGRAPHY - INTRODUCTION
INTRODUCTION
Objectives
The objective of Chapter 3 is to update the Mesozoic-Cenozoic stratigraphic framework of the Sable Sub-basinin order to refine the current understanding of the petroleum system in the area.
Results of the study are:
• A lithostratigraphic update of Sable Sub-basin based on facies and lithological interpretation, for eightrelevant stratigraphic surfaces delimited by nine key seismic horizons;• A second order stratigraphic breakdown for each well studied illustrating the major stratigraphic sequences(PL. 3.3.1 to PL.3.3.5; Appendix 1.4);• An updated stratigraphic and lithostratigraphic chart for the Sable Sub-basin (PL 3.2.1 and 3.3.5) adaptedfrom the Scotian Margin stratigraphic chart;• A chronostratigraphic and lithostratigraphic interpretation of 3 key seismic transects;
• A set of GDE maps for each key intervals (PL. 6.3.4 to 6.3.15).
Well Database and Methodology
The well database consists of ten key wells (Table 1) distributed over Sable Sub-basin from shelf to deepwater (Figure 1). These wells were used for refining the lithostratigraphy and sequence stratigraphy of thearea.The composite geological well logs are presented in Appendix 1.4. They display (1) a suite of logs (GR, NPHIcurve, RHOB); (2) a lithological column; (3) biostratigraphic surfaces; (4) formation tops; (5) sequencestratigraphic breakdown and (6) depositional environments.
• Well lithology and petrophysics
Lithological, petrological and petrophysical interpretations were obtained from PFA 2011 data set (OETR,2011) and used as such. Such information includes qualitative log interpretations, mud reports, geological mudlogs, existing composite well logs, and master logs.
For each well, lithologies were obtained from final well reports cross checked with electrofacies analysis. Thequalitative lithological interpretation presented in composite logs is determined by statistical electrofaciesdetermination through cluster analysis. The resulting lithologies (clastics and carbonates) are computed fromlog responses calibrated on cutting descriptions and master logs.
• Biostratigraphy in wells
No new quantitative biostratigraphic analyses have been performed on key wells for the current study.Biostratigraphy from the 2011 PFA study and subsequent published work (Weston et al., 2012) were enoughto conduct the current work.
• Stratigraphic sequence breakdown and depositional environment in wells
The stratigraphic sequence breakdown was determined in 2011 except on Banquereau C21, Thebaud I93 andVenture B52. For these three wells, the stratigraphic breakdown was performed by correlation with nearbywells (Figure 1; PL. 3.3.1 and 3.3.2).Up to five, second order stratigraphic sequences, with average duration of 3-15 Ma, are defined from MiddleJurassic to late Oligocene. Obtained second order sequences are propagated at the Sable Sub-basin scalethrough seismic mapping and well correlations.
• Well correlations
In order to provide a broad picture of the Sable petroleum system, two parallel transects were completed onthe shelf and slope, and a dip wheeler section (shelf to slope) was updated from the 2011 PFA.
Content
Chapter 3 includes:
• A lithologic and stratigraphic overview of Sable Sub-basin supported by an updated Stratigraphic Chart of thearea (Figure 2). This overview establishes the stratigraphic framework that will be used in the current study;
• Two well correlation panels that illustrate the vertical and lateral variation of sedimentary facies anddepositional environments through time (PL. 3.3.1 to 3.3.4);
• One lithostratigraphic section in time that shows the impact of geological events on sequence thickness andthe spatial distribution of depositional sequences (PL. 3.3.5).Stratigraphic framework results will be used in Chapter 6 for :
• Three key seismic transects interpreted in terms of seismic stratigraphy (PL. 6.1.1 to 6.1.3) showing the 2Dgeometry of the full sedimentary system and successive depositional sequences in response to geologicalevents;• A set of GDE maps for each key interval (PL. 6.3.4 to 6.3.15).
Introduction
Table 1: Selected wells for the stratigraphic framework study: 7 key wells (from the 2011 PFA) and 3 additional wells from the current study.
Figure 1: Wells and correlation transect location across the Shelburne Sub-basin.
PL. 3.1
Well ID Company Year Latitude Longitude RT WD TD WellClassification
Formation at TD TD Geological age Study
Alma F67 Shell Pex et al 1984 43°36'17.98" 60°39'56.75" 24 68 5054 Gas Well Mic_Mac/L. Missisauga Tithonian PFA 2011
Annapolis G24 Marathon Cda 2002 43°23'22.94" 59°48'29.19" 35.5 1711 6182 Gas WellVerrill Canyon /M.Missisauga
Hauterivian PFA 2011
Balvenie B79 Imperial Oil 2003 43°08'01.29" 60°10'56.84" 25 1803 4750 Gas ShowLogan Canyon /Shortland
ShaleMid Albian PFA 2011
Banquereau C21 Petrocan 1982 44°10'07.52" 58°34'00.24' 27 83 4991 Gas WellVerrill Canyon /M.
MissisaugaValanginian Current Study
Chebucto K90 Bow Valley 1984 43°39'44.73" 59°42'51.52" 22.8 86 5235 Gas WellVerrill Canyon /M.
MissisaugaHauterivian PFA 2011
Crimson F81 Marathon Cda 2004 43°20'22.29" 59°42'57.03" 21.4 2092 6676 Gas ShowVerrill Canyon /M.
MissisaugaValanginian PFA 2011
Glenelg J48 Shell Petrocan 1983 43°37'38.57" 60°06'24.84" 24 87 5148 Gas Well Mic_Mac/L. Missisauga Berriasian/tithonian PFA 2011
Tantallon M41 Shell/PCI et al 1986 43°50'55.96" 58°22'23.99" 24 1516 5602 Gas ShowVerrill Canyon /M.
MissisaugaValanginian PFA 2011
Thebaud I93 Mobil et al 1985 43°52'44.54" 60°13'50.94" 37 31 5166 Gas Well Mic_Mac/L. Missisauga Tithonian Current Study
Venture B52 Mobil et al 1983 44°01'12.88" 59°38'07.76" 34 19.5 5960 Gas Well Mic_Mac/L. Missisauga Tithonian Current Study

CHAPTER 3.1
STRATIGRAPHIC FRAMEWORK
Regional Geology and Stratigraphic Framework Overvi ew

Central Scotian Slope Study – CANADA – July 2016
STRATIGRAPHY
Overview PL. 3.1.1
Regional Geology and Stratigraphic Framework Overview
The Sable Sub-basin corresponds to the central slope of the Scotian Margin and has been the main focus of offshore oil and gasexploration in Nova Scotia, with several commercial discoveries since the 1970s leading to the development of the Sable OffshoreEnergy Project in the late 1990s early 2000s (http://www.cnsopb.ns.ca/offshore-activity/offshore-projects/sable-offshore-energy-project). The Sub-basin is bounded landward by the Abenaki Sub-basin and to the west by LaHave Platform; it expands offshoreover Missisauga and Alma Ridges (PL. 2.1.18). The Sable Sub-basin It may correspond to the thickest post-rift sedimentaccumulation of the entire margin, with a total average thickness exceeding 14 km (Kendell et al., 2016).
The sedimentary record of the Sub-basin spans the last 250 million years with continuous sedimentation from the initial opening ofthe Atlantic Ocean to the recent post-glacial period (Figures 2 to 4). The Sub-basin was fed by clastic sediments from a largedrainage system over the northeastern Canadian Shield corresponding to the proto St. Lawrence estuary. The exact size of thedrainage system and organisation of related tributaries are not yet well understood, although recent work has revealed a complexhistory of shift in drainage areas in response to the Avalon uplift (Tsikouras et al., 2011; Li et al., 2012; Strathdee, 2012).
PRE-RIFT
The Scotian Basin developed after the breakup of Pangea when North America rifted and separated from the African continent (seeChapter 2). It consists of a series of alternating horsts and grabens, or platforms and depocenters, namely the LaHave Platform,Abenaki Sub-basin, Missisauga Ridge, Migrant Ridge, Venture Ridge, Alma Ridge and Sable Sub-basin.
The boundaries of these platforms and basins may have been defined by regularly-spaced oceanic fracture zones that extended landward ontocontinental crust (Welsink et al., 1989). A northeast trending basement hinge zone is also present along the margin, defining the landward limit ofmaximum tectonic extension and an abrupt seaward increase in basement depth due to thermal subsidence. Together, these basement elementsexerted a strong control on sediment distribution in the region for more than 250 million years (PL. 2.1.1 to 2.1.12; Chapter 2).
SYN-RIFT
Red beds and evaporites were the dominant deposits during the late pre-rift phase (Wade and MacLean, 1990) (Figure 2). Rifting began in themiddle-early Late Triassic Period, about 250 – 225 Ma. At that time, Nova Scotia was located in a near equatorial position adjacent to Morocco,with most of its older Paleozoic rocks having direct Moroccan affinities (Schenk et al., 1980). A series of narrow, interconnected rift basins werecreated during the rifting phase and were filled with fluvial and lacustrine red bed sediments, as well as volcanic rocks. By the Rhaetian –Hettangian transition (Triassic – Jurassic), the North American and African plates had moved northward, with the Nova Scotia – Moroccan regionin an arid subequatorial climate zone. Renewed Late Triassic rifting further to the north and east in the Grand Banks / Iberia region led to the firstincursions of marine waters from the eastern Tethys paleo-ocean into the interconnected syn-rift basins. Restricted shallow marine conditions wereestablished with some mixed clastic - carbonate sedimentation (Eurydice Formation; PL. 3.1.5 Figure 8). Due to the hot and dry climate, theshallow seas were repeatedly evaporated, resulting in the precipitation of extensive salt and minor anhydrite deposits that were as much as 2.0 kmthick in the central parts of the rift system (Argo Formation; Figures 2 to 4).
Figure 2: Detailed Stratigraphic Chart incorporating all sedimentary and geological events as well as major anoxic events. (Modified and updated from PFA 2011).
It has been suggested that Triassic sediment deposition started inthe Scotian Basin before any other basin along the EasternCanadian Margin (Wade and MacLean, 1990). The distribution ofred beds, Euridice and Argo Fms varies from Sub-basin to Sub-basin, with some recording considerable amount of syn-rift redbeds (Wade and MacLean, 1990). The syn-rift record offshorefrom Alma Ridge is not well known as it is often poorly imageddue to the impact of the salt on seismic data.
Grabens formed during the rifting acted as loci for clasticdeposition for newly established fluvial drainage systems (Figure5). Renewed tectonism in the central rift basin during the EarlyJurassic (Hettangian) is recorded by the complex faulting anderosion of Late Triassic and Early Jurassic sediments and olderrocks. This phase of the rifting process resulted in the formationof a Breakup Unconformity (J200), which coincided with the finalseparation of the North America and Africa continents, thecreation of true oceanic crust through volcanism, and opening ofthe proto-Atlantic Ocean (see Chapter 2). As a result of theBreakup Unconformity (J200), the heavily faulted, complexterrane of grabens and basement highs along the Scotian Marginunderwent a significant degree of peneplanation.

Central Scotian Slope Study – CANADA – July 2016
STRATIGRAPHY
OverviewPL. 3.1.2
Figure 3: Geological cross-sections showing stratigraphic relationshipsfrom the LaHave Platform to the Sable Sub-basin (modified from Wadeand MacLean, 1990).
EARLY POST-RIFT
Marine transgression after the Breakup Unconformity (J200 maker ) led to the development of a shallow and restricted seawithin which thin sequences of carbonate and clastic sediments accumulated. By the late Early Jurassic, tidally influenceddolomites and clastics formed in localized areas under slightly restricted marine conditions (Iroquois Formation ). In themeantime, a thick succession of coarse grained clastic sediments and shales from fluvial sources was deposited on themargins (Mohican Formation ). Clastic sediments infilled grabens and basement highs were buried by the early MiddleJurassic (Wade and MacLean, 1990) (Figure 3 and 4). The deep water portion of the basin was infilled with marine mud.
The Atlantic Ocean became broader and deeper by the Middle Jurassic, with water depth exceeding 1000m. Prominentcarbonate banks developed and persisted until the Late Jurassic – Early Cretaceous (Figures 3 and 4). Growth of thecarbonate banks alternated with Upper Jurassic and Lower Cretaceous deltaic successions. The thick carbonate banksformed during the Jurassic correspond to the Abenaki Formation (Figures 3 and 4) which can be Subdivided into 3 members:
• Scatarie Member: consists of a carbonate succession that was established along the basin hinge zone and prograded outinto deeper water where marls and clastic muds were deposited;
• Misaine Member : consists of a shale dominated interval formed at a time were carbonates and clastic sediments on theshelf were blanketed by transgressive marine shales;
• Baccaro Member: correspond to a late-Middle to Late Jurassic interval. The succession corresponds to carbonate reef,bank and platform environments formed along the basin hinge line on the LaHave Platform.
LATE POST RIFT
The Late Jurassic (Oxfordian – Tithonian) sees the establishment of large clastic sedimentarysystems, for instance the Sable Delta complex in the Huron and Laurentian Sub-basins, and slightlylater in the Sable Sub-basin (Figures 3 to 5). These sediments were primarily sourced from theadjacent Silurian to Permian sediments that covered the entire Atlantic Provinces and parts of NewEngland (Pe-Piper & Piper, 2004; Pe-Piper & MacKay, 2006) (Figures 5 and 6). This first phase of deltaprogradation produced the Mic Mac Formation and equivalent . This Formation is characterized bysandy fluvial channels and sandy delta front cyclically interfingering with prodelta and marine shales ofthe Verrill Canyon Formation and equivalent .
During the Middle Jurassic and Cretaceous the sediment load on the shelf edge and slopesaccentuated the subsidence and also mobilized the salt, creating a complex slope morphology (e.g.Kidson et al., 2002; Shimeld, 2004) analogous to other basins with mobile salt substrates (e.g. the Gulfof Mexico). Shelf and slope deformations are associated with the development of seaward-dippinggrowth faults (Figure 3; see also Chapter 2). This time interval also coincides with the beginning of aregional uplift called the Avalon uplift associated to one or more significant thermal anomalies asevidence by the widespread igneous rocks and dikes spread in Nova Scotia and Newfoundland, as wellas the Newfoundland seamounts east of the Grand Banks (Wade and MacLean, 1990; Bowman et al.,2012; Pe-Piper et al., 2015). This uplift phase resulted in an increase of sediment supply leading to thedevelopment of significant deltas along the coast.
Around the Late Hauterivian – Late Cenomanian time, the uplift induced a rerouting of the LaurentianChannel to the south through the Bay of Fundy which led to a massive input of sediment into theShelburne Sub-basin and a decrease of clastic input into the Sable Sub-basin (Li et al., 2012;Stradhee, 2012; Figures 5 and 6). The overall increase in sediment load during the Late Jurassic andEarly Cretaceous accentuated salt mobility leading to the formation of diapirs, pillows, canopies andrelated salt features (see Chapter 2 PL. 2.1.13 to 2.1.21). During periods of low sea level, rivers incisedthe exposed outer shelf sediments and formed shelf-edge delta complexes (Cummings 2004;Cummings and Arnott, 2005). Such deltas supplied turbidity currents and mass transport deposits tothe slope, generating potential reservoirs in canyons and intra-slope and salt mini basins (CNSOPB,2012; Deptuck et al., 2014; Kendell et al., 2016).
Figure 4: General geology of the Scotian Basin (from Fensome and Williams eds., 2001; modified CNSOPB, 2009).

Central Scotian Slope Study – CANADA – July 2016
STRATIGRAPHY
Overview PL. 3.1.3
During the Early Cretaceous, the ancestral St. Lawrence River was well established (Figures 6). Increases of clasticsediment supply into the Scotian Basin overwhelmed and buried the carbonate reefs and banks. A series of thick sand-richdeltaic strand plains, carbonate shoals and shallow marine shelf successions dominated sedimentation throughout the EarlyCretaceous (Missisauga Formation and equivalent ; Figures 3 and 4). The Sable Delta prograded rapidly southwest intothe Laurentian, Huron and Sable Sub-basins and over the Banquereau Platform (Figures 4 and 6). Along the LaHavePlatform, small local rivers draining from the mainland of southwest Nova Scotia (Figure 6) provided modest amounts ofsands and shales to this region.
In the late Early Cretaceous, a major marine transgression called the Aptian MFS was followed by drastic decreases ofdeltaic sedimentation which was replaced by thick marine shales corresponding to the Naskapi Member of the LoganCanyon Formation (Figure 2). Transgressive shales were periodically interrupted by influxes of coarse clastic sediment inthe Albian-Cenomanian (Cree and Marmora Members of the Logan Canyon Formation ; Wade and MacLean, 1990).The sand was deposited along a broad coastal plain and shallow shelf. During the Late Cretaceous the margin underwentstructural readjustments following the end of the Avalon uplift. The margin was then characterized by a significant relativesea level rise related to basin subsidence. The proto St. Lawrence River returned to its former location but with its mainoutlet northward of Sable Sub-basin (Figure 6).
During the Turonian- Santonian, sediment supply decreased from the lower relief hinterland and the sand was replaced bydeeper water marine shales and limestones corresponding to the Dawson Canyon Formation (Figure 2). During this period,the Scotian Basin recorded marine marls and chalks of the Wyandot Formation (Figures 2, 3 and 4).
Banquereau Formation formed during the Tertiary and corresponds to marine mudstones and sandstones. Several majorunconformities related to relative sea level falls occurred throughout the Tertiary . The St. Lawrence outlet migratednorthward to its current location and built up a large turbidite system (Figure 6). During the Quaternary several hundredmeters of glacio-marine sediments were deposited across the Scotian Basin with the main ice stream located within the St.Lawrence channel.
Figure 5: Map showing the structural and geomorphic evolution of the Scotian Basin and its hinterland from late Triassic to early Cretaceous: (a) late Triassic; (b) early Jurassic; (c) middle Jurassic; (d) Tithonian–Valanginian. (From Li et al., 2012).
Figure 6: Map showing proposed paleogeography of Atlantic Canada during the early Cretaceous (fromStrathdee, 2012). During the early Cretaceous, sources are broadly distributed across the margin. During the lateHauterivian – Late Cenomanian interval, the main river systems are blocked by uplift south of the Cobequid-Chedabucto fault zone and related volcanism and therefore rerouted to the Bay of Fundy. (For furtherinformation, see Pe-Piper et al., 2011; Tsikouras et al., 2011).
Modified from Strathdee (2012)
Early Cretaceous Aptian Late Cretaceous

Detailed Stratigraphic Framework

Central Scotian Slope Study – CANADA – July 2016
STRATIGRAPHY
Stratigraphic Framework PL. 3.1.4
.
Generalized Stratigraphy of the Scotian Basin
The Scotian Basin contains Mesozoic-Cenozoic sedimentary rocks up to 15km thick in places, which were depositedduring the rifting of Pangea and the opening of the North Atlantic (Figure 7).
The earliest basin infill occurred during the Triassic rifting, and consists of red continental clastic sediments andevaporites (Euridice and Argo Formation ; Figure 8).
During the Early Jurassic , rift basins were gradually infilled by clastic and carbonate sediments (Figure 7a). Fullymarine conditions developed by Mid Jurassic , leading to a set of alluvial plains, deltaic and carbonate environments(Figure 7b).
Consecutive to the Avalon Uplift , the Early Cretaceous was dominated by deltaic progradation and shelf clasticdeposits (Figure 7c).
Late Cretaceous / Early Tertiary sedimentary deposits were dominated by transgressive shale, sporadic influxes ofdeltaic sands, limestone, and chalk sequences (Figure 7d).
Relative sea level fluctuations during the Paleogene and Neogene created a mix of marine sandstones and shalesinterbedded with coarse clastics and marine carbonates (chalks). These sedimentary successions are overlaid byunconsolidated glacial till, glacio-marine and marine sediments that were deposited during the Quaternary.
Figure 7: Paleogeography of the easternCanadian margin from Early Jurassic to MiddleCretaceous (Sibuet et al., 2012). Study area isindicated by the red box.
Stratigraphic Marker Stratigraphic surface Stage Equivalent Formation Alma F67 Annapolis G24 Balvenie B79 Banquereau C21 Chebucto K90 Crimson F81 Glenelg J48 Tantallon M41 Thebaud I93 Venture B52
T29 Unconformity Rupelian Banquereau 2513 3113 3037 2526
T50 Unconformity Ypresian Dawson CanyonPetrel
WyandotYpresian chalk
3354 3444 1209 1640 3485 1515 3109 949
K94 Unconformity Cenomanian 3491 3825 1909 1910 3655 1774 3263 1309 1500
K101 Unconformity Albian
Logan CanyonShortland Shale
NaskapiRoseway
1908 3852 4204 2389 2640 3990 2300 3704 1746 1907
Mid Alb unc Unconformity Albian 2170 4002 4296
Alb/Apt mfs MFS Albian/Aptian 2323 4274 3318 4548 3218 4122
Intra Aptian mfs MFS Aptian 2675 4470 3557 4722 3386
Apt/Barr unc Unconformity Aptian/ Barremian 3168 4563 3689 4772 3480 4400
K130 MFS Hauterivian
Missisauga/VerilllCanyon
3730 5285 4175 4853 5928 4061 4738 3311 3564
Hauterivian unc. Unconformity Hauterivian 4150 5143
K137 Unconformity Valanginian 4448 4715 4118 4468
J150 MFS TithonianAbenakiMicMac
4985 4591 5235
Table 2: Well markers and biostratigraphic surfaces.
a b
c d
Central Scotian Slope Study – CANADA – July 2016
STRATIGRAPHY
PL. 3.1.5
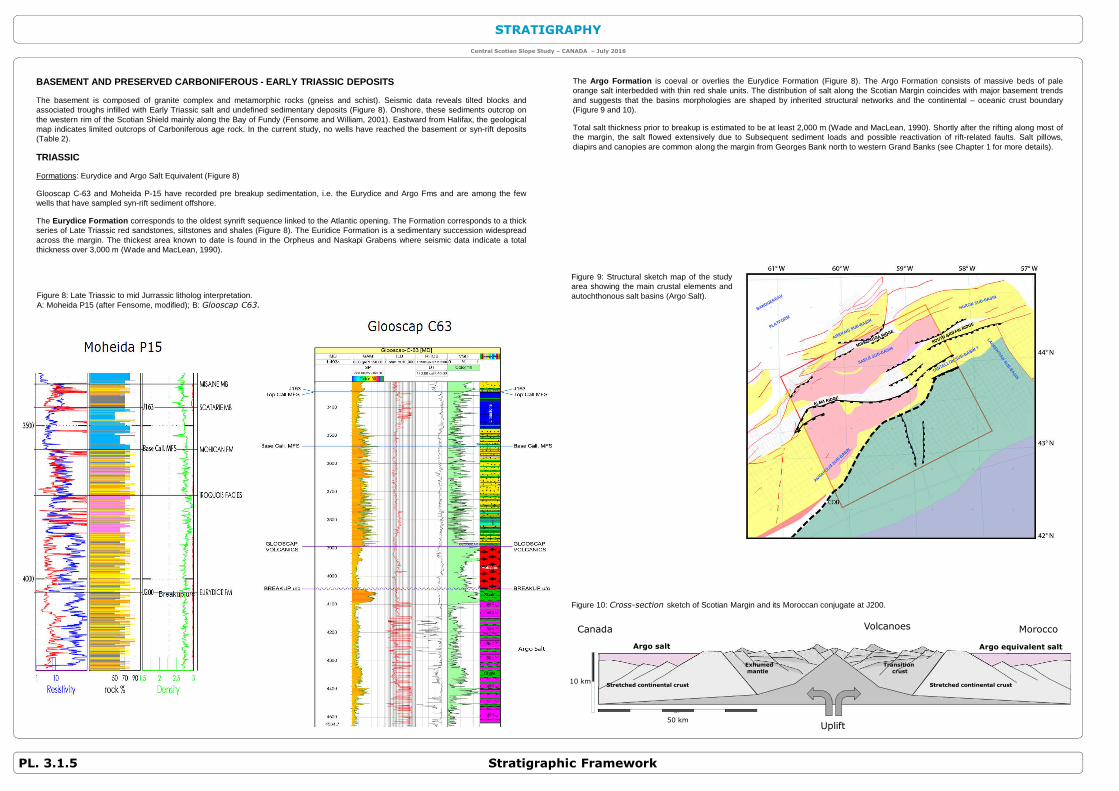
Figure 9: Structural sketch map of the studyarea showing the main crustal elements andautochthonous salt basins (Argo Salt).
50 km
10 km
MoroccoCanada
Stretched continental crust Stretched continental crust
Exhumedmantle
Transitioncrust
Argo salt Argo equivalent salt
Volcanoes
Uplift
BASEMENT AND PRESERVED CARBONIFEROUS - EARLY TRIASSI C DEPOSITS
The basement is composed of granite complex and metamorphic rocks (gneiss and schist). Seismic data reveals tilted blocks andassociated troughs infilled with Early Triassic salt and undefined sedimentary deposits (Figure 8). Onshore, these sediments outcrop onthe western rim of the Scotian Shield mainly along the Bay of Fundy (Fensome and William, 2001). Eastward from Halifax, the geologicalmap indicates limited outcrops of Carboniferous age rock. In the current study, no wells have reached the basement or syn-rift deposits(Table 2).
TRIASSIC
Formations: Eurydice and Argo Salt Equivalent (Figure 8)
Glooscap C-63 and Moheida P-15 have recorded pre breakup sedimentation, i.e. the Eurydice and Argo Fms and are among the fewwells that have sampled syn-rift sediment offshore.
The Eurydice Formation corresponds to the oldest synrift sequence linked to the Atlantic opening. The Formation corresponds to a thickseries of Late Triassic red sandstones, siltstones and shales (Figure 8). The Euridice Formation is a sedimentary succession widespreadacross the margin. The thickest area known to date is found in the Orpheus and Naskapi Grabens where seismic data indicate a totalthickness over 3,000 m (Wade and MacLean, 1990).
Figure 8: Late Triassic to mid Jurrassic litholog interpretation.A: Moheida P15 (after Fensome, modified); B: Glooscap C63.
Figure 10: Cross-section sketch of Scotian Margin and its Moroccan conjugate at J200.
The Argo Formation is coeval or overlies the Eurydice Formation (Figure 8). The Argo Formation consists of massive beds of paleorange salt interbedded with thin red shale units. The distribution of salt along the Scotian Margin coincides with major basement trendsand suggests that the basins morphologies are shaped by inherited structural networks and the continental – oceanic crust boundary(Figure 9 and 10).
Total salt thickness prior to breakup is estimated to be at least 2,000 m (Wade and MacLean, 1990). Shortly after the rifting along most ofthe margin, the salt flowed extensively due to Subsequent sediment loads and possible reactivation of rift-related faults. Salt pillows,diapirs and canopies are common along the margin from Georges Bank north to western Grand Banks (see Chapter 1 for more details).
Stratigraphic Framework

Central Scotian Slope Study – CANADA – July 2016
STRATIGRAPHY
Stratigraphic Framework PL. 3.1.6
BREAKUP UNCONFORMITY - J200
The J200 Breakup Unconformity (BU) is dated to the Early Jurassic (200 Ma; Figure 11) and separates the synrift and post rift sequences.The unconformity corresponds to the opening of the North Atlantic Ocean and is traced from the Shelburne Sub-basin up to the LaurentianSub-basin. Seismically, the unconformity is characterized by a strong reflection, which can be mapped regionally.
EARLY TO MIDDLE JURASSIC J200 – J163
The Early to Middle Jurassic stage corresponds to the development of large river systems with deltaic environments along the shorecombined with large carbonate rims and platforms on the shelf (Iroquois Fm ) (Figures 5, 11 and 12). The Sable Sub-basin records its firstpulses of clastic sediments during the late Early Jurassic forming the first turbidite deposits offshore. This sequence corresponds to theMohican Fm or offshore equivalent Fm (Given, 1977; Deptuck et al., 2014 ).
Toward the middle Jurassic, clastic input decreases and carbonate platform extends, sporadically cut by deltas developed at river mouthcomplexes (Figures 13). In Sable Sub-basin, a wide carbonate platform developed along the outer hinge zone (Figure 3) and corresponds tothe northward extension of the Abenaki carbonate bank . The lower part of the Abenaki Fm corresponds to the Scatarie Mbr. (Figure 14 to17). The Scatarie Mbr. correspond to a carbonate dominated formation widely developed across the margin and predominantly composed ofoolitic limestone (Wade and MacLean, 1990). The Scatarie Mbr. is restricted to the shelf part of the margin, while the basin is dominated bymarine shale deposits overlaying a Mohican turbidite system (Figure 13). The Scatarie Mbr. is drowned by transgressive marine shalescorresponding to the Misaine Mbr. , the transgression that reaches its maximum with the Callovian mfs (J163) .
Identification
• Formation/Member equivalents: Iroquois Fm. (carbonate platform), Mohican Fm . (clastic sands), Scatarie Mbr. (carbonate platform),Misaine Mbr. (marine shale)
• Number of exploration wells that reached the Early to Middle Jurassic: None of the wells used in the current study have encountered theseformations. For wells that have reached the cited formations, see the 2011 PFA (http://energy.novascotia.ca/oil-and-gas/offshore/play-fairway-analysis);
• Regional top sequence/seismic horizon: J163 (Top Scatarie; Callovian MFS) ;
• Age: Hettangian – Callovian .Figure 11: Gross depositional environment map at J200(Hettangian). The J200 period is the transition from rifting to drifting.
Figure 12: Sinemurian/Pliensbachian limit (190 Ma) Mohican – Iroquois Fm
Figure 13: Gross depositional environment map for the Scatarie Mbr. This period is marked by the developmentof a thick oolitic limestone sequence combined with marine shale deposits overlaying a Mohican turbidite system(blue dashed line is the 3000 m present day water depth).
Central Scotian Slope Study – CANADA – July 2016
STRATIGRAPHY
Stratigraphic FrameworkPL. 3.1.7
Description
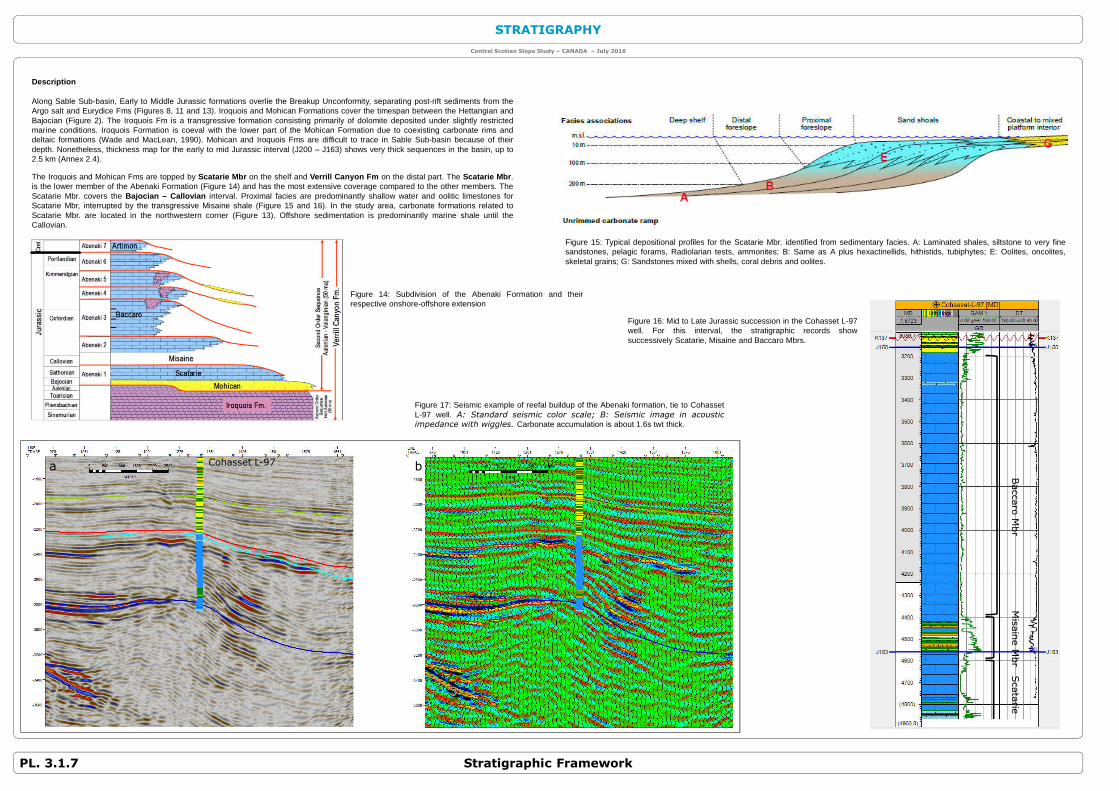
Along Sable Sub-basin, Early to Middle Jurassic formations overlie the Breakup Unconformity, separating post-rift sediments from theArgo salt and Eurydice Fms (Figures 8, 11 and 13). Iroquois and Mohican Formations cover the timespan between the Hettangian andBajocian (Figure 2). The Iroquois Fm is a transgressive formation consisting primarily of dolomite deposited under slightly restrictedmarine conditions. Iroquois Formation is coeval with the lower part of the Mohican Formation due to coexisting carbonate rims anddeltaic formations (Wade and MacLean, 1990). Mohican and Iroquois Fms are difficult to trace in Sable Sub-basin because of theirdepth. Nonetheless, thickness map for the early to mid Jurassic interval (J200 – J163) shows very thick sequences in the basin, up to2.5 km (Annex 2.4).
The Iroquois and Mohican Fms are topped by Scatarie Mbr on the shelf and Verrill Canyon Fm on the distal part. The Scatarie Mbr .is the lower member of the Abenaki Formation (Figure 14) and has the most extensive coverage compared to the other members. TheScatarie Mbr. covers the Bajocian – Callovian interval. Proximal facies are predominantly shallow water and oolitic limestones forScatarie Mbr, interrupted by the transgressive Misaine shale (Figure 15 and 16). In the study area, carbonate formations related toScatarie Mbr. are located in the northwestern corner (Figure 13). Offshore sedimentation is predominantly marine shale until theCallovian.
Figure 15: Typical depositional profiles for the Scatarie Mbr. identified from sedimentary facies. A: Laminated shales, siltstone to very finesandstones, pelagic forams, Radiolarian tests, ammonites; B: Same as A plus hexactinellids, hithistids, tubiphytes; E: Oolites, oncolites,skeletal grains; G: Sandstones mixed with shells, coral debris and oolites.
Figure 17: Seismic example of reefal buildup of the Abenaki formation, tie to CohassetL-97 well. A: Standard seismic color scale; B: Seismic image in acousticimpedance with wiggles. Carbonate accumulation is about 1.6s twt thick.
Figure 16: Mid to Late Jurassic succession in the Cohasset L-97well. For this interval, the stratigraphic records showsuccessively Scatarie, Misaine and Baccaro Mbrs.
Figure 14: Subdivision of the Abenaki Formation and theirrespective onshore-offshore extension
Mis
ain
eM
br
Scata
rieBaccaro
Mbr
Cohasset L-97a b
Central Scotian Slope Study – CANADA – July 2016
STRATIGRAPHY
Stratigraphic Framework PL. 3.1.8
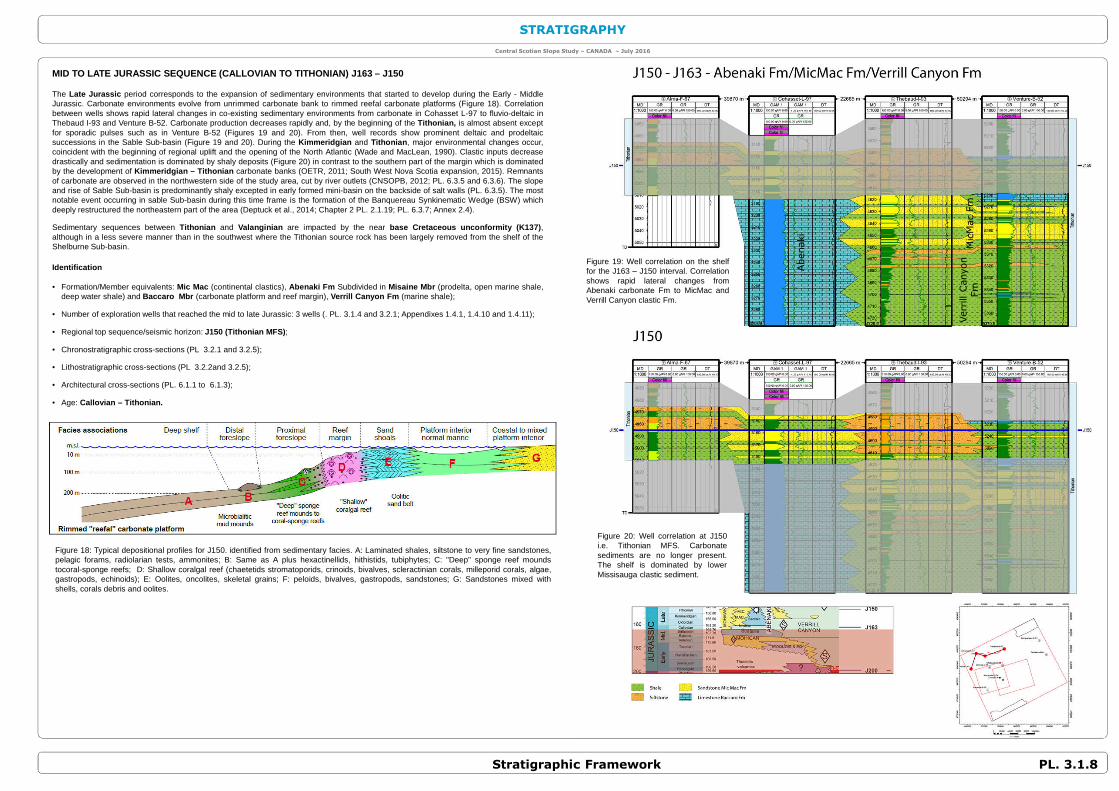
MID TO LATE JURASSIC SEQUENCE (CALLOVIAN TO TITHONIAN) J163 – J150
The Late Jurassic period corresponds to the expansion of sedimentary environments that started to develop during the Early - MiddleJurassic. Carbonate environments evolve from unrimmed carbonate bank to rimmed reefal carbonate platforms (Figure 18). Correlationbetween wells shows rapid lateral changes in co-existing sedimentary environments from carbonate in Cohasset L-97 to fluvio-deltaic inThebaud I-93 and Venture B-52. Carbonate production decreases rapidly and, by the beginning of the Tithonian, is almost absent exceptfor sporadic pulses such as in Venture B-52 (Figures 19 and 20). From then, well records show prominent deltaic and prodeltaicsuccessions in the Sable Sub-basin (Figure 19 and 20). During the Kimmeridgian and Tithonian , major environmental changes occur,coincident with the beginning of regional uplift and the opening of the North Atlantic (Wade and MacLean, 1990). Clastic inputs decreasedrastically and sedimentation is dominated by shaly deposits (Figure 20) in contrast to the southern part of the margin which is dominatedby the development of Kimmeridgian – Tithonian carbonate banks (OETR, 2011; South West Nova Scotia expansion, 2015). Remnantsof carbonate are observed in the northwestern side of the study area, cut by river outlets (CNSOPB, 2012; PL. 6.3.5 and 6.3.6). The slopeand rise of Sable Sub-basin is predominantly shaly excepted in early formed mini-basin on the backside of salt walls (PL. 6.3.5). The mostnotable event occurring in sable Sub-basin during this time frame is the formation of the Banquereau Synkinematic Wedge (BSW) whichdeeply restructured the northeastern part of the area (Deptuck et al., 2014; Chapter 2 PL. 2.1.19; PL. 6.3.7; Annex 2.4).
Sedimentary sequences between Tithonian and Valanginian are impacted by the near base Cretaceous unconformity (K137) ,although in a less severe manner than in the southwest where the Tithonian source rock has been largely removed from the shelf of theShelburne Sub-basin.
Identification
• Formation/Member equivalents: Mic Mac (continental clastics), Abenaki Fm Subdivided in Misaine Mbr (prodelta, open marine shale,deep water shale) and Baccaro Mbr (carbonate platform and reef margin), Verrill Canyon Fm (marine shale);
• Number of exploration wells that reached the mid to late Jurassic: 3 wells (. PL. 3.1.4 and 3.2.1; Appendixes 1.4.1, 1.4.10 and 1.4.11);
• Regional top sequence/seismic horizon: J150 (Tithonian MFS) ;
• Chronostratigraphic cross-sections (PL 3.2.1 and 3.2.5);
• Lithostratigraphic cross-sections (PL 3.2.2and 3.2.5);
• Architectural cross-sections (PL. 6.1.1 to 6.1.3);
• Age: Callovian – Tithonian.
Figure 18: Typical depositional profiles for J150. identified from sedimentary facies. A: Laminated shales, siltstone to very fine sandstones,pelagic forams, radiolarian tests, ammonites; B: Same as A plus hexactinellids, hithistids, tubiphytes; C: "Deep" sponge reef moundstocoral-sponge reefs; D: Shallow coralgal reef (chaetetids stromatoporids, crinoids, bivalves, scleractinian corals, milleporid corals, algae,gastropods, echinoids); E: Oolites, oncolites, skeletal grains; F: peloids, bivalves, gastropods, sandstones; G: Sandstones mixed withshells, corals debris and oolites.
Figure 19: Well correlation on the shelffor the J163 – J150 interval. Correlationshows rapid lateral changes fromAbenaki carbonate Fm to MicMac andVerrill Canyon clastic Fm.
Figure 20: Well correlation at J150i.e. Tithonian MFS. Carbonatesediments are no longer present.The shelf is dominated by lowerMissisauga clastic sediment.
Abenaki
Verr
illCanyon
Fm
Mic
Mac
Fm

Central Scotian Slope Study – CANADA – July 2016
STRATIGRAPHY
Stratigraphic FrameworkPL. 3.1.9
Description
Mic Mac Formation
The Mic Mac Formation is the lateral equivalent of the Mohawk Formation observed in the southern part of the Scotian Marginand corresponds to a mixed carbonate – clastic system (Figure 19, 20 and 22; PL 3.3.1, 3.3.2 and 6.3.5). The Mic Mac Fm iscoeval to the Bacaro Member of the Abenaki Fm and spans the late-Middle to Late Jurassic. Its depositional environment istypically very shallow marine evolving quickly through time into outer neritic; these changes are controlled by the subsidence rateof the different parts of the Scotian Margin (Wade and MacLean, 1990). In Sable Sub-basin, the Formation is typically composedof sandstone and limestone topsets, sandstone to shale foresets and shale to sandstone bottomsets (Wade and MacLean, 1990).Significant lateral facies changes are observed, such as in Venture field area where shallow water sandstones quickly change to apredominance of shelfal shales interbedded with sandstones, siltstones and lilmestones (Figures 19 and 20). Distally, the Mic Macfacies grades into the Verrill Canyon Formation characterized by a fine grained basinal facies. The distinction between Mic Macand lower Missisauga Fms is not evident as the contact is very often gradual (Figures 19 and 20). It is often considered that thetransition between the two formations occurs during the Jurassic – Cretaceous transition (Wade and MacLean, 1990).
Verrill Canyon Formation
The Verrill Canyon Formation is a shale-dominated unit that formed from the Jurassic to Early Cretaceous . The Formationwas deposited on the continental shelf, slope and rise and consists primarily of grey to brown calcareous shale with occasionalthin beds of limestone, siltstone, and sandstone. Verrill Canyon Formation is the prodeltaic and deep water facies equivalent ofthe Mohawk, Abenaki, Mic Mac, and Missisauga Formations .
Abenaki Formation
The Abenaki Formation is a limestone-dominated unit corresponding to a prominent carbonate bank facies. The Formationextends across the Scotian Margin to Georges Bank (Figure 21). The Abenaki Formation forms an outer shelf carbonate bankcomplex and is subdivided into three members: The Scatarie Member, the Misaine Member and the Baccaro Member (Figure 14).
The Misaine Member is a dark grey calcareous shale-dominated unit with interbedded proximal sandstone deposited during theCallovian regional transgressive event. It is the only clastic-dominated unit of the Abenaki Fm (Kidson et al., 2005). It is atransgressive facies and overlies the Scatarie Mbr (Figure 16). The Misaine Member is observed in only a few wells in the area;mostly wells that have targeted the carbonate banks (PFA 2011). In Cohasset L-97 (Figure 16), the Misaine Mbr is 150 m thick, butthicknesses up to 250m have been described (PFA 2011).
The Baccaro Member , which developed from early Oxfordian to Tithonian times, is the thickest carbonate unit of the AbenakiFormation although relatively limited in areal extend (narrow structure of 15 – 20 km width). It is composed of numerous aggradingand prograding parasequences of oolitic limestone with minor shale and sand intervals.
Figure 21: Abenaki Formation morphology, carbonate facies complex after A. Kidson et al., 2005.
NEAR BASE CRETACEOUS UNCONFORMITY (TITHONIAN TO BERRIASIA N) J150 – K137
During the Late Jurassic, a second breakup episode occurred on the eastern Canadian margin related to the separation of Iberia and the GrandBanks. An uplift related to the opening developed beneath the Grand Banks and led to extensive erosion of Jurassic and older sediments. Theresulting Avalon Unconformity is well recorded across the eastern Canadian margin (Jansa and Wade, 1975; MacLean et al., 1989; Wade andMacLean, 1990). The Avalon Uplift induced a massive erosion of upper Jurassic sequences resulting in a drastic reduction of space available toaccommodate sedimentation. The impact of the Avalon Uplift decreases southward and therefore its impact is less severe in Sable Sub-basinwhere no clear angular unconformity is observed (PL. 4.3.2.7). This period coincides with a time of low sedimentation rates which issuperimposed on the unconformity and is expressed as condensed sequences in the basinal part of the margin.
The Avalon Uplift was accompanied by magmatism and a thermal anomaly that lasted until Hauterivian – Barremian time (Bowman et al., 2012).Widespread volcanic activity has been evidenced from several wells and outcrops. Initially, it was proposed that the long-lived magma sourcewould impact hydrocarbon maturation (Bowman et al., 2012). Nonetheless, recent work suggests that the anomalies observed in some SableSub-basin wells are more likely related to hydrothermal circulation along salt structures (Pe-Piper et al., 2015).
Identification
• Formation/Member equivalents: Lower Missisauga (continental clastics), Verrill Canyon Fm ;
• Number of exploration wells that reached the late Jurassic: 4 wells (. PL. 3.1.4, 3.2.1 and 3.3.2; Appendixes 1.4.1, 1.4.8, 1.4.10 and 1.4.11);
• Regional top sequence/seismic horizon: K137 (near base Cretaceous unconformity) ;
• Chronostratigraphic cross-sections (PL 3.2.1 and 3.2.5);
• Lithostratigraphic cross-sections (PL 3.2.2and 3.2.5);
• Architectural cross-sections (PL. 6.1.1 to 6.1.3);
• Age: Tithonian – Berriasian .
Figure 22: Well correlation on the shelffocused on the Lower Missisauga Fm (J150– K137 interval). The geological sectionshows thick clastic succession laterallyshifting from a shale dominated area (AlmaF-67) to sand dominated interval (Venture B-52).
Central Scotian Slope Study – CANADA – July 2016
STRATIGRAPHY
EARLY CRETACEOUS SEQUENCE (BERRIASIAN - HAUTERIVIAN) K137 -K130
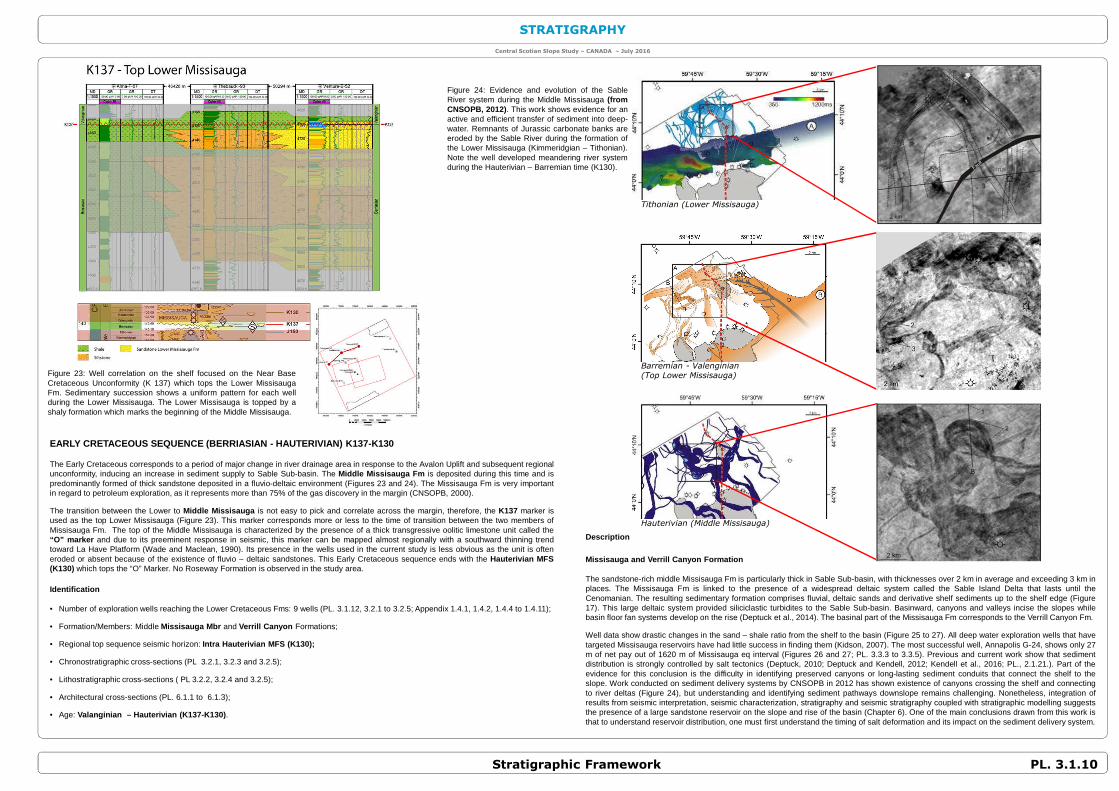
The Early Cretaceous corresponds to a period of major change in river drainage area in response to the Avalon Uplift and subsequent regionalunconformity, inducing an increase in sediment supply to Sable Sub-basin. The Middle Missisauga Fm is deposited during this time and ispredominantly formed of thick sandstone deposited in a fluvio-deltaic environment (Figures 23 and 24). The Missisauga Fm is very importantin regard to petroleum exploration, as it represents more than 75% of the gas discovery in the margin (CNSOPB, 2000).
The transition between the Lower to Middle Missisauga is not easy to pick and correlate across the margin, therefore, the K137 marker isused as the top Lower Missisauga (Figure 23). This marker corresponds more or less to the time of transition between the two members ofMissisauga Fm. The top of the Middle Missisauga is characterized by the presence of a thick transgressive oolitic limestone unit called the“O” marker and due to its preeminent response in seismic, this marker can be mapped almost regionally with a southward thinning trendtoward La Have Platform (Wade and Maclean, 1990). Its presence in the wells used in the current study is less obvious as the unit is ofteneroded or absent because of the existence of fluvio – deltaic sandstones. This Early Cretaceous sequence ends with the Hauterivian MFS(K130) which tops the “O” Marker. No Roseway Formation is observed in the study area.
Identification
• Number of exploration wells reaching the Lower Cretaceous Fms: 9 wells (PL. 3.1.12, 3.2.1 to 3.2.5; Appendix 1.4.1, 1.4.2, 1.4.4 to 1.4.11);
• Formation/Members: Middle Missisauga Mbr and Verrill Canyon Formations;
• Regional top sequence seismic horizon: Intra Hauterivian MFS (K130);
• Chronostratigraphic cross-sections (PL 3.2.1, 3.2.3 and 3.2.5);
• Lithostratigraphic cross-sections ( PL 3.2.2, 3.2.4 and 3.2.5);
• Architectural cross-sections (PL. 6.1.1 to 6.1.3);
• Age: Valanginian – Hauterivian (K137-K130) .
Figure 23: Well correlation on the shelf focused on the Near BaseCretaceous Unconformity (K 137) which tops the Lower MissisaugaFm. Sedimentary succession shows a uniform pattern for each wellduring the Lower Missisauga. The Lower Missisauga is topped by ashaly formation which marks the beginning of the Middle Missisauga.
Figure 24: Evidence and evolution of the SableRiver system during the Middle Missisauga (fromCNSOPB, 2012). This work shows evidence for anactive and efficient transfer of sediment into deep-water. Remnants of Jurassic carbonate banks areeroded by the Sable River during the formation ofthe Lower Missisauga (Kimmeridgian – Tithonian).Note the well developed meandering river systemduring the Hauterivian – Barremian time (K130).
Description
Missisauga and Verrill Canyon Formation
The sandstone-rich middle Missisauga Fm is particularly thick in Sable Sub-basin, with thicknesses over 2 km in average and exceeding 3 km inplaces. The Missisauga Fm is linked to the presence of a widespread deltaic system called the Sable Island Delta that lasts until theCenomanian. The resulting sedimentary formation comprises fluvial, deltaic sands and derivative shelf sediments up to the shelf edge (Figure17). This large deltaic system provided siliciclastic turbidites to the Sable Sub-basin. Basinward, canyons and valleys incise the slopes whilebasin floor fan systems develop on the rise (Deptuck et al., 2014). The basinal part of the Missisauga Fm corresponds to the Verrill Canyon Fm.
Well data show drastic changes in the sand – shale ratio from the shelf to the basin (Figure 25 to 27). All deep water exploration wells that havetargeted Missisauga reservoirs have had little success in finding them (Kidson, 2007). The most successful well, Annapolis G-24, shows only 27m of net pay out of 1620 m of Missisauga eq interval (Figures 26 and 27; PL. 3.3.3 to 3.3.5). Previous and current work show that sedimentdistribution is strongly controlled by salt tectonics (Deptuck, 2010; Deptuck and Kendell, 2012; Kendell et al., 2016; PL., 2.1.21.). Part of theevidence for this conclusion is the difficulty in identifying preserved canyons or long-lasting sediment conduits that connect the shelf to theslope. Work conducted on sediment delivery systems by CNSOPB in 2012 has shown existence of canyons crossing the shelf and connectingto river deltas (Figure 24), but understanding and identifying sediment pathways downslope remains challenging. Nonetheless, integration ofresults from seismic interpretation, seismic characterization, stratigraphy and seismic stratigraphy coupled with stratigraphic modelling suggeststhe presence of a large sandstone reservoir on the slope and rise of the basin (Chapter 6). One of the main conclusions drawn from this work isthat to understand reservoir distribution, one must first understand the timing of salt deformation and its impact on the sediment delivery system.
Hauterivian (Middle Missisauga)
Barremian - Valenginian(Top Lower Missisauga)
Tithonian (Lower Missisauga)
Stratigraphic Framework PL. 3.1.10
Central Scotian Slope Study – CANADA – July 2016
STRATIGRAPHY
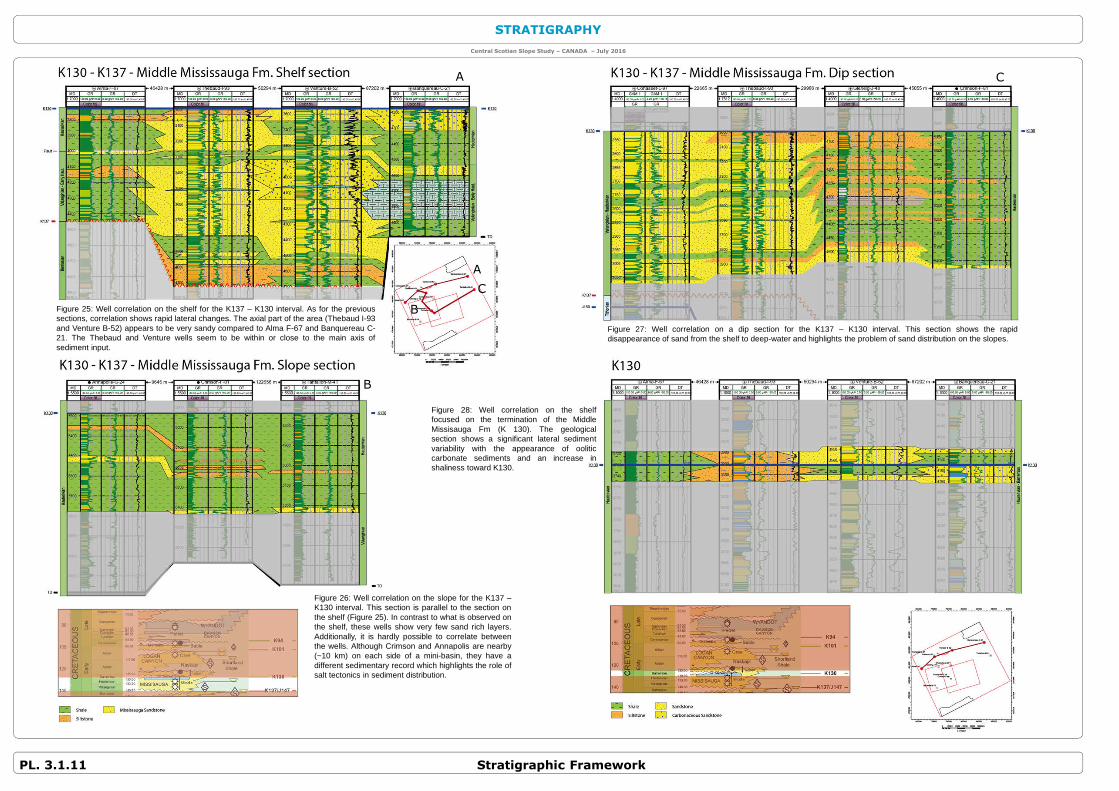
Figure 26: Well correlation on the slope for the K137 –K130 interval. This section is parallel to the section onthe shelf (Figure 25). In contrast to what is observed onthe shelf, these wells show very few sand rich layers.Additionally, it is hardly possible to correlate betweenthe wells. Although Crimson and Annapolis are nearby(~10 km) on each side of a mini-basin, they have adifferent sedimentary record which highlights the role ofsalt tectonics in sediment distribution.
Figure 25: Well correlation on the shelf for the K137 – K130 interval. As for the previoussections, correlation shows rapid lateral changes. The axial part of the area (Thebaud I-93and Venture B-52) appears to be very sandy compared to Alma F-67 and Banquereau C-21. The Thebaud and Venture wells seem to be within or close to the main axis ofsediment input.
Figure 27: Well correlation on a dip section for the K137 – K130 interval. This section shows the rapiddisappearance of sand from the shelf to deep-water and highlights the problem of sand distribution on the slopes.
Figure 28: Well correlation on the shelffocused on the termination of the MiddleMissisauga Fm (K 130). The geologicalsection shows a significant lateral sedimentvariability with the appearance of ooliticcarbonate sediments and an increase inshaliness toward K130.
A
B
C
A
B
C
Stratigraphic FrameworkPL. 3.1.11
Central Scotian Slope Study – CANADA – July 2016
STRATIGRAPHY
Stratigraphic Framework PL. 3-1-12
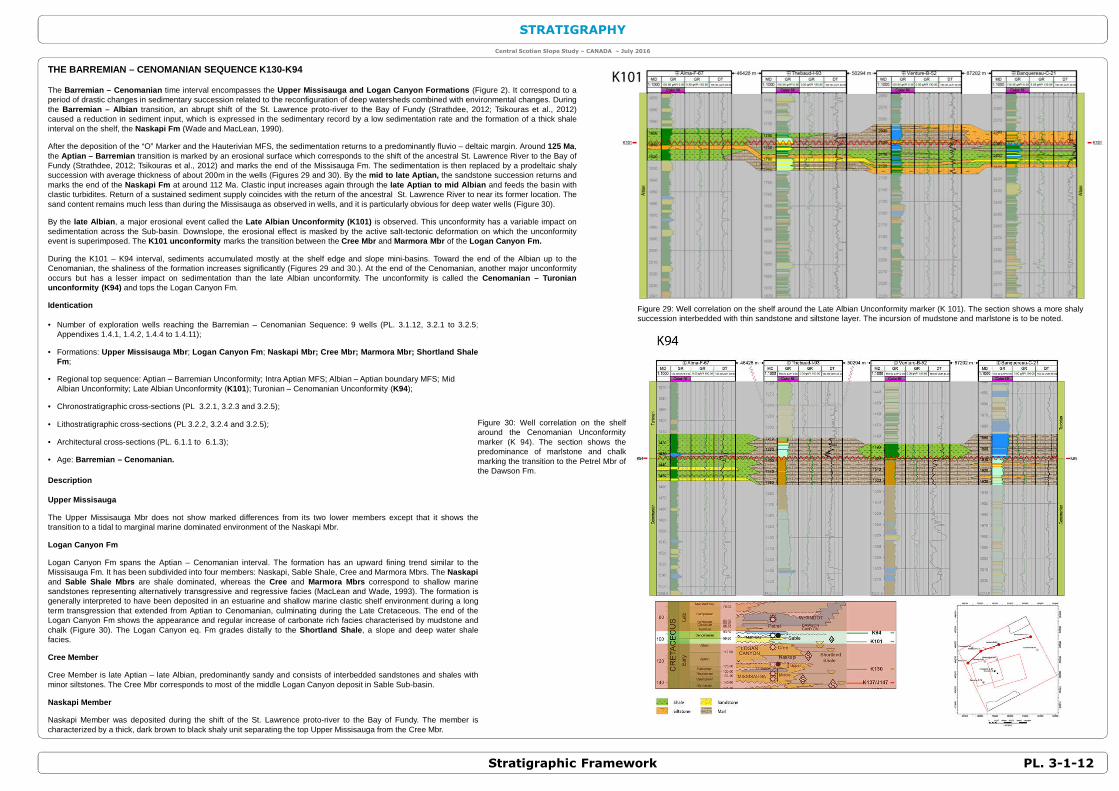
THE BARREMIAN – CENOMANIAN SEQUENCE K130-K94
The Barremian – Cenomanian time interval encompasses the Upper Missisauga and Logan Canyon Formations (Figure 2). It correspond to aperiod of drastic changes in sedimentary succession related to the reconfiguration of deep watersheds combined with environmental changes. Duringthe Barremian – Albian transition, an abrupt shift of the St. Lawrence proto-river to the Bay of Fundy (Strathdee, 2012; Tsikouras et al., 2012)caused a reduction in sediment input, which is expressed in the sedimentary record by a low sedimentation rate and the formation of a thick shaleinterval on the shelf, the Naskapi Fm (Wade and MacLean, 1990).
After the deposition of the “O” Marker and the Hauterivian MFS, the sedimentation returns to a predominantly fluvio – deltaic margin. Around 125 Ma,the Aptian – Barremian transition is marked by an erosional surface which corresponds to the shift of the ancestral St. Lawrence River to the Bay ofFundy (Strathdee, 2012; Tsikouras et al., 2012) and marks the end of the Missisauga Fm. The sedimentation is then replaced by a prodeltaic shalysuccession with average thickness of about 200m in the wells (Figures 29 and 30). By the mid to late Aptian, the sandstone succession returns andmarks the end of the Naskapi Fm at around 112 Ma. Clastic input increases again through the late Aptian to mid Albian and feeds the basin withclastic turbidites. Return of a sustained sediment supply coincides with the return of the ancestral St. Lawrence River to near its former location. Thesand content remains much less than during the Missisauga as observed in wells, and it is particularly obvious for deep water wells (Figure 30).
By the late Albian , a major erosional event called the Late Albian Unconformity (K101) is observed. This unconformity has a variable impact onsedimentation across the Sub-basin. Downslope, the erosional effect is masked by the active salt-tectonic deformation on which the unconformityevent is superimposed. The K101 unconformity marks the transition between the Cree Mbr and Marmora Mbr of the Logan Canyon Fm.
During the K101 – K94 interval, sediments accumulated mostly at the shelf edge and slope mini-basins. Toward the end of the Albian up to theCenomanian, the shaliness of the formation increases significantly (Figures 29 and 30.). At the end of the Cenomanian, another major unconformityoccurs but has a lesser impact on sedimentation than the late Albian unconformity. The unconformity is called the Cenomanian – Turonianunconformity (K94) and tops the Logan Canyon Fm.
Identication
• Number of exploration wells reaching the Barremian – Cenomanian Sequence: 9 wells (PL. 3.1.12, 3.2.1 to 3.2.5;Appendixes 1.4.1, 1.4.2, 1.4.4 to 1.4.11);
• Formations: Upper Missisauga Mbr ; Logan Canyon Fm ; Naskapi Mbr; Cree Mbr; Marmora Mbr; Shortland ShaleFm;
• Regional top sequence: Aptian – Barremian Unconformity; Intra Aptian MFS; Albian – Aptian boundary MFS; Mid Albian Unconformity; Late Albian Unconformity (K101); Turonian – Cenomanian Unconformity (K94);
• Chronostratigraphic cross-sections (PL 3.2.1, 3.2.3 and 3.2.5);
• Lithostratigraphic cross-sections (PL 3.2.2, 3.2.4 and 3.2.5);
• Architectural cross-sections (PL. 6.1.1 to 6.1.3);
• Age: Barremian – Cenomanian.
Description
Upper Missisauga
The Upper Missisauga Mbr does not show marked differences from its two lower members except that it shows thetransition to a tidal to marginal marine dominated environment of the Naskapi Mbr.
Logan Canyon Fm
Logan Canyon Fm spans the Aptian – Cenomanian interval. The formation has an upward fining trend similar to theMissisauga Fm. It has been subdivided into four members: Naskapi, Sable Shale, Cree and Marmora Mbrs. The Naskapiand Sable Shale Mbrs are shale dominated, whereas the Cree and Marmora Mbrs correspond to shallow marinesandstones representing alternatively transgressive and regressive facies (MacLean and Wade, 1993). The formation isgenerally interpreted to have been deposited in an estuarine and shallow marine clastic shelf environment during a longterm transgression that extended from Aptian to Cenomanian, culminating during the Late Cretaceous. The end of theLogan Canyon Fm shows the appearance and regular increase of carbonate rich facies characterised by mudstone andchalk (Figure 30). The Logan Canyon eq. Fm grades distally to the Shortland Shale , a slope and deep water shalefacies.
Cree Member
Cree Member is late Aptian – late Albian, predominantly sandy and consists of interbedded sandstones and shales withminor siltstones. The Cree Mbr corresponds to most of the middle Logan Canyon deposit in Sable Sub-basin.
Naskapi Member
Naskapi Member was deposited during the shift of the St. Lawrence proto-river to the Bay of Fundy. The member ischaracterized by a thick, dark brown to black shaly unit separating the top Upper Missisauga from the Cree Mbr.
Figure 29: Well correlation on the shelf around the Late Albian Unconformity marker (K 101). The section shows a more shalysuccession interbedded with thin sandstone and siltstone layer. The incursion of mudstone and marlstone is to be noted.
Figure 30: Well correlation on the shelfaround the Cenomanian Unconformitymarker (K 94). The section shows thepredominance of marlstone and chalkmarking the transition to the Petrel Mbr ofthe Dawson Fm.

Central Scotian Slope Study – CANADA – July 2016
STRATIGRAPHY
Stratigraphic Framework
Figure 32: Section 2 showing the seismic amplitude anomaly associated with a turbidite deposit on the top of a rollover structure, with the pinch against the top of the rollover.
K101
K130
TGS 109-100
TGS 173-100
K94Figure 36: Example of well developed turbidite lobes for
the Missisauga and Logan period in the very distal part of the study area. Turbidite lobes are particularly well developed
for the K130 – K101 interval.
TGS 173-100
Figure 34: Seismic section illustrating salt movement and depocenter shift during the Missisauga and Logan Canyon intervals. Here the section shows an inverted mini basin. The interval clearly shows the lateral shift of depocenter illustrated by lateral variation of thickness. It is to be noted that the K101 is missing from this section, due either to a non deposition or intense erosion, in both cases related to salt tectonics.
Figure 31: (a) RMS map calculated at K 94 on Marathon seismic (Figure from Chapter 5 PL. 5.9). Anomalies are bounded by listric faults; B: Section 1 showing the seismic amplitude anomaly associated with a turbidite deposit just off of the prograding wedge.
Figure 33: Section 3 showing the seismic amplitude anomaly associated with a turbiditedeposit within the axial part of a mini basin.
AB
Pinch out
Figure 35: Seismic section showing evidence for sediment conduits to deep-water. Here is illustrated the presence of aggrading channels within a small mini basin on top of the salt canopy. It is to be noted that here again the K101 is absent.
Aggrading channels
PL. 3.1.13

Central Scotian Slope Study – CANADA – July 2016
STRATIGRAPHY
Stratigraphic Framework PL. 3.1.14
CENOMANIAN TO EOCENE SEQUENCE K94-T50
Identication
• Number of exploration wells reaching the Late Cretaceous to Eocene Sequence: 4 wells (PL. 3.1.12, 3.2.1 to 3.2.5; Appendixes 1.4.2, 1.4.3, 1.4.6and 1.4.8);
• Formations: Dawson Canyon Fm; Petrel Mbr; Wyandot Fm;, Ypresian Chalk ;
• Age: Dawson Canyon (Turonian to Campanian ), Wyandot (Santonian-Maastrichtian ), Ypresian Chalk (Base Eocene );
• Regional top sequence: Ypresian Unconformity (T50);
• Chronostratigraphic cross-sections (PL 3.2.1, 3.2.3 and 3.2.5);
• Lithostratigraphic cross-sections (PL 3.2.2, 3.2.4 and 3.2.5);
• Architectural cross-sections (PL. 6.1.1 to 6.1.3).
Description
Dawson Canyon Formation and Petrel Mbr
Dawson Canyon Fm consists of thick marine shales interbedded with chalk and limestone layers near the early Turonian. The Formation ischaracterized by a series of limestone beds which correspond to the Petrel Mbr of the Dawson Canyon Fm . The Formation is found all across theScotian Shelf, but the sequence of deposition appears to be diachronous (OETR, 2011). The Formation spans the Cenomanian to Santonian period.The Petrel Mbr is of Turonian age; its separation from the Wyandot Fm can be difficult as the Wyandot appears to be continuous with the Petrel Mbrin the eastern part of the margin. The Wyandot Fm is a distinctive unit on the margin composed predominantly of chalk, marls and chalky mudstones.On the shelf of the study area, the Wyandot Fm can be a reservoir as observed in Eagle D-21 well, for which the associated structure contains anestimated 1.3 Tcf (Smith et al., 2016).
Ypresian Chalk Formation
The Ypresian Chalk is an Early Eocene age formation. It is a widespread unit composed of chalk and corresponds to a regional transgressive episode.
Ypresian Unconformity (T50) and Montagnais Impact
The Ypresian Unconformity is a regional regressive event occurring at or near the base of the Ypresian Chalk (Weston et al., 2012) leading to massiveerosion on the shelf and slope of the Scotian Basin (Wade and MacLean, 1990). The Montagnais marine bolide impact is coincident or close in timingto the Ypresian Unconformity (Deptuck and Campbell, 2012; Weston et al., 2012). The meteor impact led to a widespread margin collapse associatedwith intense erosion that drastically increased the impact of the Ypresian Unconformity on pre-existing sedimentary successions.
LATE EOCENE TO PRESENT SEQUENCES
Banquereau Fm
Sedimentary successions above the top Ypresian correspond to the Banquereau Formation. The sequence corresponds to a Tertiary succession ofdownlapping or prograding sequences. In more detail, the Banquereau Formation represents Plio-Quaternary progradational wedges consisting of over1500m of glaciomarine and marine sediment. The Formation is thinner on the shelf and tends to be thicker towards the outer shelf and slope.
Figure 39: (a) RMS mapcalculated at K94 on Marathonseismic showing 3 energyanomaly zones - (b) Seismicsection on Marathon goingthrough zone 1. Clinoform
Upslope mini basin
Lowstand fan
K94
K101
K130
K94
K101
K130
Alternating
Sand & Shale
Ypresian
Chalk
Figure 37: Well correlation on the shelf for theK101 – K130 interval. In contrast to the MicMacand Missisauga intervals, here sandstone layersare more represented in Alma F67 andBanquereau C21, suggesting a change in riverbehaviour and sediment input. Moreover,sandstone layers are less massive andinterbedded with thick layers of shale.
Figure 38: Wells correlation on a the slope for the K101 – K130 interval. As for the Missisaugainterval, the wells are characterized by a largely shale dominated interval. The bettercorrelation of siltstone layers between Annapolis G24 and Crimson F81 is to be noted.
Shelf edge
trajectory
Central Scotian Slope Study – CANADA – July 2016
STRATIGRAPHY
Stratigraphic FrameworkPL. 3.1.15
REFERENCES
Bowman, S., Pe-Piper, G., Piper, D., JW., Fensome, R.A., and King, E.L., 2012. Early Cretaceous volcanism in the Scotian Basin. Can.J. Earth Sci., 49, 1523-1539.
CNSOPB: Canada-Nova Scotia Offshore Petroleum Board, 2012. Call for Bids NS12-1 Information Package.http://www.callforbids.cnsopb.ns.ca/2012/01/
Cummings D. C., 2004. Sedimentology and Stratigraphy of an Ancient Progradational Terrigenous Clastic Shelf Margin, MissisaugaFormation (Upper Jurassic- Lower Cretaceous), Offshore Nova Scotia, Canada. PhD Thesis, University of Ottawa, Ontario, Canada.
Cummings, D.C. and Arnott, R.W.C., 2005. Growth-faulted shelf-margin deltas: a new (but old) play type, offshore Nova Scotia. Bulletinof Canadian Petroleum Geology, vol.53, no.3 (Sept. 2005), p.211-236.
Deptuck, M.E., 2010. The ‘slope detachment zone’ on the western Scotian Slope, offshore Nova Scotia: structural style, timing, andimplications for margin evolution. Central and North Atlantic Conjugate Margins, Lisbon 2010, Metedo Directo, v. IV, p87-95, ISBN: 978-989-96923-1-2, http://metedodirecto.pt/CM2010
Deptuck, M. and Campbell, D.C., 2012. Widespread erosion and mass failure from the 51Ma Montagnais marine bolide impact offsouthwestern Nova Scotia, Canada, Can. J. Earth Sci., 49, p.1567 – 1594.
Deptuck, M.E., Kendell, K., 2012. Contrasting tectonic style on the western versus central parts of the Scotian Margin, Offshore NovaScotia. CNSOPB Geoscience Open File Poster 2012-001PF, 2 panels.
Deptuck, M.E, Kendell, K., Brown, D.E. and Smith, B.M., 2014. Seismic stratigraphic framework and structural evolution of the easternScotian Slope: geological context for the NS14-1 Call for Bids area, offshore Nova Scotia Canada-Nova Scotia Offshore PetroleumBoard, Geoscience Open File Report 2014-001MF, 58p.
Fensome, R. and Williams, G., 2001. The Last Billion Years, a geological history of the Maritime Provinces of Canada, AGS specialpublication, 15, 206p.
Given, M.M., 1977. Mesozoic and early Cenozoic geology of offshore Nova Scotia. Bulletin of Canadian Petroleum Geology, v. 25, p.63·91.
Gradstein, FM, JG Ogg and AG Smith, 2005. A geologic time scale 2004, Cambridge University Press
Jansa, L.F. and Wade, J.A., 1975. Geology of the continental margin off Nova Scotia and Newfoundland. In Offshore geology of easternCanada. Edited by W.J.M. van der Linden and J.A. Wade. Geological Survey of Canada, Paper 74–30 (2), pp. 51–105.
Kendell, K.L., Deptuck, M.E., Smith, B.M., and Brown, D.E., 2016. Call for Bids NS16-1 – Exploration history, geological setting andexploration potential of the central Scotian Slope. CNSOPB Geoscience Open File Report, 2016-002MF, 42 p
Kidson, A. G., Brenton, M.S., Brown, D. E., C., and Altheim, B., 2002. Hydrocarbon Potential of the Deep Water Scotian Slope.CNSOPB Report, 111p, Halifax, Nova Scotia.
Kidson, A.G., Brown, D.E., Smith B.M. and Altheim, B., 2005. The Upper Jurassic Abenaki Formation Offshore Nova Scotia: A Seismicand Geologic Perspective. Canada-Nova Scotia Offshore Petroleum Board, Halifax, 165p.
Kidson, A. G., Brenton, M.S., Brown, D. E., Makrides, C., and Altheim, B., 2007. Nova Scotia Deepwater Wells, Post Drill Analysis, p.1982-2004. CNSOPB Report,181p, Halifax, Nova Scotia.
Li, G., Pe-Piper, G., and Piper, D.J.W., 2012. The provenance of Middle Jurassic sandstones in the Scotian Basin: petrographicevidence of passive margin tectonics, Can. J. Earth Sci. 49: p. 1463–1477.
MacLean, B.C., Edwards, A., McAlpine, K.D., and Wade, J.A., 1989. The enigmatic Avalon Unconformity, Geological Survey of CanadaOpen File 2099, p. 1-5.
Miller, K.G., Kominz, M.A., Browning, J.V., Wright, J.D., Mountain, G.S., Katz, M.E., Sugarman, P.J., Cramer, B.S., Christie-Blick, N.,and Pekar, S.F., 2005. The Phanerozoic Record of Global Sea-Level Change, Science, 310, p. 1293, DOI: 10.1126/science.1116412.
Offshore Energy Technical Research Association (OETR), 2011. Play Fairway Analysis Atlas - Offshore Nova Scotia. Nova ScotiaDepartment of Energy Report, NSDOE Records Storage File No. 88-11-0004-01, 347p.http://www.offshoreenergyresearch.ca/OETR/OETRPlayFairwayProgramMainPage/tabid/402/Default.aspx
Offshore Energy Research Association (OERA), 2015. South West Nova Scotia Expansion: Georges Bank and Shelburne Sub-BasinStudy. Nova Scotia Department of Energy Report, http://www.oera.ca/offshore-energy-research/geoscience/play-fairway-analysis/sw-nova-scotia-expansion-atlas/
Pe-Piper, G., and Piper, D.J.W., 2004. The effects of strike-slip motion along the Cobequid-Chedabucto-southwest Grand Banks faultsystem on the Cretaceous-Tertiary evolution of Atlantic Canada. Canadian Journal of Earth Sciences, 41(7): 799–808. doi:10.1139/e04-022.
Pe-Piper G. and MacKay R.M., 2006. Provenance of Lower Cretaceous sandstones onshore and offshore Nova Scotia from electronmicroprobe geochronology and chemical variation of detrital monazite. Bulletin of Canadian Petroleum Geology 54: p. 366-379
Pe-Piper, G., Piper, D.J.W., Gould, K.M., and DeCoste, A., 2011. Lower Cretaceous lithofacies, detrital petrology and diagenesis of theHesper I-52, Esperanto K-78 and South Griffin J-13 wells, Scotian Shelf. Geological Survey of Canada Open File 6821, 121 p.
Pe-Piper, G., Piper, D.J.W., Zhang, Y., Chavez, I., 2015. Diagenetic barite and sphalerite in middle Mesozoic sandstones, ScotianBasin, as tracers for basin hydrology. Bulletin of American Association of Petroleum Geologists vol.99, no.7, p.1281-1313.
Schenk, P. E., Lane, T. E. and Jenson, L. R., 1980. Trip 20: Paleozoic History of Nova Scotia – a time trip to Africa (or South America?); Field Trip Guidebook, Geological Association of Canada Annual Meeting, Halifax 1980.
Shimeld, J., 2004. A comparison of salt tectonic Subprovinces beneath the Scotian Slope and Laurentian Fan. In: P.J. Post, D.L. Olsen,K.T. Lyons, S.L. Palmes, P.F. Harrison, and N.C. Rosen (Eds) Salt-Sediment Interactions and Hydrocarbon Prospectivity: Concepts,Applications, and Case Studies forthe 21st Century, 24th Annual GCS-SEPM Foundation Bob F. Perkins Research Conference,Houston, p. 502-532, CD-ROM.
Sibuet, J-C., Rouzo, S., and Srivastava, S., 2012. Plate tectonic reconstructions and paleogeographic maps of the central and NorthAtlantic oceans, Can. J. Earth Sci. 49: p. 1395–1415.
Smith, B.M., Kendell, K.L., Makrides, C., Brown, D.E., 2016. Call for Bids NS16-1 – Exploration history, geologic setting, andexploration potential: Sable Subbasin Region. CNSOPB Geoscience Open File Report, 2016-001MF, 19p
Strathdee, G., 2012. Origin and significance of clay minerals in Mesozoic shales of the Scotian Basin, Msc Thesis, Saint Mary’sUniveristy, 167p.
Tsikouras, B., Pep-Piper, G., Piper, J.W., and Schaffer, M., 2011. Varietal heavy mineral analysis of sediment provenance, LowerCretaceous Scotian Basin, eastern Canada, Sedimentary Geology, 237, p. 150 – 165.
Wade J.A. and MacLean B.C., 1990. The geology of the southeastern margin of Canada, Chapter 5. In Geology of the ContinentalMargin of Eastern Canada, Geological Survey of Canada n°2, Keen, M.J. and Willians, G.L. Eds, p. 167-238.
Welsink., H.J., Dwyer, J.D. and Knight, R.J. (1989). Tectono-stratigraphy of the passive margin off Nova Scotia, Chapter 14, In: A.J.Tankard and H.R. Balkwill (Eds) Extensional Tectonics and Stratigraphy of the North Atlantic Margins, AAPG Memoir 46, p. 215-231.
Weston J., MacRae, A.R., Ascoli, P., Cooper, M.K.E., Fensome, R.A., Shaw, D., and Williams, G.L., 2012. A revised biostratigraphicand well-log sequence-stratigraphic framework for the Scotian Margin, offshore eastern Canada, Can. J. Earth Sci., 49, p. 1417 – 1462.
CHAPTER 3.2
STRATIGRAPHYGEOLOGICAL CROSS SECTIONS
Central Scotian Slope Study – CANADA – July 2016
STRATIGRAPHY
GEOLOGICAL CROSS SECTIONS – SHELF TRANSECT PL. 3.2.1
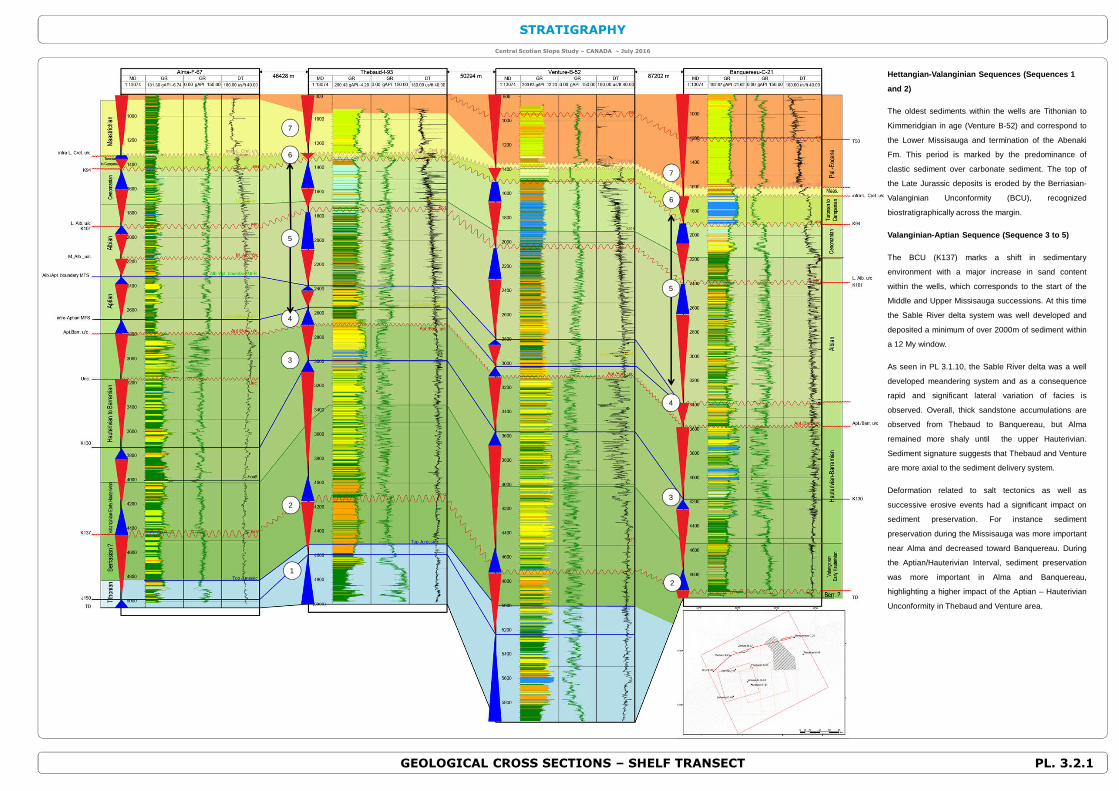
Hettangian-Valanginian Sequences (Sequences 1
and 2)
The oldest sediments within the wells are Tithonian to
Kimmeridgian in age (Venture B-52) and correspond to
the Lower Missisauga and termination of the Abenaki
Fm. This period is marked by the predominance of
clastic sediment over carbonate sediment. The top of
the Late Jurassic deposits is eroded by the Berriasian-
Valanginian Unconformity (BCU), recognized
biostratigraphically across the margin.
Valanginian-Aptian Sequence (Sequence 3 to 5)
The BCU (K137) marks a shift in sedimentary
environment with a major increase in sand content
within the wells, which corresponds to the start of the
Middle and Upper Missisauga successions. At this time
the Sable River delta system was well developed and
deposited a minimum of over 2000m of sediment within
a 12 My window.
As seen in PL 3.1.10, the Sable River delta was a well
developed meandering system and as a consequence
rapid and significant lateral variation of facies is
observed. Overall, thick sandstone accumulations are
observed from Thebaud to Banquereau, but Alma
remained more shaly until the upper Hauterivian.
Sediment signature suggests that Thebaud and Venture
are more axial to the sediment delivery system.
Deformation related to salt tectonics as well as
successive erosive events had a significant impact on
sediment preservation. For instance sediment
preservation during the Missisauga was more important
near Alma and decreased toward Banquereau. During
the Aptian/Hauterivian Interval, sediment preservation
was more important in Alma and Banquereau,
highlighting a higher impact of the Aptian – Hauterivian
Unconformity in Thebaud and Venture area.
6
5
4
3
2
7
3
1
2
5
4
6
7
Central Scotian Slope Study – CANADA – July 2016
STRATIGRAPHY
GEOLOGICAL CROSS SECTIONS – SHELF TRANSECTPL. 3.2.2
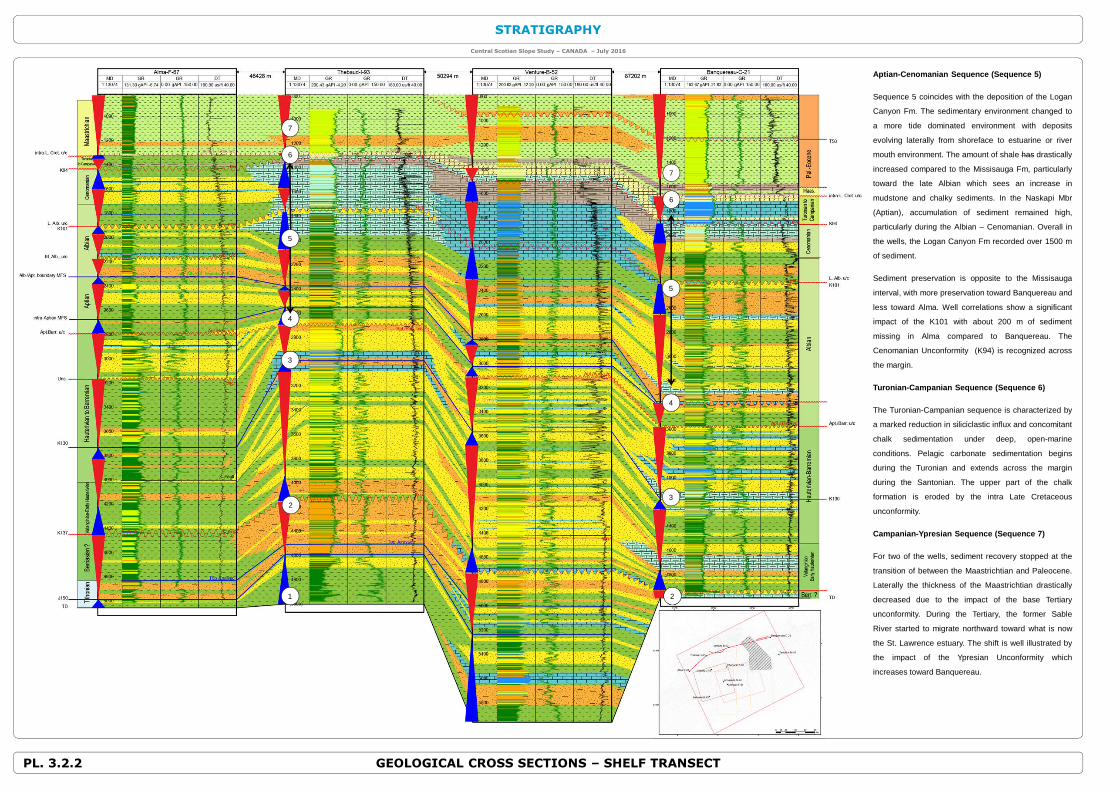
Aptian-Cenomanian Sequence (Sequence 5)
Sequence 5 coincides with the deposition of the Logan
Canyon Fm. The sedimentary environment changed to
a more tide dominated environment with deposits
evolving laterally from shoreface to estuarine or river
mouth environment. The amount of shale has drastically
increased compared to the Missisauga Fm, particularly
toward the late Albian which sees an increase in
mudstone and chalky sediments. In the Naskapi Mbr
(Aptian), accumulation of sediment remained high,
particularly during the Albian – Cenomanian. Overall in
the wells, the Logan Canyon Fm recorded over 1500 m
of sediment.
Sediment preservation is opposite to the Missisauga
interval, with more preservation toward Banquereau and
less toward Alma. Well correlations show a significant
impact of the K101 with about 200 m of sediment
missing in Alma compared to Banquereau. The
Cenomanian Unconformity (K94) is recognized across
the margin.
Turonian-Campanian Sequence (Sequence 6)
The Turonian-Campanian sequence is characterized by
a marked reduction in siliciclastic influx and concomitant
chalk sedimentation under deep, open-marine
conditions. Pelagic carbonate sedimentation begins
during the Turonian and extends across the margin
during the Santonian. The upper part of the chalk
formation is eroded by the intra Late Cretaceous
unconformity.
Campanian-Ypresian Sequence (Sequence 7)
For two of the wells, sediment recovery stopped at the
transition of between the Maastrichtian and Paleocene.
Laterally the thickness of the Maastrichtian drastically
decreased due to the impact of the base Tertiary
unconformity. During the Tertiary, the former Sable
River started to migrate northward toward what is now
the St. Lawrence estuary. The shift is well illustrated by
the impact of the Ypresian Unconformity which
increases toward Banquereau.
3
1
2
5
4
6
7
6
5
4
3
2
7
Central Scotian Slope Study – CANADA – July 2016
STRATIGRAPHY
GEOLOGICAL CROSS SECTIONS – SLOPE TRANSECT PL. 3.2.3
7
6
5
4
3
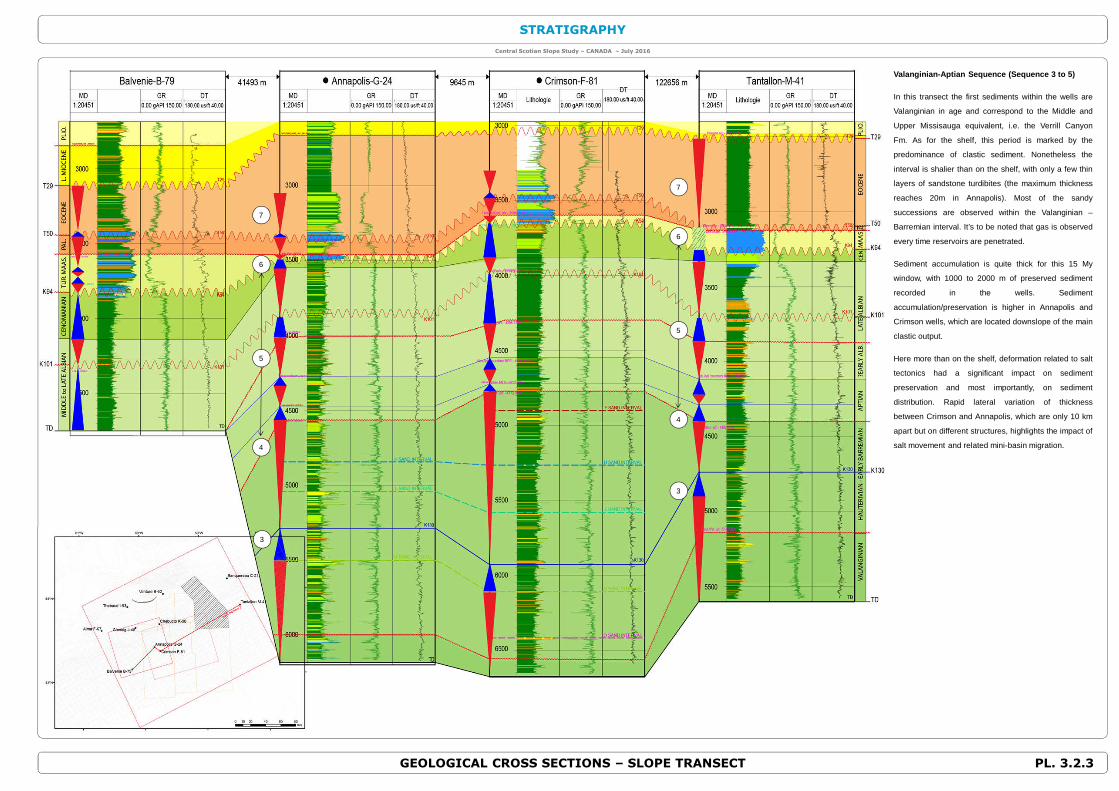
Valanginian-Aptian Sequence (Sequence 3 to 5)
In this transect the first sediments within the wells are
Valanginian in age and correspond to the Middle and
Upper Missisauga equivalent, i.e. the Verrill Canyon
Fm. As for the shelf, this period is marked by the
predominance of clastic sediment. Nonetheless the
interval is shalier than on the shelf, with only a few thin
layers of sandstone turdibites (the maximum thickness
reaches 20m in Annapolis). Most of the sandy
successions are observed within the Valanginian –
Barremian interval. It’s to be noted that gas is observed
every time reservoirs are penetrated.
Sediment accumulation is quite thick for this 15 My
window, with 1000 to 2000 m of preserved sediment
recorded in the wells. Sediment
accumulation/preservation is higher in Annapolis and
Crimson wells, which are located downslope of the main
clastic output.
Here more than on the shelf, deformation related to salt
tectonics had a significant impact on sediment
preservation and most importantly, on sediment
distribution. Rapid lateral variation of thickness
between Crimson and Annapolis, which are only 10 km
apart but on different structures, highlights the impact of
salt movement and related mini-basin migration.
7
6
5
4
3
Central Scotian Slope Study – CANADA – July 2016
STRATIGRAPHY
GEOLOGICAL CROSS SECTIONS – SLOPE TRANSECTPL. 3.2.4
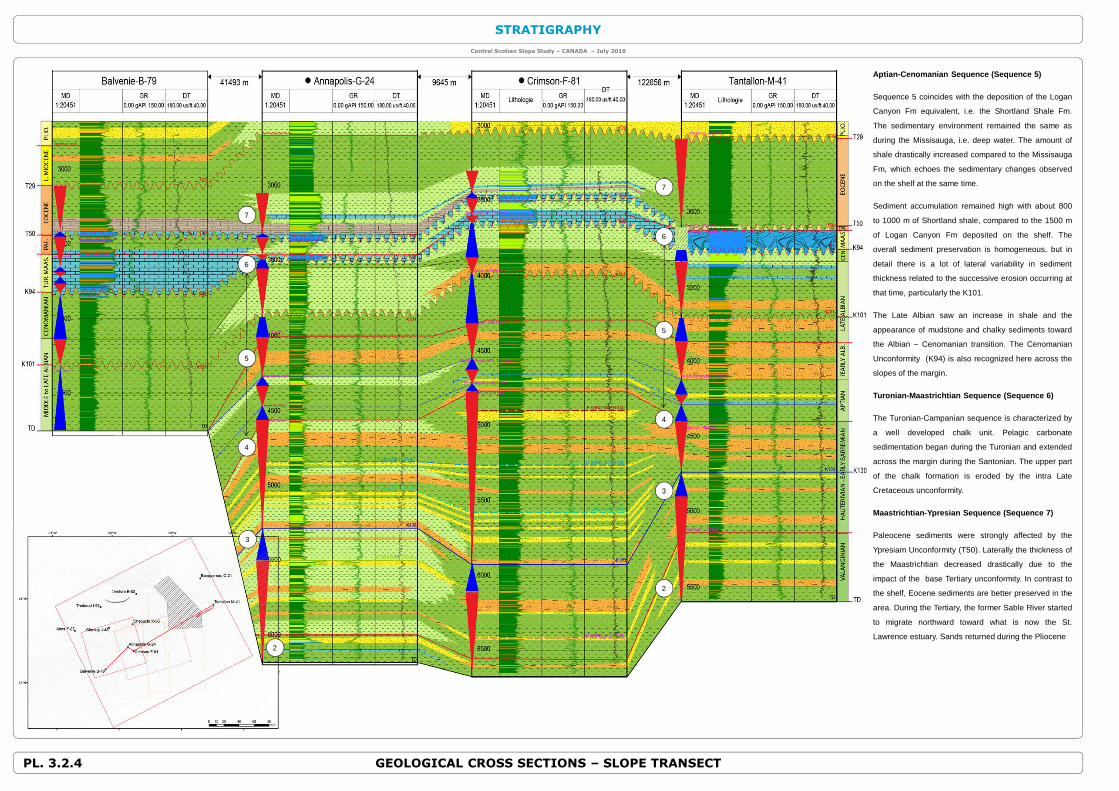
Aptian-Cenomanian Sequence (Sequence 5)
Sequence 5 coincides with the deposition of the Logan
Canyon Fm equivalent, i.e. the Shortland Shale Fm.
The sedimentary environment remained the same as
during the Missisauga, i.e. deep water. The amount of
shale drastically increased compared to the Missisauga
Fm, which echoes the sedimentary changes observed
on the shelf at the same time.
Sediment accumulation remained high with about 800
to 1000 m of Shortland shale, compared to the 1500 m
of Logan Canyon Fm deposited on the shelf. The
overall sediment preservation is homogeneous, but in
detail there is a lot of lateral variability in sediment
thickness related to the successive erosion occurring at
that time, particularly the K101.
The Late Albian saw an increase in shale and the
appearance of mudstone and chalky sediments toward
the Albian – Cenomanian transition. The Cenomanian
Unconformity (K94) is also recognized here across the
slopes of the margin.
Turonian-Maastrichtian Sequence (Sequence 6)
The Turonian-Campanian sequence is characterized by
a well developed chalk unit. Pelagic carbonate
sedimentation began during the Turonian and extended
across the margin during the Santonian. The upper part
of the chalk formation is eroded by the intra Late
Cretaceous unconformity.
Maastrichtian-Ypresian Sequence (Sequence 7)
Paleocene sediments were strongly affected by the
Ypresiam Unconformity (T50). Laterally the thickness of
the Maastrichtian decreased drastically due to the
impact of the base Tertiary unconformity. In contrast to
the shelf, Eocene sediments are better preserved in the
area. During the Tertiary, the former Sable River started
to migrate northward toward what is now the St.
Lawrence estuary. Sands returned during the Pliocene
7
6
5
4
3
2
7
6
5
4
3
2
Central Scotian Slope Study – CANADA – July 2016
STRATIGRAPHY
GEOLOGICAL CROSS SECTIONS - DIP TRANSECT (WHEELER DIAGRAM) PL. 3.2.5
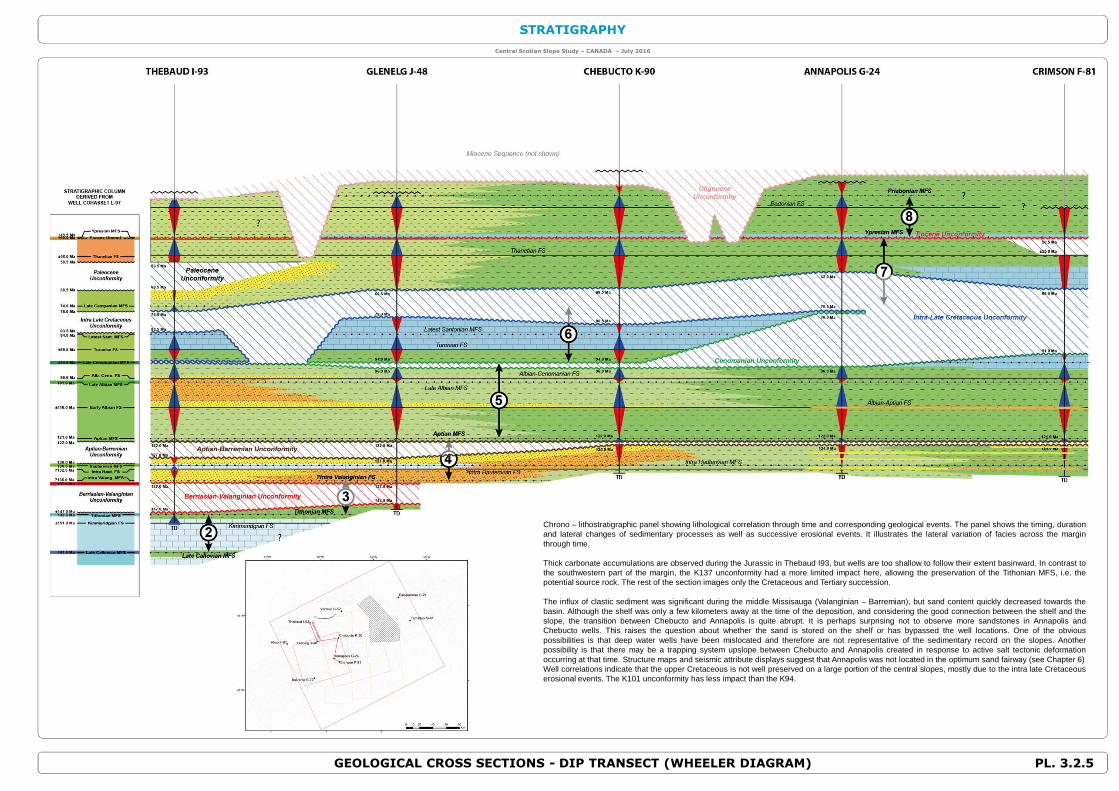
Chrono – lithostratigraphic panel showing lithological correlation through time and corresponding geological events. The panel shows the timing, durationand lateral changes of sedimentary processes as well as successive erosional events. It illustrates the lateral variation of facies across the marginthrough time.
Thick carbonate accumulations are observed during the Jurassic in Thebaud I93, but wells are too shallow to follow their extent basinward. In contrast tothe southwestern part of the margin, the K137 unconformity had a more limited impact here, allowing the preservation of the Tithonian MFS, i.e. thepotential source rock. The rest of the section images only the Cretaceous and Tertiary succession.
The influx of clastic sediment was significant during the middle Missisauga (Valanginian – Barremian), but sand content quickly decreased towards thebasin. Although the shelf was only a few kilometers away at the time of the deposition, and considering the good connection between the shelf and theslope, the transition between Chebucto and Annapolis is quite abrupt. It is perhaps surprising not to observe more sandstones in Annapolis andChebucto wells. This raises the question about whether the sand is stored on the shelf or has bypassed the well locations. One of the obviouspossibilities is that deep water wells have been mislocated and therefore are not representative of the sedimentary record on the slopes. Anotherpossibility is that there may be a trapping system upslope between Chebucto and Annapolis created in response to active salt tectonic deformationoccurring at that time. Structure maps and seismic attribute displays suggest that Annapolis was not located in the optimum sand fairway (see Chapter 6)Well correlations indicate that the upper Cretaceous is not well preserved on a large portion of the central slopes, mostly due to the intra late Cretaceouserosional events. The K101 unconformity has less impact than the K94.


![k/ /g/ / / /ɾ/ - Omniglotexisted in Scotian and is usually replaced with pharyngealization in borrowings, eg Attic Αίγυπτος [ájgyptos] "Egypt" > Scotian [ɛʼʒ t]. The](https://static.fdocuments.in/doc/165x107/609f45eea9a131243175a928/k-g-omniglot-existed-in-scotian-and-is-usually-replaced-with-pharyngealization.jpg)

