Benthic habitat mapping on the Scotian Shelf based on ... · PDF fileof bathymetric and...
17
MARINE ECOLOGY PROGRESS SERIES Mar Ecol Prog Ser Vol. 219: 121–137, 2001 Published September 10 INTRODUCTION The problem Mapping sea floor habitat is the fundamental first step necessary for scientific fisheries management, for monitoring environmental change and for assessing the impact of anthropogenic disturbance on benthic organisms. Benthic habitat is primarily determined by substrate type (sediment or rock), which reflects past and present physical processes in the near-bottom environment. The substrate determines to a large extent the presence or absence of a particular benthic species and modifies the effect of disturbance on the benthic community (Greene et al. 1995, Auster & Langton 1999). Traditionally, geoscientific sea floor mapping pri- marily involved the identification of sediment type, distribution, and thickness based on the combination of remotely sensed geophysical data (sidescan sonar and seismic reflection profiling) and sea floor sediment sampling. The advent of multibeam sonar technology in the last decade, providing 100% sea floor cover- age, has revolutionized geological mapping (Courtney & Shaw 2000). Multibeam data and derived images re- veal previously unrecognized sea floor morphological and sediment textural attributes. This new generation of bathymetric and geological maps provides a frame- work for mapping the distribution of benthos. This paper presents an interdisciplinary habitat mapping study based on analysis of megabenthos (organisms larger than 1 cm in linear dimensions) identified from sea floor photographs integrated with an interpretation of multibeam bathymetric data and associated geo- scientific information. The biological objectives are to © Inter-Research 2001 *E-mail: [email protected] Benthic habitat mapping on the Scotian Shelf based on multibeam bathymetry, surficial geology and sea floor photographs Vladimir E. Kostylev 1, *, Brian J. Todd 2 , Gordon B. J. Fader 2 , R. C. Courtney 2 , Gordon D. M. Cameron 3 , Richard A. Pickrill 2 1 EcoVector, 215 Oceanview Drive, Bedford, Nova Scotia B4A 4G9, Canada 2 Geological Survey of Canada (Atlantic), PO Box 1006, Dartmouth, Nova Scotia B2Y 4A2, Canada 3 Cameron Geoscience Research, 55B Kennedy Drive, Dartmouth, Nova Scotia B2X 1N6, Canada ABSTRACT: This study presents results of a new approach for sea floor habitat mapping based on an integrated analysis of multibeam bathymetric data, associated geoscientific information, and benthos data from Browns Bank on the southwestern Scotian Shelf, off the Canadian Atlantic coast. Based on sea floor sediment maps and statistical analysis of megabenthos determined from photographs, 6 habitats and corresponding associations of benthos were derived and mapped. The habitats are dis- tinguished primarily on the basis of sediment type and water depth. Additional factors are sea floor geomorphology, habitat complexity, and relative current strength. A Browns Bank benthic habitat map is developed as a conceptual model summarizing the understanding of the bank ecology. This study highlights the utility of multibeam bathymetric sonar for interpretation of sea floor sediments and for extrapolating benthic habitat characteristics across large areas of sea floor. KEY WORDS: Habitat mapping · Benthos · Multibeam · Sediment · Scotian Shelf Resale or republication not permitted without written consent of the publisher
Transcript of Benthic habitat mapping on the Scotian Shelf based on ... · PDF fileof bathymetric and...

MARINE ECOLOGY PROGRESS SERIESMar Ecol Prog Ser
Vol. 219: 121–137, 2001 Published September 10
INTRODUCTION
The problem
Mapping sea floor habitat is the fundamental firststep necessary for scientific fisheries management, formonitoring environmental change and for assessingthe impact of anthropogenic disturbance on benthicorganisms. Benthic habitat is primarily determined bysubstrate type (sediment or rock), which reflects pastand present physical processes in the near-bottomenvironment. The substrate determines to a largeextent the presence or absence of a particular benthicspecies and modifies the effect of disturbance on thebenthic community (Greene et al. 1995, Auster &Langton 1999).
Traditionally, geoscientific sea floor mapping pri-marily involved the identification of sediment type,distribution, and thickness based on the combinationof remotely sensed geophysical data (sidescan sonarand seismic reflection profiling) and sea floor sedimentsampling. The advent of multibeam sonar technologyin the last decade, providing 100% sea floor cover-age, has revolutionized geological mapping (Courtney& Shaw 2000). Multibeam data and derived images re-veal previously unrecognized sea floor morphologicaland sediment textural attributes. This new generationof bathymetric and geological maps provides a frame-work for mapping the distribution of benthos. Thispaper presents an interdisciplinary habitat mappingstudy based on analysis of megabenthos (organismslarger than 1 cm in linear dimensions) identified fromsea floor photographs integrated with an interpretationof multibeam bathymetric data and associated geo-scientific information. The biological objectives are to
© Inter-Research 2001
*E-mail: [email protected]
Benthic habitat mapping on the Scotian Shelfbased on multibeam bathymetry, surficial geology
and sea floor photographs
Vladimir E. Kostylev1,*, Brian J. Todd2, Gordon B. J. Fader2, R. C. Courtney2, Gordon D. M. Cameron3, Richard A. Pickrill2
1EcoVector, 215 Oceanview Drive, Bedford, Nova Scotia B4A 4G9, Canada2Geological Survey of Canada (Atlantic), PO Box 1006, Dartmouth, Nova Scotia B2Y 4A2, Canada3Cameron Geoscience Research, 55B Kennedy Drive, Dartmouth, Nova Scotia B2X 1N6, Canada
ABSTRACT: This study presents results of a new approach for sea floor habitat mapping based on anintegrated analysis of multibeam bathymetric data, associated geoscientific information, and benthosdata from Browns Bank on the southwestern Scotian Shelf, off the Canadian Atlantic coast. Based onsea floor sediment maps and statistical analysis of megabenthos determined from photographs, 6habitats and corresponding associations of benthos were derived and mapped. The habitats are dis-tinguished primarily on the basis of sediment type and water depth. Additional factors are sea floorgeomorphology, habitat complexity, and relative current strength. A Browns Bank benthic habitatmap is developed as a conceptual model summarizing the understanding of the bank ecology. Thisstudy highlights the utility of multibeam bathymetric sonar for interpretation of sea floor sedimentsand for extrapolating benthic habitat characteristics across large areas of sea floor.
KEY WORDS: Habitat mapping · Benthos · Multibeam · Sediment · Scotian Shelf
Resale or republication not permitted without written consent of the publisher
Mar Ecol Prog Ser 219: 121–137, 2001
discriminate distinct assemblages of megafauna ben-thic species, to understand and correlate the relation-ship between sea floor surficial sediments and biota,and to classify and map the defined benthic habitats.
Habitat is commonly defined as a place where amicroorganism, plant or animal lives (Begon et al.1996). Traditionally the word ‘habitat’ implied a set ofassociated environmental descriptors (e.g. substrate,temperature, salinity). The characterization of habitatrequires definition of spatial boundaries and limits ofphysical factors pertaining to a particular organism orgroups of organisms that share environmental prefer-ences and occupy the same habitat type, for examplerocky shore habitat, mud flat habitat, etc. Thereforeour working definition of a habitat is a spatially de-fined area where the physical, chemical, and biologicalenvironment is distinctly different from the surround-ing environment. We base habitat mapping on theassumption that organisms distribute themselves alongenvironmental gradients and that their clusters definedistinct sets of environmental factors. Discriminationof benthic assemblages and definition of significantphysical factors is achieved with cluster analysis, ordi-nation, and similarity analyses. A description of eachhabitat is given together with the description of theassociated benthic assemblage.
The setting of Browns Bank
Browns Bank is located at the southwestern end ofthe Scotian Shelf at the eastern entrance to the Gulfof Maine, approximately 100 km south of Yarmouth,Nova Scotia (Fig. 1). On the regional nautical chart, themorphology of the bank appears as 2 flat plateaus,with water depths ranging from <50 m in the westernarea to almost 100 m in the east (Canadian Hydro-graphic Service 1988). The southwestern edge ofBrowns Bank drops abruptly to the Northeast Channel(>200 m), which is a major trough separating BrownsBank and Georges Bank and acts as the principalhydrodynamic connection between Scotian Slope waterand the Gulf of Maine. Browns Bank is bounded to thenorth by a rough-floored bedrock channel with waterdepths >100 m.
Ocean circulation in the region of Browns Bank hasbeen studied using moored current metres, driftingbuoys, and finite element modeling (Smith 1983, Page& Smith 1989, Lynch & Naimie 1993, Hannah et al.2000). A permanent clockwise gyre exists on BrownsBank with current strengths up to 20 cm s–1. Alongthe northern edge of the bank, circulation is alignedfrom west to east. Along the south edge of BrownsBank, adjacent to the Northeast Channel, currents arestrongly aligned from southeast to northwest, parallel
to the bank flank. On the bank, the dominant currentdirection varies within the gyre and can be inferredfrom sand wave and other bedform orientations.
The Scotian Shelf is a formerly glaciated continentalshelf characterized by a series of large, shallow bankson the outer shelf, of which Browns Bank is one exam-ple (Fig. 1). The banks are separated by interveningsaddles or troughs. These landforms are interpreted ascuestas and juxtaposed lowlands developed on thebedrock surface and are typical of a coastal plain envi-ronment affected by subaerial erosion in the Late Ter-tiary period (King & MacLean 1976). The coastal plainwas modified by the advance and retreat of NorthAmerican continental ice sheets during the Quaternaryperiod (the last advance culminating at ~20 000 BP)(King & Fader 1986). Further modification took placeduring the low stand of Late Wisconsinan sea level(~18 000 BP) at ~120 m below present sea level and thesubsequent transgression across the shelf of rising sealevel (Drapeau & King 1972, Fader et al. 1977, Fader1989).
Early geological mapping of surficial sediments onBrowns Bank identified 2 facies of the Sable IslandSand and Gravel formation (Drapeau & King 1972,Fader et al. 1977). Gravel dominated in the east andsand to the west, but details of textural characteristicsand bedforms were not revealed by early studies. Thisformation is underlain by the Emerald Silt formation,a glaciomarine muddy sediment. The present knowl-edge of surficial sediment distribution provided bymultibeam data provides considerable detail on sedi-ment distribution of the Sable Island Sand and Gravelformation together with information on bedforms andsediment transport pathways.
METHODS
Multibeam bathymetric data. Multibeam bathymet-ric data were collected by the Canadian HydrographicService on Browns Bank in 1996 and 1997 using theCanadian Coast Guard Ship (CCGS) ‘Frederick G.Creed’ equipped with a Simrad EM1000 multibeam ba-thymetric system. This system produces 60 beams ar-rayed over an arc of 150° and operates by ensonifying anarrow strip of sea floor across track, and detecting thebottom echo with narrow, across-track, listening beams.The swath of sea floor imaged on each survey line was5 to 6 times the water depth. Line spacing was about 3to 4 times water depth to provide ensonification overlapbetween adjacent lines. The Differential Global Posi-tioning System was used for navigation, providingpositional accuracy of ±3 m. Survey speeds averaged14 knots resulting in an average data collection rate ofabout 5.0 km2 h–1 in water depths of 35 to 70 m.
122

Kostylev et al.: Benthic habitat mapping on the Scotian Shelf
During the survey, water depth values were in-spected, and erroneous values were removed usingCARIS/HIPS (Hydrographic Information ProcessingSystem) software from Universal Systems Limited,Fredericton, New Brunswick. Within HIPS, the datawere adjusted for tidal variation using tidal predictionsfrom the Canadian Hydrographic Service. The datawere archived in the form of ‘raw’ datagrams on Exa-byte tapes. Multibeam bathymetric data were ex-tracted from the datagrams and were gridded in 10 m(horizontal) bins and shaded with artificial illumination
using software developed by the Ocean MappingGroup at the Geological Survey of Canada (Atlantic).Relief maps, colour-coded to depth, were developedand displayed on a Hewlett-Packard workstation usingGRASS (Geographic Resources Analysis Support Sys-tem) developed at the US Army Construction Engi-neering Research Laboratories; this software is in thepublic domain. The resulting image of Browns Bankis displayed in Fig. 2.
In addition to the bathymetric data, backscatterstrengths ranging from 0 to –128 decibels (dB) were
123
50
50
50
100
100
5001000
1500
2000
3000
2500
100
NOVASCOTIA
NEW BRUNSWICK
MAINE
GEORGESBANK
BAY OFFUNDY
GULF OFMAINE
NORTHEAST CHANNEL
66°67°68°69°70° W
42° N
43°
44°
45°
65° 64° 63°
Yarmouth
GeorgesBasin
Halifax
Saint John
Bangor
EAST CHA
BROWNSBANK
SCOTIAN SHELF
100
CAPECOD > 200 m
< 200 m
Water depth
N.B.
N.S.
SCOTIAN SHELFU.S.A.ATLANTIC
OCEAN
QUÉBEC
CANADA
NFLD.
P.E.I.
Fig. 1. Location map of BrownsBank on the western ScotianShelf. Isobaths are in m. Thewhite area with dashed bound-ary on Browns Bank is thearea of the multibeam image
in Fig. 2
66° 20’ W
42° 50’ N
42° 30’ N
65° 40’ W 65° 20’ W 66° W
30
60
90
120
150
Depth (m)
0
kilometres
10 20Illumination
Altitude = 45°Azimuth = 45°
BROWNS BANKBATHYMETRY
S
EW
N Z
-Z
X
Fig. 2. Multibeam bathymet-ric map of Browns Bank. Ar-tificial sun illumination of thedigital terrain model is fromthe northeast at an angle of45° above the horizontal. Thevertical exaggeration is 10×.A colour palette has beenapplied to the bathymetricdata; warm colours representshallow water and cool col-ours deep water. The faintbanding on the image is anartefact of both the ship’ssurvey track during data col-lection and data processing

Mar Ecol Prog Ser 219: 121–137, 2001
logged by the Simrad EM1000 system (see Urick [1983]and Mitchell & Somers [1989] for backscatter defini-tion). To reduce the dynamic range of the recordeddata, the system applies a partial correction to thebackscatter strength values for the varying angle ofincidence by using Lambert’s law for the variationwith angle and assuming a flat sea floor (Simrad 1992).Backscatter strengths are computed using calibrationvalues for the electronics and transducers at the time ofinstrument manufacture (Mitchell 1996). Unless furthercalibration occurs at the time of survey, backscatterstrength values may be inaccurate. However, the rela-tive signal is still useful and differences in the backscat-ter between different sea floor materials are clearly vis-ible in the data. High backscatter values (dark tones)are typically –10 to –30 dB for gravel and low back-scatter values (light tones) range from –30 to –60 dB forfine-grained sand (Mitchell & Hughes Clark 1994,Shaw et al. 1997). Because backscatter is a function of asuite of acoustical variables, it is prudent to interpretbackscatter images in conjunction with other geophysi-cal data (seismic reflection and sidescan sonar sono-grams) and geological samples of sea floor materials.For comparison with the bathymetric image (Fig. 2),Browns Bank backscatter data were processed anddisplayed (Fig. 3). The amplitude of the returned signalvaries from –16 to –40 dB, highlighting aspects of geo-logical features not apparent in the bathymetric image.
Geoscientific data. To complement the multibeamsurvey, 850 km of high-resolution geophysical profileswere collected over Browns Bank in 1998. The systemsdeployed included a Huntec Deep Tow Seismic (DTS)boomer, single-channel sleeve-gun seismic reflection,and Simrad MS992 sidescan sonar (120 and 330 kHz).The geophysical survey investigated different sea floor
types and features identified using the multibeambathymetric and backscatter data (Fig. 4).
Using an 0.753 m Institutt for Kontinentalsokkel-undersøkelser (IKU) grab, 24 sea floor sediment sam-ples were collected at strategic sites interpreted fromgeophysical profiles (Fig. 4). The sites were chosen tocollect sea floor sediment samples representative ofbroad areas sharing similar geomorphology (basedon the bathymetric image) and acoustic backscatterresponse. Also, the selected sites were located alonggeophysical profiles to provide detailed geologicalcontrol in the third dimension. The grab sampler pene-trated the sea floor up to 0.5 m and preserved theintegrity of the layering within the surficial sediments.Grain size descriptions based on the samples and onsea floor photographs adhere to the Wentworth sizeclass scheme for clastic sediments (Wentworth 1922).
Sea floor photographs. With locations chosen fromthe multibeam bathymetric data and the geophysicalprofiles, 26 sea floor photographic sites were occupiedin 1998, of which 21 were occupied by a single-imagecamera (207 photographs) and 5 by a stereo camera (98photographs) (Fig. 4). The single-image camera systemconsisted of a box-shaped aluminum frame supportinga Benthos Deep Sea Survey camera (model 377) and anEdgerton Deep Sea flash (model 383). The system wastriggered by a weight suspended 1 m below the frameproviding images of approximately 1.2 × 0.8 m of thesea floor. The stereo camera system consisted of a tri-pod-shaped aluminum frame supporting two 35 mmPentax SF-10 cameras, each fitted with 50 mm lens,and a 50 W light source. An instrument-mountedcomputer and bottom-sensing switch controlled thecameras. The stereo camera images recorded approxi-mately 0.36 × 0.55 m of the sea floor.
124
-16
-20
-24
-28
-32
-36
-40
incr
easi
ng g
rain
siz
e
Backscatterintensity (dB)
GL
GTS
SOG
TS
42° 30’ N
42° 50’ N
66° 20’ W 65° 40’ W 65° 20’ W 66° W
0
kilometres
10 20
BROWNS BANKBACKSCATTER
Fig. 3. Backscattermap of Browns Bank.High backscatter val-ues (dark tones) areinterpreted as graveland low backscattervalues (light tones)are interpreted assand. As in Fig. 2, faintartefact banding isvisible. Bedforms andtheir orientations are,in many areas, en-hanced by the patternof contrasting back-
scatter intensities

Kostylev et al.: Benthic habitat mapping on the Scotian Shelf
The 1998 set of sea floor photographs was aug-mented by 515 single and stereo photographs collectedat 90 stations on Browns Bank by the Department ofFisheries and Oceans Canada (DFO) in 1984 and 1985.These images recorded from 0.76 × 0.51 m to 1.05 ×0.71 m of the sea floor. Details of this camera systemare given in Wildish et al. (1990), and locations of thephotographs from all years are indicated in Fig. 4. Allphotographs were digitized in Kodak Photo CD formaton compact discs, and analyzed on a computer screen.Image sharpness, contrast, brightness and color bal-ance were computer-enhanced using Paint Shop Pro5.01 (Jasc Software, Inc).
Megafauna and habitat identification. Identificationof benthic fauna to the lowest possible taxonomic level,as well as geological description, was undertaken forthe camera stations and the sediment samples. Sub-samples of the grab samples were sieved through a1 mm mesh sieve and analyzed for the presence orabsence of species in order to augment the identifica-tion of fauna from sea floor photographs. Frequency ofoccurrence was calculated for each photographic sta-tion by dividing the number of photographs in whicha species was present by the number of photographstaken at a station. Species were grouped into majortaxa. Cirripedia and Nudibranchia were omitted due totheir rarity, leaving 22 groups that were used in furtheranalyses. The taxonomic level of each group was cho-sen on the basis of similarity of habitats and life historytraits of benthic organisms. For example, the sea cu-cumbers Cucumaria frondosa and Psolus fabricii wereanalysed as 2 separate groups due to different habitatpreferences. Taxonomic diversity for each station wascalculated as the average number of major groups perphotograph. The average abundance of benthic spe-
cies and the percent cover of sponges were calculatedfor each station from the 1998 photographs.
The relative sea floor cover of boulders (>256 mm),gravel (2 to 256 mm), sand (0.0625 to 2 mm) and shellhash was estimated from each photograph. Also, thepresence of 5 types of burrows, 2 types of trails, tracks,scallop pits, and siphons were recorded. A total scorefor bioturbation was given as a normalized ratio (0 to100) of the number of observed feature types to themaximum possible number of feature types. The pres-ence of fine-grained sediments was ranked on a scalefrom 0 (none) to 100% (very abundant).
Statistical analysis. A total of 115 photographic sta-tions and 24 grab stations were studied. All statisticalanalyses refer to photographic stations unless statedotherwise. Principal components analysis (PCA) wasperformed with normalized varimax rotation on stan-dardized frequencies of occurrence of major taxa.One-way analysis of variance (ANOVA) was used foranalyses of variability among stations in PCA factorscores versus sediment type and water depth on taxo-nomic diversity. Four levels of the factor ‘sedimenttype’ were used, as identified from multibeam inter-pretation. The homogeneity of variances was testedusing Cochran’s C-test. Student-Newman-Keuls (SNK)tests were performed for the post-hoc analysis of thedifference between means. Analysis of covariance(ANCOVA) was used to test the effects of sedimenttype and water depth on taxonomic diversity. Covari-ate ‘depth’ was included in this analysis because it cov-ers a broad range of depths with satisfactory replica-tion of depths for different sediment types. Clusteranalysis of species associations was performed using aPearson correlation matrix for standardized frequen-cies of occurrence of major taxa identified in the photo-
125
0
kilometres
10 2042° 50’ N
66° 20’ W 66° W 65° 45’ W 65° 20’ W
42° 30’ N
Thick sand
BarchansThin sand over gravel lag
Gravel lag with thin sand
Grabel lag
Sea floor photograph
IKU grab
Geophysical survey
Fig. 4. Interpretation ofdistribution of surficialsediment type, thick-ness and bedformson Browns Bank. Geo-physical survey tracksare shown by blacklines; sea floor photo-graph stations are indi-cated by white squaresand IKU grab stationsby yellow squares. Thewhite outline box onnorthwestern BrownsBank identifies thearea described in Fig. 5

Mar Ecol Prog Ser 219: 121–137, 2001
graphs. Jaccards’ similarity matrix was used for theanalysis of the IKU grab data. In both cases clusteringwas performed using the complete linkage amalgama-tion technique.
Dissimilarity analysis was performed based on Bray-Curtis dissimilarity among stations with respect tospecies, and dissimilarities among stations based onall possible combinations of 5 physical factors: depth,average yearly temperature, sediment type (codedfrom 1 to 4 based on the proportion of sand), variance oftemperature based on the 4 seasons, and average near-bottom current strength. All variables were normalizedprior to construction of dissimilarity matrices. The re-sulting correlation coefficients (Spearman’s rho) wereranked, and the highest correlation was considered in-dicative of the combination of variables that best de-fined community structure (Clarke & Ainsworth 1993).
In order to examine the influence of sediment typeon the diversity of megabenthos, 2 types of data wereanalysed using 1-way ANOVA: the average number ofmajor taxonomic groups per station, and the averagenumber of distinguished species. Statistical analyseswere performed using Statistica™ software.
RESULTS
Surficial geology
Based on the geophysical data and the sea floorsediment characteristics, 4 facies of the Sable Island
Sand and Gravel formation were mapped (Fig. 4,Table 1): thick sand (TS), sand over gravel lag (SOG),gravel lag with thin sand (GTS), and gravel lag (GL)(Todd et al. 1999). Sand deposits in a variety of bed-forms are superimposed on the widespread GL thatcovers the bank. The morphology and extent of thesand deposits are interpreted from the bathymetricimage (Fig. 2) and from the backscatter image, onwhich the light-toned areas are interpreted as sand(Fig. 3); sea floor sediment samples and sidescansonograms confirm this interpretation (Todd et al.1999). The sand deposits are discontinuous on the GLand range in thickness from centimetres up to 10 m.Bedform morphology suggests that the sand depositsare presently active and have developed in response tothe clockwise circulation of water around BrownsBank. For example, on western Browns Bank adjacentto the Northeast Channel, currents are stronglyaligned to the northwest (Fig. 5). Here, an aeriallyextensive sheet of sand reaches a thickness of 6.5 mand takes the form of sand waves, which are flow-transverse, constructive bed features (Amos & King1984). The sand wave amplitude is ~1 m and the aver-age wavelength is ~40 m. In contrast, the sand wavesin shallower water near the centre of the bank,shown in the upper right of the panels in Fig. 5, are~10 m from trough to crest with an average wave-length of 180 m. These latter bedforms exhibit anasymmetric cross-section with the steeper lee facesoriented southeast indicating net sand transport inthat direction.
126
Table 1. Benthic habitats interpreted from sea floor photographs and surficial sediments. TS: thick sand, SOG: sand over gravel lag, GL: gravel lag, GTS: gravel lag with thin sand
Substrate Habitat Habitat Relative current Water depth Benthic/biologicaltype complexity strength (m) association
Sand (1) Shallow water Low High <50 Barren
TS and SOG (2) Deep water Low Low? >100 Barren, with solitary hydroids and sand dollars (Echinarachinus parma)
Gravel (3) Soft coral and sea Moderate High <50 Alcyonacea-Cucmaria associationGL and GTS cucumber Low species diversity and abundance
(4) Scallop Moderate High 40–100 Placopecten magellanicus and associated species
Low macrobenthos diversity and abundance
(5a) Terebratulina High Moderate 90–120 Terebratulina communityHigh macrobenthos diversity and abundance
(5b) Terebratulina subtype High Low >100 Sponge-dominated community, Terebratulina subtype
(6) Deposit-feeder Low Low >100 Deposit-feeder communityHigh abundance of deposit-feeding polychetes

Kostylev et al.: Benthic habitat mapping on the Scotian Shelf 127
66° 20’ W 66° 15’ W 66° 10’ W
66° 20’ W 66° 15’ W 66° 10’ W
42°
45’ N
42°
45’ N
42°
45’ N
0 5
kilometresFig. 5. Area of north-western Browns Bank(Fig. 4) showing bathy-metry (upper), back-scatter (middle) andgeological interpreta-tion (lower). The back-scatter intensity scale isthe same as in Fig. 3,and the geological de-scriptions are the sameas in Fig. 4. The colour-coded bathymetry doesnot correspond to thescale of Fig. 2; thecolour distribution herehas been optimized forthe depth range of 35 m(upper left, warm col-ours) to 100 m (lowerleft, cool colours). Thearrows on the back-scattter image (middle)show the direction ofdominant current flow
Mar Ecol Prog Ser 219: 121–137, 2001
The sea floor between these 2 sand wave fields has a‘streaky’ linear appearance in the backscatter image(Fig. 5, middle), and is interpreted as thin, disconti-nuous ribbons of sand overlying GL. Barchan dunes,which are crescent-shaped in plan view, are prominentin the west, reaching heights of 6 to 7 m with crescentwidths of 400 m. The barchans are convex to the south-east with steep lee faces to the northwest, indicatingdominant current flow in the latter direction. Thesebedforms disrupt current flow and affect the transportand deposition of sand across the sea floor to the north-west. ‘Tails’, or obstacle marks, in some instances kilo-metres in length, emanate from the lee (concave) facesof the barchan dunes, once again clearly indicating netbottom-flow current direction to the northwest. Theseobstacle marks appear as dark bands on the backscat-ter image (Fig. 5, middle), compared with the sur-rounding low backscatter values, and represent a lackof sand deposition and exposure of GL on the sea floor.This suggests that zones of higher energy and turbu-lence are generated by the barchan dunes whichpersist for distances over 2 km beyond the dunes(cf. studies on land summarized by Lancaster 1987).
The widely distributed GL on Browns Bank devel-oped from glacial till which was reworked during thetransgression of rising sea level across the ScotianShelf after about 18 000 BP (Drapeau & King 1972,Fader et al. 1977, Fader 1989). The GL exhibits a widevariation in grain sizes: IKU grab samples containedgrain sizes up to 1000 mm, and photographs and side-scan sonar records imaged abundant cobbles (64 to256 mm) and boulders (>256 mm). Sand (0.0625 to2 mm) was present in every GL sample as well. On theeastern, deeper part of Browns Bank, sea floor photo-graphs showed a thin layer of fine-grained sedimentcovering the GL. The IKU grab samples from the east-ern bank reflect this observation with silt (0.0039 to0.0625 mm) constituting up to 4% of individual sedi-ment samples.
Distribution of megabenthos
The general trend of the distribution of benthicmegainvertebrates on Browns Bank shows a predomi-nance of suspension-feeders (e.g. Placopecten, Cucu-maria, Sabellidae) on the western, shallower part ofthe bank and an increase in abundance of deposit-feeders (e.g. Nothriidae) with increasing depth towardthe east (Fig. 6). The shallower part of the bank is com-monly populated by sea scallops (Placopecten magel-lanicus), sea cucumbers (Cucumaria frondosa), andsoft corals (Alcyonacea). No megafauna was observedon large sand bedforms. Structurally complex gravelhabitats (i.e. exhibiting a wide grain size variability) on
the central and eastern parts of the bank are the mostdiverse and have the greatest abundance of sessileepifauna. Several species of sponges (notably Hali-chondria panicea, Myxilla sp. and Cliona sp.), bra-chiopods (Terebratulina septentrionalis) and tunicates(Molgulidae spp.) are characteristic of these areas.Some sediments contain fine-grained fractions of siltand clay, which are trapped in crevices and depres-sions among boulders and other gravel. On the centralpart of the bank, Sabellid polychaetes and sea cucum-bers (Psolus fabricii) are common and abundant, andmultiple burrows and siphons of infaunal invertebratesare seen among the rocks. A fine meshwork of thepolychaete Filograna implexa tubes is frequent ongravel in this area. Sediments on the deeper part of thebank (>100 m) display a thin layer of mud. Leafybryozoans (Flustra foliacea), sponges, and ascidiansdominate at these depths. Deposit-feeding polychaetes(Nothriidae and Terebellidae) are common on fine-grained sediments and are most abundant along thedeeper, eastern edge of the bank. Areas of sand withinthis area are usually barren with solitary hydroids(Corymorpha pendula) and sand dollars as typicalrepresentatives of megafauna.
Cluster analysis was performed in order to distin-guish associations between major benthic taxa as iden-tified from bottom photographs. Three main groupsof taxa and several close associations can be distin-guished (Fig. 7). The upper group (Hydroidea, Astero-idea, Porifera, Sabellidae, Serpulidae, Ascidiacea andBrachiopoda) exhibits the closest association and iscomposed of species commonly found on complexgravel substrates. The cluster of Scaphopoda, Bryozoaand Macrura is less closely associated with this groupbecause these taxa are less common. The middle clus-ter (solitary hydroids, Actiniaria, Psolus, Terebellidae,Nothriidae, Echinoidea, Ophiuroidea) represents taxacommonly found in deeper, less hydrodynamicallyactive parts of the bank, on sand or fine-grained sedi-ments. The lower cluster (Gastropoda, Paguridae, Pla-copecten, Alcyonacea, Holothuroidea) pools taxa com-mon on the shallower, western part of the bank, andthe first three of this cluster are typical for GL. Withinthe larger clusters several close associations of taxa(Asteroidea and Porifera, Ascidiacea and Brachiopodaand Alcyonacea and Holothuroidea) are ecologicallymeaningful and important for further discussion.
Sediment-benthos relationships
Analysis of variance showed the significant controlof sediment type on species richness, with a markedlyhigher average number of species found in areasof GL, and lowest species diversity on TS (ANOVA,
128

Kostylev et al.: Benthic habitat mapping on the Scotian Shelf 129
Hydroidea
Solitary hydroids
Gastropoda
Scaphopoda
Actiniaria
Asteroidea
Holothuroidea ( )Psolus
Echinoidea Ophiuroidea
6
8 9
10 11 12
13 14 15
16 17 18
Porifera
Sabellidae Serpulidae Ascidiacea
Brachiopoda Bryozoa
Decapoda (Macrura)
Terebellidae Nothriidae
1 2 3
4 5
7
Decapoda (Paguridae)
19 20 21
22 23
100%
50%
10%
LEGEND
circle size indicates:
Placopecten magellanicus Alcyonacea
Holothuroidea ( )Cucumaria Species richness
Fig. 6. Distribution of majortaxa of megabenthos (Pan-els 1–22) and taxonomicdiversity (Panel 23) onBrowns Bank (outlined bythe 100 m isobath) as identi-fied from bottom photo-graphs. For each benthictaxon, the circle size re-presents its frequency of oc-currence. Larger circles cor-respond to higher values
Mar Ecol Prog Ser 219: 121–137, 2001
df = 3/111, F = 5.574, p = 0.006; Cochran’s C = 0.600,p = 0.321). The SNK test shows that diversity on TSis significantly lower than diversity on other sedimenttypes. This relationship is also apparent at a lowertaxonomic level of resolution. ANCOVAshows that sediment type has a signifi-cant effect on the number of higher taxo-nomic groups (df = 3/111, F = 12.298, p <0.0001). Covariate depth was not signifi-cant (p = 0.0848) and there was no sig-nificant interaction between depth andsediment type. Variances, however, wereheterogeneous (Cochran’s C = 0.433, p <0.0001) due to a very low diversity ofmegafauna in the SOG in shallow water.The SNK test shows that gravel habitats(GTS, GL) have a significantly higher tax-onomic diversity than sand habitats (TS,SOG). There was no difference betweenGL and GTS, and between SOG and TS.
Principal components analysis distin-guished 2 factors with eigenvalues largerthan 1 that explain variability in the dis-tribution of major taxonomic groups onthe bank (Fig. 8). The first factor explains23.5% of the variability in frequencies ofoccurrence of benthic taxa, while the sec-ond explains 8.8%. Dissimilarity analysishad shown that combination of sedimenttype and depth yields the highest correla-tion with community structure (Fig. 9)suggesting that these two are the mostimportant factors for the definition ofhabitats.
Factor 1 (Fig. 8) is related to sedimenttype, which is supported by highly signif-
icant results of the analysis of variance (df = 3/111, F =10.8, p < 0.0001, Cochran’s C = 0.492, p < 0.0001). TheSNK test shows that the relative proportion of gravel inthe sea floor sediment is responsible for the variation(GL = GTS > SOG = TS) (Fig. 10). High values ofFactor 1 correspond to GL, and negative values corre-spond to sand. Asteroidea, Ascidiacea, Porifera andBrachiopoda exhibited the largest influence (highestpositive loadings) on this factor. The explanatory powerof principal components increased when PCA was per-formed on abundances of megabenthos. The first axisexplained 27% and the second axis explained 15% oftotal variability.
Factor 2 was significantly correlated with depth (r =0.34, p < 0.05). Alternatively, values of Factor 2 may berelated to hydrodynamic intensity, based on the alloca-tion of taxa typical for low velocity current zones (e.g.deposit feeding polychaetes) in the upper part of Fig. 8versus taxa typical for high velocity current zones (e.g.hydroids, soft corals, sea cucumbers) in the lower part.
The IKU grab samples allowed a more precise taxo-nomic resolution of the benthic fauna than the photo-graphs, and qualitative information on infauna. Classi-
130
Dissimilarity (%)
ALCYONACEACUCUMARIA
GASTROPODADEC_PAGURIDAPLACOPECTEN
SOLITARY HYDROIDSACTINIARIA
PSOLUSTEREBELLIDAE
NOTHRIIDAEECHINOIDEA
OPHIUROIDEA
SCAPHOPODABRYOZOA
DEC_MACRURA
HYDROIDEAASTEROIDEA
PORIFERASABELLIDAESERPULIDAEASCIDIACEA
BRACHIOPODA
10 20 30 40 50 60 70 80 90 100
GL
GL - SOG
TS, SOG
GL, GTS
GTS, SOG
Sedimentaffinity:
Factor 1
Fact
or
2
HYDROIDEA
SOLITARY HYDROIDS
GASTROPODA
SCAPHOPODA
PLACOPECTEN
ALCYONACEA
ACTINIARIA
ASTEROIDEA
HOLOTHUROIDEA ( )PSOLUS
ECHINOIDEA
SERPULIDAE
TEREBELLIDAE
NOTHRIIDAE
BRYOZOA
ASCIDIACEAPORIFERA
BRACHIOPODA
DECAPODA (PAGURIDA)
DECAPODA (MACRURA)
-0.8
-0.6
-0.4
-0.2
0
0.2
0.4
0.6
0.8
-0.4 -0.2 0 0.2 0.4 0.6 0.8 1
SABELLIDAE
HOLOTHUROIDEA ( )CUCUMARIA
OPHIUROIDEA
Sand Gravel
Hig
h E
nerg
yLo
w E
nerg
y
INCREASING GRAIN SIZE
Fig. 7. Cluster analysis of the frequencies of occurrence of major taxaas identified from bottom photographs. Affinity of taxa for sea floorsediment type is indicated. Sediment types are gravel lag (GL), sandover gravel (SOG), thick sand (TS), and gravel with thin sand (GTS)
Fig. 8. Principal component analysis (PCA) of the distribution of major taxonomicgroups on Browns Bank as identified from bottom photographs. The x-axis(Factor 1) explains variability in sediment type from sand (negative values)to gravel (positive values). The y-axis is related to depth and hydrodynamics

Kostylev et al.: Benthic habitat mapping on the Scotian Shelf
fication of this information distinguished a cluster rich-est in the number of species, characteristic of whichwere brachiopods Terebratulina septentrionalis, bryo-zoans Bugula sp., Caberia sp., Porella sp., polychaetesof the families Sabellidae, Serpulidae, Terebellidaeand Onuphidae, and bivalve mollusks Macoma calca-rea and Crenella glandula. Stations where this assem-blage is common share several ubiquitous species(which may belong to different assemblages as well),such as mollusks Dentalium sp., Astarte undata and A.sulcata, and hydroids (Thuiaria sp. and Sertularellasp.). This group has a wide distribution through thewhole range of samples. A cluster represented by shellsof Mesodesma deauratum, Ensis sp., Spisula polynymaand sand dollars (Echinarachnius parma) occurs inSOG with shell hash.
The presence of the Emerald Silt directly beneathgravel and sand has likely influenced the presence offine-grained material in some of the sediment samplesand the distribution of benthic communities with af-finity for fine-grained sediment.
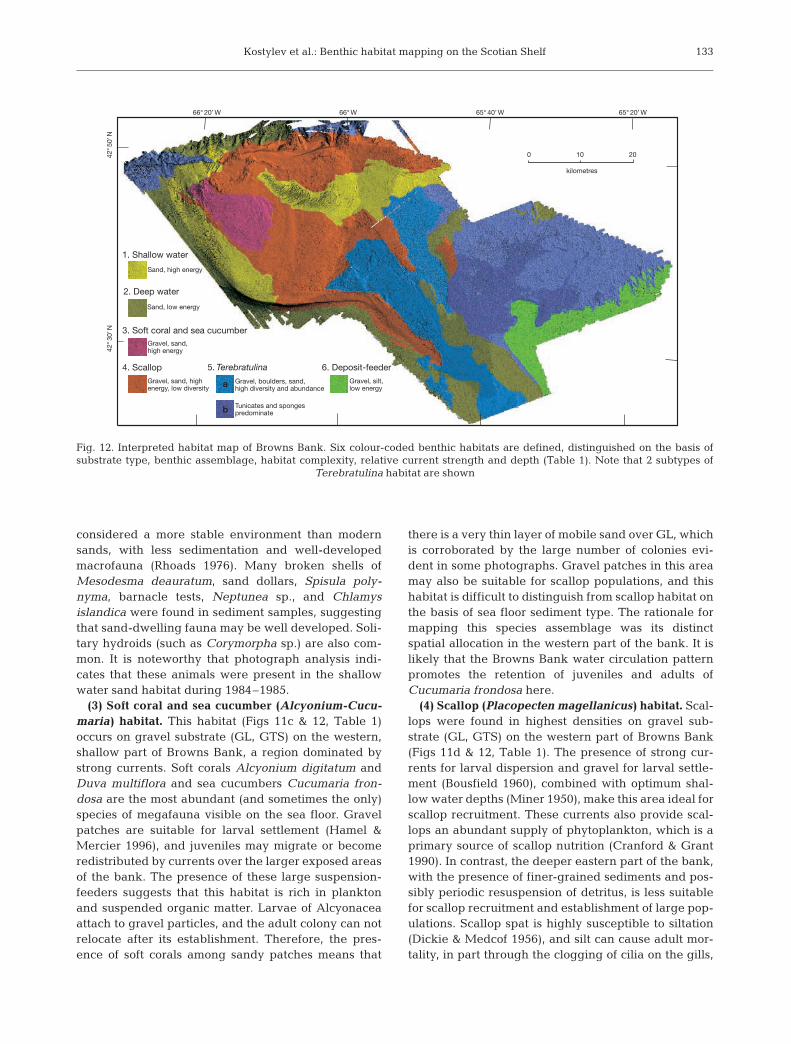
Benthic habitats and species associations
Based on the sea floor sediment map (Fig. 4) andstatistical analysis of benthos, 6 habitats and corre-sponding associations of benthic animals were mapped(Figs 11 & 12, Table 1). Each of the habitats is distin-guished on the basis of substrate, habitat complexity,relative current strength, and water depth. The spatialallocation of samples, abundance, and commonness ofspecies are used as additional guidelines for identifica-tion of habitat zonation. Species associations typical foreach habitat are listed below.
(1) Shallow water habitat. Shallow water areas withsand substrate (TS, SOG) are characterized by a verylow abundance and diversity of visible megafauna(Figs 11a & 12, Table 1) and are high-energy environ-ments with mobile sediment where it is difficult for epi-fauna to establish and proliferate. Recently deposited,medium- to coarse-grained sand can be rich in meio-fauna, with poor macrofauna and almost no epifauna(Rhoads 1976). It is possible that some species of in-fauna, such as surf clams (Spisula solidissima) or soft-shelled clams (Mya truncata) are common, but are notidentifiable on the photographs. Shell hash of Meso-desma deauratum was very common in grab samplesfrom these shallow water, sand substrate sites, indicat-ing the possibility of infauna.
(2) Deep water habitat. Low diversity and abun-dance of visible megafauna characterize deep waterareas with sand substrate (TS, SOG) surroundingBrowns Bank (Figs 11b & 12, Table 1). Relict sands are
131
-0.05 0 0.05 0.1 0.15 0.2 0.25 0.3 0.35 0.4 0.45
DS
DSC
DSV
SC
T
DST
DSCV
DSCT
SCT
S
DSTV
ST
STV
SCTV
DSCTV
SV
DV
DCV
CV
DCTV
D
DTV
CTV
DC
C
V
DCT
DT
CT
TV
Fact
ors
Spearman's rho
Sediment Type
Fact
or
1
-1.6
-1
-0.4
0.2
0.8
1.4
2
TS SOG GTS GL
INCREASING GRAIN SIZE
Fig. 9. Ranking of non-parametric correlations between dis-similarities among stations based on all possible combina-tions of physical variables and Bray-Curtis dissimilarity forbenthic community data as identified from bottom pho-tographs. D: depth, S: sediment type, C: current strength,T: average yearly temperature, V: variability in temperaturebased on the 4 seasons. Note that correlations become con-siderably higher when sediments are included in the combi-
nations of factors
Fig. 10. Average values of Factor 1 distinguished by Principalcomponent analysis (PCA) pertaining to different sedimenttypes: TS, SOG, GTS and GL. See Fig. 7 legend for abbrevia-tions. Boxes show standard deviations, and vertical error bars
indicate variance

Mar Ecol Prog Ser 219: 121–137, 2001132
a
b
c
d
e
f
g
Fig. 11. Sea floor photographs illustrating 6 benthic habitatson Browns Bank. Sand substrate habitats include (a) shallowwater and (b) deep water. Gravel substrate habitats include(c) soft coral and sea cucumber (Alcyonacea-Cucumaria),(d) scallop, (e) Terebratulina habitat, (f) subtype of Terebratu-
lina community, and (g) deposit- feeder
Kostylev et al.: Benthic habitat mapping on the Scotian Shelf
considered a more stable environment than modernsands, with less sedimentation and well-developedmacrofauna (Rhoads 1976). Many broken shells ofMesodesma deauratum, sand dollars, Spisula poly-nyma, barnacle tests, Neptunea sp., and Chlamysislandica were found in sediment samples, suggestingthat sand-dwelling fauna may be well developed. Soli-tary hydroids (such as Corymorpha sp.) are also com-mon. It is noteworthy that photograph analysis indi-cates that these animals were present in the shallowwater sand habitat during 1984–1985.
(3) Soft coral and sea cucumber (Alcyonium-Cucu-maria) habitat. This habitat (Figs 11c & 12, Table 1)occurs on gravel substrate (GL, GTS) on the western,shallow part of Browns Bank, a region dominated bystrong currents. Soft corals Alcyonium digitatum andDuva multiflora and sea cucumbers Cucumaria fron-dosa are the most abundant (and sometimes the only)species of megafauna visible on the sea floor. Gravelpatches are suitable for larval settlement (Hamel &Mercier 1996), and juveniles may migrate or becomeredistributed by currents over the larger exposed areasof the bank. The presence of these large suspension-feeders suggests that this habitat is rich in planktonand suspended organic matter. Larvae of Alcyonaceaattach to gravel particles, and the adult colony can notrelocate after its establishment. Therefore, the pres-ence of soft corals among sandy patches means that
there is a very thin layer of mobile sand over GL, whichis corroborated by the large number of colonies evi-dent in some photographs. Gravel patches in this areamay also be suitable for scallop populations, and thishabitat is difficult to distinguish from scallop habitat onthe basis of sea floor sediment type. The rationale formapping this species assemblage was its distinctspatial allocation in the western part of the bank. It islikely that the Browns Bank water circulation patternpromotes the retention of juveniles and adults ofCucumaria frondosa here.
(4) Scallop (Placopecten magellanicus) habitat. Scal-lops were found in highest densities on gravel sub-strate (GL, GTS) on the western part of Browns Bank(Figs 11d & 12, Table 1). The presence of strong cur-rents for larval dispersion and gravel for larval settle-ment (Bousfield 1960), combined with optimum shal-low water depths (Miner 1950), make this area ideal forscallop recruitment. These currents also provide scal-lops an abundant supply of phytoplankton, which is aprimary source of scallop nutrition (Cranford & Grant1990). In contrast, the deeper eastern part of the bank,with the presence of finer-grained sediments and pos-sibly periodic resuspension of detritus, is less suitablefor scallop recruitment and establishment of large pop-ulations. Scallop spat is highly susceptible to siltation(Dickie & Medcof 1956), and silt can cause adult mor-tality, in part through the clogging of cilia on the gills,
133
42° 5
0’ N
42
° 30’
N
66° 20’ W 66° W 65° 40’ W 65° 20’ W
0
kilometres
10 20
Sand, high energy
1. Shallow water
Sand, low energy
2. Deep water
Gravel, sand,high energy
3. Soft coral and sea cucumber
Gravel, sand, highenergy, low diversity
4. ScallopGravel, silt,low energy
6. Deposit-feeder
Tunicates and spongespredominate
Gravel, boulders, sand,high diversity and abundance
5. Terebratulina
a
b
Fig. 12. Interpreted habitat map of Browns Bank. Six colour-coded benthic habitats are defined, distinguished on the basis ofsubstrate type, benthic assemblage, habitat complexity, relative current strength and depth (Table 1). Note that 2 subtypes of
Terebratulina habitat are shown

Mar Ecol Prog Ser 219: 121–137, 2001
which reduces oxygen consumption and leads to even-tual suffocation (Larsen & Lee 1978, Cranford & Gor-don 1992). Additionally, inorganic sediment reducesthe energetic quality of ingested food, thus limitingproductivity of the population. The maximum densitiesof scallops on the bank were generally found at depthsof 70 to 90 m on GL or GTS (Figs 6 & 11d). The photo-graph analysis indicates that scallops are commonalong the southeastern edge of the bank as well,although in smaller quantities. This area is subjectedto strong currents along the edge of the NortheastChannel, which may be the cause for better recruit-ment and food supply in this area. Immigration of scal-lop larvae from other banks is considered to be rela-tively low, and it is possible that the general watercirculation pattern is responsible for distribution oflocally spawned scallop larvae on Browns Bank (Trem-blay & Sinclair 1991) and the resulting pattern of dis-tribution in adult populations.
The scallop habitat is generally poor in other mega-fauna species. Typical species associated with scallopsare Hydroidea, especially Sertularella sp., which iscommon and often attached to scallop shells. Carni-vores, such as whelks and hermit crabs, are commonand probably obtain a portion of their food supply frombenthic species damaged by scallop dredging. Preda-tory fish and crabs are known to be attracted to thescallop dredge tracks and have elsewhere been ob-served in tracks at densities up to 30 times higher thanoutside tracks (Caddy 1970).
Scallop dredging, which is a major source of distur-bance for benthic populations (Gordon et al. 1998) andsurficial sediments (Caddy 1970), may have a long-lasting effect on scallop habitat. Our observationsshow that several groups of species (i.e. Filogranaimplexa, Corymorpha pendula, hydroids) were morewidespread during 1984–1985 surveys than in 1998.These species are easily damaged by scallop dredging(Collie et al. 1996), and a reduction in their abundancemay lead to disappearance of other associated speciesas well (Auster et al. 1996).
(5a,b) Terebratulina community habitat. Noble et al.(1976) have described a distinct subtidal communityfrom the Bay of Fundy, represented by the widespread,conspicuous, and recurrent brachiopod Terebratulinaseptentrionalis. On Browns Bank, this brachiopod-dominated community typically occurs on gravel sub-strate with boulder-sized particles (GL, GTS) in waterdepths of ~90 m, mainly located in the central andeastern parts of the bank (Figs 11e & 12, Table 1). Thecomposition of the community closely corresponds torock-face subtype of Noble et al. (1976), with brachio-pods and sponges as the best-represented taxa. Thiscommunity is usually found in cool temperate marineregions of the Atlantic Ocean. Paine (1959) and Caddy
(1970) have reported this type of community in deepwater. Brachiopods are common to the seston-feedersbelt (Zezina 1993), which is a characteristic under-water landscape zone of the ocean. Noble et al. (1976)found sediments between boulders to be ‘rich in fines’,where moderate currents (<50 cm s–1) predominate.Similarly, on eastern Browns Bank, a thin layer of siltcommonly covers the GL surface. Terebratulina sp.larvae actively seek sites with low light (cryptic), sug-gesting that habitats with higher complexity are likelyto attract more recruitment, and thus the establishmentof brachiopod populations. Additionally, Terebratulinasp. larvae have a very short planktonic period, leadingto restricted dispersal, and the gregarious distributionof individuals in populations is promoted. Ascidians,which co-occur with brachiopods, have similar habitatpreferences and are known to settle in cryptic habitats,such as cracks, crevices, and beneath rocks (Svane &Young 1989). Thus, life history traits and strong con-trol by substrate lead to patchy distribution of popula-tions with distinct boundaries. Most of the animals inthe community are suspension-feeders. Serpulid poly-chaetes (commonly Filograna implexa, Spirorbis sp.,and less often Serpula vermicularis) were also associ-ated with brachiopods in this habitat. The close associ-ation of sponges and sea stars distinguished by clusteranalysis (Fig. 7) is due to a high abundance of spongiv-orous species of genus Henricia. The region occupiedby the Terebratulina community may also includepatches of scallop populations, mostly on GL.
A subtype of Terebratulina community (5b in Table 1,Fig. 11f) is mapped on the eastern part of the bank(Fig. 12), where silt is prevalent on the GL and which isinfluenced by colder near-bottom water masses. Tuni-cates and sponges dominate this association of species,which is similar to the sub-community described byNoble et al. (1976) and ‘biogenic gravel’ community ofThouzeau et al. (1991), who found that the sand andgravel sea floor from northeast Georges Bank has thehighest diversity and density of species.
In addition to high diversity of epifauna, Terebratu-lina habitat may have well-developed infauna, due tothe presence of fine-grained sediments, and a highfrequency of occurrence of various bioturbation fea-tures, such as burrows, siphons and trails. Analysis ofgrab samples revealed that bivalves (Astarte sp., Ma-coma calcarea, and Clinocardium ciliatum) are com-mon infauna in this habitat.
(6) Deposit-feeder habitat. Several stations on BrownsBank show a distinct association of species, manifestedby a high abundance of tube-dwelling deposit-feedingpolychaetes (Figs 11g & 12, Table 1). Photograph andgrain size analysis indicate that surficial sediments inthese areas consist of an accumulation of silt on gravel(GL, GTS). The upper surface of the sediment is re-
134

Kostylev et al.: Benthic habitat mapping on the Scotian Shelf
worked and densely covered with tracks of tube-building polychaetes (possibly Nothriidae and Terebel-lidae). Diversity of visible organisms is generally low,and the gravel occasionally accommodates attachedanemones, brachiopods and sponges. Infauna is prob-ably abundant, based on burrows of varying size andon traces of fish-feeding activity (numerous pits andtrails on the surface of mud). In general, the deepereastern part of the bank may be a suitable feeding areafor groundfish due to dominance of deposit-feeders(Wildish et al. 1989) which are otherwise responsiblefor a small proportion of total production (8.4%). The1984–1985 sea floor photographs show that Nothriidaewere present on gravel in the shallow part of the bank,in areas where shell hash provides enough material forbuilding tubes. Abundance of tubiferous polychaetesis highest in the deeper part of the bank.
DISCUSSION
In this study we defined benthic habitats on the basisof sediment characteristics, water depth, and dominantbenthic associations. This information is interpretedfrom multibeam, geophysical, geological, and photo-graphic data, which is collected in a non-destructiveway.
The use of bottom photographs instead of grab sam-ples significantly enhances the speed of data analysisand allows the collection of more information with lessexpense. The major drawback of this approach is thelack of information about benthic infauna and associ-ated detailed sediment stratigraphy; the presence ofinfauna can only be assessed on the basis of the occur-rence of tubes, burrows, and other bioturbation fea-tures on the sea floor. Eighty taxa of megabenthoswere distinguished from the bottom photographs andare comparable to the data provided by Thouzeau etal. (1991), who described a total of 106 species of epi-faunal megabenthos on Georges Bank identified fromdredge samples. However, this is only 15% of the totalnumber of macrobenthic taxa identified by Wildishet al. (1989, 1990) from grab samples. Disregardinginfauna may lead to undercounting of bivalves andpolychaete species; these are the most diverse groupon Georges Bank (Theroux & Wigley 1998). How-ever, even with coarse taxonomic resolution we wereable to distinguish associations of species and to out-line general trends and relationships between biotaand sediments. Descriptions of macrofauna patternson a family level have been deemed appropriate else-where (Warwick 1988, Warwick et al. 1990, Gray etal. 1992) where only negligible loss of discriminantinformation is shown to take place in multivariateanalyses.
On Georges Bank, Thouzeau et al. (1991) describeda 10-fold decrease in total megabenthos density ondunes compared to sand-shell bottoms, and an evenmore drastic contrast with gravel habitats. Our find-ings show similar patterns in regard to these extremesof sediment texture. Sediment type controls speciesdistribution and similar groups of species commonlyoccur on similar substrata (Thorson 1971) where grainsize is the most commonly found correlative factor(Rhoads 1976). While the relationship between sedi-ments and biota is self-evident for many scientists,recent reviews show little evidence that sedimentarygrain size alone is a primary determinant of speciesdistribution (Snelgrove & Butman 1994). Currents ap-pear to play a major role in defining both sedimentgrain size and community structure (e.g. Jumars 1993,Wildish & Kristmanson 1997). Newell et al. (1998) sug-gests that community composition is not controlled bysimple granulometric properties of the sediments.They consider particle mobility at the sediment-waterinterface, together with a complex association of chem-ical and biological factors operating on a long timescale, as the most likely controlling agents.
In this study, we describe regional geomorphologyand sea floor sediment texture based on interpretationof multibeam data. High-resolution representation ofseabed morphology allowed the interpretation of dy-namic characteristics of water masses and, furthermore,an interpretation of benthic habitats. This approachcontrasts with the more traditional granulometric de-scription, commonly based on grab samples. Our bank-wide sediment description has proven to be useful fordescribing properties of benthic habitats. It is likelythat trends in diversity, distribution, and abundance ofmegafauna elsewhere can be successfully predictedfrom the interpretation of multibeam data, which de-fines sedimentary habitat over a wide range of scales.
At present, it is not possible to use the interpretationof multibeam sonar data for distinguishing habitatscovered by a very thin layer of silt. Such habitats,as identified by the dominance of deposit-feeders andbottom photographs, suggest higher rates of depositionand low resuspension of sediments. In such cases, aswell as in the case with Alcyonacea-Cucumaria associ-ation, the benthic community provides more informa-tion about seabed habitat than sediment data. In gen-eral, sessile benthic organisms are particularly usefulfor habitat characterization because substrate is criti-cal for their survival and proliferation. Being spatiallyfixed, they become indicative of environmental condi-tions of the adjacent sea floor.
The map of Browns Bank habitats (Fig. 12) is a con-ceptual model summarizing the present understandingof the bank ecology and represents a first attempt atintegration of geological, biological, and dynamic con-
135
Mar Ecol Prog Ser 219: 121–137, 2001
ditions over a region. While the present model of thebank takes into account sea floor sediment and waterdepth, there are more factors to be considered in thefuture. Processes such as the transport of organic mat-ter to the benthos, transport of sediment across the seafloor, resuspension of detritus, storm and current mod-ification of bedforms, and a suite of processes couplingthe benthic and pelagic zones should be considered infuture habitat mapping projects.
Our study shows the high utility of multibeam bathy-metric sonar for the interpretation of sea floor sedi-ments and benthic habitats. Further developments ofthis technique should include analysis and interpreta-tion of high-resolution seabed stratigraphy, the multi-beam signal in terms of habitat complexity, and otherphysical properties, which may be applicable to thecross-classification of acoustic and benthic data.
Acknowledgements. We would like to thank the Masters andcrews of the CCGS ‘Frederick G. Creed’ and the CCGS‘Hudson’ for making the geoscientific data collection such asuccess. G. Costello of the Canadian Hydrographic Service(CHS) organized the Browns Bank multibeam bathymetricsurvey and provided the raw data for processing. We wouldlike to thank G. Costello and M. Lamplugh (CHS) for theirinterest in all aspects of the study. D. Wildish (DFO) kindlyprovided sea floor photographs of Browns Bank and valuablecomments for the first version of this manuscript. D. Davis(Nova Scotia Museum of Natural History) was very helpfulwith species identifications and general discussion of the pro-ject. D. Greenberg and J. Loder generously provided dataon temperatures and current strengths. We thank C. Hannahand B. Petrie (DFO) for discussions on oceanography. Thisproject was made possible by financial support from Clear-water Fine Foods Inc.; we thank M. Pittman and E. Roe fortheir interest in the work. D. C. Gordon, D. J. W. Piper, C. E.A. Carver and 3 anonymous referees improved the clarity ofour thinking with their thorough reviews. Geological surveyof Canada Contribution Number 2000124
LITERATURE CITED
Amos CL, King EL (1984) Bedforms of the Canadian easternseaboard: a comparison with global occurrences. MarGeol 57:167–208
Auster PJ, Langton RW (1999) The effects of fishing on fishhabitat. Am Fish Soc Symp 22:150–187
Auster PJ, Malatesta RJ, Langton RW, Watling L, ValentinePC, Donaldson CL, Langton EW, Shepard AN, Babb I(1996) The impacts of mobile fishing gear on sea floorhabitats in the Gulf of Maine (Northwest Atlantic): impli-cations for conservation of fish populations. Rev Fish Sci4:185–202
Begon M, Harper JL, Townsend CR (1996) Ecology: indi-viduals, populations and communities, 3rd edn. BlackwellScience, Cambridge
Bousfield EL (1960) Canadian Atlantic sea shells. NationalMuseum of Canada, Ottawa
Caddy JF (1970) Records of associated fauna in scallopdredge hauls from the Bay of Fundy. Fish Res Board CanTech Rep 225
Canadian Hydrographic Service (1988) Chart L/C 8006, Scot-ian Shelf, Browns Bank to Emerald Bank. Scale 1:300 000,Ottawa
Clarke KR, Ainsworth M (1993) A method of linking multi-variate community structure to environmental variables.Mar Ecol Prog Ser 92:205–219
Collie JS, Escanero GA, Hunke L, Valentine PC (1996) Scal-lop dredging on Georges Bank: photographic evaluationof effects on benthic fauna. ICES CM 1996/Mini:9
Courtney RC, Shaw J (2000) Multibeam bathymetry and back-scatter imaging of the Canadian continental shelf. GeosciCan 27:31–42
Cranford PJ, Gordon DC (1992) The influence of dilute claysuspensions on sea scallop (Placopecten magellanicus)feeding activity and tissue growth. Neth J Sea Res 30:107–120
Cranford PJ, Grant J (1990) Particle clearance and absorptionof phytoplankton and detritus by the sea scallop Placo-pecten magellanicus (Gemelin). J Exp Mar Biol Ecol 137:105–121
Dickie LM, Medcof JC (1956) Environment and the scallopfishery. Can Fisherman 9:7–9
Drapeau G, King LH (1972) Surficial geology of the Yarmouth-Browns Bank map area. Canadian Hydrographic Service,Marine Sciences Paper 2, Geological Survey of Canada.Paper 72–24, Department of the Environment, Ottawa
Fader GBJ (1989) A Late Pleistocene low sea-level stand ofthe southeast Canadian offshore. In: Scott DB, PirazzoliPA, Honig CA (eds) Late wuaternary sea-level correlationand applications. Kluwer, Dordrecht, p 71–103
Fader GBJ, King LH, MacLean B (1977) Surficial geology ofthe eastern Gulf of Maine and Bay of Fundy. CanadianHydrographic Service, Marine Science Paper 19, Geologi-cal Survey of Canada, Paper 76–17, Department ofEnergy, Mines and Resources, Ottawa
Gordon DC, Schwinghamer P, Rowell TW, Prena J, GilkinsonK, Vass WP, McKeown DL (1998) Studies in Eastern Canadaon the impact of mobile fishing gear on benthic habitatand communities. In: Dorsey EM, Pederson J (eds) Effectsof fishing gear on the sea floor of New England. Massa-chusetts Institute of Technology, Sea Grant College Pro-gram report 98–4:63–67
Gray JS, McIntyre AD, Stirn J (1992) Manual of methods inaquatic environment research, Part 11, Biological assess-ment of marine pollution with particular reference to ben-thos. FAO Fish Tech Pap 324 FAO/UNEP, Rome
Greene HG, Yoklavich MM, Sullivan D, Cailliet GM (1995) Ageophysical approach to classifying marine benthic habi-tats: Monterey Bay as a model. Applications of side-scansonar and laser-line systems in fisheries research. AlaskaFish and Game Special Publication No. 9, Juneau, p 15–30
Hamel JF, Mercier A (1996) Early development, settlement,growth and spatial distribution of the sea cucumber Cucu-maria frondosa (Echinodermata: Holothuroidea). Can JFish Aquat Sci 53(2):253–271
Hannah CG, Shore JA, Loder JW, Naimie CE (2000) Seasonalcirculation on the western and central Scotian Shelf. J PhysOceanogr 31:591–615
Jumars P (1993) Concepts in biological oceanography: an inter-disciplinary approach. Oxford University Press, New York
King LH, Fader GBJ (1986) Wisconsinan glaciation of the con-tinental shelf-southeast Atlantic Canada. Geol Surv CanBull 363
King LH, MacLean B (1976) Geology of the Scotian Shelf.Canadian Hydrographic Service, Marine Sciences Paper7, Geological Survey of Canada Paper, 74–31, Departmentof Energy, Mines and Resources, Ottawa
136

Kostylev et al.: Benthic habitat mapping on the Scotian Shelf
Lancaster N (1987) Formation and reactivation of dunes in thesouthwestern Kalihari: paleoclimatic implications. Palaeo-ecol Afr 18:103–110
Larsen PF, Lee RM (1978) Observations on the abundance,distribution and growth of post-larval sea scallops Placo-pecten magellanicus, on Georges Bank. Nautilus 92(3):112–116
Lynch DR, Naimie CE (1993) The M2 tide and its residual onthe outer banks of the Gulf of Maine. J Phys Oceanogr23:2222–2253
Miner RW (1950) Field book of seashore life. Putnam andSons, New York
Mitchell NC (1996) Processing and analysis of Simrad multi-beam sonar data. In: Pratson LF, Edwards MH (eds) Ad-vances in sea floor mapping using sidescan sonar andmultibeam bathymetry data. Mar Geophys Res 18:729–739
Mitchell NC, Hughes Clarke JE (1994) Classification of seafloor geology using multibeam sonar data from the ScotianShelf. Mar Geol 121:143–160
Mitchell NC, Somers ML (1989) Quantitative backscattermeasurements with a long-range side-scan sonar. Instituteof Electrical and Electronics Engineers. J Ocean Engin14:368–374
Newell RC, Seiderer LJ, Hitchcock DR (1998) The impact ofdredging works in coastal waters: a review of the sensitiv-ity to disturbance and subsequent recovery of biologicalresources on the sea bed. Oceanogr Mar Biol Annu Rev36:127–178
Noble JP, Logan A, Webb GR (1976) The recent Terebratulinacommunity in the rocky subtidal zone of the Bay of Fundy,Canada. Lethaia 9:1–17
Page FH, Smith PC (1989) Particle drift in the surface layer offsouthwest Nova Scotia. Can J Fish Aquat Sci 46:21–43
Paine RT (1959) Maine records of the brachiopod Terebratu-lina. Maine Field Nat 15(2):46–49
Rhoads DC (1976) Organism-sediment relationships. In: Mc-Cave IN (ed) The benthic boundary layer. Plenum Press,New York
Shaw J, Courtney RC, Currie JR (1997) Marine geology of St.George’s Bay, Newfoundland, as interpreted from multi-beam bathymetry and back-scatter data. Geo Mar Lett 17:188–194
Simrad (1992) SIMRAD EM 1000 Hydrographic Echo Sounder,Product Description. Simrad Subsea A/S, Horten, Norway
Smith PC (1983) The mean seasonal circulation off southwestNova Scotia. J Phys Oceanogr 13:1034–1054
Snelgrove PVR, Butman CA (1994) Animal-sediment relation-ships revisited: cause versus effect. Oceanogr Mar BiolAnnu Rev 32:111–177
Svane I, Young, CM (1989) The ecology and behavior of as-cidian larvae. Oceanogr Mar Biol Annu Rev 27:45–90
Theroux RB, Wigley RL (1998) Quantitative compositionand distribution of the macrobenthic invertebrate fauna ofthe continental shelf ecosystems of the northeasternUnited States. US Dept Comm, NOAA Tech Rep NMFS140
Thorson G (1971) Life in the sea. McGraw-Hill, New YorkThouzeau GR, Robert G, Ugarte R (1991) Faunal assem-
blages of benthic megainvertebrates inhabiting sea scal-lop grounds from eastern Georges Bank, in relation toenvironmental factors. Mar Ecol Prog Ser 74:61–82
Todd BJ, Fader GBJ, Courtney RC, Pickrill RA (1999) Quater-nary geology and surficial sediment processes, BrownsBank, Scotian Shelf, based on multibeam bathymetry. MarGeol 162:167–216
Tremblay MJ, Sinclair M (1991) Planktonic sea scallop larvae(Placopecten magellanicus) in the Georges Bank region:broadscale distribution in relation to physical oceanogra-phy. Can J Fish Aquat Sci 49:1597–1615
Urick RJ (1983) Principles of underwater sound, 3rd edn.McGraw-Hill, New York
Warwick RM (1988) Analysis of community attributes of themacrobenthos of Frierfjord/Langesundfjord at taxonomiclevels higher than species. Mar Ecol Prog Ser 46:167–170
Warwick RM, Platt HM, Clarke KR, Agard J, Gobin J (1990)Analysis of macrobenthic community structure in relationto pollution and disturbance in Hamilton Harbour, Ber-muda. J Exp Mar Biol Ecol 138:119–142
Wentworth CK (1922) A scale of grade and class terms forclastic sediments. J Geol 30:377–392
Wildish DJ, Kristmanson D (1997) Benthic suspension feedersand flow. Cambridge University press, New York
Wildish DJ, Wilson AJ, Frost B (1989) Benthic macrofaunalproduction of Browns Bank, Northwest Atlantic. Can J FishAquat Sci 46:584–590
Wildish DJ, Frost B, Wilson AJ (1990) Stereographic analysisof the marine, sublittoral sediment-water interface. CanTech Rep Fish Aquat Sci 1726
Zezina ON (1993) Brachiopods in the zone of seston-feederson the North Atlantic slopes. In: Kuznetsov AP, SokolovaMN (eds) Feeding of marine invertebrates in different ver-tical and latitudinal zones. IORAN, Moscow, p 31–40
137
Editorial responsibility: Otto Kinne (Editor), Oldendorf/Luhe, Germany
Submitted: April 14, 2000; Accepted: November 8, 2000Proofs received from author(s): August 6, 2001