
Chapter 3 Current Issues of the Water Supply Systemopen_jicareport.jica.go.jp/pdf/11821790_02.pdfThe...
119
Chapter 3 Current Issues of the Water Supply System
Transcript of Chapter 3 Current Issues of the Water Supply Systemopen_jicareport.jica.go.jp/pdf/11821790_02.pdfThe...

Chapter 3 Current Issues of the Water Supply System

The Study on Restructuring of Water Supply System Volume 3. Supporting Report of Tashkent City in the Republic of Uzbekistan March 2006
S 3-1-2-1
S 3.1.2 Diagnosis Study of Facilities
(1) Judgment Standard
Diagnosis ranks are stipulated as the judgment standard for civil structures and buildings
as shown in Table S 3.1.2.1 (1), and mechanical and electrical facilities as shown in
Table 3.1.2.1 (2).
Table S 3.1.2.1 (1) Diagnosis Rank and Evaluation for Civil Structures and Buildings
Class Judgment A Good B No serious problem, but replacement will be necessary C Needed to replace within 5 years because of deterioration
Table 3.1.2.1 (2) Diagnosis Rank and Evaluation for Mechanical and Electrical Facilities
Class Evaluation A Good B No serious problem, but replacement will be necessary in future
C1 Needed to replace because of deterioration C2 Breakdown frequently take place, so replace needs urgently
(2) Surface WTPs
1) Kadirya WTP
i) Diagnosis for Capacity of WTP
The design capacity and the investigated actual capacity of WTP are shown in Table S
3.1.2.2.
ii) Diagnosis for Civil Structures and Buildings
Civil structures and buildings of WTP are listed in Table S 3.1.2.3 (1).
Diagnosis results of these are shown in Table S 3.1.2.3 (2) to (5).

The Study on Restructuring of Water Supply System Volume 3. Supporting Report of Tashkent City in the Republic of Uzbekistan March 2006
S 3-1-2-2
Table S 3.1.2.2 Diagnosis for Capacity of WTP
Design Capacity
Nominal Capacity 57,292 m3/hr = 1,375,000 m3/day
Maximum capacity by No.1 intake PS 43,800 m3/hr = 1,051,200 m3/d
Maximum capacity by No.2 intake PS 56,300 m3/hr = 1,351,200 m3/d
Total Intake capacity 100,100 m3/hr = 2,402,400 m3/d Filtration area: No.1 2,736 m2 Filtration area: No.2 3,984 m2 Total Filtration area 6,720 m2 Filtration Capability(7~10m/hr) 10 m/hr 240 m/d
Distribution capacity of gravity pipe 2,251,200 m3/d
Distribution capacity of PS 6,300 m3/hr = 151,200 m3/d
Total Distribution Capacity 2,402,400 m3/d
Washing water pump capacity 6,500 m3/hr 156,000 m3/d Chlorination capacity 266 kg/hr Coagulant injection capacity kg/hr Service reservoirs capacity 30,000 m3 0.32 hr
Actual Capacity Maximum capacity by No.1 intake PS 55,040 m3/hr = 1,320,960 m3/d
Maximum capacity by No.2 intake PS 40,000 m3/hr = 960,000 m3/d
Total Intake capacity 95,040 m3/hr = 2,280,960 m3/d
Distribution capacity of gravity pipe 2,280,000 m3/d
Distribution capacity of PS 5,040 m3/hr = 120,960 m3/d
Total Distribution Capacity 2,280,000 m3/d
Washing water pump capacity 5,200 m3/hr 124,800 m3/d Chlorination capacity 140 kg/hr Coagulant injection capacity --- kg/hr

The Study on Restructuring of Water Supply System Volume 3. Supporting Report of Tashkent City in the Republic of Uzbekistan March 2006
S 3-1-2-3
Table S 3.1.2.3 (1) List of Civil Structures and Buildings
No. Name Type Dimension Area (m2) Depth (m) Volume (m3) Number 1-1 No.1 Sedimentation basin Soil bank W50-250mxL1,500m 112,500 1.5-9 1,000,000 1 1-2 No.1 Intake Weir Concrete W2.5 4 1-3 No.1 Inlet screen Steel W2.5 6 2-1 No.2 Intake Weir Concrete W2.5 4 2-2 No.2 Flocculation Basin Concrete W26xL110m 2,860 4 11,440 1 2-3 No.2 Sedimentation basin Soil bank W250xL600m 120,000 1.5-6 250,000 2 2-5 No.2 Inlet chamber Concrete W4mx10m 2 2-6 No.2 Chlrination house Brick 50 1 2-7 No.2 Pump pit Concrete 10,000 2 3 No.1 Intake pump building Concrete W12xL60m 720 1 4 No.2 Intake pump building Concrete W18x90m 1,620 1 5 Administration Building Concrete W9xL32mx2stories 576 1 6 Filter basin(old) Concrete 108.8m2x12+118x12 2,722 1 7 Filter basin(New) Concrete 166m2x24 3,984 1 8 Filter building(old) with Laboratory Concrete W48xL164m 7,872 1 9 Filter building(New) Concrete W40xL148m 5,920 1 11 Chlrination Building Brick W12xL56mx2stories 1,344 1 12 Reservoir Concrete 36mx56m 5 10,000 3 13 Coagulant dissolving T Concrete W3xL12m 120 4 14 Soluted coagulant T(circle) Concrete D25.2m 4 2000 2 15 Soluted coagulant T Concrete W25xL30m 2 1500 1 16 Coagulant feeding T Concrete 60 4 17 Coagulation Building Brick W12xL28m 336 1
18 Distribution pump Building Concrete W18xL86 1,548 1

Table S 3.1.2.3 (2) Diagnosis Sheet of Civil Structure & Buildings for Kadirya WTP
No.1 Inlet mouth x1 A B C 1969
No.2 Inlet mouth x4 A B C 1983
Quality Appearance Crack Split Leakage Screen Steel cover Gate
No.1Sedimentation basin A A NO NO NO B B B 1969
No.2Sedimentation basin A A NO NO NO B B B 1983
Appearance Erosion Crack Protection
No.1 Sedimentation basin A NO NO NO
No.2 Sedimentation basin A NO NO NO
Quality Appearance Crack Split Leakage Screen Steel cover Gate
No.1 B C NO NO NO C C C 1969
No.2 B C NO NO NO C C C 1969
Quality Appearance Crack Split Leakage
No.1 Reservoir B B NO NO NO B B 1969
No.2 Reservoir B B NO NO NO B B 1973
No.3 Reservoir B B NO NO NO B B 1980
Quality Appearance Crack Split Leakage
Alam mixing tank x 4 B C NO NO NO B 1973
No.1 Alam storege tank B C NO NO NO B 1973
No.2 Alam storege tank B C NO NO NO B 1973
No.3 Alam storege tank B C NO NO NO B 1973
Alam injection tank B B NO NO NO C 1973
Concrete
OthersFacility Name
Inner condition wasnot examined becauseof filled water ,butreportedly in faircondition throughhearing survey.
Reservoir
A
A
A
Pipes
Const.yearFacility
Inlet Chamber
Inject. facilities
C
NameConcrete Equipment
C
Const.year
Const.year
*All dikes are protected by concrete and well maintained. Sediments are well dredged in 6 months every year. 1.0m of sediments are accumulated at the deepest pont (60m) of basin.
Others
C
C
Others
Cover soil Appearance
Const.year
Ventilator
Lumber being used for inner wall is seriously worm-out.
Outer wall of tank is seriously deteriorated (Inner condition isrelatively fair in hearing survey).
Concrete
Facility Name
Inlet Weir
ChemicalFacilities
Name
Inlet channel
Facility Name
SedimentationBasin
Name
*Sedimentation basin using old canal has stable dike. Sediments are well dredged in 6 months every year. 3.0 mof sediments are accumulated at the deepest pont (10m) of basin.
Facility
Dike
Intake gate
Const.yearOthersPipes
Equipment of dosing point has seriously deteriorated.
Outer wall of tank is seriously deteriorated (Inner condition isrelatively fair in hearing survey).
Outer wall of tank is seriously deteriorated (Inner condition isrelatively fair in hearing survey).
Injection ofAlum
EquipmentInject. facilities
Concrete
*The most of steel-made weirs have deteriorated, but functioning well. Suspended solids cannot be removedsince screen is not equipped. Also, wooden alum feeder has deteriorated almost going to collapse.*The most of steel-made weir has corroded, but functioning well. Wooden alum feeder has deteriarated almostgoing to collapse.
S 3-1-2-4

Table S 3.1.2.3 (3) Diagnosis Sheet of Civil Structure & Buildings for Kadirya WTP
Quality Appearance Crack Split Leakage Painting Rust leakage Valve OthersFilter-1 B B NO NO NO NO YES NO C 1969
Filter-2 B B NO NO NO NO YES NO C 1969
Filter-3 B B NO NO NO NO YES NO C 1969
Filter-4 B B NO NO NO NO YES NO C 1972
Filter-5 B B NO NO NO NO YES NO C 1972
Filter-6 B B NO NO NO NO YES NO C 1972
Filter-7 B B NO NO NO NO YES NO C 1975
Filter-8 B B NO NO NO NO YES NO C 1975
Filter-9 B B NO NO NO NO YES NO C 1975
Filter-10 B B NO NO NO NO YES NO C 1975
Filter-11 B B NO NO NO NO YES NO C 1975
Filter-12 B B NO NO NO NO YES NO C 1975
Filter-13 B B NO NO NO NO YES NO C 1975
Filter-14 B B NO NO NO NO YES NO C 1975
Filter-15 B B NO NO NO NO YES NO C 1975
Filter-16 B B NO NO NO NO YES NO C 1975
Filter-17 B B NO NO NO NO YES NO C 1975
Filter-18 B B NO NO NO NO YES NO C 1975
Filter-19 B B NO NO NO NO YES NO C 1972
Filter-20 B B NO NO NO NO YES NO C 1972
Filter-21 B B NO NO NO NO YES NO C 1972
Filter-22 B B NO NO NO NO YES NO C 1969
Filter-23 B B NO NO NO NO YES NO C 1969
Filter-24 B B NO NO NO NO YES NO C 1969
Const.yearPipesFacility Name Concrete
Rapid SandFilter No.1
*Concrete structuresof upper and bottompart are relatively infair condition. Most ofpipes have corrordedbecause of no coatingof paint. Corrosion oflower part of pipes isso serious to causewater leak near future.As a whole, however,filters are wellmaintained and kept inmuch clean condition.
S 3-1-2-5

Table S 3.1.2.3 (4) Diagnosis Sheet of Civil Structure & Buildings for Kadirya WTP
Quality Appearance Crack Split Leakage Painting Rust leakage Valve OthersFilter‐1 B B NO NO NO NO YES YES C 1978
Filter‐2 B B NO NO NO NO YES YES C 1978
Filter‐3 B B NO NO NO NO YES YES C 1978
Filter‐4 B B NO NO NO NO YES YES C 1981
Filter‐5 B B NO NO NO NO YES YES C 1981
Filter‐6 B B NO NO NO NO YES YES C 1981
Filter‐7 B B NO NO NO NO YES YES C 1981
Filter‐8 B B NO NO NO NO YES YES C 1981
Filter‐9 B B NO NO NO NO YES YES C 1981
Filter‐10 B B NO NO NO NO YES YES C 1985
Filter‐11 B B NO NO NO NO YES YES C 1985
Filter‐12 B B NO NO NO NO YES YES C 1985
Filter‐13 B B NO NO NO NO YES YES C 1985
Filter‐14 B B NO NO NO NO YES YES C 1985
Filter‐15 B B NO NO NO NO YES YES C 1985
Filter‐16 B B NO NO NO NO YES YES C 1981
Filter‐17 B B NO NO NO NO YES YES C 1981
Filter‐18 B B NO NO NO NO YES YES C 1981
Filter‐19 B B NO NO NO NO YES YES C 1981
Filter‐20 B B NO NO NO NO YES YES C 1981
Filter‐21 B B NO NO NO NO YES YES C 1981
Filter‐22 B B NO NO NO NO YES YES C 1978
Filter‐23 B B NO NO NO NO YES YES C 1978
Filter‐24 B B NO NO NO NO YES YES C 1978
Const.yearConcrete
Rapid SandFilter No.2
Pipes
*Concrete structuresof upper and bottompart are relatively fair.Most of pipes havecorrorded because ofno duly coating ofpaint. Especially,lower part of pipes areseriously affected.Valves are apt tomalfunction andrepaired frequently,however, waterleakage occurrs due tobad quality of gasket,even after repairing.Water leakage otherthan this is notovserved. As a whole,filters are wellmaintained and kept inmuch clean condition.
Facility Name
S 3-1-2-6

Table S 3.1.2.3 (5) Diagnosis Sheet of Civil Structure & Buildings for Kadirya WTP
Quality Appearance Crack Split Leakage
ChlorinationFacilities
Building C C NO NO NO C 1969/1979
Quality Appearance Crack Split Leakage Appearance Crack Appearance Crack LeakageNo1 IntakeP/S B B B NO NO NO - - C YES YES
No2 IntakeP/S B B B NO NO NO - - C YES YES
Dist.P/S B B B NO NO NO - - C YES YES
Doors Windows Glass Ventilator Step Steel floor Lighting
No1 IntakeP/S C C C C B B C 1969
No2 IntakeP/S C C C C B B C 1983
Dist.P/S C C C C B B C 1973
Appearance Crack Appearance Crack Leakage Appearance Crack Leakage
Administration B B NO ー ー ー C NO YES 1969
Old filter A ー ー C YES YES C NO YES 1969/72/75
New filter A ー ー C YES YES C NO YES 1978/81/85
Boiler B B NO ー ー ー C NO YES 1989
Coagulation B B NO ー ー ー C NO YES 1970
Store house B B NO ー ー ー C NO YES 1971
Name
Brick wall Concrete wallConcrete floor
10.Other Building
Facility Name
Blick wall Pipes
OtherBuildings
Others
Const.yearEquipment
Both internal and external building haveeteriorated.
Both internal and external building haveeteriorated.
Roof
Others
*Mortar and joints of external wall are removedeverywhere, however, P/C concrete has notdeteriorated. *Inside structure is maintained neately.Many traces of rain leaking are found, but roughlyrepaired.
Others Const.year
Especially, outer wall and ceiling havedeteriorated seriously.
Both internal and external building haveeteriorated.
Facility Name Concrete floor RoofConcrete wall
Both internal and external building haveeteriorated.
Especially, outer wall and ceiling havedeteriorated seriously.
P/S Buildings
Const.year
Brick wall
Fitting
*Internal and external building have deteriorated seriously. It's verydangerous that there's no space to accommodate 1-ton container.Presently, about 39 containers are placed disorderly and emptycontainers are left everywhere in vacant lot. *Only 9 sets of feedingequipment out of 20, are available due to majority of malfunction.*As a whole, building has deteriorated remarkably. Service pipesinstalled on the earth, with maximum length of 400 m to feedingpoint, are roughly maintained.
Facility Name
S 3-1-2-7

The Study on Restructuring of Water Supply System Volume 3. Supporting Report of Tashkent City in the Republic of Uzbekistan March 2006
S 3-1-2-8
iii) Intake PSs
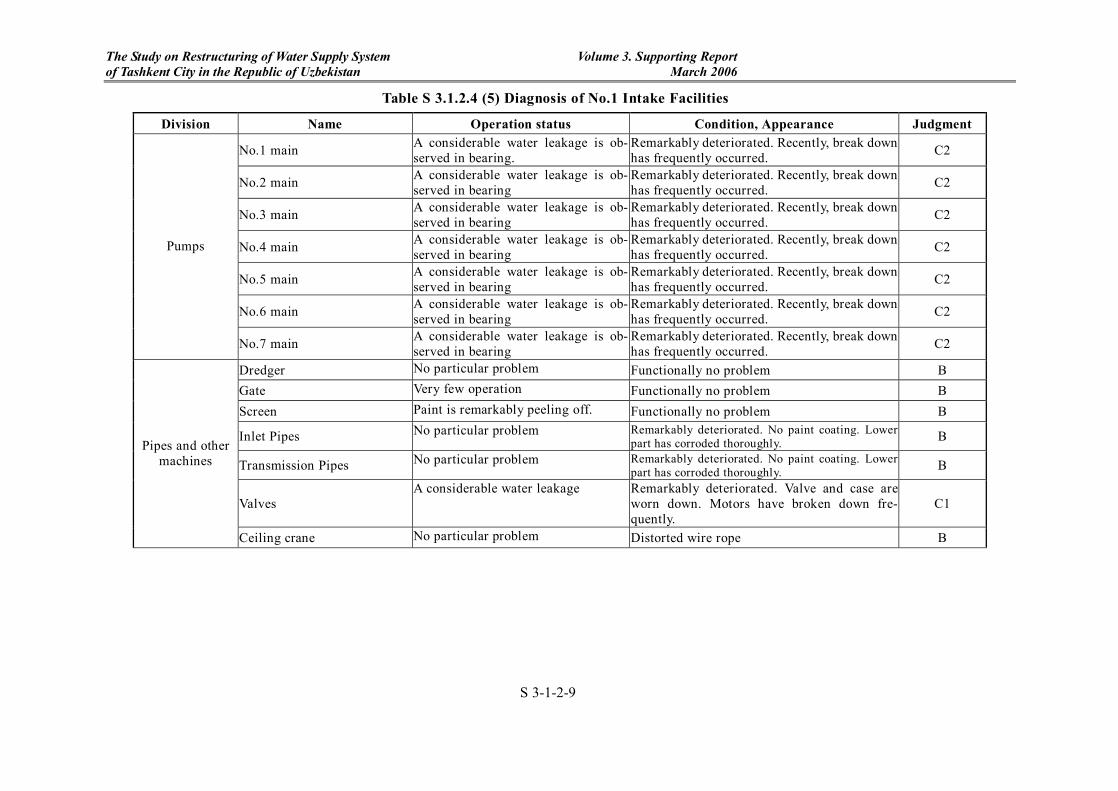
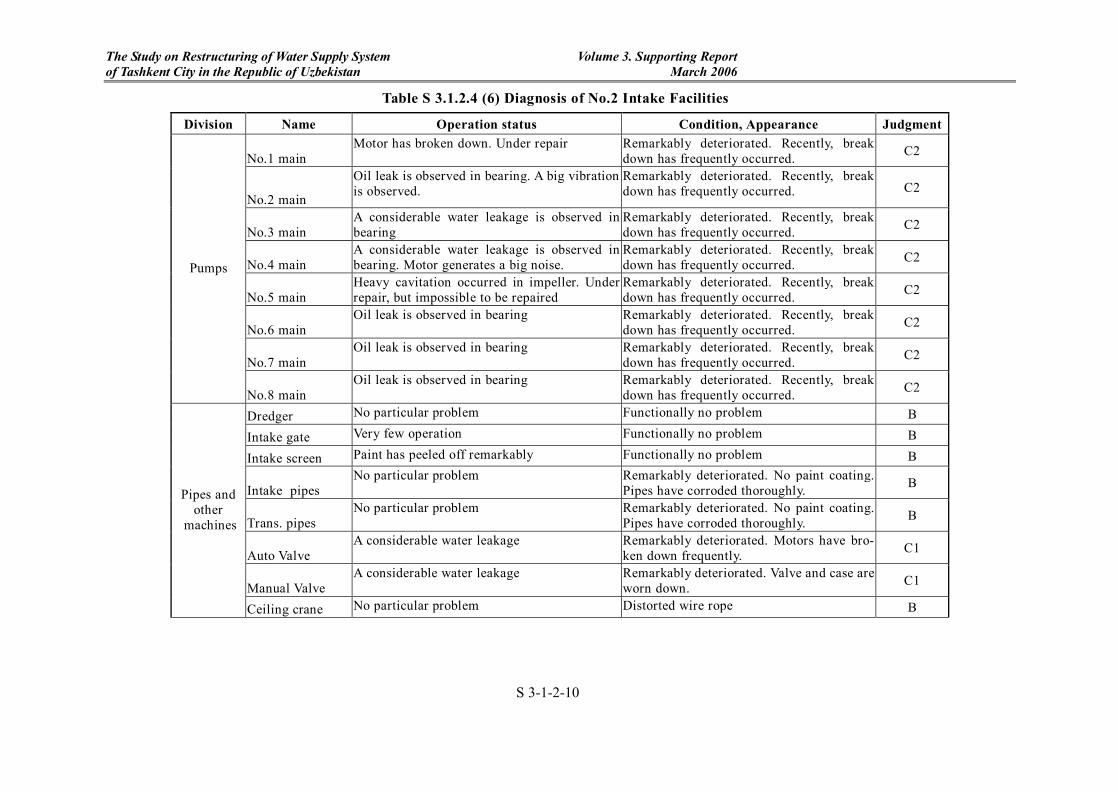
No.1 and No.2 intake pumps and related facilities are listed in Table S 3.1.2.4(1) to (4).
Diagnosis results for intake facilities are shown in Table S 3.1.2.4 (5) and (6).
Table S 3.1.2.4(1) List of Main Pump for No.1 Intake PS
No. Name Type Q (m3/hr)
Head m)
D (in, out) (mm)
Power (kW)
In Pipe (mm)
Out Valve (mm)
Inst. year
1 Main pump 48D22 12,500 24 φ1200,φ1000 1250 φ1500 φ1200 1969 2 Ditto Ditto 12,500 24 φ1200,φ1000 1250 φ1500 φ1200 1969 3 Ditto Ditto 12,500 24 φ1200,φ1000 1250 φ1500 φ1200 1969 4 Ditto Ditto 12,500 24 φ1200,φ1000 1250 φ1500 φ1200 1973 5 Ditto Ditto 12,500 24 φ1200,φ1000 1250 φ1500 φ1200 1976 6 Ditto 32D19 6,300 27 φ900,φ700 630 φ1200 φ1200 1986 7 Ditto Ditto 6,300 27 φ900,φ700 580 φ1200 φ1000 1977
Table S 3.1.2.4(2) List of Intake Facilities for No.1 Intake PS
No. Name Specifications Inst. year 1 Dredger Micro pumping boat, Volute pump 400m3/h 19.5m 75kW 1972 2 Intake gate Motor gate, 2.5mx5m 1969 3 Intake screen Bar screen, Slit width 100 mm, W2.5mxH5m 1969 4 Intake pipes D1600x6 1969 5 Trans. Pipes D1400mmx4 1969 6 Auto Valve D1000-2000mm 1969 7 Manual Valve D1000-2000mm 1969 8 Ceiling crane W18m x 20t 1969
Table S 3.1.2.4(3) List of Main Pump for No.2 Intake PS
No. Name Type Q (m3/hr)
Head ( m)
D (in, out) (mm)
Power (kW)
In Valve (mm)
Out Valve (mm)
Inst. year
1 Main pump 48D22 12,500 24 1300 ,900 1250 1600 1200 1983 2 Ditto Ditto 12,500 24 1300 ,900 1250 1600 1200 1985 3 Ditto Ditto 12,500 24 1300 ,900 1250 1600 1200 1983 4 Ditto 32D19 6,300 27 800 ,600 800 1600 1200 1985 5 Ditto Ditto 6,300 27 800 ,600 800 1600 1200 1985 6 Ditto 48D22 12,500 24 1300 ,900 1250 1600 1200 1983 7 Ditto Ditto 12,500 24 1301 ,900 1250 1600 1200 1985 8 Ditto Ditto 12,500 24 1302 ,900 1250 1600 1200 1977
Table S 3.1.2.4(4) List of Intake Facilities for No.2 Intake PS
No. Name Specifications Inst. year 1 Dredger Micro pumping boat, Volute pump 400m3/h 19.5m 75kW 1972 2 Intake gate Motor gate, W2.5×H5.0m 1983 3 Intake screen Bar screen, Slit width mm, W4mxH4m 1983 4 Intake pipes D2,500x2 1983 5 Trans. Pipes D2,000 mmx2+1400x2 1983 6 Auto Valve D1,000-2,000 mm 1983 7 Manual Valve D1,000-2,000,mm 1983 8 Ceiling crane W18m x 20t 1983
The Study on Restructuring of Water Supply System Volume 3. Supporting Report of Tashkent City in the Republic of Uzbekistan March 2006
S 3-1-2-9
Table S 3.1.2.4 (5) Diagnosis of No.1 Intake Facilities
Division Name Operation status Condition, Appearance Judgment
No.1 main A considerable water leakage is ob-served in bearing.
Remarkably deteriorated. Recently, break down has frequently occurred. C2
No.2 main A considerable water leakage is ob-served in bearing
Remarkably deteriorated. Recently, break down has frequently occurred. C2
No.3 main A considerable water leakage is ob-served in bearing
Remarkably deteriorated. Recently, break down has frequently occurred. C2
No.4 main A considerable water leakage is ob-served in bearing
Remarkably deteriorated. Recently, break down has frequently occurred. C2
No.5 main A considerable water leakage is ob-served in bearing
Remarkably deteriorated. Recently, break down has frequently occurred. C2
No.6 main A considerable water leakage is ob-served in bearing
Remarkably deteriorated. Recently, break down has frequently occurred. C2
Pumps
No.7 main A considerable water leakage is ob-served in bearing
Remarkably deteriorated. Recently, break down has frequently occurred. C2
Dredger No particular problem Functionally no problem B Gate Very few operation Functionally no problem B Screen Paint is remarkably peeling off. Functionally no problem B
Inlet Pipes No particular problem Remarkably deteriorated. No paint coating. Lower part has corroded thoroughly. B
Transmission Pipes No particular problem Remarkably deteriorated. No paint coating. Lower part has corroded thoroughly. B
Valves A considerable water leakage Remarkably deteriorated. Valve and case are
worn down. Motors have broken down fre-quently.
C1
Pipes and other machines
Ceiling crane No particular problem Distorted wire rope B
The Study on Restructuring of Water Supply System Volume 3. Supporting Report of Tashkent City in the Republic of Uzbekistan March 2006
S 3-1-2-10
Table S 3.1.2.4 (6) Diagnosis of No.2 Intake Facilities
Division Name Operation status Condition, Appearance Judgment
No.1 main Motor has broken down. Under repair Remarkably deteriorated. Recently, break
down has frequently occurred. C2
No.2 main
Oil leak is observed in bearing. A big vibration is observed.
Remarkably deteriorated. Recently, break down has frequently occurred. C2
No.3 main A considerable water leakage is observed in bearing
Remarkably deteriorated. Recently, break down has frequently occurred. C2
No.4 main A considerable water leakage is observed in bearing. Motor generates a big noise.
Remarkably deteriorated. Recently, break down has frequently occurred. C2
No.5 main Heavy cavitation occurred in impeller. Under repair, but impossible to be repaired
Remarkably deteriorated. Recently, break down has frequently occurred. C2
No.6 main Oil leak is observed in bearing Remarkably deteriorated. Recently, break
down has frequently occurred. C2
No.7 main Oil leak is observed in bearing Remarkably deteriorated. Recently, break
down has frequently occurred. C2
Pumps
No.8 main Oil leak is observed in bearing Remarkably deteriorated. Recently, break
down has frequently occurred. C2
Dredger No particular problem Functionally no problem B
Intake gate Very few operation Functionally no problem B
Intake screen Paint has peeled off remarkably Functionally no problem B
Intake pipes No particular problem Remarkably deteriorated. No paint coating.
Pipes have corroded thoroughly. B
Trans. pipes No particular problem Remarkably deteriorated. No paint coating.
Pipes have corroded thoroughly. B
Auto Valve A considerable water leakage Remarkably deteriorated. Motors have bro-
ken down frequently. C1
Manual Valve A considerable water leakage Remarkably deteriorated. Valve and case are
worn down. C1
Pipes and other
machines
Ceiling crane No particular problem Distorted wire rope B

The Study on Restructuring of Water Supply System Volume 3. Supporting Report of Tashkent City in the Republic of Uzbekistan March 2006
S 3-1-2-11
iv) Rapid Sand Filters
Rapid sand filters and related facilities are listed in Table S 3.1.2.5 (1) and (2), and the
diagnosis results are shown in Table S 3.1.2.5 (3).
Table S 3.1.2.5 (1) List of Rapid Sand Filters
No. Name Specifications Number Inst. year 1-1 Filters (1) A=108.8m2, Perforated collection pipe & double layer type, total filter layer
0.9-1.0m(quartz sand+ ceramics), Pipes and auto valve( inlet D800, outlet D800, back wash D600, drain D800)
6 1969
1-2 Pipes for filters (1) Inlet D800, outlet D800, back wash D600, drain D800 1 1969
2-1 Filters (2) A=118m2, Perforated collection pipe & double layer type ,total filter layer 0.9-1.0m( quartz sand+ ceramics), Pipes and auto valve( inlet D800, outlet D800, back wash D600, drain D800)
18 1972- 1975
2-2 Pipes for filters (2) inlet D800, outlet D800, back wash D600, drain D800 1 1972-
1975 3-1 Filters (3) A=166m2, Perforated collection pipe & double layer type, total filter layer
0.9-1.0m( quartz sand+ ceramics), Pipes and auto valve( inlet D800, outlet D800, back wash D800, drain D1000)
24 1978- 1985
3-2 Pipes for filters (3)
Inlet D800, outlet D800, back wash D800, drain D1000) 1 1978- 1985
Table S 3.1.2.5 (2) List of Facilities for Rapid Sand Filters No. Name Specifications Number Inst. year
1 Ceiling crane (1,2) W15 m x 20 t, moving distance150 m 2 1969
2 Ceiling crane (3) W15 m x 20 t, moving distance150 m 2 1978
3 Washing pump (1) 32D19, 6500m3/hrx29mhx639kw, with motor valve(in1200 mm, out1000 mm) 1 1969
4 Washing pump (2) 32D19, 6500m3/hrx29mhx639kw, with motor valve(in1200 mm, out1000 mm) 1 1975
5 Washing pump (3) 32D19, 6500m3/hrx29mhx639kw, with motor valve(in1200 mm, out1000 mm) 1 1975
The Study on Restructuring of Water Supply System Volume 3. Supporting Report of Tashkent City in the Republic of Uzbekistan March 2006
S 3-1-2-12
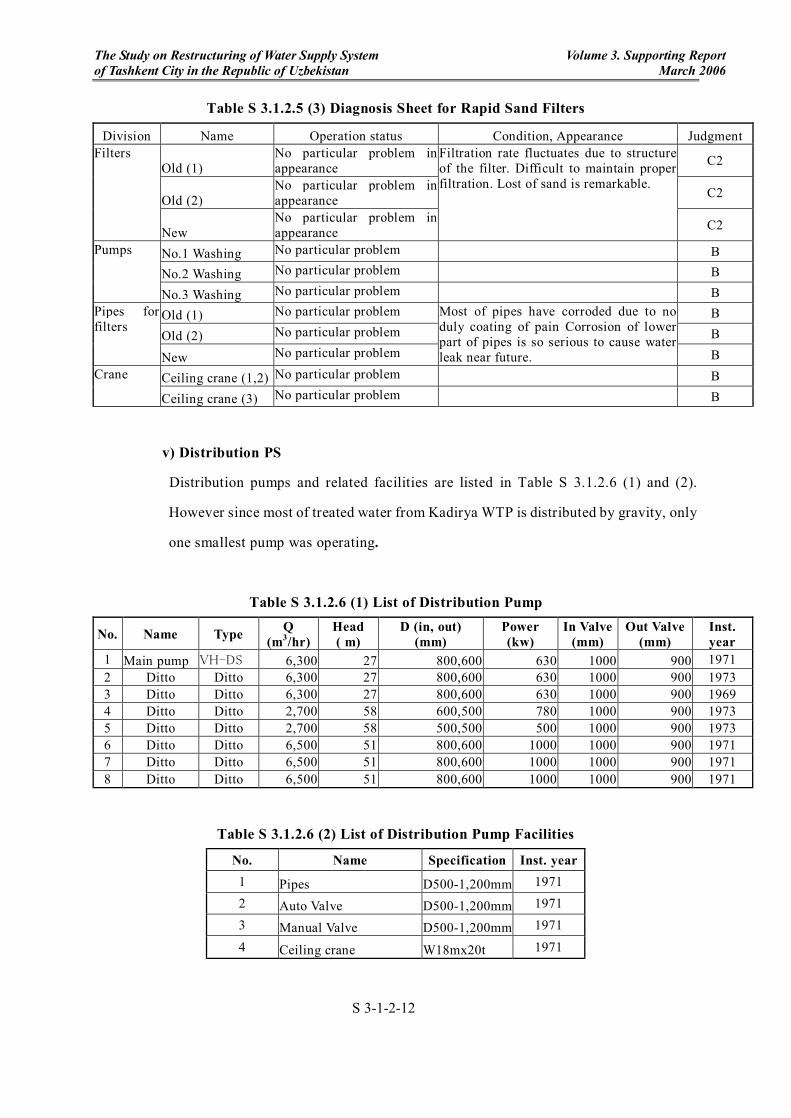
Table S 3.1.2.5 (3) Diagnosis Sheet for Rapid Sand Filters
Division Name Operation status Condition, Appearance Judgment
Old (1) No particular problem in appearance C2
Old (2) No particular problem in appearance C2
Filters
New No particular problem in appearance
Filtration rate fluctuates due to structure of the filter. Difficult to maintain proper filtration. Lost of sand is remarkable.
C2
No.1 Washing No particular problem B
No.2 Washing No particular problem B
Pumps
No.3 Washing No particular problem B
Old (1) No particular problem B
Old (2) No particular problem B
Pipes for filters
New No particular problem
Most of pipes have corroded due to no duly coating of pain Corrosion of lower part of pipes is so serious to cause water leak near future. B
Ceiling crane (1,2) No particular problem B Crane
Ceiling crane (3) No particular problem B
v) Distribution PS
Distribution pumps and related facilities are listed in Table S 3.1.2.6 (1) and (2).
However since most of treated water from Kadirya WTP is distributed by gravity, only
one smallest pump was operating.
Table S 3.1.2.6 (1) List of Distribution Pump
No. Name Type Q (m3/hr)
Head ( m)
D (in, out) (mm)
Power (kw)
In Valve (mm)
Out Valve (mm)
Inst. year
1 Main pump VH-DS 6,300 27 800,600 630 1000 900 1971 2 Ditto Ditto 6,300 27 800,600 630 1000 900 1973 3 Ditto Ditto 6,300 27 800,600 630 1000 900 1969 4 Ditto Ditto 2,700 58 600,500 780 1000 900 1973 5 Ditto Ditto 2,700 58 500,500 500 1000 900 1973 6 Ditto Ditto 6,500 51 800,600 1000 1000 900 1971 7 Ditto Ditto 6,500 51 800,600 1000 1000 900 1971 8 Ditto Ditto 6,500 51 800,600 1000 1000 900 1971
Table S 3.1.2.6 (2) List of Distribution Pump Facilities
No. Name Specification Inst. year 1 Pipes D500-1,200mm 1971 2 Auto Valve D500-1,200mm 1971 3 Manual Valve D500-1,200mm 1971
4 Ceiling crane W18mx20t 1971

The Study on Restructuring of Water Supply System Volume 3. Supporting Report of Tashkent City in the Republic of Uzbekistan March 2006
S 3-1-2-13
Table S 3.1.2.6 (3) Diagnosis Sheet for Distribution Facilities
Division Name Operation status Condition, Appearance Judgment
No.1 main A considerable water leakage in bearing
Remarkably deteriorated, but very few op-eration C2
No.2 main A considerable water leakage in bearing
Remarkably deteriorated, but very few op-eration C2
No.3 main A considerable water leakage in bearing
Remarkably deteriorated, but very few op-eration C2
No.4 main A considerable water leakage in bearing
Remarkably deteriorated. Recently, break down has frequently occurred. C2
No.5 main A considerable water leakage in bearing
Remarkably deteriorated. Recently, break down has frequently occurred. C2
No.6 main A considerable water leakage in bearing
Remarkably deteriorated, but very few op-eration C2
No.7 main A considerable water leakage in bearing
Remarkably deteriorated, but very few op-eration C2
Pumps
No.8 main A considerable water leakage in bearing
Remarkably deteriorated, but very few op-eration C2
Pipes No particular problem Remarkably deteriorated. No paint coating.
Lower part has corroded thoroughly. B
Auto Valve No particular problem Remarkably deteriorated. No paint coating.
Lower part has corroded thoroughly. B
Manual Valve No particular problem Remarkably deteriorated. No paint coating.
Lower part has corroded thoroughly. B
Pipes and other ma-chines
Ceiling crane No particular problem Distorted wire rope B
vi) Chlorinator
Chlorinators and related facilities are listed in Table S 3.1.2.7 (1), and the diagnosis
results are shown in Table S 3.1.2.7 (2).
Table S 3.1.2.7 (1) List of Chlorination Facilities
Division No. Name Type Specification Number Inst. yera 1 Cylinder scale (1) Analog type for 1ton Cylinder 4 1969/1979
2 Gas filter 2 1969/1979 3 Gas meter Flow meter 14kg/hrxd20mm 19 1969/1979 4 Ejector Water ejector D25mm 8 1969/1979
No.1 Chlorinator
5 Safety equipment Sprinkler, Discharging chamber, gas mask 1 1969/1979
1 Cylinder scale(1) Analog type for 1ton Cylinder 1 1979
2 Gas filter 1 1979 3 Gas meter Flow meter 14kg/hrxd20mm 1 1979 4 Ejector Water ejector D25mm from Distribution pumps 1 1979
No.1 Chlorinator
5 Safety equipment Gas mask 1 1979

The Study on Restructuring of Water Supply System Volume 3. Supporting Report of Tashkent City in the Republic of Uzbekistan March 2006
S 3-1-2-14
Table S 3.1.2.7 (2) Diagnosis Sheet of Chlorination Facilities Division Name Operation Status Condition, Appearance Judgment
Cylinder scale(1) No problem in operation Remarkably deteriorated, low precision C2 Gas filter No problem in operation Remarkably deteriorated C2
Gas meter 9sets are out of order and left Remarkably deteriorated C2 Ejector No problem in operation Remarkably deteriorated C2
No.1 Chlorinator
Safelty equipment No problem in operation Remarkably deteriorated C2 Cylinder scale(1) No problem in operation Remarkably deteriorated, low precision C2
Gas filter No problem in operation Remarkably deteriorated C2
Gas meter No problem in operation Remarkably deteriorated C2
Ejector No problem in operation Remarkably deteriorated C2
No.1 Chlorinator
Safelty equipment No problem in operation Remarkably deteriorated C2
i) Electrical Facilities
Table S 3.1.2.8 (1) to (5) shows the list of electrical facilities and diagnosis result of
these.

Table 3.1.2.8 (1) List of Electrical Facilities and Daignosis Results
No Facility Name Location Equipment Name Specification Inst.Year Judgment1 No.1 Transformer Oil Immersed, Outdoor, 35/6 kV, 6300kVA 1969 B2 No.2 Transformer Oil Immersed, Outdoor, 35/6 kV, 6300kVA 1969 B3 No.1 Incoming Panel (Panel No.3) Withdrawable OCB, Outdoor 1969 B4 No.2 Incoming Panel (Panel No.12) Withdrawable OCB, Outdoor 1969 B5 Feeder Panel No.1 (Panel No.1) OCB, Outdoor (To Transformer Kiosk No.1) 1969 B6 Feeder Panel No.2 (Panel No.2) Withdrawable OCB, Indoor (To No.1 Intake P/S -1) 1969 B7 Internal Use Transformer (Panel No.4) Oil Immersed, Indoor, 6/0.1kV, 25kVA 1969 B8 No.1 Lightning Arrester (Panel No.5) 1969 B9 No.1 GPT (Panel No.6) Oil Immersed, Indoor, 6/0.4kV, 25kVA 1969 B10 Bus Sectional Panel (Panel No.7) Withdrawable OCB, Indoor 1969 B11 Bus Sectional Panel (Panel No.8) DS 1969 B12 Internal Use Transformer (Panel No.9) Oil Immersed, Indoor, 6/0.4kV, 25kVA 1969 B13 No.2 Lightning Arrester (Panel No.10) 1969 B14 Internal Use Transformer (Panel No.11) Oil Immersed, Indoor, 6/0.1kV, 25kVA 1969 B15 Feeder Panel No.3 (Panel No.13) Withdrawable OCB, Indoor (To No.1 Intake P/S -2) 1969 B16 Feeder Panel No.4 (Panel No.14) Withdrawable OCB, Indoor (To No.1 T/K -2) 1969 B17 Incoming Panel from Outer S/S (Panel No.15) Withdrawable OCB, Indoor 1969 B18 Internal Use Transformer (Panel No.16) Oil Immersed, Indoor, 6/0.1kV, 25kVA 1969 B19 Feeder Panel No.1 (Panel No.17) Withdrawable OCB, Indoor (To Distribution P/S) 1969 B20 Bus Sectional Panel (Panel No.18) Withdrawable OCB, Indoor (To Bus Bar No.1) 1969 B21 Feeder Panel No.2 (Panel No.19) Withdrawable OCB, Indoor 1969 B22 Feeder Panel No.3 (Panel No.20) Withdrawable OCB, Indoor 1969 B23 Internal Use Transformer (Panel No.21) Oil Immersed, Indoor, 6/0.4kV, 25kVA 1969 B24 Bus Sectional Panel (Panel No.22) Withdrawable OCB, Indoor (To Panel No.23) 1969 B25 Bus Sectional Panel (Panel No.23) DS, Indoor (To Panel No.22) 1969 B26 Internal Use Transformer (Panel No.24) Oil Immersed, Indoor, 6/0.4kV, 25kVA 1969 B27 Feeder Panel (Panel No.25) Withdrawable OCB, Indoor 1969 B28 No.7 Pump Starter Panel (Panel No.26) Withdrawable OCB, Indoor, 630kW 1969 B29 Feeder Panel (Panel No.27) Withdrawable OCB, Indoor (To Distribution P/S) 1969 B30 Bus Sectional Panel (Panel No.28) Withdrawable OCB, Indoor (To Panel No.13) 1969 B31 Internal Use Transformer (Panel No.29) Oil Immersed, Indoor, 6/0.4kV, 25kVA 1969 B32 Incoming Panel from Outer S/S (Panel No.30) Withdrawable OCB, Indoor 1969 B
PowerReceiving
FacilitySubstation
S 3-1-2-15

Table 3.1.2.8 (2) List of Electrical Facilities and Daignosis Results
No Facility Name Location Equipment Name Specification Inst.Year Judgment33 No.5 Pump Starter Panel (Panel No.1) DS+OCB, Indoor, 1250kW 1969 C134 No.3 Pump Starter Panel (Panel No.2) DS+OCB, Indoor, 1250kW 1969 C135 No.1 Pump Starter Panel (Panel No.3) DS+OCB, Indoor, 1250kW 1969 C136 Feeder (Panel No.4) DS+PF, Indoor (Standby) 1969 C137 Feeder (Panel No.5) DS+OCB, Indoor (To Transformer Kiosk No.8) 1969 C138 Incoming Panel from S/S (Panel No.7,8) DS+OCB, Indoor 1969 C139 Internal Use Transformer (Panel No.9) Oil Immersed, Indoor, 6/0.4kV, 25kVA 1969 C140 Bus Sectional Panel (Panel No.10) DS+OCB, Indoor (To Panel No.11) 1969 C141 Bus Sectional Panel (Panel No.11) DS, Indoor (To Panel No.10) 6919 C142 Internal Use Transformer (Panel No.12) Oil Immersed, Indoor, 6/0.1kV, 25kVA 1969 C143 Incoming Panel (Panel No.13, 14) From S/S Panel No.13) 1969 C144 Internal Use Transformer (Panel No.15) Oil Immersed, Indoor, 6/0.4kV, 25kVA 1969 C145 Lightning Arrester (Panel No.16) 1969 C146 No.2 Pump Starter Panel (Panel No.18) DS+OCB, Indoor, 1250kW 1969 C147 No.4 Pump Starter Panel (Panel No.19) DS+OCB, Indoor, 1250kW 1969 C148 No.6 Pump Starter Panel (Panel No.20) DS+OCB, Indoor, 800kW 1969 C149 No.1 Pump Control Panel Indoor Self-stand 1969 C150 No.2 Pump Control Panel Indoor Self-stand 1969 C151 No.3 Pump Control Panel Indoor Self-stand 1969 C152 No.4 Pump Control Panel Indoor Self-stand 1969 C153 No.5 Pump Control Panel Indoor Self-stand 1969 C154 No.6 Pump Control Panel Indoor Self-stand 1969 C156 No.7 Pump Control Panel Indoor Self-stand 1969 C157 Valve Control Panel Indoor Self-stand C158 Low Voltage Distribution Panel Indoor Self-stand 1969 C159 Feeder (Panel No.1) DS, Indoor (Standby) 1987 C160 Feeder (Panel No.2) DS+OCB, Indoor (To Transformer Kiosk No.4-1) 1987 C161 Lightning Arrester (Panel No.3) 1987 C161 No.1 Pump Starter Panel (Panel No.4) DS+OCB, Indoor, 1250kW 1987 C162 No.3 Pump Starter Panel (Panel No.5) DS+OCB, Indoor, 1250kW 1987 C163 No.5 Pump Starter Panel (Panel No.6) DS+OCB, Indoor, 1250kW 1987 C164 No.7 Pump Starter Panel (Panel No.7) DS+OCB, Indoor, 1250kW 1987 C165 Internal Use Transformer (Panel No.8) Indoor, 25kVA 1987 C1
No.1Intake Pump
Station
No.2 Intake
Pump Station
Intake PumpStation
S 3-1-2-16

Table 3.1.2.8 (3) List of Electrical Facilities and Daignosis Results
No Facility Name Location Equipment Name Specification Inst.Year Judgment66 Incoming Panel from Outer S/S (Panel No.9) DS, Indoor 1987 C167 Incoming Bus Bar (Panel No.10,11) 1987 C168 Internal Use Transformer (Panel No.12) Indoor 1987 C169 Bus Sectional Panel (Panel No.13) DS+OCB, Indoor 1987 C170 Bus Sectional/Internal Use Transformer Indoor, 25kVA 1987 C171 Incoming Panel from Outer S/S (Panel No.15) 1987 C172 Incoming Bus Bar (Panel No.16,17,18) 1987 C173 No.2 Pump Starter Panel (Panel No.19) DS+OCB, Indoor, 1250kW 1987 C174 No.4 Pump Starter Panel (Panel No.20) DS+OCB, Indoor, 630kW 1987 C175 No.6 Pump Starter Panel (Panel No.21) DS+OCB, Indoor, 1250kW 1987 C176 No.8 Pump Starter Panel (Panel No.22) DS+OCB, Indoor, 1250kW 1987 C177 Lightning Arrester (Panel No.23) 1989 C178 Feeder (Panel No.24) DS+OCB, Indoor (To Transformer Kiosk No.4-2) 1987 C179 No.1 Pump Control Panel Indoor, Self-Stand 1987 C180 No.1 Pump Valve Control Panel Indoor, Self-Stand 1987 C181 No.2 Pump Control Panel Indoor, Self-Stand 1987 C182 No.2 Pump Valve Control Panel Indoor, Self-Stand 1987 C183 No.3 Pump Control Panel Indoor, Self-Stand 1987 C184 No.3 Pump Valve Control Panel Indoor, Self-Stand 1987 C185 No.4 Pump Control Panel Indoor, Self-Stand 1987 C186 No.4 Pump Valve Control Panel Indoor, Self-Stand 1987 C187 No.5 Pump Control Panel Indoor, Self-Stand 1987 C188 No.5 Pump Valve Control Panel Indoor, Self-Stand 1987 C189 No.6 Pump Control Panel Indoor, Self-Stand 1987 C190 No.6 Pump Valve Control Panel Indoor, Self-Stand 1987 C191 No.7 Pump Control Panel Indoor, Self-Stand 1987 C192 No.7 Pump Valve Control Panel Indoor, Self-Stand 1987 C193 No.8 Pump Control Panel Indoor, Self-Stand 1987 C194 No.8 Pump Valve Control Panel Indoor, Self-Stand 1987 C195 Low Voltage Distribution Panel Indoor, Self-Stand 1987 C196 Valve Control Panel Outdoor 1987 C1
No.2 Intake
Pump Station
Intake PumpStation
S 3-1-2-17

Table 3.1.2.8 (4) List of Electrical Facilities and Daignosis Results
No Facility Name Location Equipment Name Specification Inst.Year Judgment97 No.1 Transformer Kiosk Oil Immersed, 6/0.38kV, 250kVA 1977 C198 No.2 Transformer Kiosk Oil Immersed, 6/0.38kV, 160kVA 1977 C199 No.3 Transformer Kiosk Oil immersed, 6/0.38kV, 250kVA 1977 C1100 No.4 Transformer Kiosk Oil immersed, 6/0.38kV, 400kVA 1977 C1101 No.5 Transformer Kiosk Oil immersed, 6/0.38kV, 250kVA 1977 C1101 No.6 Transformer Kiosk Oil immersed, 6/0.38kV, 250kVA 1989 C1102 No.7 Transformer Kiosk Oil immersed, 6/0.38kV, 400kVA 1989 C1103 No.8 Transformer Kiosk Oil immersed, 6/0.38kV, 400kVA 1989 C1104 Centralized Monitoring and Control Panel Self Stand 1977 C1105 Distribution Panels for Block 1 and 2 Indoor, Self-Stand 1977 C1106 Filter Unit Control Panels for Block 1/2 Indoor, Self-Stand 1977 C1107 Distribution Panels for Block 3 and 4 Indoor, Self-Stand 1989 C1108 Filter Unit Control Panels for Block 3/4 Indoor, Self-Stand 1989 C1109 Feeder (Panel No.1) DS+OCB, Indoor (To Transformer Kiosk No.7-1) 1972 C1110 (Panel No.2) DS+OCB, Indoor, 630kW 1972 C1111 (Panel No.3) DS+OCB, Indoor, 800kW 1972 C1112 (Panel No.4) DS+OCB, Indoor, 500kW 1972 C1113 (Panel No.5) DS+OCB, Indoor, 1000kW 1972 C1114 Feeder (Panel No.6) DS+OCB, Indoor (To Transformer Kiosk No.6-1) 1972 C1115 Internal Use Transformer (Panel No.7) 1972 C1116 Feeder (Panel No.8) DS+OCB, Indoor (To Transformer Kiosk No.3) 1972 C1117 Incoming Panel -1 From S/S (Panel No.9) DS+OCB, Indoor 1972 C1118 Internal Use Transformer (Panel No.10) 1972 C1119 Bus Sectional Panel (Panel No.11) 1972 C1120 Internal Use Transformer (Panel No.12) 1972 C1
TransformerKiosk
TransformerKiosk
DistributionPump Station
Filters Filter
EachTransformer
Kiosk
EachTransformer
Kiosk
DistributionPump Station
S 3-1-2-18

Table 3.1.2.8 (5) List of Electrical Facilities and Daignosis Results
No Facility Name Location Equipment Name Specification Inst.Year Judgment121 Incoming Panel -2 From S/S (Panel No.13) DS+OCB, Indoor 1972 C1122 Feeder (Panel No.14) DS+OCB, Indoor (Standby) 1972 C1123 Internal Use Transformer (Panel No.15) 1972 C1124 Feeder (Panel No.16) DS+OCB, Indoor (To Transformer Kiosk No.6-2) 1972 C1125 (Panel No.17) DS+OCB, Indoor, 583kW 1972 C1126 (Panel No.18) DS+OCB, Indoor, 1000kW 1972 C1127 (Panel No.19) DS+OCB, Indoor, 1000kW 1972 C1128 (Panel No.20) DS+OCB, Indoor, 630kW 1972 C1129 Feeder (Panel No.21) DS+OCB, Indoor (To Transformer Kiosk No.7-2) 1972 C1130 Pump Control Panels Indoor, Self-Stand 1972 C1138 Valve Control Panel Indoor, Self-Stand 1972 C1139 Distribution Panel for Chemical Facilities Indoor, Self-Stand 1972 C1140 No.1 Blower Control Panel Indoor, Self-Stand 1972 C1141 No.2 Blower Control Panel Indoor, Self-Stand 1972 C1142 No.3 Blower Control Panel Indoor, Self-Stand 1972 C1143 Distribution Panel for Chlorination Facilities Indoor, Self-Stand 1972 B144 Facilities Indoor, Self-Stand 1972 C1145 Inlet Gate Control Panel Outdoor, Self-Stand 1972 C2
Chemical andOther Facilities
Chemical andOther Facilities
DistributionPump Station
Chemical andOther
Facilities
OtherFacilities
DistributionPump Station
S 3-1-2-19
The Study on Restructuring of Water Supply System Volume 3. Supporting Report of Tashkent City in the Republic of Uzbekistan March 2006
S 3-1-2-20
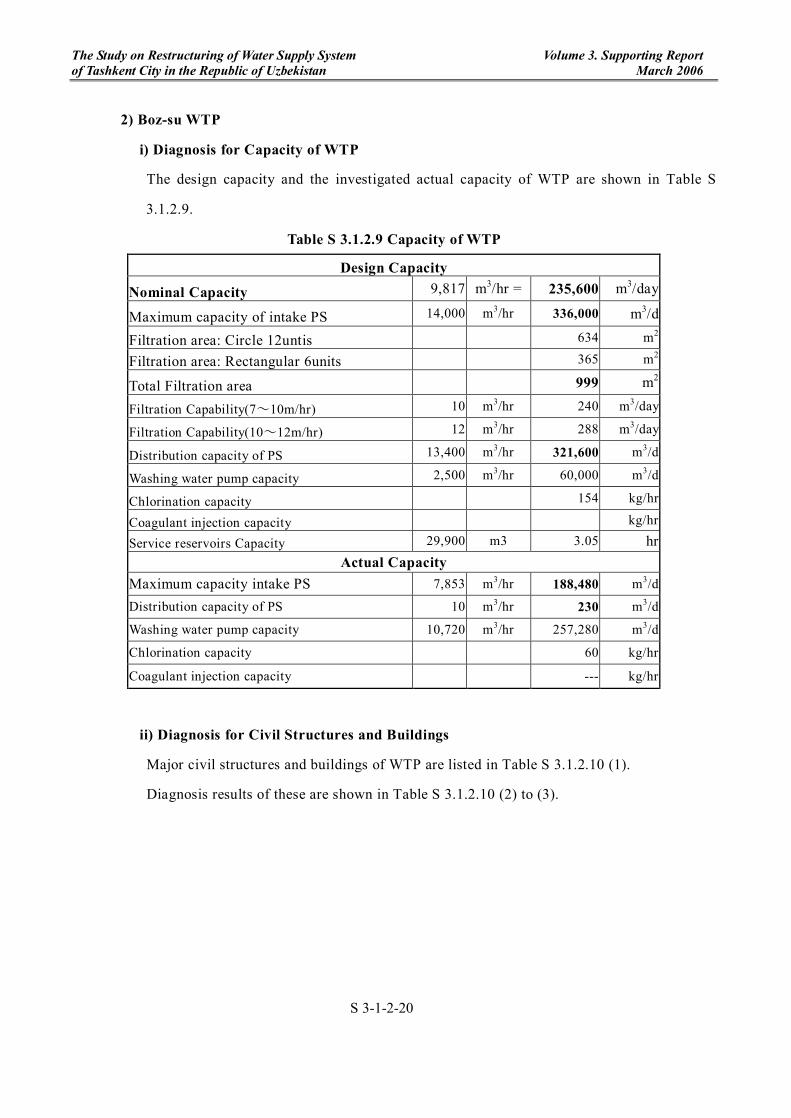
2) Boz-su WTP
i) Diagnosis for Capacity of WTP
The design capacity and the investigated actual capacity of WTP are shown in Table S
3.1.2.9.
Table S 3.1.2.9 Capacity of WTP
Design Capacity
Nominal Capacity 9,817 m3/hr = 235,600 m3/day
Maximum capacity of intake PS 14,000 m3/hr 336,000 m3/d
Filtration area: Circle 12untis 634 m2
Filtration area: Rectangular 6units 365 m2
Total Filtration area 999 m2
Filtration Capability(7~10m/hr) 10 m3/hr 240 m3/day
Filtration Capability(10~12m/hr) 12 m3/hr 288 m3/day
Distribution capacity of PS 13,400 m3/hr 321,600 m3/d
Washing water pump capacity 2,500 m3/hr 60,000 m3/d
Chlorination capacity 154 kg/hr
Coagulant injection capacity kg/hr
Service reservoirs Capacity 29,900 m3 3.05 hr Actual Capacity
Maximum capacity intake PS 7,853 m3/hr 188,480 m3/d
Distribution capacity of PS 10 m3/hr 230 m3/d
Washing water pump capacity 10,720 m3/hr 257,280 m3/d
Chlorination capacity 60 kg/hr
Coagulant injection capacity --- kg/hr
ii) Diagnosis for Civil Structures and Buildings
Major civil structures and buildings of WTP are listed in Table S 3.1.2.10 (1).
Diagnosis results of these are shown in Table S 3.1.2.10 (2) to (3).

The Study on Restructuring of Water Supply System Volume 3. Supporting Report of Tashkent City in the Republic of Uzbekistan March 2006
S 3-1-2-21
Table S 3.1.2.10 (1) List of Civil Structures and Building
No. Name Type Dimension Area (m2)
Depth (m)
Volume (m3) Number
1 Intake Gate structure Concrete W1m 1.0 2 2 Flocculation Chamber Concrete W 4m x L125m 500 3.0 1,500 1 3 No.1 Sedimentation basin Soil bank W 40m x L350m 14,000 2.6 36,400 1 4 No.2 Sedimentation basin Soil bank W40m x L368m 14,720 3.6 52,992 1 5 Pump intake chamber Concrete W2m x L50 m 1 7 Intake pump building Concrete W12mxL30m 360 1 8 Circular filter tanks Concrete D8.2m x 12units 52.8 12 9 Rectangular filter tanks Concrete W6m x L10m 60.8 6
10 Filter cover building Concrete W40m x L75m 3000 1 11 Filter pipe room Concrete W10m x L60m 600 1 12 Laboratory & control building Brick W10m x L10m x 2st. 200 2 13 Reservoir (1) Concrete W36m x L48m 3.8 6,600 1 14 Reservoir (2) Concrete W36m x L24m 3.8 3,300 1 15 Reservoir (3) Concrete W40m x L48m 3.8 10,000 1 16 Distribution pump building Brick W15m x L35m 525 1 17 Disinfection house Brick W12m x L20m 420 1 18 Coagulant building Brick W12m x L35m 420 1 19 Administration building Brick W12m x L30m x 2st. 720 1 20 Coagulant feeding T Concrete 10 1

Table S 3.1.2.10 (2) Diagnosis Sheet of Civil Structure & Buildings for Boz-su WTP
Intake mouth A C B B 1931
Quality Appearance Crack Split Leakage Screen Steel cover Gate Inject.facili
A A NO NO NO B B B C
Erosion Crack Protection ー
NO NO A ー 1931
Quality Appearance Crack Split Leakage
Intake Chaneel B B NO NO NO 1931
Quality Appearance Crack Split Leakage Painting Rust leakage Valve OthersCircle filter-1 B C YES NO YES NO YES YES B 1961
Circle filter-2 B C YES NO YES NO YES YES B 1961
Circle filter-3 B C YES NO YES NO YES YES B 1961
Circle filter-4 B C YES NO YES NO YES YES B 1961
Circle filter-5 B C YES NO YES NO YES YES B 1961
Circle filter-6 B C YES NO YES NO YES YES B 1961
Circle filter-7 B C YES NO YES NO YES YES B 1961
Circle filter-8 B C YES NO YES NO YES YES B 1961
Circle filter-9 B C YES NO YES NO YES YES B 1961
Circle filter-10 B C YES NO YES NO YES YES B 1961
Circle filter-11 B C YES NO YES NO YES YES B 1961
Circle filter-12 B C YES NO YES NO YES YES B 1961
Rect. Filter-1 B C YES NO YES NO YES YES B 1931
Rect. Filter-2 B C YES NO YES NO YES YES B 1931
Rect. Filter-3 B C YES NO YES NO YES YES B 1931
Rect. Filter-4 B C YES NO YES NO YES YES B 1931
Rect. Filter-5 B C YES NO YES NO YES YES B 1931
Rect. Filter-6 B C YES NO YES NO YES YES B 1931
Rapid SandFilter No.1
Intake Facilities
Other
Facility
Name Concrete
Pipes
Intake channel andSedimentation basin
Name Const.year
P/C concrete is in fair condition, however, most of mortar arepeeled off.
Rapid SandFilter No.2
Concrete
Others
Name Concrete
Most of the steel-made weir has deteriorated, but roughlymaintained.
Const.year
Upper and bottom partof concrete as a wholehave deteriorated, andmany cracks and waterleaking are observed.Most of the pipes havecorrorded because of nocoating of paint.Corrosion of lower partof pipes is so seriouslto cause water leaknear future. As awhole, however, filtersare well maintainedand kept in much cleancondition.
Facility Name Intake screen Const.yearIntake mouth Inlet gateInjection ofAlum
Equipment
Const.yearOthers
Sedimentation basin using old canal has stable dike.Sediments are well dredged in 6 months every year.
Dike
S 3-1-2-22

Table S 3.1.2.10 (3) Diagnosis Sheet of Civil Structure & Buildings for Boz-su WTP
Quality Appearance Crack Split Leakage
No.1reservoir B B NO NO NO B B 1931
No.2reservoir B B NO NO NO B B 1931
No.3reservoir B B NO NO NO B B 1931
No.4reservoir B B NO NO NO B B 1931
Quality Appearance Crack Split Leakage
Coagulation Solution/Storage tank C C NO NO YES C 1931
Quality Appearance Crack Split Leakage Appearance Crack Leakage Ventilator ー
IntakeP/S B B C YES NO YES C NO YES C ー
Dist.P/S B B C NO NO NO C NO YES C ー
Washing P/S C B C NO NO NO C NO YES ー ー
Doors Windows Glass Ventilator Step Steel ladder Lighting
IntakeP/S C C C C B B C 1931
Dist.P/S C C C C B B C 1961
Washing P/S C C C C - - C 1931
Appearance Crack Appearance Crack Leakage
Administration B B NO B NO YES 1936
Chlorination B B NO C NO YES 1931
Coagulation B B NO C NO YES 1931
Filter B B NO C NO YES 1931/1961
Boiler B B NO C NO YES 1961
Mashine shop B B NO B NO YES 1961
Ventilator
A
A
Facility Name Concrete
*Both inner and outer wall of tank as well aspipes have deteriorated remarkably.
Reservoir
Facility
A
A
OtherBuildings
Concrete floor Others
Both internal and external building have deteriorated. Especially amongthem,ceiling is seriously deteriorated.
Facility Name Brick wall
PipesCover soil Appearance
Facility Name
P/S Building
Concrete floor
Fitting
Roof
Name
Name Pipes Others
Const.year
Brick wall
Const.year
Equipment Const.yearOthers
*Both internal and external wall/slab of building havedeteriorated remarkably. Especially ceiling hasseriously deteriorated.
Roof
Concrete Const.year
Both internal and external building are roughly maintained, however, ceilinghas deteriorated remarkably.
Both internal and external building have deteriorated. Especially amongthem,ceiling is seriously deteriorated.
Both internal and external building have deteriorated. Especially amongthem,ceiling is seriously deteriorated.External part of the building has deteriorated remarkably and large crack isfound. Especially ceiling is seriously deteriorated.
Both internal and external building have deteriorated. Especially amongthem,ceiling is seriously deteriorated.
S 3-1-2-23

The Study on Restructuring of Water Supply System Volume 3. Supporting Report of Tashkent City in the Republic of Uzbekistan March 2006
S 3-1-2-24
iii) Intake PS
Intake pumps and related facilities are listed in Table S 3.1.2.11(1) and (2).
Diagnosis results for intake facilities are shown in Table S 3.1.2.11 (3)
Table S 3.1.2.11(1) List of Intake Pump
No. Name Model Q (m3/hr)
Head (m)
D(in,out) (mm)
Power (kW)
in Pipe (mm)
out Valve (mm)
Installation year
1 Main pump 24NDN 4700 32 800,600 500 900 600 1982 2 Ditto 32A19 6300 26 800,600 630 900 600 1982 3 Ditto Ditto 6300 26 800,600 630 900 600 1982 4 Ditto 32D19 3000 20 800,600 320 900 600 1982
Table S 3.1.2.11 (2) List of Intake PS facilities No. Name Specifications Installation year
1 Dredger Micro pumping boat, 400m3/h, - m, 100kW 1987 2 Intake gate Motor gate, W0.85m×H1.8m 1982 3 Intake screen Bar screen, Slit width 50mm, 1982 4 Intake pipes D900 x 4 --- 5 Transmission pipe D1,000 mm x2 --- 6 Pipe /Valves D500-1000 --- 7 Ceiling crane Electrical W 11m x 5t , manual10t 1982 8
Power receiving facilities
Receiving power 2,000KVA, Transformer, incoming panels, bus sectional panels and feeding panels ---
9 PS power panel 4 units --- 10 Control panel 4 units --- 11 Cable & others
---
iv) Rapid Sand Filters
Rapid sand filters and related facilities are listed in Table S 3.1.2.12 (1) and (2), and the
diagnosis results are shown in Table S 3.1.2.12 (3).
(v) Distribution PS
Distribution pumps and related facilities are listed in Table S 3.1.2.13(1) and (2) and the
diagnosis results shows in Table S 3.1.2.13 (3).

The Study on Restructuring of Water Supply System Volume 3. Supporting Report of Tashkent City in the Republic of Uzbekistan March 2006
S 3-1-2-25
Table S 3.1.2.11 (3) Diagnosis of Intake Facilities
Division Name Operation status Condition, Appearance Judgment No.1 main No particular problem Deteriorated. Recently, break down has fre-
quently occurred. C2
No.2 main No particular problem Deteriorated. Recently, break down has fre-quently occurred. C2
No.3 main No particular problem Deteriorated. Recently, break down has fre-quently occurred. C2
Pumps
No.4 main No particular problem Deteriorated. Recently, break down has fre-quently occurred. C2
Dredger No particular problem No problem B Gate Very few operation Peeling off paint is observed, but no functional
problem. B
Screen No particular problem Paint has peeled off B Inlet Pipes No particular problem Painted, but lower part has corroded. B Transmission Pipes No particular problem Painted, but lower part has corroded. B Pips/ Valves No particular problem Not so corroded, but deteriorated B
Pipes and other machines
Ceiling crane No particular problem No problem B Power receiving facilities No particular problem。 Deteriorated. C1 PS Power panel No particular problem Deteriorated and mostly out of order C1 Control panel No problem Deteriorated and all automatic circuits are out
of order. C2
Cable and Others No problem Deteriorated C1
Electrical facilities
Power receiving facilities No particular problem Deteriorated C1

The Study on Restructuring of Water Supply System Volume 3. Supporting Report of Tashkent City in the Republic of Uzbekistan March 2006
S 3-1-2-26
Table S 3.1.2.12 (1) List of Rapid Sand Filters
No. Name Specifications Number Inst. year 1-1 Filters(1):
Rectangular type
A=60.9m2, Perforated collection pipe & double layer type, total filter layer 0.9-1.0m(quartz sand+anthracite, Collecting trough W m x Lm x units, Pipes and auto valve
6 1931
1-2 Pipes for filters(1)
Inlet D800, outlet D800, back wash D600, drain D800 1 1961
2-1 Filters(2) Circle type
A=52.8m2 (D8.2m), Perforated collection pipe & double layer type, total filter layer 0.9-1.0m( quartz and + anthracite), Collecting trough W m x Lm x units, Pipes and auto valve
18 1961
2-2 Pipes for filters(2)
inlet D800, outlet D800, back wash D600, drain D800 1 1961
Table S 3.1.2.12 (2) List of Facilities for Rapid Sand Filters
No. Name Specifications Number Inst. year 1 Washing pump (1) VH-DS, 2500m3/hx20mx320kw, with motor valve 1 ---
2 Washing pump (2) VH-DS, 2500m3/hx20mx320kw, with motor valve 1 ---
3 Power panel Stand 3 --- 4 Filter Control panel (1) Stand 6 --- 5 Filter Control panel (2) Stand 18 ---
6 Pump Control panel Stand 2 ---
7 Cable and others 1 ---
Table S 3.1.2.12 (3) Diagnosis Sheet for Rapid Sand Filters Division Name Operation status Condition, Appearance Judgment
Circle type Water leak due to crack. 1 filter is out of shift.
A considerable water leaking due to crack in all filters C1 Filters
Rectangular type No particular problem Deteriorated, but no problem in use B No.1 Washing Motor broke down. Under
replacement work Remarkably deteriorated. Recently, break down has frequently occurred C2 Pumps
No.2 Washing No problem in operation Recently, break down has frequently oc-curred C2
Circle type No particular problem Re-painting was not done. Further cor-roded. B Pipes for
filters Rectangular type No particular problem Re-paint wan not done. Further corroded. B Power panel No particular problem Deteriorated. Instruments are left out of
order. B
Filter control panel (1)
No particular problem Deteriorated C1
Filter control panel (2)
No particular problem Deteriorated C1
Pump control panel No particular problem Deteriorated C1
Electrical facilities
Cable and others No particular problem Deteriorated B

The Study on Restructuring of Water Supply System Volume 3. Supporting Report of Tashkent City in the Republic of Uzbekistan March 2006
S 3-1-2-27
Table S 3.1.2.13(1) List of Distribution Pump
No. Name Type Q (m3/hr)
Head ( m)
D (in, out) (mm)
Power (kW)
In Valve (mm)
Out Valve (mm)
Inst. year
1 Main pump 22NDS 4300 52 700,500 800 800 800 --- 2 Ditto 18NDS 2800 65 700,500 500 800 800 --- 3 Ditto 22NDS 4300 52 700,500 800 800 800 1966 4 Ditto Ditto 4300 52 700,500 800 800 800 1985 5 Ditto Ditto 4300 52 700,500 800 800 800 1981 6 Ditto 32A19 6300 26 700,500 650 800 800 ---
Table S 3.1.2.13 (2) List of Distribution Pump Facilities
No. Name Specification Number Inst. year 1 Pipes D500-D1200 1 --- 2 Valves D500-D1200 1 --- 3 Ceiling crane W 11m x 5 t 1 --- 4 Power panel Stand 6 --- 5 Control panel Stand 6 --- 6 Cable&others 1 ---
Table S 3.1.2.13 (3) Diagnosis Sheet for Distribution Facilities
Division Name Operation status Condition, Appearance Judgment No.1 main Bearing is out of order,
remarkable water leakage
Remarkably deteriorated. Recently, break down has frequently occurred. C2
No.2 main No problem Remarkably deteriorated. Recently, break down has frequently occurred. C2
No.3 main No problem Remarkably deteriorated. Recently, break down has frequently occurred. C2
No.4 main No control panel. Bearing of this unit is used for No.1 pres-ently.
Remarkably deteriorated. Recently, break down has frequently occurred. C2
No.5 main No problem Remarkably deteriorated. Recently, break down has frequently occurred C2
Pumps
No.6 main No problem Remarkably deteriorated. Recently, break down has frequently occurred. C2
Pipes No problem Lower part has corroded thoroughly. B Valves No problem Corroded due to no coating of paint B
Pipes and other Machines
Ceiling crane No problem No problem B Power panel No problem Deteriorated. Instruments are out of order. C1 Control panel No problem Deteriorated. Automatic instruments are left
out of order. C1
Electrical Facilities
Cable&others No problem Deteriorated C1

The Study on Restructuring of Water Supply System Volume 3. Supporting Report of Tashkent City in the Republic of Uzbekistan March 2006
S 3-1-2-28
vi) Coagulant Facilities
Coagulant facilities are listed in Table S 3.1.2.14 (1) and the diagnosis results shows in Table
S 3.1.2.14 (2).
Table S 3.1.2.14 (1) List of Coagulant Facilities No. Name Specifications Number Inst. year
1 Dissolving Tank Steel, D2.8mxwh 1.0m=6.16m3, with mechanical mixer 1.5kw 6 --- 2 Feeding Valve Punch valve D75mm 1 --- 3 Pipe & valves D75-50mm 1 --- 4 Power panel Stand 1 --- 5 Control panel Stand 2 --- 6 Cable and others 1 ---
Table S 3.1.2.14 (3) Diagnosis Sheet for Coagulant Facilities
No. Name Operation status Condition, Appearance Judgment 1 Dissolving Tank Agitator is out of
order. Deteriorated. Paint peels off. Corroded. C1
2 Feeding Valve No problem Deteriorated. Especially rubber is deteriorated. C1 3 Pipe & valves No problem Deteriorated C1 4 Power panel No problem Deteriorated. Instruments are out of order. C1 5 Control panel No problem Deteriorated. Instruments are out of order. C1 6 Cable and others No problem Deteriorated. Instruments are out of order. C1
(vii) Chlorinator
Chlorinators and related facilities are listed in Table S 3.1.2.15 (1), and the diagnosis results
are shown in Table S 3.1.2.15 (2).
Table S 3.1.2.15 (1) List of Chlorination Facilities
No. Name Type Specification Number Inst. Year 1 Cylinder scale Analog type for 1ton Cylinder 2 1965 2 Gas filter 2 1965
For sedimentation, 4kg/hrxd20mm 3 1965 3
Gas meter Flow meter For reservoirs, 4kg/hrxd20mm 6 1965
4 Ejector Water ejector D25mm 4 1965 5 Safety equipment Sprinkler, Discharging chamber, gas mask 1 1965

The Study on Restructuring of Water Supply System Volume 3. Supporting Report of Tashkent City in the Republic of Uzbekistan March 2006
S 3-1-2-29
Table S 3.1.2.15 (2) Diagnosis Sheet of Chlorination Facilities
No. Name Operation Status Condition, Appearance Judgment 1 Cylinder scale No operational problem Remarkably deteriorated. Poor precision C2
2 Gas filter No operational problem Remarkably deteriorated C2 3 Gas meter 4 units are left out of order Remarkably deteriorated C2
4 Ejector No operational problem Remarkably deteriorated C2 5 Safelty equipment No operational problem Remarkably deteriorated C2
(3) Groundwater WTPs
1) Kibray WTP
i) Diagnosis for Capacity of WTP
The design capacity and the investigated actual capacity of WTP are shown in Table S
3.1.2.16.
Table S 3.1.2.16 Capacity of WTP
Design Capacity
Nominal Capacity 455,200 m3/day
Maximum intake capacity by wells 20,000 m3/hr = 480,000 m3/d
Maximum intake capacity from Kadirya 17,000 m3/hr = 408,000 m3/d
Total distribution quantity 888,000 m3/d
Distribution capacity of No.1 PS 11,300 m3/hr = 271,200 m3/d
Distribution capacity of No.2 PS 12,900 m3/hr = 309,600 m3/d
Total Distribution Capacity 580,800 m3/d
Chlorination capacity No.1 5 kg/hr
Chlorination capacity No.2 10 kg/hr
Service reservoirs Capacity 10,000 m3 0.53 hr Actual Capacity
Maximum intake capacity by wells 15,000 m3/hr = 360,000 m3/d
Maximum intake capacity from Kadirya 17,000 m3/hr = 408,000 m3/d
Total distribution quantity 768,000 m3/d
Distribution capacity of No.1 PS 9,040 m3/hr = 216,960 m3/d
Distribution capacity of No.2 PS 10,320 m3/hr = 247,680 m3/d
Total Intake capacity 464,640 m3/d
ii) Diagnosis for Civil Structures and Buildings
Major civil structures and buildings of WTP are listed in Table S 3.1.2.17 (1).
Diagnosis results of these are shown in Table S 3.1.2.17 (2).

The Study on Restructuring of Water Supply System Volume 3. Supporting Report of Tashkent City in the Republic of Uzbekistan March 2006
S 3-1-2-30
Table S 3.1.2.17 (1) List of Civil Structures and Building
No. Name Type Dimension Area (m2)
Depth (m)
Volume (m3) Number
1 Filter pool-1 Pond 8,000 20 2 Filter pool-2 Pond 8,000 8 3 Filter pool-3 Pond 2,800 21 4 Reservoir Concrete 36mx32m 1,152 4.5 5000 1 5 No.1 PS house Brick W8mxL40m 320 1 6 No.2 PS house Brick W12mxL48m 576 1 7 No.1 Disinfection house Brick W9mxL15mx2stroies 270 1 8 No.2 Disinfection house Brick W9mxL15mx2stroies 270 1
iii) Wells
95 wells were constructed in Kibray WTP, and 26 wells are located in right bank of Chrchik
River and the rest of 49 wells are located at left bank. The list of well structures and the
results of pumping test are shown in Table S 3.1.2.18 (1) to (5) and the list of well pumps and
operation condition are shown in Table S 3.1.2.19 (1) to (3). The list of maintenance status
and rehabilitation method are shown in Table S 3.1.2.20 (1) to (3)
The results of diagnosis are summarized in Tables S 3.1.2.21. The capacity of Kibray WTP is
decreasing year-by-year, and some drastic countermeasures should be introduced.
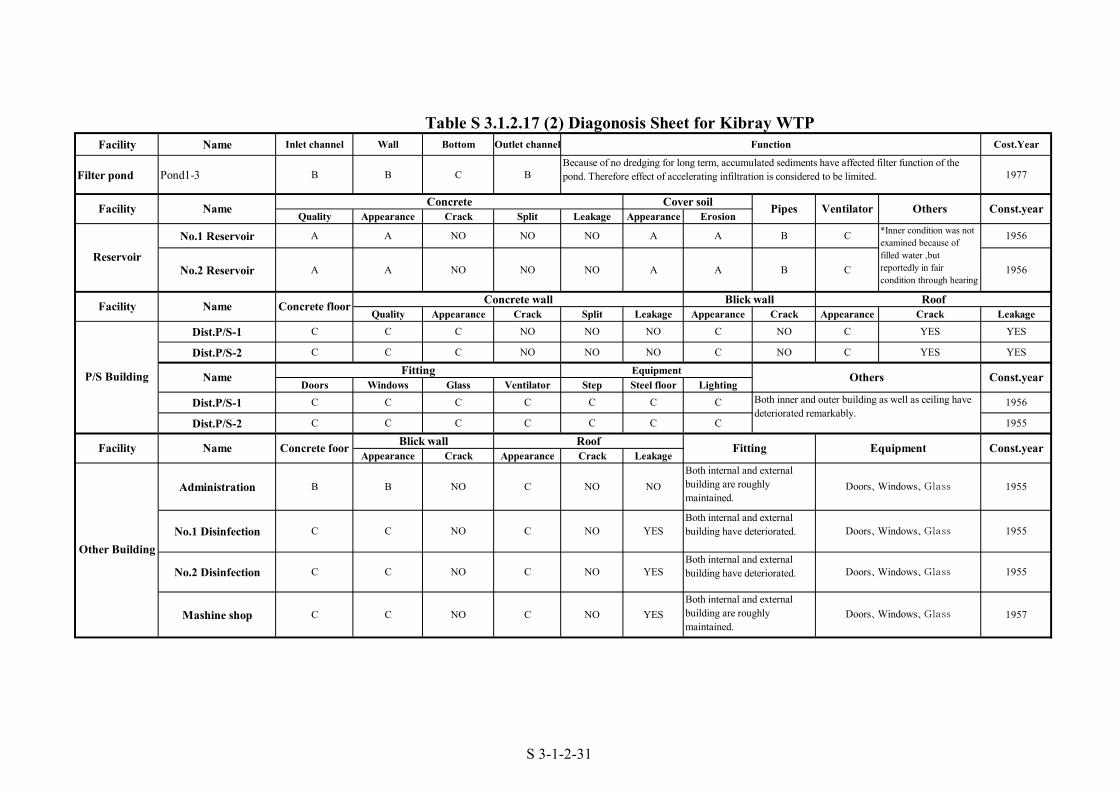
Table S 3.1.2.17 (2) Diagonosis Sheet for Kibray WTPFacility Name Inlet channel Wall Bottom Outlet channel Cost.Year
Filter pond Pond1-3 B B C B 1977
Quality Appearance Crack Split Leakage Appearance Erosion
No.1 Reservoir A A NO NO NO A A B C 1956
No.2 Reservoir A A NO NO NO A A B C 1956
Quality Appearance Crack Split Leakage Appearance Crack Appearance Crack Leakage
Dist.P/S-1 C C C NO NO NO C NO C YES YES
Dist.P/S-2 C C C NO NO NO C NO C YES YES
Doors Windows Glass Ventilator Step Steel floor Lighting
Dist.P/S-1 C C C C C C C 1956
Dist.P/S-2 C C C C C C C 1955
Appearance Crack Appearance Crack Leakage
Administration B B NO C NO NO 1955
No.1 Disinfection C C NO C NO YES 1955
No.2 Disinfection C C NO C NO YES 1955
Mashine shop C C NO C NO YES 1957
Name Fitting
Both internal and externalbuilding are roughlymaintained.
Facility Name
Reservoir
Other Building
Facility
Const.year
Blick wall Roof
Equipment
Pipes
Name
P/S Building
Facility Name Concrete foor RoofBlick wall
Concrete Cover soil
Concrete floor Concrete wall
Doors、Windows、Glass
Fitting
Both internal and externalbuilding are roughlymaintained.
Doors、Windows、Glass
Both internal and externalbuilding have deteriorated.
Both internal and externalbuilding have deteriorated.
Doors、Windows、Glass
Doors、Windows、Glass
Function
Because of no dredging for long term, accumulated sediments have affected filter function of thepond. Therefore effect of accelerating infiltration is considered to be limited.
Const.year
Const.yearEquipment
*Inner condition was notexamined because offilled water ,butreportedly in faircondition through hearingsurvey
Ventilator
Both inner and outer building as well as ceiling havedeteriorated remarkably.
Others
Others
S 3-1-2-31

Table S 3.1.2.18 (1) List of Well Structure and Pumping Test Data
69.4 6.0 7.7 1.7 40.890.0 6.0 8.0 2.0 45.0
2 1960 503.7 54.0 600-400 steel 19.4 30.6-50.0 bl-gr-sd 150.0 2.0 6.0 4.0 37.5 7.4 6.0 90.0 12.5 8.0 240.0 48.0 3103 1961 503.5 45.0 600-400 steel 11.0 30.0-41.0 bl-gr 48.0 6.5 7.5 1.0 48.0 6.5 2.8 98.0 13.3 170.0 51.2 3164 1954 503.0 56.0 600-400 steel 22.0 21.0-43.0 bl-gr-sd 66.0 4.5 12.0 7.5 8.8 6.5 2.8 78.0 13.3 170.0 51.2 3165 1958 503.7 52.0 600-400 steel 18.0 28.0-46.0 bl-gr-sd 191.6 4.0 9.0 5.0 38.3 7.3 3.5 88.0 20.0 9.2 230.0 100.0 4006 1958 503.8 55.0 600-400 steel 18.0 32.0-50.0 bl-gr-sd 177.0 2.0 8.0 6.0 29.5 7.3 4.0 90.0 21.0 9.4 244.0 106.0 4507 1954 502.5 45.0 600-400 steel 15.8 24.2-40.0 gr-sd 60.5 2.0 3.0 1.0 60.5 8.3 3.5 101.0 22.0 13.0 3508 1956 503.9 43.0 600-400 steel 17.4 20.4-37.8 gr-sd 18.0 2.6 3.0 0.4 41.9 8.3 3.3 99.9 20.4 13.0 3459 1958 505.0 47.0 600-400 steel 16.7 25.0-41.7 bl-gr-sd 50.0 5.0 5.6 0.6 83.3 7.3 14.3 89.5 20.5 10.0 259.0 115.5 450
38.8 5.0 5.5 0.5 77.655.5 5.0 5.8 0.8 69.4
11 1958 503.8 46.0 600-400 steel 22.6 11.5-26.532.0-39.6
bl-gr-sd 48.0 6.5 7.5 1.0 48.0 7.4 6.0 82.3 14.4 10.3 256.2 51.0 332
12 1958 505.6 46.0 600-400 steel 27.4 4.1-21.033.1-43.6
bl-gr-sd 78.3 4.5 8.0 3.5 22.4 7.4 6.0 82.3 14.4 10.3 256.2 51.0 332
69.4 6.0 7.7 1.7 40.890.0 6.0 8.0 2.0 45.061.0 5.1 7.1 2.0 30.570.0 5.1 8.1 3.0 23.351.0 3.9 5.4 1.5 34.071.9 3.9 6.3 2.4 30.059.1 2.0 4.2 2.2 27.566.6 2.0 4.8 2.8 23.840.0 4.5 6.5 2.0 20.042.7 4.5 7.0 2.5 17.148.0 2.6 3.1 0.5 96.056.1 2.6 3.4 0.8 70.152.2 3.1 4.3 1.3 41.864.1 3.1 5.0 2.0 32.955.8 2.2 5.0 2.8 19.960.0 2.2 5.2 3.0 20.050.0 3.3 5.2 1.9 26.355.0 3.3 5.6 2.3 23.9
59.2 31698.0 13.3 170.030.3-47.3 bl-gr 6.5 2.8
88.6 460
14 1960 506.8 53.0 600-400 steel 17.0
97.3 21.8 6.7 298.334.3-43.0 bl-gr 7.4 6.9
110.2 431
13 1958 506.2 45.0 600-400 steel 8.7
86.3 18.8 13.5 256.534.3-45.0 gr-sd 7.4 18.4600-400 steel 10.710 1956 504.3 45.0
88.9 46097.3 21.8 6.7 298.835.7-53.2 bl-gr-sd 7.4 6.9600-400 steel 17.51 1962 503.1 60.0
44.7 39091.3 12.4 9.7 269.325.0-40.0 bl-gr-sd 7.4 0.3
47.7 412
17 1964 504.4 46.0 600-400 steel 15.0
81.1 13.0 8.3 262.327.2-45.0 bl-gr 7.6 9.219 1963 507.4 51.0 600-400 steel 17.8
45.3 39292.5 11.9 9.7 268.427.0-47.0 bl-gr-sd 7.4 0.2600-400 steel 20.018 1964 506.8 50.0
75.7 43695.1 15.8 13.8 274.526.0-43.5 bl-gr 7.7 9.8
36.2 392
15 1963 503.1 50.0 600-400 steel 17.5
81.1 11.9 6.9 262.325.0-44.0 bl-gr 7.3 4.816 1963 503.1 50.0 600-400 steel 19.0
97.1 41692.5 13.0 8.3 286.728.3-45.8 bl-gr-sd 7.4 29.4600-400 steel 17.520 1964 508.9 52.0
Water Quality Analysis Data
TDS(mg/L)
Kibray
TestYield(L/s)
WPT Name
WellNo.
Const-ructionYear
Well Structure Pumping Test DataGroundEleva-tion(m)
DrilledDiameter
(mm)
Casing Screen StaticWaterLevel(m)
Mg(mg/L)
Cl(mg/L)
PumpingWaterLevel(m)
Draw-down(m)
SpecificCapa-city
(L/s/m)
pHDrilledDepth
(m)
HCO3(mg/L)
SO4(mg/L)
Diameter(mm)
Materialof
Casing
TotalLength
(m)
Position(m)
Geologyof
Screen
Na +K
(mg/L)
Ca(mg/L)
600-400 steel 16.014a 1965 504.9 52.0 30.0-46.0 bl-gr-sd 7.5 16.6 93.0 448103.1 14.3 14.0 286.7
S 3-1-2-32

Table S 3.1.2.18 (2) List of Well Structure and Pumping Test Data
56.1 2.0 3.0 1.0 56.170.0 2.0 3.5 1.5 46.758.8 2.0 4.0 2.0 29.470.0 2.0 5.0 3.0 23.3
23 514.670.0 2.0 4.0 2.0 35.076.9 2.0 5.5 3.5 22.058.3 2.2 4.2 2.0 29.271.6 2.2 5.2 3.0 23.933.3 4.4 6.8 2.4 13.950.0 4.4 8.8 4.4 11.440.0 4.5 5.6 1.1 36.450.0 4.5 7.8 3.3 15.244.4 4.0 5.8 1.8 24.750.0 4.0 6.0 2.0 25.055.5 1.8 4.8 3.0 18.566.6 1.8 5.2 3.4 19.9
30 1967 509.77 47.0 600-400 steel 19.0 24.0-43.0 bl-gr-sd 50.0 1.5 9.0 7.5 6.7 7.5 5.8 67.1 9.4 7.7 213.5 31.3 24844.4 4.0 5.8 1.8 24.750.0 4.0 6.0 2.0 25.055.5 4.6 7.4 2.8 19.861.1 4.6 7.7 3.1 19.750.0 5.1 6.7 1.6 31.361.1 5.1 7.1 2.0 30.644.4 4.4 8.4 4.0 11.150.0 4.4 9.0 4.6 10.950.0 4.5 8.3 3.8 13.258.3 4.5 9.0 4.5 13.044.4 2.0 6.0 4.0 11.150.0 2.0 6.6 4.6 10.944.4 2.2 5.1 2.9 15.350.0 2.2 5.8 3.6 13.944.4 2.1 5.0 2.9 15.350.0 2.1 5.7 3.6 13.9
SO4(mg/L)
TDS(mg/L)
Diameter(mm)
Materialof
Casing
TotalLength
(m)
Position(m)
Geologyof
Screen
Ca(mg/L)
Mg(mg/L)
Cl(mg/L)
HCO3(mg/L)
Draw-down(m)
SpecificCapa-city
(L/s/m)
pHNa +
K(mg/L)
Pumping Test Data Water Quality Analysis DataGroundEleva-tion(m)
DrilledDepth
(m)
DrilledDiameter
(mm)
Casing ScreenTestYield(L/s)
StaticWaterLevel(m)
PumpingWaterLevel(m)
WPT Name Kibray
WellNo.
Const-ructionYear
Well Structure
46.5 39690.5 11.9 10.2 267.824.6-43.6 bl-gr-sd 7.3 0.325 1965 516.4 50.0 630-400 steel 19.0
46.1 36086.4 13.1 8.4 265.427.0-47.0 bl-gr-sd 7.5 3.7
36.2 288
38 1966 524.22 50.0 600-400 steel 20.0
83.1 10.3 7.7 250.128.0-46.0 bl-gr-sd 7.4 1.6
36.2 296
33 1966 514.58 50.0 600-400 steel 18.0
79.2 10.9 8.4 237.924.0-45.0 bl-gr-sd 7.5 0.9
34.6 272
36 1966 520.05 51.0 600-400 steel 21.0
19.2 13.1 7.0 256.227.5-46.5 bl-gr-sd 7.4 2.135 1966 518.03 50.0 600-400 steel 19.0
33.7 32083.1 11.5 7.7 269.326.0-43.0 bl-gr-sd 7.2 2.1600-400 steel 17.034 1966 516.53 50.0
46.1 36026.0-46.0 bl-gr-sd 3.7 86.4 13.1 8.437 1966 522.03 50.0 600-400 steel 265.4
39.5 28872.0 13.1 8.4 231.9
296
26 1966 502.47 50.0 600-400 steel 20.0 4.4
8.8 3.3 280.6 29.2bl-gr-sd 7.2 22.8 72.0
296
27 1966 504.16 50.0 600-400 steel 23.0 23.0-46.0
9.9 12.6 213.5 51.4bl-gr-sd 7.2 12.2 72.0
248
28 1964 506.58 52.0 600-400 steel 20.4 24.2-44.6
9.4 7.7 213.5 31.3bl-gr-sd 7.5 5.8 67.129 1967 508.03 50.0 600-400 steel 19.5
24.2-44.2 bl-gr-sd 7.5
20.0 7.5
bl-gr-sd 7.3
26.0-45.5
128
31 260231.8 23.6510.71 7.1 72.0 8.8 7.027.5-45.518.01965 50.0 600 steel
18.9bl-gr-sd26.0-46.020.0 26.4 6.9 5.6 85.432 1967 512.71 50.0 600 steel 7.0 1.6
22.0-45.0 bl-gr-sd 7.4 0.3
24 1964 516.4 50.0 600-400 steel 19.0 26.0-45.0 bl-gr 7.4 0.5 91.5 11.8 9.8 269.7 47.8 396
22 1965 512.2 50.0 630-400 steel 17.0 9.8 267.825.8-43.8 bl-gr-sd 7.4 0.3
600-400 steel 23.021 1964 510.9 50.0
46.7 39591.5 13.4
45.5 39090.7 12.8 9.7 268.4
S 3-1-2-33

Table S 3.1.2.18 (3) List of Well Structure and Pumping Test Data
8.0-23.0 58.8 3.7 5.6 1.9 30.926.0-46.0 bl-gr-sd 69.4 3.7 6.1 2.4 28.9
55.5 3.0 5.0 2.0 27.869.4 3.0 5.5 2.5 27.851.1 7.5 10.3 2.8 18.363.8 7.5 11.0 3.5 18.244.4 4.0 5.8 1.8 24.750.0 4.0 6.0 2.0 25.0
43 507.0729.7 4.1 10.6 6.5 4.638.6 4.1 12.6 8.5 4.555.0 3.5 5.3 1.8 30.666.6 3.5 5.5 2.0 33.350.0 2.5 7.3 4.8 10.461.1 2.5 7.5 5.0 12.251.9 2.0 6.0 4.0 13.057.5 2.0 7.0 5.0 11.5
48 1970 516.91 50.0 600-400 steel 20.0 27.5-47.5 bl-gr-sd55.5 2.5 5.3 2.8 19.866.6 2.5 5.5 3.0 22.277.7 2.8 3.8 1.0 77.783.3 2.8 3.9 1.1 75.7
51 1969 521.26 50.0 600-400 steel 7.0 36.0-43.0 bl-gr-sd61.1 3.0 5.4 2.4 25.566.6 3.0 5.6 2.6 25.666.6 1.7 3.1 1.4 47.670.0 1.7 3.2 1.5 46.7
13.0-23.0 bl-gr-sd 66.6 2.3 4.6 2.3 29.026.0-46.0 gr-sd 77.7 2.3 5.0 2.7 28.8
61.0 2.5 4.5 2.0 30.566.6 2.5 4.6 2.1 31.755.5 4.0 5.5 1.5 37.072.2 4.0 5.9 1.9 38.055.0 2.7 4.0 1.3 44.076.9 2.7 4.1 1.4 57.0
SO4(mg/L)
TDS(mg/L)
Diameter(mm)
Materialof
Casing
TotalLength
(m)
Position(m)
Geologyof
Screen
Ca(mg/L)
Mg(mg/L)
Cl(mg/L)
HCO3(mg/L)
Draw-down(m)
SpecificCapa-city
(L/s/m)
pHNa +
K(mg/L)
Pumping Test Data Water Quality Analysis DataGroundEleva-tion(m)
DrilledDepth
(m)
DrilledDiameter
(mm)
Casing ScreenTestYield(L/s)
StaticWaterLevel(m)
PumpingWaterLevel(m)
WPT Name Kibray
WellNo.
Const-ructionYear
Well Structure
45.1 22078.4 4.0 8.3 207.026.0-46.0 bl-gr-sd 7.2 7.457 1967 503.38 50.0 600-400 steel 20.0
35.4 28076.6 13.3 7.0 256.425.0-45.0 bl-gr-sd 7.4 5.3
34.6 304
49 1968 518.95 50.0 600-400 steel 20.0
82.1 12.2 7.0 271.525.0-45.0 bl-gr-sd 7.5 6.4600-400 steel 20.050 1968 520.21 50.0
25.1 24059.6 10.6 5.6 195.224.0-42.1 bl-gr-sd 7.4 0.7600-400 steel 18.141 1967 505.61 47.0
27.2 25268.7 10.4 7.0 213.526.0-44.0 bl-gr-sd 7.2 5.5
23.6 260
44 1968 509.30 50.0 600-400 steel 18.0
72.0 8.8 7.0 231.827.5-45.5 bl-gr-sd 7.3 7.142 1965 506.26 50.0 600-400 steel 18.0
11.7 8.4 237.0 36.220.0 7.1 4.8 74.526.0-46.0 bl-gr-sd
207.4 96.2 284
40 1967 501.95 50.0 600-400 steel
0.5 78.4 20.0 7.235.0 7.939 1969 500.54 50.0 600-400 steel
32.1 28883.9 10.0 7.0 262.336.0-43.0 bl-gr-sd 7.4 3.6600-400 steel 7.053 1968 496.56 50.0
4.0 8.3 225.0 37.530.0 7.2 1.8 84.0
219.6 27.2 280
54 1969 50.0498.29 600-400 steel
5.5 67.1 9.4 7.021.2 27.0-48.2 bl-gr-sd 7.2
213.5 31.3 248
56 1967 501.74 50.2 600-400 steel
1.8 68.7 10.4 7.821.0 26.0-47.0 bl-gr-sd 7.4
244.0 39.5 296
55 1968 500.46 50.0 600-400 steel
34.6 272
46 1968 512.67 50.0 600-400 steel 19.5
74.4 10.4 8.5 225.725.0-45.0 bl-gr-sd 7.4 2.145 1968 511.26 50.0 600-400 steel 20.0
26.5-45.4 bl-gr-sd
32.9 280
52 1969 524.44 50.0 600-400 steel 18.9
72.9 13.3 5.6 256.225.0-45.0 bl-gr-sd 7.4 7.147 1968 514.34 50.0 600-400 steel 20.0
220
272
26.0-45.5 bl-gr-sd 7.4 3.0 78.2 12.7 9.2
S 3-1-2-34

Table S 3.1.2.18 (4) List of Well Structure and Pumping Test Data
44.4 2.2 4.1 1.9 23.451.4 2.2 4.3 2.1 24.552.7 2.3 5.1 2.8 18.863.8 2.3 6.1 3.8 16.8
60 1969 509.52 50.2 600-400 steel 21.2 27.0-48.2 bl-gr-sd51.9 2.2 4.0 1.8 29.761.9 2.2 4.4 2.2 28.162.2 2.6 5.1 2.5 24.976.9 2.6 5.6 3.0 25.6
10.0-22.5 bl 90.0 2.8 4.3 1.5 60.027.5-46.0 gr-sd 110.8 2.8 4.5 1.7 65.2
50.0 2.0 6.0 4.0 12.561.1 2.0 6.9 4.9 12.5
65 1965 513.60 80.0 350-200 steel 47.3 5.8-53.0 bl-gr-sd 100.0 2.63 4.30 1.67 59.9 7.3 12.0 69.0 13.0 10.0 66.0 19.066 1977 507.43 35.0 600-400 steel 30.0 0.0-30.0 bl-gr-sd 85.0 1.6 3.5 1.9 44.7 7.8 16.3 60.0 7.2 9.7 170.8 58.2 23667 1965 508.91 50.3 350-200 steel 37.2 5.3-42.5 bl-gr-sd 98.9 1.7 9.5 7.8 12.6
44.7 4.0 8.4 4.4 10.250.6 4.0 8.6 4.7 10.995.0 1.4 2.6 1.2 79.2
110.0 1.4 2.7 1.4 81.576.0 1.7 4.3 2.6 29.293.0 1.7 4.8 3.1 30.067.0 1.6 3.6 2.0 33.577.0 1.6 3.8 2.2 35.0
4.0-21.0 bl-gr-sd22.0-29.5 bl-gr-sd
73 1976 514.12 50.0 600-426 steel 37.8 7.0-44.8 bl-gr-sd 71.1 1.3 4.3 3.0 23.7 7.8 31.7 84.0 32.0 2.8 244.0 150.0 42012.0-20.0 bl-gr-sd 64.7 1.0 6.0 5.0 12.924.0-48.0 bl-gr-sd 70.8 1.0 6.8 5.8 12.2
77.0 1.0 3.5 2.5 30.899.0 1.0 3.6 2.6 38.840.0 5.0 8.3 3.3 12.155.0 5.0 9.0 4.0 13.8
5.9-24.0 bl-gr-sd 78.0 1.5 4.4 2.9 26.926.0-47.0 bl-gr-sd 91.0 1.5 5.0 3.5 26.0
SO4(mg/L)
TDS(mg/L)
Diameter(mm)
Materialof
Casing
TotalLength
(m)
Position(m)
Geologyof
Screen
Ca(mg/L)
Mg(mg/L)
Cl(mg/L)
HCO3(mg/L)
Draw-down(m)
SpecificCapa-city
(L/s/m)
pHNa +
K(mg/L)
Pumping Test Data Water Quality Analysis DataGroundEleva-tion(m)
DrilledDepth
(m)
DrilledDiameter
(mm)
Casing ScreenTestYield(L/s)
StaticWaterLevel(m)
PumpingWaterLevel(m)
WPT Name Kibray
WellNo.
Const-ructionYear
Well Structure
42.8 21270.0 8.0 8.3 195.215.0-44.1 bl-gr-sd 7.8 4.8
28.0 204
62 1969 512.47 50.0 600-400 steel 29.1
61.1 12.0 8.6 195.025.0-45.0 bl-gr-sd 7.9 0.1
20.6 200
61 1969 510.67 50.0 600-400 steel 20.0
54.0 8.2 4.9 183.026.5-42.7 bl-gr-sd 7.3 4.6
53.5 280
59 1967 507.23 50.0 600-400 steel 16.2
58 1965 505.40 50.0 600-400 steel 17.5 28.0-45.5 bl-gr-sd 7.5 5.8 57.6 17.5 5.4 201.3
84.0 8.0 10.4 207.47.6 0.1
21.5 18427.8 7.1 6.7 93.8
36.2 29263 1969 514.25 50.0 600-400 steel 25.0
23.5-48.5 bl-gr-sd 7.0 1.864 1967 506.36 51.5 600-400 steel 25.0
170.8 101.0 34226.9 72.0 7.2 15.926.5 5.0-27.0 bl-gr-sd 7.930.0 630-426 steel
68
69 1977 510.78
9.6 17.4 182.0 62.2bl-gr-sd 7.3 80.01977 510.50 30.0 630-426 steel 26.5 3.5-30.0
53.5 26072.0 7.2 16.0 195.24.0-25.6 bl-gr-sd 7.2 13.6
208
197871 513.24 30.0 400 steel 21.6
260
226
252
274
51.052.0 9.6 16.0 183.02.0-26.0 bl-gr-sd 8.1 25.7400 steel 24.070 1978 512.26 30.0
8.0 11.1 244.0 37.0bl-gr-sd 7.4 0.5 89.0
37.0
76 1969 518.16 50.0 500-400 steel 27.6 15.0-42.6
24.0 12.0 14.0 122.024.5 83.0 1.2 2.2
13.0 134.0 35.0
72 1972 31.0514.22 600-400 steel
7.2 14.0 56.0 4.039.1steel630-42677 1976 50.0519.18
75 1976 516.78 50.0 630-426 steel 40.3 6.0-46.3 bl-gr-sd 7.2 14.0 56.0 4.0 13.0 134.0 46.0 246
74 1976 515.14 50.0 630-426 steel 32.0 7.5 3.7
1.0 83.0 7.6 28.0
86.4 13.1 8.4 265.0 46.8 360
S 3-1-2-35

Table S 3.1.2.18 (5) List of Well Structure and Pumping Test Data
78 1966 520.25 40.0 350-200 steel 28.0 5.6-33.6 bl-gr-sd 78.9 1.8 11.9 10.1 7.8 7.0 0.5 67.0 24.0 0.5 75.0 15.079 1978 521.73 35.0 400 steel 23.7 6.3-30.0 bl-gr-sd 55.0 3.0 6.6 3.6 15.3 7.8 51.5 60.0 9.6 25.7 183.0 112.0 350
62.5 1.7 4.0 2.3 27.271.4 1.7 4.2 2.5 28.677.0 0.4 1.7 1.3 59.2
100.0 0.4 2.4 2.0 50.01G 1981 508.64 30.0 350 steel 19.0 5.5-24.5 bl-gr-sd 100.0 2.3 4.2 1.9 51.52G 1982 507.12 30.0 350 steel 19.0 5.5-24.5 bl-gr-sd 115.0 2.3 5.7 3.4 34.03G 1982 507.71 30.0 350 steel 17.3 7.0-24.3 bl-gr-sd 76.0 2.6 7.3 4.7 16.04G 1981 510.65 30.0 350 steel 16.0 6.0-22.0 bl-gr-sd 75.0 1.8 8.5 6.6 11.31P U.P. 525.922P U.P. 525.453P U.P. 524.934P U.P. 524.425P U.P. 522.906P U.P. 522.397P 519.678P U.P. 519.269P 518.06
10P U.P. 517.8211P U.P. 516.4212P U.P. 514.6713P 512.7214P 513.6215P 510.9916P 511.8533P 1984 508.03 35.0 400 steel 25.0 5.0-30.0 bl-gr34P 1994 509.86 35.0 400 steel bl-gr35P 511.17 35.0 400 steel bl-gr36P U.P.
SO4(mg/L)
TDS(mg/L)
Diameter(mm)
Materialof
Casing
TotalLength
(m)
Position(m)
Geologyof
Screen
Ca(mg/L)
Mg(mg/L)
Cl(mg/L)
HCO3(mg/L)
Draw-down(m)
SpecificCapa-city
(L/s/m)
pHNa +
K(mg/L)
Pumping Test Data Water Quality Analysis DataGroundEleva-tion(m)
DrilledDepth
(m)
DrilledDiameter
(mm)
Casing ScreenTestYield(L/s)
StaticWaterLevel(m)
PumpingWaterLevel(m)
WPT Name Kibray
WellNo.
Const-ructionYear
Well Structure
80 1978 522.21 31.0 400 steel 20.6 5.2-25.8 bl-gr-sd 7.8 45.7 56.0 4.8 11.1 159.0 110.0 307
81 1978 523.22 31.0 400 steel 21.4 4.0-25.4 bl-gr-sd 7.9 2.6 48.0 9.5 9.5 146.0 32.0 216
S 3-1-2-36

Table S 3.1.2.19 (1) List of Pumps and Operation
1 1962 C 20A18x1 250 75 3520
403602
600 (300) 59.0 2.3 3.2 0.9 69.4 154.2 4.1 6.1
2 1960 C 20A18x1 250 75 20 602 600 (300) 98.0 2.5 4.5 2.0 50.0 133.3 4.4 6.1
3 1961 S ETSV-12 150 45 6530
150270
200 (200) 48.0 6.5 14.0 7.5 6.4 13.3 3.4 4.8
4 1958 C 20A18x1 250 75 20 602 280 (300) 50.0 2.1 4.1 2.0 25.0 284.1 4.8 7.55 1958 C 20A18x1 250 75 20 602 600 (300) 177.8 3.5 10.3 6.9 26.0 67.7 4.5 7.56 1958 C 20A18x1 250 75 20 602 600 (300) 166.6 4.0 12.7 8.7 19.1 64.9 5.3 7.57 1955 C 20A18x1 250 75 20 602 250 470 160.0 2.0 8.0 6.0 26.7 44.1 4.3 7.28 1957 C 20A18x1 250 75 20 602 600 (300) 136.0 2.6 5.3 2.7 50.0 119.4 4.6 6.49 1956 C 20A18x1 250 75 20 602 200 470 6.4 6.3 9.910 1959 C 20A18x1 250 75 20 602 200 370 38.9 5.0 5.5 0.5 77.7 100.1 5.4 7.311 1962 S ETSV-12 150 45 30 270 200 0 Power Source 47.2 4.0 4.7 0.7 67.4 140.5 4.5 7.112 1958 C 20A18x1 250 75 20 602 320 140 6.2 8.313 1958 C 20A18x1 250 75 20 602 600 0 Power Source 69.4 6.0 13.9 8.0 8.7 19.4 6.0 7.914 1960 C 250 200 160 61.0 5.2 12.3 7.1 8.6 28.2 5.4 8.114a 1966 S ETSV-12 150 45 30 270 200 150 51.0 3.9 5.4 1.5 34.0 100.0 5.4 7.215 1964 C 20A18x1 250 75 20 602 200 260 59.1 2.0 4.2 2.2 27.5 100.0 5.5 7.116 1966 C 20A18x1 250 75 20 602 200 0 Pump 40.0 4.5 6.5 2.0 20.0 20.8 3.6 9.117 1966 C 20A18x1 250 75 20 602 200 (300) 48.0 2.6 3.1 0.5 96.0 100.0 4.2 7.018 1966 C 20A18x1 250 75 20 602 200 (300) 52.2 3.1 4.3 1.3 41.8 100.0 5.4 7.819 1965 C 20A18x1 250 75 20 602 200 >400 55.8 2.2 5.0 2.8 19.9 100.0 4.6 6.620 1965 C 20A18x1 250 75 20 602 200 (300) 50.0 3.3 5.2 1.9 26.3 100.0 3.6 9.421 1966 C 20A18x1 250 75 20 602 200 >400 56.1 2.0 3.0 1.0 56.1 100.0 4.9 7.322 1967 C 20A18x1 250 75 20 602 200 0 Motor 58.8 2.0 4.0 2.0 29.4 100.0 2.123 C 250 75 600 0 Pump 70.0 1.0 2.8 1.8 38.924 1967 C 20A18x1 250 75 20 602 600 (300) 70.0 2.0 4.0 2.0 35.0 100.0 3.025 1967 C 20A18x1 250 75 20 602 200 (200) 58.3 2.2 4.2 2.0 29.2 100.0 3.3 8.326 1968 C 20A18x1 250 75 20 602 200-250 0 Motor 5.927 1968 C 250 75 600 250 0 Motor 40.0 4.5 5.6 1.1 36.4 100.0 4.328 1969 C 20A18x1 250 75 20 602 200 0 Motor 44.4 3.0 6.0 3.0 14.8 59.2 4.029 1969 C 20A18x1 250 75 20 602 200 (300) 44.4 2.2 4.1 1.9 23.4 117.5 3.9 8.631 1969 C 20A18x1 250 75 20 602 200 (300) 3.3 8.132 1969 S ETSV-12 150 45 30 270 200 0 Motor 33.3 4.4 6.8 2.4 13.9 70.0 3.8 5.733 1969 C 20A18x1 250 75 20 602 200 (300) 50.0 5.1 6.7 1.6 31.3 100.0 6.0 9.634 1969 C 20A18x1 250 75 20 602 200 (300) 44.4 4.4 8.4 4.0 11.1 100.0 7.1 9.935 1969 C 20A18x1 250 75 20 602 200 0 Motor 50.0 4.5 8.3 3.8 13.2 100.0 3.8
Kibray
Pump Capacity Recom-mended
Intake Rate(m3/hr)
WPT Name
WellNo.
StartingYear,
OperatedQ
(m3/hr)
ModelNo.
Pump Facilities
PumpType
H(m)
Dia-meter(mm)
Output(KW)
ActualAmountof Intake(m3/hr)
Operation of Groundwater Intake
Declineof Well
Capacity(%)
TestYield(L/s)
SpecificCapacity(L/s/m)
StaticGWL(m)
PumpingGWL(m)
Draw-down(m)
Pumping Test at Feb. 2003Cause ofNon-
Operation
Problemsfor Intake
StaticGWL(m)
PumpingGWL(m)
Groundwater Level
S 3-1-2-37

Table S 3.1.2.19 (2) List of Pumps and Operation
30 1969 C ATH-14 250 75100
7546
170260360
200 0 Pump
36 1969 C 20A18x1 250 75 20 602 200 (300) 44.4 2.0 6.0 4.0 11.1 100.0 3.3 9.237 1069 C 20A18x1 250 75 20 602 200 (300) 44.4 2.2 5.1 2.9 15.3 100.0 2.738 C 20A18x1 250 75 20 602 200 (300) 44.4 2.1 5.0 2.9 15.3 100.0 3.9 9.639 C 20A18x1 250 75 20 602 200 0 Pump 55.0 2.7 4.0 1.3 44.0 142.2 5.3 9.540 C 20A18x1 250 75 20 602 200 0 Pump 51.9 2.2 4.0 1.8 28.8 103.9 2.741 1969 C 20A18x1 250 75 20 602 200 0 Pump 62.2 2.6 5.1 2.5 24.9 136.3 3.6 4.642 1967 C 20A18x1 250 75 20 602 200 (300) 55.5 1.8 4.8 3.0 18.5 74.0 4.3 7.343 S ETSV-12 150 45 30 270 (200) 55.5 3.0 5.0 2.0 27.8 1.9 3.744 1969 C 20A18x1 250 75 20 602 200 (300) 51.1 7.5 10.3 2.8 18.3 399.4 4.5 8.345 1969 C 20A18x1 250 75 20 602 200 (300) 13.0 1.0 14.0 13.0 1.0 3.0 4.4 7.146 1969 C 20A18x1 250 75 20 602 200 (300) 29.7 4.1 10.6 6.5 4.6 43.9 4.2 7.547 1969 C 20A18x1 250 75 20 602 200 0 Pump 55.0 3.5 5.3 1.8 30.6 235.5 4.6 8.248 1969 C 20A18x1 250 75 20 602 (300) 50.0 2.5 7.3 4.8 10.4 3.9 5.949 1969 C 20A18x1 250 75 20 602 200 (300) 51.9 2.0 8.0 6.0 8.7 39.0 5.9 10.050 1970 C 20A18x1 250 75 20 602 200 (300) 57.7 1.4 3.0 1.6 36.1 46.4 3.3 4.851 1970 C 20A18x1 250 75 20 602 200 0 Motor 55.5 2.5 5.3 2.8 19.8 4.9 8.352 1969 C 20A18x1 250 75 20 602 200 (300) 77.7 2.8 3.8 1.0 77.7 303.3 4.5 7.553 1972 C 20A18x1 250 75 20 602 200 0 Pump 66.6 1.7 3.1 1.4 47.6 100.0 2.454 1972 C 20A18x1 250 75 20 602 200 (300) 61.1 3.0 5.4 2.4 25.5 87.9 4.5 6.255 1972 C 20A18x1 250 75 20 602 200 0 Motor 61.0 2.5 4.5 2.0 30.5 96.2 4.1 6.856 1969 C 20A18x1 250 75 20 602 200 0 Pump 44.4 2.2 4.1 1.9 23.4 61.5 4.4 7.157 1969 C 20A18x1 250 75 20 602 200 0 Pump 44.4 4.0 5.8 1.8 24.7 43.3 4.2 6.458 1967 C 20A18x1 250 75 20 602 200 0 Pipes 52.0 2.0 4.4 2.4 21.7 88.5 3.9 6.459 1967 C 20A18x1 250 75 20 602 200 (300) 52.7 2.3 5.1 2.8 18.8 100.0 3.2 8.160 1969 C 20A18x1 250 75 20 602 200 0 Motor 55.5 4.6 7.4 2.8 19.8 4.9 8.461 1972 C 20A18x1 250 75 20 602 200 0 Motor 57.7 3.6 5.8 2.3 25.6 86.5 4.1 6.362 1972 C 20A18x1 250 75 20 602 200 0 Motor 58.8 3.7 5.6 1.9 30.9 120.7 5.0 8.763 1971 C 20A18x1 250 75 20 602 (300) 66.6 2.3 4.6 2.3 29.0 48.3 4.0 7.564 1968 C 20A18x1 250 75 20 602 200 (300) 50.0 2.0 6.0 4.0 12.5 100.0 4.1 6.765 1976 S ETSV-12 150 45 30 270 360 (200) 57.7 1.3 2.3 1.0 57.7 96.4 3.9 5.366 1980 C 20A18x1 250 75 20 602 375 630 85.0 1.6 3.5 1.9 44.7 100.0 4.0 7.567 1980 S ETSV-12 150 45 30 270 350 0 Pipes 105.6 2.2 5.3 3.1 33.7 267.6 3.268 1980 S ETSV-12 150 45 30 270 210 240 50.6 4.0 8.6 4.7 10.9 100.0 3.2 4.369 1980 S ETSV-12 150 45 30 270 210 250 110.0 1.4 2.7 1.4 81.5 100.0 3.6 4.6
WPT Name Kibray
WellNo.
StartingYear,
Operated
Pump Facilities Operation of Groundwater Intake
PumpType
ModelNo.
Dia-meter(mm)
Pumping Test at Feb. 2003SpecificCapacity(L/s/m)
StaticGWL(m)
PumpingGWL(m)
Draw-down(m)
StaticGWL(m)
PumpingGWL(m)
Declineof Well
Capacity(%)
Output(KW)
Pump Capacity Recom-mended
Intake Rate(m3/hr)
ActualAmountof Intake(m3/hr)
H(m)
Q(m3/hr)
Groundwater LevelCause ofNon-
Operation
Problemsfor Intake
TestYield(L/s)
S 3-1-2-38

Table S 3.1.2.19 (3) List of Pumps and Operation
70 1980 S ETSV-12 150 45 30 270 240 93.0 1.7 4.8 3.1 30.0 100.0 5.7 6.771 1980 S ETSV-12 150 45 30 270 240 62.2 2.6 5.1 2.5 24.9 71.1 5.1 6.572 1980 C 20A18x1 250 75 20 602 200 0 Power Source 83.0 1.2 2.2 1.0 83.0 100.0 4.073 1980 C 20A18x1 250 75 20 602 255 320 71.0 1.3 4.3 3.0 23.7 99.9 3.5 6.274 1980 S ETSV-12 150 45 30 270 0 Motor 70.8 1.0 6.8 5.8 12.2 100.0 3.775 1980 C 20A18x1 250 75 20 602 220 99.0 1.0 3.6 2.6 38.8 282.4 4.2 7.376 1980 C 20A18x1 250 75 20 602 200 280 40.0 5.0 8.3 3.3 12.1 100.0 4.4 7.477 1980 C 20A18x1 250 75 20 602 255 (300) 90.0 2.8 4.3 1.5 60.0 230.8 5.3 9.778 1980 S ETSV-12 150 45 30 270 290 0 Motor 114.3 2.6 7.0 4.4 25.9 330.3 4.1 6.679 1980 S ETSV-12 150 45 30 270 290 (200) 62.0 1.6 4.6 3.0 20.7 135.3 4.1 6.580 1980 S ETSV-12 150 45 30 270 - 0 Motor 77.0 1.7 4.4 2.7 28.5 99.9 4.3 6.881 1980 S ETSV-12 150 45 30 270 250 0 Motor 100.0 1.8 3.8 2.0 50.0 100.0 4.3 5.01G 1990 S ETSV-12 150 45 30 270 350 0 Motor2G 1990 S ETSV-12 150 45 30 270 350 (200) 2.8 3.73G 1994 S ETSV-12 150 45 30 270 250 0 Motor4G 1992 S ETSV-12 150 45 30 270 250 0 Motor1P U.P. 2P U.P. 3P U.P. 4P U.P. 5P U.P. 6P U.P. 7P C 150 30 2108P U.P.9P C 150 30 21010P U.P.11P U.P.12P U.P.13P C 150 30 21014P C 150 30 21015P C 150 30 210 3.5 4.316P C 150 30 21033P 1996 S ETSV-12 150 45 30 270 (200) 3.8 5.134P 1996 S ETSV-12 150 45 30 270 210 (200) 3.8 4.835P 1996 S ETSV-12 150 45 30 270 210 (200) 3.9 6.336P U.P.
Output(KW)
WPT Name Kibray
Pump Capacity Recom-mended
Intake Rate(m3/hr)
ActualAmountof Intake(m3/hr)
Cause ofNon-
OperationH
(m)Q
(m3/hr)
PumpingGWL(m)
WellNo.
StartingYear,
Operated
Pump Facilities Operation of Groundwater Intake
PumpType
ModelNo.
Dia-meter(mm)
Problemsfor Intake
TestYield(L/s)
StaticGWL(m)
PumpingGWL(m)
Draw-down(m)
SpecificCapacity(L/s/m)
Declineof Well
Capacity(%)
StaticGWL(m)
Pumping Test at Feb. 2003 Groundwater Level
S 3-1-2-39

Table S.3.1.2.20 (1) List of Maitenance and Rahabilitation Status
1 1962 Pump/ Motor 1 1962 28 2002 1 2003 Air Lifting2 1960 Pump/ Motor 0 1960 25 1998 1 2003 Air Lifting3 1961 Pump 2 1999 24 2002 1 2003 Air Lifting4 1958 Pump/ Motor 1 1998 32 1998 1 2003 Air Lifting5 1958 Pump/ Motor 0 1958 26 1996 1 2003 Air Lifting6 1958 Pump/ Motor 2 1983 26 1997 1 2003 Air Lifting7 1955 Pump 2 1973 40 2002 1 2003 Air Lifting8 1957 Pump 0 1957 27 1999 1 2003 Air Lifting9 1956 Pump 0 1956 23 2001 1 2003 Air Lifting10 1959 Pump/ Motor 0 1959 27 2002 1 2003 Air Lifting11 1962 Pump/ Motor 1 1990 39 2002 1 2003 Air Lifting12 1958 Pump 0 1958 33 1998 1 2003 Air Lifting13 1958 Pump 0 1958 24 1996 1 2003 Air Lifting14 1960 Pump 2 2000 33 2003 1 2003 Air Lifting14a 1966 Pump 2 1995 16 1996 1 2003 Air Lifting15 1964 Pump 0 1964 24 2001 1 2003 Air Lifting16 1966 Pump 0 1966 27 1998 1 2003 Air Lifting17 1966 Pump/ Motor 0 1966 17 1997 1 2003 Air Lifting18 1966 Pump 2 1980 27 2001 1 2003 Air Lifting19 1965 Pump/ Motor 0 1965 20 1997 1 2003 Air Lifting20 1965 Pump/ Motor 0 1965 19 2002 1 2003 Air Lifting21 1966 Pump/ Motor 0 1966 28 2001 1 2003 Air Lifting
22 1967 Pump/ Motor/Power Source 2 1998 27 1998 1 2003 Air Lifting
23 1 2003 Air Lifting24 1967 Pump/ Motor 0 1967 22 1998 1 2003 Air Lifting25 1967 Pump 3 1998 27 1998 1 2003 Air Lifting26 1968 Pump/ Motor 6 1998 44 1998 1 2003 Air Lifting27 1968 Pump 1998 1998 1 2003 Air Lifting28 1969 Power Source 2 1986 22 2002 1 2003 Air Lifting29 1969 Pump 3 1998 26 2001 1 2003 Air Lifting30 1969 Pump 5 1997 20 1997 1 2003 Air Lifting31 1969 Pump 9 2001 33 2001 1 2003 Air Lifting32 1969 Pump 1 1994 21 1995 1 2003 Air Lifting33 1969 Pump 3 1987 20 2002 1 2003 Air Lifting34 1969 Pump 3 19999 18 2001 1 2003 Air Lifting35 1969 Pump 1 1992 26 1998 1 2003 Air Lifting36 1969 Pump 2 1998 32 1998 1 2003 Air Lifting37 1969 Pump/ Motor 5 1998 28 2001 1 2003 Air Lifting38 1969 Pump 2 1998 22 1998 1 2003 Air Lifting
39 1972 Pump/PowerSource 2 1982 34 1998 1 2003 Air Lifting
40 1969 Pump 2 1998 30 2002 1 2003 Air Lifting41 1969 Pump 0 1969 19 2001 1 2003 Air Lifting42 1967 Pump 2 1998 15 1999 1 2003 Air Lifting43 1 2003 Air Lifting
FinalInstalla-tion Yearof Pump
Times ofAll
Repairs
Freq. ofRehabili-
tation(once in yrs)
Times ofRe-Instal
lationof Pump
FinalRepairYear
of Pump
WPT Name
WellNo.
StartingYear,
Operated
KibrayRepair and Rehabilitation
Equipments,often
damaged
FinalRehabili-
tationYear
Contents ofRehabilitatio
n
S 3-1-2-40

Table S.3.1.2.20 (2) List of Maitenance and Rahabilitation Status
44 1969 Pump 2 1999 28 1999 1 2003 Air Lifting45 1969 Pump/ Motor 3 1998 21 2002 1 2003 Air Lifting46 1969 Pump 0 1969 28 2001 1 2003 Air Lifting47 1969 Pump/ Motor 1 2002 24 2001 1 2003 Air Lifting48 1969 Pump 0 1969 26 2001 1 2003 Air Lifting49 1969 Pump/ Motor 0 1969 19 1999 1 2003 Air Lifting50 1970 Pump/ Motor 0 1970 38 2001 1 2003 Air Lifting51 1970 Pump/ Motor 1 1971 21 1998 1 2003 Air Lifting52 1969 Pump/ Motor 0 1969 23 1998 1 2003 Air Lifting53 1972 Pump/ Motor 1 1998 21 1998 1 2003 Air Lifting54 1972 Pump/ Motor 0 1972 17 2002 1 2003 Air Lifting55 1972 Pump 0 1972 21 1998 1 2003 Air Lifting56 1969 Pump 0 1972 22 1998 1 2003 Air Lifting57 1969 Pump/ Motor 0 1969 21 2001 1 2003 Air Lifting58 1967 Pump 0 1967 25 2001 1 2003 Air Lifting59 1967 Pump 0 1967 25 2001 1 2003 Air Lifting60 1969 Motor\Pump 0 1969 21 2001 1 2003 Air Lifting61 1972 Motor\Pump 0 1972 20 2002 1 2003 Air Lifting62 1972 Pump 0 1972 21 2002 1 2003 Air Lifting
63 1971 Pump/PowerSource 0 1971 18 1997 1 2003 Air Lifting
64 1968 Pump/PowerSource 0 1968 18 1997 1 2003 Air Lifting
65 1976 Pump 1 1981 9 1996 1 2003 Air Lifting66 1980 Pump 0 1980 15 1999 1 2003 Air Lifting67 1981 Pump 1 1982 10 1995 1 2003 Air Lifting68 1980 Pump 1 1980 10 1997 1 2003 Air Lifting69 1980 Pump 2 2001 5 2001 1 2003 Air Lifting70 1980 Pump 1 1989 16 2001 1 2003 Air Lifting71 1980 Pump 1 1980 11 2001 1 2003 Air Lifting72 1980 Pump 0 1980 12 2001 1 2003 Air Lifting73 1980 Pump 1 1998 16 2001 1 2003 Air Lifting74 1980 Pump 3 1999 12 2000 1 2003 Air Lifting75 1980 Pump 2 1981 9 1996 1 2003 Air Lifting76 1980 Pump 4 2001 14 2002 1 2003 Air Lifting77 1980 Pump 0 1980 13 2002 1 2003 Air Lifting78 1980 Pump 1 1983 6 1997 1 2003 Air Lifting
79 1980 Pump/PowerSource 7 1999 22 2000 1 2003 Air Lifting
80 1980 Pump 0 1980 6 2001 1 2003 Air Lifting81 1980 Pump 2 1997 15 1997 1 2003 Air Lifting1G 1990 Pump/ Pipe 3 1995 9 1997 1 2003 Air Lifting2G 1990 Pump 0 1990 2 1999 1 2003 Air Lifting3G 1994 Pump 0 1994 6 1997 1 2003 Air Lifting4G 1992 Pump 2 1996 19 1999 1 2003 Air Lifting1P U.P.2P U.P.
WPT Name Kibray
WellNo.
StartingYear,
Operated
Repair and Rehabilitation
Equipments,often
damaged
Times ofRe-Instal
lationof Pump
FinalInstalla-tion Yearof Pump
Times ofAll
Repairs
FinalRepairYear
of Pump
Freq. ofRehabili-
tation(once in yrs)
FinalRehabili-
tationYear
Contents ofRehabilitatio
n
S 3-1-2-41

Table S.3.1.2.20 (3) List of Maitenance and Rahabilitation Status
3P U.P.4P U.P.5P U.P.6P U.P.7P 1 2003 Air Lifting8P U.P.9P 1 2003 Air Lifting
10P U.P.11P U.P.12P U.P.13P 1 2003 Air Lifting14P 1 2003 Air Lifting15P 1 2003 Air Lifting16P 1 2003 Air Lifting33P 1996 Pump 2 1997 5 1999 1 2003 Air Lifting34P 1996 Pump 1 2002 4 1998 1 2003 Air Lifting35P 1996 Pump 0 1996 3 2001 1 2003 Air Lifting36P U.P.
WPT Name Kibray
WellNo.
StartingYear,
Operated
Repair and Rehabilitation
Equipments,often
damaged
Times ofRe-Instal
lationof Pump
FinalInstalla-tion Yearof Pump
Times ofAll
Repairs
FinalRepairYear
of Pump
Freq. ofRehabili-
tation(once in yrs)
FinalRehabili-
tationYear
Contents ofRehabilitatio
n
S 3-1-2-42

The Study on Restructuring of Water Supply System Volume 3. Supporting Report of Tashkent City in the Republic of Uzbekistan March 2006
S 3-1-2-43
Table S 3.1.2.21 Total Diagnosis of Wells
No. Name Well number Well’s function Pump’s function Problem
1 Light bank wells
26 -Intake capacities are decreasing
-Relatively normal -Lack of parts for pump repair -New Pumps purchased from Russia are not reliable
- High nitrate concen-tration -6 wells are not oper-ating -Well’s intake capaci-ties and pump capaci-ties are not match
2 Left bank wells
49
-Water level is low-ering -Intake capacities are decreasing rap-idly
-Many pumps are out of order -Pumps are frequently breakdown -Many submerged pump cannot be repaired -Well pumps located in low elevation area cannot transmit water to reser-voir -New Pumps purchased from Russia are not reliable
-20 to 30 wells are not operating -Breakdown of too many pumps
iv) Distribution PSs
No.1 (Vremennaya) distribution PS, No.2 PS and related facilities are listed in Table S
3.1.2.22 (1) to (4). Diagnosis results for intake facilities are shown in Table S 3.1.2.22 (5) and
(6)
Table S 3.1.2.22 (1) List of No.1 Distribution Pump
No. Name Model Q (m3/hr)
Head (m)
D(in,out) (mm)
Power (kw)
in Valve (mm)
out Valve (mm)
Installation year
1 Main pump HV-DS 2500 58 800, 600 500 800 600 1962 2 Ditto Ditto 3600 52 800, 600 630 800 600 1963 3 Ditto Ditto 3600 52 1000, 800 630 800 600 1962 4 Ditto Ditto 5200 51 1000, 800 1000 800 600 1966 5 Ditto Ditto 5200 51 1000, 800 1000 800 600 1966
Table S 3.1.2.22 (2) List of No.1 Distribution PS Facilities No. Name Specifications Installation year 1 Pipes D500-1400 1962 2 Valves D500-1400 1962 3 Ceiling crane W11m×20t 1962 4 Power receiving
facilities Receiving 10,000KVA,Transformer, incoming panels, bus sectional panels and feeding panels 1962
5 Power panel Stand, 5 units 1962 6 Control panel Stand, 5 units 1962 7 Cable an others 1962
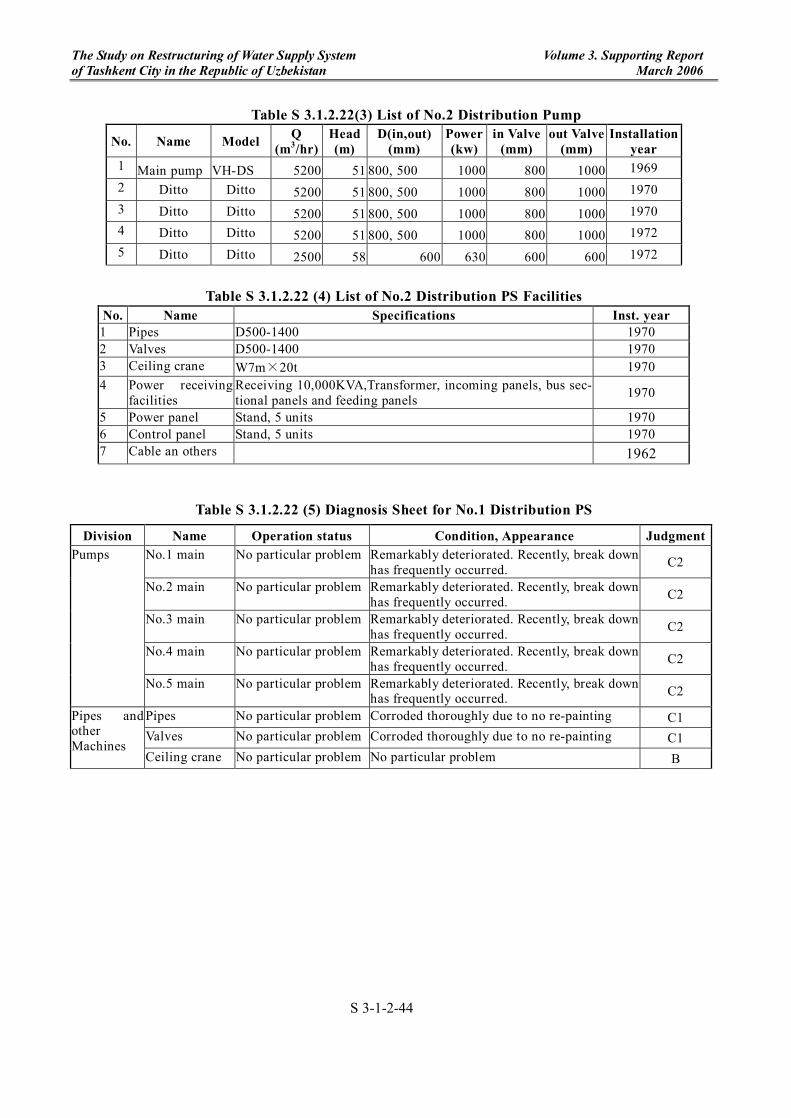
The Study on Restructuring of Water Supply System Volume 3. Supporting Report of Tashkent City in the Republic of Uzbekistan March 2006
S 3-1-2-44
Table S 3.1.2.22(3) List of No.2 Distribution Pump
No. Name Model Q (m3/hr)
Head (m)
D(in,out) (mm)
Power (kw)
in Valve (mm)
out Valve (mm)
Installation year
1 Main pump VH-DS 5200 51 800, 500 1000 800 1000 1969 2 Ditto Ditto 5200 51 800, 500 1000 800 1000 1970 3 Ditto Ditto 5200 51 800, 500 1000 800 1000 1970 4 Ditto Ditto 5200 51 800, 500 1000 800 1000 1972 5 Ditto Ditto 2500 58 600 630 600 600 1972
Table S 3.1.2.22 (4) List of No.2 Distribution PS Facilities
No. Name Specifications Inst. year 1 Pipes D500-1400 1970 2 Valves D500-1400 1970 3 Ceiling crane W7m×20t 1970 4 Power receiving
facilities Receiving 10,000KVA,Transformer, incoming panels, bus sec-tional panels and feeding panels 1970
5 Power panel Stand, 5 units 1970 6 Control panel Stand, 5 units 1970 7 Cable an others 1962
Table S 3.1.2.22 (5) Diagnosis Sheet for No.1 Distribution PS
Division Name Operation status Condition, Appearance Judgment No.1 main No particular problem Remarkably deteriorated. Recently, break down
has frequently occurred. C2
No.2 main No particular problem Remarkably deteriorated. Recently, break down has frequently occurred. C2
No.3 main No particular problem Remarkably deteriorated. Recently, break down has frequently occurred. C2
No.4 main No particular problem Remarkably deteriorated. Recently, break down has frequently occurred. C2
Pumps
No.5 main No particular problem Remarkably deteriorated. Recently, break down has frequently occurred. C2
Pipes No particular problem Corroded thoroughly due to no re-painting C1 Valves No particular problem Corroded thoroughly due to no re-painting C1
Pipes and other Machines
Ceiling crane No particular problem No particular problem B

The Study on Restructuring of Water Supply System Volume 3. Supporting Report of Tashkent City in the Republic of Uzbekistan March 2006
S 3-1-2-45
Table S 3.1.2.22 (6) Diagnosis Sheet for No.2 Distribution PS Division Name Operation status Condition, Appearance Judgment
No.1 main No particular problem Remarkably deteriorated. Recently, break down has frequently occurred. C2
No.2 main No particular problem Remarkably deteriorated. Recently, break down has frequently occurred. C2
No.3 main Bearing id under re-pair.
Remarkably deteriorated. Recently, break down has frequently occurred. C2
No.4 main No particular problem Remarkably deteriorated. Recently, break down has frequently occurred. C2
Pumps
No.5 main Motor is under repair. Remarkably deteriorated. Recently, break down has frequently occurred. C2
Pipes No particular problem Corroded thoroughly due to no re-painting C1 Valves No particular problem Corroded thoroughly due to no re-painting C1
Pipes and other Machines
Ceiling crane No particular problem No particular problem B
v) Chlorinator
Chlorinators and related facilities are listed in Table S 3.1.2.23 (1), and the diagnosis results
are shown in Table S 3.1.2.23 (2).
Table S 3.1.2.23 (1) List of Chlorination Facilities
Division No. Name Type Specification Number Inst. Year1 Cylinder scale Analog type for 1ton Cylinder 2 1955 2 Gas filter 2 1955 3 Gas meter Flow meter 2.5kg/hrxd20mm 2 1955 4 Ejector Water ejector D25mm, from well pump 2 1955
No.1
5 Safety equipment Sprinkler, Discharging chamber, Gas mask 1 1955 1 Cylinder scale Analog type for 1ton Cylinder 2 1955 2 Gas filter 2 1955 3 Gas meter Flow meter 2.5kg/hrxd20mm 4 1955 4 Ejector Water ejector D25mm, with exclusive pump 4 1955
No.3
5 Safety equipment Sprinkler, Discharging chamber, Gas mask 1 1955

The Study on Restructuring of Water Supply System Volume 3. Supporting Report of Tashkent City in the Republic of Uzbekistan March 2006
S 3-1-2-46
Table S 3.1.2.23 (2) Diagnosis Sheet of Chlorination Facilities
Division No. Name Operation Status Condition, Appearance Judgment
1 Cylinder scale No operational problem Remarkably deteriorated, poor preci-
sion C2
2 Gas filter No operational problem Remarkably deteriorated C2
3 Gas meter No operational problem Remarkably deteriorated C2 4 Ejector No operational problem Remarkably deteriorated C2
No.1
5 Safety equipment No operational problem Remarkable deteriorated C2
1 Cylinder scale No operational problem Remarkably deteriorated, poor preci-
sion C2
2 Gas filter No operational problem Remarkably deteriorated C2 3 Gas meter No operational problem Remarkably deteriorated C2
4 Ejector No operational problem Remarkably deteriorated C2
No.2
5 Safely equipment No operational problem Remarkably deteriorated C2
vi) Electrical Facilities
Table S 3.1.2.24 (1) to (4) shows the list of electrical facilities and diagnosis result of these.
As shown in the table, the facilities in dark cells were not working for a long time.

Table S 3.1.2.24 (1) List of Electrical Faciulities and Diagnosis Results
No Facility Name Location Equipment Name Specification Inst Year Judgement
1Power Receiving Equipment andNo.1 Transformer Oil Immersed, Outdoor, 110/35/6 kV, 10000kVA 1971 B
2 No.2 Transformer Oil Immersed, Outdoor, 35/6 kV, 4000kVA 1971 B3 Feeder Panel No.1 (Panel No.1) DS+OCB, Indoor (To Transformer No.1) 1971 B4 Lighting Transformer (Panel No.2) 1971 B5 No.1 Incoming Panel (Panel No.3/5) DS+OCB, Indoor 1971 B6 No.1 Internal Use Transformer (Panel No.4) 1971 B7 No.1 Lightning Arrester (Panel No.6) 1971 B8 Feeder Panel No.3 (Panel No.7) DS+OCB, Indoor (To Transformer No.6) 1971 B9 Feeder Panel No.2 (Panel No.8) DS+OCB, Indoor (To No.2 Intake P/S -2) 1971 B
10 Bus Sectional Panel (Panel No.9) DS+OCB, Indoor 1971 B11 No.2 Internal Use Transformer (Panel No.10) 1971 B12 Feeder Panel No.7 (Panel No.12) DS+OCB, Indoor (To Transformer No.5) 1971 B13 Feeder Panel No.5 (Panel No.14) DS+OCB, Indoor (To No.1 Intake P/S -2) 1971 B14 Feeder Panel No.4 (Panel No.15) DS+OCB, Indoor (To 6kV Transformer No.4) 1971 B15 Feeder Panel No.6 (Panel No.16) DS+OCB, Indoor (To No.2 Intake P/S -1) 1971 B16 No.2 Incoming Panel (Panel No.17) DS+OCB, Indoor 1971 B
17Power Receiving Equipment andNo.1 Transformer Oil Immersed, Outdoor, 110/35/6 kV, 10000kVA 1975 B
18 No.2 Transformer Oil Immersed, Outdoor, 110/35/6 kV, 10000kVA 1989 B19 Feeder Panel No.1 (Panel No.1) DS+OCB, Indoor (To No.1 Intake P/S -1) 1975 B20 Feeder Panel No.2 (Panel No.2) DS+OCB, Indoor (To Transformer No.14) 1975 B21 No.1 Incoming Panel (Panel No.3) DS+VCB, Indoor (Frm No.1 Transformer) 1975 B22 No.1 Internal Use Transformer (Panel No.4) Oil Immersed, Indoor, 6/0.22 kV, 1975 B23 Feeder Panel No.3 (Panel No.5) DS+OCB, Indoor (To No.1 Distribution Panel) 1975 B24 Feeder Panel No.4 (Panel No.6) DS+OCB, Indoor (Standby) 1975 B25 No.1 GPT (Panel No.7) DS+PF, Indoor 1975 B26 Feeder Panel No.5 (Panel No.16) DS+OCB, Indoor (Standby) 1975 B27 Feeder Panel No.6 (Panel No.8) DS+OCB, Indoor (Sectional Panel) 1975 B28 No.1 GPT (Panel No.9) DS+PF, Indoor 1975 B29 Feeder Panel No.6 (Panel No.10) DS+OCB, Indoor (To No.1 Intake P/S -3) 1975 B30 Feeder Panel No.7 (Panel No.11) DS+OCB, Indoor (To No.2 Distribution Panel) 1975 B31 No.2 Incoming Panel (Panel No.12) DS+OCB, Indoor (From No.2 Transformer) 1975 B32 No.2 Internal Use Transformer (Panel No.13) Oil Immersed, Indoor, 6/0.22 kV, 1975 B33 Feeder Panel No.8 (Panel No.14) DS+OCB, Indoor (Standby) 1975 B34 Feeder Panel No.9 (Panel No.15) DS+OCB, Indoor (Standby) 1975 B35 No.1 Incoming Panel (Panel No.14) DS+OCB, Indoor (From No.2 S/S Panel No.2) 1975 B36 No.1 Pump Starter Panel (Panel No.1) DS+OCB, Indoor, 1000kW 1975 B37 No.2 Pump Starter Panel (Panel No.2) DS+OCB, Indoor, 1000kW 1975 B38 Feeder for Transformer (Panel No.12) DS+PF, Indoor 1975 B39 GPT+Lightning Arrester (Panel No.11) Indoor 1975 B40 No.2 Incoming Panel (Panel No.10) DS+OCB, Indoor (From No.1 S/S Panel No.14) 1975 B41 Bus Sectional Panel (Panel No.9) DS, Indoor (To Panel No.8) 1975 B42 Bus Sectional Panel (Panel No.8) DS+OCB, Indoor (To Panel No.8) 1975 B43 No.3 Incoming Panel (Panel No.7) DS+OCB, Indoor (From No.2 S/S Panel No.1) 1975 B44 GPT+Lightning Arrester (Panel No.6) Indoor 1975 B45 Feeder for Transformer (Panel No.5) DS+PF, Indoor 1975 B46 No.3 Pump Starter Panel (Panel No.3) DS+OCB, Indoor, 1000kW 1975 B47 No.4 Pump Starter Panel (Panel No.4) DS+OCB, Indoor, 1000kW 1975 B48 No.5 Pump Starter Panel (Panel No.13) DS+OCB, Indoor, 630kW 1975 B49 Feeder Panel (Panel No.15) DS+OCB, Indoor (Standby) 1975 B50 No.1 Internal Use Transformer Oil Immersed, Indoor, 6/0.4 kV, 160kVA 1975 B51 No.2 Internal Use Transformer Oil Immersed, Indoor, 6/0.4 kV, 160kVA 1975 B52 No.1 Pump Control Panel Indoor Self-stand 1975 C153 No.2 Pump Control Panel Indoor Self-stand 1975 C154 No.3 Pump Control Panel Indoor Self-stand 1975 C155 No.4 Pump Control Panel Indoor Self-stand 1975 C156 No.5 Pump Control Panel Indoor Self-stand 1975 C157 Valve Control Panel-1 Indoor Self-stand 1975 C158 Valve Control Panel-2 Indoor Self-stand 1975 C1
VremenayaPump
StationPump Station
S/S No.2
S/S No.1
PowerReceivingFacility
S 3-1-2-47^

Table S 3.1.2.24 (2) List of Electrical Faciulities and Diagnosis Results
No Facility Name Location Equipment Name Specification Inst Year Judgement
59 No.1 Pump Starter Panel DS+OCB, Indoor, 500kW 1975 C160 No.2 Pump Starter Panel DS+OCB, Indoor, 800kW 1975 C161 No.3 Pump Starter Panel DS+OCB, Indoor, 630kW 1975 C162 No.4 Pump Starter Panel DS+OCB, Indoor, 1000kW 1975 C163 No.5 Pump Starter Panel DS+OCB, Indoor, 1000kW 1975 C164 No.1 Pump Control Panel Indoor Self-stand 1975 C165 No.2 Pump Control Panel Indoor Self-stand 1975 C166 No.3 Pump Control Panel Indoor Self-stand 1975 C167 No.4 Pump Control Panel Indoor Self-stand 1975 C168 No.5 Pump Control Panel Indoor Self-stand 1975 C169 Valve Control Panel Indoor Self-stand 1975 C170 Monitoring Panel Indoor Self-stand 1975 C171 No.1 Transformer Kiosk Oil immersed, 6/0.38kV, 400kVA 1984 B72 No.2 Transformer Kiosk Oil immersed, 6/0.38kV, 100kVA 1989 B73 No.3 Transformer Kiosk Oil immersed, 6/0.38kV, 180kVA 1964 B74 No.4 Transformer Kiosk Oil immersed, 6/0.38kV, 100kVA x 2sets 1989 B75 No.5 Transformer Kiosk Oil immersed, 6/0.38kV, 180kVA 1977 B76 No.6 Transformer Kiosk Oil immersed, 6/0.38kV, 63kVA 1982 B77 No.7 Transformer Kiosk Oil immersed, 6/0.38kV, 100kVA 1989 B78 No.8 Transformer Kiosk Oil immersed, 6/0.38kV, 160kVA 1977 B79 No.9 Transformer Kiosk Oil immersed, 6/0.38kV, 160kVA 1977 B80 No.10 Transformer Kiosk Oil immersed, 6/0.38kV, 100kVA 1977 B81 No.11 Transformer Kiosk Oil immersed, 6/0.38kV, 180kVA 1964 B82 No.12 Transformer Kiosk Oil immersed, 6/0.38kV, 160kVA 1977 B83 No.13 Transformer Kiosk Oil immersed, 6/0.38kV, 180kVA 1977 B84 No.14 Transformer Kiosk Oil immersed, 6/0.38kV, 180kVA 1977 C185 No.15 Transformer Kiosk Oil immersed, 6/0.38kV, 100kVA 1989 C186 No.16 Transformer Kiosk Oil immersed, 6/0.38kV, 100kVA 1989 C287 No.17 Transformer Kiosk Oil immersed, 6/0.38kV, 100kVA 1989 C188 No.18 Transformer Kiosk Oil immersed, 6/0.38kV, 100kVA 1989 C189 No.19 Transformer Kiosk Oil immersed, 6/0.38kV, 100kVA 1989 C190 No.20 Transformer Kiosk Oil immersed, 6/0.38kV, 100kVA 1989 C191 No.21 Transformer Kiosk Oil immersed, 6/0.38kV, 100kVA 1984 C292 No.22 Transformer Kiosk Oil immersed, 6/0.38kV, 100kVA 1989 C293 No.23 Transformer Kiosk Oil immersed, 6/0.38kV, 100kVA 1989 C294 No.24 Transformer Kiosk Oil immersed, 6/0.38kV, 160kVA 1977 C195 No.25 Transformer Kiosk Oil immersed, 6/0.38kV, 100kVA 1989 C196 No.26 Transformer Kiosk Oil immersed, 6/0.38kV, 100kVA 1977 C297 No.26A Transformer Kiosk Oil immersed, 6/0.38kV, 100kVA 1977 C298 No.27 Transformer Kiosk Oil immersed, 6/0.38kV, 160kVA 1977 C299 No.28 Transformer Kiosk Oil immersed, 6/0.38kV, 100kVA 1977 C1100 No.29 Transformer Kiosk Oil immersed, 6/0.38kV, 100kVA 1977 C2101 No.29A Transformer Kiosk Oil immersed, 6/0.38kV, 100kVA 1989 C1102 No.30 Transformer Kiosk Oil immersed, 6/0.38kV, 100kVA 1989 C1103 No.31 Transformer Kiosk Oil immersed, 6/0.38kV, 100kVA 1989 C1104 No.32 Transformer Kiosk Oil immersed, 6/0.38kV, 100kVA 1977 C1105 No.33 Transformer Kiosk Oil immersed, 6/0.38kV, 100kVA 1989 C1106 No.34 Transformer Kiosk Oil immersed, 6/0.38kV, 100kVA 1989 C1107 No.35 Transformer Kiosk Oil immersed, 6/0.38kV, 100kVA 1989 C1108 No.36 Transformer Kiosk Oil immersed, 6/0.38kV, 100kVA 1989 C1109 No.37 Transformer Kiosk Oil immersed, 6/0.38kV, 100kVA 1989 C2110 No.37A Transformer Kiosk Oil immersed, 6/0.38kV, 100kVA 1989 C2111 No.38 Transformer Kiosk Oil immersed, 6/0.38kV, 100kVA 1989 C2112 No.39 Transformer Kiosk Oil immersed, 6/0.38kV, 100kVA 1989 C1113 No.39A Transformer Kiosk Oil immersed, 6/0.38kV, 100kVA 1989 C2114 No.40 Transformer Kiosk Oil immersed, 6/0.38kV, 160kVA 1989 C1115 No.41 Transformer Kiosk Oil immersed, 6/0.38kV, 100kVA 1989 C1116 No.42 Transformer Kiosk Oil immersed, 6/0.38kV, 100kVA 1989 C1117 No.43 Transformer Kiosk Oil immersed, 6/0.38kV, 100kVA 1989 C1118 No.44 Transformer Kiosk Oil immersed, 6/0.38kV, 160kVA 1989 C1119 No.45 Transformer Kiosk Oil immersed, 6/0.38kV, 100kVA 1989 C1120 No.46 Transformer Kiosk Oil immersed, 6/0.38kV, 100kVA 1989 C1121 No.47 Transformer Kiosk Oil immersed, 6/0.38kV, 100kVA 1989 C1122 No.48 Transformer Kiosk Oil immersed, 6/0.38kV, 100kVA 1989 C2123 No.49 Transformer Kiosk Oil immersed, 6/0.38kV, 100kVA 1989 C1124 No.50 Transformer Kiosk Oil immersed, 6/0.38kV, 100kVA 1977 C2
No.2 PumpStation
Pump Station
Each WellPump
Station
Well PumpStation
S 3-1-2-48^

Table S 3.1.2.24 (3) List of Electrical Faciulities and Diagnosis Results
No Facility Name Location Equipment Name Specification Inst Year Judgement
125 No.51 Transformer Kiosk Oil immersed, 6/0.38kV, 160kVA 1989 C2126 No.52 Transformer Kiosk Oil immersed, 6/0.38kV, 100kVA 1989 C2127 No.53 Transformer Kiosk Oil immersed, 6/0.38kV, 160kVA 1989 C1128 No.54 Transformer Kiosk Oil immersed, 6/0.38kV, 160kVA 1989 C2129 No.55 Transformer Kiosk Oil immersed, 6/0.38kV, 160kVA 1989 C1130 No.56 Transformer Kiosk Oil immersed, 6/0.38kV, 160kVA 1989 C1131 No.57 Transformer Kiosk Oil immersed, 6/0.38kV, 100kVA 1989 C2132 No.58 Transformer Kiosk Oil immersed, 6/0.38kV, 320kVA 1967 C1133 No.58A Transformer Kiosk Oil immersed, 6/0.38kV, 100kVA 1980 C1134 No.59 Transformer Kiosk Oil immersed, 6/0.38kV, 250kVA 1977 C1135 No.59A Transformer Kiosk Oil immersed, 6/0.38kV, 160kVA 1977 C1136 No.60 Transformer Kiosk Oil immersed, 6/0.38kV, 180kVA 1977 C2137 No.61 Transformer Kiosk Oil immersed, 6/0.38kV, 160kVA 1977 C1138 No.62 Transformer Kiosk Oil immersed, 6/0.38kV, 250kVA 1977 C1139 No.63 Transformer Kiosk Oil immersed, 6/0.38kV, 180kVA 1977 C2140 No.64 Transformer Kiosk Oil immersed, 6/0.38kV, 100kVA 1989 C1141 No.65 Transformer Kiosk Oil immersed, 6/0.38kV, 100kVA 1989 C1142 No.1 Well Pump Control Panel Self-stand, Indoor, 75kW 1962 C1143 No.2 Well Pump Control Panel Self-stand, Indoor, 75kW 1960 C1144 No.3 Well Pump Control Panel Self-stand, Indoor, 45kW 1961 C1145 No.4 Well Pump Control Panel Self-stand, Indoor, 75kW 1958 C1146 No.5 Well Pump Control Panel Self-stand, Indoor, 75kW 1958 C1147 No.6 Well Pump Control Panel Self-stand, Indoor, 75kW 1958 C1148 No.7 Well Pump Control Panel Self-stand, Indoor, 75kW 1955 C1149 No.8 Well Pump Control Panel Self-stand, Indoor, 75kW 1957 C1150 No.9 Well Pump Control Panel Self-stand, Indoor, 75kW 1956 C1151 No.10 Well Pump Control Panel Self-stand, Indoor, 75kW 1959 C1152 No.11 Well Pump Control Panel Self-stand, Indoor, 75kW 1962 C1153 No.12 Well Pump Control Panel Self-stand, Indoor, 75kW 1958 C1154 No.13 Well Pump Control Panel Self-stand, Indoor, 75kW 1958 C1155 No.14 Well Pump Control Panel Self-stand, Indoor, 1960 C1156 No.14a Well Pump Control Panel Self-stand, Indoor, 45kW 1966 C1157 No.15 Well Pump Control Panel Self-stand, Indoor, 75kW 1964 C1158 No.16 Well Pump Control Panel Self-stand, Indoor, 75kW 1966 C1159 No.17 Well Pump Control Panel Self-stand, Indoor, 75kW 1966 C1160 No.18 Well Pump Control Panel Self-stand, Indoor, 75kW 1966 C1161 No.19 Well Pump Control Panel Self-stand, Indoor, 75kW 1965 C1162 No.20 Well Pump Control Panel Self-stand, Indoor, 75kW 1965 C1163 No.21 Well Pump Control Panel Self-stand, Indoor, 75kW 1966 C1164 No.22 Well Pump Control Panel Self-stand, Indoor, 45kW 1967 C2165 No.23 Well Pump Control Panel Self-stand, Indoor, 75kW C1166 No.24 Well Pump Control Panel Self-stand, Indoor, 75kW 1967 C1167 No.25 Well Pump Control Panel Self-stand, Indoor, 75kW 1967 C1168 No.26 Well Pump Control Panel Self-stand, Indoor, 75kW 1968 C1169 No.27 Well Pump Control Panel Self-stand, Indoor, 75kW 1968 C1170 No.28 Well Pump Control Panel Self-stand, Indoor, 75kW 1969 C1171 No.29 Well Pump Control Panel Self-stand, Indoor, 75kW 1969 C1172 No.30 Well Pump Control Panel Self-stand, Indoor, 100kW 1969 C2173 No.31 Well Pump Control Panel Self-stand, Indoor, 75kW 1969 C1174 No.32 Well Pump Control Panel Self-stand, Indoor, 45kW 1969 C1175 No.33 Well Pump Control Panel Self-stand, Indoor, 75kW 1969 C1176 No.34 Well Pump Control Panel Self-stand, Indoor, 75kW 1969 C1177 No.35 Well Pump Control Panel Self-stand, Indoor, 75kW 1969 C1178 No.36 Well Pump Control Panel Self-stand, Indoor, 75kW 1969 C1179 No.37 Well Pump Control Panel Self-stand, Indoor, 75kW 1969 C1180 No.38 Well Pump Control Panel Self-stand, Indoor, 75kW C1181 No.39 Well Pump Control Panel Self-stand, Indoor, 75kW C2182 No.40 Well Pump Control Panel Self-stand, Indoor, 75kW C2183 No.41 Well Pump Control Panel Self-stand, Indoor, 75kW 1969 C2184 No.42 Well Pump Control Panel Self-stand, Indoor, 75kW 1967 C1185 No.43 Well Pump Control Panel Self-stand, Indoor, 45kW C2186 No.44 Well Pump Control Panel Self-stand, Indoor, 75kW 1969 C1187 No.45 Well Pump Control Panel Self-stand, Indoor, 76kW
Each WellPump
Station
Well PumpStation
S 3-1-2-49^

Table S 3.1.2.24 (4) List of Electrical Faciulities and Diagnosis Results
No Facility Name Location Equipment Name Specification Inst Year Judgement
188 No.46 Well Pump Control Panel Self-stand, Indoor, 75kW 1969 C2189 No.47 Well Pump Control Panel Self-stand, Indoor, 75kW 1969 C1190 No.48 Well Pump Control Panel Self-stand, Indoor, 75kW 1969 C1191 No.49 Well Pump Control Panel Self-stand, Indoor, 75kW 1969 C1192 No.50 Well Pump Control Panel Self-stand, Indoor, 75kW 1970 C1193 No.51 Well Pump Control Panel Self-stand, Indoor, 75kW 1970 C2194 No.52 Well Pump Control Panel Self-stand, Indoor, 75kW 1969 C1195 No.53 Well Pump Control Panel Self-stand, Indoor, 75kW 1972 C2196 No.54 Well Pump Control Panel Self-stand, Indoor, 75kW 1972 C2197 No.55 Well Pump Control Panel Self-stand, Indoor, 45kW 1972 C2198 No.56 Well Pump Control Panel Self-stand, Indoor, 75kW 1969 C2199 No.57 Well Pump Control Panel Self-stand, Indoor, 75kW 1969 C2200 No.58 Well Pump Control Panel Self-stand, Indoor, 75kW 1967 C2201 No.59 Well Pump Control Panel Self-stand, Indoor, 75kW 1967 C1202 No.60 Well Pump Control Panel Self-stand, Indoor, 75kW 1969 C1203 No.61 Well Pump Control Panel Self-stand, Indoor, 75kW 1972 C2204 No.62 Well Pump Control Panel Self-stand, Indoor, 75kW 1972 C1205 No.63 Well Pump Control Panel Self-stand, Indoor, 75kW 1971 C2206 No.64 Well Pump Control Panel Self-stand, Indoor, 75kW 1968 C2207 No.65 Well Pump Control Panel Self-stand, Indoor, 45kW 1976 C2208 No.66 Well Pump Control Panel Self-stand, Indoor, 75kW 1980 C2209 No.67 Well Pump Control Panel Self-stand, Indoor, 45kW 1980 C2210 No.68 Well Pump Control Panel Self-stand, Indoor, 45kW 1980 C2211 No.69 Well Pump Control Panel Self-stand, Indoor, 45kW 1980 C1212 No.70 Well Pump Control Panel Self-stand, Indoor, 45kW 1980 C2213 No.71 Well Pump Control Panel Self-stand, Indoor, 45kW 1980 C2214 No.72 Well Pump Control Panel Self-stand, Indoor, 75kW 1980 C2215 No.73 Well Pump Control Panel Self-stand, Indoor, 75kW 1980 C2216 No.74 Well Pump Control Panel Self-stand, Indoor, 45kW 1980 C2217 No.75 Well Pump Control Panel Self-stand, Indoor, 75kW 1980 C2218 No.76 Well Pump Control Panel Self-stand, Indoor, 75kW 1980 C2219 No.77 Well Pump Control Panel Self-stand, Indoor, 75kW 1980 C1220 No.78 Well Pump Control Panel Self-stand, Indoor, 45kW 1980 C2221 No.79 Well Pump Control Panel Self-stand, Indoor, 45kW 1980 C1222 No.80 Well Pump Control Panel Self-stand, Indoor, 45kW 1980 C2223 No.81 Well Pump Control Panel Self-stand, Indoor, 45kW 1980 C2224 No.1G Well Pump Control Panel Self-stand, Indoor, 45kW 1990 C1225 No.2G Well Pump Control Panel Self-stand, Indoor, 75kW 1990 C2226 No.3G Well Pump Control Panel Self-stand, Indoor, 75kW 1994 C2227 No.4G Well Pump Control Panel Self-stand, Indoor, 75kW 1992 C2228 No.1P Well Pump Control Panel 1980 C2229 No.2P Well Pump Control Panel 1980 C2230 No.3P Well Pump Control Panel Self-stand, Indoor, 45kW 1980 C2231 No.4P Well Pump Control Panel C2232 No.5P Well Pump Control Panel C2233 No.6P Well Pump Control Panel C2234 No.7P Well Pump Control Panel C2235 No.8P Well Pump Control Panel C2236 No.9P Well Pump Control Panel C2237 No.10P Well Pump Control Panel C2238 No.11P Well Pump Control Panel C2239 No.12P Well Pump Control Panel C2240 No.13P Well Pump Control Panel C2241 No.14P Well Pump Control Panel C2242 No.15P Well Pump Control Panel C2243 No.16P Well Pump Control Panel 1980 C2244 No.33P Well Pump Control Panel 1996 C1245 No.34P Well Pump Control Panel 1996 C2246 No.35P Well Pump Control Panel 1996 C2247 No.36P Well Pump Control Panel C2248 No.1 Distribution Panel Self-stand, DS, Outdoor C1249 No.2 Distribution Panel Self-stand, DS, Outdoor C1250 No.2 Distribution OCB Panel Self-stand, OCB, Outdoor C1251 No.3 Distribution Panel Self-stand, DS, Outdoor C1252 No.3 Distribution OCB Panel Self-stand, OCB, Outdoor C1
Well PumpStation
Cross theRiver
PowerDistribution
Facility
Each WellPump
Station
S 3-1-2-50^

The Study on Restructuring of Water Supply System Volume 3. Supporting Report of Tashkent City in the Republic of Uzbekistan March 2006
S 3-1-2-51
2) South, Sergeli, Kara-su, Kuiluk and Bectemir WTPs
i) Diagnosis for Capacity of WTPs
The design capacity and the investigated actual capacity of WTPs are shown in Table S
3.1.2.25.
Table S 3.1.2.25 Capacity of WTPs South
Nominal Capacity 5,958 m3/hr 143,000 m3/day Maximum intake capacity 12,500 m3/hr 300,000 m3/day Well number 41 units Distribution capacity 4,500 m3/hr 108,000 m3/day Chlorination capacity 10 kg/day
Design Capacity
Service reservoir 10,000 m3 1.68 hr Maximum intake capacity 8,250 m3/hr 198,000 m3/day Operating well number 27 units
Current Function
Distribution capacity 7600 m3/hr 182,400 m3/day Sergeli
Nominal Capacity 1,667 m3/hr 40,000 m3/day Maximum intake capacity 1,875 m3/hr 45,000 m3/day Well number 9 units Distribution capacity 4,070 m3/hr 97,680 m3/day Chlorination capacity 10 kg/day
Design Capacity
Service reservoir 4,000 m3 2.40 hr Maximum intake capacity 1,292 m3/hr 31,000 m3/day Operating well number 8 units
Current function
Distribution capacity 2,000 m3/hr 48,000 m3/day Kara-su
Nominal Capacity 2,167 m3/hr 52,000 m3/day Maximum intake capacity 2,192 m3/hr 52,600 m3/day Well number 11 units
Design Capacity
Chlorination capacity 2 kg/day Maximum intake capacity 1,196 m3/hr 28,700 m3/day Current function Operating well number 6 units
Kuiluk Nominal Capacity 833 m3/hr 20,000 m3/day Maximum intake capacity 2,000 m3/hr 48,000 m3/day Well number 9 units
Design Capacity
Chlorination capacity 2 kg/day Maximum intake capacity 1,092 m3/hr 26,200 m3/day Current function Operating well number 9 units
Bectemir Nominal Capacity 833 m3/hr 20,000 m3/day Maximum intake capacity 1,000 m3/hr 24,000 m3/day Well number 11 units Distribution capacity 1,020 m3/hr 26,200 m3/day Chlorination capacity 1 kg/hr
Design Capacity
Service reservoir 1,000 m3 1.20 hr Maximum intake capacity m3/hr 11,000 m3/day Operating well number m3/hr 5 units
Current function
Distribution capacity 1,020 m3/hr 26,200 m3/day

The Study on Restructuring of Water Supply System Volume 3. Supporting Report of Tashkent City in the Republic of Uzbekistan March 2006
S 3-1-2-52
ii) Diagnosis for Civil Structures and Buildings
Major civil structures and buildings of WTP are listed in Table S 3.1.2.26 (1).
Diagnosis results of these are shown in Table S 3.1.2.26 (2).
Table S 3.1.2.26 (1) List of Civil Structures and Building
WTP Name
Name Type Dimension Area (m2) Volume (m3) Number
Reservoir Concrete W24mxL20m 2,500 2 Distribution PS building Brick W9mxL40m 360 1
Disinfection building Brick W6mxL10m 60
South
Administration building Brick 20mx40m 800 1 Reservoir Concrete 2,000 2 Distribution PS building Brick W12mxL24m 288 1 Disinfection building Brick W6mxL12m 72 1 Administration building Brick 12mx24mx2stories 576 1
Sergeli
Laboratory building Brick 10mx20m 200 1 Kara-su Administration building Brick 12mx24mx2stories 576 Kuiluk Administration building Brick 8mx30m 240 1
Reservoir Concrete 1,000 1 Distribution PS building Brick W5mxL12m 60 1
Bectemir
Administration building Brick 6mx12m 72 1
iii) Wells
Structures and pumping test results, pumps and operation status, and maintenance status and
rehabilitation of wells at South WTP are shown in Table S3.1.2.27 (1) to (4).
These at Sergeli WTP are shown in Table S 3.1.2.28 (1) to (3). Structures and pumping test
results, and pumps and operation status at Kuiluk WTP are shown in Table S 3.1.2.28 (1) and
(2). The data for Kara-su and Bectemir could not be obtained.
The results of diagnosis are summarized in Tables S 3.1.2.29. Capacities of these wells at
each WTP are decreasing, and majority of quantity of each well has problems as drinking
water.

The Study on Restructuring of Water Supply System Volume 3. Supporting Report of Tashkent City in the Republic of Uzbekistan March 2006
S 3-1-2-53
Table S 3.1.2.26 (2) Diagonosis Sheet for outh, Seregeli, Kara-su, Kuiluk and Bectemir WTP
Quality Appearance Crack Split Leakage Appearance ErosionNo.1 Reservoir B B NO NO NO B NO B C 1961
No.2 Reservoir B B NO NO NO B NO B C 1961
No.1 Reservoir B B NO NO NO B NO B C 1977
No.2 Reservoir B B NO NO NO B NO B C 1977
Quality Appearance Crack Split Leakage Appearance Crack LeakageSouth Distribution P/S C B B NO NO NO C NO YES
Sergeli Distribution P/S C B B NO NO NO C NO YES
Bectemir Distribution P/S C C C YES NO NO C YES YES
Doors Windows Glass Ventilator Step Steel floor Lighting
South Distribution P/S C C C C C C C 1962
Sergeli Distribution P/S C C C C C C C 1977
Bectemir Distribution P/S C C C C C C C 1973
Appearance Crack Appearance Crack Leakage
Administration B C NO C NO YES Doors、Windows、Glass
1961
Disinfection B C NO C NO YES Doors、Windows、Glass
1961
Administration B C NO C NO YES Doors、Windows、Glass
1977
Disinfection B C NO C NO YES Doors、Windows、Glass
1977
Laboratory B C NO C NO YES Doors、Windows、Glass
1977
Bectemir Administration B C NO C NO YES Doors、Windows、Glass
1973
Kuiluk Administration B C NO C NO YES Doors、Windows、Glass
1964
Kara-su Administration B C NO C NO YES Doors、Windows、Glass
1946Both internal and external building have deterioratedremarkably. Especially ceiling is seriously deteriorated.
Both internal and external building have deterioratedremarkably. Especially ceiling is seriously deteriorated.
Both internal and external building have deterioratedremarkably. Especially ceiling is seriously deteriorated.
Both internal and external building have deterioratedremarkably. Especially ceiling is seriously deteriorated.
Both internal and external building have deterioratedremarkably. Especially ceiling is seriously deteriorated.
Concrete Cover soil
South
Sergeli
Both internal and external building have deterioratedremarkably. Especially ceiling is seriously deteriorated.
Name
IP
South
Sergeli
Facility
Name
Name
Const.yearOthersPipes
Const.year
Ventilator
Roof
Equipment
*Both inner and outer building as well as ceilinghave deteriorated remarkably.
Const.yearFitting
Equipment
Inner condition wasnot examined becauseof filled water ,butreportedly in faircondition throughhearing survey.
Both internal and external building have deterioratedremarkably. Especially ceiling is seriously deteriorated.
Both internal and external building have deterioratedremarkably. Especially ceiling is seriously deteriorated.
Concretefloor
-
-
Brick wall-
Others
OtherBuilding
Fitting
Roof
Facility Name
Brick wallFacility Concretefloor
Facilities
Facilities
Facilities
P/SBuilding
Reservoir
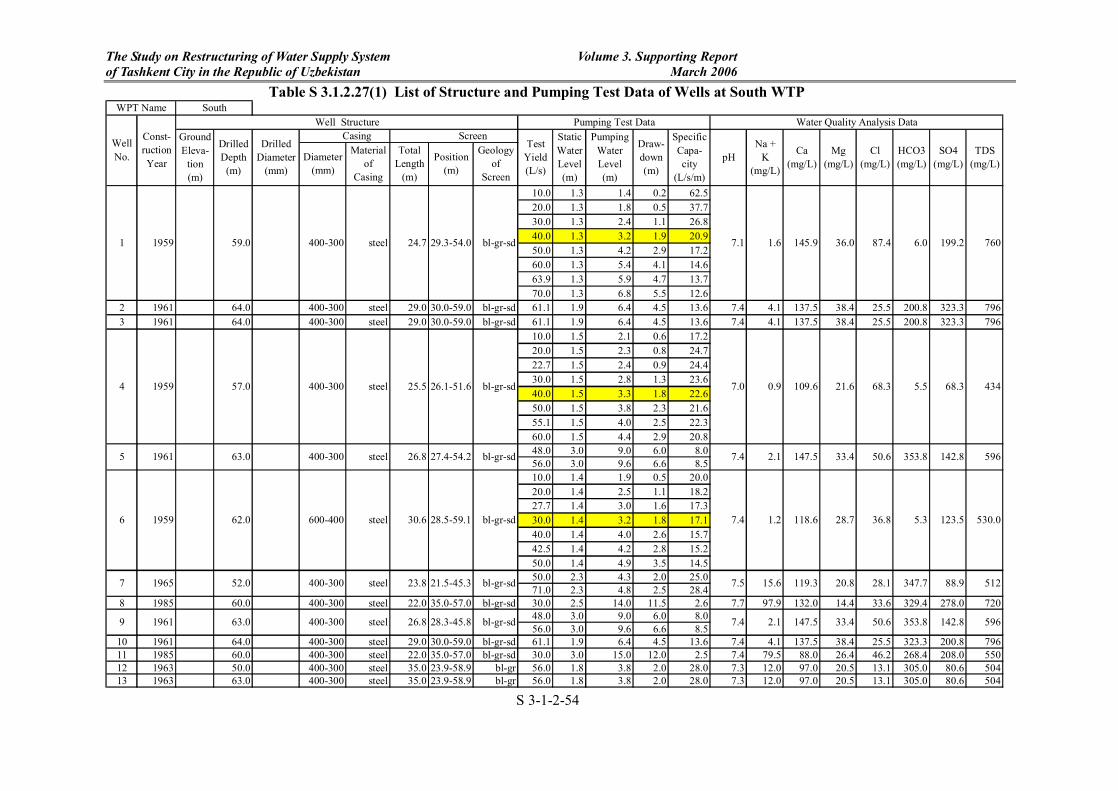
The Study on Restructuring of Water Supply System Volume 3. Supporting Report of Tashkent City in the Republic of Uzbekistan March 2006
S 3-1-2-54
10.0 1.3 1.4 0.2 62.520.0 1.3 1.8 0.5 37.730.0 1.3 2.4 1.1 26.840.0 1.3 3.2 1.9 20.950.0 1.3 4.2 2.9 17.260.0 1.3 5.4 4.1 14.663.9 1.3 5.9 4.7 13.770.0 1.3 6.8 5.5 12.6
2 1961 64.0 400-300 steel 29.0 30.0-59.0 bl-gr-sd 61.1 1.9 6.4 4.5 13.6 7.4 4.1 137.5 38.4 25.5 200.8 323.3 7963 1961 64.0 400-300 steel 29.0 30.0-59.0 bl-gr-sd 61.1 1.9 6.4 4.5 13.6 7.4 4.1 137.5 38.4 25.5 200.8 323.3 796
10.0 1.5 2.1 0.6 17.220.0 1.5 2.3 0.8 24.722.7 1.5 2.4 0.9 24.430.0 1.5 2.8 1.3 23.640.0 1.5 3.3 1.8 22.650.0 1.5 3.8 2.3 21.655.1 1.5 4.0 2.5 22.360.0 1.5 4.4 2.9 20.848.0 3.0 9.0 6.0 8.056.0 3.0 9.6 6.6 8.510.0 1.4 1.9 0.5 20.020.0 1.4 2.5 1.1 18.227.7 1.4 3.0 1.6 17.330.0 1.4 3.2 1.8 17.140.0 1.4 4.0 2.6 15.742.5 1.4 4.2 2.8 15.250.0 1.4 4.9 3.5 14.550.0 2.3 4.3 2.0 25.071.0 2.3 4.8 2.5 28.4
8 1985 60.0 400-300 steel 22.0 35.0-57.0 bl-gr-sd 30.0 2.5 14.0 11.5 2.6 7.7 97.9 132.0 14.4 33.6 329.4 278.0 72048.0 3.0 9.0 6.0 8.056.0 3.0 9.6 6.6 8.5
10 1961 64.0 400-300 steel 29.0 30.0-59.0 bl-gr-sd 61.1 1.9 6.4 4.5 13.6 7.4 4.1 137.5 38.4 25.5 323.3 200.8 79611 1985 60.0 400-300 steel 22.0 35.0-57.0 bl-gr-sd 30.0 3.0 15.0 12.0 2.5 7.4 79.5 88.0 26.4 46.2 268.4 208.0 55012 1963 50.0 400-300 steel 35.0 23.9-58.9 bl-gr 56.0 1.8 3.8 2.0 28.0 7.3 12.0 97.0 20.5 13.1 305.0 80.6 50413 1963 63.0 400-300 steel 35.0 23.9-58.9 bl-gr 56.0 1.8 3.8 2.0 28.0 7.3 12.0 97.0 20.5 13.1 305.0 80.6 504
123.5 530.0
25.5 26.1-51.6 bl-gr-sd 7.0
bl-gr-sd 7.4 1.228.5-59.1
199.2 760145.9 36.0 87.4 6.029.3-54.0 bl-gr-sd 7.1 1.6400-300 steel 24.71 1959 59.0
512119.3 20.8 28.1 347.7bl-gr-sd 7.5 15.6 88.9
596
7 1965 52.0 400-300 steel 23.8 21.5-45.3
33.4 50.6 353.8 142.89 1961 63.0 400-300 steel 26.8 28.3-45.8 bl-gr-sd 7.4 2.1 147.5
118.6 28.7 36.8 5.3
Water Quality Analysis Data
TDS(mg/L)
South
TestYield(L/s)
Table S 3.1.2.27(1) List of Structure and Pumping Test Data of Wells at South WTPWPT Name
WellNo.
Const-ructionYear
Well Structure Pumping Test DataGroundEleva-
tion(m)
DrilledDiameter
(mm)
Casing Screen StaticWaterLevel(m)
Mg(mg/L)
Cl(mg/L)
PumpingWaterLevel(m)
Draw-down(m)
SpecificCapa-city
(L/s/m)
pHDrilledDepth
(m)
HCO3(mg/L)
SO4(mg/L)
Diameter(mm)
Materialof
Casing
TotalLength
(m)
Position(m)
Geologyof
Screen
Na +K
(mg/L)
Ca(mg/L)
62.0 600-400 steel 30.6
4 1959
6 1959
57.0 400-300 steel
7.4 2.1
68.3
142.8
4340.9 109.6 21.6 68.3 5.5
59626.8steel 147.5 33.4 50.6 353.827.4-54.2 bl-gr-sd19615 400-30063.0

The Study on Restructuring of Water Supply System Volume 3. Supporting Report of Tashkent City in the Republic of Uzbekistan March 2006
S 3-1-2-55
85.0 2.8 6.0 3.2 26.6113.0 2.8 6.7 3.9 29.056.0 3.8 4.9 1.1 50.962.0 3.8 5.0 1.2 51.7
16 1965 60.0 400-300 steel 32.5 19.4-51.9 bl-gr-sd 65.8 4.5 7.8 3.3 19.9 7.4 8.1 99.4 17.6 9.8 305.0 70.8 48071.0 2.6 4.0 1.4 50.783.0 2.6 4.1 1.5 55.327.5 2.7 14.5 11.8 2.333.0 2.7 17.0 14.3 2.350.0 3.0 4.0 1.0 50.066.0 3.0 4.3 1.3 50.855.0 3.8 5.5 1.7 33.365.8 3.8 5.6 1.8 37.666.6 3.5 4.7 1.2 55.572.2 3.5 4.8 1.3 55.5
22 1991 50.0 426 325 steel 20.0 25.0-45.0 bl-gr-sd 12.6 3.2 4.4 1.2 10.523 1991 50.0 426 325 steel 20.0 25.0-45.0 bl-gr-sd 12.6 3.2 4.4 1.2 10.53P 1997 50.0 400-3004P 1997 50.0 400-3005P 1997 50.0 400-3006P 1997 50.0 400-3007P 1997 50.0 400-3008P 1997 50.0 400-3009P 1997 50.0 400-30010P 1997 50.0 400-30011P 1997 50.0 400-30012P 1997 50.0 400-30013P 1997 50.0 400-30014P 1997 50.0 400-30015P 1997 50.0 400-30016P 1997 50.0 400-3002A 1992 50.0 400-3003A 1992 50.0 400-3004A 1992 50.0 400-3005A 1992 50.0 400-300
308.123.0-62.0 bl-gr-sd 7.3 8.1400-300 steel 39.015 1964 65.0
448
47.9 51299.7 21.6 17.4
18.7 11.2 311.1 79.0bl-gr-sd 7.6 11.7 101.3
624
17 1965 60.6 400-300 steel 35.2 19.3-54.5
32.3 5.9 219.6 182.7bl-gr-sd 7.4 2.3 96.4
456
18 1961 65.0 400-300 steel 27.2 30.0-57.2
steel 34.7 12.6 280.6
bl-gr-sd 7.4
21.2-55.9 bl-gr-sd 7.4 15.6 97.6 18.7 102.0
20 488
432
19 1965 62.0 400-300
311.1 91.317.7 104.9 17.6 15.518.6-54.535.91965 60.5 400-300 steel
37.2 69.9bl-gr-sd20.6-54.4 104.0 19.2 11.9 317.2400-300 steel 7.533.821 1965 61.0
400-300 steel 33.614 1963 61.0 22.4-56.0 bl-gr 7.4 22.3 93.8 50899.7 19.4 17.2 311.1
Table S 3.1.2.27(2) List of Structure and Pumping Test Data of Wells at South WTPWPT Name South
WellNo.
Const-ructionYear
Well Structure Pumping Test Data Water Quality Analysis DataGroundEleva-
tion(m)
DrilledDepth
(m)
DrilledDiameter
(mm)
Casing ScreenTest
Yield(L/s)
Diameter(mm)
Materialof
Casing
TotalLength
(m)
Position(m)
Geologyof
Screen
StaticWaterLevel(m)
PumpingWaterLevel(m)
Draw-down(m)
SpecificCapa-city
(L/s/m)
pHNa +
K(mg/L)
Ca(mg/L)
Mg(mg/L)
Cl(mg/L)
HCO3(mg/L)
SO4(mg/L)
TDS(mg/L)
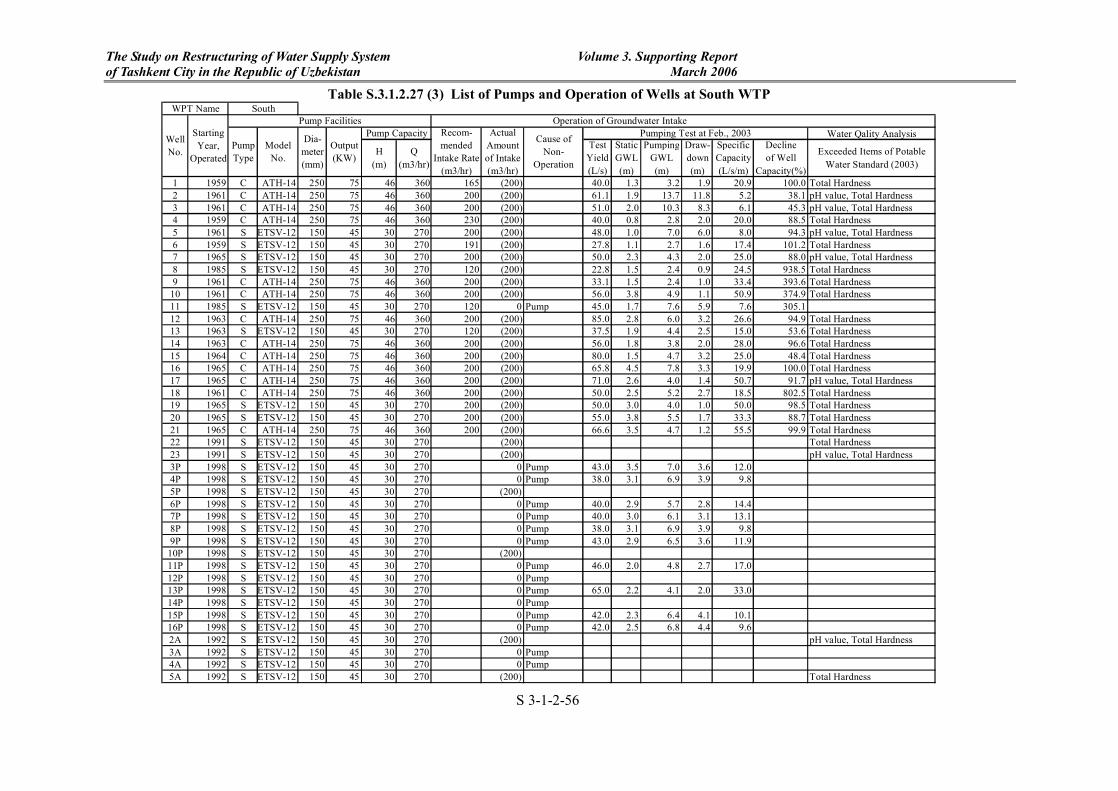
The Study on Restructuring of Water Supply System Volume 3. Supporting Report of Tashkent City in the Republic of Uzbekistan March 2006
S 3-1-2-56
Water Qality Analysis
1 1959 C ATH-14 250 75 46 360 165 (200) 40.0 1.3 3.2 1.9 20.9 100.0 Total Hardness2 1961 C ATH-14 250 75 46 360 200 (200) 61.1 1.9 13.7 11.8 5.2 38.1 pH value, Total Hardness3 1961 C ATH-14 250 75 46 360 200 (200) 51.0 2.0 10.3 8.3 6.1 45.3 pH value, Total Hardness4 1959 C ATH-14 250 75 46 360 230 (200) 40.0 0.8 2.8 2.0 20.0 88.5 Total Hardness5 1961 S ETSV-12 150 45 30 270 200 (200) 48.0 1.0 7.0 6.0 8.0 94.3 pH value, Total Hardness6 1959 S ETSV-12 150 45 30 270 191 (200) 27.8 1.1 2.7 1.6 17.4 101.2 Total Hardness7 1965 S ETSV-12 150 45 30 270 200 (200) 50.0 2.3 4.3 2.0 25.0 88.0 pH value, Total Hardness8 1985 S ETSV-12 150 45 30 270 120 (200) 22.8 1.5 2.4 0.9 24.5 938.5 Total Hardness9 1961 C ATH-14 250 75 46 360 200 (200) 33.1 1.5 2.4 1.0 33.4 393.6 Total Hardness
10 1961 C ATH-14 250 75 46 360 200 (200) 56.0 3.8 4.9 1.1 50.9 374.9 Total Hardness11 1985 S ETSV-12 150 45 30 270 120 0 Pump 45.0 1.7 7.6 5.9 7.6 305.112 1963 C ATH-14 250 75 46 360 200 (200) 85.0 2.8 6.0 3.2 26.6 94.9 Total Hardness13 1963 S ETSV-12 150 45 30 270 120 (200) 37.5 1.9 4.4 2.5 15.0 53.6 Total Hardness14 1963 C ATH-14 250 75 46 360 200 (200) 56.0 1.8 3.8 2.0 28.0 96.6 Total Hardness15 1964 C ATH-14 250 75 46 360 200 (200) 80.0 1.5 4.7 3.2 25.0 48.4 Total Hardness16 1965 C ATH-14 250 75 46 360 200 (200) 65.8 4.5 7.8 3.3 19.9 100.0 Total Hardness17 1965 C ATH-14 250 75 46 360 200 (200) 71.0 2.6 4.0 1.4 50.7 91.7 pH value, Total Hardness18 1961 C ATH-14 250 75 46 360 200 (200) 50.0 2.5 5.2 2.7 18.5 802.5 Total Hardness19 1965 S ETSV-12 150 45 30 270 200 (200) 50.0 3.0 4.0 1.0 50.0 98.5 Total Hardness20 1965 S ETSV-12 150 45 30 270 200 (200) 55.0 3.8 5.5 1.7 33.3 88.7 Total Hardness21 1965 C ATH-14 250 75 46 360 200 (200) 66.6 3.5 4.7 1.2 55.5 99.9 Total Hardness22 1991 S ETSV-12 150 45 30 270 (200) Total Hardness23 1991 S ETSV-12 150 45 30 270 (200) pH value, Total Hardness3P 1998 S ETSV-12 150 45 30 270 0 Pump 43.0 3.5 7.0 3.6 12.04P 1998 S ETSV-12 150 45 30 270 0 Pump 38.0 3.1 6.9 3.9 9.85P 1998 S ETSV-12 150 45 30 270 (200)6P 1998 S ETSV-12 150 45 30 270 0 Pump 40.0 2.9 5.7 2.8 14.47P 1998 S ETSV-12 150 45 30 270 0 Pump 40.0 3.0 6.1 3.1 13.18P 1998 S ETSV-12 150 45 30 270 0 Pump 38.0 3.1 6.9 3.9 9.89P 1998 S ETSV-12 150 45 30 270 0 Pump 43.0 2.9 6.5 3.6 11.9
10P 1998 S ETSV-12 150 45 30 270 (200)11P 1998 S ETSV-12 150 45 30 270 0 Pump 46.0 2.0 4.8 2.7 17.012P 1998 S ETSV-12 150 45 30 270 0 Pump13P 1998 S ETSV-12 150 45 30 270 0 Pump 65.0 2.2 4.1 2.0 33.014P 1998 S ETSV-12 150 45 30 270 0 Pump15P 1998 S ETSV-12 150 45 30 270 0 Pump 42.0 2.3 6.4 4.1 10.116P 1998 S ETSV-12 150 45 30 270 0 Pump 42.0 2.5 6.8 4.4 9.62A 1992 S ETSV-12 150 45 30 270 (200) pH value, Total Hardness3A 1992 S ETSV-12 150 45 30 270 0 Pump4A 1992 S ETSV-12 150 45 30 270 0 Pump5A 1992 S ETSV-12 150 45 30 270 (200) Total Hardness
Exceeded Items of PotableWater Standard (2003)
Pump Facilities
PumpType
Operation of Groundwater Intake
Declineof Well
Capacity(%)
TestYield(L/s)
SpecificCapacity(L/s/m)
StaticGWL(m)
PumpingGWL(m)
Draw-down(m)
Cause ofNon-
OperationH
(m)
Dia-meter(mm)
Output(KW)
ActualAmountof Intake(m3/hr)
SouthTable S.3.1.2.27 (3) List of Pumps and Operation of Wells at South WTP
Pump Capacity Recom-mended
Intake Rate(m3/hr)
WPT Name
WellNo.
StartingYear,
OperatedQ
(m3/hr)
ModelNo.
Pumping Test at Feb., 2003

The Study on Restructuring of Water Supply System Volume 3. Supporting Report of Tashkent City in the Republic of Uzbekistan March 2006
S 3-1-2-57
1 1959 Pump 0.5 2002 2 Air Lifting2 1961 Pump 1 2003 2 Air Lifting3 1961 Pump 1 2003 2 Air Lifting4 1959 Pump 0.5 2002 2 Air Lifting5 1961 Pump 0 2 Air Lifting6 1959 Pump 0.5 2002 2 Air Lifting7 1965 Pump 2001 0 2 Air Lifting8 1985 Pump 1 2003 2 Air Lifting9 1961 Pump 1.5 2002 2 Air Lifting
10 1961 Pump 0.3 2000 2 Air Lifting11 1985 Pump - 2 Air Lifting12 1963 Pump 0.6 2002 2 Air Lifting13 1963 Pump - 2 Air Lifting14 1963 Pump 2 Air Lifting15 1964 Pump 0.5 2002 2 Air Lifting16 1965 Pump 0.5 2003 2 Air Lifting17 1965 Pump 0.5 2002 2 Air Lifting18 1961 Pump 1 2002 2 Air Lifting19 1965 Pump 1 2003 2 Air Lifting20 1965 Pump 1 2003 2 Air Lifting21 1965 Pump 1 2003 2 Air Lifting22 1991 Pump 1 2002 2 Air Lifting23 1991 Pump 1 2002 2 Air Lifting3P 1998 Pump 2 Air Lifting4P 1998 Pump 2 Air Lifting5P 1998 Pump 2 Air Lifting6P 1998 Pump 2 Air Lifting7P 1998 Pump 2 Air Lifting8P 1998 Pump 2 Air Lifting9P 1998 Pump 2 Air Lifting
10P 1998 Pump 2 Air Lifting11P 1998 Pump 2 Air Lifting12P 1998 Pump 2 Air Lifting13P 1998 Pump 2 Air Lifting14P 1998 Pump 2 Air Lifting15P 1998 Pump 2 Air Lifting16P 1998 Pump 2 Air Lifting2A 1992 Pump 2 Air Lifting3A 1992 Pump 2 Air Lifting4A 1992 Pump 2 Air Lifting5A 1992 Pump 2 Air Lifting
Times ofRe-Instal
lationof Pump
Table S 3.1.2.27(4) List of Maintenance Status and Rehabilitation of Wells at South WTP
FinalRepairYear
of Pump
WPT Name
WellNo.
StartingYear,
Operated
SouthRepair and Rehabilitation
Equipments,often
damaged
FinalRehabili-
tationYear
Contents ofRehabilitation
FinalInstalla-tion Yearof Pump
Frq. OfRepairs
(times/yr)
Freq. ofRehabili-
tation(once in yrs)

The Study on Restructuring of Water Supply System Volume 3. Supporting Report of Tashkent City in the Republic of Uzbekistan March 2006
S 3-1-2-58
Table S 3.1.2.28(1) List of Structure and Pumping Test Data of Wells at Sergeli WTP
Table S.3.1.2.28 (2) List of Pumps and Operation of Wells at Sergeli WTP
1 1966 40.0 325-168 steel 19.0 21.0-40.0 gr-sd 44.4 1.3 2.1 0.8 55.62 1966 70.0 426-325 steel 35.0 30.0-65.0 gr-sd 83.3 1.4 2.4 1.0 83.33 1966 70.0 426-273 steel 34.0 31.0-65.0 gr-sd 83.3 1.2 2.2 1.0 83.34 1966 70.0 426-273 steel 34.0 31.0-65.0 gr-sd 83.3 1.2 2.6 1.4 59.55 1970 104.0 219-152 steel 21.3 73.2-94.5 gr-sd 33.3 5.0 6.0 1.0 33.36 1976 50.0 426-325 steel 19.0 29.0-48.0 gr-sd 83.3 1.1 2.9 1.8 47.67 1976 50.0 426-325 steel 18.0 30.0-48.0 gr-sd 83.3 1.0 2.8 1.8 47.689
Ca(mg/L)
WPT Name
WellNo.
Const-ructionYear
Well Structure Pumping Test DataGroundEleva-tion(m)
DrilledDiameter
(mm)
CasingDrilledDepth
(m)
Sergeli
TestYield(L/s)
StaticWaterLevel(m)
Mg(mg/L)
PumpingWaterLevel(m)
Draw-down(m)
pHDiameter(mm)
Materialof
Casing
TotalLength
(m)
SpecificCapa-city
(L/s/m)
ScreenTDS
(mg/L)
Water Quality Analysis Data
Cl(mg/L)
HCO3(mg/L)
SO4(mg/L)
Position(m)
Geologyof
Screen
Na +K
(mg/L)
Water Qality Analysis
1 1966 S ETSV-10 32 160 19.4 1.3 2.1 0.8 24.3 43.7 Total Hardness2 1966 C ATH-14 250 75 46 360 0 Water Quality 19.4 1.4 2.4 1.0 19.4 23.33 1966 C ATH-14 250 75 46 360 19.4 1.2 2.2 1.0 19.4 23.34 1966 C ATH-14 250 75 46 360 19.4 1.2 2.6 1.4 13.9 23.3 Total Hardness5 1970 S ETSV-10 32 160 14.3 5.0 6.0 1.0 14.3 42.9 Total Hardness,Intestinal Bacillus6 1976 C ATH-14 250 75 46 360 33.3 1.1 2.9 1.8 19.0 40.0 Total Hardness7 1976 C ATH-14 250 75 46 360 33.3 1.0 2.8 1.8 19.0 40.089
Sergeli
Pump Capacity Recom-mended
Intake Rate(m3/hr)
WPT Name
WellNo.
StartingYear,
OperatedQ
(m3/hr)
ModelNo.
Pumping Test at Present TimeCause ofNon-
OperationH
(m)
Dia-meter(mm)
Output(KW)
ActualAmountof Intake(m3/hr)
Exceeded Items of Potable WaterStandard (2003)
Pump Facilities
PumpType
Operation of Groundwater Intake
Declineof Well
Capacity(%)
TestYield(L/s)
SpecificCapacity(L/s/m)
StaticGWL(m)
PumpingGWL(m)
Draw-down(m)
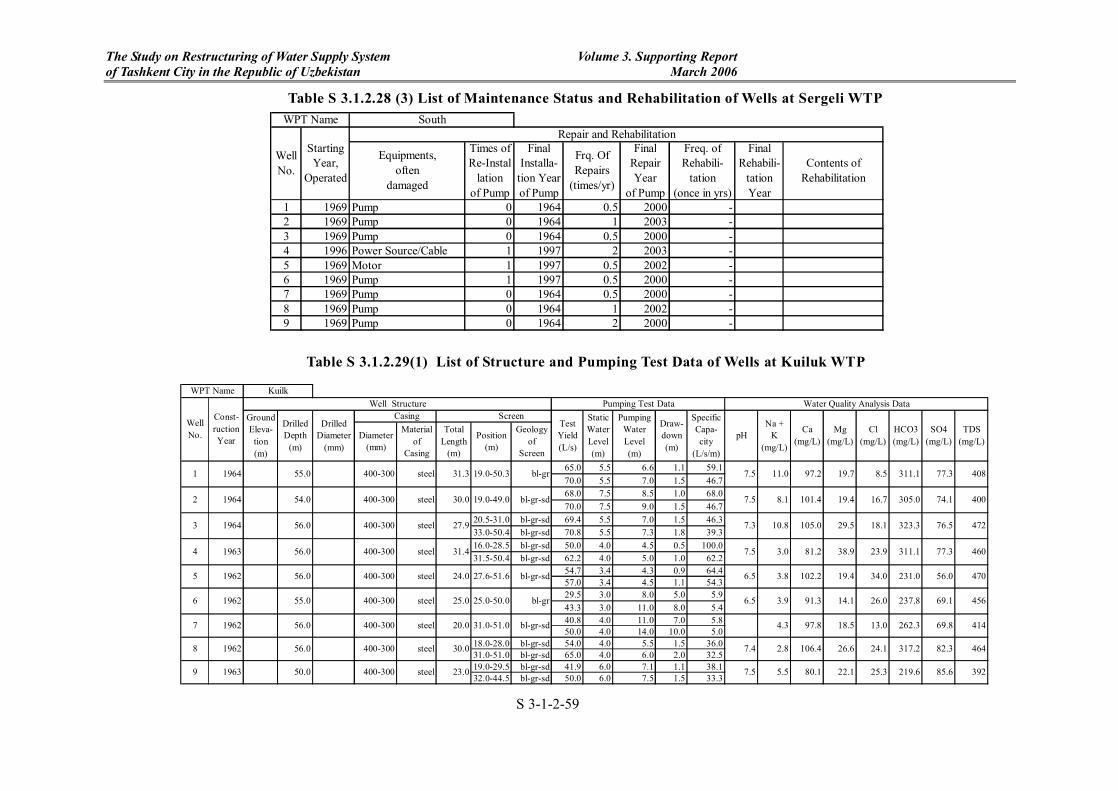
The Study on Restructuring of Water Supply System Volume 3. Supporting Report of Tashkent City in the Republic of Uzbekistan March 2006
S 3-1-2-59
Table S 3.1.2.28 (3) List of Maintenance Status and Rehabilitation of Wells at Sergeli WTP
Table S 3.1.2.29(1) List of Structure and Pumping Test Data of Wells at Kuiluk WTP
65.0 5.5 6.6 1.1 59.170.0 5.5 7.0 1.5 46.768.0 7.5 8.5 1.0 68.070.0 7.5 9.0 1.5 46.7
20.5-31.0 bl-gr-sd 69.4 5.5 7.0 1.5 46.333.0-50.4 bl-gr-sd 70.8 5.5 7.3 1.8 39.316.0-28.5 bl-gr-sd 50.0 4.0 4.5 0.5 100.031.5-50.4 bl-gr-sd 62.2 4.0 5.0 1.0 62.2
54.7 3.4 4.3 0.9 64.457.0 3.4 4.5 1.1 54.329.5 3.0 8.0 5.0 5.943.3 3.0 11.0 8.0 5.440.8 4.0 11.0 7.0 5.850.0 4.0 14.0 10.0 5.0
18.0-28.0 bl-gr-sd 54.0 4.0 5.5 1.5 36.031.0-51.0 bl-gr-sd 65.0 4.0 6.0 2.0 32.519.0-29.5 bl-gr-sd 41.9 6.0 7.1 1.1 38.132.0-44.5 bl-gr-sd 50.0 6.0 7.5 1.5 33.3
bl-gr 6.5 3.925.0-50.0
8.5 311.1
69.1 456
231.0
74.1 400
472323.3
19.0-50.3 bl-gr 7.5 11.0400-300 steel 31.31 1964 55.0
41497.8 18.5 13.0 262.3bl-gr-sd 4.3 69.8
392
7 1962 56.0 400-300 steel 20.0 31.0-51.0
22.1 25.3 219.6 85.67.5 5.5 80.19 1963 50.0 400-300 steel 23.0
TDS(mg/L)
Water Quality Analysis Data
91.3 14.1 26.0 237.8
77.3 40897.2 19.7
Kuilk
TestYield(L/s)
WPT Name
WellNo.
Const-ructionYear
Well Structure Pumping Test DataGroundEleva-
tion(m)
DrilledDiameter
(mm)
Casing Screen StaticWaterLevel(m)
Mg(mg/L)
Cl(mg/L)
PumpingWaterLevel(m)
Draw-down(m)
SpecificCapa-city
(L/s/m)
pHDrilledDepth
(m)
HCO3(mg/L)
SO4(mg/L)Diameter
(mm)
Materialof
Casing
TotalLength
(m)
Position(m)
Geologyof
Screen
Na +K
(mg/L)
Ca(mg/L)
55.0 400-300 steel 25.0
3 1964
6 1962
56.0 400-300 steel
6.5 3.8
76.5
56.0
7.5 3.0 81.2
27.9 7.3 10.8 105.0 29.5 18.1
24.0steel 102.2 19.427.6-51.6 bl-gr-sd19625 400-30056.0
2 1964 54.0 400-300 steel 30.0 19.0-49.0 bl-gr-sd 7.5 8.1 101.4 19.4 16.7 305.0
4 1963 56.0 400-300 steel 31.4
400-300 steel 30.08 1962 56.0 7.4 2.8 106.4
46038.9 23.9 311.1 77.3
47034.0
46426.6 24.1 317.2 82.3
1 1969 Pump 0 1964 0.5 2000 -2 1969 Pump 0 1964 1 2003 -3 1969 Pump 0 1964 0.5 2000 -4 1996 Power Source/Cable 1 1997 2 2003 -5 1969 Motor 1 1997 0.5 2002 -6 1969 Pump 1 1997 0.5 2000 -7 1969 Pump 0 1964 0.5 2000 -8 1969 Pump 0 1964 1 2002 -9 1969 Pump 0 1964 2 2000 -
Contents ofRehabilitation
FinalInstalla-
tion Yearof Pump
Frq. OfRepairs
(times/yr)
Freq. ofRehabili-
tation(once in yrs)
Times ofRe-Instal
lationof Pump
FinalRepairYear
of Pump
WPT Name
WellNo.
StartingYear,
Operated
SouthRepair and Rehabilitation
Equipments,often
damaged
FinalRehabili-
tationYear

The Study on Restructuring of Water Supply System Volume 3. Supporting Report of Tashkent City in the Republic of Uzbekistan March 2006
S 3-1-2-60
Table S.3.1.2.29 (2) List of Pumps and Operation of Wells at KuilukWTP
Table S 3.1.2.30 Summarized Diagnosis Results of Wells for Small Scale WTPs No. Name Well number Well’s function Pump’s function Problem
1 South Total: 41 Operating: 27
-Relatively normal -Unsuitable water for distribution
- Many of South area well’s pumps were breakdown -Lack of parts for pump repair -New Pumps purchased from Russia are not reliable
- High hardness exceeding standard -14 wells are not operating -Well’s intake capacities and pump capacities are not match
2 Sergeli Total: 9 Operating: 8
-Decreasing rapidly - Lack of parts for pump repair -New Pumps purchased from Russia are not reliable
-One well is unsuitable for drinking -Frequent breakdown of pumps
3 Kara-su Total: 11 Operating:6
-Unknown because of no data
- Lack of parts for pump repair -Many submerged pump cannot be repaired
-5 wells are not operating
4 Kuiluk Total: 9 Operating: 9
- Unknown because of no data
- Relatively normal operation - Lack of parts for pump repair
-Relatively high hardness
5 Bectemir Total: 11 Operating: 5
- Unknown because of no data
- Lack of parts for pump repair -Many submerged pump cannot be repaired
-6 wells are not operating -Contaminated water by surround-ing pollution
1 1969 C ATH-14 250 75 46 360 200 (200) 65.0 5.5 6.6 1.1 59.1 100.0 1.7 21.4 Clogging of Screen2 1969 C ATH-14 250 75 46 360 200 (200) 68.0 7.5 8.5 1.0 68.0 100.0 1.0 3.53 1969 C ATH-14 250 75 46 360 200 (200) 69.4 5.5 7.0 1.5 46.3 100.0 2.6 4.94 1996 S ETSV-12 150 45 30 270 200 (200) 50.0 4.0 5.0 1.0 50.0 50.0 2.8 3.35 1969 S ETSV-12 150 45 30 270 200 (200) 54.7 3.4 7.7 4.3 12.9 20.0 1.8 4.06 1969 S ETSV-12 150 45 30 270 200 (200) 56.0 5.5 11.2 5.7 9.8 166.5 2.1 3.97 1969 C ATH-14 250 75 46 360 200 (200) 40.8 4.0 15.0 11.0 3.7 63.6 1.8 21.1 Clogging of Screen8 1969 C ATH-14 250 75 46 360 200 (200) 54.0 4.0 9.5 5.5 9.8 27.3 2.7 4.09 1969 C ATH-14 250 75 46 360 200 (0) Cable 41.9 6.0 7.2 1.2 34.9 91.7 3.0 7.1
Pumping Test at Feb., 2003
H(m)
Declineof Well
Capacity(%)
TestYield(L/s)
SpecificCapacity(L/s/m)
StaticGWL(m)
PumpingGWL(m)
Draw-down(m)
Dia-meter(mm)
Output(KW)
ActualAmountof Intake(m3/hr)
KuilkPump Facilities
PumpType
Pump Capacity Recom-mended
Intake Rate(m3/hr)
WPT Name
WellNo.
StartingYear,
OperatedQ
(m3/hr)
ModelNo.
Cause ofNon-
Operation
Operation of Groundwater IntakeGroundwater Level
StaticGWL(m)
PumpingGWL(m)
Problems forGroundwater Intake

The Study on Restructuring of Water Supply System Volume 3. Supporting Report of Tashkent City in the Republic of Uzbekistan March 2006
S 3-1-2-61
iv) Distribution PSs
South, Sergeli and Bectemir WTPs have distribution PSs. Lists of distribution pumps and
related facilities are shown in Table S 3.1.2.31 (1) and (2). Diagnosis results for each WTP
are shown in Table S 3.1.2.31 (3) to (5).
Table S 3.1.2.31(1) List of Distribution Pumps for South, Sergeli and Bectemir WTPs WTP Name No. Name Model Q
(m3/hr) Head (m)
D(in,out) (mm)
Power (kw)
in Valve (mm)
out Valve (mm)
Installation year
1Main pump VH-DS 1250 125 350,200 630 400 400 1969 2Ditto Ditto 2000 100 350,200 800 400 400 1974 3Ditto Ditto 1250 125 350,200 630 400 400 1996 4Ditto Ditto 1250 125 350,200 630 400 400 2000
South
5Ditto Ditto 2000 100 500,300 830 1200 400 1979 1Main pump VH-DS 1250 63 400,300 250 500 500 1978 2Ditto Ditto 1250 63 400,300 250 500 500 1978 3Ditto Ditto 1250 63 400,300 315 500 500 1991 4Ditto Ditto 1250 63 400,300 250 500 500 1978 5Ditto Ditto 1250 63 400,300 315 500 500 1993
Sergeli
6Ditto Ditto 320 50 300,250 75 300 250 1978 1Main pump VH-SS 160 30 150,100 30 300 250 1986 2Ditto Ditto 160 30 150,100 30 300 250 1986 4Ditto Ditto 320 50 150,100 55 300 250 1986
Bectemir
5Ditto Ditto 320 50 150,100 55 300 250 1986
Table S 3.1.2.31 (2) List of No.1 Distribution PS Facilities WTP Name No. Name Specifications Inst. year
1 Pipes D300-1000 1963 2 Valves D300-1000 1963 3 Ceiling crane W 8.0m x 5ton 1963 4 Power panel Stand, 5 units 1963 5 Control panel Stand, 5 units 1963
South
6 Cable an others 1963 1 Pipes D500-1000 1978 2 Valves D500-1000 1978 3 Ceiling crane W 11m x 3.2ton 1978 4 Power panel Stand, 5 units 1978 5 Control panel Stand, 5 units 1978
Sergeli
6 Cable an others 1978 1 Pipes D250-500 1986 2 Valves D250-500 1986 3 Ceiling crane W 5m x 2ton 1986 4 Power panel Stand, 5 units 1986 5 Control panel Stand, 5 units 1986
Bectemir
6 Cable an others 1986

The Study on Restructuring of Water Supply System Volume 3. Supporting Report of Tashkent City in the Republic of Uzbekistan March 2006
S 3-1-2-62
Table S 3.1.2.31 (3) Diagnosis Sheet for South Distribution PS
Division Name Operation status Condition, Appearance Judgment No.1 main No particular problem Remarkably deteriorated. A large water leak-
age. Break down has frequently occurred. C2
No.2 main No particular problem Remarkably deteriorated. A large water leak-age. Unusual motor noise. Break down has frequently occurred.
C2
No.3 main Motor is worn-out. Under repair
Remarkably deteriorated. Break down has fre-quently occurred. C2
No.4 main No particular problem Remarkably deteriorated. Break down has fre-quently occurred. C2
Pumps
No.5 main No particular problem Remarkably deteriorated. Break down has fre-quently occurred. C2
Pipes No particular problem Corroded thoroughly due to no re-painting C1 Valves No particular problem Corroded thoroughly due to no re-painting C1
Pipes and other Machines
Ceiling crane No particular problem No particular problem B Power panel No particular problem Remarkably deteriorated. Instruments are partly
out of order. C1
Control panel No particular problem Remarkably deteriorated. Automatic circuits are out of order. C1
Electrical Facilities
Cable/others No particular problem Remarkably deteriorated C1
Table S 3.1.2.31 (4) Diagnosis Sheet for Sergeli Distribution PS
Division Name Operation status Condition, Appearance Judgment No.1 main No problem Remarkably deteriorated. Recently serious
break down of main axis has occurred. C1
No.2 main No problem Remarkably deteriorated. Recently break down has frequently occurred. C2
No.3 main Motor is worn-out. Under repair
Remarkably deteriorated. Recently break down has frequently occurred. C2
No.4 main Motor was fired 4 years ago. Impossible to be repaired.
Impossible to be repaired C2
No.5 main No problem Remarkably deteriorated. Recently break down has frequently occurred. C1
Pumps
No.5 main Replaced. Frequently used due to break down of other units.
Remarkably deteriorated. Recently break down has frequently occurred. C2
Pipes No problem Painted. Partly corroded, but in good appear-ance. C1
Valves No problem Painted. Partly corroded, but in good appear-ance. C1
Pipes and other Machines
Ceiling crane No problem No problem B Power panel No particular problem Remarkably deteriorated. A part of instruments
are out of order. C1
Control panel No particular problem Remarkably deteriorated. Automatic circuits are out of order. C1
Electrical Facilities
Cable/others No particular problem Remarkably deteriorated C1

The Study on Restructuring of Water Supply System Volume 3. Supporting Report of Tashkent City in the Republic of Uzbekistan March 2006
S 3-1-2-63
Table S 3.1.2.31(5) Diagnosis Sheet for Bectemir Distribution PS
Division Name Operation status Condition, Appearance Judgment No.1 main No problem Remarkably deteriorated. Break down has fre-
quently occurred. C1
No.2 main No problem Remarkably deteriorated. Break down has fre-quently occurred. C2
No.3 main No problem Remarkably deteriorated. Break down has fre-quently occurred. C2
Pumps
No.4 main No problem Remarkably deteriorated. Break down has fre-quently occurred. C2
Pipes No problem Painted. Very little corrosion. In good appear-ance. B
Valves No problem Painted. Partly corroded, but in good appear-ance. B
Pipes and other Machines
Ceiling crane No problem No problem B Power panel No particular problem Deteriorated, but in fair condition. B Control panel No particular problem Deteriorated, but in fair condition. B
Electrical Facilities
Cable/others No particular problem Deteriorated, but in fair condition. B
iv) Chlorinator
South and Sergeli WTP are using liquid chlorine filled up in 1ton cylinders, and that for
Kara-su, Kuiluk and Bectemir WTP are using calcium hypo-chlorite. Chlorinators for South
and Sergeli WTP and related facilities are listed in Table S 3.1.2.32 (1), and the diagnosis
results are shown in Table S 3.1.2.32 (2).
Chlorinators for Kara-su, Kuiluk and Bactemir WTPs are listed in Table S 3.3.33(1) and the
diagnosis results are shown in Table S 3.1.2.33 (2).
Table S 3.1.2.32 (1) List of Chlorination Facilities using Liquid Chlorine
Division No. Name Type Specification Number Inst. Year1 Cylinder scale Analog type for 1ton Cylinder 1 1961 2 Gas filter 1 1961 3 Gas meter Flow meter 2.5kg/hrxd20mm 2 1961
4 Ejector Water ejector D25mm, from distribution pump 2 1961
South
5 Safety equipment Sprinkler, Discharging chamber, Gas mask 1 1961 1 Cylinder scale Analog type for 1ton Cylinder 1 1977 2 Gas filter 1 1977 3 Gas meter Flow meter 2.5kg/hrxd20mm 2 1977
4 Ejector Water ejector D25mm, with exclusive pump 2 1977
Sergeli
5 Safety equipment Sprinkler, Discharging chamber, Gas mask 1 1977
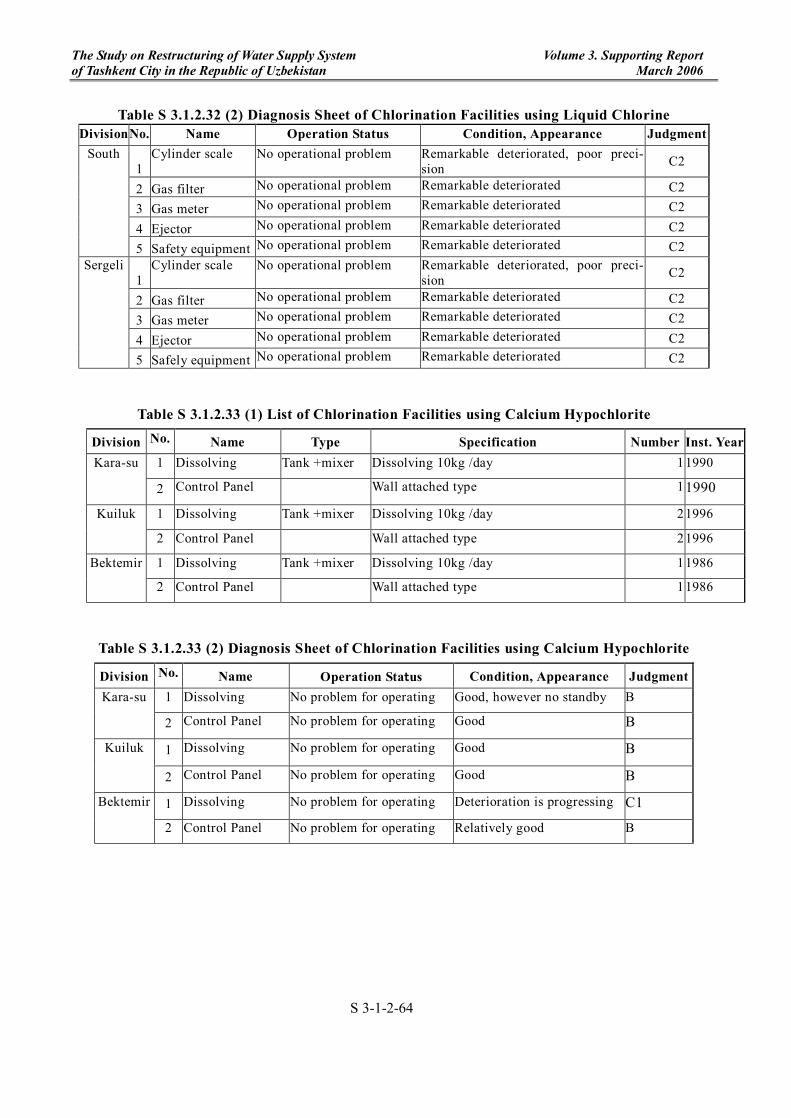
The Study on Restructuring of Water Supply System Volume 3. Supporting Report of Tashkent City in the Republic of Uzbekistan March 2006
S 3-1-2-64
Table S 3.1.2.32 (2) Diagnosis Sheet of Chlorination Facilities using Liquid Chlorine Division No. Name Operation Status Condition, Appearance Judgment
1 Cylinder scale No operational problem Remarkable deteriorated, poor preci-
sion C2
2 Gas filter No operational problem Remarkable deteriorated C2 3 Gas meter No operational problem Remarkable deteriorated C2
4 Ejector No operational problem Remarkable deteriorated C2
South
5 Safety equipment No operational problem Remarkable deteriorated C2
1 Cylinder scale No operational problem Remarkable deteriorated, poor preci-
sion C2
2 Gas filter No operational problem Remarkable deteriorated C2 3 Gas meter No operational problem Remarkable deteriorated C2
4 Ejector No operational problem Remarkable deteriorated C2
Sergeli
5 Safely equipment No operational problem Remarkable deteriorated C2
Table S 3.1.2.33 (1) List of Chlorination Facilities using Calcium Hypochlorite
Division No. Name Type Specification Number Inst. Year1 Dissolving Tank +mixer Dissolving 10kg /day 1 1990 Kara-su
2 Control Panel Wall attached type 1 1990
1 Dissolving Tank +mixer Dissolving 10kg /day 2 1996 Kuiluk
2 Control Panel Wall attached type 2 1996
1 Dissolving Tank +mixer Dissolving 10kg /day 1 1986 Bektemir
2 Control Panel Wall attached type 1 1986
Table S 3.1.2.33 (2) Diagnosis Sheet of Chlorination Facilities using Calcium Hypochlorite
Division No. Name Operation Status Condition, Appearance Judgment 1 Dissolving No problem for operating Good, however no standby B Kara-su
2 Control Panel No problem for operating Good B
1 Dissolving No problem for operating Good B Kuiluk
2 Control Panel No problem for operating Good B
1 Dissolving No problem for operating Deterioration is progressing C1 Bektemir
2 Control Panel No problem for operating Relatively good B

The Study on Restructuring of Water Supply System Volume 3. Supporting Report of Tashkent City in the Republic of Uzbekistan March 2006
S 3-1-2-65
(4) Booster PSs
List of Booster PS are shown in Table S 3.1.2.34 (1) to (8).
Diagnosis sheets for Booster PS are shown in Table S 3.1.2.35 (1) to (9).

Table S 3.1.2.34 (1) List of Booster PSs
No. No. indistrict Pumping station location
Supplycapacity
m3/h
Constructedyear
Type ofpump
Number ofpump
(Yakkasaray) m3/h m kWNo.1 320 38 55No.2 320 50 55No.3 320 50 55No.4 320 38 55No.5 320 50 55No.1 320 50 75No.2 320 50 75No.3 320 50 55No.1 200 36 30No.2 320 50 55No.3 200 36 30No.4 200 36 30No.1 100 65 30No.2 100 65 30No.3 100 65 30No.4 100 65 30No.1 320 50 75No.2 320 50 75No.3 320 50 75No.4 320 50 75No.5 320 50 75No1 80 50 18No2 80 50 18No.1 320 50 75No.2 320 38 55No.3 320 38 55No.1 80 50 15No.2 45 55 17No.3 45 30 17No.4 100 80 15No.1 100 32 30No.2 100 32 30No.1 320 50 75No.2 320 50 75No.3 320 50 75No.4 320 50 75No.5 320 38 55No.1 320 50 75No.2 320 50 75No.3 320 50 75No.4 320 50 75No.1 320 50 75No.2 320 38 55No.3 320 50 55No.4 320 38 55No.5 320 50 75No.1 320 50 75No.2 320 50 75No.3 320 38 55No.4 320 50 55No.5 320 50 45No.1 90 35 15No.2 160 20 11No.3 90 35 15No.4 30 45 7.5
1987 No.1 90 35 152002 No.2 90 35 15
No.3 90 35 15No.4 100 65 15No.1 45 40 11No.2 45 30 7.5
2000 Centrifugal16 7 Alibekova str., 3а 90
150 1978 Centrifugal
15 6 Jukovskaya str., 83a 150 Centrifugal
14 5 Kafanov str., 5
2002
1991 Centrifugal
12 3
13 4 Fitrat 1, Fitrat str., 4a 1000
m. Ippondrom, in front of "Himfarm"plant 1000
1988 Centrifugal
1968 Centrifugal
1987 Centrifugal
11 2 Ts - 7, close to Telephone stattion (56) 600
500
10 1 50 anniversary of RU, S. Barak str., 68 1000
2000 Centrifugal9 9 U. Nosir str., near "Ocean" supermarket 200
Centrifugal1984
1998 Centrifugal
1989 Centrifugal
50 2002 Centrifugal6 6 Kahhar str., in front of 16-floor storiesbuilding
Abdullaeva str., 1188
7 7 Anhor, near White House
400
5 5 baranova str., behind "Rossia" hotel 1000
4
1000
Centrifugal
2 2
4 samarkandskaya str., 14 1976 Centrifugal
3 3 Bobur str. Close to Tash. Heat-electriccentral 1976600
Bobur str. In front of Bobur park 600
Capacity of pump
Massiv Bashlik between houses 4 & 5 Centrifugal
1998 Centrifugal
1 1 1000 1987
S 3-1-2-66

Table S 3.1.2.34 (2) List of Booster PSs
No. No. indistrict Pumping station location
Supplycapacity
m3/h
Constructedyear
Type ofpump
Number ofpump
No.1 320 38No.2 320 38 55No.1 45 30 11No.2 45 30 11No.3 45 30 11No.1 800 57 200No.2 800 57 200
20 11 massiv Kuyluk - 4, 49 20 2000 Submergible No.1 - - 1621 12 Munis str., 9 (cellar) 20 2000 Submergible No.1 - - 16
No.1 170 15.2 5.5No.2 170 15.2 5.5No.3 170 15.2 5.5
(Akmal - Ikramovskiy)2000 No.1 800 50 2002000 No.2 800 50 2002000 No.3 800 50 2002000 No.4 800 50 2002000 No.5 800 50 2002000 No.6 800 50 2001999 No.1 320 50 751995 No.2 320 50 751995 No.3 320 50 751999 No.4 320 50 751997 No.5 320 50 752001 No.6 320 50 75
No.1 320 50 75No.2 320 50 75No.3 320 50 75No.4 320 50 75
1996 No.1 320 50 752001 No.2 320 50 751995 No.3 320 50 75
No.1 320 50 55No.2 320 50 55No.3 320 50 55No.1 160 30 30No.2 160 30 30No.3 160 30 30
29 7 Rahimbabaeva str., 2 (cellar) 90 1990 Centrifugal No.1 320 50 30No.1 320 38 55No.2 320 50 75No.3 320 38 55No.4 320 38 55
1996 No.1 320 50 751996 No.2 320 50 751996 No.3 320 50 751996 No.4 320 50 752000 No.5 320 50 75
32 10 m. Chilanzar 12(cellar) 20 2002 Submergebl No.1 - - 16No.1 45 30 11No.2 45 30 11
34 11 1 block, build. - 50, 51, 52а 20 2001 Submergebl No.1 - - 1135 12 Avangard 7 20 2001 Submergebl No.1 - - 16
Capacity of pump
Centrifugal
1996 Centrifugal
1998 Centrifugal
22 Centrifugal200060Kuyluk 2 (TACIS)
817 Centrifugal2000600Fitrat 11, Fitrat 4
33 11 Attoyi mahallya 40
1995 Centrifugal
Centrifugal
1995 Centrifugal
31 9 B-14 block 1000
30 8 m. Chilanzar 26, terr. Tashmoloko(Tashmilk) 1000
27 5
28 6 at the territory of Uz. State Univer. OfLang. 160
1000
m. Hondamir, Ziyo Said str. 600
26 4 Ziyo Said str., near Post office 600
1991 Centrifugal
Centrifugal24 2 m. Chilanzar - 25 (car park) 1000
25 3 Uygur str. - G. Uzakova str.
Centrifugal
19 10
23 1 m. Chilanzar-30, school 203 3000
massiv Kuyluk - 2 800
13
1999 Centrifugal
2000 Centrifugal
18 9 Staradubtseva str., behind institute oftransport 45
S 3-1-2-67
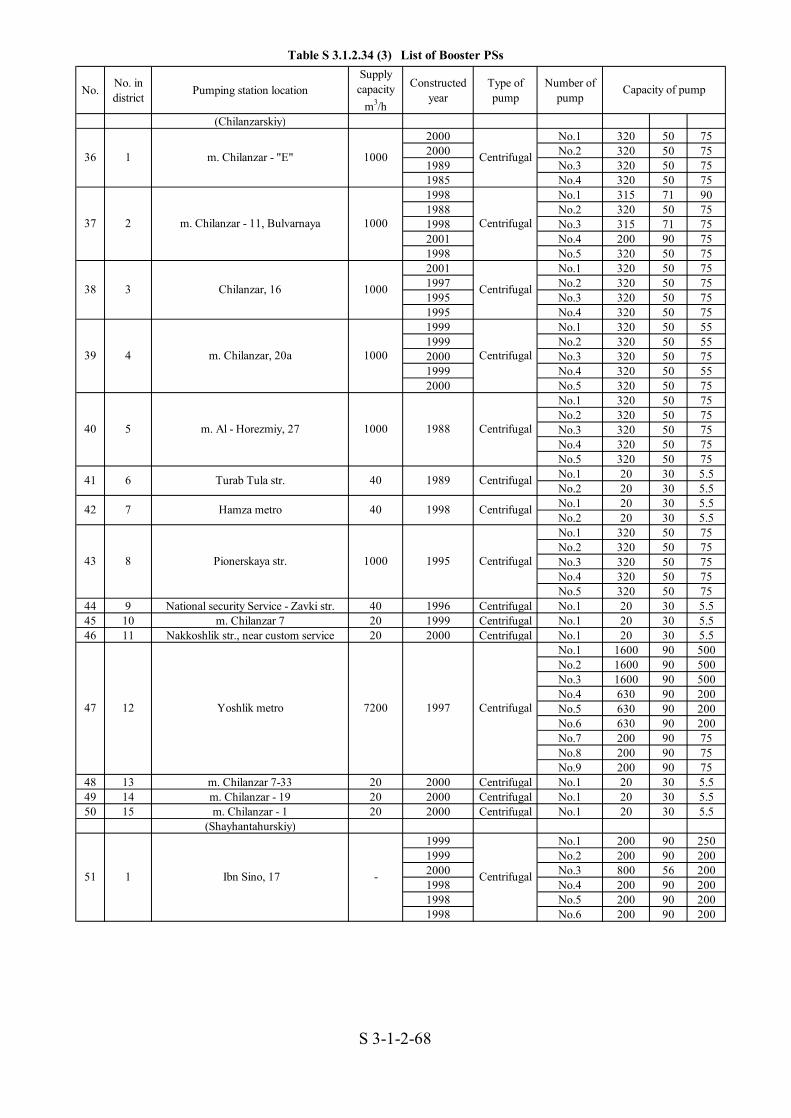
Table S 3.1.2.34 (3) List of Booster PSs
No. No. indistrict Pumping station location
Supplycapacity
m3/h
Constructedyear
Type ofpump
Number ofpump
(Chilanzarskiy)2000 No.1 320 50 752000 No.2 320 50 751989 No.3 320 50 751985 No.4 320 50 751998 No.1 315 71 901988 No.2 320 50 751998 No.3 315 71 752001 No.4 200 90 751998 No.5 320 50 752001 No.1 320 50 751997 No.2 320 50 751995 No.3 320 50 751995 No.4 320 50 751999 No.1 320 50 551999 No.2 320 50 552000 No.3 320 50 751999 No.4 320 50 552000 No.5 320 50 75
No.1 320 50 75No.2 320 50 75No.3 320 50 75No.4 320 50 75No.5 320 50 75No.1 20 30 5.5No.2 20 30 5.5No.1 20 30 5.5No.2 20 30 5.5No.1 320 50 75No.2 320 50 75No.3 320 50 75No.4 320 50 75No.5 320 50 75
44 9 National security Service - Zavki str. 40 1996 Centrifugal No.1 20 30 5.545 10 m. Chilanzar 7 20 1999 Centrifugal No.1 20 30 5.546 11 Nakkoshlik str., near custom service 20 2000 Centrifugal No.1 20 30 5.5
No.1 1600 90 500No.2 1600 90 500No.3 1600 90 500No.4 630 90 200No.5 630 90 200No.6 630 90 200No.7 200 90 75No.8 200 90 75No.9 200 90 75
48 13 m. Chilanzar 7-33 20 2000 Centrifugal No.1 20 30 5.549 14 m. Chilanzar - 19 20 2000 Centrifugal No.1 20 30 5.550 15 m. Chilanzar - 1 20 2000 Centrifugal No.1 20 30 5.5
(Shayhantahurskiy)1999 No.1 200 90 2501999 No.2 200 90 2002000 No.3 800 56 2001998 No.4 200 90 2001998 No.5 200 90 2001998 No.6 200 90 200
Capacity of pump
1988
Centrifugal
Centrifugal
Centrifugal
51 1
Centrifugal199840Hamza metro
Centrifugal19958 Pionerskaya str.
1989 Centrifugal
1000 Centrifugal
Centrifugal
4041 6 Turab Tula str.
43
742
1000
439 m. Chilanzar, 20а
100040 5 m. Al - Horezmiy, 27
38 3 Chilanzar, 16 1000
37 2 m. Chilanzar - 11, Bulvarnaya 1000
36 1 m. Chilanzar - "Е" 1000
Centrifugal19977200Yoshlik metro
Ibn Sino, 17 - Centrifugal
1247
S 3-1-2-68

Table S 3.1.2.34 (4) List of Booster PSs
No. No. indistrict Pumping station location
Supplycapacity
m3/h
Constructedyear
Type ofpump
Number ofpump
1982 No.1 320 55 751982 No.2 320 55 752000 No.3 320 55 751989 No.4 320 55 751989 No.5 320 55 75
No.1 320 50 75No.2 320 50 75No.3 320 50 75No.1 320 38 55No.2 320 38 55No.1 320 38 55No.1 320 50 75No.1 320 38 55No.2 320 38 55No.1 160 30 17No.2 160 30 17No.3 90 35 17No.1 320 38 55No.2 320 38 55
1995 No.1 320 38 551995 No.2 320 38 552000 No.3 320 38 551999 No.1 90 55 302003 No.2 100 65 451999 No.3 90 50 221999 No.4 90 50 221999 No.5 90 50 22
No.1 50 50 15No.2 50 50 15
2002 No.1 90 35 181999 No.2 90 35 18
63 13 Gulhani str. 20 1979 Centrifugal No.1 320 70 -77Mirzo - Ulugbekskiy
No.1 320 50 75No.2 320 50 75No.3 320 50 75No.4 320 38 55No.5 320 38 55No.1 320 50 75No.2 320 38 55No.3 320 50 75No.4 320 38 55No.5 320 38 55No.1 320 50 75No.2 320 50 75No.3 320 50 75No.4 320 50 75No.5 320 50 75No.1 90 35 15No.2 90 35 15
68 5 Karasu - 6 90 1988 Centrifugal No.1 100 80 15No.1 320 38 55No.2 320 38 55No.3 320 38 55No.4 320 38 55No.5 320 38 55No.1 320 38 55No.2 320 38 55No.3 320 38 55No.4 320 38 55No.5 320 38 55
Capacity of pump
57
52
3
56
53
2
54 4
7
6
1000 1987 Centrifugal70
669
Pushkin str., Salar - river side7
Centrifugal1000 1999Humayun str.
366
Centrifugal199340m Cherdansev, 20467
Centrifugal19891000m. TTZ - 4, build.1
Centrifugalm. Feruza, 3265 19871000
64 1000 1987 Centrifugal
Centrifugal
2001
Shastri str., m. G. Petrov1
CentrifugalGulhani str.
62 12 chorsu, Samarkand-Darbaza str, 6 60
61 11 20
800 1993m. Ts - 13, build.26
1000m. Almazar
Centrifugal
2000 Centrifugal
Centrifugal
Ts - 14, behind "Ganga" 120
1999 Centrifugal500Kukcha, Uygur str.
huvaydo str., 2a 200 1976 Centrifugal
58 500 2000 Centrifugal8 Ts - 27, near school
Centrifugal
60 10 chorsu, Samarkand-Darbaza str, 5 Centrifugal400
59 9 Gulhani str. 1000
55 Centrifugal1991200Ipakchi str.5
S 3-1-2-69

Table S 3.1.2.34 (5) List of Booster PSs
No. No. indistrict Pumping station location
Supplycapacity
m3/h
Constructedyear
Type ofpump
Number ofpump
H. Olimjon. Pushkin str (under theNo.1 90 85 45No.2 90 85 45No.3 90 85 45No.4 100 85 55No.5 90 85 55No.1 320 38 55No.2 90 35 15No.3 100 65 30No.4 85 45 45No.5 90 55 30No.1 200 32 30No.2 200 32 30No.3 320 50 75No.4 200 32 30No.1 320 50 75No.2 320 50 75No.3 320 50 75No.4 320 38 75No.5 - - -
1976 No.1 90 85 4519976 No.2 90 85 451977 No.3 200 36 451999 No.4 45 55 451999 No.5 45 55 15
No.1 6200 51 1000No.2 6200 51 1000No.3 6200 51 1000No.4 6200 51 1000No.5 6200 51 1000No.6 6200 51 1000No.7 6200 51 1000No.8 5200 51 800
76 13 m. Karasu - 6 (cellar) 90 1998 Centrifugal No.1 320 35 22s. Rahimovskiy
1998 No.1 300 40 160No.2 800 56 200No.3 800 56 200No.4 800 56 200No.5 800 56 200No.6 800 56 200No.1 320 50 75No.2 320 50 75No.3 320 50 75No.4 320 50 75No.5 320 50 75No.1 320 50 75No.2 320 50 75No.3 320 50 75No.4 320 50 55No.5 320 50 75
1991 No.1 320 38 551999 No.2 320 50 751991 No.3 320 50 751999 No.4 320 50 751999 No.5 320 50 75
Capacity of pump
972
No.2 group
71 8
No.1 group
CentrifugalLafarga str. 109 800 1968
600 1983 Centrifugal
Centrifugal73 10
74 11 Ts-1B, Gogol str, 9 60 Centrifugal
Centrifugal30000Cherdaesev str.1275 1967
Karasu - 3, build.13 600 1983
Centrifugal77 1 B - 1, m. Beruniy, Guncha 3000 2000
Centrifugal19991000278 Farobiy str., - Candidates house(students)
79 3 Karasayskaya 2 Centrifugal19971000
Centrifugal1000Taksinbaeva, 11480
S 3-1-2-70

Table S 3.1.2.34 (6) List of Booster PSs
No. No. indistrict Pumping station location
Supplycapacity
m3/h
Constructedyear
Type ofpump
Number ofpump
1984 No.1 320 50 551999 No.2 320 50 551999 No.3 320 50 551984 No.4 320 50 551984 No.5 320 50 551982 No.1 500 50 751982 No.2 500 50 751982 No.3 320 50 751988 No.4 320 50 751985 No.1 320 38 551985 No.2 320 38 552000 No.3 320 50 552000 No.4 320 50 551985 No.5 320 38 551986 No.1 320 50 751986 No.2 320 50 752001 No.3 320 50 751988 No.4 320 50 901997 No.1 320 38 551997 No.2 320 38 551986 No.3 320 38 551997 No.4 320 38 55
No.1 80 50 37No.2 80 35 37
87 11 Beruniy str. 20 1996 Centrifugal No.1 20 80 488 12 sagban str., 3,4,5 80 1997 Centrifugal No.1 65 150 -89 13 Ts - 22 -103 (cellar) 20 1986 Submergebl No.1 - - 16
No.1 160 30 30No.2 160 30 30
91 15 Kalinin - Mavzukter / Promenergo 60 1970 Centrifugal No.1 20 30 2No.1 20 30 5.5No.2 20 30 5.5
93 17 Sagban 2, Huriyat str. 20 1999 Centrifugal No.1 90 35 20Yunus Abad
No.1 90 35 30No.2 90 35 30No.3 90 35 30No.4 90 35 30No.5 90 35 30No.1 320 50 75No.2 320 50 75No.3 320 50 75No.4 320 50 75No.5 320 50 75No.1 320 38 55No.2 320 38 55No.3 320 38 55No.4 320 38 55No.1 800 57 200No.2 800 57 200No.3 800 57 200No.4 800 57 200No.5 800 57 200No.6 800 57 200No.1 290 30 40No.2 290 30 40No.3 290 30 40No.1 320 38 55No.2 290 30 40No.3 320 38 55
Capacity of pump
Centrifugal81 1000
6 Vuzgorodok
5 Ts 17-18. m. Sebzar, 20
84 1000
82
CentrifugalTashMI, Medgorodok, 12 1000783
Centrifugal1000
1991
Centrifugalm. K. Karamish 1/2 -68
14
Centrifugal
400 CentrifugalK. Kamish 2/4 -32985
Niyazova str. Beruniy str. 90
90
86 10
CentrifugalSagban 1, Doka Hleb16 20 199992
shumilovo (hospital territory) 1997160 Centrifugal
Centrifugal-90 Boundary college
396
Centrifugal19821000SB-4 Y. Abad - 12 circle of bus - 72
194
295
497
Centrifugal1982
1982 Centrifugal3000SB-4б Y. Abad - 14
1000SD-2, A. Danish 2 -60
Centrifugal1971300Ts - 4598
600Ts - 5699 Centrifugal1971
S 3-1-2-71

Table S 3.1.2.34 (7) List of Booster PSs
No. No. indistrict Pumping station location
Supplycapacity
m3/h
Constructedyear
Type ofpump
Number ofpump
No.1 20 30 40No.2 20 30 40No.3 20 30 40No.1 100 50 30No.2 100 50 30No.3 100 50 30No.1 90 53 15No.2 90 53 15No.1 320 38 55No.2 320 38 55No.3 320 38 55No.4 320 38 55No.5 320 38 55
104 11 Block-8 20 1999 Submergible No.1 - - 16No.1 315 71 90No.2 315 71 90No.3 315 71 90No.4 315 71 90No.5 315 71 90No.1 20 30 5.5No.2 20 30 5.5No.1 100 32 15No.2 100 32 15No.3 90 35 15No.1 325 71 90No.2 325 71 90No.3 325 71 90No.4 325 71 90No.5 325 71 90No.1 320 38 15No.2 320 38 15No.1 90 35 15No.2 90 35 15No.1 20 30 4No.2 20 30 4
112 19 Block 18 20 2001 Submergebl No.1 - - 16113 20 20 - block - 5 20 2001 Centrifugal No.1 - - 16114 21 21 Housing stock of "Yulduz" Factory 20 2001 Submergebl No.1 - - 16115 22 Ts - 5 20 2001 Submergebl No.1 - - 16
(Hamzinskiy district)116 1 Lisunova str., 4 90 2002 Centrifugal No.1 100 50 30
1990 No.1 320 50 751990 No.2 320 50 752000 No.3 320 50 751990 No.4 320 50 751990 No.5 320 50 751989 No.1 320 38 551989 No.2 320 38 552000 No.3 320 38 552000 No.4 320 38 551989 No.5 320 38 551990 No.1 320 50 75
- No.2 320 50 752000 No.3 320 50 75
- No.4 320 50 75- No.5 320 50 75
2003 No.6-1 100 65 302003 No.6-2 100 65 30
Capacity of pump
Centrifugal
100
199920
100 Centrifugal199420Murtazaeva str., 4
8
7
101
Centrifugal199190Badamzar 89102
Centrifugal1988Dj. Abidov str.
103
Centrifugal19991000Hasanboy - Circle, near gas-filling works12105
Centrifugal1987100010 SB-5 Y. Abad 9, circle of bus
15
13106
Centrifugal200030Amir Timur str., 114107
CentrifugalYunus Abad - 4
108
Centrifugal1999320Turgunboev str.16109
19991000Zakirov str. (behind mosque)
Centrifugal200090Krasnoprenenskaya str., 3717110
Sohibkor - circle // anhor river side 20111 200018 Centrifugal
Centrifugal1000Lisunova str.2117
Centrifugal1000Ahangaran - 40 let3118
1000Chezelnaya str., 1a4119 Centrifugal
S 3-1-2-72

Table S 3.1.2.34 (8) List of Booster PSs
No. No. indistrict Pumping station location
Supplycapacity
m3/h
Constructedyear
Type ofpump
Number ofpump
No.1 320 50 75No.2 320 50 75
- No.1 - - -1999 No.2 320 50 752000 No.3 320 50 751999 No.4 320 50 751999 No.5 320 50 75
- No.6 - - -122 7 Fergana Yuli, 15 40 1990 Centrifugal No.1 45 30 7.5
No.1 90 35 18No.2 90 35 18No.3 90 35 18No.1 90 45 8No.2 45 30 5No.1 45 30 5.5No.2 45 30 5.5No.1 320 50 55No.2 320 50 55No.1 320 50 55No.2 320 50 55No.3 320 50 55No.1 45 30 15No.2 45 30 15No.1 45 30 10No.2 45 30 10
(Sergeliyskiy)No.1 320 38 55No.2 320 38 55No.3 320 38 55No.4 320 38 55
1995 No.1 320 50 751995 No.2 320 50 751995 No.3 320 50 752000 No.4 800 56 2001995 No.5 1250 63 3151998 No.6 300 90 3152000 No.7 1250 63 3152000 No.8 1250 63 315
No.1 320 50 75No.2 320 38 55No.3 320 38 55No.4 320 50 75No.5 320 38 55
No.1-1 90 30 7.5No.1-2 45 30 18No.2 90 85 55No.3 320 50 75No.4 320 50 75No.5 320 50 75No.6 320 50 75No.7 320 50 75No.1 320 35 18No.1 320 50 55No.2 320 50 55No.3 320 50 55No.4 320 50 55No.5 320 50 55
120 Centrifugal
1000Kuyluk 1, Fergana Yuli str.6
district of REVS5 300 1958
45Havastskaya str.
121
Centrifugal2000200Z. Shamutdinov str.8123
Centrifugal
9124
Centrifugal200020Tabibiy str.10125
Centrifugal2000
126 11 Panelnaya str. 600 2000 Centrifugal
600 2000 CentrifugalZangori12127
Slonima13128 45 2001 Centrifugal
Centrifugal199920129
Sergeli 2130 1 Centrifugal
Centrifugal
Karimova14
131 3000
1000 1983
Centrifugal19891000
Sergeli 3 - 5
Kuyluk 5
Centrifugal19931000Sergeli 8
1000 1993Stroitel'5
132
4133
2
3
Capacity of pump
134 Centrifugal
S 3-1-2-73

Table S 3.1.2.35 (1) Diagnosis of Booster PSsCealing of axis
Crack Corrosion Pintingexfoliation
Leaking Temperature
Oilleakage
Noise Rust Vibration Temperature
No.1 No. whole whole Much Normal No Nomal No Nomal Nomal B Not bad conditionNo.2 No. whole whole Much Normal No B Not bad conditionNo.3 No. whole whole Much Normal No B Not bad conditionNo.4 - No. whole whole - - - - - - - - - Motor was burnedNo.5 - No. whole whole - - - - - - - - - Motor was burnedNo.1 Normal No. whole whole Much Normal No Nomal No Normal Normal B Not bad conditionNo.2 Normal No. whole whole Much Normal No Nomal No Normal Normal B Not bad conditionNo.3 Normal No. whole whole Much Normal No Nomal No Normal Normal B Not bad conditionNo.1 Normal No. whole whole Much Normal No Nomal Whole Normal Normal C2 DeteriorationNo.2 Normal No. whole whole Much Normal No Nomal Whole Normal Normal B Not bad conditionNo.3 Normal No. whole whole Much Normal No Nomal Whole Normal Normal C2 DeterioratedNo.4 Normal No. whole whole - - No - - - - C2 Deteriorated Motor was burnedNo.1 Normal No. whole whole Much Normal No Nomal No Normal Normal B Not bad conditionNo.2 Normal No. whole whole Much Normal No Nomal No Normal Normal B Not bad conditionNo.3 Normal No. whole whole Much Normal No Nomal No Normal Normal B Not bad conditionNo.4 Normal No. whole whole Much Normal No Nomal No Normal Normal B Not bad conditionNo.1 Normal No. whole whole Much Normal No Nomal Whole Normal Normal B Not bad conditionNo.2 Normal No. Normal Normal Much Normal No Nomal Whole Normal Normal B Not bad conditionNo.3 - - - - - - - - - - - - - Motor was burnedNo.4 Normal No. whole whole Much Normal No Nomal Whole Normal Normal B Not bad conditionNo.5 Normal No. whole whole Much Normal No Nomal Whole Normal Normal B Not bad conditionNo.1 - - - - - - - - - - - - - Motor was burnedNo.2 Normal No. whole whole Much Normal No Nomal No Normal Normal B Not bad conditionNo.3 Normal No. whole whole Much Normal No Nomal No Normal Normal B Not bad conditionNo.1 Normal No. No No Much Normal No Nomal No Normal Normal B Not bad conditionNo.2 Normal No. No No Much Normal No Nomal No Normal Normal B Not bad conditionNo.3 - No. No No - - No - - - - - - Motor was burnedNo.4 Normal No. No No Much Normal No Nomal No Normal Normal B Not bad conditionNo.1 - - - - - - - - - - Motor was burnedNo.2 Normal No. whole whole Much Normal No Nomal Partly Normal Normal B Not bad conditionNo.3 Normal No. whole whole Much Normal No Nomal Partly Normal Normal B Not bad conditionNo.4 Normal No. whole whole Much Normal No Nomal Partly Normal Normal B Not bad conditionNo.5 Normal No. whole whole Much Normal No Nomal Partly Normal Normal B Not bad conditionNo.1 Normal No. No No Much Normal No Nomal No Normal Normal B Not bad conditionNo.2 Normal No. No No Much Normal No Nomal No Normal Normal B Not bad conditionNo.3 Normal No. No No Much Normal No Nomal No Normal Normal B Not bad conditionNo.4 - - - - - - - - - - Motor was burned
8
10
11
3
4
5
7
Casing Motor
1
2
P/S No. No.of Pump Pump noiseBearing
Judgment Basis of Judgment Note
S 3-1-2-74

Table S 3.1.2.35 (2) Diagnosis of Booster PSsCealing of axis
Crack Corrosion Pintingexfoliation
Leaking Temperature
Oilleakage
Noise Rust Vibration Temperature
No.1 Normal No. whole whole Much Normal No Nomal Whole Normal Normal B Not bad conditionNo.2 Normal No. whole whole Much Normal No Nomal Whole Normal Normal B Not bad conditionNo.3 Normal No. whole whole Much Normal No Nomal Whole Normal Normal B Not bad conditionNo.4 Normal No. whole whole Much Normal No Nomal Whole Normal Normal B Not bad conditionNo.5 - - - - - - - - - - Motor was burnedNo.1 Normal No. partly partly Much Normal No Nomal Partly Normal Normal B Not bad conditionNo.2 Normal No. partly partly Much Normal No Nomal Partly Normal Normal B Not bad conditionNo.3 Normal No. whole whole Much Normal No Nomal Whole Normal Normal B Not bad conditionNo.4 Normal No. whole whole Much Normal No Nomal Whole Normal Normal B Not bad conditionNo.5 Normal No. whole whole Much Normal No Nomal Whole Normal Normal B Not bad conditionNo.1 Normal No. whole whole Much Normal No Nomal Whole Normal Normal B Not bad conditionNo.2 Normal No. whole whole Much Normal No Nomal Whole Normal Normal B Not bad conditionNo.3 Normal No. whole whole Much Normal No Nomal Whole Normal Normal B Not bad conditionNo.4 Normal No. whole whole Much Normal No Nomal Whole Normal Normal B Not bad conditionNo.1 Normal No. whole whole Much Normal No Nomal Partly Normal Normal B Not bad conditionNo.2 Normal No. whole whole Much Normal No Nomal Partly Normal Normal B Not bad conditionNo.3 Normal No. whole whole Much Normal No Nomal Partly Normal Normal B Not bad conditionNo.4 Normal No. whole whole Much Normal No Nomal Partly Normal Normal B Not bad conditionNo.1 Normal No. whole whole Little Normal No Nomal Whole Normal Normal B Not bad conditionNo.2 Normal No. whole whole Little Normal No Nomal Whole Normal Normal B Not bad conditionNo.1 Normal No. whole whole Much Normal No Nomal Partly Normal Normal B Not bad conditionNo.2 Normal No. whole whole Much Normal No Nomal Partly Normal Normal B Not bad conditionNo.1 Normal No. No No Much Normal No Nomal No Normal Normal B Not bad conditionNo.2 Normal No. No No Much Normal No Nomal No Normal Normal B Not bad conditionNo.1 Normal No. No No No Normal No Nomal No Normal Normal A New Made in GermanyNo.2 Normal No. No No No Normal No Nomal No Normal Normal A New Made in GermanyNo.3 Normal No. No No No Normal No Nomal No Normal Normal A New Made in GermanyNo.1 Normal No. whole whole Much Normal No Nomal Whole Normal Normal B Not bad conditionNo.2 Normal No. whole whole Much Normal No Nomal Whole Normal Normal B Not bad conditionNo.3 Normal No. whole whole Much Normal No Nomal Whole Normal Normal B Not bad conditionNo.4 Normal No. whole whole Much Normal No Nomal Whole Normal Normal B Not bad conditionNo.5 Normal No. whole whole Much Normal No Nomal Whole Normal Normal B Not bad conditionNo.6 Normal No. whole whole Much Normal No Nomal Whole Normal Normal B Not bad conditionNo.1 Normal No. whole whole Very much Normal No Nomal Partly Normal Normal B Not bad conditionNo.2 Normal No. whole whole Very much Normal No Nomal Partly Normal Normal B Not bad conditionNo.3 Normal No. whole whole Very much Normal No Nomal Partly Normal Normal B Not bad conditionNo.4 Normal No. whole whole Much Normal No Nomal Partly Normal Normal B Not bad conditionNo.5 Normal No. whole whole Very much Normal No Nomal Partly Normal Normal B Not bad conditionNo.6 - No. whole whole - - - - - - - - - Motor was burned
24
17
19
22
23
13
14
15
16
12
P/S No. No.of Pump Pump noiseCasing Motor
Judgment Basis of Judgment NoteBearing
S 3-1-2-75
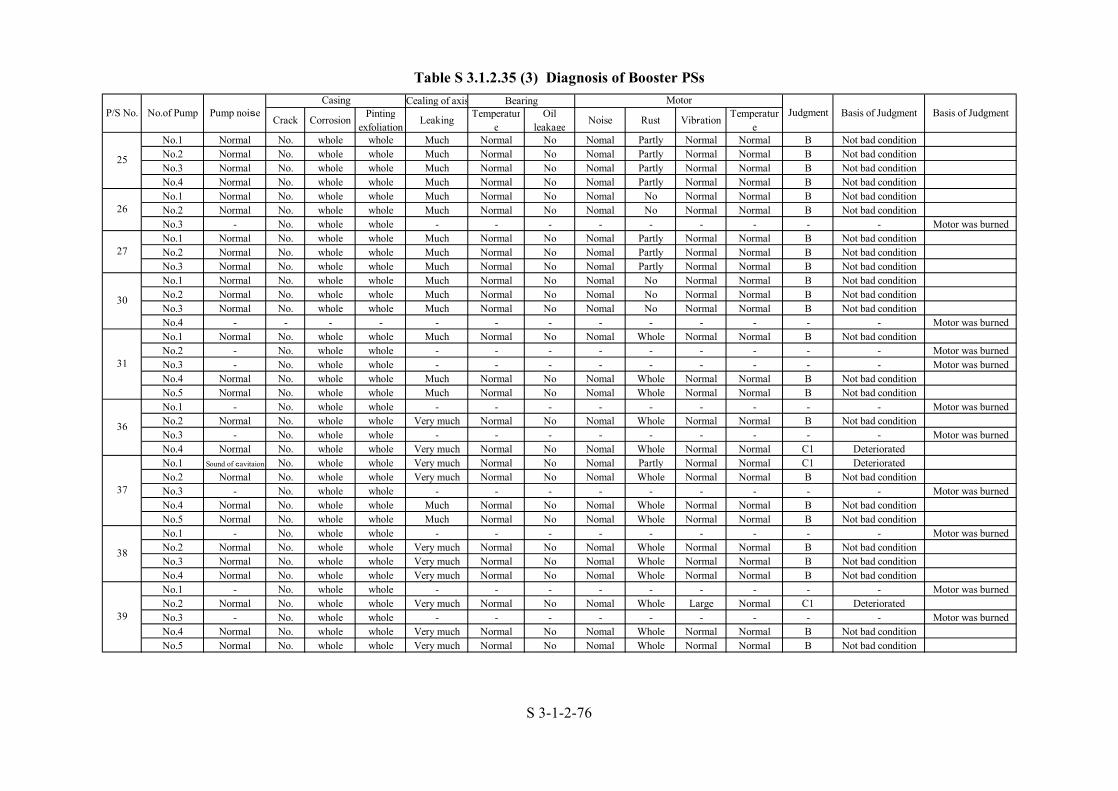
Table S 3.1.2.35 (3) Diagnosis of Booster PSsCealing of axis
Crack Corrosion Pintingexfoliation
Leaking Temperature
Oilleakage
Noise Rust Vibration Temperature
No.1 Normal No. whole whole Much Normal No Nomal Partly Normal Normal B Not bad conditionNo.2 Normal No. whole whole Much Normal No Nomal Partly Normal Normal B Not bad conditionNo.3 Normal No. whole whole Much Normal No Nomal Partly Normal Normal B Not bad conditionNo.4 Normal No. whole whole Much Normal No Nomal Partly Normal Normal B Not bad conditionNo.1 Normal No. whole whole Much Normal No Nomal No Normal Normal B Not bad conditionNo.2 Normal No. whole whole Much Normal No Nomal No Normal Normal B Not bad conditionNo.3 - No. whole whole - - - - - - - - - Motor was burnedNo.1 Normal No. whole whole Much Normal No Nomal Partly Normal Normal B Not bad conditionNo.2 Normal No. whole whole Much Normal No Nomal Partly Normal Normal B Not bad conditionNo.3 Normal No. whole whole Much Normal No Nomal Partly Normal Normal B Not bad conditionNo.1 Normal No. whole whole Much Normal No Nomal No Normal Normal B Not bad conditionNo.2 Normal No. whole whole Much Normal No Nomal No Normal Normal B Not bad conditionNo.3 Normal No. whole whole Much Normal No Nomal No Normal Normal B Not bad conditionNo.4 - - - - - - - - - - - - - Motor was burnedNo.1 Normal No. whole whole Much Normal No Nomal Whole Normal Normal B Not bad conditionNo.2 - No. whole whole - - - - - - - - - Motor was burnedNo.3 - No. whole whole - - - - - - - - - Motor was burnedNo.4 Normal No. whole whole Much Normal No Nomal Whole Normal Normal B Not bad conditionNo.5 Normal No. whole whole Much Normal No Nomal Whole Normal Normal B Not bad conditionNo.1 - No. whole whole - - - - - - - - - Motor was burnedNo.2 Normal No. whole whole Very much Normal No Nomal Whole Normal Normal B Not bad conditionNo.3 - No. whole whole - - - - - - - - - Motor was burnedNo.4 Normal No. whole whole Very much Normal No Nomal Whole Normal Normal C1 DeterioratedNo.1 Sound of cavitaion No. whole whole Very much Normal No Nomal Partly Normal Normal C1 DeterioratedNo.2 Normal No. whole whole Very much Normal No Nomal Whole Normal Normal B Not bad conditionNo.3 - No. whole whole - - - - - - - - - Motor was burnedNo.4 Normal No. whole whole Much Normal No Nomal Whole Normal Normal B Not bad conditionNo.5 Normal No. whole whole Much Normal No Nomal Whole Normal Normal B Not bad conditionNo.1 - No. whole whole - - - - - - - - - Motor was burnedNo.2 Normal No. whole whole Very much Normal No Nomal Whole Normal Normal B Not bad conditionNo.3 Normal No. whole whole Very much Normal No Nomal Whole Normal Normal B Not bad conditionNo.4 Normal No. whole whole Very much Normal No Nomal Whole Normal Normal B Not bad conditionNo.1 - No. whole whole - - - - - - - - - Motor was burnedNo.2 Normal No. whole whole Very much Normal No Nomal Whole Large Normal C1 DeterioratedNo.3 - No. whole whole - - - - - - - - - Motor was burnedNo.4 Normal No. whole whole Very much Normal No Nomal Whole Normal Normal B Not bad conditionNo.5 Normal No. whole whole Very much Normal No Nomal Whole Normal Normal B Not bad condition
38
39
30
31
36
37
25
26
27
P/S No. No.of Pump Pump noiseCasing Motor
Judgment Basis of Judgment Basis of JudgmentBearing
S 3-1-2-76

Table S 3.1.2.35 (4) Diagnosis of Booster PSsCealing of axis
Crack Corrosion Pintingexfoliation
Leaking Temperature
Oilleakage
Noise Rust Vibration Temperature
No.1 Normal No. whole whole Very much Normal No Nomal Whole Normal Normal C1 DeterioratedNo.2 - No. whole whole - - - - - - - - - Motor was burnedNo.3 - No. whole whole - - - - - - - - - Motor was burnedNo.4 - No. whole whole - - - - - - - - - Motor was burnedNo.5 Normal No. whole whole Very much Normal No Nomal Whole Normal Normal C1 DeterioratedNo.1 Normal No. whole whole Very much Normal No Noisy Whole Normal Normal C1 DeterioratedNo.2 - No. whole whole - - - - - - - - - Motor was burnedNo.3 Normal No. whole whole - - - - - - - - - Motor was burnedNo.4 - No. whole whole Much Normal No Nomal Whole Normal Normal B Not bad conditionNo.5 Normal No. whole whole Much Normal No Nomal Whole Normal Normal B Not bad conditionNo.1 Normal No. whole whole Much Normal No Nomal Whole Normal Normal B Not bad conditionNo.2 Normal No. whole whole Much Normal No Nomal Whole Normal Normal B Not bad conditionNo.3 Normal No. whole whole Much Normal No Nomal Whole Normal Normal B Not bad conditionNo.4 Normal No. whole whole Much Normal No Nomal Whole Normal Normal B Not bad conditionNo.5 - No. whole whole - - - - - - - - - Motor was burnedNo.6 - No. whole whole - - - - - - - - - Motor was burnedNo.1 Normal No. whole whole Much Normal No Nomal Whole Normal Normal B Not bad conditionNo.2 - No. whole whole - - - - - - - - - Motor was burnedNo.3 Normal No. whole whole Much Normal No Nomal Whole Normal Normal B Not bad conditionNo.4 Normal No. whole whole Much Normal No Nomal Whole Normal Normal B Not bad conditionNo.5 Normal No. whole whole Much Normal No Nomal Whole Normal Normal B Not bad conditionNo.1 Normal No. whole whole Much Normal No Nomal Partly Normal Normal B Not bad conditionNo.2 Normal No. whole whole Much Normal No Nomal Partly Normal Normal B Not bad conditionNo.3 Normal No. whole whole Much Normal No Nomal Partly Normal Normal B Not bad conditionNo.1 Normal No. No No Little Normal No Nomal No Normal Normal B Not bad conditionNo.2 Normal No. No No Little Normal No Nomal No Normal Normal B Not bad conditionNo.1 Normal No. whole whole Very much Normal No Nomal Partly Normal Normal B Not bad conditionNo.2 Normal No. whole whole Very much Normal No Nomal Partly Normal Normal B Not bad conditionNo.1 Normal No. partly partly Much Normal No Nomal Partly Normal Normal B Not bad conditionNo.2 Normal No. partly partly Much Normal No Nomal Partly Normal Normal B Not bad conditionNo.1 Normal No. whole whole Much Normal No Nomal No Normal Normal B Not bad conditionNo.2 Normal No. whole whole Much Normal No Nomal No Normal Normal B Not bad conditionNo.1 Normal No. partly partly Much Normal No Nomal Partly Normal Normal B Not bad conditionNo.2 Normal No. partly partly Much Normal No Nomal Partly Normal Normal B Not bad conditionNo.3 Normal No. partly partly Much Normal No Nomal Partly Normal Normal B Not bad conditionNo.1 Normal No. whole whole Much Normal No Nomal Whole Normal Normal B Not bad conditionNo.2 Normal No. whole whole Much Normal No Nomal Whole Normal Normal B Not bad conditionNo.3 Normal No. whole whole Much Normal No Nomal Whole Normal Normal B Not bad conditionNo.4 - No. whole whole - Normal - - - - - - - Motor was burnedNo.5 Normal No. whole whole Much Normal No Nomal Whole Normal Normal B Not bad condition
60
55
56
58
59
51
52
53
54
40
43
P/S No. No.of Pump Pump noiseCasing Motor
Judgment Basis of Judgment Basis of JudgmentBearing
S 3-1-2-77

Table S 3.1.2.35 (5) Diagnosis of Booster PSsCealing of axis
Crack Corrosion Pintingexfoliation
Leaking Temperature
Oilleakage
Noise Rust Vibration Temperature
No.1 Normal No. whole whole Much Normal No Nomal Partly Normal Normal B Not bad conditionNo.2 Normal No. whole whole Much Normal No Nomal Partly Normal Normal B Not bad condition
63 No.1 Normal No. whole whole 少ない Normal No Nomal No Normal Normal B Not bad conditionNo.1 Normal No. whole whole Much Normal No Nomal - - - - - Motor was burnedNo.2 Normal No. whole whole Much Normal No Nomal Whole Normal Normal B Not bad conditionNo.3 Normal No. whole whole Much Normal No Nomal Whole Normal Normal B Not bad conditionNo.4 Normal No. whole whole Much Normal No Nomal Whole Normal Normal B Not bad conditionNo.5 Normal No. whole whole Much Normal No Nomal Whole Normal Normal B Not bad conditionNo.1 Normal No. whole whole Much Normal No Nomal Whole Normal Normal B Not bad conditionNo.2 Normal No. whole whole Much Normal No Nomal Whole Normal Normal B Not bad conditionNo.3 Normal No. whole whole Much Normal No Nomal Whole Normal Normal B Not bad conditionNo.4 Normal No. whole whole Much Normal No Nomal Whole Normal Normal B Not bad conditionNo.5 Normal No. whole whole Much Normal No Nomal Whole Normal Normal B Not bad conditionNo.1 - - - - - - - - - - Not InstalledNo.2 Normal No. whole whole Much Normal No Nomal No Normal Normal B Not bad conditionNo.3 Normal No. whole whole Much Normal No Nomal No Normal Normal B Not bad conditionNo.4 Normal No. whole whole Much Normal No Nomal No Normal Normal B Not bad conditionNo.5 Normal No. whole whole Much Normal No Nomal No Normal Normal B Not bad conditionNo.1 Normal No. whole whole Much Normal No Nomal No Normal Normal B Not bad conditionNo.2 Normal No. whole whole Much Normal No Nomal No Normal Normal B Not bad conditionNo.1 Normal No. whole whole Much Normal No Nomal No Normal Normal B Not bad conditionNo.2 - - - - - - - - - - Not InstalledNo.3 - - - - - - - - - - Not InstalledNo.4 Normal No. whole whole Much Normal No Nomal No Normal Normal B Not bad conditionNo.5 Normal No. whole whole Much Normal No Nomal No Normal Normal B Not bad conditionNo.1 Normal No. partly partly Much Normal No Nomal Partly Normal Normal B Not bad conditionNo.2 Normal No. partly partly Much Normal No Nomal Partly Normal Normal B Not bad conditionNo.3 Normal No. partly partly Much Normal No Nomal Partly Normal Normal B Not bad conditionNo.4 Normal No. partly partly Much Normal No Nomal Partly Normal Normal - - Bearing is repairingNo.5 Normal No. partly partly Much Normal No Nomal - - - - - Motor was burnedNo.1 Normal No. whole whole Much Normal No Nomal Whole Normal Normal B Not bad conditionNo.2 Normal No. whole whole Much Normal No Nomal Whole Normal Normal B Not bad conditionNo.3 Normal No. whole whole Much Normal No Nomal Whole Normal Normal B Not bad conditionNo.4 Normal No. whole whole Much Normal No Nomal Whole Normal Normal B Not bad conditionNo.5 Normal No. whole whole Much Normal No Nomal Whole Normal Normal B Not bad conditionNo.1 Normal No. whole whole Much Normal No Nomal Whole Normal Normal B Not bad conditionNo.2 Normal No. whole whole Much Normal No Nomal Whole Normal Normal B Not bad conditionNo.3 Normal No. whole whole Much Normal No Nomal Whole Normal Normal B Not bad conditionNo.4 Normal No. whole whole Much Normal No Nomal Whole Normal Normal B Not bad conditionNo.5 Normal No. whole whole Much Normal No Nomal Whole Normal Normal B Not bad condition
67
69
70
71
62
64
65
P/S No. No.of Pump Pump noiseCasing Motor
Judgment Basis of Judgment Basis of Judgment
66
Bearing
S 3-1-2-78

Table S 3.1.2.35 (6) Diagnosis of Booster PSsCealing of axis
Crack Corrosion Pintingexfoliation
Leaking Temperature
Oilleakage
Noise Rust Vibration Temperature
No.1 Normal No. No No Much Normal No Nomal No Normal Normal B Not bad conditionNo.2 Normal No. No No Much Normal No Nomal No Normal Normal B Not bad conditionNo.3 Normal No. No No Much Normal No Nomal No Normal Normal B Not bad conditionNo.4 Normal No. No No Much Normal No Nomal No Normal Normal B Not bad conditionNo.1 Normal No. whole whole Much Normal No Nomal Whole Normal Normal B Not bad conditionNo.2 - No. whole whole - Normal No Nomal - - - - - Motor was burnedNo.3 Normal No. whole whole Much Normal No Nomal Whole Normal Normal B Not bad conditionNo.4 Normal No. whole whole Much Normal No Nomal Whole Normal Normal B Not bad conditionNo.5 - No. - - - Normal - Nomal - - - - - Not installed
No.1-1 - No. whole whole - Normal - Nomal - - - - Deteriorated Motor was burnedNo.1-2 - No. whole whole - Normal - Nomal - - - - Deteriorated Motor was burnedNo.2 Noisy No. whole whole Much Normal No Nomal Whole Normal Normal C2 DeterioratedNo.3 - No. No No No Normal No Nomal No Normal Normal A Not bad conditionNo.4 - No. whole whole - Normal - Nomal Whole - - C2 DeterioratedNo.1 Normal No. No No Much Normal No Nomal Partly Normal Normal C1 DeterioratedNo.2 Normal No. No No Normal Normal No Nomal Partly Normal Normal C1 DeterioratedNo.3 Normal No. No No Much Normal No Nomal Partly Normal Normal C1 DeterioratedNo.4 Normal No. No No Normal Normal No Nomal Partly Normal Normal - Deteriorated Bearing is repairingNo.5 Normal No. No No Normal Normal No Nomal - - - - Deteriorated Motor was burnedNo.6 Normal No. No No Much Normal No Nomal Partly Normal Normal C1 DeterioratedNo.7 Normal No. No No Normal Normal No Nomal Partly Normal Normal C1 DeterioratedNo.8 Normal No. No No Normal Normal No Nomal Partly Normal Normal C1 DeterioratedNo.1 Normal No. whole whole Much Normal No Nomal Partly Normal Normal B Not bad conditionNo.2 Normal No. whole whole Much Normal No Nomal Partly Normal Normal B Not bad conditionNo.3 Normal No. whole whole Much Normal No Nomal Partly Normal Normal B Not bad conditionNo.4 Normal No. whole whole Much Normal No Nomal Partly Normal Normal B Not bad conditionNo.5 Normal No. whole whole Much Normal No Nomal Partly Normal Normal B Not bad conditionNo.6 Normal No. whole whole Much Normal No Nomal Partly Normal Normal B Not bad conditionNo.1 - No. whole whole - - - - - - - - - Motor was burnedNo.2 Normal No. whole whole Very much Normal No Nomal Whole Normal Normal C2 DeterioratedNo.3 Normal No. whole whole Very much Normal No Nomal Whole Normal Normal C2 DeterioratedNo.4 Normal No. whole whole Very much Normal No Nomal Whole Normal Normal C2 DeterioratedNo.5 Normal No. whole whole Very much Normal No Nomal Whole Normal Normal C2 DeterioratedNo.1 Normal No. whole whole Very much Normal No Nomal Whole Normal Normal C2 DeterioratedNo.2 Normal No. whole whole Very much Normal No Nomal Whole Normal Normal C2 DeterioratedNo.3 Normal No. whole whole Very much Normal No Nomal Whole Normal Normal C2 DeterioratedNo.4 Normal No. whole whole Very much Normal No Nomal Whole Normal Normal C2 DeterioratedNo.5 - - - - - - - - - - - - - Motor was burned
77
79
80
72
73
74
75
P/S No. No.of Pump Pump noiseCasing Motor
Judgment Basis of Judgment Basis of JudgmentBearing
S 3-1-2-79

Table S 3.1.2.35 (7) Diagnosis of Booster PSsCealing of axis
Crack Corrosion Pintingexfoliation
Leaking Temperature
Oilleakage
Noise Rust Vibration Temperature
No.1 Normal No. whole whole Very much Normal No Nomal Whole Normal High C2 DeterioratedNo.2 - No. whole whole - - - - - - - - -No.3 Normal No. whole whole Very much Normal No Nomal Whole Normal Normal C2 DeterioratedNo.4 Normal No. whole whole Very much Normal No Noisy Whole Normal Normal C2 DeterioratedNo.5 Normal No. whole whole Very much Normal No Nomal Whole Normal Normal C2 DeterioratedNo.1 Normal No. whole whole Very much Normal No Nomal Whole Normal Normal C2 DeterioratedNo.2 - No. whole whole - - - - - - - - -No.3 - whole whole - - - - - - - - -No.4 Normal Yes whole whole Very much Normal No Nomal Whole Normal Normal C2 DeterioratedNo.1 Normal No. whole whole Very much Normal No Nomal Whole Normal Normal C2 DeterioratedNo.2 Normal No. whole whole Very much Normal No Nomal Whole Normal Normal C2 DeterioratedNo.3 Normal No. whole whole Very much Normal No Nomal Whole Normal Normal C2 DeterioratedNo.4 Normal No. whole whole Very much Normal No Nomal Whole Normal Normal C2 DeterioratedNo.5 Normal No. whole whole Very much Normal No Nomal Whole Normal Normal C2 DeterioratedNo.1 Normal No. whole whole Very much Normal No Nomal Whole Normal Normal C1 DeterioratedNo.2 Normal No. whole whole Very much Normal No Nomal Whole Normal Normal C1 DeterioratedNo.3 Normal No. whole whole Very much Normal No Nomal Whole Normal Normal C1 DeterioratedNo.4 Normal No. whole whole Very much Normal No Nomal Whole Normal Normal C1 DeterioratedNo.1 Normal No. whole whole Very much Normal No Nomal Whole Normal Normal C2 DeterioratedNo.2 - - - - - - - - - - - - - Motor was burnedNo.3 - No. whole whole - - - - - - - - - Motor was burnedNo.4 Normal No. whole whole Very much Normal No Nomal Whole Normal Normal C2 DeterioratedNo.1 Normal No. whole whole Very much Normal No Nomal Whole Normal Normal C2 DeterioratedNo.2 Normal No. whole whole Very much Normal No Nomal Whole Normal Normal C2 DeterioratedNo.3 - No. whole whole - - - - - - - - - Motor was burnedNo.4 Normal No. whole whole Very much Normal No Nomal Whole Normal Normal C2 DeterioratedNo.5 - No. whole whole - - - - - - - - - Motor was burnedNo.1 - No. whole whole - - - - - - - - - Motor was burnedNo.2 Normal No. whole whole Very much Normal No Nomal Whole Normal Normal C2 DeterioratedNo.3 Normal No. whole whole Very much Normal No Nomal Whole Normal Normal C2 DeterioratedNo.4 Normal No. whole whole Very much Normal No Nomal Whole Normal Normal C2 DeterioratedNo.1 - No. whole whole - - - - - - - - - Motor was burnedNo.2 Normal No. whole whole Very much Normal No Noisy Whole Normal Normal C2 DeterioratedNo.3 Normal No. whole whole Very much Normal No Nomal Whole Normal Normal C2 DeterioratedNo.4 Normal No. whole whole Very much Normal No Nomal Whole Normal Normal C2 DeterioratedNo.5 - No. whole whole - - - - - - - - - Motor was burnedNo.6 Normal No. whole whole Very much Normal No Nomal Whole Normal Normal C2 DeterioratedNo.1 Normal No. whole whole Very much Normal No Nomal Whole Normal Normal C2 DeterioratedNo.2 - - - - - - - - Whole - - - - Pump was repiaringNo.3 Normal No. whole whole Very much Normal No Nomal Whole Normal Normal C2 Deteriorated
95
96
97
98
82
83
84
85
81
MotorJudgment Basis of Judgment Basis of Judgment
BearingP/S No. No.of Pump Pump noise
Casing
S 3-1-2-80

Table S 3.1.2.35 (8) Diagnosis of Booster PSsCealing of axis
Crack Corrosion Pintingexfoliation
Leaking Temperature
Oilleakage
Noise Rust Vibration Temperature
No.1 Normal No. whole whole Very much Normal No Nomal Whole Normal Normal C2 DeterioratedNo.2 - - - - - - - - Whole - - - - Pump was repiaringNo.3 Normal No. whole whole Very much Normal No Nomal Whole Normal Normal C2 DeterioratedNo.1 Normal No. whole whole Very much Normal No Nomal Whole Normal Normal C2 DeterioratedNo.2 - No. whole whole - - - - - - - - - Motor was burnedNo.3 - No. whole whole - - - - - - - - - Motor was burnedNo.4 - No. whole whole - - - - - - - - - Motor was burnedNo.5 Normal No. whole whole Very much Normal No Nomal Whole Normal Normal C2 DeterioratedNo.1 - No. whole whole - - - - - - - - - Motor was burnedNo.2 - No. whole whole - - - - - - - - - Motor was burnedNo.3 - - - - - - - - - - - - - Motor was burnedNo.4 Normal No. whole whole Very much Normal No Nomal Whole Normal Normal C2 DeterioratedNo.5 Normal No. whole whole Very much Normal No Nomal Whole Normal Normal C2 DeterioratedNo.1 Normal No. whole whole Very much Normal No Nomal Whole Normal Normal C2 DeterioratedNo.2 - No. whole whole - - - - - - - - - Motor was burnedNo.3 - No. whole whole - - - - - - - - - Motor was burnedNo.4 - No. whole whole - - - - - - - - - Motor was burnedNo.5 Normal No. whole whole Very much Normal No Nomal Whole Normal Normal C2 DeterioratedNo.6 Normal No. whole whole Very much Normal No Nomal Whole Normal Normal C2 DeterioratedNo.1 Normal No. No No Normal Normal No Nomal Partly Normal Normal B Not bad conditionNo.2 Normal No. No No Normal Normal No Nomal Partly Normal Normal B Not bad conditionNo.3 Normal No. No No Normal Normal No Nomal Partly Normal Normal B Not bad conditionNo.4 Normal No. No No Normal Normal No Nomal Partly Normal Normal B Not bad conditionNo.5 Normal No. No No Normal Normal No Nomal Partly Normal Normal B Not bad conditionNo.1 Normal No. whole whole Normal Normal No Nomal Whole Normal Normal C1 DeterioratedNo.2 Normal No. whole whole Normal Normal No Nomal Whole Normal Normal B Not bad conditionNo.3 Normal No. whole whole Normal Normal No Nomal Whole Normal Normal B Not bad conditionNo.4 Normal No. whole whole Normal Normal No Nomal Whole Normal Normal B Not bad conditionNo.5 Normal No. whole whole Normal Normal No Nomal Whole Normal Normal B Not bad conditionNo.1 Normal No. partly partly Normal Normal No Nomal Whole Normal Normal B Not bad conditionNo.2 Normal No. partly partly Normal Normal No Nomal Whole Normal Normal B Not bad conditionNo.3 Normal No. No No Normal Normal No Nomal Partly Normal Normal B Not bad conditionNo.4 Normal No. partly partly Normal Normal No Nomal Whole Normal Normal B Not bad conditionNo.5 - No. partly partly - - - - - - - - - Motor was burned
No.6-1 Normal No. No No Normal Normal No Nomal Partly Normal Normal B Not bad conditionNo.6-2 Normal No. whole whole Normal Normal No Nomal Whole Normal Normal B Not bad condition
117
118
119
99
103
105
108
P/S No. No.of Pump Pump noiseCasing Bearing Motor
Judgment Basis of Judgment Basis of Judgment
S 3-1-2-81

Table S 3.1.2.35 (9) Diagnosis of Booster PSsCealing of axis
Crack Corrosion Pintingexfoliation
Leaking Temperature
Oilleakage
Noise Rust Vibration Temperature
No.1 - - - - - - - - - - - - Motor was burnedNo.2 Normal No. whole whole Normal Normal No Nomal Whole Normal Normal B Not bad conditionNo.3 Normal No. whole whole Normal Normal No Nomal Whole Normal Normal B Not bad conditionNo.4 Normal No. whole whole Normal Normal No Nomal Whole Normal Normal B Not bad conditionNo.5 Normal No. whole whole Normal Normal No Nomal Whole Normal Normal B Not bad conditionNo.1 Normal No. whole whole Much Normal No Nomal Whole Normal Normal B Not bad conditionNo.2 Normal No. whole whole Much Normal No Nomal Whole Normal Normal B Not bad conditionNo.1 Normal No. No No Normal No Nomal No Normal Normal B Not bad conditionNo.2 Normal No. No No Normal Normal No Nomal No Normal Normal B Not bad conditionNo.3 Normal No. No No Normal Normal No Nomal No Normal Normal B Not bad conditionNo.1 Normal No. whole whole Very much Normal No Nomal Whole Normal Normal C2 DeterioratedNo.2 Normal No. whole whole Very much Normal No Nomal Whole Normal Normal C2 DeterioratedNo.3 Normal No. whole whole Very much Normal No Nomal Whole Normal Normal C2 DeterioratedNo.4 Normal No. whole whole Very much Normal No Nomal Whole Normal Normal C2 DeterioratedNo.1 Normal No. whole whole Very much Normal No Nomal Whole Normal Normal B Not bad conditionNo.2 Normal No. whole whole Very much Normal No Nomal Whole Normal Normal B Not bad conditionNo.3 - No. whole whole - - - - - - - - - Motor was burnedNo.4 Normal No. whole whole Very much Normal No Nomal Whole Normal Normal B Not bad conditionNo.5 - No. whole whole - - - - - - - - - Motor was burnedNo.6 Normal No. whole whole Very much Normal No Nomal Whole Normal Normal B Not bad conditionNo.7 Normal No. whole whole Very much Normal No Nomal Whole Normal Normal B Not bad conditionNo.8 Normal No. whole whole Very much Normal No Nomal Whole Normal Normal B Not bad conditionNo.1 - - - - - - - - - - Motor was burnedNo.2 Normal No. whole whole Very much Normal No Nomal Whole Normal Normal C2 DeterioratedNo.3 Normal No. whole whole Very much Normal No Nomal Whole Normal Normal C2 DeterioratedNo.4 Normal No. whole whole Very much Normal No Nomal Whole Normal Normal C2 DeterioratedNo.5 Normal No. whole whole Very much Normal No Nomal Whole Normal Normal C2 Deteriorated
No.1-1 Normal No. whole whole Very much Normal No Nomal Whole Normal Normal C2 DeterioratedNo.1-2 Normal No. whole whole Very much Normal No Nomal Whole Normal Normal C2 DeterioratedNo.2 Normal No. whole whole Very much Normal No Nomal Whole Normal Normal C2 DeterioratedNo.3 Normal No. whole whole Very much Normal No Nomal Whole Normal Normal C2 DeterioratedNo.4 Normal No. whole whole Very much Normal No Nomal Whole Normal Normal C2 DeterioratedNo.5 - - - - - - - - - - Motor was burnedNo.6 Normal No. whole whole Very much Normal No Nomal Whole Normal Normal C2 DeterioratedNo.7 Normal No. whole whole Very much Normal No Nomal Whole Normal Normal C2 DeterioratedNo.1 Normal No. whole whole Very much Normal No Nomal Whole Normal Normal C2 DeterioratedNo.2 Normal No. whole whole Very much Normal No Nomal Whole Normal Normal C2 DeterioratedNo.3 Normal No. whole whole Very much Normal No Nomal Whole Normal Normal C2 DeterioratedNo.4 Normal No. whole whole Very much Normal No Nomal Whole Normal Normal C2 DeterioratedNo.5 Normal No. whole whole Very much Normal No Nomal Whole Normal Normal C2 Deteriorated
132
133
134
126
127
130
131
121
P/S No. No.of Pump Pump noiseCasing
Basis of JudgmentBearing Motor
Judgment Basis of Judgment
S 3-1-2-82

The Study on Restructuring of Water Supply System Volume 3. Supporting Report of Tashkent City in the Republic of Uzbekistan March 2006
S 3-1-3-1
S 3.1.3 Evaluation of Groundwater Source of Kibray WTP
(1) Current Conditions and Problems for Existing Well System
1) Yield Amount and Operation Status of Wells
The operational data of Kibray WTP such as the monthly average intake amount and op-
eration number of wells from February 2002 to April 2003 are shown in Table S 3.1.3.1,
Figure S 3.1.2.1 and Figure S 3.1.3.2.
Table S .3.1.3.1 Wells Yield Amount and Operation Number
Year 2002
Month 1 2 3 4 5 6 7 8 9 10 11 12Intake Amount (m3/day) 338,252 380,996 423,098 422,782 420,702 452,684 451,126 406,474 367,930 392,800 378,182
Right Bank 23 16 23 18 23 25 24 21 21 23 23Left Bank 38 32 31 32 29 28 35 33 29 35 37
Numbers of Operating
Wells Total 61 48 54 50 52 53 59 54 50 58 60Right Bank 88.5 61.5 88.5 69.2 88.5 96.2 92.3 80.8 80.8 88.5 88.5Left Bank 55.1 46.4 44.9 46.4 42.0 40.6 50.7 47.8 42.0 50.7 53.6
Percentage of Operating
Wells Total 64.2 50.5 56.8 52.6 54.7 55.8 62.1 56.8 52.6 61.1 63.2Year 2003
Month 1 2 3 4Average
Intake Amount (m3/day) 348,014 342,800 355,100 391,595 403,184
Right Bank 22 19 20 16 22 Left Bank 41 40 36 38 33
Numbers of Operating
Wells Total 63 59 56 54 54 Right Bank 84.6 73.1 76.9 61.5 83.9 Left Bank 59.4 58.0 52.2 55.1 47.3
Percentage of Operating
Wells Total 66.3 62.1 58.9 56.8 57.3
As shown in the table and figures,
the maximum yield amount exceeded
450,000 m3/d, the minimum yield
amount was around 350,000 m3/d,
and the average of this duration was
around 392,000 m3/d. While design
capacity of Kibray WTP is 455,200
m3/d, the capacity decline was not so
large based on these data. Figure S .3.1.3.1 Total Yield Amount
0
100,000
200,000
300,000
400,000
500,000
2 3 4 5 6 7 8 9 10 11 12 1 2 3 4
2003
Inta
ke A
mou
nt (m
3 /day
)
2002

The Study on Restructuring of Water Supply System Volume 3. Supporting Report of Tashkent City in the Republic of Uzbekistan March 2006
S 3-1-3-2
Figure S3.1.3.2 Operation Number and Ratio of Wells
Figure S 3.1.3.3 shows the water balance of Kibray WTP.
Kibray WTP receives transmission water from Kadirya WTP, and distributes mixed water
with intake yield of wells to the City. Total major inlet and outlet pipes of the WTP are six
(6); however, a half of flow meters of the pipes were out of order for long time.
Figure S 3.1.3.3 Water Balance of Kibray WTP
Distribution amount from Kibray WTP was estimated to be 650,000-750,000 m3/d and
treated water was transmitted from Kadirya WTP. The transmission amount from Kadirya
WTP had been estimated less than 300,000m3/d until January 2004, when the transmission
flow was measured by an ultra-sonic flow meter in Kadirya WTP and the measured result
was around 400,000m3/d. It means that the yield amount mentioned above may be over-
estimated, because the well’s yield amount was estimated to be the total distribution amount
to the city minus estimated transmission amount from Kadirya WTP.
Total Distribtionamount to the City650-750x103m3/d
Transmission amountfrom Fadirya WTP350-400x103m3/d
Right Bank
Left Bank
Chirchik River
Distribution
Transmission pipe fromKadirya WTP
From wells
Distribution pipes
0
20
40
60
80
2 3 4 5 6 7 8 9 10 11 12 1 2 3 4
2002 2003
Num
bers
of O
pera
ting
Wel
ls
0
20
40
60
80
100
Perc
enta
ge o
f Ope
ratin
g W
ells
Right BankLeft BankTotalRight BankLeft BankTotal

The Study on Restructuring of Water Supply System Volume 3. Supporting Report of Tashkent City in the Republic of Uzbekistan March 2006
S 3-1-3-3
Thus if the transmission amount from Kadirya WTP was at 400,000m3/d, yield amount of
Kibray WTP was 250,000-350,000m3/d. The maximum intake amount is presented in the
summer season and the minimum is presented in winter, while the water flow of the
Chirchik River is plentiful from spring to summer and that is little in the winter season.
However, as shown in Table 2.1.2 (2), precipitation in summer is lowest and that in winter is
relatively high. Since the water flow of the Chirchik River relies on the discharge flow from
Charvak Dam, which is shown in Figure 2.1.4, the flow fluctuation mentioned above is
caused.
The operation ratio of wells at the right bank is around 80% and that at the left bank is less
than 50%. The reason why the ratio of the left bank was low is said that 1) the level of
groundwater at the left bank easily falls
and well’s pumps brake down by dry
operation, and 2) the liability of pumps
recently installed in the wells at the left
bank is low.
Recent data for the yield amount are
shown in Figure S 3.1.3.4 based on
Table S 3.1.3.2. Operation number of
wells and ratio are
shown in Figure S
3.1.3.5.
The yield amount is
the total of each
well’s yield, and the
total value was
checked by the flow
meters of the inlet and Figure S 3.1.3.5 Wells Operation Number and Ratio
outlet pipes of the WTP, which previously broken meters were repaired.
0
100,000
200,000
300,000
400,000
500,000
Jul. Aug. Sep. Oct. Nov. Dec.
Inta
ke A
mou
nt (m
3 /day
)
TotalRightLeft
0
20
40
60
80
Jul. Aug. Sep. Oct. Nov. Dec.
Num
bers
of O
pera
ting
Wel
ls
0
20
40
60
80
100
Rat
o of
Ope
ratin
g W
ells
(%)
Right BankLeft BankTotalRight BankLeft BankTotal
Figure S 3.1.3.4 Intake Amount in 2004

The Study on Restructuring of Water Supply System Volume 3. Supporting Report of Tashkent City in the Republic of Uzbekistan March 2006
S 3-1-3-4
. Table S 3.1.3.2 Monthly Intake Amount of Groundwater in 2004 Intake Amount (m3/day) Intake Amount (m3/day) Well
No. Altitude
Jul. Aug. Sep. Oct. Nov. Dec. Average Well No.
Altitude Jul. Aug. Sep. Oct. Nov. Dec. Average
Right Bank 50 520.2 8,400 11,760 10,800 9,600 n.m. 10,800 10,2721 503.9 13,008 7,200 11,040 7,200 n.m. 10,800 9,850 51 521.3 repair repair repair repair repair repair2 503.7 8,160 7,920 8,400 n.m. n.m. 9,120 8,400 52 524.4 13,200 12,000 14,400 11,280 n.m. 10,800 12,3363 503.5 6,000 3,432 3,120 2,640 n.m. 3,600 3,758 53 496.6
4 503.0 10,800 7,200 11,160 10,560 n.m. 10,560 10,056 54 498.3
5 503.7 9,600 9,120 8,400 7,200 n.m. 9,120 8,688 55 500.5
6 503.8 8,880 8,160 7,920 7,680 n.m. repair 8,160 56 501.7
7 503.5 8,280 7,200 9,600 8,880 n.m. 8,400 8,472 57 503.4
8 503.9 11,040 n.m. n.m. 10,800 n.m. n.m. 10,920 58 505.4 8,160 7,920 8,400 7,200 n.m. repair 7,9209 505.0 8,400 7,200 10,080 8,160 n.m. 9,600 8,688 59 507.2 9,240 9,120 7,680 8,160 n.m. 8,400 8,520
10 504.3 11,520 8,760 14,400 10,800 n.m. 10,800 11,256 60 509.5 repair repair repair repair n.m. repair 11,04011 503.8 3,840 4,080 4,320 repair repair repair 4,080 61 510.7 9,840 7,680 n.m. 3,600 n.m. repair 7,38012 505.6 9,600 8,160 8,400 repair n.m. 7,920 8,520 62 512.5 repair n.m. n.m. n.m. n.m. n.m. 3,12013 506.2 8,880 8,880 8,640 6,960 n.m. 8,400 8,352 63 514.3 n.m. repair n.m. n.m. n.m. n.m. 11,16014 506.8 12,000 8,160 repair 7,680 n.m. 9,840 9,420 64 506.4 n.m. n.m. n.m. n.m. n.m. n.m. n.m
14a 504.9 6,120 5,280 repair repair repair repair 5,700 65 513.6 5,760 6,120 6,120 5,760 n.m. 5,760 5,90415 503.1 12,600 7,200 11,520 8,640 n.m. 10,320 10,056 66 507.4 14,400 12,000 14,400 11,280 repair 11,280 12,67216 503.1 10,800 7,440 8,640 7,200 n.m. 7,440 8,304 67 508.9 repair repair repair repair17 504.4 2,640 3,120 repair repair repair repair 2,880 68 510.5 repair repair repair repair repair repair18 506.8 3,120 2,640 3,120 2,640 n.m. repair 2,880 69 510.8 n.m. n.m. n.m. n.m. n.m. n.m. n.m19 507.4 4,920 6,480 4,560 3,960 n.m. 4,800 4,944 70 512.3 repair n.m. repair repair repair repair n.m20 508.9 6,720 7,200 9,600 8,160 n.m. 9,600 8,256 71 513.2 n.m. repair repair repair repair repair21 510.9 7,920 5,280 8,160 7,200 n.m. 6,720 7,056 72 514.2 repair repair repair repair repair repair22 512.2 repair 5,520 repair repair n.m. 6,000 5,760 73 514.1 n.m. n.m. n.m. n.m. repair repair n.m23 514.6 74 515.1 repair repair repair repair repair repair24 516.4 8,880 5,520 6,720 7,680 n.m. 7,200 7,200 75 516.8 4,080 3,600 6,720 5,280 repair repair 4,92025 517.3 repair repair repair repair repair repair 76 518.2 5,040 2,640 6,000 4,800 n.m. 6,000 4,896
Right Bank 77 519.2 3,600 4,080 repair 4,560 n.m. 4,800 4,26026 502.5 78 520.3 repair repair repair repair repair repair27 504.2 79 521.7 repair repair repair repair repair repair28 506.6 80 522.2 5,760 5,760 6,120 6,120 repair repair 5,94029 508.0 8,640 9,600 8,880 8,640 n.m. 8,400 8,832 81 523.2 4,080 4,440 4,800 repair n.m. repair 4,44030 509.8 1G 508.6
31 510.7 repair repair repair repair repair repair 2G 507.1 5,880 6,000 4,800 6,120 repair repair 5,70032 512.7 6,000 5,760 5,040 4,080 n.m. 6,120 5,400 3G 507.7
33 514.6 repair repair repair repair repair repair 4G 510.7
34 516.5 4,800 5,280 5,760 5,040 n.m. 9,120 6,000 13P 512.7
35 518.0 repair repair repair repair repair repair 14P 513.6
36 520.1 repair repair repair repair repair repair 15P 511.0
37 522.0 repair 7,200 7,920 7,200 repair repair 7,440 16P 511.9
38 524.2 8,880 7,440 7,200 7,680 n.m. 10,080 8,256 33P 508.0 2,400 2,400 2,760 3,360 n.m. 2,400 2,66439 500.5 34P 509.9 5,040 4,800 4,800 4,560 n.m. repair 4,80040 502.0 35P 511.2 repair repair repair repair repair repair41 505.6 Right 193,728 151,152 157,800 134,040 143,040 181,65642 506.3 11,520 12,000 14,400 11,040 n.m. 10,800 11,952 Left 187,440 193,032 191,280 169,272 155,280 221,18943 507.1 2,040 2,352 2,280 2,232 n.m. 2,040 2,189
Intake Amount
Total 381,168 344,184 349,080 303,312 298,320 402,84544 509.3 4,800 10,320 10,320 9,960 n.m. 9,600 9,000 Right 23 24 20 19 21 18 2445 511.3 10,080 9,840 9,600 repair n.m. 10,320 9,960 Left 32 33 32 31 27 24 3546 512.7 9,000 8,280 7,200 7,320 repair 9,120 8,184
Operation Number
Total 55 57 52 50 48 42 5947 514.3 9,600 7,200 7,680 6,720 n.m. 10,320 8,304 Right 88.5 92.3 76.9 73.1 80.8 69.2 92.348 516.9 7,200 7,440 7,200 7,680 n.m. 9,120 7,728 Left 46.4 47.8 46.4 44.9 39.1 34.8 50.749 519.0 n.m. n.m n.m. n.m. n.m. n.m. n.m
% of Operation
wells Total 57.9 60.0 54.7 52.6 50.5 44.2 62.1

The Study on Restructuring of Water Supply System Volume 3. Supporting Report of Tashkent City in the Republic of Uzbekistan March 2006
S 3-1-3-5
Thus, the intake amount of this duration was reliable. The yield amount was obviously down
and the operation ratio was also fallen compared to the data as shown in Table S 3.1.3 1.
Each yield capacity of well based on the data from July to December in 2004 was presented in
Table S 3.1.3.2. At the right bank, the average yield amount of wells exceeded 7,400m3/d and
the figure shows that the yield amount of each well at inland is larger than that of along the
Chirchik River.
The wells, which have never operated, were just two at right bank.
Figure S .3.1.3.6 Average Yield Capacity of Wells in 2004
24.819.9
19.921.8
21.819.9
22.6
28.6
43.5
39.9
37.2
49.6
47.8
49.645.2
43.5 49.645.2
57.149.6
11.95.66.65.8 12.9
12.6 7.19.1 11.9 5.36.6
8.26.610.2
6.6
5.8
7.16.6 11.9
7.5
9.1 10.2
7.5 6.67.1
5.38.2
7.57.5
9.1
8.2
4.0
Legend
Well, Satisfied Satandard Value
Well, Exceeded Satandard Value
Unit : mg/L
Sampling Date : Oct., 2004
0
- 2,500
- 5,000
- 7,500
- 10,000
10,000 -
m3/day
Non Measured

The Study on Restructuring of Water Supply System Volume 3. Supporting Report of Tashkent City in the Republic of Uzbekistan March 2006
S 3-1-3-6
At the left bank, the average yield amount of wells is similar to that at the right bank, and it is
a feature that yields of the wells along the river and yields of the wells’ row, which is the
farthest away from the river, were little.
Around a half of the wells at the left bank have never been operated, and especially, most of
wells at down stream areas and along the river were not operated. The reason why wells at
down stream areas were not operated is assumed that the gradient of intake pipes of the wells is
large and the transmission pipe from upstream and down stream is connected directly as shown
in Figure S 3.1.3 7. Therefore, the well pumps at down stream site may be broken by water
pressure.
Figure S 3.1.3.7 Inclination of Ground and a Problem of Transmission
Distance of each well, minimum less than 100m, along the river is so small that the mutual
interference of wells takes place. It causes a lowering of underwater level in the wells and
breakdowns of well pumps by dry operation.
2) Deterioration of Wells
Installation of wells in Kibray WTP was started in 1950th and it was almost completed in 1970th.
Therefore, over 40 years have passed after installation of old ones and those have become
deteriorated. In addition, since the pumps with largely excessive capacity are used for wells,
breakdowns of pumps have frequently taken place because of a dry operation by a drop of water
level or a vibration of pump caused by excessive closing of discharge valves.
To Reservoir Well pump
Deep wellsgroundwaterlevel
High pressure
Reverse pressure

The Study on Restructuring of Water Supply System Volume 3. Supporting Report of Tashkent City in the Republic of Uzbekistan March 2006
S 3-1-3-7
The Specific Capacity by the pump test just after construction of wells varies 4.5 -96.0
m3/sec/m and the average value is at 30m3/sec/m, relatively large. The values have been de-
creasing. The recommended yield capacities of wells based on the pump tests varied from 600
to 200 m3/hr, while the actual yield amount of many wells exceeded the recommended yield
capacity.
The Specific Capacity is defined as an intake amount, which can be withdrawn from
groundwater layer by dropping 1 m of water level. When the wells’ deterioration progresses,
that will become smaller. Table S 3.1.3.3 (1) to (3) shows comparison of well capacity between
just after construction and in 2004. Based on the table, Figure S 3.1.3.8 shows decline ratio of
Specific Capacities between the value just after construction and the current actual value.
24.819.9
19.921.8
21.819.9
22.6
28.6
43.5
39.9
37.2
49.6
47.8
49.645.2
43.5 49.645.2
57.149.6
11.95.66.65.8 12.9
12.6 7.19.1 11.9 5.3
6.68.26.6
10.2
6.6
5.8
7.16.6 11.9
7.5
9.1 10.2
7.5 6.67.1
5.38.2
7.57.5
9.1
8.2
4.0
Legend
Well, Satisfied Satandard Value
Well, Exceeded Satandard Value
Unit : mg/L
Sampling Date : Oct., 2004
0 - 25
25 - 50
50 - 75
75 -100
100<
%
Non Measured
Figure 3.1.3.8 Decline Ratio of Specific Capacity of Wells

The Study on Restructuring of Water Supply System Volume 3. Supporting Report of Tashkent City in the Republic of Uzbekistan March 2006
S 3-1-3-8
Table 3.1.3.3 (1) Comparison of Yield Capacity between just after Construction and in 2004 (1) Pumping Test Data at Construction Time At Present (2004)
Well No.
Const- ruction
Year Test
Yield (L/s)
Test Yield
(m3/hr)
Static Water Level
(GL-m)
Pumping Water Level
(GL-m)
Draw- down (m)
Specific Capacity (m3/hr/m)
Recom- mended
Intake Rate (m3/hr)
Actual Intake Rate
(m3/hr)
Static Water Level
(GL-m)
Pumping Water Level
(GL-m)
Draw- down (m)
Specific Capacity (m3/hr/m)
Decreasing Ratio of
Well Capacity (%)
Ratio of Over
Pumping (%)
1 1962 69.4 249.8 5.95 7.65 1.70 147.0 600 410.4 5.70 10.36 4.66 88.1 59.9 68.4 2 1960 150.0 540.0 2.00 6.00 4.00 135.0 600 350.0 4.87 10.60 5.73 61.1 45.3 58.3 3 1961 48.0 172.8 6.50 7.50 1.00 172.8 200 156.6 4.25 6.20 1.95 80.5 46.6 78.3 4 1954 66.0 237.6 4.50 12.00 7.50 31.7 280 419.0 6.43 10.95 4.52 92.6 292.4 149.6 5 1958 191.6 689.8 4.00 9.00 5.00 138.0 600 362.0 5.54 10.10 4.56 79.4 57.5 60.3 6 1958 177.0 637.2 2.00 8.00 6.00 106.2 600 370.0 5.20 9.35 4.15 89.2 84.0 61.7 7 1954 60.5 217.8 2.00 3.00 1.00 217.8 250 353.0 5.62 10.25 4.63 76.2 35.0 141.2 8 1956 18.0 64.8 2.57 3.00 0.43 150.7 600 455.0 5.95 11.25 5.30 85.8 57.0 75.8 9 1958 50.0 180.0 5.00 5.60 0.60 300.0 200 362.0 5.71 10.21 4.50 80.5 26.8 181.0
10 1956 38.8 139.7 5.00 5.50 0.50 279.4 200 469.0 5.86 9.83 3.97 118.1 42.3 234.5 11 1958 48.0 172.8 6.50 7.50 1.00 172.8 200 170.0 4.50 7.40 2.90 58.6 33.9 85.0 12 1958 78.3 281.9 4.50 8.00 3.50 80.5 320 355.0 5.91 11.18 5.26 67.5 83.8 110.9 13 1958 69.4 249.8 5.95 7.65 1.70 147.0 600 348.0 5.85 12.18 6.33 55.0 37.4 58.0 14 1960 61.0 219.6 5.10 7.10 2.00 109.8 200 416.7 5.15 10.23 5.08 82.0 74.7 208.3
14a 1965 51.0 183.6 3.90 5.40 1.50 122.4 200 237.5 4.50 5.98 1.48 161.0 131.5 118.8 15 1963 59.1 212.8 2.00 4.15 2.15 99.0 200 419.0 5.56 9.56 4.00 104.8 105.9 209.5 16 1963 40.0 144.0 4.50 6.50 2.00 72.0 200 346.0 5.66 11.54 5.88 58.8 81.7 173.0 17 1964 48.0 172.8 2.60 3.10 0.50 345.6 200 120.0 4.50 7.60 3.10 38.7 11.2 60.0 18 1964 52.2 187.9 3.05 4.30 1.25 150.3 200 120.0 4.48 8.15 3.68 32.7 21.7 60.0 19 1963 55.8 200.9 2.20 5.00 2.80 71.7 200 206.0 5.71 9.83 4.12 50.0 69.7 103.0 20 1964 50.0 180.0 3.30 5.20 1.90 94.7 200 344.0 5.44 10.46 5.02 68.5 72.3 172.0 21 1964 56.1 202.0 2.00 3.00 1.00 202.0 200 294.0 6.20 11.16 4.96 59.3 29.3 147.0 22 1965 58.8 211.7 2.00 4.00 2.00 105.8 200 240.0 5.70 11.50 5.80 41.4 39.1 120.0 23 600 24 1964 70.0 252.0 2.00 4.00 2.00 126.0 600 282.5 5.85 10.46 4.61 61.2 48.6 47.1 25 1965 58.3 209.9 2.20 4.20 2.00 104.9 200 26 1966 33.3 119.9 4.40 6.80 2.40 50.0 200-250 27 1966 40.0 144.0 4.50 5.60 1.10 130.9 250 28 1964 44.4 159.8 4.00 5.80 1.80 88.8 200 29 1967 55.5 199.8 1.80 4.80 3.00 66.6 200 370.0 5.11 10.50 5.39 68.7 103.1 185.0 30 1967 50.0 180.0 1.50 9.00 7.50 24.0 200 31 1965 44.4 159.8 4.00 5.80 1.80 88.8 200

The Study on Restructuring of Water Supply System Volume 3. Supporting Report of Tashkent City in the Republic of Uzbekistan March 2006
S 3-1-3-9
Table 3.1.3.3 (2) Comparison of Yield Capacity between just after Construction and in 2004 (2) Pumping Test Data at Construction Time At Present (2004)
Well No.
Const- ruction
Year Test
Yield (L/s)
Test Yield
(m3/hr)
Static Water Level
(GL-m)
Pumping Water Level
(GL-m)
Draw- down (m)
Specific Capacity
(m3/hr/m)
Recom- mended
Intake Rate(m3/hr)
Actual Intake Rate
(m3/hr)
Static Water Level
(GL-m)
Pumping Water Level
(GL-m)
Draw- down (m)
Specific Capacity (m3/hr/m)
Decreasing Ratio of
Well Capacity (%)
Ratio of Over Pumping (%)
32 1967 55.5 199.8 4.60 7.40 2.80 71.4 200 238.8 4.69 7.96 3.28 72.8 102.1 119.4 33 1966 50.0 180.0 5.10 6.70 1.60 112.5 200 34 1966 44.4 159.8 4.40 8.40 4.00 40.0 200 260.0 6.13 11.85 5.73 45.4 113.7 130.0 35 1966 50.0 180.0 4.50 8.30 3.80 47.4 200 36 1966 44.4 159.8 2.00 6.00 4.00 40.0 200 37 1966 44.4 159.8 2.20 5.10 2.90 55.1 200 300.0 4.00 10.70 6.70 44.8 81.2 150.0 38 1966 44.4 159.8 2.10 5.00 2.90 55.1 200 344.0 4.78 9.75 4.98 69.1 125.5 172.0 39 1969 58.8 211.7 3.70 5.60 1.90 111.4 200 40 1967 55.5 199.8 3.00 5.00 2.00 99.9 200 41 1967 51.1 184.0 7.50 10.30 2.80 65.7 200 42 1965 44.4 159.8 4.00 5.80 1.80 88.8 200 498.0 5.01 11.23 6.22 80.0 90.1 249.0 43 91.2 3.89 5.05 1.16 78.6 44 1968 29.7 106.9 4.10 10.60 6.50 16.4 200 375.0 6.00 11.00 5.00 74.9 455.6 187.5 45 1968 55.0 198.0 3.50 5.30 1.80 110.0 200 415.0 5.69 10.33 4.63 89.6 81.4 207.5 46 1968 50.0 180.0 2.50 7.30 4.80 37.5 200 341.0 5.79 10.36 4.57 74.6 198.8 170.5 47 1968 51.9 186.8 2.00 6.00 4.00 46.7 200 346.0 5.69 9.69 4.01 86.4 184.9 173.0 48 1970 322.0 5.74 10.52 4.78 67.4 49 1968 55.5 199.8 2.50 5.30 2.80 71.4 200 0.00 50 1968 77.7 279.7 2.80 3.80 1.00 279.7 200 428.0 5.41 9.63 4.21 101.6 36.3 214.0 51 1969 200 52 1969 61.1 220.0 3.00 5.40 2.40 91.7 200 540.0 6.30 10.10 3.80 142.1 155.1 270.0 53 1968 66.6 239.8 1.70 3.10 1.40 171.3 200 54 1969 66.6 239.8 2.30 4.60 2.30 104.2 200 55 1968 61.0 219.6 2.50 4.50 2.00 109.8 200 56 1967 55.5 199.8 4.00 5.50 1.50 133.2 200 57 1967 55.0 198.0 2.70 3.95 1.25 158.4 200 58 1965 44.4 159.8 2.20 4.10 1.90 84.1 200 330.0 5.75 10.10 4.35 75.9 90.2 165.0 59 1967 52.7 189.7 2.30 5.10 2.80 67.8 200 355.0 5.50 10.17 4.67 76.0 112.2 177.5 60 1969 200 460.0 7.00 11.00 4.00 115.0 230.0 61 1969 51.9 186.8 2.20 3.95 1.75 106.8 200 307.5 5.31 9.21 3.90 78.8 73.8 153.8 62 1969 62.2 223.9 2.60 5.10 2.50 89.6 200 130.0 5.95 9.05 3.10 41.9 46.8 65.0 63 1969 90.0 324.0 2.80 4.30 1.50 216.0 465.0 5.92 10.90 4.98 93.3 43.2

The Study on Restructuring of Water Supply System Volume 3. Supporting Report of Tashkent City in the Republic of Uzbekistan March 2006
S 3-1-3-10
Table 3.1.3.3 (3) Comparison of Yield Capacity between just after Construction and in 2004 (3)
Pumping Test Data at Construction Time At Present (2004)
Well No.
Const- ruction
Year Test
Yield (L/s)
Test Yield
(m3/hr)
Static Water Level
(GL-m)
Pumping Water Level
(GL-m)
Draw- down (m)
Specific Capacity
(m3/hr/m)
Recom- mended Intake Rate
(m3/hr)
Actual Intake Rate
(m3/hr)
Static Water Level
(GL-m)
Pumping Water Level
(GL-m)
Draw- down (m)
Specific Capacity
(m3/hr/m)
Decreasing Ratio of Well Ca-
pacity (%)
Ratio of Over Pump-
ing (%)
64 1967 50.0 180.0 2.00 6.00 4.00 45.0 20065 1965 100.0 360.0 2.63 4.30 1.67 215.6 360 246.0 4.48 5.99 1.51 163.2 75.7 68.366 1977 85.0 306.0 1.60 3.50 1.90 161.1 375 528.0 6.00 10.31 4.32 122.3 76.0 140.867 1965 98.9 355.9 1.70 9.54 7.84 45.4 35068 1977 44.7 160.9 3.95 8.35 4.40 36.6 21069 1977 95.0 342.0 1.35 2.55 1.20 285.0 21070 1978 76.0 273.6 1.70 4.30 2.60 105.271 1978 67.0 241.2 1.60 3.60 2.00 120.672 1972 83.0 298.8 1.20 2.20 1.00 298.8 20073 1976 71.1 256.0 1.30 4.30 3.00 85.3 25574 1976 64.7 232.9 1.00 6.00 5.00 46.675 1976 77.0 277.2 1.00 3.50 2.50 110.9 205.0 7.10 11.57 4.47 45.9 41.476 1969 40.0 144.0 5.00 8.30 3.30 43.6 200 204.0 5.96 11.14 5.18 39.4 90.3 102.077 1976 78.0 280.8 1.50 4.40 2.90 96.8 255 177.5 6.09 10.48 4.39 40.5 41.8 69.678 1966 78.9 284.0 1.82 11.90 10.08 28.2 29079 1978 55.0 198.0 3.00 6.60 3.60 55.0 29080 1978 62.5 225.0 1.70 4.00 2.30 97.8 - 247.5 6.37 8.14 1.77 139.8 142.981 1978 77.0 277.2 0.40 1.70 1.30 213.2 250 185.0 5.03 8.00 2.97 62.4 29.2 74.01G 1981 100.0 360.0 2.30 4.24 1.94 185.6 3502G 1982 115.0 414.0 2.30 5.68 3.38 122.5 350 237.5 2.29 3.53 1.24 191.9 156.7 67.93G 1982 76.0 273.6 2.58 7.32 4.74 57.7 2504G 1981 75.0 270.0 1.84 8.46 6.62 40.8 2507P9P
13P14P15P16P33P 1984 111.0 4.12 5.61 1.49 74.534P 1994 210 200.0 3.63 4.95 1.33 150.9 95.235P 210

The Study on Restructuring of Water Supply System Volume 3. Supporting Report of Tashkent City in the Republic of Uzbekistan March 2006
S 3-1-3-11
The capacity decline of wells at the right bank is progressing compared to those at the left bank
because the wells at the right bank are older than at the left bank.
The Specific Capacity of many wells at the left bank has not decreased. Figure S 3.1.3.9 shows
the excessive yield ratio between the current recommended yield capacity and the actual yield
amount. As shown the figure, the majority of wells at the right bank were withdrawing proper
yield quantity, while many of the wells at the left bank were withdrawing a largely excessive
yield quantity.
Figure S 3.1.3.9 Excessive Yield Ratio between the Value after construction and current actual
Value
24.819.9
19.921.8
21.819.9
22.6
28.6
43.5
39.9
37.2
49.6
47.8
49.645.2
43.5 49.645.2
57.149.6
11.95.66.65.8 12.9
12.6 7.19.1 11.9 5.3
6.68.26.6
10.2
6.6
5.8
7.16.6 11.9
7.5
9.1 10.2
7.5 6.67.1
5.38.2
7.57.5
9.1
8.2
4.0
LegendWell, Satisfied Satandard Value
Well, Exceeded Satandard Value
Unit : mg/L
Sampling Date : Oct., 2004
> 75
75 - 100
100 - 150
150 -200
200 <
%
Non Measured

The Study on Restructuring of Water Supply System Volume 3. Supporting Report of Tashkent City in the Republic of Uzbekistan March 2006
S 3-1-3-12
3) Ground water level
The average groundwater levels presented by contour at condition of statistic and well pump
operating are shown in Figure S 3.1.3.10 and S 3.1.3.11 derived from the data from July to
December in 2004. Figure S 3.1.3.12 shows the drawdown map for ground water based on
the above two maps.
Figure S 3.1.3.10 Contour Map of Average Groundwater Level with Statistic Condition
A valley of groundwater is formed at 800m far from the Chirchik River along the River as
shown in Figure S 3.1.3.10. Since the valley may have been the flow channel of the river, an
Operating Well
Non-operating Well

The Study on Restructuring of Water Supply System Volume 3. Supporting Report of Tashkent City in the Republic of Uzbekistan March 2006
S 3-1-3-13
active penetration flow of groundwater can be expected in this area. The groundwater level at
the left bank is slightly higher than that at the right bank. Groundwater levels with the con-
dition of well pumps operating vary based on the difference of yield amount and yield ca-
pacity of each well as shown in Figure S 3.1.3.11. As shown in Figure S 3.1.3.12, closed
curved lines stood out and the fall of groundwater level is large in the area far form the river.
It means that groundwater supply is not enough to recover the level compared with ground-
water intake by the wells located at nearby area of the river.
Non-operating Well
Operating Well
Figure S.1.3.11 Contour Map of Average Groundwater Level
with Condition of Well Pump Operating

The Study on Restructuring of Water Supply System Volume 3. Supporting Report of Tashkent City in the Republic of Uzbekistan March 2006
S 3-1-3-14
Figure 3.1.3 12 Contour Map of Groundwater Drawdown
The figures are fallen meters of groudwater level

The Study on Restructuring of Water Supply System Volume 3. Supporting Report of Tashkent City in the Republic of Uzbekistan March 2006
S 3-1-3-15
4) High concentration of nitrate
The nitrate concentration of some wells as shown in Figure S 3.1.3.13 at the right bank has
exceeded the standard value of the Drinking Water Standard in 2003. In the figure, the nitrate
concentration of each well shown with red or blue figures, and red figures exceed the standard
value of 45 mg/l, which is equivalent to Japanese Standard of 10mg/l as nitrogen in nitrate.
The analysis data for the wells at the right bank of nitrate concentration from 1994 to 2003 is
shown in Figure S 3.1.3.14 (1) to (4) based on Table S 3.1.3.4(1) to (4).
24.819.9
19.921.8
21.819.9
22.6
28.6
43.5
39.9
37.2
49.6
47.8
49.645.2
43.5 49.645.2
57.149.6
11.95.66.65.8 12.9
12.6 7.19.1 11.9 5.36.6
8.26.610.2
6.6
5.8
7.16.6 11.9
7.5
9.1 10.2
7.5 6.67.1
5.38.2
7.57.5
9.1
8.2
4.0
LegendWell, Satisfied Satandard Value
Well, Exceeded Satandard Value
Unit : mg/L
Sampling Date : Oct., 2004
Figure S.3.1.3.13 Map of Nitrate Concentration
It is said that discharge water from a chemical plant, which was located in Chrchik City up-
stream of Kibray WTP and produced chemical fertilizer, causes the high concentration.
However although the plant had already been closed in 1997, the concentration has not de-
creased as shown in Figure S 3.1.3.14 (1) to (4), while much nitrate fertilizer has been utilizing
at the farm lands in the wide region at the right bank side of the Chirchik River.
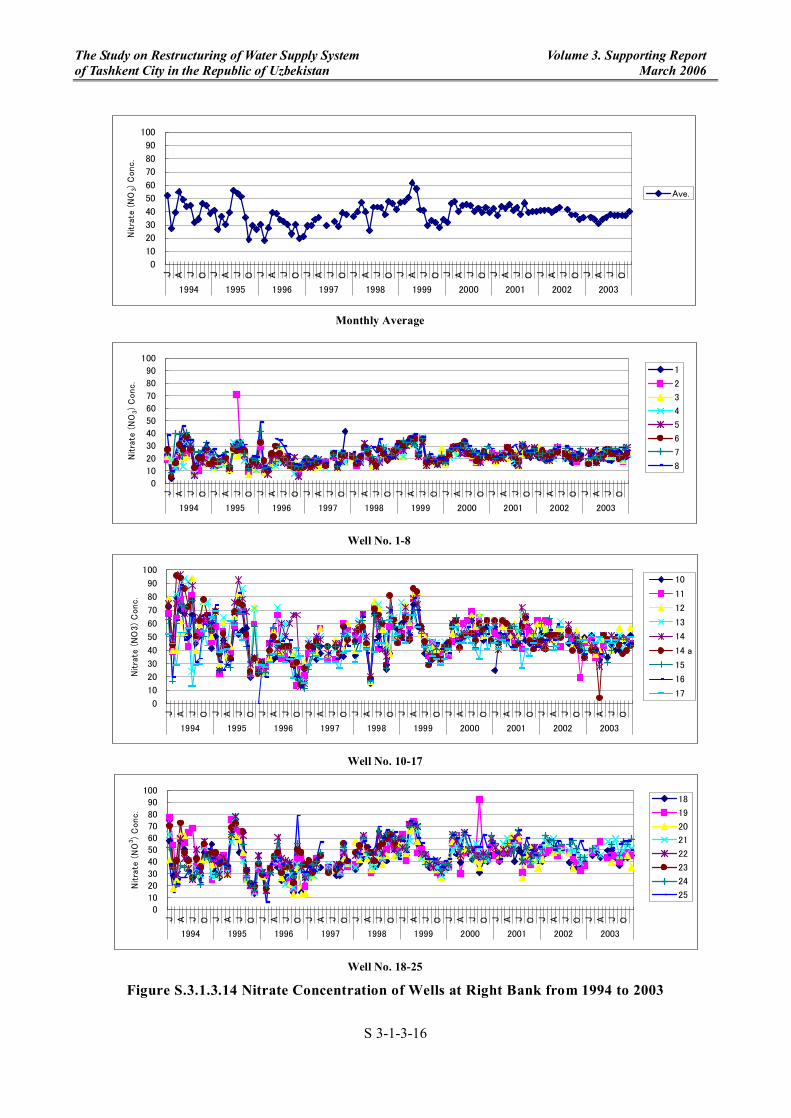
The Study on Restructuring of Water Supply System Volume 3. Supporting Report of Tashkent City in the Republic of Uzbekistan March 2006
S 3-1-3-16
Figure S.3.1.3.14 Nitrate Concentration of Wells at Right Bank from 1994 to 2003
Monthly Average
Well No. 1-8
Well No. 10-17
Well No. 18-25
0
10
20
30
40
50
60
70
80
90
100
J A J O J A J O J A J O J A J O J A J O J A J O J A J O J A J O J A J O J A J O
1994 1995 1996 1997 1998 1999 2000 2001 2002 2003
Nit
rate
(N
O3)
Conc.
1
2
3
4
5
6
7
8
0
10
20
30
40
50
60
70
80
90
100
J A J O J A J O J A J O J A J O J A J O J A J O J A J O J A J O J A J O J A J O
1994 1995 1996 1997 1998 1999 2000 2001 2002 2003
Nit
rate
(N
O3)
Conc.
10
11
12
13
14
14 a
15
16
17
010
2030
4050607080
90100
J A J O J A J O J A J O J A J O J A J O J A J O J A J O J A J O J A J O J A J O
1994 1995 1996 1997 1998 1999 2000 2001 2002 2003
Nit
rate
(N
O3)
Conc.
18
19
20
21
22
23
24
25
0
10
20
30
40
50
60
70
80
90
100
J A J O J A J O J A J O J A J O J A J O J A J O J A J O J A J O J A J O J A J O
1994 1995 1996 1997 1998 1999 2000 2001 2002 2003
Nit
rate
(N
O3)
Conc.
Ave.

The Study on Restructuring of Water Supply System Volume 3. Supporting Report of Tashkent City in the Republic of Uzbekistan March 2006
S 3-1-3-17
Table S 3.1.3.4 (1) Nitrate Concentration of Wells at Right Bank from 1994 to 1996
1 2 3 4 5 6 7 8 9 10 11 12 13 14 14 a 15 16 17 18 19 20 21 22 23 24 25January 23.0 19.1 21.7 23.0 24.5 27.0 38.5 60.3 72.7 67.3 78.9 75.3 72.7 62.9 72.7 52.3 57.6 77.1 40.8 62.9 72.7 70.0 52.3 38.1 52.6
February 3.9 18.2 18.2 18.2 5.7 8.5 9.5 25.4 41.0 39.1 40.1 49.3 43.9 17.1 19.6 45.1 28.4 54.0 17.9 35.7 35.7 35.7 35.7 14.2 27.5 March 17.9 13.7 15.6 13.0 16.3 39.9 24.7 32.3 79.7 63.8 39.9 81.5 75.3 95.7 60.3 62.9 29.2 24.8 21.3 24.8 29.2 41.0 21.3 21.3 39.4 April 25.3 23.0 24.4 26.6 21.7 31.0 39.0 35.4 70.0 70.0 78.0 62.0 88.6 96.6 93.9 75.3 88.6 53.2 57.6 59.4 62.0 59.4 72.7 37.2 26.6 55.1 May 29.7 23.9 20.4 13.3 37.7 26.6 22.6 45.6 78.0 67.5 70.9 53.2 93.9 67.3 85.9 72.7 47.8 53.2 50.5 55.8 62.0 42.5 47.8 35.6 26.6 49.2 June 33.7 23.9 21.3 33.7 36.3 37.7 40.3 35.0 54.1 50.1 42.5 91.3 54.1 72.7 50.5 56.7 41.6 64.7 37.2 40.8 34.6 40.8 31.9 31.9 44.0 July 29.7 32.3 35.0 29.7 31.0 26.6 35.0 35.0 70.9 66.5 80.7 93.9 23.9 88.6 77.1 77.5 65.6 13.3 26.6 68.3 28.7 26.6 25.3 26.6 26.6 26.6 44.9
August 9.3 8.0 8.0 7.5 6.6 12.9 25.7 16.0 43.4 45.2 48.7 39.9 48.7 62.0 50.4 45.2 31.0 29.2 37.2 36.3 29.2 34.6 50.5 42.5 29.2 34.5 32.0 September 16.0 10.2 19.5 16.8 18.2 20.8 24.4 22.6 39.0 50.5 53.2 59.6 62.0 64.7 62.0 51.4 33.7 29.9 28.8 36.8 39.9 28.8 32.3 35.9 21.3 22.6 34.6
October 16.8 16.8 18.2 17.3 16.8 20.8 26.6 26.6 57.6 64.7 62.0 76.2 76.2 62.0 78.1 50.5 59.4 54.1 47.8 53.2 41.6 53.2 57.6 54.9 43.4 47.8 46.2 November 16.0 21.3 15.1 23.6 26.6 26.6 32.3 31.9 29.2 60.3 66.5 66.5 76.2 62.0 66.5 59.4 66.5 43.4 44.3 47.8 47.8 43.4 46.1 46.1 43.4 50.5 44.6 December 18.6 20.8 18.6 20.8 16.0 15.5 25.3 25.3 18.6 41.6 46.1 50.5 64.7 60.3 54.9 54.9 60.3 64.7 54.9 25.3 38.1 28.8 41.6 47.8 42.5 43.4 38.5 Average 20.0 19.3 19.7 20.3 23.5 22.3 29.0 28.8 48.2 59.1 59.9 60.0 70.7 68.1 71.1 57.0 54.9 43.7 41.7 50.0 39.2 39.4 44.0 46.8 35.0 32.0 42.4 January 16.0 16.0 12.4 12.4 14.6 18.6 23.6 27.5 47.8 50.5 57.6 69.1 69.1 69.1 69.1 60.3 73.5 69.1 31.9 41.6 27.4 28.4 43.4 47.8 29.2 39.0 41.0
February 14.6 15.5 16.0 16.0 17.3 16.8 17.3 21.7 24.8 24.8 22.2 29.2 24.8 24.8 37.2 31.0 38.5 26.9 40.8 29.2 31.5 29.2 38.5 43.4 40.8 26.9 March 15.6 14.6 16.8 15.8 18.4 18.2 22.6 38.5 47.4 54.5 61.1 64.4 47.4 52.3 43.4 24.8 40.3 40.3 45.2 38.1 43.4 40.3 40.3 38.1 36.7 April 18.4 16.2 15.5 19.0 19.0 20.4 24.4 25.5 31.0 40.8 40.8 35.9 38.1 40.8 43.0 29.2 29.2 41.0 33.9 31.7 30.6 33.9 29.5 36.3 36.3 36.3 30.6 May 10.6 10.6 11.3 11.8 11.7 12.4 13.7 29.2 40.8 38.1 43.0 33.7 34.6 33.7 27.0 32.3 62.0 75.8 75.8 63.4 56.7 63.4 68.7 63.4 65.1 39.5 June 25.9 27.5 32.7 29.2 27.5 29.2 31.0 62.0 66.9 58.5 65.3 75.8 75.8 68.7 62.0 54.9 58.5 75.8 65.3 62.0 77.2 78.4 72.2 68.7 58.5 56.4 July 32.7 70.9 22.4 25.9 29.2 25.9 29.9 27.5 54.9 51.8 68.7 82.4 72.2 92.6 75.8 68.7 82.4 51.8 47.8 65.3 58.5 54.2
August 32.7 25.9 24.9 32.7 27.5 26.6 32.1 29.2 47.8 54.9 68.7 78.4 85.9 78.4 73.8 68.7 68.7 47.8 47.8 44.7 47.8 41.2 62.0 65.3 54.9 65.3 51.3 September 20.6 22.4 23.9 18.8 22.8 25.9 23.9 31.0 50.0 56.7 50.0 68.7 68.7 51.6 43.0 43.0 27.0 26.1 25.3 25.3 32.8 32.8 27.0 32.8 35.4
October 10.9 9.1 7.0 12.6 13.1 12.6 12.2 12.6 24.1 19.9 22.6 27.9 28.8 29.5 24.1 21.5 19.9 19.9 21.5 19.9 21.5 21.5 21.5 18.9 November 17.2 16.8 13.7 15.6 18.2 19.9 21.7 50.5 59.6 72.2 71.3 34.3 33.9 57.8 13.7 14.5 14.5 17.2 19.1 18.2 22.6 29.6 December 13.7 13.7 10.9 10.9 14.5 16.4 18.2 20.8 21.7 25.3 31.0 31.0 24.8 22.6 23.7 34.3 34.3 39.9 35.9 45.2 38.1 39.9 47.0 26.7 Average 19.1 21.1 16.9 19.0 19.4 20.1 21.9 24.6 40.2 45.5 47.2 54.1 55.3 51.7 48.8 45.9 48.9 51.1 39.6 42.1 42.7 36.7 42.2 43.7 40.3 42.4 37.3 January 31.0 29.0 32.8 32.8 14.1 32.8 41.6 48.7 27.5 27.5 31.5 32.3 27.5 31.5 30.6 29.9 29.9 29.0 29.0 31.0 27.5 31.0 29.1 31.0 29.0 30.7
February 10.0 9.2 8.4 13.7 10.9 18.2 11.7 14.1 27.5 21.7 27.5 23.5 21.7 25.3 23.5 19.9 27.5 28.8 28.8 18.2 16.4 15.5 17.2 19.9 6.0 18.6 March 10.0 13.7 13.7 11.7 7.2 10.9 12.6 11.7 31.0 45.2 34.3 38.1 45.2 39.9 35.9 47.0 31.0 34.3 31.0 31.0 34.3 31.0 38.1 27.8 April 22.2 13.3 18.8 18.8 23.7 35.4 33.2 54.9 54.9 47.8 47.8 50.1 56.3 59.9 37.1 39.4 40.5 42.1 44.4 44.4 40.6 39.3 May 16.6 18.8 14.4 22.6 29.8 17.7 35.9 23.5 35.4 66.2 39.0 71.8 40.7 45.2 37.8 44.3 35.4 44.3 40.9 60.3 47.8 55.4 43.0 38.6 June 20.8 27.5 17.5 22.6 23.7 29.9 34.6 33.2 37.8 33.2 37.8 47.8 60.3 43.0 35.4 47.0 35.4 24.4 36.8 26.6 31.7 43.0 31.0 35.4 37.8 34.2 July 21.5 21.5 21.5 20.4 16.6 18.8 20.4 30.1 33.2 33.2 35.4 42.9 60.3 50.1 42.9 40.7 50.1 31.0 26.6 31.0 21.3 40.7 35.4 37.6 28.8 32.5
August 21.5 17.7 18.8 16.6 15.9 19.5 17.7 23.7 34.1 33.2 42.9 60.3 42.9 40.7 47.4 33.1 23.4 23.5 21.3 28.8 39.4 35.9 34.1 39.4 30.5 September 14.6 14.6 14.6 15.1 14.4 14.4 14.4 18.8 21.3 35.4 30.1 37.6 66.4 28.8 28.8 26.6 18.8 13.7 17.7 12.6 18.8 23.9 22.6 28.1 29.9 23.3
October 13.3 13.3 17.7 7.8 21.3 12.9 14.4 15.5 19.0 19.9 13.7 31.0 35.4 66.4 30.9 19.9 19.9 41.6 35.4 43.0 35.4 37.6 47.9 50.1 55.4 78.9 30.7 November 6.9 8.9 12.9 5.5 5.8 12.9 13.3 14.4 14.4 13.7 28.1 13.3 17.7 12.9 14.4 16.6 12.6 35.4 14.4 43.0 12.9 33.2 35.4 47.9 37.6 31.0 19.8 December 14.4 14.4 12.9 14.4 13.3 12.9 14.4 18.4 20.4 25.7 21.3 31.0 28.8 15.5 26.6 11.5 28.8 15.5 26.6 19.0 13.7 27.5 26.6 37.6 28.8 31.0 21.2 Average 16.5 16.3 17.7 15.7 15.3 19.2 18.9 24.2 26.7 28.8 35.8 34.3 39.7 43.5 35.9 31.4 35.4 31.7 25.8 32.8 22.1 29.8 36.4 36.1 36.6 36.1 28.9
Time AverageWell No.
1996
1995
1994

The Study on Restructuring of Water Supply System Volume 3. Supporting Report of Tashkent City in the Republic of Uzbekistan March 2006
S 3-1-3-18
Table S 3.1.3.4 (2) Nitrate Concentration of Wells at Right Bank from 1997 to 1999
1 2 3 4 5 6 7 8 9 10 11 12 13 14 14 a 15 16 17 18 19 20 21 22 23 24 25January 20.4 15.5 17.7 18.8 14.4 18.8 20.4 15.5 31.0 40.7 37.6 43.0 47.9 45.2 43.0 25.7 28.8 28.8 25.7 28.8 25.7 26.6 37.6 40.7 28.8 35.4 29.3
February 13.3 14.4 14.4 13.3 12.9 13.3 17.7 18.8 31.0 40.7 40.7 37.6 43.0 40.7 43.0 35.4 40.7 37.6 33.2 37.6 28.8 28.8 35.4 31.0 37.6 33.2 29.8 March 17.7 12.9 14.4 14.4 16.6 18.8 21.5 35.9 33.2 47.8 37.6 47.8 50.3 46.5 44.3 50.3 35.4 33.2 42.9 37.6 33.2 37.6 40.7 40.7 42.9 34.2 April 16.6 16.6 14.4 17.7 18.8 16.6 18.8 17.7 35.4 37.6 56.2 56.2 50.1 47.9 43.0 43.0 43.0 33.2 35.4 45.2 45.2 45.2 47.9 56.2 35.8 MayJune 17.7 16.6 15.5 12.9 15.5 14.4 17.7 16.6 35.4 35.4 33.2 37.6 35.4 37.6 43.0 43.0 37.6 31.0 33.2 35.4 33.2 37.6 31.0 33.2 37.6 29.5 July
August 21.0 21.0 23.8 23.8 22.6 23.8 23.0 26.1 28.8 42.5 33.2 47.6 40.8 45.2 42.5 42.5 33.2 31.0 28.8 35.4 33.2 35.4 37.7 33.2 35.4 35.4 32.6 September 14.4 12.9 13.3 12.9 13.3 13.3 15.5 31.0 35.4 37.7 37.7 37.7 45.2 37.7 37.7 35.4 26.6 28.8 31.0 31.0 35.4 37.7 37.7 28.7
October 17.7 20.4 20.4 23.8 17.7 22.6 25.0 26.1 20.4 35.4 59.8 40.8 50.0 57.6 52.3 57.6 37.7 42.5 47.6 42.5 50.0 47.6 55.4 52.3 55.4 39.1 November 41.5 17.7 16.6 17.7 22.6 22.6 23.8 23.8 47.6 50.0 55.4 59.8 52.3 45.2 47.6 50.0 43.0 39.4 39.0 35.9 39.0 39.0 40.5 41.9 38.0 DecemberAverage 20.3 17.5 16.5 17.3 16.9 18.0 19.8 20.2 33.0 39.0 44.6 44.2 45.0 44.7 44.9 41.5 41.1 33.4 33.3 36.8 35.7 36.3 38.6 39.5 39.4 41.8 33.0 January 21.5 21.5 20.4 21.5 22.6 21.5 22.6 25.0 35.9 35.9 51.4 39.4 47.8 53.8 46.6 44.3 46.6 31.0 33.2 37.7 57.6 35.4 45.2 47.6 47.8 36.6
February 15.6 14.4 18.8 17.7 16.6 15.5 18.8 17.7 47.6 47.6 47.6 59.8 62.0 59.8 55.4 55.4 55.4 39.4 38.3 46.5 42.0 44.3 52.6 53.8 46.4 46.4 39.8 March 17.7 18.8 20.4 18.8 16.6 21.5 22.6 55.4 57.4 66.9 62.0 59.8 66.9 57.6 62.0 64.7 52.3 43.0 59.8 47.8 59.8 62.0 59.8 57.6 47.1 April 26.1 26.1 27.7 28.8 32.3 28.8 26.1 29.9 40.8 43.0 43.0 45.2 47.8 50.0 45.2 40.8 37.7 40.8 47.8 47.8 43.0 45.2 52.3 47.8 52.3 39.8 May 20.4 21.5 23.9 23.9 27.7 23.9 27.7 13.3 15.5 17.7 16.6 17.7 20.4 18.8 17.7 18.8 31.0 31.0 33.4 35.9 41.3 47.8 47.8 25.8 June 16.6 15.5 14.4 16.6 17.7 18.8 21.3 29.2 66.5 67.3 71.8 76.6 71.8 67.3 70.9 66.5 47.6 38.8 35.9 40.5 40.5 35.9 47.8 40.5 53.4 43.6 July 16.6 13.3 13.3 14.4 13.3 14.4 25.0 40.8 50.1 40.8 71.8 74.0 62.6 66.5 57.6 42.5 45.2 37.7 46.5 45.2 47.2 62.6 52.7 66.5 69.5 43.6
August 20.4 18.8 26.4 18.8 16.6 27.7 17.7 35.4 52.7 59.8 59.2 55.4 59.8 40.8 59.8 62.0 59.8 45.2 42.5 42.5 37.7 42.5 47.2 55.4 59.8 59.8 43.2 September 23.6 26.1 23.6 28.8 25.0 23.6 28.8 25.0 17.7 25.7 28.8 45.2 42.5 35.4 28.8 26.6 28.8 52.3 40.8 50.1 45.2 57.6 59.8 59.8 63.6 66.5 37.7
October 18.8 21.3 20.4 22.6 21.1 18.8 20.4 21.3 59.8 37.7 57.6 37.7 66.5 70.0 81.1 71.8 70.0 62.6 55.4 64.7 64.7 59.8 62.6 61.5 47.8 November 21.3 25.0 26.1 23.6 25.0 21.3 22.6 20.4 64.7 62.6 62.6 62.6 64.7 62.6 57.6 59.8 47.3 50.1 52.3 45.2 50.1 55.4 59.8 64.7 46.1 December 23.6 25.0 21.3 23.6 21.3 26.1 28.8 31.3 50.1 55.4 47.3 50.1 52.3 47.3 45.2 50.1 55.4 52.3 45.2 50.1 55.4 45.2 59.8 47.3 42.5 42.1 Average 20.2 20.6 21.4 21.6 21.3 21.8 23.5 25.7 45.4 46.5 49.5 51.9 55.6 52.2 53.2 51.0 48.9 46.1 40.5 46.7 46.5 46.7 53.5 52.8 56.4 55.8 41.1 January 28.8 26.1 21.3 29.9 32.3 32.3 27.7 28.8 42.5 59.8 52.7 57.6 75.7 55.4 50.1 57.6 47.6 57.6 57.6 62.6 55.4 50.1 52.3 59.8 57.6 47.2
February 29.9 28.8 21.3 21.3 26.1 29.9 34.6 28.8 55.4 62.6 66.5 73.9 69.5 71.8 64.7 66.5 66.5 45.2 45.2 40.8 47.3 52.3 50.1 52.3 47.8 47.9 March 29.9 32.3 32.3 29.9 29.9 32.3 32.3 34.6 45.4 47.3 58.5 60.9 60.9 51.4 47.8 47.8 51.4 66.5 69.5 71.8 66.5 57.6 71.8 69.5 74.0 50.9 April 33.2 33.2 31.3 33.2 35.9 35.2 37.0 66.5 74.0 78.6 81.1 78.9 86.4 69.5 78.9 66.4 71.8 73.9 69.5 71.8 71.8 73.9 72.0 61.9 May 33.2 35.9 37.0 31.3 32.3 35.9 31.3 39.4 71.8 57.6 81.1 83.7 78.8 74.0 83.7 70.3 70.3 57.6 55.4 47.3 57.6 66.4 69.5 71.8 59.8 57.3 June 21.3 23.6 22.6 25.0 21.3 22.6 23.6 25.0 50.1 55.4 52.3 55.4 55.4 57.6 52.3 50.1 52.3 50.1 45.2 42.5 47.3 47.3 55.4 41.4 July 33.2 35.9 34.8 37.0 33.2 34.8 35.9 37.0 37.7 50.1 50.1 46.5 45.4 46.5 42.1 42.1 42.1 46.5 45.4 42.4 45.4 46.5 37.7 42.1 41.3
August 14.4 17.7 15.5 14.4 16.6 20.4 17.7 26.6 35.4 35.4 40.8 40.8 37.7 28.8 31.0 29.8 35.4 40.8 37.7 37.7 42.1 42.1 29.9 September 17.7 18.8 18.8 18.8 23.3 23.3 37.6 33.2 45.6 42.1 46.5 35.4 33.2 37.6 35.4 35.4 37.6 35.4 35.4 35.4 35.4 42.1 42.1 33.3
October 17.7 18.8 17.7 18.8 17.7 17.7 18.8 17.7 37.6 35.4 37.6 40.8 45.6 42.1 35.4 40.8 45.6 33.2 33.2 31.0 33.2 35.4 40.8 40.8 37.6 31.7 November 15.5 17.7 17.7 16.6 15.5 16.6 17.7 20.4 33.2 33.2 37.6 42.1 35.4 33.2 33.2 40.8 28.8 31.0 28.8 26.6 28.8 31.0 33.2 35.4 27.9 December 18.8 20.4 28.0 21.0 20.4 22.8 20.4 35.4 40.8 42.1 42.1 46.5 42.1 42.1 42.1 45.6 33.2 35.4 37.6 33.2 33.2 35.4 37.6 40.8 34.0 Average 24.5 26.4 24.9 25.0 25.6 26.2 27.0 27.5 45.6 47.7 53.3 55.6 54.7 51.9 50.8 50.7 50.3 46.6 47.6 47.7 46.1 46.4 49.1 50.7 50.6 42.1
1999
1998
Time
1997
Well No. Average
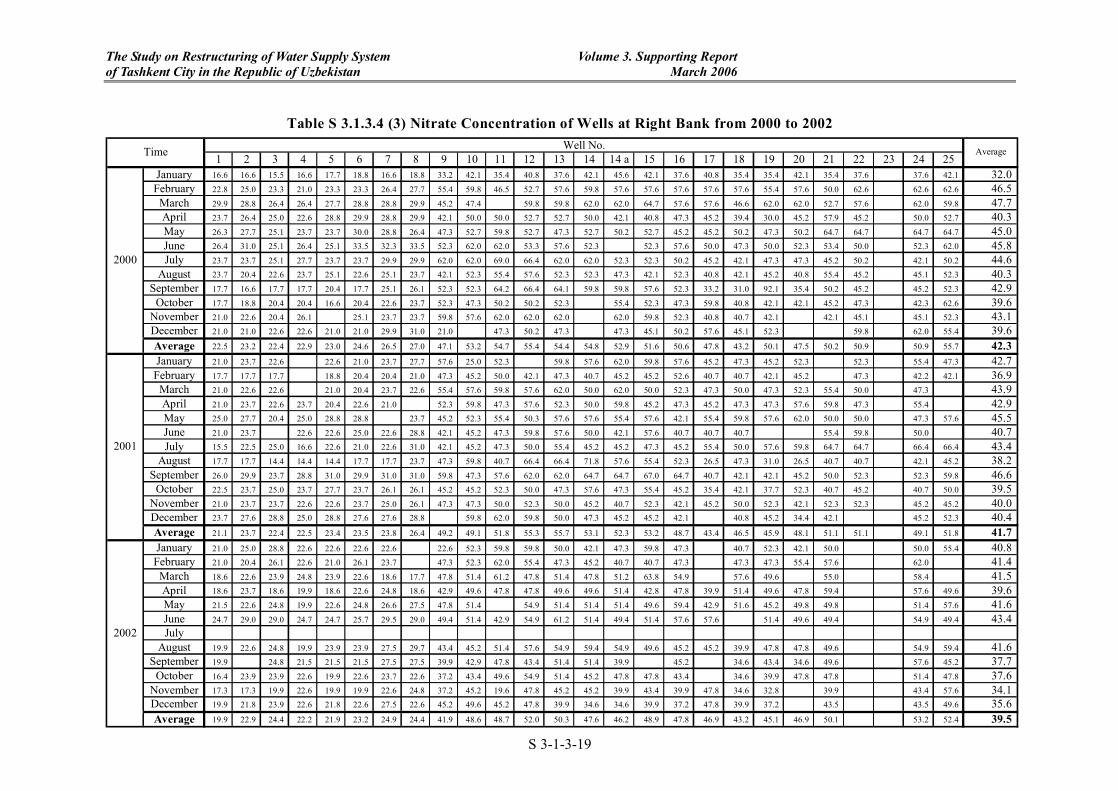
The Study on Restructuring of Water Supply System Volume 3. Supporting Report of Tashkent City in the Republic of Uzbekistan March 2006
S 3-1-3-19
Table S 3.1.3.4 (3) Nitrate Concentration of Wells at Right Bank from 2000 to 2002
1 2 3 4 5 6 7 8 9 10 11 12 13 14 14 a 15 16 17 18 19 20 21 22 23 24 25January 16.6 16.6 15.5 16.6 17.7 18.8 16.6 18.8 33.2 42.1 35.4 40.8 37.6 42.1 45.6 42.1 37.6 40.8 35.4 35.4 42.1 35.4 37.6 37.6 42.1 32.0 February 22.8 25.0 23.3 21.0 23.3 23.3 26.4 27.7 55.4 59.8 46.5 52.7 57.6 59.8 57.6 57.6 57.6 57.6 57.6 55.4 57.6 50.0 62.6 62.6 62.6 46.5
March 29.9 28.8 26.4 26.4 27.7 28.8 28.8 29.9 45.2 47.4 59.8 59.8 62.0 62.0 64.7 57.6 57.6 46.6 62.0 62.0 52.7 57.6 62.0 59.8 47.7 April 23.7 26.4 25.0 22.6 28.8 29.9 28.8 29.9 42.1 50.0 50.0 52.7 52.7 50.0 42.1 40.8 47.3 45.2 39.4 30.0 45.2 57.9 45.2 50.0 52.7 40.3 May 26.3 27.7 25.1 23.7 23.7 30.0 28.8 26.4 47.3 52.7 59.8 52.7 47.3 52.7 50.2 52.7 45.2 45.2 50.2 47.3 50.2 64.7 64.7 64.7 64.7 45.0 June 26.4 31.0 25.1 26.4 25.1 33.5 32.3 33.5 52.3 62.0 62.0 53.3 57.6 52.3 52.3 57.6 50.0 47.3 50.0 52.3 53.4 50.0 52.3 62.0 45.8 July 23.7 23.7 25.1 27.7 23.7 23.7 29.9 29.9 62.0 62.0 69.0 66.4 62.0 62.0 52.3 52.3 50.2 45.2 42.1 47.3 47.3 45.2 50.2 42.1 50.2 44.6
August 23.7 20.4 22.6 23.7 25.1 22.6 25.1 23.7 42.1 52.3 55.4 57.6 52.3 52.3 47.3 42.1 52.3 40.8 42.1 45.2 40.8 55.4 45.2 45.1 52.3 40.3 September 17.7 16.6 17.7 17.7 20.4 17.7 25.1 26.1 52.3 52.3 64.2 66.4 64.1 59.8 59.8 57.6 52.3 33.2 31.0 92.1 35.4 50.2 45.2 45.2 52.3 42.9
October 17.7 18.8 20.4 20.4 16.6 20.4 22.6 23.7 52.3 47.3 50.2 50.2 52.3 55.4 52.3 47.3 59.8 40.8 42.1 42.1 45.2 47.3 42.3 62.6 39.6 November 21.0 22.6 20.4 26.1 25.1 23.7 23.7 59.8 57.6 62.0 62.0 62.0 62.0 59.8 52.3 40.8 40.7 42.1 42.1 45.1 45.1 52.3 43.1 December 21.0 21.0 22.6 22.6 21.0 21.0 29.9 31.0 21.0 47.3 50.2 47.3 47.3 45.1 50.2 57.6 45.1 52.3 59.8 62.0 55.4 39.6 Average 22.5 23.2 22.4 22.9 23.0 24.6 26.5 27.0 47.1 53.2 54.7 55.4 54.4 54.8 52.9 51.6 50.6 47.8 43.2 50.1 47.5 50.2 50.9 50.9 55.7 42.3 January 21.0 23.7 22.6 22.6 21.0 23.7 27.7 57.6 25.0 52.3 59.8 57.6 62.0 59.8 57.6 45.2 47.3 45.2 52.3 52.3 55.4 47.3 42.7 February 17.7 17.7 17.7 18.8 20.4 20.4 21.0 47.3 45.2 50.0 42.1 47.3 40.7 45.2 45.2 52.6 40.7 40.7 42.1 45.2 47.3 42.2 42.1 36.9
March 21.0 22.6 22.6 21.0 20.4 23.7 22.6 55.4 57.6 59.8 57.6 62.0 50.0 62.0 50.0 52.3 47.3 50.0 47.3 52.3 55.4 50.0 47.3 43.9 April 21.0 23.7 22.6 23.7 20.4 22.6 21.0 52.3 59.8 47.3 57.6 52.3 50.0 59.8 45.2 47.3 45.2 47.3 47.3 57.6 59.8 47.3 55.4 42.9 May 25.0 27.7 20.4 25.0 28.8 28.8 23.7 45.2 52.3 55.4 50.3 57.6 57.6 55.4 57.6 42.1 55.4 59.8 57.6 62.0 50.0 50.0 47.3 57.6 45.5 June 21.0 23.7 22.6 22.6 25.0 22.6 28.8 42.1 45.2 47.3 59.8 57.6 50.0 42.1 57.6 40.7 40.7 40.7 55.4 59.8 50.0 40.7 July 15.5 22.5 25.0 16.6 22.6 21.0 22.6 31.0 42.1 45.2 47.3 50.0 55.4 45.2 45.2 47.3 45.2 55.4 50.0 57.6 59.8 64.7 64.7 66.4 66.4 43.4
August 17.7 17.7 14.4 14.4 14.4 17.7 17.7 23.7 47.3 59.8 40.7 66.4 66.4 71.8 57.6 55.4 52.3 26.5 47.3 31.0 26.5 40.7 40.7 42.1 45.2 38.2 September 26.0 29.9 23.7 28.8 31.0 29.9 31.0 31.0 59.8 47.3 57.6 62.0 62.0 64.7 64.7 67.0 64.7 40.7 42.1 42.1 45.2 50.0 52.3 52.3 59.8 46.6
October 22.5 23.7 25.0 23.7 27.7 23.7 26.1 26.1 45.2 45.2 52.3 50.0 47.3 57.6 47.3 55.4 45.2 35.4 42.1 37.7 52.3 40.7 45.2 40.7 50.0 39.5 November 21.0 23.7 23.7 22.6 22.6 23.7 25.0 26.1 47.3 47.3 50.0 52.3 50.0 45.2 40.7 52.3 42.1 45.2 50.0 52.3 42.1 52.3 52.3 45.2 45.2 40.0 December 23.7 27.6 28.8 25.0 28.8 27.6 27.6 28.8 59.8 62.0 59.8 50.0 47.3 45.2 45.2 42.1 40.8 45.2 34.4 42.1 45.2 52.3 40.4 Average 21.1 23.7 22.4 22.5 23.4 23.5 23.8 26.4 49.2 49.1 51.8 55.3 55.7 53.1 52.3 53.2 48.7 43.4 46.5 45.9 48.1 51.1 51.1 49.1 51.8 41.7 January 21.0 25.0 28.8 22.6 22.6 22.6 22.6 22.6 52.3 59.8 59.8 50.0 42.1 47.3 59.8 47.3 40.7 52.3 42.1 50.0 50.0 55.4 40.8 February 21.0 20.4 26.1 22.6 21.0 26.1 23.7 47.3 52.3 62.0 55.4 47.3 45.2 40.7 40.7 47.3 47.3 47.3 55.4 57.6 62.0 41.4
March 18.6 22.6 23.9 24.8 23.9 22.6 18.6 17.7 47.8 51.4 61.2 47.8 51.4 47.8 51.2 63.8 54.9 57.6 49.6 55.0 58.4 41.5 April 18.6 23.7 18.6 19.9 18.6 22.6 24.8 18.6 42.9 49.6 47.8 47.8 49.6 49.6 51.4 42.8 47.8 39.9 51.4 49.6 47.8 59.4 57.6 49.6 39.6 May 21.5 22.6 24.8 19.9 22.6 24.8 26.6 27.5 47.8 51.4 54.9 51.4 51.4 51.4 49.6 59.4 42.9 51.6 45.2 49.8 49.8 51.4 57.6 41.6 June 24.7 29.0 29.0 24.7 24.7 25.7 29.5 29.0 49.4 51.4 42.9 54.9 61.2 51.4 49.4 51.4 57.6 57.6 51.4 49.6 49.4 54.9 49.4 43.4 July
August 19.9 22.6 24.8 19.9 23.9 23.9 27.5 29.7 43.4 45.2 51.4 57.6 54.9 59.4 54.9 49.6 45.2 45.2 39.9 47.8 47.8 49.6 54.9 59.4 41.6 September 19.9 24.8 21.5 21.5 21.5 27.5 27.5 39.9 42.9 47.8 43.4 51.4 51.4 39.9 45.2 34.6 43.4 34.6 49.6 57.6 45.2 37.7
October 16.4 23.9 23.9 22.6 19.9 22.6 23.7 22.6 37.2 43.4 49.6 54.9 51.4 45.2 47.8 47.8 43.4 34.6 39.9 47.8 47.8 51.4 47.8 37.6 November 17.3 17.3 19.9 22.6 19.9 19.9 22.6 24.8 37.2 45.2 19.6 47.8 45.2 45.2 39.9 43.4 39.9 47.8 34.6 32.8 39.9 43.4 57.6 34.1 December 19.9 21.8 23.9 22.6 21.8 22.6 27.5 22.6 45.2 49.6 45.2 47.8 39.9 34.6 34.6 39.9 37.2 47.8 39.9 37.2 43.5 43.5 49.6 35.6 Average 19.9 22.9 24.4 22.2 21.9 23.2 24.9 24.4 41.9 48.6 48.7 52.0 50.3 47.6 46.2 48.9 47.8 46.9 43.2 45.1 46.9 50.1 53.2 52.4 39.5
Well No. Average
2002
2001
2000
Time

The Study on Restructuring of Water Supply System Volume 3. Supporting Report of Tashkent City in the Republic of Uzbekistan March 2006
S 3-1-3-20
Table S 3.1.3.4(4) Nitrate Concentration of Well at Right Bank in 2003
1 2 3 4 5 6 7 8 9 10 11 12 13 14 14 a 15 16 17 18 19 20 21 22 23 24 25January
February 16.4 16.4 18.6 15.5 25.2 15.5 19.9 21.8 45.2 51.4 47.8 45.2 51.4 43.5 39.9 43.5 47.8 45.2 47.8 49.6 51.4 36.1 March 22.6 22.6 23.9 21.8 22.6 24.8 21.8 23.9 34.6 34.6 34.6 37.2 39.9 43.5 39.9 39.9 39.9 45.2 47.8 51.4 51.4 34.5 April 16.4 19.9 19.9 16.4 16.4 17.3 19.9 28.5 39.9 32.8 37.2 39.9 47.8 27.5 4.4 37.2 37.2 49.6 43.5 57.1 45.2 31.1 May 19.9 23.7 25.7 23.9 21.8 22.6 22.6 24.8 37.2 43.5 43.5 47.8 51.4 51.4 51.4 37.2 34.3 June 19.9 23.9 22.6 19.9 19.9 22.6 24.8 28.6 31.0 34.6 47.8 45.2 47.8 47.8 31.0 47.8 47.8 49.6 43.5 57.1 45.2 36.1 July 24.8 22.6 21.8 23.9 25.7 27.5 27.5 17.3 34.6 43.5 39.9 51.4 51.4 39.9 45.2 45.2 49.6 45.2 39.9 54.5 54.5 51.4 38.0
August 18.6 22.6 21.8 22.6 23.9 23.9 27.5 25.7 43.5 39.9 47.8 44.6 47.8 49.1 51.4 47.8 43.5 45.2 59.4 37.2 September 21.8 21.8 21.8 22.6 24.8 23.9 27.5 24.8 45.2 39.9 57.1 51.4 43.5 47.8 45.2 37.2 39.9 45.2 45.2 45.2 54.9 37.5
October 24.8 19.9 19.9 21.8 21.8 19.9 22.6 28.6 43.5 49.6 47.8 39.9 37.2 49.6 45.2 43.5 45.2 49.6 57.1 57.1 37.2 November 17.3 17.3 18.6 19.0 21.8 21.8 28.6 28.6 35.4 47.8 39.9 45.2 39.9 47.8 43.5 43.5 47.8 45.2 54.9 54.9 57.1 36.9 December 21.8 23.9 27.5 23.9 28.5 23.9 28.6 25.7 47.8 51.4 45.2 57.1 45.2 45.2 43.5 43.5 45.2 49.6 45.2 45.2 35.4 51.4 59.4 49.6 40.2 Average 20.4 21.3 22.0 21.0 22.9 22.2 24.6 25.3 39.8 42.1 42.7 46.1 46.7 44.3 39.5 42.4 44.8 47.5 44.9 46.8 41.4 51.8 53.8 52.6 36.3
Time Well No. Average
2003

The Study on Restructuring of Water Supply System Volume 3. Supporting Report of Tashkent City in the Republic of Uzbekistan March 2006
S 3-1-3-21
In addition, the groundwater layer at the right bank is stable because the plentiful penetrated
water from these areas supplies the layer. It is not sure now that high concentration of nitrate is
derived from fertilizer for the farmland, because the duration since the close of the chemical
has not been so long. However if the reason of the high concentration is thought to be the
fertilizer for farmlands, reduction of the nitrate concentration cannot be expected. The con-
centration of nitrate from left bank wells must be observed carefully in the future.
(2) Evaluation of Groundwater Source
1) Surveyed results of intake potential for groundwater
Tashkent Hydro-Geological Survey Institute conducted a hydro-geological survey for the
groundwater sources in surrounding area of Tashkent City. The results of survey were sum-
marized as Table S.3.1.3.5, and this is almost the same figure with Table 2.1.5, which is a list
of ground water intake rights for Tashkent Vodokanal.
Table 3.1.3.5 Estimated Groundwater Yield Potential (103m3/d)
Category WTP Area A B C1 C2
Total
Right Bank 157.7 35.2 41.5 234.4 Left Bank 354.6 193.0 153.6 56.2 757.4 Kibray Sub Total 512.3 228.2 195.1 56.2 991.8
I 39.9 39.9 South
II 99.8 20.7 120.5 Sergeli 39.0 39.0 Kuiluk 21.4 21.4 Total 712.4 248.9 195.1 56.2 1212.6
Note: A: This quantity can be always withdrawn, B: This can be temporarily withdrawn, C1: Potential of easy intake, C2: Potential of relatively difficult intake
As shown in the table, the potential of groundwater intake was judged at 991,800m3/d.
However, the current minimum intake amount is around 300,000m3/d in Kibray WTP in 2004.
The reasons of capacity decline are assumed as follows:
- A mutual interference of wells caused falls of groundwater level because of too small dis-
tances between wells;
- Excessive capacity of pumps is installed for wells compared to the actual yield capacity of
wells, and it causes a fall of groundwater level and a harmful vibration of pumps due to ex-

The Study on Restructuring of Water Supply System Volume 3. Supporting Report of Tashkent City in the Republic of Uzbekistan March 2006
S 3-1-3-22
cessive closing of discharge valves;
- Because well pumps are operated manually, when water level in the wells is dropped by
excessive yield, the pumps break down seriously by the dry operation;
- Yield capacity becomes lower because it must be strained to avoid the dry operation;
and
- Improper connection of transmission pipes as aforementioned.
Many of the wells at the left bank were broke down, and their operation ratio is less than 50%
due to the above reasons.
2) Evaluation of Yield Capacity
Since the falls of groundwater level stand out currently, all existing wells cannot be operated
continuously. Thus proper wells need to be selected to ensure stable intake.
According to the previous discussion, the conditions of proper wells should be defined as
follows:
- Stable operation in the past;
- Large yield capacity;
- Capacity decline ratio is small; and
- In the zone of lowering groundwater level, some wells shall be abolished to expand the
distance of each well.
Based in above conditions, wells to be operated in the future are selected as shown in Figure
S.3.1.3.15. The number of selected wells at the right bank is 19, and that at the left bank is 37
as shown in the figure.
In this case, the average yield capacity of wells at the right bank is 330m3/hr (7.900m3/d) and
that at the left bank is 225m3/hr (5,400m3/d).
Total capacity = 7,900m3/d x 19 + 5,400m3/d x 37=150,000m3/d (right bank)+200,000m3/d
(left bank) = 350,000m3/d
Current actual minimum yield amount from April to December is around 300,000m3/d. It

The Study on Restructuring of Water Supply System Volume 3. Supporting Report of Tashkent City in the Republic of Uzbekistan March 2006
S 3-1-3-23
may be reduced in mid-winter. However, when all necessary pumps as shown in the figure are
replaced by new pumps with proper capacity and automatic operation according to the water
level, the yield amount of 350,000m3/d is assumed to be ensured as discussed above.
Figure S 3.1.3.15 Location of Selected Wells

The Study on Restructuring of Water Supply System Volume 3. Supporting Report of Tashkent City in the Republic of Uzbekistan March 2006
S 3-1-4-1
S 3.1.4 Examination of Current Distribution Network
This Study examines the flow condition of existing distribution network through various
hydraulic analyses/simulations, which are as shown below. Future network to be rec-
ommended is described in S 5.4.4.
(1) Availability of the Existing Data
Detailed drawings/data of existing distribution network including pipeline route, diameter,
length, material, elevation of each junction and other related information are fundamentals
for the Study. Although the Study Team frequently requested the concerned agencies for
provision of the said data since the beginning stage of the Study, these data have not yet
been released at this moment due to national security reason. Some data for the pipeline
network is got by hearing with Vodokanal engineers. Under such a situation, the Study
Team referred to the reports of previous JICA Study (2000) and limited data/information
provided by Vodokanal in the examination of distribution network during the course of the
first field investigation. Therefore, it is noted that the update of the model and/or pipe-
line/nodal data will be primarily required when the detailed drawings/data that are cur-
rently being collected, are available.
(2) Software Used in the Hydraulic Analysis
In the examination of distribution network, Water CAD, a water distribution model
software developed by Haestad Methods, Inc., was fully used. Following are the objec-
tives of using Water CAD and features of the software.
1) Objectives of using Water CAD in the Study
ü To study/analyze water flow and pressure in existing distribution network of
Tashkent City;
ü To develop/recommend appropriate distribution network as well as system op-
eration of Tashkent water supply though various analyses/simulations; and
ü To enhance technical capability of Vodokanal through the above activities to-
gether with technical workshop.

The Study on Restructuring of Water Supply System Volume 3. Supporting Report of Tashkent City in the Republic of Uzbekistan March 2006
S 3-1-4-2
2) Feature of Water CAD
Water CAD has many powerful and versatile project tools to analyze/simulate distribu-
tion pipe network as follows:
i) Laying out the Network
Using Pipe layout toolbar helps in the easy laying out of the water distribution network.
Reservoir/s, tank/s, pump/s, junctions, pipes and valves are placed into the drawing
pane. Pipelines are automatically placed according to placing Junction. As an al-
ternative, drawings of network in a .DXF format (.DWG format in the AutoCAD
version) can be used as a background drawing in laying out a scaled network.
ii) Easy Data Entry (add/delete/edit)
Four (4) ways to enter and modify element data are provided in Water CAD. Among
them, using Dialog Box and Flex Table will be much easier to handle the model as a
stand alone-basis. Aside from these, Database Connections can create connections to
import and export model data using common database and spreadsheet. Alternative
Editors will be used for creating alternatives from base alternatives.
iii) Performing Various Analyses/Simulations
Various analyses can be performed using Water CAD as follows:
- Steady State Analysis: Generally, water distribution for Average Daily De-
mand/Maximum Daily Demand will be analyzed.
- Extended Period Simulation (EPS): EPS can be conducted for any specified dura-
tion. Tank levels fluctuation, pump operation, valves open/close, and demands
change throughout the day can be simulated. Variation in demand over time can be
modeled using demand patterns. Demand patterns are multipliers that vary with
time. Demand patterns at each node can combine different patterns of water use
(residential, commercial, fire flow, etc.).
- Water Quality Analysis: Computing Water Age (Travel time from source/reservoir),
Analyzing Constituent Concentrations (Chlorine residuals in the system over time)
and Performing a Trace Analysis (Percentage of water from a specific source node)
- Cost Estimating: Cost Manager in Water CAD is a tool for tracking the costs as-
sociated with a water distribution construction project.
Powerful Reporting Tools

The Study on Restructuring of Water Supply System Volume 3. Supporting Report of Tashkent City in the Republic of Uzbekistan March 2006
S 3-1-4-3
Many reporting tools can be used for various purposes as follows:
- Reports by Element (Detailed Report): Every element can generate a report in the
same general format, which includes the name of the calculated scenario and series
of tables describing the element’s properties and result in detail. Graphs on the
concerned items are effectively employed.
- Tabular Reports (Flex Tables): Tabular Reports are an extremely powerful tool in
Water CAD. These reports are not only good presentation tools, but also very
helpful in data entry and analysis. When data must be entered for a large number of
elements, clicking each element and entering the data are tedious and time con-
suming. However, using Flex tables can make the job easier, since entering/editing
the data is done on same tables. Using tabular report, elements can be changed
using the global edit tool, or filtered to display only the desired elements. Values
that are entered into the table will be automatically updated in the model. The
tables can also be customized to contain only the desired data. Columns can be
added or removed, or duplicates of the same column with different units can be
displayed. The tables can be printed or copied into a spreadsheet program such as
EXCEL.
- Plan View (Full View/Current View): Full View will create a plan of the entire
system regardless of what the screen shows, while Current View will create a plan
of exactly what is displayed in the window at that moment. These views can be
printed or copied to the clipboard, and can be exported to AutoCAD or other
compatible software with a.DXF file.
- Contouring: Contouring enables to generate contours for reporting attributes such
as elevation, pressure and hydraulic grade. Contour interval as well as color code
by index values or ranges of values can be specified.
- Element Annotation: Element annotation enables to label network attributes in the
plan view and control which values are displayed, how they are labeled and how
units are expressed.
- Color Coding: Color Coding enables to review results in the plan view by
color-coding the elements based on attributes or range of values.
- Versatile Scenario Management: Scenario Management tools enable to create a

The Study on Restructuring of Water Supply System Volume 3. Supporting Report of Tashkent City in the Republic of Uzbekistan March 2006
S 3-1-4-4
New Alternative, edit and create scenarios, calculate and compare scenarios.
Traditionally, there have only been two possible ways of analyzing the effects of
change on a software mode, such as change the model, recalculate, and review the
results. Although either of these methods may be adequate for a relatively small
system, the data duplication, editing, and re-editing becomes very time-consuming
and error-prone as the size of the system and the number of possible conditions
increase. Additionally, comparing conditions requires manual data manipulation,
because all output must be stored in physically separate data files.
- Working with Data from External Sources: Water CAD supports several methods of
exchanging data with external applications, preventing duplication effort and al-
lowing saving time by reusing data already present in other locations. For instance,
exchanging data with databases or GIS system, or converting CAD line work to
pipe network. One or more database connections can be set up to bring in infor-
mation stored in many standard database and spreadsheet formats. Drawings of
network in a .DXF format (.DWG format in the AutoCAD version) can be used as a
background drawing in laying out a scaled network. Importing data available from
other distribution model software are Previous Water CAD/Cybernet Versions,
EPANET Files and KYPIPE Data.
(3) Examination of Current Flow Condition
1) Outline of the Existing Distribution Network
As shown in Figure S 3.1.4.1, the existing distribution network in Tashekent has several
features in its configuration and operation.
Distribution trunk lines with a diameter of 1,200 - 1,400 mm starting from two (2) key
water sources of Kadirya and Kibray WTPs surround the City to form outer ring mains.
In addition, a 1,800 mm distribution pipe is utilized for transmitting a part of Kadirya
water to Kibray WTP. Other trunk lines with a diameter of 1,000 - 1,600 mm are placed
through the City to finally connect the said outer ring mains and interconnect each other.
As for water flow in the distribution network, water from Kibray WTP is supplied for
eastern to southern part of the City of which supply zone is considered to be approxi-
mately quarter (1/4) to one-third (1/3) of total service area. Water from Kadirya WTP
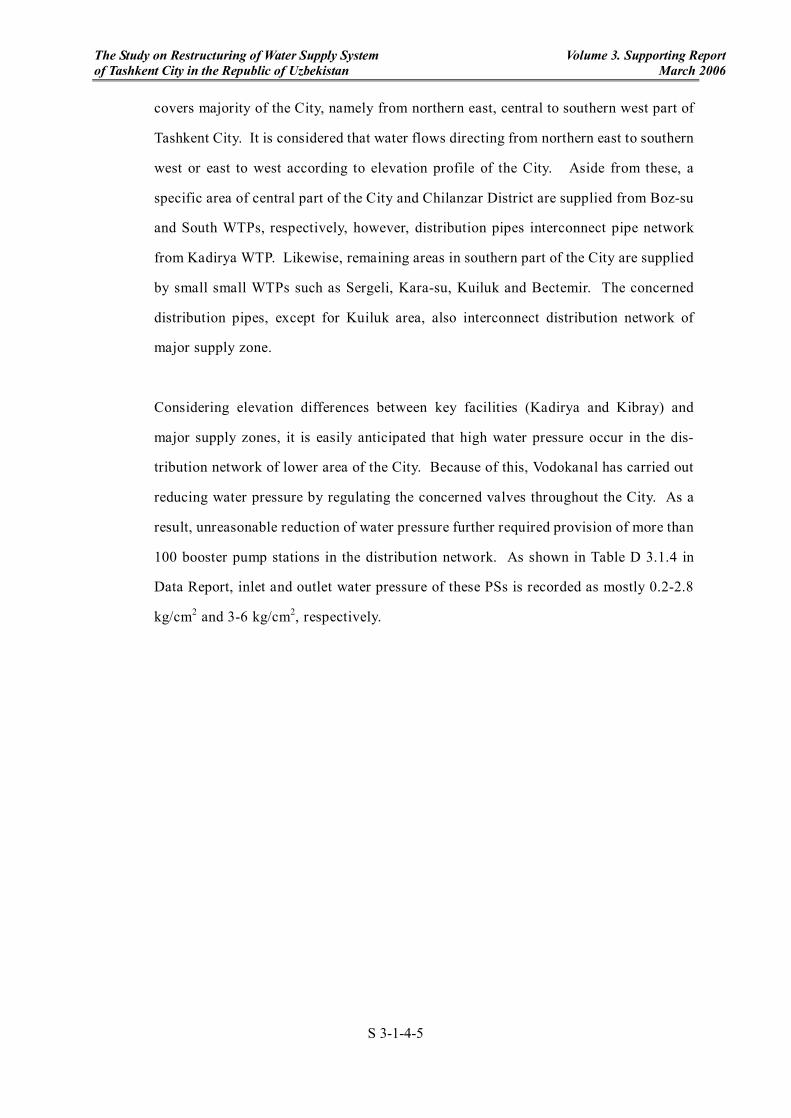
The Study on Restructuring of Water Supply System Volume 3. Supporting Report of Tashkent City in the Republic of Uzbekistan March 2006
S 3-1-4-5
covers majority of the City, namely from northern east, central to southern west part of
Tashkent City. It is considered that water flows directing from northern east to southern
west or east to west according to elevation profile of the City. Aside from these, a
specific area of central part of the City and Chilanzar District are supplied from Boz-su
and South WTPs, respectively, however, distribution pipes interconnect pipe network
from Kadirya WTP. Likewise, remaining areas in southern part of the City are supplied
by small small WTPs such as Sergeli, Kara-su, Kuiluk and Bectemir. The concerned
distribution pipes, except for Kuiluk area, also interconnect distribution network of
major supply zone.
Considering elevation differences between key facilities (Kadirya and Kibray) and
major supply zones, it is easily anticipated that high water pressure occur in the dis-
tribution network of lower area of the City. Because of this, Vodokanal has carried out
reducing water pressure by regulating the concerned valves throughout the City. As a
result, unreasonable reduction of water pressure further required provision of more than
100 booster pump stations in the distribution network. As shown in Table D 3.1.4 in
Data Report, inlet and outlet water pressure of these PSs is recorded as mostly 0.2-2.8
kg/cm2 and 3-6 kg/cm2, respectively.

The Study on Restructuring of Water Supply System Volume 3. Supporting Report of Tashkent City in the Republic of Uzbekistan March 2006
S 3-1-4-6
Figure S 3.1.4.1 Existing Distribution Primary Mains

The Study on Restructuring of Water Supply System Volume 3. Supporting Report of Tashkent City in the Republic of Uzbekistan March 2006
S 3-1-4-7
In addition, respective supply zones are not completely isolated. More than 1,500 of
valves are being utilized for flow control in the City and water flowing in the congested
distribution network finally form flow balance. Since appropriate flow measurement is
not practiced, it is difficult to exactly identify the boundaries of supply zones from
different water sources. It is considered that improper or unnecessary valve regulating,
especially in the distribution mains with large diameter, may have caused unreasonable
water supply due to ineffective use of pipe capacity and/or unnecessary provision of
booster pumps.
The extreme case is found in Chilanzar District where the farthest from Kadirya WTP
and water flow seems to finally balance in the District, however, because of insufficient
water pressure, the area is supplied by South WTP of which pumping head arrives at
more than 100 m. Under such a condition, another boosting system of Chilanzar PS
delivers water to Chilanzar from opposite side of South WTP with approximate 90 m of
pumping head.
Taking account of configuration of the network system and topographic condition of the
City, the distribution network of Tashekent City is considered to be relatively fair.
However, its operation/flow control in specific areas is unreasonable and closely relates
wastes of electric energy.
2) Hydraulic Analysis on Current Flow Condition
i) Layout of the model
Figure S 3.1.4.2 presents schematic diagram of the existing distribution network.
Placed in the model are:
- Distribution pipes with a diameter of lager than 300 mm
- Surface water sources of Kadirya and Boz-su WTPs, and groundwater sources of
Kibray, South, Sergeli, Kara-su, Bectemir and Kuiluk WTPs
- Major pumping stations of Mirzo-Ulugbek, Chilanzar and Sergeli 3/5
- Other booster pumping stations placed as off-take points
- Eleven (11) hot water plants consuming a large water volume

The Study on Restructuring of Water Supply System Volume 3. Supporting Report of Tashkent City in the Republic of Uzbekistan March 2006
S 3-1-4-8
Finally, total number of pipeline and junctions placed in the model arrived at 970 and
630, respectively, which corresponds to the maximum number (1,000) of pipelines to
be accommodated in Water CAD.
ii) Water demand
Total distribution volume and water consumption by water use were examined in the
Study. Current water distribution volume by district was assumed as shown in Table
S 3.1.4.1, based on the billed water volume provided by the Sales Department of
Vodokanal.

The Study on Restructuring of Water Supply System Volume 3. Supporting Report of Tashkent City in the Republic of Uzbekistan March 2006
S 3-1-4-9
Figure S 3.1.4.2 Schematic Diagram of the Existing Distribution Network

The Study on Restructuring of Water Supply System Volume 3. Supporting Report of Tashkent City in the Republic of Uzbekistan March 2006
S 3-1-4-10
Table S 3.1.4.1 Assumed Water Distribution Volume by District (Year 2002) (Unit: m3/day)
District Consumption
excl. Hot Water Plant
Consumption for Hot Water
Plant
Total Con-sumption Leakage Total Distribu-
tion Volume
(Tashkent City) A. Ikramov 101,766 31,098 132,864 90,853 223,717 Bektemir 19,356 - 19,356 15,397 34,752 Mirabad 115,844 19,271 135,115 98,285 233,400 M. Ulgbek 172,589 66,279 238,868 158,393 397,261 S. Rahimov 131,652 39,316 170,968 117,243 288,211 Sergeli 69,877 113,423 183,300 91,702 275,002 Khamza 134,645 31,291 165,937 117,069 283,005 Chilanzar 104,304 60,423 164,727 102,210 266,937 Shayhantahur 129,782 38,510 168,291 115,499 283,790 Yunusabad 144,150 95,389 239,538 145,040 384,579 Yakkasaray 75,814 0 75,814 60,307 136,121 Sub-total 1,199,778 495,000 1,694,778 1,111,998 2,806,776
(Vicinity area) Kibray 29,287 - 29,287 23,297 52,584 Ata 17,666 - 17,666 14,052 31,718 Other vicinity towns 4,969 - 4,969 3,953 8,923 Sub-total 51,922 - 51,922 41,302 93,224
Total 1,251,700 495,000 1,746,700 1,153,300 2,900,000
iii) Assumed conditions for analysis
Coefficient of roughness
In the pipe net calculation model, the head loss due to friction in the pipeline is calcu-
lated using the following William-Hazen formula:
HL = 10.667 x C-1.85 x D-4.87 x Q1.85 x L
Where, HL: Head loss due to friction in distribution pipe C: Coefficient of roughness D: Internal diameter of distribution pipe (m) Q: Flow (m3/sec) L: Length of pipeline (m)
With regard to coefficient of roughness, generally a value of 90 may be used, consid-
ering the majority of the aged pipes as shown in Table S 3.1.4.2. However, as shown in
Photo S 3.1.4.1, it is considered that inner surface of the aged pipes in the City are not so
seriously damaged compared with the outer surface condition as shown in Photo S
3.1.4.2.

The Study on Restructuring of Water Supply System Volume 3. Supporting Report of Tashkent City in the Republic of Uzbekistan March 2006
S 3-1-4-11
Table S 3.1.4.2 List of Existing Pipes Diameter Length by Age
(mm) Length (Km)
<5 years 5-10 yrs 10-20 yrs 20-30 yrs 30-40 yrs 40-50 yrs >50 yrs
Steel Cast Iron Total Steel Cast Iron Total Steel Cast Iron Total Steel Cast Iron Total Steel Cast Iron Total Steel Cast Iron Total Steel Cast Iron Total Steel Cast Iron Total
19 2.7 2.7 0.0 0.0 0.0 2.4 2.4 0.3 0.3 0.0 0.0
25 10.7 10.7 0.0 0.0 0.6 0.6 7.9 7.9 1.9 1.9 0.3 0.3 0.0
32 24.8 24.8 0.0 0.4 0.4 5.1 5.1 6.9 6.9 7.9 7.9 4.3 4.3 0.2 0.2
38 47.7 47.7 0.1 0.1 0.6 0.6 0.3 0.3 8.5 8.5 7.1 7.1 18.9 18.9 12.2 12.2
50 254.1 84.0 338.1 7.1 7.1 1.1 1.1 21.9 6.5 28.4 93.9 8.9 102.8 74.2 66.6 140.8 43.1 43.1 12.8 2.0 14.8
63 17.8 17.8 0.0 0.0 0.4 0.4 2.6 2.6 5.5 5.5 5.6 5.6 3.7 3.7
75 103.0 11.5 114.5 18.1 0.1 18.2 5.1 0.7 5.8 7.8 7.8 29.7 2.3 32.0 33.7 4.8 38.5 5.9 0.7 6.6 2.7 2.9 5.6
100 402.2 209.4 611.6 60.5 4.0 64.5 24.3 15.7 40.0 52.8 13.1 65.9 131.4 84.4 215.8 109.5 60.9 170.4 7.9 13.7 21.6 15.8 17.6 3.1.4
125 17.9 10.3 28.2 2.1 2.1 1.1 1.1 1.2 1.2 5.9 3.9 9.8 4.4 3.0 7.4 2.9 1.0 3.9 0.3 2.4 2.7
150 244.0 273.1 517.1 43.8 3.0 46.8 52.1 16.4 68.5 31.2 47.6 78.8 27.0 103.3 130.3 81.4 64.7 146.1 6.4 20.4 26.8 2.1 17.7 19.8
200 218.5 170.3 388.8 18.4 4.0 22.4 42.6 0.8 43.4 68.8 22.4 91.2 38.3 67.5 105.8 38.1 43.7 81.8 6.4 18.5 24.9 5.9 13.4 19.3
250 44.6 41.2 85.8 0.0 1.4 1.4 21.9 2.4 24.3 5.2 6.3 11.5 13.4 4.8 18.2 0.6 5.8 6.4 2.1 21.9 24.0
275 4.8 4.8 2.1 2.1 1.5 1.5 1.0 1.0 0.0 0.2 0.2 0.0 0.0
300 266.0 247.6 513.6 9.9 3.5 13.4 15.6 8.7 24.3 128.2 60.4 188.6 64.3 72.7 137.0 36.7 70.2 106.9 4.5 19.2 23.7 6.8 12.9 19.7
325 107.9 0.3 108.2 26.5 26.5 26.8 26.8 36.0 0.3 36.3 12.7 12.7 5.9 5.9 0.0 0.0
350 4.5 2.0 6.5 0.1 0.1 0.0 2.3 2.3 1.3 1.3 0.6 0.7 1.3 0.0 1.5 1.5
400 101.8 32.7 134.5 6.9 0.1 7.0 19.2 0.5 19.7 30.1 3.5 33.6 23.0 14.0 37.0 22.3 8.1 30.4 0.3 0.3 0.6 6.2 6.2
500 46.8 17.2 64.0 8.4 8.4 10.6 10.6 19.9 19.9 5.0 5.7 10.7 2.6 9.6 12.2 0.3 1.9 2.2 0.0
600 104.2 74.8 179.0 2.8 2.8 15.4 1.2 16.6 31.9 0.8 32.7 36.0 25.9 61.9 16.0 25.9 41.9 2.1 14.1 16.2 6.9 6.9
700 30.7 30.7 7.1 7.1 0.0 2.9 2.9 14.2 14.2 6.5 6.5 0.0 0.0
800 37.0 4.0 41.0 12.1 12.1 6.5 6.5 12.5 12.5 5.8 3.3 9.1 0.7 0.7 0.1 0.1 0.0
900 2.5 17.6 20.1 0.0 0.0 0.3 0.3 2.2 9.0 11.2 2.5 2.5 6.1 6.1 0.0
1,000 94.0 94.0 8.2 8.2 8.9 8.9 20.2 20.2 39.0 39.0 17.7 17.7 0.0 0.0
1,200 161.0 0.7 161.7 4.1 4.1 29.2 29.2 20.0 0.7 20.7 89.4 89.4 18.3 18.3 0.0 0.0
1,400 90.2 90.2 5.9 5.9 3.2 3.2 25.8 25.8 54.6 54.6 0.7 0.7 0.0 0.0
1,600 11.6 11.6 0.0 0.0 0.0 11.6 11.6 0.0 0.0 0.0
1,800 3.9 3.9 0.0 0.0 1.7 1.7 2.2 2.2 0.0 0.0 0.0
Total 2,454.9 1,196.7 3,651.6 244.2 14.7 258.9 265.6 44.0 309.6 544.8 157.7 702.5 719.7 408.5 1,128.2 504.9 366.2 871.1 109.6 101.7 211.3 66.1 103.9 170.0

The Study on Restructuring of Water Supply System Volume 3. Supporting Report of Tashkent City in the Republic of Uzbekistan March 2006
S 3-1-4-12
Photo S 3.1.4.1 Inner Surface of Removed Pipe
Photo S 3.1.4.2 Outer Surface of Removed Pipe
Although the rust on the inner surface is observed, swelling of the rust has not occurred. This
means that water supplied to the City is not corrosive and inner surface of pipes is maintained

The Study on Restructuring of Water Supply System Volume 3. Supporting Report of Tashkent City in the Republic of Uzbekistan March 2006
S 3-1-4-13
relatively in fair condition. Actually, there is no water quality problem such as red water in the
distribution pipe. Therefore, a value of 100 was determined as an acceptable level for distri-
bution pipe network analysis in this Study.
Water demand to be allotted for respective nodes/off-take points
In the hydraulic analysis, water demand at peak flow was employed to respective nodes/off-take
points as shown in Table S 3.1.4.3. Water losses were equally allotted to them except for hot
water plants.
Table S 3.1.4.3 Water Demand Allotted to Nodes by District Water Demand for Respective
Nodes/Off-take Points Water Demand for Hot Water Plant
District Number
Water De-mand/Node
(m3/h) Number Water Demand
(m3/h)
(Tashkent City) A. Ikramov 68 130 1 1,427 Bektemir 6 266 Mirabad 48 205 1 884 M. Ulugbek 80 190 2 3,041 S. Rahimov 64 178 1 1,804 Sergeli 43 172 2 5,204 Khamza 44 262 1 1,436 Chilanzar 64 155 1 2,772 Shayhantahur 40 281 1 1,767 Yunusabad 107 124 1 4,376 Yakkasaray 37 169
(Vicinity area) Kibray 4 603 Ata 3 485 Other vicinity towns 17 24
Total 625 2,658,000 (m3/d) 11 545,000 (m3/d)
Flow/pressure control applied for specific pipelines
In the initial calculation for the existing network, any pressure control was not applied in the
model, with the result that water pressure of 26 m (2.6 kg/cm2) or larger prevailed in the most of
supply zones as shown in Figure S 3.1.4.3. This result did not represent the actual inlet/outlet
water pressure of booster pump station in the City. Therefore, evaluation criteria of the
simulations were assumed to meet actual water pressure of booster pump stations. Because of
this, during a conduct of try and error calculation, some of the pipes were closed and pres-
sure-reducing valves were inserted in the specific pipelines in order to realize the current
condition as much as possible.


